Operational Guidance For Bicycle-Specific Traffic Signals in the United States
|
|
|
- Loren Foster
- 5 years ago
- Views:
Transcription

1 Portland State University PDXScholar Civil and Environmental Engineering Faculty Publications and Presentations Civil and Environmental Engineering Operational Guidance For Bicycle-Specific Traffic Signals in the United States Christopher Monsere Portland State University, Miguel A. Figliozzi Portland State University, Sam Thompson Portland State University Kirk Paulsen Portland State University Let us know how access to this document benefits you. Follow this and additional works at: Part of the Civil Engineering Commons, Transportation Commons, and the Transportation Engineering Commons Citation Details Monsere, Chris, Miguel Figliozzi, Sam Thompson, and Kirk Paulsen. Operational Guidance For Bicycle-Specific Traffic Signals In the United States. No. FHWA-OR-RD Portland, OR: Transportation Research and Education Center (TREC), This Report is brought to you for free and open access. It has been accepted for inclusion in Civil and Environmental Engineering Faculty Publications and Presentations by an authorized administrator of PDXScholar. For more information, please contact

2 OPERATIONAL GUIDANCE FOR BICYCLE-SPECIFIC TRAFFIC SIGNALS IN THE UNITED STATES Final Report SPR 747 OTREC 2102FG
3
4 OPERATIONAL GUIDANCE FOR BICYCLE-SPECIFIC TRAFFIC SIGNALS IN THE UNITED STATES ODOT PROJECT SPR 747 OTREC PROJECT 2102FG by Chris Monsere, Miguel Figliozzi, Sam Thompson, Kirk Paulsen Portland State University Department of Civil and Environmental Engineering Portland, OR for Oregon Department of Transportation Research Section th St. NE Salem OR and Federal Highway Administration 1200 New Jersey Avenue S.E. Washington, DC October 2013
5
6 Technical Report Documentation Page 1. Report No. FHWA-OR-RD Government Accession No. 3. Recipient s Catalog No. 4. Title and Subtitle Operational Guidance For Bicycle-Specific Traffic Signals In The United States 5. Report Date October Performing Organization Code 7. Author(s) Chris Monsere, Miguel Figliozzi, Sam Thompson, Kirk Paulsen 8. Performing Organization Report No. 9. Performing Organization Name and Address Portland State University Department of Civil and Environmental Engineering Portland, OR Sponsoring Agency Name and Address Oregon Department of Transportation Research Section and Federal Highway Administration th St. NE 400 Seventh Street, SW Salem, OR Washington, DC Work Unit No. (TRAIS) 11. Contract or Grant No. SPR 747 OTREC 2102FG 13. Type of Report and Period Covered Final Report 14. Sponsoring Agency Code 15. Supplementary Notes 16. Abstract The research consisted of two phases: 1) a synthesis of practice and 2) and analysis of cyclist performance characteristics. The synthesis of current practice reviewed the literature, current engineering design and operational guidance documents, and surveyed the jurisdictions about their current deployments of bicyclespecific signals. This report summarizes research of cyclist behavior at signalized intersections in Portland, Eugene, Corvallis, Beaverton and Clackamas County, OR. These signals had both bicycle-specific indications and vehicle-only signals. A total of 4,673cyclists were observed. For each cyclist observed arriving on red, a set of descriptive variables were collected (e.g., age, sex, helmet use, presence of cargo, arrival in group). Timebased event data were collected to establish reaction times, crossing times, waiting time, gap acceptance, and saturation flow rates. Compliance behavior was also established for these cyclists. 17. Key Words Bicycle, Traffic Signal, Multi-mode roadways, Intersection Safety and Urban Bikeways 18. Distribution Statement Copies available from NTIS, and online at Security Classification (of this report) Unclassified 20. Security Classification (of this page) Unclassified 21. No. of Pages 22. Price Technical Report Form DOT F (8-72) Reproduction of completed page authorized Printed on recycled paper 298 i
7 SI* (MODERN METRIC) CONVERSION FACTORS APPROXIMATE CONVERSIONS TO SI UNITS APPROXIMATE CONVERSIONS FROM SI UNITS Symbol When You Know Multiply By To Find Symbol Symbol When You Know Multiply By To Find Symbol ii LENGTH LENGTH in inches 25.4 millimeters mm mm millimeters inches in ft feet meters m m meters 3.28 feet ft yd yards meters m m meters 1.09 yards yd mi miles 1.61 kilometers km km kilometers miles mi AREA AREA in 2 square inches millimeters squared mm 2 mm 2 millimeters squared square inches in 2 ft 2 square feet meters squared m 2 m 2 meters squared square feet ft 2 yd 2 square yards meters squared m 2 m 2 meters squared square yards yd 2 ac acres hectares ha ha hectares 2.47 acres ac mi 2 square miles 2.59 kilometers squared km 2 km 2 kilometers squared square miles mi 2 VOLUME VOLUME fl oz fluid ounces milliliters ml ml milliliters fluid ounces fl oz gal gallons liters L L liters gallons gal ft 3 cubic feet meters cubed m 3 m 3 meters cubed cubic feet ft 3 yd 3 cubic yards meters cubed m 3 m 3 meters cubed cubic yards yd 3 NOTE: Volumes greater than 1000 L shall be shown in m 3. MASS MASS oz ounces grams g g grams ounces oz lb pounds kilograms kg kg kilograms pounds lb T short tons (2000 lb) megagrams Mg Mg megagrams short tons (2000 lb) T TEMPERATURE (exact) TEMPERATURE (exact) F Fahrenheit (F-32)/1.8 Celsius C C Celsius 1.8C+32 Fahrenheit F *SI is the symbol for the International System of Measurement
8 ACKNOWLEDGEMENTS The authors thank the Oregon Department of Transportation (ODOT), Oregon Transportation Research and Education Center (OTREC) and the Federal Highway Administration (FHWA) for funding this research. The Technical Advisory Committee has provided valuable input throughout the project. The TAC consisted of Scott Bearid (Kittelson and Associates, Inc), Nick Fortey (FHWA), Peter Koonce (Portland Bureau of Transportation), Gary Obery (Oregon DOT) and Zahidul Siddique (Oregon DOT). The project was managed by Mark Joerger (Oregon DOT). DISCLAIMER This document is disseminated under the sponsorship of the Oregon Department of Transportation and the United States Department of Transportation in the interest of information exchange. The State of Oregon and the United States Government assume no liability of its contents or use thereof. The contents of this report reflect the view of the authors who are solely responsible for the facts and accuracy of the material presented. The contents do not necessarily reflect the official views of the Oregon Department of Transportation or the United States Department of Transportation. The State of Oregon and the United States Government do not endorse products of manufacturers. Trademarks or manufacturers names appear herein only because they are considered essential to the object of this document. This report does not constitute a standard, specification, or regulation. iii
9 iv
10 TABLE OF CONTENTS 1.0 INTRODUCTION RESEARCH OBJECTIVES ORGANIZATION LITERATURE REVIEW PERFORMANCE CHARACTERISTICS Crossing Time Acceleration Perception Reaction / Start-up Lost Time Speed TRAFFIC OPERATIONS AND SIGNAL ISSUES SAFETY AND COMPLIANCE CONCLUSION DATA ASSEMBLY OVERVIEW OF DATA COLLECTION Portland State University Video Data, Type Portland State University Video Data, Type City of Portland Video Data, Type City of Portland Video Data, Type INTERSECTION DESCRIPTIONS Pearl Street / E 18th Avenue, Eugene, OR NW Buchanan Avenue / NW 9th Street, Corvallis, OR SW 5th Street / SW Lombard Avenue, Beaverton, OR SE Johnson Creek Boulevard / SE Bell Avenue, Clackamas County, OR NW Broadway / NW Lovejoy Street, Portland, OR N Williams Avenue / NE Broadway, Portland, OR SE Madison Street / SE Grand Avenue, Portland, OR N Rosa Parks Way / I-5 South Off-Ramp, Portland, OR N Vancouver Ave / NE Weidler St, Portland, OR DATA REDUCTION METHODOLOGY DESCRIPTIVE DATA Date and Day of the Week Weather Age Sex Helmet Use Commuter or Recreational Cargo Alone or Group Number of Cyclists Waiting Car in Adjacent Lane Cyclist Balancing EVENTS Arrival Time Time of Green Departure Time Wait Time v
11 4.2.4 Time of Mid-Intersection Time of Intersection Crossing PERFORMANCE Reference Line Reaction Time Acceleration and Speed Determining Case Determining Case Determining Case Determining Case Determining Acceleration and Speed Distributions QUEUE DISCHARGE Standard Bicycle Lane Beginning of Red Indication Total Number of Cyclists in Queue Cyclists in Front of Stop Line Position in Queue First Bike to Clear Queue Headway Last Bike to Clear Queue Last Bike to Clear Intersection Infrastructure Type Bike Box Total Number of Cyclists in Queue Cyclists Within Bike Box Cyclists Beyond Bike Box First Bike to Clear Queue COMPLIANCE Cross-Traffic Volume Compliance Indicator Compliant Noncompliant: RTOR Noncompliant: Gap Accepted Noncompliant: Signal Jump Noncompliant: Other Gap Time Time to Green Violation Number ANALYSIS AND RESULTS PERFORMANCE Summary of Observations by Location Accelerations from Standing Start All Observed Cyclists By Case By Recreational or Commuter By Alone or In Group By Grade By Intersection Width Cruising Speeds All Observed Cyclists By Case By Recreational or Commuter By Alone or In Group By Grade By Intersection Width Perception Reaction Times All Observed Cyclists vi
12 By Case By Recreational or Commuter By Alone or Group By Intersection Width Discussion QUEUE DISCHARGE Headways Discharge Times Intersection Clearance Time COMPLIANCE Summary of Observations by Location Compliance at Bicycle-Specific Signals Helmet Use Commuter vs. Recreational Status Presence of Cargo Time of Day Compliance by Day of the Week Compliance By Cross-Traffic Volume Compliance by Time Spent Waiting Discussion CONCLUSIONS PERFORMANCE QUEUE DISCHARGE COMPLIANCE REFERENCES APPENDIX A: A REVIEW OF THE STATE OF PRACTICE REGARDING BICYCLE-SPECIFIC TRAFFIC SIGNALS APPENDIX B: TRAFFIC SIGNAL POLICY AND GUIDELINES, ADDENDUM NO. 2, SECTION VI SPECIAL APPLICATIONS APPENDIX C: STATE OF THE PRACTICE SURVEY INSTRUMENT APPENDIX D: STATE OF THE PRACTICE SUMMARY SHEETS APPENDIX E: SAMPLE REQUEST TO EXPERIMENT FOR BICYCLE-SPECIFIC SIGNALS LIST OF TABLES Table E-1 Summary of All Cyclists Performance Observations... xii Table E-2 Summary of Compliance Analysis... xiv Table 2-1 Definitions of Reported Speed Types... 8 Table 2-2 Reported Speeds (km/h) from Opiela et al., Table 2-3 Comparisons of Study Scope with Respect to Speed Table 2-4 Comparisons of Speed Reporting Table 3-1 Summary of Cyclist Observations by Video Data Type Table 3-2 Summary of Locations for Data Collection Table 5-1 Summary of Observations for Performance Analysis by Location Table 5-2 Descriptive Statistics, Accelerations, (ft./sec 2 ) Table 5-3 Descriptive Statistics, Cruising Velocities from Standing Start, (ft./sec) Table 5-4 Descriptive Statistics of Reaction Time (sec) Table 5-5 Summary of All Cyclists Values Table 5-6 Summary of Observations for Queue Discharge vii
13 Table 5-7 Summary of Observations for Compliance Analysis by Location Table 5-8 Compliance Summary Table 5-9 Summary Statistics for Noncompliant Cyclists Table 5-10 Compliance at Bicycle-Specific Signals Table 5-11 Summary of Compliance by Helmet Use Table 5-12 Summary of Compliance by Commuter Status Table 5-13 Summary of Compliance by Cargo Table 5-14 Summary of Compliance During Peak Hours LIST OF FIGURES Figure 2-1 Headways of i th Bicycle in Queue (Raksuntorn and Khan 2003)... 7 Figure 2-2 Histogram of Speed Frequency of All Observations (Rubins and Handy, 2005) Figure 2-3 Crossing Times as a Function of Street Width (Shaldover et al.) Figure 2-4 Observations of Bicyclist Non-Compliance, Pennsylvania Ave., Washington, D.C Figure 2-5 Observations of Bicyclist Behavior at SF Intersections (Cooper et al. 2012) Figure 3-1 Data-collection Examples Figure 3-2 Vicinity Map and Aerial Photo, Pearl Street and E 18th Avenue, Eugene Figure 3-3 Vicinity Map and Aerial Photo, NW Buchanan Avenue / NW 9th Street, Corvallis, OR Figure 3-4 Vicinity Map and Aerial Photo, SW 5th Street / SW Lombard Avenue, Beaverton, OR Figure 3-5 Vicinity Map and Aerial Photo, SE Johnson Creek Boulevard / SE Bell Avenue, Figure 3-6 Vicinity Map and Aerial Photo, NW Broadway / NW Lovejoy Street, Portland, OR Figure 3-7 Vicinity Map and Aerial Photo, N Williams Avenue / NE Broadway, Portland, OR Figure 3-8 Vicinity Map and Aerial Photo, SE Madison Street / SE Grand Avenue, Portland, OR Figure 3-9 Vicinity Map and Aerial Photo, N Rosa Parks Way / I-5 South Off-ramp/On-ramp, Figure 3-10 Vicinity Map and Aerial Photo, N Vancouver Avenue / N Weidler Street, Portland, OR Figure 4-1 Screen Capture for Clothing Type Figure 4-2 Positions of Reference Lines for Performance Study Figure 4-3 Schematic of Data Reduction Methodology Figure 4-4 Possible Cyclist Positions in a Bike Box Figure 5-1 Barplots of Median and 15 th Percentile of Acceleration by Category Figure 5-2 Density of Accelerations (ft./sec 2 ), All Cyclists Figure 5-3 Density of Accelerations (ft./sec 2 ) by Case Figure 5-4 Density of Accelerations (ft./sec 2 ) by Commuter (0) vs. Recreational (1) Figure 5-5 Density of Accelerations (ft./sec 2 ) by Alone (0) or Group (1) Figure 5-6 Density of Accelerations (ft./sec 2 ) by Grade (No = 0, Yes = 1) Figure 5-7 Density of Accelerations (ft./sec 2 ) by Intersection Width Figure 5-8 Barplots of Median and 15 th Percentile of Cruising Speed by Category Figure 5-9 Density of Velocities (ft./sec), All Cyclists Figure 5-10 Density of Velocities (ft./sec) by Case Figure 5-11 Density of Velocities (ft./sec) by Commuter (0) vs. Recreational (1) Figure 5-12 Density of Velocities (ft./sec) by Alone (0) or Group (1) Figure 5-13 Density of Velocities (ft./sec) by Grade (No = 0, Yes = 1) Figure 5-14 Density of Velocities (ft./sec) by Intersection Width Figure 5-15 Barplots of Median and 15 th Percentile of Reaction Time by Category Figure 5-16 Density of Reaction Times, All Cyclists Figure 5-17 Density of Reaction Times by Case Figure 5-18 Density of Reaction Times by Commuter (0) vs. Recreational (1) Figure 5-19 Density of Reaction Times by Alone (0) or Group (1) Figure 5-20 Density of Reaction Times by Intersection Width Figure 5-21 Total Crossing Times By Total Crossing Width, Excluding Reaction Times Figure 5-22 Position in Queue and Average Headways Figure 5-23 Discharge Times vs. Queue Size Figure 5-24 Queue Size vs. Clearance Time viii
14 Figure 5-25 Discharge Time vs. Intersection Clearance Time Figure 5-26 Compliance by Location Figure 5-27 Proportion of Compliance vs. Hour of Arrival Figure 5-28 Compliance by Day of Week Figure 5-29 Compliance at Intersections with Tuesday and/or Friday Data Figure 5-30 Cross Traffic (Vehicles per Hour) By Hour of Day, By Location Figure 5-31 Gap Accepted Noncompliance and Cross Traffic Figure 5-32 Signal Jump Noncompliance and Cross Traffic Figure 5-33 Wait Time for Types of Noncompliance Figure 5-34 Wait Times for Gap Accepters Figure 5-35 Violation Number of Noncompliant Cyclists Figure 5-36 Violators in a Queue Figure 5-37 Severity of Signal Jump vs. Wait Time Figure 5-38 Average Accepted Gap vs. Arrival Hour Figure 5-39 Accepted Gaps vs. Cross Traffic ix
15 x
16 EXECUTIVE SUMMARY Many cities in North America are making significant investments in bicycling infrastructure to improve cycling conditions. These investment are partly motivated by research that indicates that in order to grow bicycle ridership facilities should be designed to accommodate all riders. Bicycle facilities should serve not only current users but also those demographic groups that may not otherwise choose to cycle in the typical urban setting because riding is a stressful experience. The objectives of this research were to review engineering guidelines for design of bicycle-specific traffic signals; and develop operational guidelines for timing and phasing of bicycle-specific traffic signals or modifications that can be made to existing signals to better accommodate bicycles. The research consisted of two phases: 1) a synthesis of practice and 2) and analysis of cyclist performance characteristics. The synthesis of current practice reviewed the literature, current engineering design and operational guidance documents, and surveyed the jurisdictions about their current deployments of bicycle-specific signals. This review highlighted both the guidance available to engineers and planners, and the types of designs being implemented by jurisdictions with bicycle-specific signals. The availability of engineering guidance has improved substantially over the past few years with the release of the California Manual on Uniform Traffic Control Devices (MUTCD), the National Association of City Transportation Officials (NACTO) Urban Bikeway Design Guide, and guidance from the American Association of State Highway and Transportation Officials (AASHTO). While there are minor differences among these three documents, there is generally consistent guidance. To some extent, the guidance documents reflect the lessons learned by the surveyed jurisdictions since installation of the bicycle-specific signals is limited to those places willing to experiment. The survey of practice found a variety in some design elements: lens size, use of insignia, utilization of louvers, mounting location, and the means to designate that the signal head is for bicyclists only. Some consensus appears on the use of the lens insignia and accompanying signage. Given the accelerated deployments of bicycle-specific signals and the new guidance documents, it is likely that there will be less variety in future designs. Adoption of minimum guidance in the U.S. MUTCD would also likely improve consistency and practice. The results of that effort are documented in Appendix A of this report and have been published in the Transportation Research Record, which is a peer reviewed journal. The second phase of this research collected and analyzed video data of cyclist behavior at nine signalized intersections in Portland, Eugene, Corvallis, Beaverton and Clackamas County, OR. A total of 4,673 cyclists were observed. Bicycle movements at four intersections are controlled by a bicycle-specific signal. At the other five intersections, bicyclists followed regular vehicle signals. For each cyclist observed arriving on red a set of descriptive variables were collected (e.g., age, sex, helmet use, type of bike, clothing, presence of cargo, arrival in group). Time-based event data were collected to establish reaction times, crossing times, waiting time, gap acceptance, and saturation flow rates. Compliance with signalized traffic control was also evaluated for these cyclists. These observations were used to study 1) performance (accelerations, cruising speeds and reaction time); 2) queue discharge; and 3) compliance. As part of this research, a general xi
17 methodology to estimate bicyclists acceleration and speed for traffic-signal timing applications was developed. This methodology was also published in the Transportation Research Record. Utilizing physical equations of motion, this research analytically derived expressions that can be used to classify an individual bicyclist s performance as a function of the observed acceleration profile. Performance Table E-1 summarizes the results of the performance analysis. The table presents the AASHTO defaults for values used to calculate the minimum clearance interval for cyclists starting from a standing start, the number of observations, and the median and 85 th or 15 th percentile values of all observations. The primary conclusions of the analysis are: The AASHTO defaults are clearly conservative for acceleration. Nearly every cyclist observed in this research obtained much higher average accelerations. For all cyclists, the 1.5 ft./sec 2 AASHTO default is less than the 2 nd percentile in the observed data. The AASHTO default cruising speed of 14.7 ft./sec is higher than the median value observed in the field. The default speed is approximately the 52 nd percentile of the observed data (meaning that approximately 48% of cyclists we observed were not able to obtain this cruising speed). The AASHTO default perception-reaction time of 1.0 seconds is between the 32 nd and 39 th percentile of the observations. Approximately 61% of observed cyclists had reaction times longer than 1.0 second. The combination of AASHTO defaults in the clearance formula, however, produces conservative timing values (due to the low acceleration assumed). An analysis of the actual crossing times of cyclists indicate that nearly all riders are accommodated by the AASHTO default timing, with the exception of some recreational riders at a wide intersection. Statistically significant differences were found between alone and group, recreational and commuter, and grade or no grade in each of the performance categories. The analysis suggests there is a performance difference between commute and recreational riders (classified by weekday and weekend) that merit adjustments to the default values. Alternatively, field-based measurement of cyclist performance at a particular location could be easily made with the methodology developed in this research. Whether bicyclists reach cruising speed and the value of the bicyclists average acceleration are influenced by the intersection width. Unusually narrow or wide intersections may particularly benefit from field-base estimation of acceleration, cruising speeds, and crossing times. Most of the intersections studied in this research have a width within 61 feet and 75 feet. Table E-1 Summary of All Cyclists Performance Observations xii
18 Value Acceleration (ft./sec 2 ) Cruising Speed (ft./sec) Perception Reaction Time (sec) AASHTO Defaults Number of Observations All Cyclists Observed Median Percentile Percentile of AASHTO Default in Observed Data (15 th ) < (15 th ) (85 th ) Queue Discharge The discharge characteristics of cyclist queues at one signalized intersection were studied using footage from two time periods: before and after the installation of a bike box. A total of 1,303 cyclists were observed. For the bike lane, headway distributions with respect to cyclist position in a queue were estimated per the procedure described in the Highway Capacity Manual (HCM). For the bike box, the ability of cyclists to line up parallel to each other inside the box precluded the use of the HCM procedure. Instead, a methodology was developed to acquire the discharge time for a queue of cyclists stopped at the intersection and the time it takes for all cyclists in the queue to clear the path of opposing traffic, the intersection clearance time. The following are the primary conclusions from the analysis: With the bike lane, the average cyclist headway was found to be seconds for cyclists positioned fifth or higher in their queue. This is equivalent to a saturation flow rate of 3,610 cyclists per hour of green. The addition of a bicycle box decreases the discharge time for queues of equal length compared to a bicycle lane. The decrease in discharge time between bike boxes and lanes becomes more evident with larger queue sizes. The horizontal nature of queuing that is possible in a bike box enables cyclists to move into the intersection more quickly as they are less likely to be restricted by cyclists ahead of them. This finding of decreased queue discharge time has important capacity and delay implications for motor vehicles (especially right-turning vehicles) at intersections with installations of bicycle boxes. The addition of a bicycle box decreases the intersection clearance time for queues of equal length compared to a bicycle lane. However, this trend is only evident for queues of five or more cyclists. Compliance xiii
19 Cyclists arriving on red were examined for their compliance with the traffic signal indication. Cyclists were only eligible to become part of the compliance dataset if they 1) arrived on a red indication and 2) utilized the bike lane on both sides of the intersection (and bike signal where applicable). Table E-2 shows the summary of the compliance analysis of 2,617 cyclists arriving on red. Cyclists turning right on red without stopping were noted but removed from further analysis. The overall observed compliance is nearly 90%. The noncompliant cyclists consist of two behavior types. Cyclists who violate the signal just before receiving a green (during the yellow time of a conflicting phase or during all red) were considered signal jumpers. These cyclists were 4.3% of the observed sample. The remaining noncompliant cyclists were selected gaps in the conflicting traffic stream while the signal was red (i.e., while a conflicting phase had a green signal). These cyclists were 5.9% of the total observed cyclists. An important finding is that compliance is comparable at intersections with bicycle-specific signals and those without. The analysis of the additional demographic and time-gap acceptance revealed a risk-taking profile for noncompliant cyclists. These cyclists were: more likely to not wear a helmet; not influenced by wait time; and minimum gap accepted with higher volumes nearly equal to or less than the minimum crossing time, based on AASHTO calculations. A possible conclusion is that design is probably not likely to influence noncompliant cyclists. Enforcement and/or work to change the culture of cyclists may be needed, especially for those comprised within the 5.9% of bicyclists violates the red signal while there is a green signal for a conflicting phase. Table E-2 Summary of Compliance Analysis Compliance Behavior Percent Number of Observations Compliant Gap Accepted Signal Jump Other xiv
20 1.0 INTRODUCTION Many cities in North America are making significant investments in bicycling infrastructure to improve cycling conditions. This is in part motivated by research that indicates that in order to grow bicycle ridership facilities should be designed to accommodate all riders; particularly those demographic groups that may not otherwise choose to cycle in the typical urban setting because riding is a stressful experience. The connectivity of the bicycle network also plays into people s choices to use a bicycle for transportation. Although cyclists are willing to travel out of their way to utilize bicycle infrastructure, minimizing trip distance is another important factor in route choice. Difficult connections not only create discontinuities in the bicycle network, but also pose a threat to perceived cyclist safety and comfort. Safety, or the perceptions thereof, has been cited as a significant factor in people s decision to cycle. A majority of bicycle-vehicle crashes in urban areas occur at intersections. At most intersections, however, bicyclists are controlled by regular vehicle signals. To improve safety at some intersections, bicycle movements may need to be separated from other conflicting traffic. This is most often done with bicycle-specific traffic signals. These are traffic signal heads used at intersections with conventional traffic signals to specifically control the movement of bicyclists. They are typically not viewable by motorists or they are distinguished from other signal heads through the use of special signing, bicycle indications, or signal housing color. Under the control of a bicycle-specific traffic signal, the movement of bicyclists may occur concurrently with other compatible vehicle phases or exclusively on a separate phase. In both cases, traffic-signal timing plays a significant role to make cycling a safe and attractive option for people as a means to travel around the city. Because there may be performance differences among cycling demographics, it is important to have a detailed understanding of the performance characteristics of urban cyclists. 1.1 RESEARCH OBJECTIVES The objectives of this research were to: Review engineering guidelines for the design of bicycle-specific traffic signals. Develop operational guidelines for timing and phasing of bicycle-specific traffic signals or modifications that can be made to existing signals to better accommodate bicycles. The research consisted of two phases: 1) a synthesis of practice and 2) and analysis of cyclist performance characteristics. The synthesis of current practice reviewed the literature, current engineering design and operational guidance documents, and surveyed the jurisdictions about their current deployments of bicycle-specific signals. This report summarizes research of cyclist behavior at signalized intersections in Portland, Eugene, Corvallis, Beaverton and Clackamas County, OR. These signals had both bicycle-specific indications and vehicle-only signals. A total of 4,673 cyclists were observed. For each cyclist observed arriving on red, a set of descriptive variables were collected (e.g., age, sex, helmet use, presence of cargo, arrival in group). Time- 1
21 based event data were collected to establish reaction times, crossing times, waiting time, gap acceptance, and saturation flow rates. Compliance behavior was also established for these cyclists. 1.2 ORGANIZATION The remainder of this report is organized in the following chapters: Chapter 2: Literature Review Current practices and published literature were reviewed for material that related to the project. Chapter 3: Data Assembly A description of the video-based data collected in this research. Chapter 4: Data Reduction Methodology A description of how the data were extracted from video for analysis. Chapter 5: Analysis and Results A summary of the analysis of 1) performance (accelerations, cruising speeds, and reaction time) 2) queue discharge, and 3) compliance. Chapter 6: Conclusions Conclusions and recommendations are presented. The report appendices include the following: Appendix A: A Review of the State of Practice Regarding Bicycle-Specific Traffic Signals Appendix B: Traffic Signal Policy and Guidelines, Addendum No. 2, Section VI Special Applications Appendix C: State of the Practice Survey Instrument Appendix D: State Of The Practice Summary Sheets Appendix E: Sample Request to Experiment for Bicycle-Specific Signals 2
22 2.0 LITERATURE REVIEW Increasing cycling as a regular mode of transportation has many personal and environmental benefits that have been noted in recent literature (Pucher et al. 2010). These benefits, paired with growing concerns about pollution and traffic congestion from personal car use, have motivated many municipalities to attempt to elevate the use of bicycles among their populations. Subsequently, the amount of funding for bicycle-specific infrastructure has increased in recent years (Dill and Carr 2003). Although some individuals and interest groups advocate for a complete lack of bike-specific facilities or vehicular cycling (Pucher and Buehler 2009), it has been shown that people are encouraged to bike with increased choices in infrastructure/bike-specific facilities, especially new or less confident riders (Dill 2009; Koorey 2010; Pucher et al. 2010). Meanwhile, there is some evidence that safety (measured as an individual s risk) improves with increased ridership (i.e., the safety in numbers theory) (Jacobsen 2003; Robinson 2005). Additionally, research suggests that the connectivity of the bicycle network plays into people s choices to bike (Dill 2009; Mekuria et al. 2012). Difficult connections not only create discontinuities in the bicycle network but also pose a threat to perceived cyclist safety and comfort (Krizek and Roland 2005). Safety, or the perceptions thereof, has been cited as a significant factor in people s decision to cycle (Pucher and Dijkstra, 2000). Indeed, it has been shown that more than half of Portland residents are concerned about their safety when cycling and thus limit their time on a bicycle (City of Portland Bureau of Transportation [PBOT] 2004). In a classification now copied by many, a (2009) report by Roger Geller of PBOT revealed that 60% of the surveyed population self-classified as Interested but Concerned cyclists, citing fear for their safety as a primary deterrent to cycling. Insecurities about safety and gaps in connectivity at intersections pose barriers to cycling that could be alleviated by new technologies like bike signals. Bicycle-specific traffic signals are a common element of the bike network in European countries where cycling is popular (Fischer et al. 2010) and have been implemented in several U.S. cities (see state of the practice results), with formal experimentation as proscribed in the MUTCD in additional cities pending. Presently, despite their increasing usage in the U.S., no official guidance exists in the MUTCD on the placement, design, phasing, timing, or warrants for the use of bike signals (FHWA 2009). This lack of standards or regulatory guidance creates liability and limits the installation of these signals to those wishing to participate in an experiment. In addition, inconsistent infrastructure could lead to a consequent lack of understanding and compliance by cyclists riding in unfamiliar cities. A couple studies have indicated intersection types and characteristics for which bike-friendly signal timing or a bike phase would be beneficial for improving level of service (LOS) for both cyclists and motorists (i.e., intersections with bicycle clearance-time accidents, very wide widths, or those on major bicycle routes with high cyclist volumes (Wachtel et al. 1995), and those on collector streets or with steep grades (Taylor and Mahmassani 2000)). When combined with concerns about riders safety, liability for controlling jurisdiction, and efforts to increase rates of cycling, there is a clear need to explore variables needed to operate bicycle-specific traffic signals for use in the U.S. 3
23 Descriptive data on cyclist performance characteristics like speed, acceleration and start-up lost time that affect intersection clearance time are important for effective timing of bike phases. Timing not conducive to cyclists can result in car-bike accidents. Wachtel et al. (1995) noted the connection between signal timing and a common type of car-bike collision: that which occurs when a cyclist is hit by a motorist after lawfully entering an intersection during the yellow phase. Due to an insufficient amount of time allotted to the cyclist by the yellow and red phases, the cyclist remains in the intersection when cross traffic is given a green indication. A 1994 FHWA report classified bicycle user types into three categories: Advanced cyclists, basic cyclists and children. A limited amount of research on cyclist performance has been carried out in an attempt to create empirically derived values to confirm or reject these assumptions. Some of the published values associated with these user types are assumptions that lack empirical evidence. Further studies have addressed the potential effects of empirically derived signal timing on the capacity at signalized intersections (note capacity-related work is discussed later). To gather sources for this review, electronic searches were conducted in early 2012 using Google, Google Scholar, and TRIS Online (National Transportation Library) using bike or bicycle in conjunction with other keywords: signal, operation, safety, performance, timing, intersection, compliance, and clearance. Relevant studies published at any date were considered for inclusion, though the earliest utilized study dated from Sources were limited to those in English and included material found on the Fietsberaad (a partner of the Dutch Cycling Embassy) website that was originally published in Dutch and translated to English. In order to analyze results of already-implemented bike signal projects, it was necessary to include non-peer reviewed research found in government documents. This chapter aims to synthesize the important literature in three areas: (1) cyclist performance characteristics, (2) traffic operations and signal issues associated with bicycle traffic, and (3) safety and compliance. The objective of this paper is to illuminate gaps and discrepancies in the current research that must be addressed in order to recommend parameters for the timing and operation of bicycle-specific traffic signals. 2.1 PERFORMANCE CHARACTERISTICS Fundamental definitions of cyclist performance are critical for engineering design of bicyclespecific traffic signals, specifically their signal timing. Because humans are not uniform in their performance capabilities or equipment, there is a range of values for many performance characteristics. Studies compiled on cyclist performance explored one or more of four specific performance characteristics: crossing time, acceleration, perception-reaction time, and speed. Data were gathered from individuals at traffic signals originally timed for automobile traffic not bicycle-specific signals. This would presumably not have an effect on basic performance characteristics of cyclists. Furthermore, intersections for all studies were selected based on their high volume of bicycle traffic in order to obtain statistically significant sample sizes. Before delving into a discussion of the findings, it is important to define working variables used in performance studies. Wachtel et al. (1995) defined two start types for cyclists crossing an intersection: rolling and standing. Cyclists who enter at full speed late in the green or during the 4
24 yellow phase were defined as crossing with a rolling start while those who have stopped on red and start from a new green were defined as crossing with a standing start (p. 38). Subsequent studies adopted these start-type definitions. Crossing distance or intersection width was defined by Rubins and Handy (2005) as the distance from the first crosswalk line on the near side of the intersection to the first line on the other side of the intersection (the third line encountered rather than the limit line on the far side) (p. 23). They also noted that this definition was chosen because of convenience and practicality since most bicyclists stop at the first crosswalk line at red lights and because bicyclists are safely out of the path of cross traffic when they cross the third line (p. 23). This definition of intersection width appears to be used by all following studies with the exception of two, which defined intersection width similarly to Rubins and Handy but with an additional 6 feet to account for complete clearance of a bicycle through an intersection (Shladover et al. 2011, 2009) Crossing Time While other performance characteristics have been examined because of their influence on crossing time, the time a cyclist needs to cross an intersection is the most basic parameter needed for bicycle-specific signal timing. Crossing times for the two start types are used for different purposes in signal timing. The length of the minimum green indication (green time) in a signal phase is governed by the time it would take standing-start cyclists to cross the intersection since, presumably, this cyclist would need the greater amount of time to cross compared to a rollingstart cyclist. In many states it is legal for cyclists to cross into an intersection during the yellow clearance, and rolling-start crossing times are used to determine minimum yellow indication length to ensure that cyclists entering an intersection have enough time to make it safely across. Although most of the performance studies reviewed did measure crossing time, it was generally used to determine other performance characteristics. Only two studies made explicit comparisons of their crossing-time data (Rubins and Handy 2005; Wheeler et al. 2010). In these studies, crossing time was determined by review of video footage. Rubins and Handy (2005) examined crossing time at 10 signalized intersections and reported significant variation in crossing times for seemingly homogeneous populations of cyclists. The findings revealed a weak linear relationship (linear regression R 2 value of 0.27) between crossing time and width for both start types. Clearly, other factors besides intersection width influence crossing time. Wheeler et al. (2010) inspected the differences in crossing time between men and women at two intersections one with a level grade and one that had a slight uphill grade during winter and summer. It was determined that minimum clearance times accommodating the average cyclist would be insufficient to accommodate a large portion of female riders. It was concluded that at wide and graded intersections especially, females need more time to cross safely and comfortably. Using average values or specific percentiles may affect women since men usually constitute 60% or more of the total riders. The same rationale can apply to other groups that are a minority in the current bicycling population (e.g. children, elderly, etc.). As evidenced by these two studies, crossing time is not governed by a single variable like intersection width. In order to discern the reason for crossing-time variability, it is prudent to 5
25 individually consider the fluctuations of other performance measures from which it is comprised. This has been carried out in a few studies whose particulars are discussed below Acceleration Crossing time for standing starts is comprised of the time to recognize the signal change and accelerate to a constant speed in addition to the time it would take to cross the remaining portion of the intersection at that constant speed. Values for cyclist acceleration are therefore important to determining minimum green times. A 1997 study by Pein analyzed riders on a trail at roadway crossings. Crossing time and distance were collected and fit by linear regression. Accelerations were then estimated from this model. He found the 15 th percentile and mean accelerations of standing start riders to be 2.4 ft/s 2 and 3.5 ft/s 2, respectively. These values are reasonable when compared to suggested design values in AASHTO s Guide for the Development of Bicycle Facilities (2012) and the Netherland s CROW Design Manual for Bicycle Traffic (2007). As noted by Pein, it is not made clear by either design aid if suggested accelerations were mean, 15 th percentile, or other percentile values. The age distribution of users on the trail may have affected how closely his values matched those in existing design aids. Pein states that in a previous study of the trail, the majority of cyclists were adults between the ages of 26 and 65, with very few people over the age of 66 or under the age of 10. Wheeler et al. s discussion of acceleration points to gender differences in acceleration. No explicit values for acceleration were reported, but the findings suggested that males continue accelerating past the midpoint of an intersection while females reach their top speed somewhere near the midpoint of the crossing. This was true at both the level and graded intersection during winter and summer, and would partially account for the differences in crossing times discussed previously. Findings for acceleration allude to the adequacy of existing design values for an average cyclist population. However, lower accelerations might be reasonable for populations with higher numbers of older people, very young children, and women. It is unclear what adjustments should be made for intersections with grades. More data is needed to elucidate the effects of cyclist demographics (like age and gender) and intersection grade on acceleration Perception Reaction / Start-up Lost Time As previously noted, the minimum green time is based on the crossing time needed by standingstart cyclists. Thus, the time used to recognize the indication change and begin acceleration, the start-up time, is a relevant aspect of cyclist performance. Three studies explored start-up time. It should be noted that perception reaction time (PRT) and start-up lost time (SLT) are not the same in these studies. The SLT is equal to the PRT plus the time needed to accelerate to the cruising speed. Raksuntorn and Khan (2003) took the most general approach to exploring start-up time and noted that the first five bicyclists in a queue experienced a significant SLT but that of following bicyclists was marginal. This could be due to cyclists behind them being tipped off to the signal change and therefore able to ready 6
26 themselves to depart before space is made by leading cyclists. The total SLT for this study (the sum of individual headways per phase) was found to be 2.5 seconds. The reaction times of the first bicycles can be seen in Figure 2-1. Assuming the researchers followed standard procedures for measuring saturation flow, it can be seen that the reaction and travel time to the common measuring point are in the range of seconds. Reaction times would be less than these since it would not include the time to travel to the reference position. Figure 2-1 Headways of i th Bicycle in Queue (Raksuntorn and Khan 2003) Another study found SLTs for each of the three start types discussed previously. Noting that finding SLTs was important in determining minimum green time, Rubins and Handy (2005) took the intercepts from linear regression equations fitted to plots of crossing time versus crossing distance as the start-up time for each start type; 3.1, 0.5, and 2.1 seconds for standing, quasirolling, and rolling starts, respectively. These numbers are not intuitive and the intercept of a regression analysis may not be the best way to find SLTs given that are many variables that are not included in the analysis. In addition, it is not particularly clear how SLT would be used to determine minimum green time (i.e., no formula was given), as the study only states that minimum green should account for the time required for the bicyclist to accelerate. Presumably, if you had an average cyclist speed, you could add the SLT to that to determine an appropriate crossing time and therefore signal timing. Furthermore, since crossing time and distance were not heavily correlated in this study the average R 2 value for the regression lines was these values are rough estimates and lack corroboration from further studies. The most comprehensive study exploring SLT (referred to in their paper as offset time) was done by Shladover et al. (2011) and expanded upon data from a 2009 study. Offset times were determined graphically by plotting cyclists trajectories (position vs. time) and extracting the time difference where the line tangent to the trajectory curve (indicating cruising speed) crossed the line of the starting position. This offset time is the time required for a cyclist to react, start and accelerate to cruising speed. The study found 80 th and 90 th percentile offset times to be four and five seconds, respectively (though there were outlier times of up to eight seconds for 90 th 7
27 percentiles at one intersection). One study intersection was a noticeable outlier in terms of its distribution of longer offset times. Exploration of this outlier led to the speculation that cyclists at that particular intersection were more slowly moving into the intersection due to three potential factors the limited visibility and high speeds of cross traffic and the steeply crowned intersection. It was suggested that cyclists were more cautiously moving out into the intersection because of visibility concerns about dangerous cross traffic and, additionally, were physically slowed by the steep crown at the crossing. It therefore took a longer amount of time to accelerate to a final speed. This research suggest that intersection characteristics besides grade can have an effect on cyclist performance and thus have important implications for minimum green time that should be considered when adjusting signal timing for bicycles. More research and data are needed to generalize these findings and provide realistic SLT design values Speed Of the sources that explored performance characteristics of cyclists, seven reported values for cyclist speed. The results of two studies by Shladover et al. (2011 & 2009) were combined, however, so this section of the review will deal with six studies. The performance measure speed can be further dissected into three speed types that were reported: approach, mean crossing, and final crossing speed. Definitions for speed parameters are found in Table 2-1. Table 2-1 Definitions of Reported Speed Types Reported Speed Definitions Approach Final Crossing Cruising Mean crossing Speed of cyclist nearing the intersection but far enough away to be unaffected by traffic control. Speed of cyclist as they crossed far edge of intersection after beginning from a standing start. Speed of rolling-start cyclists as they cross the far edge of the intersection. Average speed of a standingstart cyclist determined by dividing the total crossing time by the intersection width. Approach speeds were observed for one study and reported as ranges by facility type, with the fastest speeds for cyclists in bike lanes as opposed to those on multiuse paths or sidewalks (Opiela et al. 1980) (see Table 2-2). Table 2-2 Reported Speeds (km/h) from Opiela et al., 1980 Sampling Observed Speeds (km/h) Facility Periods Mean Maximum Minimum Bike path Bicycle lane Sidewalk No facility Overall This potentially points to faster allowable design speeds for more confident users riding next to traffic in a bike lane. Another source reported average speed of crossing cyclists using a simple calculation of crossing distance over crossing time (Wachtel et al. 1995). Speeds from these first two studies are reasonably close to speeds listed in AASHTO s guide, which are meant to accommodate 98% of class A and B riders. 8
28 Remaining sources reported final crossing speeds of standing-start cyclists and cruising speeds of rolling-start cyclists. While video recording was utilized by all studies to collect raw data, analysis and subsequent calculations and reporting of speed were varied and made comparisons between study results difficult. Pein used crossing distance vs. crossing time for individual riders to develop a 15 th percentile crossing speed equation and a linear regression equation for estimating average crossing speed. The fit of the line of the 15 th percentile equation (R 2 value of 0.99) was much better than that of the linear regression for mean speed estimates (R 2 value of 0.75). While the mean speed, 7.9 mph, compared favorably to the AASHTO value for speed of basic adult cyclists, the 15 th percentile speed, 6.7 mph, was much closer to the design value for children (Class C, 6 mph). This leads to the inference that speed assumptions in AASHTO s 1999 guide do not in fact accommodate 98% of adult cyclists. The 2012 guide only provides a range for paved, level terrain (8-15 mph). One possibility for the low 15 th percentile speeds found in the study is discussed by Pein and has to do with the study location: a trail. These speeds were low when compared to actual rolling speeds of cyclists riding on the roadway adjacent to the trail crossings. The lower speeds could potentially be explained by a difference in trip purpose, with recreational riders on the trail traveling at a more leisurely pace than presumably utilitarian riders on the roadway. As this was the only study that used data from a trail, more research and more variables in the regression modes are needed to determine if trip purpose significantly affects crossing and cruising speeds. Shladover et al. (2011) combined the cumulative distributions of crossing speeds at each study intersection and analyzed their differences with respect to variables associated with each crossing (including both cyclist and intersection characteristics). While most average speeds per intersection were within the range of AASHTO design values for adult cyclists, it was shown that final crossing speed for both standing and rolling starts was noticeably influenced by intersection geometry; speed, visibility, and density of opposing cross traffic; age and ability of the cyclist population; trip purpose (i.e., recreational vs. utilitarian trips); and time of day. It isn t clear how trip purpose was determined, though it is implied that knowledge of the land uses and the likelihood that there were tourists biking in the area were decision factors. The researchers also found that offset times and final crossing speeds were not correlated, further emphasizing the dependency of crossing speed on a variety of factors. A study by Wheeler et al. (2010) sought to determine correlations of gender, intersection grade, and season with crossing speed. It was determined that intersection grade and gender of the cyclists significantly affected crossing speeds. Results differed from those of Shladover with observed average speeds significantly lower than the 11.7feet/second (8 mph) suggested by the 1999 AASHTO guideline for basic adult cyclists (class B). Similarly to acceleration results from this study, females experienced statistically significant slower crossing speeds than males, leading to longer required crossing times. A study of cyclists in Davis, CA, found the mean and median crossing and cruising speeds of the study population to be comparable to AASHTO values (Rubins and Handy 2005), but since AASHTO values are meant to accommodate 98% of cyclists for their respective cyclist type, it makes more sense to compare these assumptions with the 2 nd percentile values from the study. The study found that speeds for 98% of cyclists from both standing and rolling starts were well 9
29 under design values in AASHTO, even though it was noted by the researchers that the majority of the study population was made of college-aged adults. A histogram of the speeds observed by type (standing, rolling, and quasi-rolling are presented in Figure 2-2). Quasi-rolling starts are defined as those of cyclists stopped (with at least one foot on the ground) several bicycle lengths from the stop line, which allows them to speed up before entering the intersection. Figure 2-2 Histogram of Speed Frequency of All Observations (Rubins and Handy 2005) Comparing speed values across studies was difficult because of the assortment of speeds reported (i.e., mean, median, 15 th percentile, etc.). This is telling of an uncertainty among researchers about which speeds are most representative of cyclist populations and/or what percentage of the population is reasonable to accommodate. Researchers from one study expressed concern about the use of speed values higher than the 2 nd percentile value since signal timing would not accommodate particularly vulnerable groups, such as children (Wachtel et al., 1995). Also problematic was the incongruous analysis of factors influencing crossing speed. Table 2-3 and 3-4 summarize the differences in study scope and reporting methods, respectively. As demonstrated by the findings for crossing and cruising speed in the six previously discussed studies, crossing speed is highly dependent on a wide range of variables including, but not limited to, cyclist age, gender and ability; trip purpose; and intersection geometry and grade. Other performance measures that affect overall crossing time were found to be similarly variable over a range of parameters. Therefore, crossing time is dependent on a large number of environmental and demographic factors. Additional research is needed to quantify these relationships. 10
30 Table 2-3 Comparisons of Study Scope with Respect to Speed Speed Type Start Types Examined Influencing factors compared or discussed Study Approach Cruising Crossing Standing Rolling Grade Trip purpose Visibility Season Cyclist age and ability Gender Facility type Opiela et al. x n/a n/a x Pein X x x x x x Rubins & Handy X x x x x Shladover et al. X x x x x x x x Wachtel et al. X x x x Wheeler et al. x x x x x Table 2-4 Comparisons of Speed Reporting Reported as Study 2nd %-ile 10th %-ile 15th %-ile 20th %-ile 50th %-ile Mean Median Range Opiela et al. x x Pein x x Rubins & Handy x x x x x Shladover et al. X x x Wachtel et al. x Wheeler et al. x x 11
31 2.2 TRAFFIC OPERATIONS AND SIGNAL ISSUES Signalized intersections have traditionally been designed to accommodate motor vehicle traffic. Introduction of bike-specific phasing has the potential to lower the capacity and flow for other modes of travel at intersections because of the possibility for exclusive phasing. Conversely, if cycling is to grow as a utilitarian means of transport, the quality of service for cyclists must be considered. This would require that signal timing provide adequate time for users to clear the intersection safely and comfortably without enduring unnecessarily long wait times. In the CROW manual, it is noted that, Waiting for traffic lights appears to be the most significant source of delay for cyclists and that waiting time is a significant measure for bicyclefriendliness (2007 p. 204). Moreover, shorter wait times for cyclists are not only a matter of the quality of service but also of compliance. Since shorter wait times are preferred, cyclists are more likely to cross at noncompliant times if faced with unnecessarily long waits (Fietsberaad, 2003). Measures to alleviate long wait times for cyclists while providing adequate clearance times for all users are currently in place in the Netherlands, and include special measures for leftturning bicycles and twice green for cyclists in the same cycle phase (de Haan et al. 2003). Flow rate of cyclists through intersections has implications for appropriate signal timing to accommodate cyclists. Raksuntorn and Khan (2003) measured saturation headway and flow rate of cyclists at two signalized intersections. This study looked at cyclists distances from each other and the adjacent motorist lane. From these, they determined the unspecified width of a sublane, three of which fit into an 8-foot-wide bike lane. The saturation headway for all cyclists was found to be 0.80 seconds with a corresponding saturation flow rate of 1,500 bicycles per hour of green time per sublane. So, the 0.80s headway relates to three sublanes within an 8- foot-wide bike lane for a total flow of 4,500 per hour of green per 8-foot bike lane. The latter value is in contrast to the recommended bicycle saturation flow rate in the Highway Capacity Manual (HCM) (Transportation Research Board 2010) of 2,000 bicycles per hour of green time. The study also revealed a positive relationship between bike lane width and capacity. As the HCM value is not based on empirical evidence and does not account for varying lane widths, there is a need for more bicycle saturation flow studies that can confirm the results of Raksuntorn and Khan and/or further examine factors that influence bicycle saturation flow rate at signalized intersections. A 1995 study, Signal Clearance Timing for Bicyclists, cursorily explored whether or not minimum yellow and red intervals for automobiles were appropriate for accommodating bicycles (Wachtel et al. 1995). Using equations for minimum yellow and red intervals found in combined form in the 1999 AASHTO guide, researchers determined that cyclists needed a maximum of 2.8 seconds of yellow time below the minimum recommended in the MUTCD for vehicles and nearly 12 seconds of all-red time (red interval as the clearance interval and when using a cyclist speed of 8 mph, they get a clearance time of 11.6 seconds). It was found that timing already in use for cars should be adequate for bicycles since the yellow interval yielded cyclists an extra seconds and, since an red clearance interval of more than six seconds would be against guidance in the MUTCD, locally permitted red maximums would have to suffice (Wachtel et al. 1995). It should be noted that the low and high velocities used were 8-20 mph and 8-25 mph for yellow and red interval equations, respectively, though it is unclear how researchers arrived at these speeds or why they differ between the two equations. A check of yellow and red intervals 12
 used experimentally derived performance measures from both studies to come up with bicycle-friendly green times.")
32 using transparent, empirical data would be an apropos follow-up to the signal timing portion of this study. Two studies by Shladover et al. (2009, 2011) used experimentally derived performance measures from both studies to come up with bicycle-friendly green times. These green times were input into traffic simulation software to examine the effects of bike-friendly timing on motorist delay during congested and uncongested scenarios at actuated traffic signals. It was demonstrated that minimum green times for cyclists had no significantly negative impacts on delay. It was noted that during congested travel periods, vehicle actuation would automatically increase the minimum green time to an adequate length for cyclists. It must be emphasized that the finding regarding the lack of significantly negative impacts on delay was reached using simulation (SYNCHRO) in a very small set of traffic scenarios and major and minor traffic flows. Work to investigate the effects of more innovative signal phasing options, like twice green giving cyclists two green phases within a cycle, is needed in addition to research to corroborate the findings of Shladover et al. Shladover et al. (2011) also plotted the total time available to cross the intersection based on the observed values of offset and crossing speeds as a function of crossing width. The figure shows the guidance for minimum green from the Caltrans MUTCD. In the figure, the 80 th percentile crossing times are indicated by dashed lines and the 90 th percentile crossing times are solid lines. The orange lines represent an outlier intersection. The Caltrans timing appears to represent the 85 th percentile cyclist performance. Figure 2-3 Crossing Times as a Function of Street Width (Shaldover et al.) 13
33 There is a marked need for further examination of bicycle flow and the effects of bike-friendly signal timing, using reliable performance data, on traffic flow in order to effectively time signals for bicycles while minimizing delay for other users 2.3 SAFETY AND COMPLIANCE In order to create guidance for bicycle-specific traffic signals, information is needed on their safety effects and whether or not cyclists comply with these special indications. In fact, compliance may affect cyclist safety using bicycle infrastructure. One study on drivers attitudes towards cyclists found that drivers increased risky behavior around bike-specific facilities, possibly because there was less perceived risk of a cyclist making unpredictable maneuvers into the way of the motorist (Basford et al., n.d.). Although there are a number of bike signals in place, few studies have attempted to illuminate their effectiveness at increasing safety and compliance. One case study of a bike signal at a trail crossing of a roadway in Denver, CO, attempted to look at cyclist compliance before and after the installation (Denver, CO 2009). Previous to installation, only a pedestrian signal head existed and cyclists were considered compliant only if crossing during the WALK phase. As might be expected, cyclists continued to cross during the flashing-hand phase of the pedestrian signal since it allowed ample time for them to cross. It was shown that with the installation of a bike signal, cyclists were more likely to cross during the bicycle interval time. However, comparison of cycle phase time and displays of the bike and pedestrian signals revealed that, while cyclists were more likely to cross at compliant times, compliant times provided by the bike signal matched the existing behavior of cyclists. The study also sought to examine potential motorist confusion regarding the bike signal. None was found but more studies are needed to corroborate this result. Compliance of cyclists at bike-specific signals is likely related to overall cyclist compliance with all traffic indications, especially signalization at intersections. Two studies done abroad analyzed the rate of red-light running at signalized intersections and factors that affect the likelihood of this type of non-compliance. The first study was based in China and looked at red-light running of users on both bicycles and electric bikes. It was found that, for cyclists only, 50% of riders violated the red indication. The likelihood of red-light running increased significantly with youth, decreasing group and queue size, low cross-traffic volume and witness of other users running the red light. The study identified three types of cyclists: law-obeying, risk-taking and opportunistic. Risk-takers and opportunists violated a red interval differently, with risk-takers riding through the signal without yielding and with opportunists growing impatient with the red indication and crossing during an available gap (Wu et al. 2011). The behavior of the opportunists validates the assertion that increased wait time increases non-compliance of cyclists (Fietsberaad 2003). Lastly, it was found that the majority (70%) of non-compliant cyclists crossed during the very beginning or end of the red phase, suggesting two scenarios: (1) Cyclists speeding through the intersection to avoid stopping and (2) cyclists jumping the gun and beginning their crossing maneuver before the green phase (Wu et al. 2011). The second study done on cyclist compliance analyzed cyclist behavior at signalized intersections in Melbourne, Australia. Researchers found the rate of red light non-compliance to be only 7%, much lower than that for cyclists in the previously-mentioned study. Researchers 14
34 also found that left-hand turn violations (similar to right-hand turns in the United States) were 28.3 times as likely, indicating that non-compliant actions with few conflict points are more attractive to cyclists. Results also showed that the presence of other users deterred the infringement of traffic indications as did gender, with females being more compliant (Johnson et al., 2011a). Parks, Monsere, McNeil and Dill (2012) studied compliance with signals in the Washington, D.C., area as part of a wider evaluation of the cycling infrastructure. They found compliance at signals strongly related to crossing traffic and somewhat related to delay or progression for cyclists. Each of these intersections are unique so while it is difficult to state definitively, a trend is apparent. The results of this analysis are in Figure 2-4, which shows the rate of compliance and a function of the conflicting vehicle flow rate (expressed as a 15-minute flow rate). Figure 2-4 Observations of Bicyclist Non-Compliance, Pennsylvania Ave., Washington, D.C. (Parks et al. 2012) Cooper et al (2012) recently presented an analysis of user behaviors at 12 intersections in the San Francisco metropolitan area. The study observed 557 cyclists in the 4-6 p.m. hours and categorized red-light running behaviors. Figure 2-5 shows a horizontal bar chart reflecting these data. The non-compliance ranged from 36-4%. The higher non-compliance intersections generally had more gaps in traffic while the higher compliance locations had steady opposing traffic. 15
 In terms of safety, no studies quantitatively evaluated installed bike signals for their effects on safety, though, as noted in previous sections of this review, cyclist safety increases with")
35 Figure 2-5 Observations of Bicyclist Behavior at SF Intersections (Cooper et al. 2012) In terms of safety, no studies quantitatively evaluated installed bike signals for their effects on safety, though, as noted in previous sections of this review, cyclist safety increases with increased availability of infrastructure. Theoretically, bike signals could increase cyclist safety by separating movements and/or user modes. This would mitigate collisions such as the right hook, where a motorist turning right collides with a cyclist crossing through an intersection. One criticism of bicycle-specific signals is that the possibility that motorists will confuse the indication with ones meant for motor vehicles. No published studies were found that examined this empirically or in a simulator. In the realms of safety and compliance at bike signals, there is much room for growth in research. Further study is needed to investigate how bike signals affect cyclist behavior by encouraging compliance since compliance is an important factor in the potential effectiveness of bike signals that seek to reduce auto-bike conflicts by separation of users. Extensive study is also needed on the actual safety effects of installed bike signals. 2.4 CONCLUSION This literature review summarizes the available research on bicycle performance as it relates to signal timing, the effects of bike-friendly signal phasing on motorist delay, and the safety and compliance of cyclists at bike signals. The review reveals a number of inconsistencies in the literature on bicycle performance, notably for cyclist speed and acceleration estimations. While some studies observed cyclist accelerations and speeds consistent with those suggested by AASHTO, others found that representative speeds were well under those values. Furthermore, there seems to be disagreement among professionals on which representative speeds should be considered when adjusting signal timing for bikes. Recommended adjustments for geometric factors such as grade or intersection skew were not identified. 16
36 The greatest variability in performance-related literature stems from the examination of influences on performance characteristics. Findings show that a wide variety of cyclist traits and intersection qualities contributes to cyclist performance. Further investigation of these correlations is needed in order to customize signal phasing at intersections with particular demographics and geometries. More detailed, quantitative knowledge of variables affecting performance will enable further study of signal timing and contribute to a greater understanding of changes in motorist delay and traffic flow due to bike phasing. Research on the safety of currently implemented bike signals is lacking. This is a crucial gap in the knowledge needed to create standards for the operation of bike signals since safety is a priority concern for cyclists and municipalities alike. Studies have explored three topics crucial to advising guidance on the implementation of bicycle-specific traffic signals: performance, traffic operations, and safety and compliance. Currently, data on performance characteristics is lacking consistency in reporting methods and exploration of variables affecting performance. There is no consistent methodology to determine field or real-world crossing speeds, accelerations, and SLT. Furthermore, the literature suggests that intersection characteristics besides grade (e.g., limited visibility, high speed of cross traffic) do have an effect on cyclist performance. In addition, the literature suggests that cyclist demographics (e.g., gender, age) can significantly affect performance. The potential existence of dilemma zones has not been discussed in the literature. Preliminary research using traffic simulation in a very restricted set of scenarios has shown no negative effects on intersection capacity or delays with the introduction of bike-friendly signal timing. However, this work was limited in scope and treatment. Clearly, more studies are needed to corroborate these findings and consider a meaningful array of green extensions, bicycle volumes, and traffic volumes at major and minor crossing streets as well as the impacts on arterial progression. Safety and compliance literature are another major gap in research to date, with very few documented analyses of quantitative comprehension, safety, and compliance impacts of bike signals. These missing pieces of research are crucial for determining design and operational standards for the implementation of bicycle-specific traffic control. 17
37 18
38 3.0 DATA ASSEMBLY This chapter describes data-collection procedures, data sources, and definitions employed to code and process video footage. Data collection took place at intersections in Portland, Eugene, Corvallis, Beaverton and Clackamas County, OR. 3.1 OVERVIEW OF DATA COLLECTION The objective of the video data collection was to obtain observations of cyclist behavior at signalized intersection in Oregon. Table 3-1 presents a summary of observations collected from video data analysis; a total of 4,673 cyclists were observed. To better address the research questions, the research team utilized video footage from both archived and original datacollection sources. Table 3-1 Summary of Cyclist Observations by Video Data Type Portland State University City of Portland Category At Intersections At At Bicycle At Bike Box Total Intersections Signals Treatment (Type 1) (Type 2) (Type 3) (Type 4) Hours of Video Number of Observed Cyclists Performance Queue Discharge Compliance 500 2,117 2,617 Total 4,673 The following subsections describe the data-collection methods and setup procedures for each video data type. The date of data collection and additional details about each intersection are summarized in Table Portland State University Video Data, Type 1 To support performance, compliance, and queue discharge analysis, video data were collected at five locations: Pearl Street and E 18th Avenue, Eugene, OR NW Buchanan Avenue and NW 9th Street, Corvallis, OR SE Johnson Creek Boulevard and SE Bell Avenue, Clackamas, OR 19
. The device contains a battery and digital video recorder (DVR). The cameras were pole mounted, out of the view of most road users.")
, midpoint of the cyclists path")
39 SW Lombard Avenue and SW 5th Street, Beaverton, OR SE Madison Street and SE Grand Avenue, Portland, OR The setup consisted of a portable video data-collection system equipped with two camera inputs (wide-angle cameras). The device contains a battery and digital video recorder (DVR). The cameras were pole mounted, out of the view of most road users. An example of the setup can be seen in Figure 3-1a. For intersections used in the performance and compliance analysis, cameras were angled to record one or more of the following: cyclist queuing area (see Figure 3-1b), midpoint of the cyclists path through the intersection, the point where a cyclist has completely crossed the intersection, or the signal indication for cyclists. Footage from the cameras was time synced by the DVR. Reference lines were painted at the intersection for later use in the analysis (see Figure 3-1b.) a) Data-collection Setup b) Trail Intersection Waiting/Queuing Area Footage Figure 3-1 Data-collection Examples Footage collected at the last intersection, SE Madison and SE Grand, was used in the queue discharge analysis and captured similar views as the City of Portland, Data Type 4 (see Section 3.1.4) Portland State University Video Data, Type 2 Video from two intersections were available from prior research that analyzed bicyclists performance (accelerations and speed) (Figliozzi et al. In Press; Wheeler et al. 2010). Footage was collected in a manner consistent with PSU Type 1 data. Collection occurred during the winter and summer at locations along popular commute routes with good pavement conditions. 20
40 SE Madison Street and SE Grand Avenue, Portland, OR N Vancouver Avenue and NE Weidler Street, Portland, OR A video camera was located at the far side of each intersection (relative to the direction of bike traffic), on the sidewalk adjacent to the bike lane. This provided a view of the cyclists approaching the intersection, stopping at the near side of the intersection on a red light, and traveling through the intersection on a green light. As in PSU Type 1 data-collection efforts, the pavement at each intersection was marked with orange paint to demarcate significant reference points City of Portland Video Data, Type 3 As part of their support for this project, the City of Portland installed video cameras to study cyclist compliance at locations with bicycle-specific traffic signals. The data include two camera inputs such that the cyclist, the traffic signal, and cross traffic were visible. The locations used in this research were: NW Broadway and NW Lovejoy Street, Portland, OR N Rosa Parks Way and I-5 SB Off-Ramp, Portland, OR NE Broadway and N Williams Avenue, Portland, OR City of Portland Video Data, Type 4 To analyze the queue discharge behavior at a signalized intersection with and without a bike box, video from the following intersection was employed. This data was also employed previously in a study of the effects of bike boxes on cyclist safety at signalized intersections (Dill et al. 2011). SE Madison Street and SE Grand Avenue, Portland, OR 3.2 INTERSECTION DESCRIPTIONS Data were used from nine intersections. At some intersections, multiple legs were used for data collection and analysis. This section provides brief descriptions of the intersections. Relevant details are summarized in Table 3-2. Aerial photos and vicinity maps are provided for each intersection. The crossing leg for which data were collected is identified on the aerial with a blue arrow. 21
41 Table 3-2 Summary of Locations for Data Collection # City Approach Type of Signal for Bikes Intersection Width (ft.)* Grade Time of Year Observed (mm/yy) Weather # of Cyclists Observed 1 Eugene, OR SB Pearl St. Left Side Bike Lane at E 18 th Ave. RS 61 F 10/12 CL 103 Eugene, OR WB E 18 th Ave. Bike Lane at Pearl St. RS 65 F 10/12 CL 30 2 Corvallis, OR SB NW 9 th St. Bike Lane at NW Buchanan Ave. RS 63 F 10/12 CO 6 Corvallis, OR EB NW Buchanan Ave. Bike Lane at NW 9 th St. RS 80 F 10/12 CO/F 15 3 Beaverton, OR EB SW 5 th St. Bike Lane at SW Lombard Ave. RS 55 F 10/12 CL/CO 63 Beaverton, OR WB SW 5 th St. Bike Lane at SW Lombard Ave. RS 55 F 10/12 CL/CO 69 4 Clackamas County, OR 5 Portland, OR 6 Portland, OR 7 Portland, OR Portland, OR 8 Portland, OR 9 Portland, OR Springwater Corridor Trail Bike/Ped Path at SE Johnson Creek Blvd. and SE Bell Ave. SB NW Broadway Bike Lane (from multi-use sidewalk on the Broadway Bridge to the onstreet bike lanes along either NW Lovejoy St. or NW Broadway) at NW Lovejoy St. WB NE Broadway Bike Lane at N Williams Ave. WB SE Madison St. Bike Lane to a 2-lane wide bike lane across the intersection at SE Grand Ave. WB SE Madison St. Bike Box to a 2-lane wide bike lane across the intersection at SE Grand Ave. EB N Rosa Parks Way bike lane to bike/ped sidewalk connection to bike lane at I-5 South on-ramp EB N Weidler St. Bike Lane at N Vancouver Ave. BS 75 F 9/12 CL 217 BS 90 F 07/11 CL/CO 1425 BS 75 F 06/11 CL/CO 557 RS 61 F 9/10 CO 585 RS 61 F 2/12 & 7/13 R/CO 402 BS 90 F 09/11 CL/CO 141 RS 70 U 7/08 & 12/08 CL/CO 173 Key: Direction NB = Northbound, EB = Eastbound, SB = Southbound, WB = Westbound Type of Signal RS = Regular Signal, BS = Bicycle-specific Signal Weather CL = Clear, CO = Cloudy/Overcast, F = Fog, R = Rain Grade F = Flat, U = Uphill * Note: Intersection width refers to the shortest, legal crossing distance for cyclists (usually from the stop bar to far line of the far crosswalk). 22
, and striped bike lanes at the curbs.")
42 3.2.1 Pearl Street / E 18th Avenue, Eugene, OR This four-leg intersection consists of a one-way street (Pearl Street) intersecting with a two-way street (E 18th Avenue). E 18th has one motor-vehicle lane in each direction, a center turn lane (that turns into a left-turn-only lane at the intersection for the westbound traffic), and striped bike lanes at the curbs. The crossing distance is 30 feet. The Pearl Street cross section consists of a right-turn-only lane, a bike lane, a through lane, a through/left lane, and another bike lane. The crossing distance is 103 feet. The left-side bike lane is to accommodate the large number of users destined for a multiuse path that begins one block to the south and east. Data were collected in October 2012 in clear weather conditions. Bicyclists are controlled by vehicle signals on both approaches. Figure 3-2 Vicinity Map and Aerial Photo, Pearl Street and E 18th Avenue, Eugene 23
 consists of two motor-vehicle lanes in each direction, a center turn-lane (that turns into left-turn-only lanes at the intersection), and bike lanes at the curb.")
43 3.2.2 NW Buchanan Avenue / NW 9th Street, Corvallis, OR NW Buchanan and NW 9 th Street is a four-leg intersection of two two-way streets. The major road (NW 9 th ) consists of two motor-vehicle lanes in each direction, a center turn-lane (that turns into left-turn-only lanes at the intersection), and bike lanes at the curb. The crossing distance is 63 feet. The minor road (NW Buchanan) consists of one motor-vehicle lane in each direction, with bike lanes at the curbs. The crossing distance is 80 feet. The data were collected in October 2012 in the morning. The weather was cloudy but not raining. Bicyclist movements are controlled with a regular traffic signal. Figure 3-3 Vicinity Map and Aerial Photo, NW Buchanan Avenue / NW 9th Street, Corvallis, OR 24

44 3.2.3 SW 5th Street / SW Lombard Avenue, Beaverton, OR This four-leg intersection consists of two two-way streets. SW 5th Street consists of one motorvehicle lane in each direction with bike lanes on both sides, and left-turn pockets at each of the approaches. SW Lombard Avenue has one motor-vehicle lane and bike lanes in each direction. Both crossings are 55 feet wide. Data were collected over two days in October The weather was clear for one day and cloudy the other day. Bicyclist movements are controlled with a regular traffic signal. Figure 3-4 Vicinity Map and Aerial Photo, SW 5th Street / SW Lombard Avenue, Beaverton, OR 25

45 3.2.4 SE Johnson Creek Boulevard / SE Bell Avenue, Clackamas County, OR This intersection is the only recreational/commuter multiuse path intersection. Bicyclists are expected to utilize the bicycle-specific signal, which allows for a single-stage diagonal crossing. The crossing distance is 75 feet. The major road at this intersection is SE Johnson Creek, consisting of one motor-vehicle lane in each direction, bike lanes on both sides, and a center turn lane that becomes a left-turn-only lane at each approach. When the bike signal is activated, people turning right from SE Johnson Creek onto SE Bell are displayed an active warning No Right Turn sign. The minor road is SE Bell, which consists of one motor-vehicle lane in each direction, bike lanes on both sides south of the intersection, and a single bike lane north of the intersection for the uphill, northbound traffic. The data were collected in September 2012 over the weekend. On the Sunday of data collection, the City of Portland held a Sunday Parkways event in East Portland, near this crossing. The weather was clear. Figure 3-5 Vicinity Map and Aerial Photo, SE Johnson Creek Boulevard / SE Bell Avenue, Clackamas County, OR 26

46 3.2.5 NW Broadway / NW Lovejoy Street, Portland, OR This three-leg intersection consists of two two-way streets and a separated bike path that carries cyclists across the Broadway Bridge. The separated path branches into two on-street bike lanes at the bridge s exit; a through lane for cyclists remaining on NW Broadway and a westbound lane for those turning onto NW Lovejoy. Southbound bicycle traffic remaining on NW Broadway (the southern leg of the intersection) utilizes the through bicycle lane and a bicycle-specific traffic signal to cross. The crossing distance is 90 feet. Broadway s southbound approach has two through lanes and a right-turn lane, which is the source of conflict for through cyclists. Cyclists turning right onto NW Lovejoy have a continuous lane separate from that for through cyclists. NW Lovejoy s approach has two lanes, one left-turn-only and one for either left- or right-turning motorists, and striped bike lanes at the curbs. The data were collected in July Weather was varied (clear and cloudy) but no rain. Figure 3-6 Vicinity Map and Aerial Photo, NW Broadway / NW Lovejoy Street, Portland, OR 27

47 3.2.6 N Williams Avenue / NE Broadway, Portland, OR Both approaches to this intersection are one-way roads, with the majority of traffic traveling westbound along NE Broadway, and the remaining traffic heading northbound along N Williams Avenue. Both Broadway and Williams allow vehicles to access I-5 northbound through an onramp located just north of the intersection on the west side of Williams. The NE Broadway cross section consists of two through motor-vehicle lanes, two right-turn-only lanes, and a striped bike lane at the curb. A bicycle-specific signal is utilized to mitigate the conflict between westbound through cyclists and right-turning vehicles on NE Broadway. When the bicycle-specific signal is green, right-turning vehicles are presented with a No Turn on Red active warning sign, in addition to a static No Turn on Red sign. The Williams approach consists of three motorvehicle lanes, all allowing vehicles to travel through the intersection while the lane furthest to the left also allows vehicles to turn left onto Broadway. In addition, there is a striped bike lane to the right of these three motor-vehicle lanes. The crossing distance is 75 feet. Data were collected over two weeks in June Weather was varied clear and cloudy. Figure 3-7 Vicinity Map and Aerial Photo, N Williams Avenue / NE Broadway, Portland, OR 28
48 3.2.7 SE Madison Street / SE Grand Avenue, Portland, OR This intersection consists of two one-way streets and was the focus of a before/after study when a bike box was added (Dill et al., 2011). The observations here were classified as Data Type 4. The cross sections depicted below reflect the before condition from that study. The cross section of SE Madison consists of two through motor-vehicle lanes, a bike lane to the right of the two through lanes, and a right-turn-only/through bus lane to the right of the bike lane. Buses use the right-turn-only lane to access a bus stop at the northeastern corner of the intersection, and then travel across the bike lane to merge into the through motor-vehicle lanes after picking up passengers. SE Madison begins to gain elevation after the intersection as it carries westbound traffic towards the Hawthorne Bridge. On the far side of the intersection, there are two receiving bike lanes. The cross section of SE Grand consists of four northbound through motor-vehicle lanes. The crossing distance is 61 feet. The data were collected in September 2010 and February Additional data were collected in July Bicyclist movements are controlled with a regular traffic signal. Figure 3-8 Vicinity Map and Aerial Photo, SE Madison Street / SE Grand Avenue, Portland, OR 29

49 3.2.8 N Rosa Parks Way / I-5 South Off-Ramp, Portland, OR N Rosa Parks Way is a major east/west road that crosses over I-5 with the actual intersection of study being where the on/off-ramps for I-5 South meet N Rosa Parks Way. The westbound cross section of N Rosa Parks Way consists of a striped bike lane at the curb, two motor-vehicle through lanes, and a left-turn-only lane to enter the I-5 South on-ramp. The studied approach is eastbound N Rosa Parks Way, as there is a bicycle-specific signal for this movement. The crossing distance is 90 feet. Eastbound Rosa Parks Way consists of one motor-vehicle through lane, one right-turn-only lane (onto the I-5 South on-ramp), and a sidewalk that is split to accommodate bicyclists and pedestrians. Motor vehicles are presented a No Turn on Red active warning sign when the bicycle signal is green so that cyclists can safely cross to the onstreet bike lanes on the east side of the intersection. Data were collected in September The weather was varied - clear and cloudy. Figure 3-9 Vicinity Map and Aerial Photo, N Rosa Parks Way / I-5 South Off-ramp/On-ramp, Portland, OR 30

50 3.2.9 N Vancouver Ave / NE Weidler St, Portland, OR This intersection involves two one-way streets. N Vancouver Ave carries SB traffic and consists of a bike/bus only through lane on the right side, a through motor vehicle lane to the left of the bike/bus lane, a through/left motor vehicle lane to the left of the through lanes, and a left-turn only lane at the far left-hand side of the road. NE Weidler Street consists of three motor-vehicle through lanes, a striped bike lane to the right of the through lanes, and a right-turn-only lane to the right of the bike lane. The approach on NE Weidler was the focus of analysis due to its uphill grade. The crossing distance is 70 feet. Bicyclist movements are controlled with a regular traffic signal. The data were collected in July 2008 and December The July weather was clear; the December weather was cloudy. Figure 3-10 Vicinity Map and Aerial Photo, N Vancouver Avenue / N Weidler Street, Portland, OR 31
51 32
52 4.0 DATA REDUCTION METHODOLOGY To acquire the necessary data to complete this research, video footage was reviewed and a number of data elements were extracted for each observed cyclist. This chapter is organized to reflect that data elements are categorized as descriptive, events, or related only to performance, queue discharge, or compliance analysis. Data for each cyclist were recorded in an Excel spreadsheet with each cyclist represented by one row. The description of these data elements (along with their reduction codes) are defined below in the following subsections. 4.1 DESCRIPTIVE DATA Descriptive data elements are used to qualitatively describe each cyclist or the context of the observation Date and Day of the Week The date and day of the week of each cyclist were recorded Weather Weather was coded during the data collection as either: Other (0), Clear (1), Cloudy/Overcast (2), Rain (3), or Fog (4). Nearly all data collected for this project (that recorded this element) took place during clear weather. Two data collection periods for the Type 2 data occurred during winter Age Cyclist age was categorized into four categories: (U) Unknown, (1) Young (<18 years), (2) Middle (18-50 years), or (3) Older (> 50 years). In the Type 2 data, cyclists were classified only as young and old. There was considerable uncertainty in age classification from the video Sex Sex was coded to two variables: (0) Male or (1) Female, except for cyclists of different sexes riding a tandem bicycle who were classified as NA Helmet Use Helmet use was recorded as either: (1) Yes or (0) No Commuter or Recreational The commuter or recreational status of each cyclist was determined by day of the week. Cyclists recorded on Saturday and Sunday were classified as recreational while all other cyclists were classified as commuter. All of the riders observed at the Springwater Trail Crossing were classified as recreational. 33


53 4.1.7 Cargo Cargo was recorded as either: (0) No Cargo or (1) Cargo. Cyclists carrying small backpacks to those utilizing a cargo bike or trailer were classified as having cargo. Note that the presence of cargo was only collected during reduction of Type 1 data. 0 - No Cargo 1 Cargo Figure 4-1 Screen Capture for Clothing Type Alone or Group Cyclists were recorded as either: (0) Traveling Alone or (1) Group Riding when traveling with a partner or group (side by side or within one bicycle length from each other) Number of Cyclists Waiting The number of cyclists already waiting at the stop bar was recorded as either: (0) Cyclist is the first to arrive at the stop bar; (1) One cyclist is already waiting at the stop bar; (2) Two cyclists are already waiting at the stop bar; or (3) Three or more cyclists are already waiting at the stop bar Car in Adjacent Lane The presence of cars was recorded as: (0) No cars present during the time that the cyclist was waiting or (1) One or more cars present at any time the cyclist was waiting. This variable only observes the lane(s) directly adjacent to the cyclist Cyclist Balancing Cyclists were recorded as either: (0) Having one foot on the ground or (1) Balancing the bike with both feet on the pedals. 4.2 EVENTS 34
54 These data elements refer to a specific time when an action or event took place. Although, a timestamp was provided in all original video files (accurate to within one second), increased precision was necessary for calculating time used in analyses. The media software program SMPlayer was used to view the video (since it displays frame numbers). The frame number at the start and end of each event was recorded. The number of frames per second at which the video was originally recorded (fps) was used to convert the difference in frame numbers to elapsed time in seconds. The accuracy of this method was validated by comparing times obtained from timestamps to those calculated from frame numbers for a sample of observations. The ability of the researchers to consistently obtain equivalent frame numbers for specific events was also verified Arrival Time Arrival time was recorded when a cyclist took a foot off a pedal to rest it on the ground. The arrival time of cyclists on recumbent bikes or those balancing was recorded at the point of zero forward motion. When the observed cyclist did not make a complete stop (e.g., a noncompliant cyclist), the data collector used their best judgment to determine when the cyclist s forward motion was at its slowest and recorded arrival time Time of Green Time of the beginning of the green indication utilized by the cyclist(s) Departure Time Time when forward motion of the cyclist begins Wait Time Wait time was calculated by subtracting the arrival and departure times Time of Mid-Intersection Time when the cyclist's front tire crosses the center mark on the pavement Time of Intersection Crossing Time when the cyclist's front tire crosses the far line of the far crosswalk. 4.3 PERFORMANCE For analyzing performance characteristics, only cyclists who 1) came to a complete stop at the intersection; 2) stopped at one of the designated reference lines (see Figure 4-2); 3) was the frontmost cyclist at the signal; 4) had at least one foot on the ground; and 5) used the bike lane before and after the intersection were eligible to become part of the dataset. These constraints allowed researchers to estimate the perception reaction time, acceleration, and velocity of a cyclist in a consistent manner. 35
 were created to calculate the distance traveled by cyclists stopping near, but not at, the")
 All intersections except Springwater Trail b) Springwater Trail Figure 4-2 Positions of Reference Lines for Performance Study 4.3.")
55 4.3.1 Reference Line The reference line closest to the cyclist s front wheel just before departure was recorded. The far and near sides of the 1-foot-wide stop bar were labeled 0 and 1, respectively. Since cyclists do not consistently stop directly over the stop bar, additional reference lines (in orange) were created to calculate the distance traveled by cyclists stopping near, but not at, the stop bar. Reference lines were numbered in the manner depicted in Figure 4-2. Reference lines created by researchers were spaced in 2-foot increments from the near edge of the stop bar. a) All intersections except Springwater Trail b) Springwater Trail Figure 4-2 Positions of Reference Lines for Performance Study Reaction Time Reaction time is equal to the difference between the Time of Green and Departure Time Acceleration and Speed The following methodology on determining acceleration and speed is from a forthcoming paper by (Figliozzi et al., In Press). Note that since frame numbers were used to record all times used in this analysis, times were divided by the fps value of the video to obtain times in seconds. The determination of observed cyclists acceleration and speed is recommended by the guidance documents (American Association of State Highway and Transportation Officials, 2012; National Association of City Transportation Officials, 2011; State of California Department of Transportation, 2012). However, these documents provide no methodology to determine velocities or acceleration is provided. It should be noted that automated methods to extract object trajectories from video data are possible (Zaki et al., 2012), though not widely available. Even if detailed video trajectories are available, the determination of a value for observed speed and acceleration is not trivial because values of speeds and accelerations are a function of time and individual bicyclist performance. For example, starting from a standing position initial speed is zero and it takes a time t c to reach cruising speed. The change of speed is, in turn, a function of the acceleration a from time zero t 0 (departure time) to the time t c. As expected from physics 36

56 and real observations, the value of acceleration is not a constant but tends to decrease as speed increases (Wheeler et al., 2010). Hence, many potential acceleration values can be observed in a second-by-second trajectory analysis. To compare against guidance acceleration and speed values a consistent methodology is necessary, one derived from fundamental physics equations of motion, to obtain representative average acceleration and speed values. Figure 4-3 Schematic of Data Reduction Methodology It is not trivial to obtain representative average acceleration and speed values. For an individual bicyclist, it is possible to observe the time t 1 to cover a given distance d 1 from a standing position. If the goal is to obtain an average acceleration, denoted a and a cruising speed, v c, assuming constant acceleration, the time to reach cruising speed is t c = v c / a and the distance traveled is equal to d c = 1/ 2a(t c ) 2 = (v c ) 2 / 2a. The time elapsed up to the first observations is equal to: t 1 = t c + (t 1 t c ) = t c + (d 1 d c ) / v c (1) Replacing v c =t c a and d c = (v c ) 2 / 2a into (1): t 1 = v c a + d (v 1 c )2 / 2a v c 37
57 t 1 = v c 2a + d 1 v c (2) In equation (2) two values are known from measurement (t 1, d 1 ) and two unknowns, v c and a. Hence, the problem is indeterminate. It is not possible to estimate both values simultaneously. This indetermination can be broken by taking another observation. In addition to (t 1, d 1 ) it is possible to obtain a second pair of observations timing the cyclists time t 2 to cover a given distance d 2 from a standing position and starting at time/distance (t 0, d 0 ). Without loss of generality, let s assume that t 1 < t 2 and d 1 < d 2. Using the observations (t 1, d 1 ) and (t 2, d 2 ), it is possible to have four different acceleration profiles based on the point at which each bicycle rider has finished accelerating (i.e., the cyclist has reached a cruising speed). These cases are described as follows: Case 1: The cyclist reaches cruising speed within, at or before reaching the time/distance (t 1, d 1 ). Case 2: The cyclist reaches cruising speed after (t 1, d 1 ) but before reaching (t 2, d 2 ). Case 3: The cyclist reaches cruising speed after (t 2, d 2 ). Case 4: The cyclist does not have a non-decreasing speed profile. To simplify the notation and expressions, the prime symbol is introduced to denote the differences. For example, the partial time/distance between observation 1 and 2 are denoted: t 2 = t 2 t 1 d 2 = d 2 d 1 Similarly, the partial time/distance between observation 0 and 1 are denoted: t 1 = t 1 t 0 d 1 = d 1 d Determining Case 1 The cyclist reaches cruising speed within, at or before reaching the time/distance (t 1, d 1 ); hence, it is possible to solve the indeterminacy because the second period is travelled at a cruising speed: v c = (d 2 d 1 ) /(t 2 t 1 ) = d 2' / t 2' (3) Replacing (3) into (2) we obtain the value of a: t 1 = d 2' 2at 2' + d 1 t 2' d 2', 38
58 d 2' a = 2t 2' (t 1 d 1 t 2' ) d 2' t c = v c / a (4) Given that accelerations cannot be negative, Case 1 holds when this obvious inequality is valid: d 2' > t 2' d 1 t Determining Case 2 The cyclist reaches cruising speed after (t 1, d 1 ) but before reaching (t 2, d 2 ); hence, in Case 2 we can estimate the acceleration in the first period: a = 2d 1 (t 1 ) 2 (5) However, t c and v c are still unknown. In this case, v c is reached in the time interval [t 1, t 2 ] and equation (2) must be written as: t 2 = v c 2a + d 2 v c (6) Expressing equation (6) as a 2 nd order equation: (v c ) 2 2a t v + d = 0 2 c 2 Replacing, we obtain: v c = at 2 ± (at 2 ) 2 2ad 2 (7) To obtain real roots, the term inside the square root must be positive: (at 2 ) 2 2ad 2 > 0 t 2 2 > 2d 2 / a From the analysis of equation (7) only one root may be feasible. This root is infeasible: v c = at 2 + (at 2 ) 2 2ad 2 (8) This is proved because the cruising speed must satisfy is assumed to be reached in the time interval [t 1,t 2 ] ). v c at 2 (i.e., in Case 2 the cruising speed 39
59 For the only potentially feasible root (see expression (9)), the feasibility constraint indicates that the cruising speed is reached in the time interval [t 1,t 2 ] as shown in expression (10). v c = at 2 (at 2 ) 2 2ad 2 (9) t 1 a v c t 2 a (10) Determining Case 3 For Case 3, the cyclist reaches cruising speed after (t 2, d 2 ). Hence, we may have two average accelerations in each period, a 1 and a 2 : d 1 = 1/ 2a(t 1 ) 2 (11) d 2' = v 1 t 2' + a 2 (t 2' )2 2 (12) From (11) we know that: a 1 = 2d 1 (t 1 ) 2 (13) From (12) we obtain: a 2 = 2(d 2' a 1 t 1 t 2' ) (t 2' ) 2 Since a 2 > 0, a feasibility constraint is that: d 2' > 2a 1 t 1 t 2', d 2' > v 1 t 2' (14) The distance traveled in the interval [t 1, t 2 ] must be larger than the distance that would be traveled if the speed at time t 1 is maintained (i.e., if a 2 = 0). If this condition does not hold, the bicyclist is decreasing speed (i.e., a 2 < 0), and the speed profile is no longer a non-decreasing function of time. This is not what is usually expected from a cyclist crossing an intersection from a standing position; a cyclist s intuitive behavior would be to brake to reach a standing position. This latter case naturally brings up the final case Determining Case 4 From a standing position, Cases 1 to 3 have assumed a positive acceleration until the cyclist eventually reaches cruising speed, (i.e., the speed profile is non-decreasing). However, in Case 4 the cyclist has a decreasing speed profile and does not fit any of the previous cases. For example, the cyclist may accelerate to a maximum speed and then decelerate to a final cruising speed. 40
60 4.3.8 Determining Acceleration and Speed Distributions Utilizing two time/distance measurements and the formulas presented in this section, it is possible to classify a bicyclist s performance case, acceleration and cruising speed value. Each bicycle crossing time is allocated to an acceleration case, and then average acceleration and cruising speed values are calculated for each bicycle rider. By aggregating individual rider performance values, it is possible to put together distribution functions of average acceleration and cruising speeds. These distributions can be used to calculate average and 15 th percentile values. Finally, it should be noted that the speed and acceleration distributions are a function of the intersection width and the chosen values for (d 1, d 2 ). However, d 1 and d 2 are not equal across observations from the same intersection due to the utilization of reference lines and the selection of intersections of various widths. 4.4 QUEUE DISCHARGE The purpose of this analysis is to compare the discharge characteristics of cyclist queues at a signalized intersection. These characteristics were determined for one signalized intersection using footage from before and after installation of a bike box. Precision similar to that of event data elements was needed for analysis of cyclists queues, so the same methodology was used to record times associated with specific events (see Section 4.2). In the Highway Capacity Manual (HCM) (Transportation Research Board 2010), the headway for the first vehicle is the elapsed time, in seconds, between the initiation of the green and the front wheels of the first vehicle crossing over the stop line (pg. 4-11). Headways for subsequent vehicles are equal to the elapsed time between the front wheels of said vehicle and the one prior. Consistent with the HCM methods, the time used to calculate headways was the time that a cyclist s front wheel crossed the reference point. However, the stop line was not chosen as the reference point for this analysis for two reasons: 1) Cyclists typically place their front wheels on the stop line, which would make the headway for the first cyclist much shorter than that for subsequent cyclists; and 2) Unlike motor vehicles, it is possible for more than one cyclist to line up at the stop line, which would confuse the relationship between queue position and headway. For these reasons, the far line of the near-side crosswalk was chosen as the reference point for calculating headways. For calculation of the intersection clearance time, the near line of the farside crosswalk was used as the reference point since this is the point at which cyclists were no longer in conflict with motor vehicles. Due to the ability of cyclists to line up parallel to each other inside a bike box, ordering cyclists in a bike box by their position in the queue was not possible. Thus, calculation of individual headways using the HCM method was not possible. Therefore, data reduction differed depending on the type of infrastructure observed. The following sections outline the data reduction methods for each infrastructure type and the reasoning behind these differing methods. All data elements were recorded in an Excel spreadsheet with each cyclist represented by one row Standard Bicycle Lane Analysis for the before portion of video closely followed the HCM methods for determining the headway distribution of a queue of automobiles since cyclists tended to line up one behind 41
61 each other, similar to motor vehicles. The data elements described below are collected for each cyclist queue unless otherwise noted Beginning of Red Indication Knowing the time of the start of the green indication is necessary for analysis of queue discharge. The archived video footage did not include a view that included the signal head controlling the bicycle movement. However, the cross traffic signal could be easily seen. From the signal timing plans, there was 1.0 second of all red. Thus, the time of red indication was recorded and 1.0 second added to determine the start of green Total Number of Cyclists in Queue Only cyclists that came to a complete stop and put a foot down at the signal were counted as part of the queue, with the frontmost cyclist in position 1. If a cyclist s feet were not visible, an observed halt in forward motion was also counted as a complete stop. In a few instances, the presence of a bus at an adjacent bus stop created large gaps in the cyclist queue. In these instances, only cyclists in the queue before the gap were counted as being part of the queue so as not to create artificially large headways between cyclists on either edge of the gap. Additionally, those cyclists that jumped the signal were not counted as part of the queue. In general, if the position or behavior of the first cyclist in the queue had potential to affect the integrity of the entire queue (e.g., if stopped more than half a bicycle wheel-length in front of the stop bar and was, therefore, affecting the positions of other riders relative to cyclists in the same position from other queues), footage of that queue was not used in analysis Cyclists in Front of Stop Line The number of cyclists whose front wheel at least partially rested in front of the stop bar (but not more than half a wheel-length) was recorded. This data element was useful for checking large headways Position in Queue The position in the queue was recorded for each cyclist after determining the number of cyclists eligible to be part of the queue, per the method in First Bike to Clear Queue This data element is the time at which the cyclist s front wheel crosses the reference point line. The definition for the reference point is discussed in Section Headway Headway for the first cyclist in the queue was calculated using Equation 1. h 1 = (Ref 1 Red) 1s ( 1 ) 42
62 Where: h 1 = the headway for the 1st cyclist Ref 1 = the time at which the 1st cyclist sfront wheel crosses the reference line Red = the time at the beginning of the Red indication for opposing traffic 1 second is then subtracted from this time to account for the 1second red clearance time at the studied signal. * The headway for the first cyclist would simply be the difference between the reference point and green indication times divided by the frames per second of the video footage for video where the green indication is visible. Headway for subsequent cyclists was calculated using Equation 2. h n = (Ref n Ref n 1 ) ( 2 ) Where: h n = the headway for the n th cyclist Ref n = the time at which the front wheel of the n th cyclist crosses the reference line Ref n 1 = the time at which the front wheel of the n 1 th cyclist crosses the refernce line * In the event of passing cyclists, the position number of the passing cyclist can be traded with the position number of the passed cyclist in order to avoid negative headways between cyclists Last Bike to Clear Queue For this data element, the frame number at which the front wheel of the last cyclist in the queue crossed the reference line was recorded Last Bike to Clear Intersection The frame number at which the back wheel of the last cyclist in the queue crossed the reference line for intersection clearance (this is different than the reference point for queue discharge, see clarification in Section 4.4) is recorded for this element. It references the last instant during which a cyclist is vulnerable to opposing traffic (t 2 in Figure 4-4) Infrastructure Type The infrastructure type was recorded as either: (0) Bike Lane or (1) Bike Box Bike Box Due to the nonlinear movements, close spacing, and passing tendencies of cyclists utilizing a bike box, headways among cyclists were difficult to discern. This prompted the development of a new method for calculating discharge and intersection clearance times for cyclists using a bike box. The methods for recording the Beginning of Red Indication time, Cyclists in Front of Stop Line, Last Bike to Clear Queue, Last Bike to Clear Intersection, and Infrastructure Type are all exactly as with cyclists queuing in a bicycle lane and will not be restated in this section. 43
. Cyclists are only eligible to become part of the queue if they meet requirements outlined in Section 4.4.1.2. 4.4.2.2 Cyclists Within Bike Box This data element is equal to the number of cyclists within the bike box (not including the bike lane behind the bike box) (see Figure 4-4 for clarification).")
63 Total Number of Cyclists in Queue For bike boxes, the total number of cyclists in the queue is equal to the number of cyclists recorded within the bike box (Section ), plus the number of cyclists recorded beyond the bike box (Section ). Cyclists are only eligible to become part of the queue if they meet requirements outlined in Section Cyclists Within Bike Box This data element is equal to the number of cyclists within the bike box (not including the bike lane behind the bike box) (see Figure 4-4 for clarification) Cyclists Beyond Bike Box The number of cyclists eligible to be part of the analysis queue (see Section for clarification) but that are situated in the bicycle lane beyond the bike box are recorded for this data element (see Figure 4-4 for clarification). Figure 4-4 Possible Cyclist Positions in a Bike Box First Bike to Clear Queue This is the moment the front wheel of the first cyclist in the queue crosses the reference point (t 1 in Figure 4-4). 44
64 4.5 COMPLIANCE Cyclists were only eligible to become part of the compliance dataset if they 1) arrived on a red indication and 2) utilized the bike lane on both sides of the intersection (and bike signal where applicable). Cyclists continuing through the intersection on yellow or green, or those using the motorist lane instead of the dedicated bike infrastructure, did not become part of the dataset. Similarly, cyclists using the crosswalk or exhibiting other nonstandard behaviors were not counted. However, different from the performance study, more than just the frontmost cyclist was eligible for use. In addition to the descriptive data elements discussed in Section 4.1, a few intersection/cyclist characteristics specific to compliance were recorded Cross-Traffic Volume Cross traffic at each location was estimated based on a 15-minute count of cross-traffic volumes that were recorded in 15-minute increments and extrapolated to hourly volumes. These hourly volumes were then applied to all cyclist records for a given time period (e.g., AM peak hour for a weekday). Values for motorist traffic crossing the path of the cyclist were recorded after all other data reduction was complete Compliance Indicator The compliance of each cyclist was reduced and coded to one of five categories: (0) Compliant, (1) Noncompliant: RTOR, (2) Noncompliant: Gap Accepted, (3) Noncompliant: Signal Jump, or (4) Noncompliant: Other Compliant Cyclists were recorded as being compliant if they met the requirements to be in the dataset and exhibited none of the noncompliant behaviors described in the following paragraphs Noncompliant: RTOR The compliance indicator, RTOR was used to denote cyclists who made right-turn maneuvers without stopping Noncompliant: Gap Accepted The Gap Accepted indicator was used to denote cyclists who left the stop bar during the green phase for opposing traffic. Since these cyclists were usually accepting a gap between two vehicles crossing the path of the cyclist, the indicator is named as such. A small number of cyclists departed during the opposing green phase, but no cross traffic was present before the change in phase. There is a behavioral similarity to signal jumps, but these cyclists were classified as Gap Accepters. An additional data element was recorded when Gap Accepted noncompliance was observed. See Section for documentation of this datum. 45
65 Noncompliant: Signal Jump The Signal Jump compliance indicator was used to denote cyclists who left before receiving a green indication but after the green phase for opposing traffic (i.e., during the yellow or red clearance interval), assuming yellow and red clearance phases of 1-3 seconds, respectively, at all signals. An additional data element was recorded when Signal Jump noncompliance was observed. See Section for documentation of this datum Noncompliant: Other During this study, three cyclists who met the criteria to become part of the dataset exhibited noncompliant behavior similar to Gap Accepted, with the exception that these cyclists proceeded to halt traffic as they crossed. These were the only cyclists classified as Other Gap Time Gap time was only recorded in the event that a cyclist was classified as a Gap Acceptor. Two types of cyclists were observed accepting gaps: Runners and Waiters. Runners are defined as cyclists who proceed into the intersection without first stopping at the stop bar (wait time = 0 seconds), while Waiters initially stop at the stop bar but proceed into the intersection during the red after waiting (wait time > 0 seconds). For Runners, the gap time (in seconds) we recorded is defined as the difference between a cyclist s departure time and the time that a vehicle crosses the cyclist s path. Waiters choose a gap between two vehicles. Their gap time is equal to the headway between vehicles Time to Green The Time to Green was only recorded in the event that a cyclist s behavior was classified as a Signal Jump. This data element is equal to the time (in seconds) from the cyclist s departure to their green indication Violation Number The Violation Number is recorded as either (0) No Violation or an integer of 1 or greater that indicates the number of successive violators of that red signal phase. For instance, recording a 1 for a cyclist indicates that they were the first to violate that particular red phase; a recording of 2 indicates that they were the second violator of that phase, and so on. 46
66 5.0 ANALYSIS AND RESULTS This chapter reports and discusses the results of data analysis. This chapter is divided into three sections: 1) performance, 2) queue discharge, and 3) compliance. Discussion of the results follows the performance and compliance sections. Discussion is imbeded in the queue discharge analysis. 5.1 PERFORMANCE In this section, results from analysis of perception-reaction times are presented first, followed by the results for distance to cruising speed, and the rates of acceleration and velocity. Though we collected many demographic and cyclist characteristics (e.g., sex, age, cargo), in practice signal timing for bicyclists must reasonably accommodate all expected users. Thus, we focus the analysis in this report on location-specific variables that may have implications for practice. Accelerations, cruising speeds and reaction times were analyzed by the following groupings: all cyclists by acceleration case by recreational or commuter (defined by weekday or weekend) by alone or group by presence of grade by intersection width (<65 feet = short, >65 feet = long) In each of the following subsections, a summary table of descriptive statistics is presented. The usual statistics (mean, minimum, maximum, standard deviation, and the number of samples) are reported. The range of the data are given by the 1 st and 3 rd quartiles (25 th and 75 th percentiles, respectively). Depending on the implications for design, either the 85 th percentile or the 15 th percentile value is reported. To compare the variability across data analysis groups, the coefficient of variation (CV) is reported. Larger values of CV indicate more variability relative to the mean. The standard deviation (SD) is used to compare variability within each group. The skewness and kurtosis statistics are presented to describe the shape of the distribution. Positive skewness values indicate right-skewed distributions. Kurtosis is the peakedness of the distribution. For reference, the kurtosis of the standard normal distribution is 3.0. Higher kurtosis values indicate more concentrated (sharper) peaks. Finally, for each grouping, the distribution of each variable is shown by kernel density plots. The kernel density plots are nonparametric estimates of the distribution. For interpretation purposes, the reader can consider these plots as continuous histograms Summary of Observations by Location Table 5-1 summarizes the observations by intersection for a select set of descriptive variables in addition to acceleration case. A total of 734 observations were made at the six intersections in the analysis. In the table, note that for the original (Type 2) data, not all categorizations were made of the cyclists. 47
67 Table 5-1 Summary of Observations for Performance Analysis by Location Type 2 Data Type 1 Data Variable SE Madison/SE Grand NE Vancouver/ NE Weidler Pearl St & E 18th Ave NW Buchanan & NW 9 th Ave SE Johnson and Bell SW Lombard & SW 5 th St. Row Total Row % Day of the Week Time of Day Weather Helmet Use Alone/ Group Sex Age Cyclist Type Cargo Case Weekday % Weekend % AM-Peak % Off-Peak % PM-Peak % Clear % Cloudy/Overcast % Rain % Fog % Yes % No % Alone % Group % Male % Female % Unknown % Young % Medium % Old % Recreational % Commuter % No Cargo % Cargo % Case % Case % Case % 48
68 5.1.2 Accelerations from Standing Start The acceleration values were determined by the methods described in the data reduction chapter. This analysis used the Portland State University (PSU) Type 1 and Type 2 data (734 observations). Table 5-2 presents the descriptive statistics summary for the analysis of accelerations. Figure 5-1 is a horizontal barplot of the median (50th percentile) and 15th percentile for all categories (these values are bolded in the table). As a reminder, acceleration cases are: Case 1 = Person reaches cruising speed before the midpoint [d 1 ] of the intersection. Case 2 = Person reaches cruising speed after the midpoint [d 1 ] and before the far side [d 2 ] of the intersection. Case 3 = Person reaches cruising speed after the far side [d 3 ] of the intersection. It is important to note that the determination of the average acceleration for a given cyclist is a function of the intersection width. 49
69 Table 5-2 Descriptive Statistics, Accelerations, (ft./sec 2 ) Statistic All Case Type Group Grade Crossing Width Commut er Recreati onal Alone Group Yes No Short Long Minimum th Percentile st Quartile Median Mean rd Quartile Maximum n SD CV Skewness Kurtosis
70 15th Percentile Median Long Short No Grade Grade Group Alone Recreational Commuter Case 3 Case 2 Case 1 All Cyclists Accelerations (ft./sec 2 ) Figure 5-1 Barplots of Median and 15 th Percentile of Acceleration by Category All Observed Cyclists Table 5-2 presents the summary statistics for the accelerations of all observed cyclists. The median value is 4.09 ft./sec 2 and the 15 th percentile is 2.86 ft./sec 2. The sample is skewed right and has maximum value of ft./sec 2. The kurtosis of the distribution was Figure 5-2 is the kernel density plot. Figure 5-2 Density of Accelerations (ft./sec 2 ), All Cyclists 51
71 By Case As shown in Table 5-2, average accelerations were also summarized by acceleration determination cases. The majority of riders are Case 1 (n = 593), reaching cruising speed before the midpoint of the intersection. These cyclists have the highest median acceleration at 4.36 ft./sec 2. Cyclists in Case 2 or 3 had lower accelerations (as would be expected since they do not reach cruising speed until further into the intersection). Figure 5-3 shows the kernel density plots of all three cases. Figure 5-3 Density of Accelerations (ft./sec 2 ) by Case By Recreational or Commuter Table 5-2 shows that people riding on the recreational path (n = 139) have accelerations that are less than people riding in a commute context (n = 595). Although intuitive, these results must be taken with caution because there was only one intersection with recreational riders. The recreational weekend riders were recorded at one location (SE Johnson and SE Bell). The weekday/commute riders had a median acceleration of 4.19 ft./sec 2 while the recreational riders had a lower rate of 3.78 ft./sec 2. The observations of commuter cyclists have a higher standard deviation (1.64 secs) compared to the recreational cyclists (1.45 sec). Figure 5-4 provides kernel density plots for each rider type and shows similarly shaped distributions. A two-sample t-test of means assuming unequal variances rejects the null hypothesis that the means are equal at the 95 th percentile confidence level (t = , df = , p-value = ) the difference in the mean accelerations is statistically significant. 52
72 Figure 5-4 Density of Accelerations (ft./sec 2 ) by Commuter (0) vs. Recreational (1) By Alone or In Group Table 5-2 shows that people riding as part of a group (n = 72) have accelerations that are much lower than the values for people riding alone (n = 242). Alone or group was not captured in the PSU Type 2 data (the NA panel of the figure). The median acceleration of the people arriving alone was 3.97 ft./sec 2 while the group riders had a rate of 3.32 ft./sec 2. The difference is larger for 15 th percentile accelerations: 2.93 ft./sec 2 and 2.15 ft./sec 2 for alone and group riders, respectively. Except for Case 3 cyclists, the 15 th percentile acceleration value for riders arriving in a group is the lowest for all comparisons. The alone riders have larger SD (1.34) compared to group riders (1.09). Figure 5-5 shows the kernel density plots for the observations and visually confirms these descriptive statistics. A two-sample t-test of means assuming unequal variances rejects the null hypothesis that the means are equal at the 95 th percentile confidence (t = , df = , p-value = 6.579e-07) the difference in the means is statistically significant. Figure 5-5 Density of Accelerations (ft./sec 2 ) by Alone (0) or Group (1) 53
73 By Grade Table 5-2 shows observations made at an intersection with a grade. Note that only one intersection had any uphill grade. Thus, there are 172 observations with a grade compared to 562 without. The 15 th percentile rate of acceleration is lower (2.59 ft./sec 2 ) than the value for intersections with no grade (2.95 ft./sec 2 ). The median values, however, are in reverse order with no grade (4.33 ft./sec 2 ) higher than grade (3.46 ft./sec 2 ). The observations without grade are more dispersed (SD = 1.69) than those with grade (SD = 0.97). These results must be taken with caution because there was only one intersection with an uphill grade. A two-sample t-test of means assuming unequal variances rejects the null hypothesis that the means are equal at the 95 th percentile confidence (t = , df = , p-value < 2.2e-16) the difference in the means is statistically significant. Figure 5-6 shows the kernel density plots of these observations. Figure 5-6 Density of Accelerations (ft./sec 2 ) by Grade (No = 0, Yes = 1) By Intersection Width Table 5-2 presents the summary statistics for accelerations by intersection width. The wide intersections include SE Johnson and SE Bell (75 feet), Vancouver/Weidler (70 feet), and Buchanan (80 feet). The median acceleration for the short crossing-distance intersections was 4.65 ft./sec 2 compared to 3.55 ft./sec 2 for the long crossings. Figure 5-7 shows the kernel density plots. A two-sample t-test of means assuming unequal variances rejects the null hypothesis that the means are equal at the 95 th percentile confidence (t = , df = , p-value < 2.2e-16) the difference in the means is statistically significant. 54
74 Figure 5-7 Density of Accelerations (ft./sec 2 ) by Intersection Width Cruising Speeds Table 5-3 presents the summary statistics for the cruising velocities obtained from a standing start. All values are in ft./sec. Figure 5-8 is a horizontal barplot of the median (50 th percentile) and the 15 th percentile for all categories. These rows are bolded in the table. 55
75 Table 5-3 Descriptive Statistics, Cruising Velocities from Standing Start, (ft./sec) Type All Case Type Group Grade Width Comm uter Recreatio nal Alone Group Yes No Short Long Minimum th Percentile st Quartile Median Mean rd Quartile Maximum n SD CV Skewness Kurtosis
76 15th Percentile Median Long Short No Grade Grade Group Alone Recreational Commuter Case 3 Case 2 Case 1 All Cyclists Speed (ft./sec) Figure 5-8 Barplots of Median and 15 th Percentile of Cruising Speed by Category All Observed Cyclists Table 5-3 presents the summary statistics for the velocities of all observed cyclists. Figure 5-9 is the kernel density plot of these values. The median value is ft./sec and the 15 th percentile value is ft./sec 2. The sample is slightly skewed right and has a maximum value of ft./sec (a recreational rider in Case 3). The kurtosis of the distribution was Figure 5-9 Density of Velocities (ft./sec), All Cyclists 57
77 By Case As shown in Table 5-3, most observations are Case 1 (n=593) with a smaller number of Case 2 (n = 111) and Case 3 (n = 33) observations. Case 1 cyclists obtained a median cruising speed of ft./sec. Case 2 and 3 riders obtained higher cruising speeds (though at a longer distance into the intersection). The 15 th percentile speeds are 11.74, 13.73, and ft./sec, respectively, Case 1, 2 and 3 riders. The Case 2 and 3 cyclist speeds have larger variability (SD = 2.55 and 2.66) when compared to those of Case 1 cyclists (SD = 2.04). Figure 5-10 shows the kernel density plots for each case. Figure 5-10 Density of Velocities (ft./sec) by Case By Recreational or Commuter Similar to the other performance measures, differences in cruising speed were observed between recreational and commuter cyclists (Table 5-3). The 15 th percentile speed for recreational cyclists, ft./sec, is lower than that for cyclists identified as commuter riders (12.40 ft./sec). Figure 5-11 shows the kernel density plots for each rider type. As seen in the figures and from the SD values in the table, people riding on a recreational path had a more dispersed range of speeds, consistent with other performance measures. A two-sample t-test of means assuming unequal variances rejects the null hypothesis that the means are equal at the 95 th percentile confidence (t = , df = , p-value = ) the difference in the means is statistically significant. 58
78 Figure 5-11 Density of Velocities (ft./sec) by Commuter (0) vs. Recreational (1) By Alone or In Group Consistent with the trend observed with accelerations, a difference in cruising speed was observed between cyclists riding alone and those riding in groups (Table 5-3). The 15 th percentile speed for cyclists arriving alone at the intersection is ft./sec and is higher than that for cyclists identified as arriving in a group (10.34 ft./sec). Most (59) of the 72 cyclists arriving in a group were observed at SE Johnson Creek and SE Bell. Figure 5-12 shows the kernel density plots of the categories (NA is cyclists from the Type 2 data collection where alone/group was not collected). A two-sample t-test of means assuming unequal variances rejects the null hypothesis that the means are equal at the 95 th percentile confidence (t = , df = , p-value = ) the difference in the means is statistically significant. Figure 5-12 Density of Velocities (ft./sec) by Alone (0) or Group (1) 59
79 By Grade At the intersection with grade, cyclists were observed to obtain higher cruising speeds (median = ft./sec) compared to ft./sec for those at intersections with no grade. Additionally, speeds are more variable for the intersection with a positive grade (SD = 2.7 vs. 2.2) and the median acceleration values are lower. However, there is a shift in acceleration cases for the grade and no-grade intersections. In the no-grade observations there was a much higher proportion of Case 1 cyclists (those who reached their cruising speed before the intersection s mid-point) compared to Case 2 cyclists (Case 1 = 513, Case 2 = 32, Case 3 = 17). At the location with a positive grade there was a very similar proportion of Case 1 cyclists compared to Case 2 cyclists (those who reached their cruising speed after the intersection s mid-point) (Case 1 = 80, Case 2 = 79, Case 3 = 13). Figure 5-13 shows the kernel density plots of these categories. A twosample t-test of means assuming unequal variances rejects the null hypothesis that the means are equal at the 95 th percentile confidence (t = , df = , p-value < 2.2e-16) the difference in the means is statistically significant. Figure 5-13 Density of Velocities (ft./sec) by Grade (No = 0, Yes = 1) By Intersection Width At the wider intersections, higher cruising speeds are obtained. The median speed for wide intersections is ft./sec compared to ft./sec for narrower intersections. The longer distances provide additional distance to accelerate. The results for wide intersections are confounded by the fact that one of the wide intersections is SE Johnson Creek and SE Bell with commuter recreational cyclists; the other is Weidler and Vancouver where there is an uphill grade. The recreational cyclists have lower cruising speeds; the cyclists at grade have higher cruising speed. A two-sample t-test of means assuming unequal variances rejects the null hypothesis that the means are equal at the 95 th percentile confidence (t = , df = , p-value = 2.718e-05) the difference in the means is statistically significant. 60
80 Figure 5-14 Density of Velocities (ft./sec) by Intersection Width Perception Reaction Times This section presents the combined perception and reaction times (referred to as reaction times in the rest of the text) for observed cyclists. Analysis used the PSU Type 1 data. To be included in analysis, the following condition must be met: Cyclist was the first in the queue during a red interval, was behind the stop bar, and came to a complete stop before the signal turned green. A cyclist who did not start forward motion prior to the green indication was excluded from analysis. Three hundred six cyclists met these criteria. Perception-reaction time was measured in seconds (minimum precision of 1/10 second) per the procedure described in the data reduction section. As described previously, perception-reaction time is defined by subtracting the time when the cyclist starts forward motion from the time the signal indication turns green. Table 5-4 presents the descriptive statistics summary for the analysis. Figure 5-15 is a horizontal barplot of the median (50 th percentile) and the 85 th percentile for all categories. These rows are bolded in the table. 61
81 Table 5-4 Descriptive Statistics of Reaction Time (sec) All Case Type Group Intersection Width Statistic Cyclists Commuter Recreational Alone Group Short Long Minimum st Quartile Median Mean rd Quartile th Percentile Maximum n SD CV Skewness Kurtosis
82 85th Percentile Median Long Short Group Alone Recreational Commuter Case 3 Case 2 Case 1 All Cyclists Reaction Time (sec) Figure 5-15 Barplots of Median and 15 th Percentile of Reaction Time by Category All Observed Cyclists As shown in Table 5-4, the median reaction time is 1.11 seconds. The 85 th percentile reaction time is 1.91 seconds. The distribution of the reaction times is skewed right with a long tail (skewness = 1.935). This is intuitive as some people take a long time to respond to the signal for various reasons (e.g., distracted by a person at the intersection). The longest observed reaction time was 5.21 seconds. The majority of users, however, exhibited reactions times within a very small range of values. Figure 5-16 shows the kernel density plot for all cyclists. The kurtosis (4.235) corresponds with the tight peak of the distribution. Figure 5-16 Density of Reaction Times, All Cyclists 63
83 By Case As shown in Table 5-4, 283 out of 306 observations were classified as Case 1. Case 1 cyclists had a median reaction time of 1.11 seconds and an 85 th percentile reaction time of 1.87 seconds. Case 2 cyclists had a lower median (1.05 sec) reaction time but a longer 85 th percentile reaction time (2.32 sec). Cyclists in Case 3 have very similar 85th percentile reaction times to Case 1 cyclists, differing by only 0.02 seconds. Figure 5-17 shows the kernel density plot of cyclists in each case. The figure shows that Case 1 reaction times have less variability (SD = 0.847) than Case 2 times (SD = 1.04). Figure 5-17 Density of Reaction Times by Case By Recreational or Commuter Table 5-4 includes a summary of reaction times for recreational and commute cyclists As noted previously, all observations for the recreational/weekend cyclists were at the intersection of SE Johnson and SE Bell. People classified as recreational exhibit much higher, more dispersed reaction times than other riders (SD = vs. SD = 0.743). The 85 th percentile reaction time for recreational riders was 2.3 seconds compared to that for commute (weekday) riders (1.5 sec), which is nearly a second shorter. Figure 5-18 shows the kernel density plot of reactions times by cyclist type. A two-sample t-test of means assuming unequal variances rejects the null hypothesis that the means are equal (t = , df = , p-value = ) the difference in mean reaction time between recreational and commute riders is statistically significant. 64
84 Figure 5-18 Density of Reaction Times by Commuter (0) vs. Recreational (1) By Alone or Group Table 5-4 includes a summary of statistics of cyclists riding alone or as part of a group. There were 235 cyclists riding alone and 71 cyclists associated with a group upon arrival at the signal. People riding as part of a group have reaction times that are more dispersed (SD = vs ) than people that ride alone, with the tendency of group riders to have much longer reaction times. The 85 th percentile reaction time of group riders is 2.55 seconds compared to 1.80 seconds for alone riders. A two-sample t-test of means assuming unequal variances rejects the null hypothesis that the means are equal (t = , df = , p-value = ) the difference in mean reaction time between lone and group riders is statistically significant. Figure 5-19 shows the kernel density plots of these riders. Figure 5-19 Density of Reaction Times by Alone (0) or Group (1) 65
85 By Intersection Width Table 5-4 summarizes the reaction times by intersection width. The reaction times for the long intersection include observations from SE Johnson Creek and SE Bell and a few observations from NW Buchanan. Because of this, the results are nearly identical to the commute/recreational and alone/group analysis. Figure 5-20 plots the kernel density estimates. Again, a two-sample t-test assuming unequal variances rejects the null hypothesis that the means are equal (t = , df = , p-value = 0.). The difference in the mean reaction times for long and short intersections is statistically significant. Figure 5-20 Density of Reaction Times by Intersection Width Discussion Current AASHTO (2012) and CALTRANS (2012) guidelines recommend field measurements or assumed values for acceleration (1.5 ft./sec 2 ), bicycle cruising speed (14.7 ft./sec), and perception reaction time (1.0 sec). It is worth mentioning that a recent survey found that the timing plans for some bicycle-specific signals assumed a speed of up to 18.7 ft./sec (Thompson et al., In Press). The values for all observed cyclists in this research provide some insight into the default values in current AASHTO guidance. Table 5-5 summarizes the median and 85 th or 15 th percentile values found from this analysis 1. The table also shows where in the observations the AASHTO value lies by percentile in the last column. In the final row of the table, the total clearance interval (BMG + Y + AR) is calculated for a hypothetical intersection with a width of 60 feet using the values in each column. Based on the observed acceleration rates, it is clear that cyclists in this research were able to obtain much higher average rates of acceleration than the AASHTO default. For all cyclists, the 1 As a reminder, a 15 th percentile value for speed means that 15% of the total observations were lower than this value and 85% were faster. If this value were chosen for design, 15% of observed cyclists would not be accommodated. 66
86 1.5 feet/sec 2 AASHTO default is less than the 2 nd percentile. The AASHTO cruising speed assumption of 14.7 ft./sec is higher than even the median value observed in the field. This speed is approximately the 52 nd percentile of the observed data. The 1.0-second default perceptionreaction time is between the 32 nd and 39 th percentile (there is a concentration of observations within 1/10 of a second of 1.0). As a principle, design should accommodate a reasonable range of expected users. This is typically a balance between accommodation of all users and the cost (defined in many ways) of providing this accommodation. The AASHTO defaults are clearly conservative for acceleration. Nearly every cyclist observed achieved higher acceleration values. Conversely, the default value of 14.7 ft./sec for cruising speed is not conservative. Approximately 48% of cyclists observed in this study were unable to attain this cruising speed. Similarly, the default reaction time is not conservative. Approximately 61% of observations had longer reaction times than 1.0 second. However, overall the combination of AASHTO defaults in the clearance formula produces conservative timing values. Applying the AASHTO formula with the median values obtained from this research results in a 7.48 second clearance time. When using the 85 th percentile value for acceleration and the 15 th percentile values for speed and perception-reaction time, a practical minimum value of 9.51 seconds is obtained. When contrasted with the value obtained via application of the AASHTO defaults (10.39 seconds), it is clear that these default values produce conservative clearance times for cyclists. Table 5-5 Summary of All Cyclists Values Value Acceleration (ft./sec 2 ) Cruising Speed (ft./sec) Perception Reaction Time (sec) BMG + Y + AR for a 60 ft. intersection (sec) AASHTO Defaults Number of Observations All Cyclists Observed Median Percentile Percentile of AASHTO Default in Observed Data (15 th ) < (15 th ) (85 th ) To illustrate this further, Figure 5-21 is a plot of the observed crossing distances (including the distance of those cyclists who stop behind the cross bar) and corresponding crossing times. Overlaid on this plot is the AASHTO timing formula (shown as the solid green line) for these distances. The red observations represent commute cyclists while the aqua ones represent recreational riders. The PRT time is removed from both the AASHTO equation and the observed data. Indeed, the plot shows that most riders are accommodated by the AASHTO timing with the exception of some recreational riders at wide intersections. At typical two-lane intersection widths, the AASHTO formula provides sufficient times. 67
87 Figure 5-21 Total Crossing Times By Total Crossing Width, Excluding Reaction Times Overall, the analysis suggests a performance difference between commute and recreational riders (classified by weekday and weekend). The analysis suggests that some adjustments should be made for intersection locations with long crossings, recreational cyclists and positive grades. It is interesting to note that only combinations of long crossing distances and recreational riders produce crossing times exceeding the AASHTO time in Figure There are a number of limitations to this research. First, all the recreational cyclist observations are from one location with a long crossing distance. In our method, the values for acceleration and speed depend on crossing distance. Thus, we cannot completely discern the separate effects of distance and the recreational status on cyclist speed and acceleration. The values obtained by comparing alone and group riders suggest that group riders have lower performance in terms of acceleration, reaction time and final cruising speed. The analysis presented here uses a large number of observations produced with a high level of precision. Unfortunately, direct comparison of the resulting speed and acceleration values with those presented in the literature is difficult since most published studies have used different measurement techniques to derive these performance values. Additionally, the reported percentiles of these values are not consistent. However, the results of this analysis, in combination with the wide range of acceleration and speed values presented in the literature (Opiela et al. 1980; Pein 1997; Rubins and Handy 2005; Shladover et al. 2011; Wachtel et al.1995; Wheeler et al. 2010) do suggest that speed and acceleration can vary widely from location to location. With regard to reaction time, this analysis is unique in that it directly examines reaction times for a large number of observations. Three other studies were found to have explored reaction time, but only indirectly (Raksuntorn and Khan, 2003; Rubins and Handy, 2005; Shladover et al., 2011). 68
88 5.2 QUEUE DISCHARGE The purpose of this analysis is to compare the discharge characteristics of cyclist queues. The intersection selected for analysis (SW Madison and SW Grand in Portland) had archived video before and after the installation of a bicycle box. The volumes of cyclists provided sufficient opportunity to capture large queues of cyclists. Specifically of interest is the discharge time for a queue of cyclists stopped at the intersection and the time it takes for all cyclists in the queue to clear the path of opposing traffic, the intersection clearance time. The discharge characteristics of cyclists from bike boxes have not been previously quantified. Headway distributions with respect to cyclist position in a queue were created for the bicycle lane configuration only. The times for a queue to discharge from stop and to completely clear the intersection were determined and compared between data from the before and after periods (i.e., with and without a bike box). Table 5-6 presents a summary of the analysis. Table 5-6 Summary of Observations for Queue Discharge Bicycle Lane Bike Box Discharge Time Intersection Discharge Time Intersection Clearance Queue (sec) Clearance (sec) n (sec) (sec) Size Mean SD Mean SD Mean SD Mean SD n Headways Figure 5-22 shows the result of the HCM analysis for the start-up lost time (SLT) for cyclists discharging from a bike lane. Cyclists in a bicycle lane discharge from stop in a nearly 1:1 fashion with each additional cyclist in the queue adding approximately one second to the discharge time. This results in an average cyclist headway of seconds for cyclists positioned fifth or higher in their queue. In comparison, Raksuntorn and Khan (2003) found bicycle saturation headways of 0.80 seconds for an 8-foot-wide bike lane. 69
89 Figure 5-22 Position in Queue and Average Headways Discharge Times Cyclists were recorded at the same intersection before and after the installation of a bike box with results from before labeled as Bike Lane and those from after labeled as Bike Box. Figure 5-23 is a plot of discharge time as a function of queue size at the start of the green interval. Bike lane observations are plotted as circles; bike box observations are plotted with triangles. A LOWESS regression line is fitted through the data with the default smoothing parameters and is shown in black to more clearly show trends. A clear relationship between queue size and discharge time was evident for both infrastructure types. The addition of a bicycle box decreases the discharge time with queues of equal length needing less time to discharge from a bike box than from a standard bicycle lane. Additionally, the decrease in discharge time between bike boxes and lanes becomes more evident with larger queue sizes. The horizontal nature of queuing that is possible in a bike box enables cyclists to move into the intersection more quickly as they are less likely to be restricted by cyclists ahead of them, effectively creating bicycle sub-lanes as described in Raksuntorn and Khan (2003). They estimated that a 10-foot bicycle lane has four or five sub-lanes (an 8-foot lane has three sub-lanes). This finding has important capacity and delay implications for motor vehicles. At intersections with large volumes of cyclists, motorists would need to wait for the entire queue of cyclists to clear before turning right. As right-of-way is normally constrained in width, an effective way to increase the capacity is with the addition of a bike box. An added benefit (perhaps more 70
90 important than increasing capacity) is the delay savings at locations where cars must wait on the discharge of long queues of cyclists to make a right turn. Bicycle Lane Bike Box Figure 5-23 Discharge Times vs. Queue Size Intersection Clearance Time The relationship of queue size to intersection clearance is less intuitive. Clearance time is the time for the cyclists to completely clear the intersection. Figure 5-24 plots the discharge time for both the bike lane and bike box data. Bike lane observations are plotted as circles; bike box observations are plotted as triangles. A LOWESS regression line is fitted through the data with the default smoothing parameters and is shown in black. The relationship of queue size and intersection clearance of cyclists discharging from a bike lane is positive and linear. However, the relationship of queue size and intersection clearance time for cyclists utilizing a bike box is nonlinear. Clearance times for smaller queue sizes appear to be very similar to those of equal queue sizes from bike lanes. Times for queue sizes of five or more, though, appear to benefit from the addition of a bike box. It seems that although cyclists are able to enter the intersection more quickly from a bike box, the sum of the incremental time savings for each individual cyclist when crossing the entire intersection is nearly insignificant until the bike box is near half capacity. This is potentially due to the need to maneuver from a spread formation at the start of the crossing to a narrow formation (there are two downstream, receiving bicycle lanes) towards the end of the crossing. For smaller queues, this time taken to maneuver horizontally negates gains made at the stop bar upon discharge. 71
91 Figure 5-25 is a plot of intersection clearance time against discharge time. As expected, this confirms a clear correlation with the discharge and intersection clearance times. Bicycle Lane Bike Box Figure 5-24 Queue Size vs. Clearance Time Bike Box Bicycle Lane Figure 5-25 Discharge Time vs. Intersection Clearance Time 72
92 5.3 COMPLIANCE The purpose of this analysis is to characterize cyclist compliance and illuminate the demographic and operational variables that influence it Summary of Observations by Location Table 5-7 summarizes the observations by intersection and a select set of descriptive variables for the observations used in the compliance analysis. Observations are of 2,617 cyclists at seven different interesections with varying geometries and operational elements (see the chapter on data assembly for more detail). Table 5-7 Summary of Observations for Compliance Analysis by Location Type 1 Data Type 3 Data Weekday/Weekend Weather Helmet Use Peak Period Alone or Group Compliance Pearl St & E 18th Ave NW Buchanan and NW 9 th Ave SE Johnson and Bell SW Lombard and SW 5 th Street N Rosa Parks and I-5 SB NW Broadway & NW Lovejoy NE Broadway & NE Williams Row Total % Weekday % Weekend % Clear % Cloudy % Rain % Fog % Yes % No % AM (7-9) % PM (4-6) % Off Peak % Alone % In Group % Compliant % RTOR % Gap Accepted % Signal Jump % Other % It is important to note that the overall compliance rate of 69.1% is inclusive of cyclists making illegal right-hand turns (RTOR). The RTOR behavior observed in this study consisted of turns on red indications without a prior stop where cyclists have a continuous, conflict-free path (excluding conflicts with pedestrians). As is evidenced by Table 5-8 below, this type of 73

93 noncompliant maneuver was specific to only a portion of the surveyed locations where there was ample opportunity and desire for cyclists to make right turns. Furthermore, at the location at NW Broadway and Lovejoy in Portland, it is arguable that the intent of designing engineers was that cyclists would not stop when merging right onto Lovejoy. Since these locations account for a significant portion of the total records, the RTOR compliance indicator is disproportionately represented in the data. In addition, RTOR violations do not meaningfully contribute to the understanding of cyclist compliance. Therefore, RTOR are not considered with regard to compliance for the remainder of this chapter. When RTORs are not factored into overall compliance, the proportion of compliant cyclists is nearly 90% (Table 5-8). Table 5-8 Compliance Summary Compliance Indicator Percent Number of Observations Compliant Gap Accepted Signal Jump Other To show the compliance behavior across intersections, the percent compliance by intersection is shown by Figure The figure shows that the compliance rates and proportions vary by location. The variables that play into the varying rates of compliance at each location are explored next. Figure 5-26 Compliance by Location 74
94 Table 5-9 Summary Statistics for Noncompliant Cyclists Noncompliance Type Violations Avg Wait Time Category Total Percent RTOR % Gap accepted % Signal jump % Other 3 0.4% Alone % With group % First to violate % Following violation % Female % Male % AM peak % PM peak % Off-peak % Average Gap Accepted seconds Gap accepted, all 2.69 seconds Gap accepted, waiters seconds Compliance at Bicycle-Specific Signals As shown in Table 5-10, the proportion of compliance appears to increase with the presence of a bicycle-specific traffic signal. A Pearson s chi-square test of independence confirms that the proportions differ significantly by category (χ 2 = , df = 2, p-value < 0.000), with cyclists more compliant at dedicated signals. Some of the increased compliance can likely be attributed to intersection geometry and traffic differences (the bicycle signals are often separating a key conflict with motor vehicles for safety or adding convenience for cyclists). Table 5-10 Compliance at Bicycle-Specific Signals Category Compliance Indicator Percent Number of Observations Compliant No Bicycle Signal Gap Accepted Signal Jump 9 25 Compliant Bicycle Signal Gap Accepted Signal Jump Other Helmet Use Helmet use was another factor analyzed. It seems that those not wearing helmets are more likely to be noncompliant (Table 5-11). Not wearing a helmet may be correlated (in aggregate) with 75
95 more risky behaviors. A Pearson s chi-square test of independence confirms that the proportions differ significantly by category (excluding other ) (χ 2 = , df = 2, p-value < 0.000). Table 5-11 Summary of Compliance by Helmet Use Category Compliance Indicator Percent Number of Observations Compliant Helmet Gap Accepted Signal Jump Other Compliant No Gap Accepted Helmet Signal Jump Other Commuter vs. Recreational Status The compliance as a function of commuter status for all cyclists can be found in Table Recreational or commuter status does not appear to significantly influence overall compliance, although there appears to be some decrease in noncompliance with recreational status, especially for signal jump maneuvers. This may be because recreational cyclists have fewer constraints on their schedule than cyclists commuting or running errands. However, a Pearson s chi-square test of independence confirms that the proportions do not differ significantly by category (χ 2 = 5.757, df = 2, p-value = 0.056). Table 5-12 Summary of Compliance by Commuter Status Category Compliance Indicator Percent Number of Observations Compliant Commuter Recreational Gap Accepted Signal Jump Compliant Gap Accepted Signal Jump Other Presence of Cargo Researchers explored the presence of cargo to see if cyclists bearing heavier loads were more likely to wait at signals and rest or push through to avoid stopping. It should be noted that the presence of cargo was only recorded during the second phase of data collection and that the results presented below are based upon data from that phase only. For the data collected, it appears that cyclists bearing some cargo are more likely to get a head start on their green phase (i.e., commit a signal jump) (Table 5-13). This behavior could be because cyclists with heavier loads want to maximize the time they have available to cross the intersection or because cyclists 76
.")
96 with bags are more likely to be commuters or errand runners on a tight schedule, which would emphasize relationships between commuter status and signal jumps. A Pearson s chi-square test of independence confirms that the proportions of compliant cyclists differ significantly by category (χ 2 = , df = 2, p-value = 0.002). Indeed, the number of signal jumpers carrying cargo was more than expected. Table 5-13 Summary of Compliance by Cargo Category Compliance Indicator Percent Number of Observations Compliant No Cargo Gap Accepted Signal Jump Other Compliant Cargo Gap Accepted Signal Jump Other Time of Day In addition to cross traffic, the time of day and its relationship to compliance was explored. Noncompliant behavior seems more likely to occur very early or late in the day (i.e., before and after the AM and PM peaks, respectively), although it should be noted that sample sizes for cyclists during these time periods were small (Figure 5-27). Figure 5-27 Proportion of Compliance vs. Hour of Arrival 77
97 To further corroborate this finding, compliance was assessed based on whether or not the cyclist was recorded during a peak period. Indeed, it appears that a greater proportion of cyclists participate in more dangerous noncompliant maneuvers during the off-peak hours (Table 5-14). Additionally, cyclists during the PM peak seem to be more ready to jump the green indication. A Pearson s chi-square test of independence confirms that the proportions differ significantly by category (χ 2 = , df = 4, p-value < 0.000). Table 5-14 Summary of Compliance During Peak Hours Category Compliance Indicator Percent Number of Observations Compliant AM Peak Gap Accepted Signal Jump Compliant PM Peak Gap Accepted Signal Jump Compliant Off-peak Gap Accepted Signal Jump Other Compliance by Day of the Week Compliance was determined for each day of the week. Although compliance is very comparable throughout the week (Figure 5-28), it appears that overall rates of noncompliance are higher on Tuesdays and Fridays, especially for the Gap Accepted type of maneuver. However, the proportion of Gap Accepted noncompliant maneuvers is not greatest on Fridays at every location, reemphasizing the differences in behavior based on intersection characteristics. The four intersections with data from either Tuesday, Friday, or both days are shown with compliance percentages in Figure


98 Figure 5-28 Compliance by Day of Week Figure 5-29 Compliance at Intersections with Tuesday and/or Friday Data 79

99 5.3.8 Compliance By Cross-Traffic Volume Presumably, high volumes of cross traffic at a particular location will reduce the number of noncompliant maneuvers of the Gap Accepted type since fewer or shorter gaps would be available. For reference, the average cross-traffic volumes at each intersection per hour of day are shown in Figure Figure 5-30 Cross Traffic (Vehicles per Hour) By Hour of Day, By Location When paired with compliance information from each intersection, it appears that increased conflicting traffic may have a negative effect on some forms of noncompliance. Specifically, the likelihood of a cyclist accepting a gap in traffic seems to decrease with increased cross traffic (Figure 5-31), while the relationship is less clear for cyclists jumping the signal (Figure 5-32). 80

100 Figure 5-31 Gap Accepted Noncompliance and Cross Traffic Figure 5-32 Signal Jump Noncompliance and Cross Traffic 81

101 5.3.9 Compliance by Time Spent Waiting The average wait time was seconds for all observed cyclists. After analyzing overall compliance for various cyclist demographics and intersection characteristics, behavior of noncompliant cyclists only was explored. The noncompliant records were split roughly in half between Gap Accepted and Signal Jump violations. Closer analysis of solely noncompliant cyclists was done to elucidate the causes of each type of noncompliance. Exploration of the relationship between the cyclists wait time and violation type suggests that individuals displaying the most risky behavior (i.e., accepting gaps in traffic) are not driven to noncompliance by long wait times. Instead, it appears that most gap accepters have already made the decision to be noncompliant before even arriving at the intersection (Figure 5-33), with the majority of gap accepters darting into the intersection without stopping (Figure 5-34). Figure 5-33 Wait Time for Types of Noncompliance 82
.")
102 Figure 5-34 Wait Times for Gap Accepters The relationship between successive violators was also explored to determine the effects of noncompliant cyclists on the compliance of cyclists behind them. The vast majority of cyclists committing a violation were the first to violate the signal during the cycle length (Figure 5-35). This suggests that cyclists are largely not following the example of their previous noncompliant counterparts or that most violating cyclists are waiting at the signal by themselves. Figure 5-35 Violation Number of Noncompliant Cyclists 83
, most cyclists did not violate the signal even in the")
103 The possibility that violating cyclists were arriving and departing the intersection alone was accounted for in the next figure (Figure 5-36). The figure shows that for cyclists arriving within a certain time period of one another (and thus arriving during the same red indication), most cyclists did not violate the signal even in the presence of one or more violators. Figure 5-36 Violators in a Queue Specific violation types are also of interest. For violators entering the intersection before receiving a green indication, signal jumping, the time to green was used as a measure of the severity of the signal jump. Similarly to cyclists accepting a gap, signal jumpers making the most egregious of jumps tend to do so after little to no wait at a signal (Figure 5-37). Also, from the same figure, many signal jumps were so small that, although it was clear to researchers that cyclists had left before the green indication, they were numerically and operationally insignificant. 84
104 Figure 5-37 Severity of Signal Jump vs. Wait Time Acceptance of a gap in traffic is the last specific type of noncompliance explored. Similar to signal jumps, more severe (i.e., shorter gaps) were accepted during the AM and PM rush periods and post-lunch hour as is evidenced by the spikes in average accepted gap times during those parts of the day in Figure Furthermore, accepted gaps were compared to cross traffic for that hour. To control for the various intersection widths, the accepted gap for each cyclist was divided by the calculated bicycle crossing time from the AASHTO formulas using the defaults. The lower the ratio, the riskier the gap accepted. The results of this analysis are shown in Figure A general trend is that as the volume of cross traffic increases, gap-accepting cyclists crossed with smaller gaps. The available gaps are of course a function of traffic volume. 85

105 Figure 5-38 Average Accepted Gap vs. Arrival Hour Figure 5-39 Accepted Gaps vs. Cross Traffic Discussion When removing the RTOR violations, compliance is nearly 90% for observations of 2,617 cyclists arriving on red. An important finding is that compliance is comparable at intersections 86
106 with bicycle signals and those without. At the end of the analysis, a risk-taking profile emerged for noncompliant cyclists: More likely to not wear a helmet. Not influenced by wait time. Accepted the minimum gap with higher volumes nearly equal to or less than the minimum crossing time based on AASHTO calculations. A possible conclusion is that design is probably not likely to influence the noncompliant cyclists. Enforcement or work to change the culture of cyclists may be needed. To put cyclist noncompliance in context, the literature on motorist and pedestrian compliance with various forms of traffic control were explored. Cyclists have the ability to be noncompliant in three main ways at a traffic signal, the first of which is turning right illegally on a red indication. Several studies have shown the frequent violation of No Right Turn on Red signs by motorists (Podnay et al. 2004), and the safety consequences of motorists failing to yield rightof-way to pedestrians and cyclists is well documented (Preusser et al. 1981). A study of countermeasures related to right turns on red found that 56.9% of motorists failed to come to a complete stop before completing their right turn (Zeeger and Cynecki 1985). The rates of RTOR violations by cyclists found in this study are only 23%. The second form of cyclist noncompliance is jumping the signal (i.e., leaving before the beginning of the green indication). Although this behavior is not prominent with motorists due to the size of motor vehicles, signal jumping behavior was found to be prominent (up to 30% at one intersection with an average of 15.8% over all studied intersections) among pedestrians in a study on pedestrian compliance and delay (Virkler 1998). It should be noted that the time left in seconds to the pedestrian indication for these jumps had the potential to be much greater than those found for cyclists in this study, and is probably more analogous to cyclist noncompliance by both signal jump and gap acceptance. That being said, the average noncompliance rate of 15.8% for pedestrians in this study is higher than the 7.8% noncompliance rate found for cyclists that either jump the signal or accept a gap. Clearly, the compliance analysis is location specific. These results are not necessarily transferrable to other locations. Though the sample is diverse, there is not sufficient variation to make firm conclusions about the geometric and other factors that are influencing compliance decisions. Accepting gaps in traffic is the last form of cyclist noncompliance observed in this study. Cyclists were found to ride through a red indication at a rate of 4.5%. This is comparable to the rate of cyclists violating red indications found in an Australian study (6.9%) where both through and left-turn movements were considered to be noncompliant (Johnson et al. 2011b). Electric and pedal cyclists were found to have substantially higher rates of noncompliance (56%) in China (Wu et al. 2011), while Brazilian cyclists self-reported their noncompliance at a rate of 38.4% (Bacchieri et al. 2010). Relative to other modes, gap acceptance is most closely paralleled by motorists running red indications. Motorists violate red indications (excluding turning right on red without yielding) at much lower rates. A study of red light violators in Oxnard, CA, found 87
107 that prior to red light camera installations, motorists violated the red indications at a rate of 13.2 violations per 10,000 vehicles (about 1.3%) (Retting et al. 1999). Furthermore, analysis of cyclist compliance showed that a small subset of violators participated in the most risky observed behavior accepting a gap between opposing vehicles without stopping at the stop bar prior to entering the intersection and that this behavior seemed uninfluenced by any of the cyclist or intersection characteristics explored. Additionally, gapaccepting cyclists were less likely to be wearing a helmet. These discoveries point to a subset of cyclists who are likely to be noncompliant regardless of the presence of traffic control. Comparable relationships were found for motorists running red indications. A field investigation of red-light violators in Virginia found that motorists running red lights were significantly more likely to have had other moving violations and had generally poorer driving records. Similar to lack of helmet use among noncompliant cyclists, red-light violators were also less likely to utilize safety belts (Retting and Williams 1996). 88
108 6.0 CONCLUSIONS This research collected and analyzed video data of cyclist behavior at signalized intersections in Portland, Eugene, Corvallis, Beaverton and Clackamas County, OR. A total of 4,673 cyclists were observed. For each observed cyclist a set of descriptive variables were collected (e.g., age, sex, helmet use, type of bike, clothing, presence of cargo, arrival in group). Time-based event data were collected to establish reaction times, crossing times, waiting time, gap acceptance, and saturation flow rates. Compliance behavior was established for cyclists who arrived on red. These observations were used to study 1) performance (accelerations, cruising speeds, and reaction time), 2) queue discharge, and 3) compliance. The performance obserations were analyzed by all cyclists; by acceleration case; by recreational or commuter (defined by weekday or weekend); by alone or group; by presence of grade; and by intersection width. As part of this research, a general methodology to estimate bicyclists acceleration and speed for traffic-signal timing applications was developed. Utilizing physical equations of motion, this research analytically derived expressions that can be used to classify an individual bicyclist s performance as a function of the observed acceleration profile. 6.1 PERFORMANCE The primary conclusions of the analysis are: The AASHTO defaults are clearly conservative for acceleration. Nearly every cyclist observed in this research attained much higher average accelerations. For all cyclists, the 1.5 feet/sec 2 AASHTO default is approximately the 2 nd percentile in the observed data. The AASHTO default cruising speed of 14.7 ft./sec is higher than the median value observed in the field. The default speed is approximately the 58 th percentile of the observed data (meaning that approximately 42% of cyclists we observed were not able to attain this cruising speed). The AASHTO default perception-reaction time of 1.0 seconds is between the 32 nd and 39 th percentile of the observations. Approximately 61% of observed cyclists had reaction times longer than 1.0 second. The combination of AASHTO defaults in the clearance formula, however, produces conservative timing values (due to the low assumed acceleration). An analysis of the actual crossing times of cyclists indicates that nearly all riders are accommodated by the AASHTO default timing, with the exception of some recreational riders at a wide intersection. Statistically significant differences were found between alone and group, recreational and commuter, and grade or no grade in each of the performance categories. The analysis suggests there is a performance difference between commute and recreational riders (classified by weekday and weekend) that merits adjustments to the default values. 89
109 Alternatively, field-based measurement of cyclist performance at a particular location could be easily made with the methodology developed in this research. This research demonstrated how field-collected observations from a basic video setup can be used to successfully estimate design acceleration and speed values using equations of motion. It is shown that it is not trivial to obtain cyclists acceleration and speed distributions. The proposed analytical procedure allows for further statistical analysis of cyclist acceleration and cruising speed performance by demographic group and intersection grade (if these data are collected), or to justify longer crossing times when a specific type of rider needs special accommodation (e.g., young riders near schools or older riders near a retirement home). Findings from the statistical analysis are intuitive and consistent with the expected performance of bicycle riders by gender and intersection grade. The existing policy guidelines (AASHTO, Caltrans and NACTO) require that an adequate clearance interval be provided and that in determining this minimum interval, field investigation of bicyclists speeds is recommended. Clearly, as other work has shown, the performance values derived for a particular intersection crossing location depend on intersection location, the type of cyclist, and the time of the data collection. Traffic engineers should be cognizant of this issue when deploying data-collection equipment and reducing data for analysis. In particular, field estimations of acceleration and speed distributions should be provided if bicycle traffic-signal designs that exceed AASHTO-recommended values result in high costs in terms of delays, fuel consumption and emissions. 6.2 QUEUE DISCHARGE The purpose of this analysis is to compare the discharge characteristics of cyclist queues based on the infrastructure available at a signalized intersection. These characteristics were determined for one signalized intersection using footage from two time periods: before and after installation of a bike box. A total of 1,303 cyclists were observed. Headways distributions with respect to cyclist position in queue were estimated per the procedure described in the HCM (Transportation Research Board 2010). For the bike box, the ability of cyclists to line up parallel to each other inside a bike box precludes the use of the HCM procedure. Instead, a methodology was developed to compare the discharge time for a queue of cyclists stopped at the intersection and the time it takes for all cyclists in the queue to clear the path of opposing traffic, the intersection clearance time. The following are the primary conclusions from the analysis: At the bike lane, the average cyclist headway was found to be seconds for cyclists positioned fifth or higher in their queue. This is equivalent to a saturation flow rate of 3,610 cyclists per hour of green. The addition of a bicycle box decreases the discharge time with queues of equal length compared to a bicycle lane. The decrease in discharge time between bike boxes and lanes becomes more evident with larger queue sizes. The horizontal nature of queuing that is possible in a bike box enables 90
110 cyclists to move into the intersection more quickly, as they are less likely to be restricted by cyclists ahead of them. This finding of decreased discharge time has important capacity and delay implications for motor vehicles with regard to the installation of bicycle boxes. The addition of a bicycle box decreases the intersection clearance time for queues of equal length compared to a bicycle lane. However, this trend is only evident for queues of five or more cyclists. 6.3 COMPLIANCE Cyclists arriving on red were examined for their compliance with the traffic signal indication. Cyclists were only eligible to become part of the compliance dataset if they 1) arrived on a red indication and 2) utilized the bike lane on both sides of the intersection (and bike signal where applicable). Cyclists turning right on red without stopping were noted but removed from the further analysis. The overall observed compliance is nearly 90%. The noncompliant cyclists consist of two behavior types. Cyclists who violate the signal just before receiving a green were considered signal jumpers. These cyclists were 4.3% of the observed sample. The remaining noncompliant cyclists selected gaps in the conflicting traffic stream while the signal was red. These cyclists were 5.9% of the total observed cyclists. An important finding is that compliance is comparable at intersections with bicycle-specific signals and those without. The analysis of the additional demographic and time gap acceptance revealed a risk-taking profile for noncompliant cyclists. These cyclists were: More likely to not wear a helmet. Not influenced by wait time. Accepted the minimum gap with higher volumes nearly equal to or less than the minimum crossing time based on AASHTO calculations. A possible conclusion is that design is probably not likely to influence noncomplying cyclists. Enforcement and/or work to change the culture of cyclists may be needed. 91
111 92
112 7.0 REFERENCES American Association of State Highway and Transportation Officials. Guide for the Development of Bicycle Facilities. American Association of State Highway and Transportation Officials Bacchieri, G., A.J.D. Barros, J.V. dos Santos, D.P. Gigante. Cycling to Work in Brazil: Users Profile, Risk Behaviors, and Traffic Accident Occurrence. Accident Analysis & Prevention, Vol.42, 2010, pp Basford, L., S. Reid, T. Lester, J. Thomson, A. Tolmie. Drivers Perceptions of Cyclists. No. TRL549. Department of Transport of the United Kingdom, United Kingdom. Undated. City of Portland Bureau of Transportation (PBOT). Pedestrian and Bicycle Enhanced Enforcement Project: Opportunity Analysis. PBOT, Portland, OR, CROW. ede Rik de Groot, H. (Ed.). Design Manual for Bicycle Traffic. CROW Record. CROW, Ede De Haan, D., T. Zeegers, and P. van der Linden. Bicycle-friendly Traffic Lights. Verkeerskunde. Traffic Engineering, Vol.10, 2003, pp Denver, CO. Traffic Signal Study Behavior. City and County of Denver, CO, Dill, J. Bicycling for Transportation and Health: The Role of Infrastructure. Journal of Public Health Policy S95 S Dill, J., Carr, T. Bicycle Commuting and Facilities in Major U.S. Cities: If You Build Them, Commuters Will Use Them. Transportation Research Record, No. 1828, 2003, pp Dill, J., C. Monsere, and N. McNeil Evaluation of Bike Boxes at Signalized Intersections. WWW Document. Accessed August 10, Federal Highway Administration. Manual on Uniform Traffic Control Devices. Federal Highway Administration, Washington D.C., Fietsberaad. The Bicycle Friendliness of Traffic Control Systems. Fietsberaad, Amsterdam, Figliozzi, M.A., N. Wheeler, and C.M. Monsere. A Methodology to Estimate Bicyclists Acceleration and Speed Design Values to Calculate Minimum Green Times at Signalized Intersections. Transportation Research Record: Journal of the Transportation Research Board, Transportation Research Board of the National Academies, Washington, D.C., In Press. Fischer, E.L., G.K. Rousseau, S.M. Turner, E.J. Blais, C.L. Engelhart, D.R. Henderson, J.A. Kaplan, V.M. Keller, J.D. Mackay, P.A. Tobias, D.E. Wigle, and C.V. Zegeer. Pedestrian and Bicyclist Safety and Mobility in Europe. Publication No. FHWA-PL Federal Highway 93
113 Administration and the American Association of State Highway and Transportation Officials, Alexandria, VA, Geller, R. Four Types of Cyclists. Portland Bureau of Transportation, Portland, OR, Jacobsen, P.L. Safety in numbers: More Walkers and Bicyclists, Safer Walking and Bicycling. Injury Prevention, Vol. 9, 2003, pp Johnson, M., S. Newstead, J. Charlton, and J. Oxley. 2011a. Riding through Red Lights: The Rate, Characteristics and Risk Factors of Non-Compliant Urban Commuter Cyclists. Accident Analysis and Prevention, Vol. 43, 2011a, pp Koorey, G. Attracting the Next 10% of Cyclists with the Right Infrastructure. Presented at PSU Urban Center, Krizek, K.J., and R.W. Roland. What is at the End of the Road? Understanding Discontinuities of On-street Bicycle Lanes in Urban Settings. Transportation Research Part D: Transport and Environment, Vol. 10, 2005, pp Mekuria, M.C., P.G. Furth, and H. Nixon, Loss-Stress Bicycling and Network Connectivity. No. MTI Report Mineta Transportation Institute, San Jose, CA, National Association of City Transportation Officials. Urban Bikeway Design Guide. National Association of City Transportation Officials, New York, NY, Opiela, K.S., S. Khasnabis, and T.K. Datta. Determination of the Characteristics of Bicycle Traffic at Urban Intersections. Transportation Research Record. Vol. 743, 1980, pp Pein, W. Bicyclist Performance on a Multiuse Trail. Transportation Research Record. Vol. 1578, 1997, pp Podnay, K.I., M.S. Wogalter, and C.B. Mayhorn. Perceived Effectiveness of No Turn on Red Traffic Signs. Proceedings of the Human Factors and Ergonomics Society Annual Meeting. SAGE Publications Preusser, D., W.A. Leaf, K.B. Debartolo, and R.D. Blomberg. The Effect of Right-Turn-On-Red on Pedestrian and Bicycle Accidents. Publication No. DOT HS U.S. Department of Transportation National Highway Traffic Safety Administration Pucher, J., and R. Buehler. Cycling for a Few or for Everyone: The Importance of Social Justice in Cycling Policy. World Transport Policy & Practice, No. 15, 2009, pp Pucher, J., and L. Dijkstra. Making Walking and Cycling Safer: Lessons from Europe. Transportation Quarterly. No. 54, Pucher, J., J. Dill, and S. Handy. Infrastructure, Programs, and Policies to Increase Bicycling: An International Review. Preventive Medicine. Vol. S106 S
114 Raksuntorn, W., and S.I. Khan Saturation Flow Rate, Start-Up Lost Time, and Capacity for Bicycles at Signalized Intersections. Transportation Research Record. Vol. 1852, 2003, pp Retting, R.A., and A.F. Williams. Characteristics of Red Light Violators: Results of a Field Investigation. Journal of Safety Research. Vol. 27, 1996, pp Retting, R.A., A.F. Williams, C.M. Farmer, and A.F. Feldman. Evaluation of Red Light Camera Enforcement in Oxnard, California. Accident Prevention & Analysis. Vol. 31, 1999, pp Robinson, D.L. Safety in Numbers in Australia: More Walkers and Bicyclists, Safer Walking and Bicycling. Health Promotion Journal of Australia. Vol. 16, 2005, pp Rubins, D.I., and S. Handy. Times of Bicycle Crossings: Case Study of Davis, California. Transportation Research Record. Vol. 1939, 2005, pp Shladover, S., Z. Kim, M. Cao, A. Sharafsaleh, and J.-Q. Li. Bicyclist Intersection Crossing Times: Quantitative Measurements for Selecting Signal Timing. Transportation Research Record. Vol. 2128, 2009, pp Shladover, S., Z.W. Kim, M. Cao, A. Sharafsaleh, I. Li, and S. Johnston. Bicycle Detection and Operational Concept at Signalized Intersections: Phase 2. Publication No. UCB-ITS-PRR California PATH Research Program State of California Department of Transportation. California Manual on Uniform Traffic Control Devices. State of California Department of Transportation Taylor, D.B., and H.S. Mahmassani. Coordinating Traffic Signals for Bicycle Progression. Transportation Research Record. No. 1705, 2000, pp Thompson, S.R., C. Monsere, M.A. Figliozzi, P. Koonce, and G. Obery. Bicycle-Specific Traffic Signals: Results from a State-of-the-Practice Review. Transportation Research Record: Journal of the Transportation Research Board, Transportation Research Board of the National Academies, Washington, D.C. In Press. Transportation Research Board. The Highway Capacity Manual, 5th ed. Transportation Research Board, Washington D.C., Virkler, M.R. Pedestrian Compliance Effects on Signal Delay. Transportation Research Record: Journal of the Transportation Research Board. Vol. 1636, 1998, pp Wachtel, A., J. Forester, and D. Pelz. Signal Clearance Timing for Bicyclists. Institute of Transportation Engineering, Vol. 65, 1995, pp Wheeler, N., R. Conrad, and M.A. Figliozzi. A Statistical Analysis of Bicycle Rider Performance: The Impact of Gender on Riders Performance at Signalized Intersections, 89th Annual Meeting of the Transportation Research Board
115 Wu, C., L. Yao, and K. Zhang. The Red-Light Running Behavior of Electric Bike Riders and Cyclists at Urban Intersections in China: An Observational Study. Accident Analysis and Prevention Zaki, M.H., T. Sayed, K. Ismail, and F. Alrukaibi. Use of Computer Vision to Identify Pedestrians Nonconforming Behavior at Urban Intersections. Transportation Research Record:, Transportation Research Board of the National Academies. Vol. 2279, 2012, pp Zeeger, C.V., and M.J. Cynecki. Determination of Motorist Violations and Pedestrian-related Countermeasures Related to Right-Turn-On-Red. Transportation Research Record: Journal of the Transportation Research Board. Vol. 1010, 1985, pp
116 APPENDIX A: A REVIEW OF THE STATE OF PRACTICE REGARDING BICYCLE- SPECIFIC TRAFFIC SIGNAL
117
118 A-1.0 INTRODUCTION The purpose of this appendix is to summarize the relevant design and related guidance for bicycle-specific traffic signals, the existing published literature, and the results of a survey of installed bicycle-specific traffic signals in North America. This appendix includes report contains the following four sections: Background A summary of relevant design manuals, legislation and policy. State of the Practice A summary of our survey of known installations of bicyclespecific traffic signals, mostly in the U.S. but with a handful of Canadian jurisdictions. Conclusions A summary of the state of the practice review A-1
. A-2.")
119 A-2.0 BACKGROUND This appendix briefly reviews the relevant design manuals, engineering documents and enabling legislations. These are provided as context for the subsequent sections. The review includes both versions of the Guide for the Development of Bicycle Facilities, published by the American Association of State Highway and Transportation Officials (AASHTO). A-2.1 DESIGN MANUALS A Guide for the Development of Bicycle Facilities (AASHTO 1999) The Guide for the Development of Bicycle Facilities recognizes that the greatest risk for cyclists at an intersection is when crossing. This is especially so during periods of low traffic flow at actuated signals where the minimum clearance interval for waiting cars may be inadequate for cyclists entering during the yellow phase. From the guide, equations for the minimum clearance interval are as follows: Figure A 0-1 Total Clearance Interval Equations (AASHTO 1999) It should be noted that for many intersection widths, this formula produces very long yellow and red clearance intervals. Cyclists starting from a stopped position require a minimum total phase time in order to perform a complete crossing maneuver, including reacting to the new green signal and accelerating from a stop. After establishing minimum yellow and all-red intervals, a minimum green time is needed to ensure most cyclists can safely cross an intersection from a stopped position. Equations for the minimum green time from the guide are as follows: A-2

120 Figure A 0-2 Minimum Green Time Equations (AASHTO 1999) In lieu of field data from actual cyclists at the intersection to be timed, AASHTO s guide uses three classes of cyclist to estimate cyclist speed for use in the above equations. The three categories of design cyclists were originally established in a Federal Highway Administration (FHWA) report on accommodating bicycles on roadways (1994). The FHWA and AASHTO define the classes A, B and C as follows: Class A Advanced Cyclists: This type of cyclist feels comfortable using the current roadway infrastructure alongside motor vehicles and treats their bicycle similarly to a motor vehicle. Class A cyclists want direct, convenient access to destinations with minimal delay or detour. Class B Basic Cyclists: This type of cyclist is less confident than Class A cyclists and generally avoids interacting with motor vehicle traffic. Class B cyclists are more comfortable on low-volume streets or on roadways with bicycle-specific facilities. Class C Children: Children are not as fast or agile as adult riders. This type of cyclist, whether accompanied by parents or alone, needs well-defined bicycle facilities on busier roads or streets with low motor vehicle speeds and volumes. The guide states that, if field observation data is unavailable, the following speeds should be used to accommodate 98% of cyclists in Group A, B and C, respectively: 12 mph (17.6 feet/second), 8 mph (11.7 feet/second), and 6 mph (8.8 feet/second). It is unclear as to the source of these values. The document contains no other guidance related to bicycle-specific signals. A Urban Bikeway Design Guide (NACTO 2011) The National Association of City Transportation Officials (NACTO) Urban Bikeway Design Guide contains a chapter on bicycle signal heads. The guide identifies required, recommended and optional features as they relate to bicycle signal heads (including operations and timing A-3
121 parameters). The NACTO guide requires that an adequate clearance interval (i.e., the movement s combined time for the yellow and all-red phases) shall be provided to ensure that bicyclists entering the intersection during the green phase have sufficient time to safely clear the intersection before conflicting movements receive a green indication. In determining this minimum interval, field investigation of bicyclists speeds is recommended. The guide suggests intervals sufficient for 15 th percentile speeds should be used. Absent field data, the guide suggests that 14 feet per second (9.5 miles per hour) may be used as a default speed. The total clearance interval is specified with the following equation: C i = 3 + W V where intersection width (W) should be calculated from the intersection entry (i.e., stop-line or crosswalk in the absence of a stop-line) to halfway across the last lane carrying through traffic, and V is the rolling speed of the cyclist (this differs from AASHTO and Caltrans guidance). The NACTO guide notes that there are currently no national standards on determining an appropriate clearance interval. The NACTO guide mentions that the bicycle minimum green time is determined using the bicycle crossing time for standing cyclists. A clear definition of standing is not provided, though Rubins and Handy define a standing-start cyclist as a cyclist with at least one foot on the ground. A Guide for the Development of Bicycle Facilities (AASHTO 2012) The recently released AASHTO Guide for the Development of Bicycle Facilities provides revised treatment of the information as it relates to the types of cyclists and guidance about minimum crossing times. The three classes of cyclists (A, B and C) have been replaced by two new classes named Experienced and Confident and Casual and Less Confident. Descriptive characteristics of each class are presented including suggested ranges for operating performance. These are shown in Table A 2-1. TableA 0-1 Rider Characteristics (AASHTO 2012) Experienced/Confident Riders Most are comfortable riding with vehicles on streets and are able to navigate streets like a motor vehicle, including using the full width of a narrow travel lane when appropriate and using left-turn lanes. While comfortable on most streets, some prefer on-street bike lanes, paved shoulders, or shared use paths when available. Prefer a more direct route. Avoid riding on sidewalks. Ride with the flow of traffic on streets. May ride at speeds up to 25 mph on level grades, up to 45 mph on steep descents. May cycle longer distances. Casual/Less Confident Riders Prefer shared use paths, bicycle boulevards or bike lanes along low-volume, low-speed streets. May have difficulty gauging traffic and may be unfamiliar with rules of the road as they pertain to bicyclists; may walk bike across intersections. May use less direct route to avoid arterials with heavy traffic volumes. If no on-street facility is available, may ride on sidewalks. May ride at speeds around 8 to 12 mph. Cycle shorter distances: One to five miles is a typical trip distance. A-4
122 Information about the design vehicle and key performance characteristics are presented in ranges without distinction by type or class. The new AASHTO performance assumptions are shown in the table below: Table A 0-2 Key Performance Criteria (AASHTO 2012) Bicyclist Type Typical upright adult bicyclist Feature Value U.S. Customary Metric Speed, pave level terrain 8-15 mph km/h Speed, downhill plus mph plus km/h Speed, uphill 5-12 mph 8-19 mph Perception reaction time s s Acceleration rate ft/s m/s 2 Coefficient of friction for braking, dry level pavement Deceleration rate (dry level pavement) 16.0 ft/s m/s 2 Deceleration rate for wet conditions (50-80% ft/s m/s 2 reduction in efficiency) Recumbent bicyclist Speed, level terrain mph km/h Acceleration rate ft/s m/s 2 Deceleration rate ft/s m/s 2 Note: The speeds reported are for bicyclists on shared use paths. Experience suggest that maximum speeds on roadways can be considerably higher The new guide presents timing issues separately for standing and rolling bicyclists. For stopped bicyclists, the guide presents the equations to determine the minimum green required for a cyclist to start from stop and clear the intersection width (this width is not specifically defined). These equations are presented in Table A 0-3. Note that the presentation of the calculation of minimum green recommends a change in the reaction time from 2.5 seconds to 1.0 seconds for standing crossing time (i.e., a bicycle starting from a stopped position). A-5
123 Table A 0-3 Bicycle Minimum Green Time Using Standing Bicycle Crossing Time (AASHTO, 2012) U.S. Customary BMG = BCT standing Y R clear BMG = PRT + V (W + L) + + Y + R 2a V clear where: Metric BMG = BCT standing Y R clear BMG = PRT + V 2a where: (W + L) + + Y + R V clear BMG = bicycle minimum green time (s) BMG = bicycle minimum green time (s) BCT standing = bicycle crossing time (s) BCT standing = bicycle crossing time (s) Y = yellow change interval (s) Y = yellow change interval (s) R clear = all-red (s) R clear = all-red (s) W = intersection width (ft) W = intersection width (m) L = typical bicycle length = 6 ft (see Chapter 3 for other design users) V = bicycle crossing speed at intersection (ft/s) L = typical bicycle length = 1.8 m (see Chapter 3 for other design users) V = bicycle crossing speed at intersection (ft/s) PRT = perception reaction time = 1s PRT = perception reaction time = 1s a = bicycle acceleration (1.5 ft/s2) a = bicycle acceleration (0.5 m/s 2 ) For rolling cyclists, the guide presents equations for determining the braking distance and rolling crossing time. A cyclist who enters the intersection just at the end of green should have sufficient time to clear the intersection during the yellow change and red clearance intervals. The rolling time is presented as the sum of the braking distance, intersection width, and length of bicycle divided by the assumed rolling speed (suggested as 10 mph or 14.7 feet/second). These equations are presented in Table A 0-4. The presentation of these equations in the previous guidance as a means to determine the length of yellow change interval and red clearance intervals for bicyclists has been removed. Instead, the new AASHTO guide states that the yellow interval is based on the approach speeds of automobiles and, therefore, should not be adjusted to accommodate bicycles (pp 4-46). The guide suggests modifying the red time, or if that is insufficient, to provide for extension time using a dedicated bicycle detector and controller settings to add sufficient time to clear the intersection. A-6
124 Table A 0-4 Rolling Bicycle Crossing Time Considering Braking Distance (AASHTO 2012) BCT standing = BD = PRT V + V2 2a where: U.S. Customary BD + W + L V BCT standing = BD = PRT V + V2 2a where: Metric BD + W + L V BCT standing = bicycle crossing time (s) BCT standing = bicycle crossing time (s) W = intersection width (ft) W = intersection width (m) L = typical bicycle length = 6 ft (see Chapter 3 for other design users) V = bicycle crossing speed at intersection (ft/s) L = typical bicycle length = 1.8 m (see Chapter 3 for other design users) V = bicycle crossing speed at intersection (ft/s) BD = breaking distance (ft) BD = breaking distance (m) PRT = perception reaction time = 1s PRT = perception reaction time = 1s a = deceleration rate for wet pavement = 5 ft/s 2 a = deceleration rate for wet pavement = 1.5 m/s 2 The document also contains some information on detectors and placements. There is no other guidance related to bicycle-specific signals. It must be noted that AASHTO 2012 recommendations for minimum stopping sight distance are slightly different than those from the previous 1999 Guide which has a smaller suggested deceleration rate; the minimum stopping sight distance, S, is calculated using this formula: V 2 S = PRT V + 30(f ± G) where the recommended PRT is 2.5 seconds and f is 0.16; hence, in all cases BD < S. There is no discussion of potential dilemma zones. Regarding bicycle detection the new AASHTO guide states that, Actuated traffic signals should detect bicycles. The guide also indicates that, It may be desirable to install advance detection bicycle detection, similar to advance vehicle detection. Where it is installed, advance detection makes it possible to minimize delay to cyclists and provide green extension time by installing A-7
125 one small area detection zone about 100ft (30 m) from the stop bar, with a second, perhaps larger, detection zone located at the stop bar. The new AASHTO guide does not discuss the impact of stopping sight distance (close to 100 feet at 15 mph) on detection location, green extension timing for bicycles, or the impacts of green extensions on total intersection delay or maximum green times. A Manual on Uniform Traffic Control Devices (FHWA 2009) There are two references to bicycle signals in the current Manual on Uniform Traffic Control Devices (MUTCD). First, in Section 4D.07 Size of Vehicular Signal Indications the manual permits the use of an 8-inch circular indication for the sole purpose of controlling a bikeway or a bicycle movement. The use of the red-yellow-green (RYG) bicycle stencil in lenses is not provided. In Section 9D.02 Signal Operations for Bicycles, standards are provided for the installation of visibility-limited signal faces. The MUTCD requires that when these are used, signal faces shall be adjusted so bicyclists for whom the indications are intended can see the signal indications. If the visibility-limited signal faces cannot be aimed to serve the bicyclist, then separate signal faces shall be provided for the bicyclist. In addition, the manual states that on bikeways 2, signal timing and actuation shall be reviewed and adjusted to consider the needs of bicyclists. A California MUTCD (Caltrans 2012) The California MUTCD includes significant guidance for bicycle-specific signals. Section 4C.102 provides a Bicycle Signal Warrant which states that a bicycle signal should be considered for use only when the volume and collision or volume and geometric warrants have been met. These are identified as: volume (based on the number of bicycles per peak hour (at least 50) and the number of vehicles at the peak hour entering the intersection); collision (when two or more bicycle/vehicle collisions of types susceptible to correction by a bicycle signal have occurred over a 12-month period, and the responsible public works official determines that a bicycle signal will reduce the number of collisions); and geometric (a path connection or to allow a movement not allowed for vehicles). The manual states that a bicycle signal should be used only after other alternatives have been used. The California MUTCD allows an 8-inch lenses for the circular indications in a signal face installed for the sole purpose of controlling a bikeway or a bicycle movement. The manual specifies the use of the bicycle insignia by stating that only green, yellow and red lighted bicycle symbols, shall be used to implement bicycle movement at a signalized intersection. 2 a generic term for any road, street, path, or way that in some manner is specifically designated for bicycle travel, regardless of whether such facilities are designated for the exclusive use of bicycles or are to be shared with other transportation modes. (MUTCD, pg 11) A-8
126 Figure 4D-112 (CA) in the manual shows the RYG arrangement (with the bicycle stencil facing left): Figure A 0-3 Figure 4D-112 (CA) Example of Bicycle Signal Face The manual provides detection guidance (including drawings of detector placement). It also includes provisions on the minimum timing parameters. The manual states that for all phases, the sum of the minimum green, plus the yellow change interval, plus any red clearance interval should be sufficient to allow a cyclist riding a bicycle 6 feet long to clear the last conflicting lane at a speed of 14.7 feet/second (10 mph) plus an additional effective start-up time of six seconds, according to the formula: (W + 6 ft) G min + Y + R clear > 6 sec ft/sec where: Gmin = Length of minimum green interval (sec) Y = Length of yellow interval (sec) Rclear = Length of red clearance interval (sec) W = Distance from limit line to far side of last conflicting lane (feet) The minimum time, based on the distance, is provided in the following table: A-9
, and acceleration (1.5 feet/sec 2 ), the first two terms of the AASHTO equation are approximately six seconds. PRT + V 2a 6 sec. A-2.1.6 Traffic Signal Timing Manual (FHWA 2008) The")
127 TableA 0-5 Signal Operations - Minimum Bicycle Timing (Caltrans) The AASHTO and California formulas estimate similar numbers; with the default AASHTO values of perception-reaction (one second), speed (14.7 feet/sec), and acceleration (1.5 feet/sec 2 ), the first two terms of the AASHTO equation are approximately six seconds. PRT + V 2a 6 sec. A Traffic Signal Timing Manual (FHWA 2008) The FHWA Traffic Signal Timing Manual contains many references to accommodating bicycles at intersection signals, but no specific guidance in terms of timing parameters or clearance intervals. The manual is currently being updated and will likely include additional guidance. A Traffic Signal Guidelines for Bicycles (Transportation Association of Canada (TAC) 2004) The Transportation Association of Canada (TAC) compiled the Traffic Signal Guidelines for Bicycles to provide a comprehensive list of best practices for the application of bicycle-specific traffic signals in Canada. Section A4.1.2 of Traffic Signal Guidelines recommends that bicycle signals comply with the bicycle standards of Quebec province, which requires signals to consist of three 200-millimeter (8-inch) circular lenses stacked vertically with bicycle insignia, as shown A-10
 Another aesthetic recommendation is that the housing color of bicycle signals be black (opposite the usual yellow housings for motorist signals) to")
128 in Figure A2-4. Inclusion of a lens insignia is expressly recommended to eliminate motorist confusion. FigureA 2-4 Quebec Standard Signal Head (TAC) Another aesthetic recommendation is that the housing color of bicycle signals be black (opposite the usual yellow housings for motorist signals) to further distinguish their special use. It is noted that bicycle signals are intended to signal permissive movements only, with all bicycle movements being permitted unless there is signage to indicate otherwise. Sections A4.1.3 and A discuss timing and phasing for bicycle signals, respectively. The average typical cruising speed of a cyclist is given to be 20 kilometers/hour (12.4 mph), and it is suggested that cyclists in mixed traffic are adequately served by existing green times for the majority of cases. Recognizing the extra steps for cyclists to begin pedaling from start (e.g., lock into toe clips, engage lower gear), the document recommends an absolute minimum green time of five seconds. It is also suggested that minimum vehicular greens at very wide crossings or on uphill gradients be extended to accommodate cyclists. Recommendations for clearance intervals are that yellow times should remain unchanged, since cyclists can more easily stop than motor vehicles, and that, if needed, red clearance displays can be extended to accommodate slower cyclists. For exclusive bicycle phasing, the recommended minimum green time is 10 seconds for most intersection widths. For very wide intersections where cyclists must accelerate from a stop, an additional five seconds can be allocated to the minimum green time for a total of 15 seconds. Yellow and red times should be shorter and longer than motorist times, respectively, although values for these times were not given. Section A states procedures for installation of bicycle signals. Recommendations applicable to newly installed signals are as follows: One signal head should be installed in the field of vision of cyclists or within 30 meters (98.4 feet) of the stop bar for easy perception and identification of the signal. A-11

129 For signal heads more than 30 meters (98.4 feet) away from stopped cyclists, 300- millimeter lenses (12 in.) are appropriate. Alternatively, bicycle signals may be placed in both the road median and at the far edge of very wide intersections. Signal indications should contain LEDs. Mounting heights for bicycle signals should be the same as pedestrian signals heads on the opposite side of an intersection. Bicycle signals placed over the travelled part of the roadway should be mounted at the standard signal height above the roadway. Suggested mounting heights and positions can be seen in Figure A 0-4. Supplemental near-side displays are suggested for very wide intersections or those with complex geometry. Figure A 0-4 Typical Mounting Heights for Bicycle Traffic Signals -- Figure A4.2 (TAC) Section A discusses justifications for the installation of a bicycle signal. Although several key factors to consider are detailed in the report, no thresholds or minimum numbers of cyclists are given to warrant a bicycle signal. The view of the authors is that appropriate implementation is dependent on many factors and justification for one intersection is not necessarily appropriate for another intersection, even one with similar geometry. There is a strong emphasis on the use of engineering judgment in conjunction with the key factors: safety, traffic/cycling volumes, conflicting movements, and public input. Engineering judgment is also important when deciding whether or not to incorporate an exclusive bicycle phase into the timing plan at an intersection. Only rare circumstances should be considered for a fully actuated bicycle signal, as exclusive phases can increase delay for other modes. A Manual of Uniform Traffic Control Devices for Canada, 2008 update (TAC 2008) The Canadian MUTCD has similar guidance to Traffic Signal Guidelines for Bicycles for the design aspects of bicycle signals. The Canadian MUTCD states that standard bicycle signal lenses are 200-millimeter (8-inch) circular lenses but that when the lens is more than 30 meters A-12
130 (98.4 feet) away from stopped cyclists, 300-millimeter (12-inch) lenses may be considered. It also states that a bicycle signal head should be mounted within the cone of vision of cyclists and preferably within 30 m upstream of the stop bar with vertical mounting preferred. The guidance on this characteristic is that the minimum height for a bicycle signal over a roadway is 4.5 meters (14.8 feet). No guidance on cyclist performance values is given in the Canadian MUTCD. A Design Manual for Bicycle Traffic (CROW 2007) The CROW Design Manual for Bicycle Traffic takes a more qualitative approach to guidance for bicycle infrastructure than the U.S. and Canadian guidance documents. All discussion of traffic measures are centered around five main requirements for bicycle-friendly infrastructure: attractiveness, comfort, directness, safety, and cohesion. For traffic signals, two of the main requirements are applicable directness and comfort. At intersections, both directness and comfort deal with cyclist delay, which is broken down into the probability of stopping and the wait time once stopped. The chance of stopping/possibility of proceeding and the wait time are considered highly significant when assessing the quality of a bicycle crossing. A basic premise of the guide is that bicycles should have to stop as little as possible. An average wait time of less than 15 seconds is considered good, with an absolute maximum wait time (in built-up areas) of 90 seconds. To aide in the appropriate timing of signals to meet these optimal conditions, the CROW manual provides suggested design values for speed (20 kilometers/hour; 12.4 mph), acceleration (0.8 to 1.2 m/s2), deceleration (1.5 m/s2), and perception-reaction time (one second). Variety in speed and acceleration because of cyclist characteristics and road conditions is acknowledged. Although warrants for bicycle signals are not explicitly discussed, safety for cyclists is cited as an important consideration for the installation of any type of traffic signal specifically where motorist cross-traffic speed and/or volume is high enough to hinder cyclists crossing of an intersection. Maintaining the flow of bicycle traffic is another reason for the installation of a signal, particularly when the right of way of the cyclists needs to be emphasized. A-2.2 RELEVANT LEGISLATION This search was not exhaustive but identified related legislation that allows the use of bicycle signal indications. A Oregon Oregon Senate Bill 130 amended ORS to describe the requirements of a bicyclist when facing green, yellow or red bicycle signals. The definitions are (quoted directly): Green bicycle signal. A bicyclist facing a green bicycle signal may proceed straight through or turn right or left unless a sign at that place prohibits either turn. The bicyclist shall yield the right of way to other vehicles within the intersection at the time the green bicycle signal is shown. Steady yellow bicycle signal. A bicyclist facing a steady yellow bicycle signal is thereby warned that the related right of way is being terminated and that a red bicycle signal will A-13
131 be shown immediately. A bicyclist facing a steady yellow bicycle signal shall stop at a clearly marked stop line, but if none, shall stop before entering the marked crosswalk on the near side of the intersection, or if there is no marked crosswalk, then before entering the intersection. If a bicyclist cannot stop in safety, the bicyclist may proceed cautiously through the intersection. Steady red bicycle signal. A bicyclist facing a steady red bicycle signal shall stop at a clearly marked stop line, but if none, before entering the marked crosswalk on the near side of the intersection, or if there is no marked crosswalk, then before entering the intersection. The bicyclist shall remain stopped until a green bicycle signal is shown except when the bicyclist is permitted to make a turn under ORS The requirements for the steady yellow bicycle signal can lead to a bicyclist s dilemma zone. Though, as later addressed, there is no discussion of dilemma zones for bicyclists in the current guidelines. A California California similarly defines the requirements of a bicyclist when facing a bicycle signal indication in Section Transportation Bicycle Signals as (quoted directly): An operator of a bicycle facing a green bicycle signal shall proceed straight through or turn right or left or make a U-turn unless a sign prohibits a U-turn. An operator of a bicycle, including one turning, shall yield the right-of-way to other traffic and to pedestrians lawfully within the intersection or an adjacent crosswalk. An operator of a bicycle facing a steady yellow bicycle signal is, by that signal, warned that the related green movement is ending or that a red indication will be shown immediately thereafter. Except as provided in subdivision (d), an operator of a bicycle facing a steady red bicycle signal shall stop at a marked limit line, but if none, before entering the crosswalk on the near side of the intersection, or, if none, then before entering the intersection, and shall remain stopped until an indication to proceed is shown. Except when a sign is in place prohibiting a turn, an operator of a bicycle, after stopping as required by subdivision (c), facing a steady red bicycle signal, may turn right, or turn left from a one-way street onto a one-way street. An operator of a bicycle making a turn shall yield the right-of-way to pedestrians lawfully within an adjacent crosswalk and to traffic lawfully using the intersection. A bicycle signal may be used only at those locations that meet geometric standards or traffic volume standards, or both, as adopted by the Department of Transportation. A-2.3 ODOT DESIGN POLICY ODOT has established an addendum to the Traffic Signal Policy and Guidelines. The policy is included in the Appendix B A-14

132 A-3.0 STATE OF THE PRACTICE This section reports on the practices that operating agencies currently use to employ bicyclespecific traffic signals. The purpose of this synthesis is to illuminate the similarities and differences between installed signals in terms of their physical and operational properties. These include mounting height, signal housing color, and signal timing. Additionally, information was gathered on the motivations and guidance used to design the bike signals. Discussion of the findings of the synthesis is organized via these three categories. Individual data sheets on each signal head can be found in Appendix C. Data for all reported jurisdictions was gathered via an online survey 3 disseminated through e- mail with the exception of data from Portland, OR, which was gathered via site visits and correspondence with agency contacts. Surveys were sent out to agencies in 21 jurisdictions, 19 in the United States and two in Canada. A copy of the survey instrument can be found in Appendix B. The per-city response rate for the survey, including data gathered for Portland, was 71%. A breakdown of responding jurisdictions can be found in Figure A 4-1. Figure A 0-1 Jurisdictions Identified with Bicycle-specific Signals and Survey Respondents Note: numbers following the : denote the number of reported signal heads at that location. U denotes a non-response for that location. NA denotes a response from Tucson on their TOUCAN signals which is shown for completeness. Using the per-city response rate and knowledge of signals in non-responding jurisdictions, it is estimated that the survey attempted to document a total of 241 signal heads. This equates to 62% per-signal head response rate for the survey. A-15
133 In all, a total of 63 intersections and 149 separate signal heads were analyzed for this section. It should be noted that although a response from a Tucson, AZ, contact was collected, information about the signals in that jurisdiction was not used statistically for the Synthesis of Practice. Tucson has designed special signalized intersections called TOUCAN s that only serve bicycle and pedestrian traffic on the side street approaches. With no potential for confusion among motorists or bicyclists, these types of signals were not the focus of this survey. All statistics reported in this synthesis are based on received responses and site visits only. The columns labeled unknown contain the percentage of respondents who took the survey but did not respond to a particular question. A-3.1 PHYSICAL PROPERTIES Physical representation of a signal relates to its visibility and recognition. This section analyzes the physical aspects of the signals themselves as well as their placement in relation to other traffic control devices. A Characteristics of the Signal Head Five characteristics of the bicycle signal heads are described in this synthesis: backplate presence and color, signal housing color, lens size, traits of the insignia, and the presence of louvers or a visibility limited indication. A summary of the survey results for these characteristics is found in Table A0-1. Standard signal housing colors, yellow and black, made up the majority of housing colors for reviewed signals. Eight signal heads from San Francisco were reported as being Dark Green and appear in the Other column of Table A0-1. The reported color of backplates, when present, varied between black and yellow, although the vast majority of bicycle signals have no backplates. Of those that do, yellow and black were almost equally reported. Pictures of the various housing and backplate combinations are shown in Figure 4-3f. It should be noted that these elements reflect local design practice. For example, the housing color of Vancouver, B.C., bicycle signals head housing (yellow) matched the motorist signals. In the survey, it was more common for U.S. jurisdictions to use different color housing than motor vehicle signals. The majority of U.S. signal lenses were 12 inches; Canadian signals were more likely 8 inches. This corresponds to guidance in Canadian MUTCD and the fact that signal heads are often placed on both sides of the intersection. As one way to differentiate the bike signal from motorist signals, many bicycle signal heads display an insignia (or stencil) of a bicycle in the lens. The majority of installed bicycle signals have some sort of insignia on the lenses. Interestingly, there is variation on the direction of the insignia faces. Canadian signals were more uniform in their use of a left-facing lens insignia (in Montreal and Vancouver). Within and between the U.S. cities, there is variation with the application of lens insignia. Also, two basic forms of the insignia were found: a realistic outline of a bicycle and a more abstract one. Pictures of these are shown in Figure A0-3 Figure A0-3 Photographs of Various Elements of Bicycle-Specific Traffic Signals c. A-16
134 Most of the surveyed signals heads did not use louvers or other modifiers to restrict the visibility of the bicycle signal to make it viewable by cyclists only. Generally, when louvers were employed, it was at intersections with major safety concerns and/or where the bicycle signal aligned with the motorist signal and might be easily confused. Louvers were not heavily utilized in either of the surveyed Canadian jurisdictions. Table A0-1 Elements of the Signal Head Number of Signal Heads Percent of Signal Heads Characteristic US CN Total US CN Total Backplate Black % - 12% Color Yellow % - 7% No backplate % 100% 81% Unknown Housing Black % 38% 46% Color Yellow % 62% 48% Other % - 5% Unknown Lens Size 12" % 7% 28% 10" " % 93% 66% Other % - 1% Unknown % - 4% Bicycle Faces Left % 81% 66% Insignia Faces Right % - 13% No Insignia % 19% 20% Unknown % - 1% Utilization Yes % 18% 37% of Louvers No % 82% 62% Unknown % - 1% US = United States, CN = Canada Note: All percentages are rounded to the nearest integer. Note: Percentages based on total number of surveyed signal heads, 149. A Placement and Mounting In the U.S., motor vehicle traffic signals are located on the far side of the intersection unless there are sight distance issues. This practice has been followed with installations of bicycle signal heads. About 19% of the U.S. sample and 64% of the Canadian intersections had signal heads placed on both the near and far side of the intersection. Near side-only bicycle signals are commonly found in Europe, but no near side-only signals were found in our North American survey. Note that these near-side heads are typically smaller and lower in Europe. Pictures of some typical mounting locations are shown in Figure A0-3 Photographs of Various Elements of Bicycle-Specific Traffic Signals a and b. A-17
135 The reported mounting heights of bicycle signals varied widely, from 7 to 19 feet (measured from pavement elevation at the bicycle stop bar). The mounting height partially correlated with the intersection placement of the signals intersections with signals on both near and far sides tended to have lower mounting heights. Lower mounting heights were also common when the bicycle signal was mounted on the same pole as the pedestrian indication. The mounting heights are summarized in Table A0-2 Placement and Mounting, using height bins to simplify the display. Table A0-2 Placement and Mounting Number of Intersections Percent Characteristic US CN Total US CN Total Intersection Near side-only Placement * Far side-only % 36% 56% Both % 64% 44% Unknown % - Mounting < 10 ft % - 9% Height ft % 96% 75% 15+ ft % 4% 8% Unknown % - 8% * Percentages based on total number of surveyed intersections, 63. A-3.2 OPERATIONAL PROPERTIES A Detection, Phasing, Restricted Movements, Accompanying Signage All of the signalized intersections from Vancouver, B.C, and Montreal, QC, were reported to not include detection. Forty-four percent of U.S. signals were on recall with no detection. For the remaining intersections with some form of detection, loop detection was the most common. For intersections with loop detection, most used the bicycle detector pavement marking found in the MUTCD to inform cyclists of where they could be detected. Some U.S. locations also included push button actuations. Close-up pictures of these are shown in Figure A0-3d. The pavement marking from the MUTCD to request green was commonly used (see Figure A0-2). Two jurisdictions (Austin, TX, and Portland, OR) reported experimenting with a detection feedback indication which illuminates when the controller detects the presence of cyclists. A close-up of Portland s installation is shown in Figure A0-3d. There was no information included in the survey questions about advance detector placement. Based on submitted timing plans, commentary from the survey, and Internet research, the phasing for the majority of the signals could be determined. In the U.S., 59% of the intersections provided for an exclusive phase for the bicycle movement. It was very common to restrict any conflicting motor vehicle movement as part of the design and operation (70% of the U.S. and 56% of the Canadian intersections). Although the geometry of a few intersections mitigated the need to restrict conflicting movements, overall, motorists were restricted from making some sort of movement while at an intersection with a bicycle signal. The restricted movements were A-18
 of intersections with motorist restrictions had an exclusive phase for cyclists at the bicycle signal. Finally, nearly 74% of the U.S.")
136 almost entirely turns against the bikeway with a few intersections restricting all movement by vehicles while bicyclists were crossing. The majority (64%) of intersections with motorist restrictions had an exclusive phase for cyclists at the bicycle signal. Finally, nearly 74% of the U.S. signals included some form of accompanying signage to provide additional information that the signal head controlled bicycle movements. The signs were generally consistent (see Figure A0-3 Photographs of Various Elements of Bicycle-Specific Traffic Signals e) though Long Beach, CA, added lettering to the signal backplate. Design Element Detection Type Table A-4.3 Operational Elements Number of Intersections Percent of Intersections US CN Total US CN Total Loop % - 11% Video % - 3% Loop & push-button % - 6% Push-button Only % - 3% No Detection/ Recall % 100% 76% Unknown Phasing Type Exclusive % 36% 46% Concurrent % 64% 48% Leading interval % - 2% Unknown % - 5% Restricted Movements Accompanying Signage Yes % 56% 62% No % 44% 35% Unknown % - 3% Yes % 25% 46% No % 75% 52% Unknown % - 2% *One reviewed signal, from Portland, OR, with a leading interval for cyclists is included. Note: Percentages based on total number of surveyed intersections, 63. Note: The definition for Exclusive includes those signals that are concurrent with pedestrian traffic but not motorist traffic. Figure A0-2 Bicycle Detector Pavement Marking A-19

137 Figure A0-3 Photographs of Various Elements of Bicycle-Specific Traffic Signals A Signal Timing Survey respondents were asked to report the minimum green, yellow and red times for the bicycle signals in their jurisdictions. These statistics are reported in TableA 0-3. Because a comparison of minimum times also needs to account for intersection width, these minimum times were normalized based on the standing start equation for bicycle minimum green time from AASHTO s 2012 guide. The guide-suggested values for PRT (1 s), L (6 feet), and a (1.5 ft/s2) were used in these calculations (T). Intersection widths were obtained from Google Earth. These normalized values are presented in TableA 0-3. Although timing information could not be determined for all signals, analysis of the data revealed a range of speeds. A-20
138 TableA 0-3 Assumed Cyclist Speeds, Derived from Minimum Green Times and Intersection Widths Statistic US CN Total Sample Mean Minimum Median Green Low Time (sec) High Mean Intersection Median width (ft) Low High Assumed Cyclist Speed (ft/s) Mean Median Low 2.1 * * High % of sample with available 78% 36% 54% timing information *Extreme low due to one location with a narrow intersection width and lengthened bicycle indication to be concurrent with pedestrian indication. Next lowest value was 3.8 ft/s. It should be noted that other characteristics of the intersection and cyclist population were beyond the scope of knowledge reasonably available to survey respondents. From the literature review, it is clear that factors beyond intersection width affect crossing time and other cyclist performance characteristics. The calculated assumed speeds, detached from this supplementary information, are difficult to compare across signals as it is impossible to group the signals by meaningful intersection or cyclist characteristics. A-3.3 MOTIVATIONS AND DECISION CRITERIA A Motivations Another aspect of signal head installation is the motivations behind it. Survey respondents were asked to cite the reasons for installing signals at particular locations. Reasons for installation could be grouped into five categories: 1. Cyclist non-compliance with previous traffic control 2. Presence of a contra-flow bicycle movement 3. A diagonal (or otherwise unique) cyclist path through the intersection 4. Safety concerns for cyclists 5. Other From Table A0-4, bicycle signals are most commonly installed when cyclists are moving against motorist traffic or taking a non-standard path through an intersection or when there are safety concerns for cyclists at that intersection. The many contra-flow responses are from installations in Vancouver, B.C., and Montreal, QC, with two-way cycle tracks. Reasons falling into the A-21
139 Other category were few. For two signals, infrastructure updates gave the agencies an opportunity to install the signal. Three more signals were installed for experimental reasons to try out new traffic control and/or signal timing for cyclists. Table A0-4 Motivations for Installation Motivations Number of Intersections Percent of Sample US CN Total US CN Total Non-compliance % - 3% Contra-flow % 69% 48% Unique path % 6% 18% Safety % 23% 24% Other % 2% 6% Note: percentages do not add to 100% as more than one motivating reason per intersection could be cited A Decision Criteria Very few jurisdictions had clear decision criteria for the installation of bicycle signals. Four survey respondents and the Portland Bureau of Transportation (PBOT) indicated that they had some sort of decision criteria for installing the signals. Table A0-5 indicates the jurisdictions with decision criteria and the source/type of the criterion. Table A0-5 Decision Criteria Jurisdiction Source/Type of Decision criteria Ashland and Clackamas Co., OR ODOT Traffic Signal Policy and Guidelines, Addendum 2 Eugene, OR Independently Developed Portland, OR Independently Developed San Francisco, CA CAMUTCD A Ashland and Clackamas County, OR Traffic control in these two Oregon jurisdictions is governed by the Oregon Department of Transportation and thus uses the decision criteria given in Addendum 2 of Oregon s Traffic Signal Policy and Guidelines, found in Appendix A. A Eugene, OR Eugene has three criteria, of which one should be met, to install a bicycle signal: 1. When two or more bicycle/motor vehicle crashes, which happened for reasons that could have been prevented by the installation of a bicycle signal, have occurred in the last three years. A-22
140 2. When geometric factors at an intersection, which impede cyclist crossing, could be mitigated with a bicycle phase. 3. When there is a bicycle-only approach to an intersection. A Portland, OR Portland specifies that one of the following conditions/objectives be met in order to warrant a bicycle signal: 1. Geometric factors to control the separation of conflicting movements between cyclists and motorists. 2. When there is a bicycle-only approach to an intersection. 3. When there is a need to provide a leading interval for cyclists in order to increase their visibility and safety. 4. Where paths cross roadways to provide a shorter green time for cyclists when no pedestrians are present. 5. If there is a bicycle movement that is not accommodated by typical traffic signals. 6. If there are high cyclist volumes at an intersection. A San Francisco, CA San Francisco uses the warrants given in the California MUTCD that have been previously discussed in this report (See Section A2.1.5). Of the five agencies with decision criteria, all include warrants based on geometric factors that affect cyclists crossing an intersection. The existence of a bicycle-only approach and collision criteria were warrants present in four of the five agencies documents. A-23
141 A-4.0 CONCLUSIONS This review has highlighted both the guidance available to engineers and planners and the types of designs being implemented by jurisdictions of bicycle-specific signals. The availability of engineering guidance has improved substantially over the past few years with the release of the California MUTCD, NACTO s Urban Bikeway Design Guide, and AASHTO s guidance. While there are minor differences, there is generally consistent guidance. To some extent, the guidance documents reflect the lessons learned by the surveyed jurisdictions since installation of the bicycle-specific signals is limited to those places willing to experiment. The survey of practice found a variety in some design elements: lens size, use of insignia, utilization of louvers, mounting location, and the means to designate that the signal head is for bicyclists. Some consensus appears on the use of the lens insignia and accompanying signage. Given the accelerated deployments of bicycle-specific signals and the new guidance documents, it is likely that there will be less variety in future designs. Adoption of minimum guidance in the U.S. MUTCD would also likely improve consistency and practice A-4.1 RESEARCH NEEDS The review highlighted a few clear knowledge gaps that warrant further research. First, the timing of minimum green and clearance intervals is challenging based on the wide variety of cyclists abilities. Descriptive data on cyclist performance characteristics like speed, acceleration, start-up lost time, and saturation flow rate that affect intersection clearance time are important for effective timing of intervals to accommodate cyclists. Second, quantitative research on the safety effectiveness of bicycle-specific signals is lacking. This is a key gap in the knowledge needed to create standards for the operation of bicycle-specific signals. Finally, operational compliance of cyclists with bicycle-specific signals is another empirical data gap. A-24
142 APPENDIX B: OREGON DEPARTMENT OF TRANSPORTATION TRAFFIC SIGNAL POLICY AND GUIDELINES, ADDENDUM NO. 2, SECTION VI SPECIAL APPLICATIONS
143
144 ODOT Traffic Signal Policy and Guidelines, Addendum 2: Bicycle Signals B-1
145 B-2
146 APPENDIX C: STATE OF THE PRACTICE SURVEY INSTRUMENT
147
148 C-1
149 C-2
150 C-3
151 C-4
152 C-5
153 C-6
154 APPENDIX D: STATE OF THE PRACTICE INTERSECTION SUMMARY SHEETS
155
 Canada) x")
156 Municipality: Alexandria, VA Contact: William Schultheiss Contact Info Phone Agency or Firm Name Mount Vernon Trail & Porto Vecchio driveway Design Guidance Used for Cyclist Performance Guide technique Design AASHTO Guide d'aménagement Manual for for the des voies Bicycle Development cyclables Traffic of Bicycle (Transportation (CROW Facilities Association of Dutch Guide) Canada) x Intersection Characteristics # of legs # of Bike signals Crossing Distance for Bike Signal #1 (ft) Crossing Distance for Bike Signal #2 (ft) Field Measurements x NACTO Urban Bikeway Design Guide Signal Characteristics (for both directions of travel) Mounting Lens Housing Operation Near- or Mounting Bike Housing Backplate Far-side? Height 1 Size (in.) Louvers? Detection Type (ft) Insignia? Color Color Far 10 8 Faces right No Yellow No backplate On recall 1 from ground to bottom of signal housing Motivation for Signal Installation Noncompliance with previous traffic control x Contraflow bicycle movement Unique bicycle path through intersection Safety concerns x Other Signal Timing Bicycle Signal(s) Number of Bikeonly Cyclist Speeds (ft/s) Assumed Minimum Phase Lengths (s) Phases: Standing Start 1 Min. Green Yellow All-red using the equation for standing bicycle crossing time in AASHTO s 2012 Guide D-1

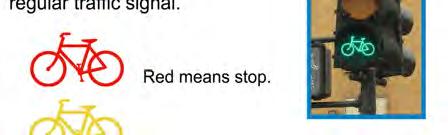


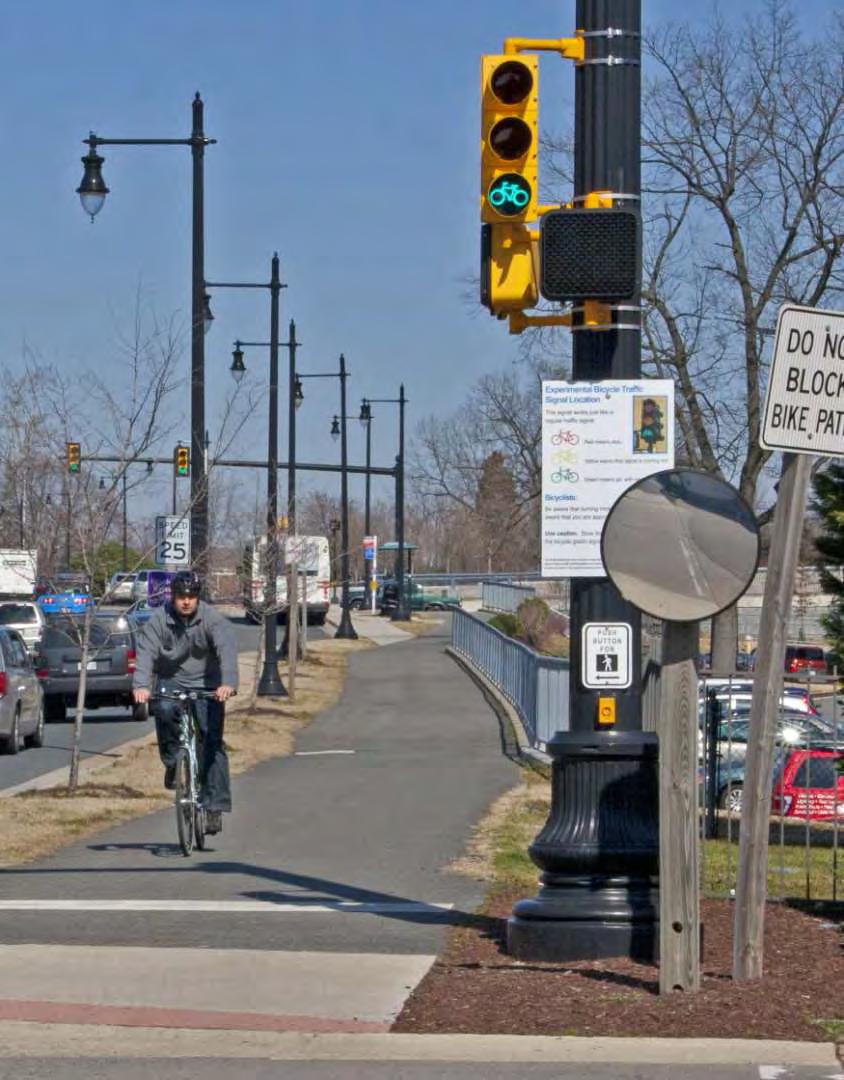
157 Figure 1. Approximate Crossing Distances and Bike Signal Locations Adjoining signage: D-2
158 Municipality: Arlington, VA Contact: Dave Kirschner Contact Info Phone Agency or Firm Name Lee Highway (US 29) and N Oak Street Design Guidance Used for Cyclist Performance Guide technique Design AASHTO Guide d'aménagement Manual for for the des voies Bicycle Development cyclables Traffic of Bicycle (Transportation (CROW Facilities Association of Dutch Guide) Canada) Field Measurements x x x Intersection Characteristics # of legs # of Bike signals Crossing Distance for Bike Signal #1 (ft) Crossing Distance for Bike Signal #2 (ft) NACTO Urban Bikeway Design Guide Signal Characteristics (for both directions of travel) Mounting Lens Housing Operation Near- or Mounting Bike Housing Backplate Far-side? Height 1 Size (in.) Louvers? Detection Type (ft) Insignia? Color Color Far 10 8 Yes No Yellow No backplate On recall 1 from ground to bottom of signal housing Motivation for Signal Installation Noncompliance with previous traffic control x Contraflow bicycle movement Signal Timing Bicycle Signal(s) Number of Bikeonly Cyclist Speeds (ft/s) Assumed Minimum Phases: 0 Unique bicycle path through intersection Safety concerns Phase Lengths (s) Other Standing Start 1 Min. Green Yellow All-red 1 using the equation for standing bicycle crossing time in AASHTO s 2012 Guide D-3
159 Figure 1. Approximate Crossing Distances and Bike Signal Locations Adjoining signage: with "Bike Signal Ahead" placard D-4
 Canada) Field Measurements")
160 Municipality: Arlington, VA Contact: Dave Kirschner Contact Info Phone Agency or Firm Name Lee Highway (US 29) and N Scott Street Design Guidance Used for Cyclist Performance Guide technique Design AASHTO Guide d'aménagement Manual for for the des voies Bicycle Development cyclables Traffic of Bicycle (Transportation (CROW Facilities Association of Dutch Guide) Canada) Field Measurements x x x Intersection Characteristics # of legs # of Bike signals Crossing Distance for Bike Signal #1 (ft) Crossing Distance for Bike Signal #2 (ft) NACTO Urban Bikeway Design Guide Signal Characteristics (for both directions of travel) Mounting Lens Housing Operation Near- or Mounting Bike Housing Backplate Far-side? Height 1 Size (in.) Louvers? Detection Type (ft) Insignia? Color Color Far 10 8 Yes No Yellow No backplate On recall 1 from ground to bottom of signal housing Motivation for Signal Installation Noncompliance with previous traffic control x Contraflow bicycle movement Signal Timing Bicycle Signal(s) Number of Bikeonly Cyclist Speeds (ft/s) Assumed Minimum Phases: 0 Unique bicycle path through intersection Safety concerns Phase Lengths (s) Other Standing Start 1 Min. Green Yellow All-red 1 using the equation for standing bicycle crossing time in AASHTO s 2012 Guide D-5
161 Figure 1. Approximate Crossing Distances and Bike Signal Locations Adjoining signage: with "Bike Signal Ahead" placard D-6
 Canada) Intersection Characteristics #")
162 Municipality: Austin, TX Contact: Nathan Wilkes Contact Info Phone Agency or Firm Name Red River Street & 4th Street Design Guidance Used for Cyclist Performance Guide technique Design AASHTO Guide d'aménagement Manual for for the des voies Bicycle Development cyclables Traffic of Bicycle (Transportation (CROW Facilities Association of Dutch Guide) Canada) Intersection Characteristics # of legs # of Bike signals Crossing Distance for Bike Signal #1 (ft) Crossing Distance for Bike Signal #2 (ft) Field Measurements x NACTO Urban Bikeway Design Guide Signal Characteristics (for both directions of travel) Mounting Lens Housing Operation Near- or Mounting Bike Housing Backplate Far-side? Height 1 Size (in.) Louvers? Detection Type (ft) Insignia? Color Color Far 12 none No Yellow Yellow On recall 1 from ground to bottom of signal housing Motivation for Signal Installation Noncompliance with previous traffic control Contraflow bicycle movement x Unique bicycle path through intersection Signal Timing Bicycle Signal(s) Number of Bikeonly Speeds (ft/s) Assumed Minimum Cyclist Phases: Standing Start 1 Safety concerns Min. Green Phase Lengths (s) Other Yellow All-red 1 using the equation for standing bicycle crossing time in AASHTO s 2012 Guide D-7
163 Figure 1. Approximate Crossing Distances and Bike Signal Locations D-8

 Mounting Lens Housing Operation Near- or Mounting Bike Housing Backplate Far-side?")
164 Municipality: Austin, TX Contact: Nathan Wilkes Contact Info Phone Agency or Firm Name Rio Grande Street & Martin Luther King Jr. Boulevard Design Guidance Used for Cyclist Performance Guide technique Design AASHTO Guide d'aménagement Manual for for the des voies Bicycle Development cyclables Traffic of Bicycle (Transportation (CROW Facilities Association of Dutch Guide) Canada) Intersection Characteristics # of legs # of Bike signals Crossing Distance for Bike Signal #1 (ft) Crossing Distance for Bike Signal #2 (ft) Field Measurements x NACTO Urban Bikeway Design Guide Signal Characteristics (for both directions of travel) Mounting Lens Housing Operation Near- or Mounting Bike Housing Backplate Far-side? Height 1 Size (in.) Louvers? Detection Type (ft) Insignia? Color Color Far 12 none No Yellow Yellow video 1 from ground to bottom of signal housing Motivation for Signal Installation Noncompliance with previous traffic control Contraflow bicycle movement Signal Timing Bicycle Signal(s) Number of Bikeonly Cyclist Speeds (ft/s) Assumed Minimum Phases: x Unique bicycle path through intersection x Safety concerns Phase Lengths (s) Other Standing Start 1 Min. Green Yellow All-red 1 using the equation for standing bicycle crossing time in AASHTO s 2012 Guide D-9
165 Figure 1. Approximate Crossing Distances and Bike Signal Locations D-10

166 Municipality: Contact: Contact Info Clackamas County, OR Richard Nys Phone Agency or Firm Name SE Johnson Creek Blvd, Bell Avenue (Springwater Trail) Design Guidance Used for Cyclist Performance Guide technique Design AASHTO Guide d'aménagement Manual for for the des voies Bicycle Development cyclables Traffic of Bicycle (Transportation (CROW Facilities Association of Dutch Guide) Canada) Intersection Characteristics Crossing Crossing # of Distance for Distance for # of legs Bike Bike Signal Bike Signal signals #1(ft) #2(ft) 6 * * including two legs of the Springwater Corridor Trail Field Measurements x NACTO Urban Bikeway Design Guide Signal Characteristics (for both directions of travel) Mounting Lens Housing Operation Near- or Mounting Housing Backplate Detection Far-side? Height 1 Size (in.) Bike Insignia? Louvers? (ft) Color Color Type Far 12 Faces right Yes Black Yellow Loop 1 from ground to bottom of signal housing Motivation for Signal Installation Noncompliance with previous traffic control Contraflow bicycle movement Unique bicycle path through intersection x Safety concerns x Other Signal Timing Bicycle Signal(s) Number of Bikeonly Speeds (ft/s) Assumed Minimum Cyclist Phase Lengths (s) Phases: Standing Start 1 Min. Yellow All-red 1 Green using the equation for standing bicycle crossing time in AASHTO s 2012 Guide D-11

167 Figure 1. Approximate Crossing Distances and Bike Signal Locations Adjoining Signage: D-12
 Canada) Intersection Characteristics #")
168 Municipality: Denver, CO Contact: Amy Rens Contact Info Phone Agency or Firm Name Bannock Street and 14 th Avenue Design Guidance Used for Cyclist Performance Guide technique Design AASHTO Guide d'aménagement Manual for for the des voies Bicycle Development cyclables Traffic of Bicycle (Transportation (CROW Facilities Association of Dutch Guide) Canada) Intersection Characteristics # of legs # of Bike signals Crossing Distance for Bike Signal #1 (ft) Field Measurements x NACTO Urban Bikeway Design Guide Signal Characteristics (for both directions of travel) Mounting Lens Housing Operation Near- or Mounting Bike Housing Backplate Far-side? Height 1 Size (in.) Louvers? Detection Type (ft) Insignia? Color Color Far 12 Faces left No Black No backplate On recall 1 from ground to bottom of signal housing Motivation for Signal Installation Noncompliance with previous traffic control Contraflow bicycle movement x Unique bicycle path through intersection Safety concerns Other Signal Timing Bicycle Signal(s) Number of Bikeonly Speeds (ft/s) Assumed Minimum Cyclist Phase Lengths (s) Phases: Standing Start 1 Min. Yellow All-red 0 Green using the equation for standing bicycle crossing time in AASHTO s 2012 Guide D-13
169 Figure 1. Approximate Crossing Distances and Bike Signal Locations D-14
 Canada) Field Measurements NACTO")
170 Municipality: Contact: Contact Info Eugene, OR Christina Knierim Phone Agency or Firm Name Alder Street and E 18 th Avenue Design Guidance Used for Cyclist Performance Guide technique Design AASHTO Guide d'aménagement Manual for for the des voies Bicycle Development cyclables Traffic of Bicycle (Transportation (CROW Facilities Association of Dutch Guide) Canada) Field Measurements NACTO Urban Bikeway Design Guide x x x x *Bicycle Transportation: A Handbook for Cycling Transportation Engineers (Forester) was also used for this signal Intersection Characteristics # of legs # of Bike signals Crossing Distance for Bike Signal #1 (ft) Crossing Distance for Bike Signal #2 (ft) Signal Characteristics (for both directions of travel) Mounting Lens Housing Operation Near- or Mounting Bike Housing Backplate Far-side? Height 1 Size (in.) Louvers? Detection Type (ft) Insignia? Color Color Far Faces right Yes Black Yellow Loop 1 from ground to bottom of signal housing Motivation for Signal Installation Noncompliance with previous traffic control Contraflow bicycle movement x Unique bicycle path through intersection Safety concerns x Left-turn movement from trail to street Signal Timing Bicycle Signal(s) Number of Bikeonly Speeds (ft/s) Assumed Minimum Cyclist Phase Lengths (s) Phases: Standing Start 1 Min. Yellow All-red 1 Green using the equation for standing bicycle crossing time in AASHTO s 2012 Guide Other D-15


171 Figure 1. Approximate Crossing Distances and Bike Signal Locations Adjoining signage: D-16
 Canada) x Intersection Characteristics #")
172 Municipality: Montreal, Canada Contact: Roger Bibaud Contact Info Phone Agency or Firm Name Rue Berri & Rue Cherrier Design Guidance Used for Cyclist Performance Guide technique Design AASHTO Guide d'aménagement Manual for for the des voies Bicycle Development cyclables Traffic of Bicycle (Transportation (CROW Facilities Association of Dutch Guide) Canada) x Intersection Characteristics # of legs # of Bike signals Crossing Distance for Bike Signal #1 (ft) Crossing Distance for Bike Signal #2 (ft) Field Measurements NACTO Urban Bikeway Design Guide x Signal Characteristics (for both directions of travel) Mounting Lens Housing Operation Near- or Mounting Bike Housing Backplate Far-side? Height 1 Size (in.) Louvers? Detection Type (ft) Insignia? Color Color Far 14 8 Faces left No Black No backplate On recall 1 from ground to bottom of signal housing Motivation for Signal Installation Noncompliance with previous traffic control Contraflow bicycle movement Unique bicycle path through intersection Safety concerns x x x Other Signal Timing Bicycle Signal(s) Number of Bikeonly Speeds (ft/s) Assumed Minimum Cyclist Phase Lengths (s) Phases: Standing Start 1 Min. Yellow All-red 1 Green using the equation for standing bicycle crossing time in AASHTO s 2012 Guide D-17


173 Figure 1. Approximate Crossing Distances and Bike Signal Locations Adjoining signage: D-18
174 Municipality: Montreal, Canada Contact: Roger Bibaud Contact Info Phone Agency or Firm Name Christophe-Colomb & Saint-Grégoire Design Guidance Used for Cyclist Performance Guide technique Design AASHTO Guide d'aménagement Manual for for the des voies Bicycle Development cyclables Traffic of Bicycle (Transportation (CROW Facilities Association of Dutch Guide) Canada) x Intersection Characteristics # of legs # of Bike signals Crossing Distance for Bike Signal #1 (ft) Crossing Distance for Bike Signal #2 (ft) Field Measurements NACTO Urban Bikeway Design Guide x Signal Characteristics Mounting Lens Housing Operation Near- or Mounting Bike Housing Backplate Far-side? Height 1 Size (in.) Louvers? (ft) Insignia? Color Color Detection Type Far 13 8 Faces left No Black No backplate On recall 1 from ground to bottom of signal housing Motivation for Signal Installation Noncompliance with previous traffic control Contraflow bicycle movement x Unique bicycle path through intersection Safety concerns Other Demonstration project Signal Timing Bicycle Signal(s) Number of Bikeonly Speeds (ft/s) Assumed Minimum Cyclist Phase Lengths (s) Phases: Standing Start 1 Min. Yellow All-red 1 Green using the equation for standing bicycle crossing time in AASHTO s 2012 Guide D-19
175 Figure 1. Approximate Crossing Distances and Bike Signal Locations Adjoining signage: D-20
 Canada) x Intersection")
176 Municipality: Montreal, Canada Contact: Roger Bibaud Contact Info Phone Agency or Firm Name Rue de la Commune & Rue McGill Design Guidance Used for Cyclist Performance Guide technique Design AASHTO Guide d'aménagement Manual for for the des voies Bicycle Development cyclables Traffic of Bicycle (Transportation (CROW Facilities Association of Dutch Guide) Canada) x Intersection Characteristics # of legs # of Bike signals Crossing Distance for Bike Signal #1 (ft) Crossing Distance for Bike Signal #2 (ft) Field Measurements NACTO Urban Bikeway Design Guide x Signal Characteristics (for both directions of travel) Mounting Lens Housing Operation Near- or Mounting Bike Housing Backplate Far-side? Height 1 Size (in.) Louvers? Detection Type (ft) Insignia? Color Color Both 14 8 Faces left No Black No backplate On recall 1 from ground to bottom of signal housing Motivation for Signal Installation Noncompliance with previous traffic control Contraflow bicycle movement x Unique bicycle path through intersection x Safety concerns Other Signal Timing Bicycle Signal(s) Number of Bikeonly Speeds (ft/s) Assumed Minimum Cyclist Phase Lengths (s) Phases: Standing Start 1 Min. Yellow All-red 1 Green using the equation for standing bicycle crossing time in AASHTO s 2012 Guide D-21


177 Figure 1. Approximate Crossing Distances and Bike Signal Locations Adjoining signage: D-22
 Canada) x Intersection")
178 Municipality: Montreal, Canada Contact: Roger Bibaud Contact Info Phone Agency or Firm Name Park Avenue & Avenue du Parc Design Guidance Used for Cyclist Performance Guide technique Design AASHTO Guide d'aménagement Manual for for the des voies Bicycle Development cyclables Traffic of Bicycle (Transportation (CROW Facilities Association of Dutch Guide) Canada) x Intersection Characteristics Field Measurements NACTO Urban Bikeway Design Guide Crossing Crossing Crossing Crossing Total Crossing # of Distance for Distance for Distance for Distance for Distance # of legs Bike Bike Signal Bike Signal Bike Signal Bike Signal (including signals #1(ft) #2(ft) #3(ft) #4(ft) median, ft) Signal Characteristics (for both directions of travel) Mounting Lens Housing Operation Near- or Mounting Bike Housing Backplate Far-side? Height 1 Size (in.) Louvers? Detection Type (ft) Insignia? Color Color Far * 14 8 Faces left No Black No backplate On recall 1 from ground to bottom of signal housing * on median and far side of intersection for both directions Motivation for Signal Installation Noncompliance with previous traffic control Presence of contra-flow bike lane Unique bicycle path through intersection Safety concerns x x x Left-turn movement from trail to street Signal Timing Bicycle Signal(s) Number of Bikeonly Speeds (ft/s) Assumed Minimum Cyclist Phase Lengths (s) Phases: Standing Start 1 Min. Yellow All-red 0 Green using the equation for standing bicycle crossing time in AASHTO s 2012 Guide x Other New construction opportunity D-23
179 Figure 1. Approximate Crossing Distances and Bike Signal Locations *Signals #1 and #3 face South, signals #2 and #4 face North D-24
180 Adjoining signage: D-25
 Canada) x Intersection")
 #2(ft) #3(ft) #4(ft) median, ft) 4 4 45 45 40 40 95 Signal Characteristics (for both directions of travel) Mounting Lens")

181 Municipality: Montreal, Canada Contact: Roger Bibaud Contact Info Phone Agency or Firm Name Park Avenue & Avenue des Pins Ouest Design Guidance Used for Cyclist Performance Guide technique Design AASHTO Guide d'aménagement Manual for for the des voies Bicycle Development cyclables Traffic of Bicycle (Transportation (CROW Facilities Association of Dutch Guide) Canada) x Intersection Characteristics Field Measurements NACTO Urban Bikeway Design Guide Crossing Crossing Crossing Crossing Total Crossing # of Distance for Distance for Distance for Distance for Distance # of legs Bike Bike Signal Bike Signal Bike Signal Bike Signal (including signals #1(ft) #2(ft) #3(ft) #4(ft) median, ft) Signal Characteristics (for both directions of travel) Mounting Lens Housing Operation Near- or Mounting Bike Housing Backplate Far-side? Height 1 Size (in.) Louvers? Detection Type (ft) Insignia? Color Color Far * 14 8 Faces left No Black No backplate On recall 1 from ground to bottom of signal housing * on median and far side of intersection for both directions Motivation for Signal Installation Noncompliance with previous traffic control Contraflow bicycle movement x Unique bicycle path through intersection Safety concerns x Other New construction opportunity Signal Timing Bicycle Signal(s) Number of Bikeonly Speeds (ft/s) Assumed Minimum Cyclist Phase Lengths (s) Phases: Standing Start 1 Min. Yellow All-red 0 Green using the equation for standing bicycle crossing time in AASHTO s 2012 Guide x D-26


182 Figure 1. Approximate Crossing Distances and Bike Signal Locations D-27
 Canada) x Intersection")
183 Municipality: Montreal, Canada Contact: Roger Bibaud Contact Info Phone Agency or Firm Name Avenue Viger Est & Rue Berri Design Guidance Used for Cyclist Performance Guide technique Design AASHTO Guide d'aménagement Manual for for the des voies Bicycle Development cyclables Traffic of Bicycle (Transportation (CROW Facilities Association of Dutch Guide) Canada) x Intersection Characteristics # of legs # of Bike signals Crossing Distance for Bike Signal #1 (ft) Crossing Distance for Bike Signal #2 (ft) Field Measurements NACTO Urban Bikeway Design Guide x Signal Characteristics (for both directions of travel) Mounting Lens Housing Operation Near- or Mounting Bike Housing Backplate Far-side? Height 1 Size (in.) Louvers? Detection Type (ft) Insignia? Color Color Far 14 8 Faces left No Black No backplate On recall 1 from ground to bottom of signal housing Motivation for Signal Installation Noncompliance with previous traffic control Contraflow bicycle movement x Unique bicycle path through intersection Safety concerns x Other Signal Timing Bicycle Signal(s) Number of Bikeonly Speeds (ft/s) Assumed Minimum Cyclist Phase Lengths (s) Phases: Standing Start 1 Min. Yellow All-red 1 Green using the equation for standing bicycle crossing time in AASHTO s 2012 Guide D-28
184 Figure 1. Approximate Crossing Distances and Bike Signal Locations Adjoining signage: D-29
185 Municipality: Montreal, Canada Contact: Roger Bibaud Contact Info Phone Agency or Firm Name Beaubien & Boyer Design Guidance Used for Cyclist Performance Guide technique Design AASHTO Guide d'aménagement Manual for for the des voies Bicycle Development cyclables Traffic of Bicycle (Transportation (CROW Facilities Association of Dutch Guide) Canada) x Intersection Characteristics # of legs # of Bike signals Crossing Distance for Bike Signal #1 (ft) Crossing Distance for Bike Signal #2 (ft) Field Measurements NACTO Urban Bikeway Design Guide x Signal Characteristics (for both directions of travel) Mounting Lens Housing Operation Near- or Mounting Bike Housing Backplate Far-side? Height 1 Size (in.) Louvers? Detection Type (ft) Insignia? Color Color Far 13 8 Faces left No Black No backplate On recall 1 from ground to bottom of signal housing Motivation for Signal Installation Noncompliance with previous traffic control Contraflow bicycle movement x Unique bicycle path through intersection Safety concerns x Other Demonstration project Signal Timing Bicycle Signal(s) Number of Bikeonly Speeds (ft/s) Assumed Minimum Cyclist Phase Lengths (s) Phases: Standing Start 1 Min. Yellow All-red 1 Green using the equation for standing bicycle crossing time in AASHTO s 2012 Guide D-30


186 Figure 1. Approximate Crossing Distances and Bike Signal Locations Adjoining signage: D-31
187 Municipality: Montreal, Canada Contact: Roger Bibaud Contact Info Phone Agency or Firm Name Belanger & Boyer Design Guidance Used for Cyclist Performance Guide technique Design AASHTO Guide d'aménagement Manual for for the des voies Bicycle Development cyclables Traffic of Bicycle (Transportation (CROW Facilities Association of Dutch Guide) Canada) x Intersection Characteristics # of legs # of Bike signals Crossing Distance for Bike Signal #1 (ft) Crossing Distance for Bike Signal #2 (ft) Field Measurements NACTO Urban Bikeway Design Guide x Signal Characteristics (for both directions of travel) Mounting * Lens Housing Operation Near- or Mounting Bike Housing Backplate Far-side? Height 1 Size (in.) Louvers? Detection Type (ft) Insignia? Color Color Far 13 8 Faces left No Black No backplate On recall 1 from ground to bottom of signal housing Motivation for Signal Installation Noncompliance with previous traffic control Contraflow bicycle movement x Unique bicycle path through intersection Safety concerns x Other Demonstration project Signal Timing Bicycle Signal(s) Number of Bikeonly Speeds (ft/s) Assumed Minimum Cyclist Phase Lengths (s) Phases: Standing Start 1 Min. Yellow All-red 1 Green using the equation for standing bicycle crossing time in AASHTO s 2012 Guide D-32


188 Figure 1. Approximate Crossing Distances and Bike Signal Locations Adjoining signage: D-33
189 Municipality: Montreal, Canada Contact: Roger Bibaud Contact Info Phone Agency or Firm Name Bellechasse & Boyer Design Guidance Used for Cyclist Performance Guide technique Design AASHTO Guide d'aménagement Manual for for the des voies Bicycle Development cyclables Traffic of Bicycle (Transportation (CROW Facilities Association of Dutch Guide) Canada) x Intersection Characteristics # of legs # of Bike signals Crossing Distance for Bike Signal #1 (ft) Crossing Distance for Bike Signal #2 (ft) Field Measurements NACTO Urban Bikeway Design Guide x Signal Characteristics (for both directions of travel) Mounting Lens Housing Operation Near- or Mounting Bike Housing Backplate Far-side? Height 1 Size (in.) Louvers? Detection Type (ft) Insignia? Color Color Far 13 8 Faces left No Black No backplate On recall 1 from ground to bottom of signal housing Motivation for Signal Installation Noncompliance with previous traffic control Contraflow bicycle movement x Unique bicycle path through intersection Safety concerns x Other Demonstration project Signal Timing Bicycle Signal(s) Number of Bikeonly Speeds (ft/s) Assumed Minimum Cyclist Phase Lengths (s) Phases: Standing Start 1 Min. Yellow All-red 1 Green using the equation for standing bicycle crossing time in AASHTO s 2012 Guide D-34
190 Figure 1. Approximate Crossing Distances and Bike Signal Locations Adjoining signage: D-35
191 Municipality: Montreal, Canada Contact: Roger Bibaud Contact Info Phone Agency or Firm Name Jean-Talon & Boyer Design Guidance Used for Cyclist Performance Guide technique Design AASHTO Guide d'aménagement Manual for for the des voies Bicycle Development cyclables Traffic of Bicycle (Transportation (CROW Facilities Association of Dutch Guide) Canada) x Intersection Characteristics # of legs # of Bike signals Crossing Distance for Bike Signal #1 (ft) Crossing Distance for Bike Signal #2 (ft) Field Measurements NACTO Urban Bikeway Design Guide x Signal Characteristics (for both directions of travel) Mounting Lens Housing Operation Near- or Mounting Bike Housing Backplate Far-side? Height 1 Size (in.) Louvers? Detection Type (ft) Insignia? Color Color Far 13 8 Faces left No Black No backplate On recall 1 from ground to bottom of signal housing Motivation for Signal Installation Noncompliance with previous traffic control Contraflow bicycle movement x Unique bicycle path through intersection Safety concerns x Other Demonstration project Signal Timing Bicycle Signal(s) Number of Bikeonly Speeds (ft/s) Assumed Minimum Cyclist Phase Lengths (s) Phases: Standing Start 1 Min. Yellow All-red 1 Green using the equation for standing bicycle crossing time in AASHTO s 2012 Guide D-36


192 Figure 1. Approximate Crossing Distances and Bike Signal Locations Adjoining signage: D-37
193 Municipality: Montreal, Canada Contact: Roger Bibaud Contact Info Phone Agency or Firm Name Rosemont & Boyer Design Guidance Used for Cyclist Performance Guide technique Design AASHTO Guide d'aménagement Manual for for the des voies Bicycle Development cyclables Traffic of Bicycle (Transportation (CROW Facilities Association of Dutch Guide) Canada) x Intersection Characteristics # of legs # of Bike signals Crossing Distance for Bike Signal #1 (ft) Crossing Distance for Bike Signal #2 (ft) Field Measurements NACTO Urban Bikeway Design Guide x Signal Characteristics (for both directions of travel) Mounting Lens Housing Operation Near- or Mounting Bike Housing Backplate Far-side? Height 1 Size (in.) Louvers? Detection Type (ft) Insignia? Color Color Far 13 8 Faces left No Black No backplate On recall 1 from ground to bottom of signal housing Motivation for Signal Installation Noncompliance with previous traffic control Contraflow bicycle movement x Unique bicycle path through intersection Safety concerns x Other Demonstration project Signal Timing Bicycle Signal(s) Number of Bikeonly Speeds (ft/s) Assumed Minimum Cyclist Phase Lengths (s) Phases: Standing Start 1 Min. Yellow All-red 1 Green using the equation for standing bicycle crossing time in AASHTO s 2012 Guide D-38
194 Figure 1. Approximate Crossing Distances and Bike Signal Locations Adjoining signage: D-39
195 Municipality: Montreal, Canada Contact: Roger Bibaud Contact Info Phone Agency or Firm Name Saint-Zotique & Boyer Design Guidance Used for Cyclist Performance Guide technique Design AASHTO Guide d'aménagement Manual for for the des voies Bicycle Development cyclables Traffic of Bicycle (Transportation (CROW Facilities Association of Dutch Guide) Canada) x Intersection Characteristics # of legs # of Bike signals Crossing Distance for Bike Signal #1 (ft) Crossing Distance for Bike Signal #2 (ft) Field Measurements NACTO Urban Bikeway Design Guide x Signal Characteristics (for both directions of travel) Mounting Lens Housing Operation Near- or Mounting Bike Housing Backplate Far-side? Height 1 Size (in.) Louvers? Detection Type (ft) Insignia? Color Color Far 13 8 Faces left No Black No backplate On recall 1 from ground to bottom of signal housing Motivation for Signal Installation Noncompliance with previous traffic control Contraflow bicycle movement x Unique bicycle path through intersection Safety concerns x Other Demonstration project Signal Timing Bicycle Signal(s) Number of Bikeonly Speeds (ft/s) Assumed Minimum Cyclist Phase Lengths (s) Phases: Standing Start 1 Min. Yellow All-red 1 Green using the equation for standing bicycle crossing time in AASHTO s 2012 Guide D-40
196 Figure 1. Approximate Crossing Distances and Bike Signal Locations Adjoining signage: D-41
 Canada) x Intersection Characteristics # of")
 Mounting Lens Housing Operation Near- or Mounting Bike Housing Backplate Far-side? Height 1 Size (in.) Louvers? Detection Type (ft) Insignia?")
 Number of Bikeonly Speeds (ft/s) Assumed Minimum Cyclist")
197 Municipality: Montreal, Canada Contact: Roger Bibaud Contact Info Phone Agency or Firm Name Villeray & Boyer Design Guidance Used for Cyclist Performance Guide technique Design AASHTO Guide d'aménagement Manual for for the des voies Bicycle Development cyclables Traffic of Bicycle (Transportation (CROW Facilities Association of Dutch Guide) Canada) x Intersection Characteristics # of legs # of Bike signals Crossing Distance for Bike Signal #1 (ft) Crossing Distance for Bike Signal #2 (ft) Field Measurements NACTO Urban Bikeway Design Guide x Signal Characteristics (for both directions of travel) Mounting Lens Housing Operation Near- or Mounting Bike Housing Backplate Far-side? Height 1 Size (in.) Louvers? Detection Type (ft) Insignia? Color Color Far 13 8 Faces left No Black No backplate On recall 1 from ground to bottom of signal housing Motivation for Signal Installation Noncompliance with previous traffic control Contraflow bicycle movement x Unique bicycle path through intersection Safety concerns x Other Demonstration project Signal Timing Bicycle Signal(s) Number of Bikeonly Speeds (ft/s) Assumed Minimum Cyclist Phase Lengths (s) Phases: Standing Start 1 Min. Yellow All-red 1 Green using the equation for standing bicycle crossing time in AASHTO s 2012 Guide D-42
198 Figure 1. Approximate Crossing Distances and Bike Signal Locations Adjoining signage: D-43
 Canada) Intersection")
199 Municipality: Contact: Contact Info Portland, OR Peter Koonce Phone Agency or Firm Name NE 22 nd Avenue & Sandy Boulevard Design Guidance Used for Cyclist Performance Guide technique Design AASHTO Guide d'aménagement Manual for for the des voies Bicycle Development cyclables Traffic of Bicycle (Transportation (CROW Facilities Association of Dutch Guide) Canada) Intersection Characteristics # of legs # of Bike signals Crossing Distance for Bike Signal #1 (ft) Field Measurements x NACTO Urban Bikeway Design Guide Signal Characteristics Mounting Lens Housing Operation Near- or Mounting Housing Backplate Detection Far-side? Height 1 Size (in.) Bike Insignia? Louvers? (ft) Color Color Type Far 19 8 Faces No Black Black Loop 1 from ground to bottom of signal housing Motivation for Signal Installation Noncompliance with previous traffic control Contraflow bicycle movement x Unique bicycle path through intersection Safety concerns Other Signal Timing Bicycle Signal(s) Number of Bikeonly Speeds (ft/s) Assumed Minimum Cyclist Phase Lengths (s) Phases: Standing Start 1 Min. Yellow All-red 1 Green using the equation for standing bicycle crossing time in AASHTO s 2012 Guide D-44
200 Figure 1. Approximate Crossing Distances and Bike Signal Locations Adjoining Signage: D-45
 Canada) Intersection Characteristics #")
201 Municipality: Contact: Contact Info Portland, OR Peter Koonce Phone Agency or Firm Name Rosa Parks Way & Interstate 5 Design Guidance Used for Cyclist Performance Guide technique Design AASHTO Guide d'aménagement Manual for for the des voies Bicycle Development cyclables Traffic of Bicycle (Transportation (CROW Facilities Association of Dutch Guide) Canada) Intersection Characteristics # of legs # of Bike signals Crossing Distance for Bike Signals #1 & #2 (ft) Field Measurements x NACTO Urban Bikeway Design Guide Signal Characteristics Mounting Lens Housing Operation Near- or Mounting Size Housing Detection Far-side? Height 1 Bike Insignia? Louvers? (ft) (in.) Color Backplate Color Type Both 1 from ground to bottom of signal housing Motivation for Signal Installation Noncompliance with previous traffic control Contraflow bicycle movement N = Faces Left F = Faces Left Unique bicycle path through intersection Safety concerns x N = Yes F = Yes N = Black F = Black Other Signal Timing Bicycle Signal(s) Number of Bikeonly Speeds (ft/s) Assumed Minimum Cyclist Phase Lengths (s) Phases: Standing Start 1 Min. Yellow All-red 0 Green using the equation for standing bicycle crossing time in AASHTO s 2012 Guide N = No Backplate F = Black Loop D-46
202 Figure 1. Approximate Crossing Distances and Bike Signal Locations Adjoining Signage: D-47
 Canada) Intersection Characteristics #")
203 Municipality: Contact: Contact Info Portland, OR Peter Koonce Phone Agency or Firm Name 57 th Avenue & Sandy Blvd Design Guidance Used for Cyclist Performance Guide technique Design AASHTO Guide d'aménagement Manual for for the des voies Bicycle Development cyclables Traffic of Bicycle (Transportation (CROW Facilities Association of Dutch Guide) Canada) Intersection Characteristics # of legs # of Bike signals Crossing Distance for Bike Signal #1 (ft) Field Measurements x NACTO Urban Bikeway Design Guide Signal Characteristics Mounting Lens Housing Operation Near- or Mounting Housing Backplate Detection Far-side? Height 1 Size (in.) Bike Insignia? Louvers? (ft) Color Color Type Far 8 Left No Black No Backplate Push-button 1 from ground to bottom of signal housing Motivation for Signal Installation Noncompliance with previous traffic control Contraflow bicycle movement Unique bicycle path through intersection x Safety concerns Other Signal Timing Bicycle Signal(s) Number of Bikeonly Speeds (ft/s) Assumed Minimum Cyclist Phase Lengths (s) Phases: Standing Start 1 Min. Yellow All-red 1 Green using the equation for standing bicycle crossing time in AASHTO s 2012 Guide D-48
204 Figure 1. Approximate Crossing Distances and Bike Signal Locations Adjoining Signage: D-49
 Canada) Intersection")
205 Municipality: Contact: Contact Info Portland, OR Peter Koonce Phone Agency or Firm Name SE 87th Avenue & SE Division Street Design Guidance Used for Cyclist Performance Guide technique Design AASHTO Guide d'aménagement Manual for for the des voies Bicycle Development cyclables Traffic of Bicycle (Transportation (CROW Facilities Association of Dutch Guide) Canada) Intersection Characteristics Crossing Crossing # of Distance for Distance for # of legs Bike Bike Signal Bike Signal signals #1(ft) #2(ft) Field Measurements x NACTO Urban Bikeway Design Guide Signal Characteristics (for both directions of travel) Mounting Lens Housing Operation Near- or Mounting Housing Backplate Detection Far-side? Height 1 Size (in.) Bike Insignia? Louvers? (ft) Color Color Type Far 12 None Yes * Push-button & Black No Backplate Loop 1 from ground to bottom of signal housing *for SB signal head only Motivation for Signal Installation Noncompliance with previous traffic control Contraflow bicycle movement Unique bicycle path through intersection Safety concerns x Other Signal Timing Bicycle Signal(s) Number of Bikeonly Speeds (ft/s) Assumed Minimum Cyclist Phase Lengths (s) Phases: Standing Start 1 Min. Yellow All-red 1 Green using the equation for standing bicycle crossing time in AASHTO s 2012 Guide D-50
206 Figure 1. Approximate Crossing Distances and Bike Signal Locations Adjoining Signage: D-51
 Canada) Intersection")
207 Municipality: Contact: Contact Info Portland, OR Peter Koonce Phone Agency or Firm Name Broadway and NW Lovejoy Street Design Guidance Used for Cyclist Performance Guide technique Design AASHTO Guide d'aménagement Manual for for the des voies Bicycle Development cyclables Traffic of Bicycle (Transportation (CROW Facilities Association of Dutch Guide) Canada) Intersection Characteristics # of legs # of Bike signals Crossing Distance for Bike Signal #1 (ft) Field Measurements x NACTO Urban Bikeway Design Guide Signal Characteristics Mounting Lens Housing Operation Near- or Mounting Bike Housing Backplate Detection Far-side? Height 1 Size (in.) Louvers? (ft) Insignia? Color Color Type Far 12 Faces left Yes Black Black Video 1 from ground to bottom of signal housing Motivation for Signal Installation Noncompliance with previous traffic control Contraflow bicycle movement Unique bicycle path through intersection Safety concerns x Other Signal Timing Bicycle Signal(s) Number of Bikeonly Speeds (ft/s) Assumed Minimum Cyclist Phase Lengths (s) Phases: Standing Start 1 Min. Yellow All-red 0 Green using the equation for standing bicycle crossing time in AASHTO s 2012 Guide D-52

208 Figure 1. Approximate Crossing Distances and Bike Signal Locations Adjoining Signage: D-53
 Canada) Intersection")
209 Municipality: Contact: Contact Info Portland, OR Peter Koonce Phone Agency or Firm Name NE Broadway and NE Victoria Avenue Design Guidance Used for Cyclist Performance Guide technique Design AASHTO Guide d'aménagement Manual for for the des voies Bicycle Development cyclables Traffic of Bicycle (Transportation (CROW Facilities Association of Dutch Guide) Canada) Intersection Characteristics # of legs # of Bike signals Crossing Distance for Bike Signal #1 (ft) Field Measurements x NACTO Urban Bikeway Design Guide Signal Characteristics Mounting Lens Housing Operation Near- or Mounting Housing Backplate Detection Far-side? Height 1 Size (in.) Bike Insignia? Louvers? (ft) Color Color Type Far Faces right Yes Yellow Yellow Loop 1 from ground to bottom of signal housing Motivation for Signal Installation Noncompliance with previous traffic control Contraflow bicycle movement Unique bicycle path through intersection Safety concerns Other experimental Signal Timing Bicycle Signal(s) Number of Bikeonly Speeds (ft/s) Assumed Minimum Cyclist Phase Lengths (s) Phases: Leading Standing Start 1 Min. Yellow All-red Green interval using the equation for standing bicycle crossing time in AASHTO s 2012 Guide D-54
210 Figure 1. Approximate Crossing Distances and Bike Signal Locations Adjoining Signage: D-55
 Canada) Intersection")
211 Municipality: Contact: Contact Info Portland, OR Peter Koonce Phone Agency or Firm Name NE Broadway and N Williams Avenue Design Guidance Used for Cyclist Performance Guide technique Design AASHTO Guide d'aménagement Manual for for the des voies Bicycle Development cyclables Traffic of Bicycle (Transportation (CROW Facilities Association of Dutch Guide) Canada) Intersection Characteristics # of legs # of Bike signals Crossing Distance for Bike Signal #1 (ft) Crossing Distance for Bike Signal #2 (ft) Field Measurements x NACTO Urban Bikeway Design Guide Signal Characteristics Mounting Lens Housing Operation Near- or Mounting Housing Backplate Detection Far-side? Height 1 Size (in.) Bike Insignia? Louvers? (ft) Color Color Type Both N = 9.5 N = 8 N = Faces left N = No N = Black N = Black Push button & F = F = 12 F = Faces left F = Yes F = Yellow F = Black Loop 1 from ground to bottom of signal housing Motivation for Signal Installation Noncompliance with previous traffic control Contraflow bicycle movement Unique bicycle path through intersection Safety concerns x Other Signal Timing Bicycle Signal(s) Number of Bikeonly Speeds (ft/s) Assumed Minimum Cyclist Phase Lengths (s) Phases: Standing Start 1 Min. Yellow All-red 0 Green using the equation for standing bicycle crossing time in AASHTO s 2012 Guide D-56


212 Figure 1. Approximate Crossing Distances and Bike Signal Locations Adjoining Signage: D-57
 Canada) Intersection")
213 Municipality: Contact: Contact Info Portland, OR Peter Koonce Phone Agency or Firm Name N Interstate Avenue & NE Oregon Street Design Guidance Used for Cyclist Performance Guide technique Design AASHTO Guide d'aménagement Manual for for the des voies Bicycle Development cyclables Traffic of Bicycle (Transportation (CROW Facilities Association of Dutch Guide) Canada) Intersection Characteristics # of legs # of Bike signals Crossing Distance for Bike Signal #1 (ft) 5 * 1 80 * including bike trail from East bank esplanade Field Measurements x NACTO Urban Bikeway Design Guide Signal Characteristics Mounting Lens Housing Operation Near- or Mounting Housing Backplate Detection Far-side? Height 1 Size (in.) Bike Insignia? Louvers? (ft) Color Color Type Far Faces left No Black No backplate Loop 1 from ground to bottom of signal housing Motivation for Signal Installation Noncompliance with previous traffic control Contraflow bicycle movement Unique bicycle path through intersection x Safety concerns Other Signal Timing Bicycle Signal(s) Number of Bikeonly Speeds (ft/s) Assumed Minimum Cyclist Phase Lengths (s) Phases: Standing Start 1 Min. Yellow All-red 1 Green using the equation for standing bicycle crossing time in AASHTO s 2012 Guide D-58


214 Figure 1. Approximate Crossing Distances and Bike Signal Locations Adjoining Signage: D-59
 Canada) Intersection")
215 Municipality: Contact: Contact Info Portland, OR Peter Koonce Phone Agency or Firm Name SW Moody Avenue & SW Gibbs Street Design Guidance Used for Cyclist Performance Guide technique Design AASHTO Guide d'aménagement Manual for for the des voies Bicycle Development cyclables Traffic of Bicycle (Transportation (CROW Facilities Association of Dutch Guide) Canada) Intersection Characteristics # of legs # of Bike signals Crossing Distance for Bike Signal #1 (ft) 4 * 4 30 * including bike lanes crossing Moody to OHSU campus Field Measurements x NACTO Urban Bikeway Design Guide Signal Characteristics (for both directions of travel) Mounting Lens Housing Operation Near- or Far-side? Mounting Height 1 (ft) Size (in.) N = 5 N = 4X4.5 (square) Both F = 10.8 F = 12 1 from ground to bottom of signal housing Motivation for Signal Installation Noncompliance with previous traffic control Contraflow bicycle movement Unique bicycle path through intersection x Bike Insignia? None Safety concerns Louvers? No Other Housing Color N = Black F = Black Complicated crossing with pedestrians and streetcar Signal Timing Bicycle Signal(s) Number of Bikeonly Speeds (ft/s) Assumed Minimum Cyclist Phase Lengths (s) Phases: Standing Start 1 Min. Yellow All-red 1 Green using the equation for standing bicycle crossing time in AASHTO s 2012 Guide Backplate Color N = No backplate F = Black Detection Type Push button & Loop D-60


216 Figure 1. Approximate Crossing Distances and Bike Signal Locations * * Bicycle infrastructure not shown Adjoining Signage: Current Bicycle Infrastructure: D-61
 Canada) Intersection")
217 Municipality: Contact: Contact Info Portland, OR Peter Koonce Phone Agency or Firm Name SW Moody Avenue & SW Sheridan Street Design Guidance Used for Cyclist Performance Guide technique Design AASHTO Guide d'aménagement Manual for for the des voies Bicycle Development cyclables Traffic of Bicycle (Transportation (CROW Facilities Association of Dutch Guide) Canada) Intersection Characteristics # of legs # of Bike signals 3 1 Crossing Distance for Bike Signal #1 (ft) Field Measurements x NACTO Urban Bikeway Design Guide Signal Characteristics (for both directions of travel) Mounting Lens Housing Operation Near- or Far-side? Mounting Height 1 (ft) Size (in.) Bike Insignia? Louvers? Housing Color Backplate Color Both Faces right No Black Black 1 from ground to bottom of signal housing Detection Type Push button & Loop Motivation for Signal Installation Noncompliance with previous traffic control Contraflow bicycle movement Unique bicycle path through intersection x Safety concerns Left-turn movement from trail to street Signal Timing Bicycle Signal(s) Number of Bikeonly Speeds (ft/s) Assumed Minimum Cyclist Phase Lengths (s) Phases: Standing Start 1 Min. Yellow All-red 1 Green using the equation for standing bicycle crossing time in AASHTO s 2012 Guide Other D-62


218 Figure 1. Approximate Crossing Distances and Bike Signal Locations Crossing Distance Picture Unavailable Adjoining Signage: Current Bicycle Infrastructure: D-63

219 Municipality: San Francisco, CA Contact: Damon R. Curtis Contact Info Phone Agency or Firm Name Fell Street & Masonic Avenue Design Guidance Used for Cyclist Performance Guide technique Design AASHTO Guide d'aménagement Manual for for the des voies Bicycle Development cyclables Traffic of Bicycle (Transportation (CROW Facilities Association of Dutch Guide) Canada) x Intersection Characteristics Field Measurements NACTO Urban Bikeway Design Guide Crossing Crossing Crossing Crossing # of Distance for Distance for Distance for Distance for # of legs Bike Bike Signal Bike Signal Bike Signal Bike Signal signals #1(ft) #2(ft) #4(ft) #4(ft) Signal Characteristics (for both directions of travel) Mounting Lens Housing Operation Near- or Mounting Bike Housing Backplate Detection Far-side? Height 1 Size (in.) Louvers? (ft) Insignia? Color Color Type Both 7 12 Faces left Yes Dark Green No backplate On recall 1 from ground to bottom of signal housing Motivation for Signal Installation Noncompliance with previous traffic control Contraflow bicycle movement Unique bicycle path through intersection Safety concerns x Other Signal Timing Bicycle Signal(s) Number of Bikeonly Speeds (ft/s) Assumed Minimum Cyclist Phase Lengths (s) Phases: Standing Start 1 Min. Yellow All-red 1 Green using the equation for standing bicycle crossing time in AASHTO s 2012 Guide D-64

220 Figure 1. Approximate Crossing Distances and Bike Signal Locations Adjoining signage: with "Bike Signal Ahead" placard D-65

 Crossing Distance for Bike Signal #2 (ft) 4 2 90 75 Field Measurements NACTO Urban Bikeway Design Guide Signal Characteristics (for both directions of travel)")

221 Municipality: San Francisco, CA Contact: Damon R. Curtis Contact Info Phone Agency or Firm Name Fell Street & Shrader Street Design Guidance Used for Cyclist Performance Guide technique Design AASHTO Guide d'aménagement Manual for for the des voies Bicycle Development cyclables Traffic of Bicycle (Transportation (CROW Facilities Association of Dutch Guide) Canada) x Intersection Characteristics # of legs # of Bike signals Crossing Distance for Bike Signal #1 (ft) Crossing Distance for Bike Signal #2 (ft) Field Measurements NACTO Urban Bikeway Design Guide Signal Characteristics (for both directions of travel) Mounting Lens Housing Operation Near- or Mounting Bike Housing Backplate Detection Far-side? Height 1 Size (in.) Louvers? (ft) Insignia? Color Color Type Far 7 12 Faces left Yes Dark Green No backplate On recall 1 from ground to bottom of signal housing Motivation for Signal Installation Noncompliance with previous traffic control Contraflow bicycle movement Unique bicycle path through intersection x Safety concerns Other Signal Timing Bicycle Signal(s) Number of Bikeonly Speeds (ft/s) Assumed Minimum Cyclist Phase Lengths (s) Phases: Standing Start 1 Min. Yellow All-red 1 Green using the equation for standing bicycle crossing time in AASHTO s 2012 Guide D-66
222 Figure 1. Approximate Crossing Distances and Bike Signal Locations D-67

223 Municipality: San Francisco, CA Contact: Damon R. Curtis Contact Info Phone Agency or Firm Name Page Street & Stanyan Street Design Guidance Used for Cyclist Performance Guide technique Design AASHTO Guide d'aménagement Manual for for the des voies Bicycle Development cyclables Traffic of Bicycle (Transportation (CROW Facilities Association of Dutch Guide) Canada) x Intersection Characteristics # of legs # of Bike signals Crossing Distance for Bike Signal #1 (ft) Crossing Distance for Bike Signal #2 (ft) 4 * * including trail from Golden Gate Park Field Measurements NACTO Urban Bikeway Design Guide Signal Characteristics (for both directions of travel) Mounting Lens Housing Operation Near- or Mounting Bike Housing Backplate Detection Far-side? Height 1 Size (in.) Louvers? (ft) Insignia? Color Color Type Far 7 12 Faces left No Dark Green No backplate On recall 1 from ground to bottom of signal housing Motivation for Signal Installation Noncompliance with previous traffic control Contraflow bicycle movement Unique bicycle path through intersection x Safety concerns Other New signal construction Signal Timing Bicycle Signal(s) Number of Bikeonly Speeds (ft/s) Assumed Minimum Cyclist Phase Lengths (s) Phases: Standing Start 1 Min. Yellow All-red 1 Green using the equation for standing bicycle crossing time in AASHTO s 2012 Guide D-68
224 Figure 1. Approximate Crossing Distances and Bike Signal Locations D-69
225 Municipality: Washington D.C. Contact: William Schultheiss Contact Info Phone Agency or Firm Name 15 th Street NW & E Street NW Design Guidance Used for Cyclist Performance Bicycle Design AASHTO Guide Transportation: A Manual for for the Handbook for Bicycle Development Cycling Traffic of Bicycle Transportation (CROW Facilities Engineers Dutch Guide) (Forester) x Intersection Characteristics # of legs # of Bike signals Crossing Distance for Bike Signal #1 (ft) Crossing Distance for Bike Signal #2 (ft) Field Measurements x NACTO Urban Bikeway Design Guide Signal Characteristics (for both directions of travel) Mounting Lens Housing Operation Near- or Mounting Bike Housing Backplate Far-side? Height 1 Size (in.) Louvers? Detection Type (ft) Insignia? Color Color Far Faces right No Black No backplate On recall 1 from ground to bottom of signal housing Motivation for Signal Installation Noncompliance with previous traffic control Contraflow bicycle movement x Unique bicycle path through intersection Signal Timing Bicycle Signal(s) Number of Bikeonly Speeds (ft/s) Assumed Minimum Cyclist Phases: Standing Start 1 x Safety concerns Other Phase Lengths (s) Green Yellow All-red 1 using the equation for standing bicycle crossing time in AASHTO s 2012 Guide D-70
226 ~ Figure 1. Approximate Crossing Distances and Bike Signal Locations (does not show bike infrastructure) Figure 2. Bicycle Pavement Markings D-71
227 Adjoining signage: D-72

228 Municipality: Washington D.C. Contact: William Schultheiss Contact Info Phone Agency or Firm Name 16 th, U, New Hampshire Design Guidance Used for Cyclist Performance Guide technique Design AASHTO Guide d'aménagement Manual for for the des voies Bicycle Development cyclables Traffic of Bicycle (Transportation (CROW Facilities Association of Dutch Guide) Canada) x Intersection Characteristics # of legs # of Bike signals Crossing Distance from Bike Signal #1 to #2 (ft) Crossing Distance from Bike Signal #3 to #4 (ft) Field Measurements x NACTO Urban Bikeway Design Guide Signal Characteristics (for both directions of travel) Mounting Lens Housing Operation Near- or Mounting Bike Housing Backplate Far-side? Height 1 Size (in.) Louvers? Detection Type (ft) Insignia? Color Color Both 10 Faces right No Black No backplate Loop 1 from ground to bottom of signal housing Motivation for Signal Installation Noncompliance with previous traffic control Contraflow bicycle movement x Unique bicycle path through intersection x Safety concerns Other Signal Timing Bicycle Signal(s) Number of Bikeonly Speeds (ft/s) Assumed Minimum Cyclist Phase Lengths (s) Phases: Standing Start 1 Green Yellow All-red using the equation for standing bicycle crossing time in AASHTO s 2012 Guide D-73

229 Figure 1. Signal Timing Plan Figure 2. Approximate Crossing Distances and Bike Signal Locations D-74


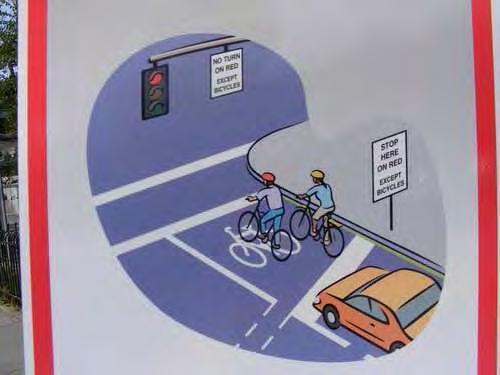
230 Adjoining signage: D-75
 Canada) Field Measurements")
231 Municipality: Contact: Contact Info Vancouver, BC, Canada Winston Chou Phone Agency or Firm Name Hornby Street and Smithe Street Design Guidance Used for Cyclist Performance Guide technique Design AASHTO Guide d'aménagement Manual for for the des voies Bicycle Development cyclables Traffic of Bicycle (Transportation (CROW Facilities Association of Dutch Guide) Canada) Field Measurements NACTO Urban Bikeway Design Guide Intersection Characteristics # of legs # of Bike signals Crossing Distance for cycletrack (ft) Signal Characteristics (for both directions of travel) Mounting Lens Housing Operation Near- or Mounting Housing Backplate Detection Far-side? Height 1 Size (in.) Bike Insignia? Louvers? (ft) Color Color Type Both 10 8 Faces left * no Yellow none On recall 1 from ground to bottom of signal housing * present for contra-flow signals only Motivation for Signal Installation Noncompliance with previous traffic control Contraflow bicycle movement x Unique bicycle path through intersection Signal Timing Bicycle Signal(s) Number of Bikeonly Speeds (ft/s) Assumed Minimum Cyclist Phases: 0 Standing Start 1 Safety concerns Min. Green Phase Lengths (s) Other Yellow All-red 1 using the equation for standing bicycle crossing time in AASHTO s 2012 Guide D-76
232 Figure 1. Approximate Crossing Distances and Bike Signal Locations D-77
 Canada) Field Measurements")
233 Municipality: Contact: Contact Info Vancouver, BC, Canada Winston Chou Phone Agency or Firm Name Hornby Street and Robson Street Design Guidance Used for Cyclist Performance Guide technique Design AASHTO Guide d'aménagement Manual for for the des voies Bicycle Development cyclables Traffic of Bicycle (Transportation (CROW Facilities Association of Dutch Guide) Canada) Field Measurements NACTO Urban Bikeway Design Guide Intersection Characteristics # of legs # of Bike signals Crossing Distance for cycletrack (ft) Signal Characteristics (for both directions of travel) Mounting Lens Housing Operation Near- or Mounting Housing Backplate Detection Far-side? Height 1 Size (in.) Bike Insignia? Louvers? (ft) Color Color Type Both 10 8 Faces left * no Yellow none On recall 1 from ground to bottom of signal housing * present for contra-flow signals only Motivation for Signal Installation Noncompliance with previous traffic control Contraflow bicycle movement x Unique bicycle path through intersection Signal Timing Bicycle Signal(s) Number of Bikeonly Speeds (ft/s) Assumed Minimum Cyclist Phases: 0 Standing Start 1 Safety concerns Min. Green Phase Lengths (s) Other Yellow All-red 1 using the equation for standing bicycle crossing time in AASHTO s 2012 Guide D-78
234 Figure 1. Approximate Crossing Distances and Bike Signal Locations D-79
 Canada) Field Measurements")
235 Municipality: Contact: Contact Info Vancouver, BC, Canada Winston Chou Phone Agency or Firm Name Hornby Street and W Pender Street Design Guidance Used for Cyclist Performance Guide technique Design AASHTO Guide d'aménagement Manual for for the des voies Bicycle Development cyclables Traffic of Bicycle (Transportation (CROW Facilities Association of Dutch Guide) Canada) Field Measurements NACTO Urban Bikeway Design Guide Intersection Characteristics # of legs # of Bike signals Crossing Distance for cycletrack (ft) Signal Characteristics (for both directions of travel) Mounting Lens Housing Operation Near- or Mounting Housing Backplate Detection Far-side? Height 1 Size (in.) Bike Insignia? Louvers? (ft) Color Color Type Both 10 8 Faces left no Yellow none On recall 1 from ground to bottom of signal housing Motivation for Signal Installation Noncompliance with previous traffic control Contraflow bicycle movement x Unique bicycle path through intersection Signal Timing Bicycle Signal(s) Number of Bikeonly Speeds (ft/s) Assumed Minimum Cyclist Phases: 0 Standing Start 1 Safety concerns Min. Green Phase Lengths (s) Other Yellow All-red 1 using the equation for standing bicycle crossing time in AASHTO s 2012 Guide D-80
236 Figure 1. Approximate Crossing Distances and Bike Signal Locations D-81
237 Municipality: Contact: Contact Info Vancouver, BC, Canada Winston Chou Phone Agency or Firm Name Hornby Street and Pacific Street Design Guidance Used for Cyclist Performance Guide technique Design AASHTO Guide d'aménagement Manual for for the des voies Bicycle Development cyclables Traffic of Bicycle (Transportation (CROW Facilities Association of Dutch Guide) Canada) Field Measurements NACTO Urban Bikeway Design Guide Intersection Characteristics # of legs # of Bike signals Crossing Distance for cycletrack (ft) Signal Characteristics (for both directions of travel) Mounting Lens Housing Operation Near- or Mounting Housing Backplate Detection Far-side? Height 1 Size (in.) Bike Insignia? Louvers? (ft) Color Color Type Both 10 8 Faces left * no Yellow none On recall 1 from ground to bottom of signal housing * present for contra-flow signals only Motivation for Signal Installation Noncompliance with previous traffic control Contraflow bicycle movement x Unique bicycle path through intersection Signal Timing Bicycle Signal(s) Number of Bikeonly Speeds (ft/s) Assumed Minimum Cyclist Phases: 0 Standing Start 1 Safety concerns Min. Green Phase Lengths (s) Other Yellow All-red 1 using the equation for standing bicycle crossing time in AASHTO s 2012 Guide D-82
238 Figure 1. Approximate Crossing Distances and Bike Signal Locations D-83
239 Municipality: Contact: Contact Info Vancouver, BC, Canada Winston Chou Phone Agency or Firm Name Hornby Street and Nelson Street Design Guidance Used for Cyclist Performance Guide technique Design AASHTO Guide d'aménagement Manual for for the des voies Bicycle Development cyclables Traffic of Bicycle (Transportation (CROW Facilities Association of Dutch Guide) Canada) Field Measurements NACTO Urban Bikeway Design Guide Intersection Characteristics # of legs # of Bike signals Crossing Distance for cycletrack (ft) Signal Characteristics (for both directions of travel) Mounting Lens Housing Operation Near- or Mounting Housing Backplate Detection Far-side? Height 1 Size (in.) Bike Insignia? Louvers? (ft) Color Color Type Both 10 8 Faces left no Yellow none On recall 1 from ground to bottom of signal housing Motivation for Signal Installation Noncompliance with previous traffic control Contraflow bicycle movement x Unique bicycle path through intersection Signal Timing Bicycle Signal(s) Number of Bikeonly Speeds (ft/s) Assumed Minimum Cyclist Phases: 0 Standing Start 1 Safety concerns Min. Green Phase Lengths (s) Other Yellow All-red 1 using the equation for standing bicycle crossing time in AASHTO s 2012 Guide D-84
240 Figure 1. Approximate Crossing Distances and Bike Signal Locations D-85
241 Municipality: Contact: Contact Info Vancouver, BC, Canada Winston Chou Phone Agency or Firm Name Hornby Street and Helmcken Street Design Guidance Used for Cyclist Performance Guide technique Design AASHTO Guide d'aménagement Manual for for the des voies Bicycle Development cyclables Traffic of Bicycle (Transportation (CROW Facilities Association of Dutch Guide) Canada) Field Measurements NACTO Urban Bikeway Design Guide Intersection Characteristics # of legs # of Bike signals Crossing Distance for cycletrack (ft) Signal Characteristics (for both directions of travel) Mounting Lens Housing Operation Near- or Mounting Housing Backplate Detection Far-side? Height 1 Size (in.) Bike Insignia? Louvers? (ft) Color Color Type Both 10 8 Faces left * no Yellow none On recall 1 from ground to bottom of signal housing * present for contra-flow signals only Motivation for Signal Installation Noncompliance with previous traffic control Contraflow bicycle movement x Unique bicycle path through intersection Signal Timing Bicycle Signal(s) Number of Bikeonly Speeds (ft/s) Assumed Minimum Cyclist Phases: 0 Standing Start 1 Safety concerns Min. Green Phase Lengths (s) Other Yellow All-red 1 using the equation for standing bicycle crossing time in AASHTO s 2012 Guide D-86
242 Figure 1. Approximate Crossing Distances and Bike Signal Locations D-87
 Canada) Field")
243 Municipality: Contact: Contact Info Vancouver, BC, Canada Winston Chou Phone Agency or Firm Name Hornby Street and W Hastings Street Design Guidance Used for Cyclist Performance Guide technique Design AASHTO Guide d'aménagement Manual for for the des voies Bicycle Development cyclables Traffic of Bicycle (Transportation (CROW Facilities Association of Dutch Guide) Canada) Field Measurements NACTO Urban Bikeway Design Guide Intersection Characteristics # of legs # of Bike signals Crossing Distance for cycletrack (ft) Signal Characteristics (for both directions of travel) Mounting Lens Housing Operation Near- or Mounting Housing Backplate Detection Far-side? Height 1 Size (in.) Bike Insignia? Louvers? (ft) Color Color Type Both 10 & 14 8 & 12 2 Faces left no 1 from ground to bottom of signal housing 2 lenses in yellow housings = 8, black housings = 12 Motivation for Signal Installation Noncompliance with previous traffic control Contraflow bicycle movement x Unique bicycle path through intersection Signal Timing Bicycle Signal(s) Number of Bikeonly Speeds (ft/s) Assumed Minimum Cyclist Phases: 0 Standing Start 1 x Safety concerns Min. Green Phase Lengths (s) Black & Yellow Other Yellow All-red 1 using the equation for standing bicycle crossing time in AASHTO s 2012 Guide none On recall D-88
244 Figure 1. Approximate Crossing Distances and Bike Signal Locations (Bicycle Infrastructure not shown) D-89
 Canada) Field Measurements")
245 Municipality: Contact: Contact Info Vancouver, BC, Canada Winston Chou Phone Agency or Firm Name Hornby Street and W Georgia Street Design Guidance Used for Cyclist Performance Guide technique Design AASHTO Guide d'aménagement Manual for for the des voies Bicycle Development cyclables Traffic of Bicycle (Transportation (CROW Facilities Association of Dutch Guide) Canada) Field Measurements NACTO Urban Bikeway Design Guide Intersection Characteristics # of legs # of Bike signals Crossing Distance for cycletrack (ft) Signal Characteristics (for both directions of travel) Mounting Lens Housing Operation Near- or Mounting Housing Backplate Detection Far-side? Height 1 Size (in.) Bike Insignia? Louvers? (ft) Color Color Type Both 10 8 Faces left no Yellow none On recall 1 from ground to bottom of signal housing Motivation for Signal Installation Noncompliance with previous traffic control Contraflow bicycle movement x Unique bicycle path through intersection Signal Timing Bicycle Signal(s) Number of Bikeonly Speeds (ft/s) Assumed Minimum Cyclist Phases: 0 Standing Start 1 Safety concerns Min. Green Phase Lengths (s) Other Yellow All-red 1 using the equation for standing bicycle crossing time in AASHTO s 2012 Guide D-90
246 Figure 1. Approximate Crossing Distances and Bike Signal Locations D-91
247 Municipality: Contact: Contact Info Vancouver, BC, Canada Winston Chou Phone Agency or Firm Name Hornby Street and Dunsmuir Street Design Guidance Used for Cyclist Performance Guide technique Design AASHTO Guide d'aménagement Manual for for the des voies Bicycle Development cyclables Traffic of Bicycle (Transportation (CROW Facilities Association of Dutch Guide) Canada) Field Measurements NACTO Urban Bikeway Design Guide Intersection Characteristics # of legs # of Bike signals Crossing Distance for cycletrack (ft) Signal Characteristics (for both directions of travel) Mounting Lens Housing Operation Near- or Mounting Housing Backplate Detection Far-side? Height 1 Size (in.) Bike Insignia? Louvers? (ft) Color Color Type Both 10 8 Faces left * no Yellow none On recall 1 from ground to bottom of signal housing * present for contra-flow signals only Motivation for Signal Installation Noncompliance with previous traffic control Contraflow bicycle movement x Unique bicycle path through intersection Signal Timing Bicycle Signal(s) Number of Bikeonly Speeds (ft/s) Assumed Minimum Cyclist Phases: 0 Standing Start 1 Safety concerns Min. Green Phase Lengths (s) Other Yellow All-red 1 using the equation for standing bicycle crossing time in AASHTO s 2012 Guide D-92
248 Figure 1. Approximate Crossing Distances and Bike Signal Locations D-93
249 Municipality: Contact: Contact Info Vancouver, BC, Canada Winston Chou Phone Agency or Firm Name Hornby Street and Drake Street Design Guidance Used for Cyclist Performance Guide technique Design AASHTO Guide d'aménagement Manual for for the des voies Bicycle Development cyclables Traffic of Bicycle (Transportation (CROW Facilities Association of Dutch Guide) Canada) Field Measurements NACTO Urban Bikeway Design Guide Intersection Characteristics # of legs # of Bike signals Crossing Distance for cycletrack (ft) Signal Characteristics (for both directions of travel) Mounting Lens Housing Operation Near- or Mounting Housing Backplate Detection Far-side? Height 1 Size (in.) Bike Insignia? Louvers? (ft) Color Color Type Both 10 8 Faces left * no Yellow none On recall 1 from ground to bottom of signal housing * present for contra-flow signals only Motivation for Signal Installation Noncompliance with previous traffic control Contraflow bicycle movement x Unique bicycle path through intersection Signal Timing Bicycle Signal(s) Number of Bikeonly Speeds (ft/s) Assumed Minimum Cyclist Phases: 0 Standing Start 1 Safety concerns Min. Green Phase Lengths (s) Other Yellow All-red 1 using the equation for standing bicycle crossing time in AASHTO s 2012 Guide D-94
250 Figure 1. Approximate Crossing Distances and Bike Signal Locations D-95
251 Municipality: Contact: Contact Info Vancouver, BC, Canada Winston Chou Phone Agency or Firm Name Hornby Street and Davie Street Design Guidance Used for Cyclist Performance Guide technique Design AASHTO Guide d'aménagement Manual for for the des voies Bicycle Development cyclables Traffic of Bicycle (Transportation (CROW Facilities Association of Dutch Guide) Canada) Field Measurements NACTO Urban Bikeway Design Guide Intersection Characteristics # of legs # of Bike signals Crossing Distance for cycletrack (ft) Signal Characteristics (for both directions of travel) Mounting Lens Housing Operation Near- or Mounting Housing Backplate Detection Far-side? Height 1 Size (in.) Bike Insignia? Louvers? (ft) Color Color Type Both 10 8 Faces left * no Yellow none On recall 1 from ground to bottom of signal housing * present for contra-flow signals only Motivation for Signal Installation Noncompliance with previous traffic control Contraflow bicycle movement x Unique bicycle path through intersection Signal Timing Bicycle Signal(s) Number of Bikeonly Speeds (ft/s) Assumed Minimum Cyclist Phases: 0 Standing Start 1 Safety concerns Min. Green Phase Lengths (s) Other Yellow All-red 1 using the equation for standing bicycle crossing time in AASHTO s 2012 Guide D-96
252 Figure 1. Approximate Crossing Distances and Bike Signal Locations D-97
253 Municipality: Contact: Contact Info Vancouver, BC, Canada Winston Chou Phone Agency or Firm Name Dunsmuir Street and Seymour Street Design Guidance Used for Cyclist Performance Guide technique Design AASHTO Guide d'aménagement Manual for for the des voies Bicycle Development cyclables Traffic of Bicycle (Transportation (CROW Facilities Association of Dutch Guide) Canada) Field Measurements NACTO Urban Bikeway Design Guide Intersection Characteristics # of legs # of Bike signals Crossing Distance for cycletrack (ft) Signal Characteristics (for both directions of travel) Mounting Lens Housing Operation Near- or Mounting Housing Backplate Detection Far-side? Height 1 Size (in.) Bike Insignia? Louvers? (ft) Color Color Type Both 10 8 none no Yellow none On recall 1 from ground to bottom of signal housing Motivation for Signal Installation Noncompliance with previous traffic control Contraflow bicycle movement x Unique bicycle path through intersection Signal Timing Bicycle Signal(s) Number of Bikeonly Speeds (ft/s) Assumed Minimum Cyclist Phases: 0 Standing Start 1 Safety concerns Min. Green Phase Lengths (s) Other Yellow All-red 1 using the equation for standing bicycle crossing time in AASHTO s 2012 Guide D-98
254 Figure 1. Approximate Crossing Distances and Bike Signal Locations D-99
255 Municipality: Contact: Contact Info Vancouver, BC, Canada Winston Chou Phone Agency or Firm Name Dunsmuir Street and Richards Street Design Guidance Used for Cyclist Performance Guide technique Design AASHTO Guide d'aménagement Manual for for the des voies Bicycle Development cyclables Traffic of Bicycle (Transportation (CROW Facilities Association of Dutch Guide) Canada) Field Measurements NACTO Urban Bikeway Design Guide Intersection Characteristics # of legs # of Bike signals Crossing Distance for cycletrack (ft) Signal Characteristics (for both directions of travel) Mounting Lens Housing Operation Near- or Mounting Housing Backplate Detection Far-side? Height 1 Size (in.) Bike Insignia? Louvers? (ft) Color Color Type Both 10 8 none no Yellow none On recall 1 from ground to bottom of signal housing Motivation for Signal Installation Noncompliance with previous traffic control Contraflow bicycle movement x Unique bicycle path through intersection Signal Timing Bicycle Signal(s) Number of Bikeonly Speeds (ft/s) Assumed Minimum Cyclist Phases: 0 Standing Start 1 Safety concerns Min. Green Phase Lengths (s) Other Yellow All-red 1 using the equation for standing bicycle crossing time in AASHTO s 2012 Guide D-100
256 Figure 1. Approximate Crossing Distances and Bike Signal Locations D-101
257 Municipality: Contact: Contact Info Vancouver, BC, Canada Winston Chou Phone Agency or Firm Name Dunsmuir Street and Howe Street Design Guidance Used for Cyclist Performance Guide technique Design AASHTO Guide d'aménagement Manual for for the des voies Bicycle Development cyclables Traffic of Bicycle (Transportation (CROW Facilities Association of Dutch Guide) Canada) Field Measurements NACTO Urban Bikeway Design Guide Intersection Characteristics # of legs # of Bike signals Crossing Distance for cycletrack (ft) Signal Characteristics (for both directions of travel) Mounting Lens Housing Operation Near- or Mounting Housing Backplate Detection Far-side? Height 1 Size (in.) Bike Insignia? Louvers? (ft) Color Color Type Both 10 8 none no Yellow none On recall 1 from ground to bottom of signal housing Motivation for Signal Installation Noncompliance with previous traffic control Contraflow bicycle movement x Unique bicycle path through intersection Signal Timing Bicycle Signal(s) Number of Bikeonly Speeds (ft/s) Assumed Minimum Cyclist Phases: 0 Standing Start 1 Safety concerns Min. Green Phase Lengths (s) Other Yellow All-red 1 using the equation for standing bicycle crossing time in AASHTO s 2012 Guide D-102
258 Figure 1. Approximate Crossing Distances and Bike Signal Locations D-103
 Canada) Field Measurements")
259 Municipality: Contact: Contact Info Vancouver, BC, Canada Winston Chou Phone Agency or Firm Name Dunsmuir Street and Homer Street Design Guidance Used for Cyclist Performance Guide technique Design AASHTO Guide d'aménagement Manual for for the des voies Bicycle Development cyclables Traffic of Bicycle (Transportation (CROW Facilities Association of Dutch Guide) Canada) Field Measurements NACTO Urban Bikeway Design Guide Intersection Characteristics # of legs # of Bike signals Crossing Distance for cycletrack (ft) Signal Characteristics (for both directions of travel) Mounting Lens Housing Operation Near- or Mounting Housing Backplate Detection Far-side? Height 1 Size (in.) Bike Insignia? Louvers? (ft) Color Color Type Both 10 8 & 12 2 none no 1 from ground to bottom of signal housing 2 lenses in yellow housings = 8, black housings = 12 Motivation for Signal Installation Noncompliance with previous traffic control Contraflow bicycle movement x Unique bicycle path through intersection Signal Timing Bicycle Signal(s) Number of Bikeonly Speeds (ft/s) Assumed Minimum Cyclist Phases: 0 Standing Start 1 Safety concerns Min. Green Phase Lengths (s) Yellow & Black Other Yellow All-red 1 using the equation for standing bicycle crossing time in AASHTO s 2012 Guide none On recall D-104
260 Figure 1. Approximate Crossing Distances and Bike Signal Locations D-105
 Canada) Field")
261 Municipality: Contact: Contact Info Vancouver, BC, Canada Winston Chou Phone Agency or Firm Name Dunsmuir Street and Hamilton Street Design Guidance Used for Cyclist Performance Guide technique Design AASHTO Guide d'aménagement Manual for for the des voies Bicycle Development cyclables Traffic of Bicycle (Transportation (CROW Facilities Association of Dutch Guide) Canada) Field Measurements NACTO Urban Bikeway Design Guide Intersection Characteristics # of legs # of Bike signals Crossing Distance for cycletrack (ft) Signal Characteristics (for both directions of travel) Mounting Lens Housing Operation Near- or Mounting Housing Backplate Detection Far-side? Height 1 Size (in.) Bike Insignia? Louvers? (ft) Color Color Type Both 10 8 & 12 2 none no 1 from ground to bottom of signal housing 2 lenses in yellow housings = 8, black housings = 12 Motivation for Signal Installation Noncompliance with previous traffic control Contraflow bicycle movement x Unique bicycle path through intersection Signal Timing Bicycle Signal(s) Number of Bikeonly Speeds (ft/s) Assumed Minimum Cyclist Phases: 0 Standing Start 1 Safety concerns Min. Green Phase Lengths (s) Yellow & Black Other Yellow All-red 1 using the equation for standing bicycle crossing time in AASHTO s 2012 Guide none On recall D-106
262 Figure 1. Approximate Crossing Distances and Bike Signal Locations D-107
 Canada) Field")
263 Municipality: Contact: Contact Info Vancouver, BC, Canada Winston Chou Phone Agency or Firm Name Dunsmuir Street and Granville Street Design Guidance Used for Cyclist Performance Guide technique Design AASHTO Guide d'aménagement Manual for for the des voies Bicycle Development cyclables Traffic of Bicycle (Transportation (CROW Facilities Association of Dutch Guide) Canada) Field Measurements NACTO Urban Bikeway Design Guide Intersection Characteristics # of legs # of Bike signals Crossing Distance for cycletrack (ft) Signal Characteristics (for both directions of travel) Mounting Lens Housing Operation Near- or Mounting Housing Backplate Detection Far-side? Height 1 Size (in.) Bike Insignia? Louvers? (ft) Color Color Type Both 10 8 none no Yellow none On recall 1 from ground to bottom of signal housing Motivation for Signal Installation Noncompliance with previous traffic control Contraflow bicycle movement x Unique bicycle path through intersection Signal Timing Bicycle Signal(s) Number of Bikeonly Speeds (ft/s) Assumed Minimum Cyclist Phases: 0 Standing Start 1 Safety concerns Min. Green Phase Lengths (s) Other Yellow All-red 1 using the equation for standing bicycle crossing time in AASHTO s 2012 Guide D-108
264 Figure 1. Approximate Crossing Distances and Bike Signal Locations D-109
 Canada) Field")
265 Municipality: Contact: Contact Info Vancouver, BC, Canada Winston Chou Phone Agency or Firm Name Dunsmuir Viaduct and Citadel Parade Design Guidance Used for Cyclist Performance Guide technique Design AASHTO Guide d'aménagement Manual for for the des voies Bicycle Development cyclables Traffic of Bicycle (Transportation (CROW Facilities Association of Dutch Guide) Canada) Field Measurements NACTO Urban Bikeway Design Guide Intersection Characteristics # of legs # of Bike signals Crossing Distance for cycletrack (ft) Signal Characteristics (for both directions of travel) Mounting Lens Housing Operation Near- or Mounting Housing Backplate Detection Far-side? Height 1 Size (in.) Bike Insignia? Louvers? (ft) Color Color Type Far 10 8 none no Yellow none On recall 1 from ground to bottom of signal housing Motivation for Signal Installation Noncompliance with previous traffic control Contraflow bicycle movement x Unique bicycle path through intersection Signal Timing Bicycle Signal(s) Number of Bikeonly Speeds (ft/s) Assumed Minimum Cyclist Phases: 0 Standing Start 1 Safety concerns Min. Green Phase Lengths (s) Other Yellow All-red 1 using the equation for standing bicycle crossing time in AASHTO s 2012 Guide D-110
266 Figure 1. Approximate Crossing Distances and Bike Signal Locations D-111
 Canada) Field Measurements")
267 Municipality: Contact: Contact Info Vancouver, BC, Canada Winston Chou Phone Agency or Firm Name Dunsmuir Street and Cambie Street Design Guidance Used for Cyclist Performance Guide technique Design AASHTO Guide d'aménagement Manual for for the des voies Bicycle Development cyclables Traffic of Bicycle (Transportation (CROW Facilities Association of Dutch Guide) Canada) Field Measurements NACTO Urban Bikeway Design Guide Intersection Characteristics # of legs # of Bike signals Crossing Distance for cycletrack (ft) Signal Characteristics (for both directions of travel) Mounting Lens Housing Operation Near- or Mounting Housing Backplate Detection Far-side? Height 1 Size (in.) Bike Insignia? Louvers? (ft) Color Color Type Both 10 8 none no Yellow none On recall 1 from ground to bottom of signal housing Motivation for Signal Installation Noncompliance with previous traffic control Contraflow bicycle movement x Unique bicycle path through intersection Signal Timing Bicycle Signal(s) Number of Bikeonly Speeds (ft/s) Assumed Minimum Cyclist Phases: 0 Standing Start 1 Safety concerns Min. Green Phase Lengths (s) Other Yellow All-red 1 using the equation for standing bicycle crossing time in AASHTO s 2012 Guide D-112
268 Figure 1. Approximate Crossing Distances and Bike Signal Locations D-113
 Canada) Field Measurements")
269 Municipality: Contact: Contact Info Vancouver, BC, Canada Winston Chou Phone Agency or Firm Name Dunsmuir Street and Beatty Street Design Guidance Used for Cyclist Performance Guide technique Design AASHTO Guide d'aménagement Manual for for the des voies Bicycle Development cyclables Traffic of Bicycle (Transportation (CROW Facilities Association of Dutch Guide) Canada) Field Measurements NACTO Urban Bikeway Design Guide Intersection Characteristics # of legs # of Bike signals Crossing Distance for cycletrack (ft) Signal Characteristics (for both directions of travel) Mounting Lens Housing Operation Near- or Mounting Housing Backplate Detection Far-side? Height 1 Size (in.) Bike Insignia? Louvers? (ft) Color Color Type Both 10 8 & 12 2 none no 1 from ground to bottom of signal housing 2 lenses in yellow housings = 8, black housings = 12 Motivation for Signal Installation Noncompliance with previous traffic control Contraflow bicycle movement x Unique bicycle path through intersection Signal Timing Bicycle Signal(s) Number of Bikeonly Speeds (ft/s) Assumed Minimum Cyclist Phases: 0 Standing Start 1 Safety concerns Min. Green Phase Lengths (s) Yellow & Black Other Yellow All-red 1 using the equation for standing bicycle crossing time in AASHTO s 2012 Guide none On recall D-114
270 Figure 1. Approximate Crossing Distances and Bike Signal Locations D-115
271 Municipality: Contact: Contact Info Vancouver, BC, Canada Winston Chou Phone Agency or Firm Name Burrard Street and W Hastings Street Design Guidance Used for Cyclist Performance Guide technique Design AASHTO Guide d'aménagement Manual for for the des voies Bicycle Development cyclables Traffic of Bicycle (Transportation (CROW Facilities Association of Dutch Guide) Canada) Field Measurements NACTO Urban Bikeway Design Guide Picture Unavailable Intersection Characteristics # of legs # of Bike signals Crossing Distance for cycletrack (ft) Signal Characteristics (for both directions of travel) Mounting Lens Housing Operation Near- or Mounting Housing Backplate Detection Far-side? Height 1 Size (in.) Bike Insignia? Louvers? (ft) Color Color Type Both 10 8 & 12 2 Faces left * no 1 from ground to bottom of signal housing 2 lenses in yellow housings = 8, black housings = 12 * present for contra-flow signals only Motivation for Signal Installation Noncompliance with previous traffic control Contraflow bicycle movement x Unique bicycle path through intersection Signal Timing Bicycle Signal(s) Number of Bikeonly Speeds (ft/s) Assumed Minimum Cyclist Phases: 0 Standing Start 1 x Safety concerns Min. Green Phase Lengths (s) Yellow & Black Other Yellow All-red 1 using the equation for standing bicycle crossing time in AASHTO s 2012 Guide none On recall D-116
272 Figure 1. Approximate Crossing Distances and Bike Signal Locations D-117
 Canada) Field")
273 Municipality: Contact: Contact Info Vancouver, BC, Canada Winston Chou Phone Agency or Firm Name Burrard Street and W Cordova Street Design Guidance Used for Cyclist Performance Guide technique Design AASHTO Guide d'aménagement Manual for for the des voies Bicycle Development cyclables Traffic of Bicycle (Transportation (CROW Facilities Association of Dutch Guide) Canada) Field Measurements NACTO Urban Bikeway Design Guide Intersection Characteristics # of legs # of Bike signals Crossing Distance for cycletrack (ft) Signal Characteristics (for both directions of travel) Mounting Lens Housing Operation Near- or Mounting Housing Backplate Detection Far-side? Height 1 Size (in.) Bike Insignia? Louvers? (ft) Color Color Type Both 10 8 Faces left * no Yellow none On recall 1 from ground to bottom of signal housing * present for contra-flow signals only Motivation for Signal Installation Noncompliance with previous traffic control Contraflow bicycle movement x Unique bicycle path through intersection Signal Timing Bicycle Signal(s) Number of Bikeonly Speeds (ft/s) Assumed Minimum Cyclist Phases: 0 Standing Start 1 Safety concerns Min. Green Phase Lengths (s) Other Yellow All-red 1 using the equation for standing bicycle crossing time in AASHTO s 2012 Guide D-118
274 Figure 1. Approximate Crossing Distances and Bike Signal Locations D-119
 Canada) Field Measurements")
275 Municipality: Contact: Contact Info Vancouver, BC, Canada Winston Chou Phone Agency or Firm Name Burrard Street and Canada Place Design Guidance Used for Cyclist Performance Guide technique Design AASHTO Guide d'aménagement Manual for for the des voies Bicycle Development cyclables Traffic of Bicycle (Transportation (CROW Facilities Association of Dutch Guide) Canada) Field Measurements NACTO Urban Bikeway Design Guide Intersection Characteristics # of legs # of Bike signals Crossing Distance for cycletrack (ft) Signal Characteristics (for both directions of travel) Mounting Lens Housing Operation Near- or Mounting Housing Backplate Detection Far-side? Height 1 Size (in.) Bike Insignia? Louvers? (ft) Color Color Type Both 10 & 15 8 & 12 2 Faces left * no 1 from ground to bottom of signal housing 2 lenses in yellow housings = 8, black housings = 12 * present for contra-flow signals only Motivation for Signal Installation Noncompliance with previous traffic control Contraflow bicycle movement x Unique bicycle path through intersection Signal Timing Bicycle Signal(s) Number of Bikeonly Speeds (ft/s) Assumed Minimum Cyclist Phases: 0 Standing Start 1 x Safety concerns Min. Green Phase Lengths (s) Yellow & Black Other Yellow All-red 1 using the equation for standing bicycle crossing time in AASHTO s 2012 Guide none On recall D-120
276 Figure 1. Approximate Crossing Distances and Bike Signal Locations D-121
 Canada) x Intersection")
277 Municipality: Contact: Contact Info Minneapolis, MN Simon Blenski Phone Agency or Firm Name Broadway Street NE and 5th Street NE Design Guidance Used for Cyclist Performance Guide technique Design AASHTO Guide d'aménagement Manual for for the des voies Bicycle Development cyclables Traffic of Bicycle (Transportation (CROW Facilities Association of Dutch Guide) Canada) x Intersection Characteristics # of legs # of Bike signals Crossing Distance for cycletrack (ft) Field Measurements x NACTO Urban Bikeway Design Guide Signal Characteristics (for both directions of travel) Mounting Lens Housing Operation Near- or Mounting Housing Backplate Detection Far-side? Height 1 Size (in.) Bike Insignia? Louvers? (ft) Color Color Type Far 12 Faces right Yes Black Black Push-button 1 from ground to bottom of signal housing Motivation for Signal Installation Noncompliance with previous traffic control Contraflow bicycle movement Unique bicycle path through intersection x Safety concerns x Other Signal Timing Bicycle Signal(s) Number of Bikeonly Speeds (ft/s) Assumed Minimum Cyclist Phase Lengths (s) Phases: Standing Start 1 Min. Yellow All-red 1 Green using the equation for standing bicycle crossing time in AASHTO s 2012 Guide D-122
278 Figure 1. Approximate Crossing Distances and Bike Signal Locations Adjoining Signage: D-123
279 Municipality: Contact: Contact Info Cambridge, MA Jeffery R. Parenti Phone Agency or Firm Name Massachusetts Avenue and Somerville Avenue Design Guidance Used for Cyclist Performance Guide technique Design AASHTO Guide d'aménagement Manual for for the des voies Bicycle Development cyclables Traffic of Bicycle (Transportation (CROW Facilities Association of Dutch Guide) Canada) Field Measurements NACTO Urban Bikeway Design Guide No Picture Available Intersection Characteristics # of legs # of Bike signals Crossing Distance for cycletrack (ft) Signal Characteristics (for both directions of travel) Mounting Lens Housing Operation Near- or Mounting Housing Backplate Detection Far-side? Height 1 Size (in.) Bike Insignia? Louvers? (ft) Color Color Type Far None No Black Black On recall 1 from ground to bottom of signal housing Motivation for Signal Installation Noncompliance with previous traffic control Contraflow bicycle movement Unique bicycle path through intersection x Safety concerns Other Signal Timing Bicycle Signal(s) Number of Bikeonly Speeds (ft/s) Assumed Minimum Cyclist Phase Lengths (s) Phases: Standing Start 1 Min. Yellow All-red 1 Green using the equation for standing bicycle crossing time in AASHTO s 2012 Guide D-124
280 Figure 1. Approximate Crossing Distances and Bike Signal Locations D-125
281 Municipality: Contact: Contact Info Cambridge, MA Jeffery R. Parenti Phone Agency or Firm Name Massachusetts Avenue and Johnston Gate Design Guidance Used for Cyclist Performance Guide technique Design AASHTO Guide d'aménagement Manual for for the des voies Bicycle Development cyclables Traffic of Bicycle (Transportation (CROW Facilities Association of Dutch Guide) Canada) Field Measurements NACTO Urban Bikeway Design Guide No Picture Available Intersection Characteristics # of legs # of Bike signals Crossing Distance for cycletrack (ft) Signal Characteristics (for both directions of travel) Mounting Lens Housing Operation Near- or Mounting Housing Backplate Detection Far-side? Height 1 Size (in.) Bike Insignia? Louvers? (ft) Color Color Type Far None No Black Black On recall 1 from ground to bottom of signal housing Motivation for Signal Installation Noncompliance with previous traffic control Contraflow bicycle movement Unique bicycle path through intersection x Safety concerns Other Signal Timing Bicycle Signal(s) Number of Bikeonly Speeds (ft/s) Assumed Minimum Cyclist Phase Lengths (s) Phases: Standing Start 1 Min. Yellow All-red 1 Green using the equation for standing bicycle crossing time in AASHTO s 2012 Guide D-126
282 Figure 1. Approximate Crossing Distances and Bike Signal Locations D-127
283 APPENDIX E: TEMPLATE FOR OREGON PUBLIC AGENCIES TO REQUEST EXPERIMENTATION WITH BICYCLE-SPECIFIC TRAFFIC SIGNALS
284

285 TEMPLATE FOR OREGON PUBLIC AGENCIES TO REQUEST EXPERIMENTATION WITH BICYCLE- SPECIFIC TRAFFIC SIGNALS The purpose of this template is to provide Oregon agencies with a working template to submit a RTE for bicycle-specific traffic signals to FHWA that meets MUTCD requirements. Guidance is included for all information required by FHWA. Because each installation is unique, agencies should modify this template and evaluation plan to fit their particular installation. This template was modified based on other successful applications for bicycle specific signals in Oregon. Agencies using this template should review all text for accuracy. Per the MUTCD guidance the official request to FHWA should include a cover letter on agency letterhead. Courtesy copies are required to the Oregon Division office, attention Nick Fortey (Nick.FORTEY@dot.gov). This template suggests courtesy copies to Gary Obery, (Gary.R.OBERY@odot.state.or.us) Bicycle and Pedestrian Traffic Engineer at the Oregon DOT The experiment requests should be sent electronically as an attachment (PDF or Word Document) to an to MUTCDofficialrequest@dot.gov. The following flowchart from the MUTCD web page outlines the steps required for approval. Figure 4 Flowchart for Obtaining Experimental Approval E-1
286 The following legend in the template is used: Italic grey text a helpful reminder of the required information in Paragraph 11 of Section 1A.10 identified in the MUTCD. Delete this text before submitting to FHWA. Blue text guidance describing what should be included in the section. Replace this text with your own narratives. Black text the wording of this text should be sufficient and acceptable for all RTE and should not need modification. [Red text with gray highlight] - Words to be replaced in text by agency author. E-2
287 [DATE] Office of Transportation Operations Federal Highway Administration 1200 New Jersey Avenue, S.E. HOTO-1 Washington, DC RE: Request for permission to experiment with a bicycle-specific traffic signal in [LOCATION] [AGENCY] formally requests approval, as outlined in Section 1A.10 of the Manual on Uniform Traffic Control Devices (MUTCD) to install a bicycle signal as an experimental traffic control device. The proposed device is located at [LOCATION]. This experiment is requested because the use of bicycle symbols in the traffic signal lens and the supplementary sign accompanying the signal head is currently not allowed in the MUTCD. This experiment will contribute to the growing body of knowledge about the operation of these traffic control devices. The attached document provides all of the information and [AGENCY] agreements requested in MUTCD required for experimental approval. We look forward to your review and approval of this request. Sincerely, [AGENCY] CC: Nick Fortey, Oregon FHWA Division Office Gary Obery, Oregon DOT, Traffic and Roadway Section E-3
288 Request to Experiment Bicycle-Specific Signal at [LOCATION] A. PROJECT BACKGROUND 1. MUTCD - A statement of the nature of the problem, including data that justifies the need for a new device or application. This section should describe the project background. In addition to defining the nature of the problem in narrative form, consider including the following information in this section: A figure showing the approximate project location on a map. A table providing existing bicyclist counts at the location (see section G guidance for more information). Crash or other safety data that is relevant to the application and justifies the need for a bicycle-specific traffic signal at this specific location. B. PROPOSED APPLICATION OF THE TRAFFIC CONTROL DEVICE 2. MUTCD - A description of the proposed change, how it was developed, and how it deviates from the current MUTCD. This section should describe the specific element(s) of the project that deviate from the MUTCD for which the request to experiment (RTE) is being sought. In addition to a convincing narrative discussing the alternatives that were considered and why a bicycle-specific signal is the best option for this location (e.g. reduce delay for bicyclists, improve safety for bicyclists and motorists, eliminate a conflict in time, improve overall signal operation), consider including the following information in this section A figure showing the draft plan showing the location and traffic movements controlled by the signal assembly. Provide relevant engineering details such as lens diameter, mounting height, and/or use of louvers for visibility restrictions on the figure or in the narrative. Include this as ATTACHMENT 1 A figure showing the phasing sequence of the traffic signal operation. Include a written narrative that explains the operation of bicycle-specific signal in context of the operation of other permitted and protected movements. Include timing data and consider showing calculations. Include the figure as part of ATTACHMENT 1 A frank assessment of any potentially negative consequences of the installation and why those were considered or addressed in the design. E-4

289 C. DESCRIPTION AND ILLUSTRATIONS OF THE PROPOSED TRAFFIC CONTROL DEVICE 3. MUTCD - Any illustration(s) that enhances understanding of the device or its use. The proposed device consists of experimental bicycle-specific signal heads with indications for a red, yellow and green bike symbol shown in Figure 5. In Oregon, these devices have been included in the Oregon DOT Traffic Signal Policy and Guidelines (see ATTACHMENT 2). This document was reviewed and approved by the Oregon State Traffic Engineer and the Oregon Traffic Control Devices Committee in In Oregon, the appropriate driver response to these indications has been defined in statute (see ATTACHMENT 3). The signal face assembly will be accompanied by a BIKE SIGNAL sign (Figure 5) mounted adjacent to the signal head. 24 x 30 Figure 5 Proposed Bike Signal and Sign The bicycle indications will be displayed from [SIZE] circular housings. The bicycle symbol itself will measure approximately [SIZE] across. The bicycle indications will closely match the bicycle symbol used on sign W11-1 in the MUTCD and FHWA Standard Highway Signs manual. D. SUPPORTING DATA FOR THE PROPOSED DEVICE 4. MUTCD - Supporting data that explains how the experimental device was developed, if it has been tried, the adequacy of its performance, and the process by which the device was chosen or applied. A recent paper by Thompson et al, 2013 to be published in Transportation Research Board s Transportation Research Record documented the current state of the practice for bicycle specific traffic signals in the U.S. and Canada. The survey revealed many installations in the United States (Davis CA, Denver CO, Washington DC, Long Beach, CA, New York City, NY) and Canada (Vancouver, BC and Montreal, QC). Experimental use approval for bicycle-specific E-5
290 signals of a similar design has also been granted for other installations in Oregon (Ashland, Eugene, Clackamas County, and Portland). E. PATENT 5. MUTCD - A legally binding statement certifying that the concept of the traffic control device is not protected by a patent or copyright (see MUTCD Section 1A.10 for additional details.) The bicycle-specific signal concept is not protected by a patent or copyright. All elements (signal heads, mounting brackets, signal controller, mast arms, and other related equipment) that are used to construct a bicycle signal can be obtained from multiple vendors. F. TIME PERIOD AND LOCATION OF THE EXPERIMENT 6. MUTCD - The proposed time period and location(s) of the experiment. The proposed traffic signal is expected to be installed in [MONTH & YEAR]. [AGENCY] proposes to collect crash data after the installation of the bicycle signal to allow for safety evaluation. To allow for sufficient time to gather reported motor-vehicle crash information, [AGENCY] proposes a four-year period for experimental use of the bicycle signal. This will allow traffic patterns to normalize immediately after project completion and allow [AGENCY] to collect a full three years of crash data. The Oregon DOT is responsible for collecting reported motor-vehicle-bicycle collisions in Oregon and maintains a statewide crash reporting system to which all public agencies have access. Thus we are requesting the experimental approval start on [DATE] and end on [DATE]. G. EVALUATION PLAN 7. MUTCD - A detailed research or evaluation plan providing for close monitoring of the experimentation, especially in the early stages of field implementation. The evaluation plan should include before and after studies as well as quantitative date enabling a scientifically sound evaluation of the performance of the device. ***Another option would be to just provide an example evaluation and also suggest contracting for services for the analysis (maybe even provide a range of costs). This might result in more jurisdictions being willing to try a bike signal since this can seem daunting for small staffs.*** This section should describe the proposed evaluation of the bicycle signal installation. In addition to the guidance provided in this section, the FHWA has also prepared a useful report Pedestrian and Bicyclist Traffic Control Device Evaluation Methods published in May 2011 that has additional guidance E-6
291 In determining an appropriate evaluation plan, the first step is to identify the key measures of effectiveness (MOE) for the device. Presently, much of the discussion about including bicyclespecific signals in the MUTCD is centered around two concerns 1) potential for a motorist to misinterpret a green bicycle indication as a circular green indication for their movement, and 2) cyclist comprehension and compliance with the devices. It is likely that FHWA will appreciate data being collected that contribute to these outstanding research questions if possible. There is also limited empirical data on the safety (in terms of reported crashes) of these locations, so diligent collection of crash records is important. Depending on the specific installation, there are also related design questions about signal face placement (both vertical and lateral placement, and far side versus near side) and operational questions such as minimum green, appropriate clearance intervals, and the use of the detector stencil to encourage correct cyclist stopping position that may be studied. In a comprehensive evaluation of bicycle-specific signals more than one location would be part of the study. Because these RTE are generally for only one location, the level of evaluation any one agency can do is limited. If data are collected in a common format, information from many sites can be pooled for additional analysis. In this proposed template, we recommend the following sections (G.1, G.2, & G.3) in the RTE. G.1. Research Questions The evaluation plan should begin with a clear statement and explanation of the research questions. These should be specific to the device and location being proposed in the RTE. The proposed analysis and data collection plan should seek to answer these questions. Some possible research questions might be: Is a signal display with bicycle symbols an effective means of controlling the movements of bicyclists at the traffic signal? Does there appear to be motorist confusion with the signal indications? What are the compliance rates with the bicycle signal indication? How does the installation change safety? G.2. Method of Evaluation In this section, the agency should document the proposed method of evaluation. At a minimum, the template recommends video and crash data analysis. Table 1 suggests the data collection types and intervals. More detail is provided in the narrative text. Table 6 Data Collection Periods Period Video Counts Crash Reports Before (if necessary) At least 2 weekdays covering peak periods during high bicycle volume periods. Include weekends Ideally, for 1 week per year with in the same time period as crash reports. Recognizing this unlikely, whatever volumes are available. 3-5 years prior to installation After At least 2 weekdays covering peak periods during high bicycle Consider automated counters or signal infrastructure to count 3 years E-7
292 volume periods. Consider including weekends. Repeat for each year of the evaluation period. longer durations (1 week). Optionally, use video interval as count Video Data Collection and Analysis The easiest and most robust way to conduct in-field evaluation of traffic control devices is with video. Using video, there is substantial flexibility to examine many questions and users are not influenced by an observers presence. The ability to record long durations of high-quality video has also become relatively inexpensive. If the agency does not have its own equipment, there are a number of traffic counting vendors who will provide the service for a reasonable cost. The agency may need to provide oversight on the camera setup to ensure the proper field of view is obtained. Camera Setup Video should be positioned to capture images of bicyclists approaching and passing through the intersection as well as the status of the signal displays. Ideally, cameras should be positioned such that they are not readily visible by other users. The video images should be date and timestamped. If motorist actions are also of interest, the travel lanes should be included in the field of view. Consideration should also be made of glare and sun-angle when placing the camera, since these conditions could eliminate many hours if the camera is affected. Sample Periods Video should be scheduled to record peak, off-peak, weekday and weekend bicycle traffic. Volumes of cyclist are usually much lower at night, but if there any reason to collect night time data it is easy to collect. Most cameras can easily be programmed to record a specified set of hours. If the location is being substantially modified by construction, the collection of before data is usually not useful. If the modification is minor, before data will be useful to compare behaviors with and without the bicycle-specific signal. A minimum sample size will depend on the MOE being measured but 100 per sample period is a reasonable target. Analysis Presently, the analysis is the most costly aspect of video data collection. One of the items of interest (motorists confusion about misinterpreting the green bicycle indication as a green ball for their movement) is difficult to measure using video. In the video, only the motorist action is known - not their comprehension. For example, if the bicycle signal is used to separate rightturning vehicles and through bicyclists, we don t know if a motorist turning right illegally is doing so because they saw the green bicycle indication or did not see the right-turn on red restrictions. Nonetheless, depending on the lane configurations, a driver action that possibly indicated confusion could be identified and recorded. To do this, the video field of view should include the motor vehicle lanes and the signal indications. It may be useful to report in the video sampled the number of potential confusions. Measuring cyclist compliance with the bicycle signal is easier since it is less subjective. A spreadsheet could be set up to record the following information of each cyclists arriving at the bicycle specific signal: Arrival time Status of bicycle signal indication (red or green) Departure time E-8
293 User s response (slow or briefly stop, stop and remain stopped, or proceed through intersection) Cyclist location - (e.g. bike lane if available, sidewalk/crosswalk, or general traffic lanes) Review and analysis of video data can be time-intensive. One way to make review faster and data more reliable is to create a data collection input spreadsheet. Use of video frame numbers can also make recording of time elements quicker (e.g. arrival at frame 40, departure at frame 50, 1 frame =1/10 second). With the above format, compliance can be reported for only the first cyclists arriving on red, delay can be calculated for each stopping cyclists, and total counts can be tabulated. The suggested data elements could easily be expanded to include other operational questions. However, each additional data element increase the time required to analyze the video. In the near future, automated video analysis techniques should make video data reduction less timeconsuming 5. The agency may also consider working with a university or local college to have students help in the video data reduction. Crash Record Analysis An assessment of the bicycle crash data compiled after implementation should be made on an annual basis. While few bicycle-related crashes are expected, those that do occur may provide a basis for concerns or additional observation. Where possible, the agency should attempt to obtain the crash narratives from the police agency. An important aspect of the crash analysis will be attempting to control for changes in exposure. Conflicting motor vehicle volumes as well as bicycle volumes should be sampled on an annual basis. The video analysis may easily double as a counting tool for the time period it is deployed, but due to the variability of short-term bicycle counts, the agency should consider conducting longer counts (1 week) with automated counting equipment. Depending on the design of the traffic signal detection system, motor vehicle and bicycle volumes may also be available from the signal controller. (Optional) Conflict Analysis To supplement crash analysis, it is possible to use the video data to record the occurrences of conflicts with motorized traffic, pedestrians, or other cyclists. A precise definition of a conflict is required. This should be a repeatable observation and requires training all observers. Automated techniques can make this effort more repeatable. For example, a conflict could be defined as an event involving a bicyclist and another road user (motorist, pedestrian, or other cyclist) in which the action of one user causes the other user to make an evasive maneuver to avoid a collision. An evasive maneuver is characterized by braking or swerving by the road user who has the right-of-way. (Optional) Survey of Users User comprehension or perception could be supplemented with a survey of users. Cyclists and pedestrians are relatively easy to intercept and direct to an online survey. It is generally not feasible to intercept motorists. Design of survey questions is beyond the scope of this template, but care should be taken to create non-biasing questions. Intercept surveys at the location yield useful results but could be subjected to self-selection bias. Another alternative is to randomly sample nearby residents with a mailing who are likely users of the location. This can also give the motorist perspective. Survey costs could be contained by including with other agency communication materials. 5 Presently, PSU is in the process of developing such a tool but other research-level tools are available E-9
294 G.3 Reporting and Assessment This section should describe the planned reporting interval and analysis methods. The interim reports can be brief memorandums. The final report should summarize all relevant data and information. Sample report outlines can be found in the FHWA guidance. SAMPLE TEXT FROM OREGON RTEs For example, this is the wording that Oregon DOT and Clackamas County provided in their RTE: Before Studies: Crash data for three years prior to planned intersection improvements Video data collection to provide the following information at the crossing on a typical weekday: Motor vehicle and bicycle counts - total crossings by time of day o Bicycle operational behavior, including assessment of compliance with traffic control devices o Motor vehicle operational behavior, including assessment of compliance with laws regarding pedestrians in crosswalks and cyclists o Bicycle/motor vehicle conflicts After Studies: Crash analysis each year following implementation up to three full years Video data will be collected at the end of the first month, and every year thereafter for three years. In addition to the data and assessments made in the before period, an additional analysis will be made of motorist and bicyclist delay. Public surveys to better understand how users (motor vehicle operators, cyclists and pedestrians) perceive the device H. AGREEMENT TO RESTORE 8. MUTCD - An agreement to restore the experimental site to a condition that complies with the provisions of the MUTCD within 3 months following completion of the experiment. The agreement must also provide that the sponsoring agency will terminate the experiment at any time if it determines that the experiment directly or indirectly causes significant safety hazards. If the experiment demonstrates an improvement, the device or application may remain in place until an official rulemaking action occurs. Upon the request of FHWA, [AGENCY]agrees to restore the site of the experiment to a condition that complies with the provisions of the Manual on Uniform Traffic Control Devices within three months following the end of the time period of the experiment. In the event that FHWA becomes dissatisfied with the performance of the bicycle-specific signal during the experiment, [AGENCY] agrees to terminate the experiment. [AGENCY] and FHWA acknowledge and agree that if the experiment demonstrates an improvement, the device or application may remain in place until an official rulemaking action occurs. I. SEMI-ANNUAL PROGRESS REPORTS E-10
295 [AGENCY] will provide semi-annual progress reports during the course of the experiment and will provide a copy of a report documents the final results within three months following the conclusion of the experiment. J. PROJECT ADMINISTRATION [AGENCY] is responsible for all project administration. The project manager will be: Name Title [AGENCY] Address City, OR ZIP Phone: Fax: E-11
296 ATTACHMENT 1 DRAFT SIGNAL PLANS AND TIMING INFORMATION ATTACHMENT 2: OREGON DEPARTMENT OF TRANSPORTATION TRAFFIC SIGNAL POLICY AND GUIDELINES, ADDENDUM 2: BICYCLE SIGNALS ATTACHMENT 3: ORS OREGON VEHICLE CODE DEFINITIONS OF APPROPRIATE RESPONSES TO BICYCLE SIGNALS E-12
297 ATTACHMENT 1 DRAFT SIGNAL PLANS AND TIMING INFORMATION [INSERT DRAFT PLANS HERE] E-13
298 ATTACHMENT 2 ODOT Traffic Signal Policy and Guidelines, Addendum 2: Bicycle Signals E-14

299 E-15
Cyclist Compliance at Signalized Intersections
 Portland State University PDXScholar TREC Friday Seminar Series Transportation Research and Education Center (TREC) 11-15-2013 Cyclist Compliance at Signalized Intersections Sam R. Thompson Portland State
Bicycle-Specific Traffic Signals: Results from a State-of-the-Practice Review
 0 0 0 0 Bicycle-Specific Traffic Signals: Results from a State-of-the-Practice Review Paper # -0 S. R. Thompson (corresponding author) Department of Civil & Environmental Engineering Portland State University
Saturation Flow Rate, Start-Up Lost Time, and Capacity for Bicycles at Signalized Intersections
 Transportation Research Record 1852 105 Paper No. 03-4180 Saturation Flow Rate, Start-Up Lost Time, and Capacity for Bicycles at Signalized Intersections Winai Raksuntorn and Sarosh I. Khan A review of
Bicycle-Specific Traffic Signals
 Bicycle-Specific Traffic Signals Results from a State-of-the-Practice Review Sam R. Thompson, Christopher M. Monsere, Miguel Figliozzi, Peter Koonce, and Gary Obery This paper presents the results of a
A Methodology to Estimate Bicyclists Acceleration and Speed Design Values to Calculate Minimum Green Times at Signalized Intersections
 Figliozzi, Wheeler, and Monsere 0 0 0 A Methodology to Estimate Bicyclists Acceleration and Speed Design Values to Calculate Minimum Green Times at Signalized Intersections *Miguel Figliozzi Associate
A Traffic Operations Method for Assessing Automobile and Bicycle Shared Roadways
 A Traffic Operations Method for Assessing Automobile and Bicycle Shared Roadways A Thesis Proposal By James A. Robertson Submitted to the Office of Graduate Studies Texas A&M University in partial fulfillment
Evaluation of Bike Boxes at Signalized Intersections [Presentation]
![Evaluation of Bike Boxes at Signalized Intersections [Presentation]](/thumbs/89/98792206.jpg "Evaluation of Bike Boxes at Signalized Intersections [Presentation]") Portland State University PDXScholar Urban Studies and Planning Faculty Publications and Presentations Nohad A. Toulan School of Urban Studies and Planning 10-1-2010 Evaluation of Bike Boxes at Signalized
Portland State University PDXScholar Urban Studies and Planning Faculty Publications and Presentations Nohad A. Toulan School of Urban Studies and Planning 10-1-2010 Evaluation of Bike Boxes at Signalized
FEDERAL HIGHWAY ADMINISTRATION APPLICATION
 FEDERAL HIGHWAY ADMINISTRATION APPLICATION REQUEST FOR PERMISSION TO EXPERIMENT WITH A BICYCLE BOX INTERSECTION TREATMENT Submitted by: City of Columbus Department of Public Service Date: June 26, 2009
2018 AASHTO BIKE GUIDE
 2018 AASHTO BIKE GUIDE Your presenter Rob Burchfield, PE NW Regional Engineering Director 35 years of experience in traffic engineering and bicycle facility design Toole Design Group Toole Design Group
Complete Street Analysis of a Road Diet: Orange Grove Boulevard, Pasadena, CA
 Complete Street Analysis of a Road Diet: Orange Grove Boulevard, Pasadena, CA Aaron Elias, Bill Cisco Abstract As part of evaluating the feasibility of a road diet on Orange Grove Boulevard in Pasadena,
Simulation Analysis of Intersection Treatments for Cycle Tracks
 Abstract Simulation Analysis of Intersection Treatments for Cycle Tracks The increased use of cycle tracks also known as protected bike lanes has led to investigations of how to accommodate them at intersections.
GUIDELINES FOR USING DECISION SIGHT DISTANCE AT IGNALIZED INTERSECTIONS NEAR VERTICAL CURVES
 1. Report No. FHWA/TX-05/0-4084-P2 4. Title and Subtitle 2. Government Accession No. 3. Recipient's Catalog No. GUIDELINES FOR USING DECISION SIGHT DISTANCE AT IGNALIZED INTERSECTIONS NEAR VERTICAL CURVES
TABLE OF CONTENTS. Executive Summary
 Executive Summary Background... ES-1 Pedestrian Network... ES-2 Bikeway Network... ES-2 Collision History... ES-2 Public Input... ES-4 Conclusions and Recommendations... ES-4 1. Introduction and Setting
Health, Transportation and Bicycling: Connecting the Dotted Lines
 Portland State University PDXScholar Urban Studies and Planning Faculty Publications and Presentations Nohad A. Toulan School of Urban Studies and Planning 11-17-2010 Health, Transportation and Bicycling:
The Corporation of the City of Sarnia. School Crossing Guard Warrant Policy
 The Corporation of the City of Sarnia School Crossing Guard Warrant Policy Table of Contents Overview And Description... 2 Role of the School Crossing Guard... 2 Definition of a Designated School Crossing...
Bikeway action plan. Bicycle Friendly Community Workshop March 5, 2007 Rochester, MN
 Bikeway action plan Summary The was held on March 5, 2007 at the Rochester Mayo Civic Center. The workshop was hosted by Rochester-Olmsted County Planning Department in collaboration with the League of
DEPARTMENT OF ENVIRONMENTAL SERVICES. North Harrison Street (Lee Highway to Little Falls Road) Comparative Analysis. Prepared for:
 Comparative Analysis. Prepared for:") DEPARTMENT OF ENVIRONMENTAL SERVICES North Harrison Street (Lee Highway to Little Falls Road) Comparative Analysis Prepared for: Arlington County Department of Environmental Services 2100 Clarendon Boulevard,
DEPARTMENT OF ENVIRONMENTAL SERVICES North Harrison Street (Lee Highway to Little Falls Road) Comparative Analysis Prepared for: Arlington County Department of Environmental Services 2100 Clarendon Boulevard,
Chapter VISION, MISSION, AND GOALS AND OBJECTIVES. Vision. Mission. Goals and Objectives CONNECTING COMMUNITIES ACROSS THE ST.
 VISION, MISSION, AND GOALS AND OBJECTIVES Chapter 3 The Plan s vision, mission, and goals and objectives were developed through a series of interactive exercises with the Citizens Advisory Committee (CAC)
ENHANCED PARKWAY STUDY: PHASE 2 CONTINUOUS FLOW INTERSECTIONS. Final Report
 Preparedby: ENHANCED PARKWAY STUDY: PHASE 2 CONTINUOUS FLOW INTERSECTIONS Final Report Prepared for Maricopa County Department of Transportation Prepared by TABLE OF CONTENTS Page EXECUTIVE SUMMARY ES-1
Evaluation of a Combined Bicycle Lane/Right Turn Lane in Eugene, Oregon
 Evaluation of a Combined Bicycle Lane/Right Turn Lane in Eugene, Oregon PUBLICATION NO. FHWA-RD-00-151 August 2000 U.S. Department of Transportation Federal Highway Administration Research and Development
2018 AASHTO BIKE GUIDE
 2018 AASHTO BIKE GUIDE Your presenters Jessica Fields, PE Denver Office Director Sagar Onta, PE, PTOE Denver Engineering Director 35 years of combined experience street design, transportation planning,
Dear Mr. Tweed: Sincerely, Min Zhou, P.E. Vice President
 December 17, 2012 Mr. Steve Tweed City of Long Beach, Department of Public Works Traffic & Transportation Bureau, 10 th Floor City Hall 333 West Ocean Boulevard Long Beach, CA 90802 Subject: Broadway and
Comments EXECUTIVE SUMMARY
 Comments 1. Under any Alternatives, MCDOT should provide better at-grade pedestrian crossing of Georgia Avenue and Forest Glen Road, including improved crosswalks with wider medians and adequate signal
The Traffic Monitoring Guide: Counting Bicyclists and Pedestrians. APBP 2017 June 28: 11:15am-12:45pm
 The Traffic Monitoring Guide: Counting Bicyclists and Pedestrians APBP 2017 June 28: 11:15am-12:45pm 2 Presentation Organization Why count bicyclists and pedestrians? Why report count data? What resources
TRAFFIC IMPACT STUDY CRITERIA
 Chapter 6 - TRAFFIC IMPACT STUDY CRITERIA 6.1 GENERAL PROVISIONS 6.1.1. Purpose: The purpose of this document is to outline a standard format for preparing a traffic impact study in the City of Steamboat
Coquitlam Cross-town Bike Route Improving Bicycle Facilities in a Mature Suburban Environment
 Coquitlam Cross-town Bike Route Improving Bicycle Facilities in a Mature Suburban Environment Sarah Rocchi, Vice-President, Projects, Opus International Consultants (Main Presenter) Catherine Mohoruk,
APPENDIX A: Complete Streets Checklist DRAFT NOVEMBER 2016
 APPENDIX A: Complete Streets Checklist DRAFT NOVEMBER 2016 Complete Streets Checklist MetroPlan Orlando s Complete Streets Checklist is an internal planning tool for staff to further implementation of
TOWN OF PORTLAND, CONNECTICUT COMPLETE STREETS POLICY
 TOWN OF PORTLAND, CONNECTICUT COMPLETE STREETS POLICY I. VISION, GOALS & PRINCIPLES VISION To improve the streets of Portland making them safer and more accessible for all users including pedestrians,
Rochester Downtown Bicycle Study 2009
 Rochester Downtown Bicycle Study 2009 Relationship of ROCOG Long Range Transportation Plan to Rochester Comprehensive Plan Regional Long Range Transportation Plan (LRTP) is prepared under the auspices
DOT HS September Crash Factors in Intersection-Related Crashes: An On-Scene Perspective
 DOT HS 811 366 September 2010 Crash Factors in Intersection-Related Crashes: An On-Scene Perspective DISCLAIMER This publication is distributed by the U.S. Department of Transportation, National Highway
Bicycle Facilities Planning
 Bicycle Facilities Planning Overview Types of Cyclists Purpose for Riding Types of Facilities Bike Lanes Bicycle Boulevards Cycle Tracks Intersections Signals Signing and Marking Discussion Types of Bicyclists
A Summary of Recent Evaluations of Cycling Facilities in Portland, OR
 A Summary of Recent Evaluations of Cycling Facilities in Portland, OR Christopher Monsere, Ph.D., P.E. Civil & Environmental Engineering Jennifer Dill, Ph.D. Urban Studies & Planning Nathan McNeil Center
Pedestrian Level of Service at Intersections in Bhopal City
 Pedestrian Level of Service at Intersections in Bhopal City 1 Rakesh Wahane 1 M.E. Student 1 Department of Civil Engineering 1 Samrat Ashok Technological Institute Vidisha MP 464001 Abstract - This study
2.0 LANE WIDTHS GUIDELINE
 2.0 LANE WIDTHS GUIDELINE Road Engineering Design Guidelines Version 2.0.1 May 2018 City of Toronto, Transportation Services City of Toronto Page 0 Background In early 2014, Transportation Services initiated
Boudart, Foster, Koonce, Maus, & Okimoto 1 IMPROVING THE BICYCLE DETECTION PAVEMENT MARKING SYMBOLS TO INCREASE COMPREHENSION AT TRAFFIC SIGNALS
 Boudart, Foster, Koonce, Maus, & Okimoto 0 0 0 0 IMPROVING THE BICYCLE DETECTION PAVEMENT MARKING SYMBOLS TO INCREASE COMPREHENSION AT TRAFFIC SIGNALS Jesse Boudart, E.I. * Kittelson & Associates, Inc.
An Analysis of Reducing Pedestrian-Walking-Speed Impacts on Intersection Traffic MOEs
 An Analysis of Reducing Pedestrian-Walking-Speed Impacts on Intersection Traffic MOEs A Thesis Proposal By XIAOHAN LI Submitted to the Office of Graduate Studies of Texas A&M University In partial fulfillment
Crash Analysis of I-64 Closure in St. Louis County
 Report # MATC-MST: 341 Final Report 25-1121-0001-341 Crash Analysis of I-64 Closure in St. Louis County Ghulam H. Bham, Ph.D. Professor Department of Civil, Architectural, and Environmental Engineering
MEMORANDUM. Charlotte Fleetwood, Transportation Planner
 MEMORANDUM Date: Updated August 22, 2017 To: Organization: Charlotte Fleetwood, Transportation Planner Boston Transportation Department From: Jason DeGray, P.E., PTOE, Regional Director of Engineering
Texas Transportation Institute The Texas A&M University System College Station, Texas
 1. Report No. FHWA/TX-05/0-4084-P1 4. Title and Subtitle GUIDELINES FOR THE USE OF COUNTERMEASURES TO REDUCE CRASHES ON APPROACHES TO SIGNALIZED INTERSECTIONS NEAR VERTICAL CURVES 2. Government Accession
Matt Dykstra PSU MGIS Program
 Matt Dykstra PSU MGIS Program Outline Background Objective Existing Research Methodology Conclusions Significance and Limitations Two-way cycle track: Streetsblog.org Background What is bicycle infrastructure?
An Assessment of Potential Greenhouse Gas Emissions Reductions from Proposed On Street Bikeways
 An Assessment of Potential Greenhouse Gas Emissions Reductions from Proposed On Street Bikeways Through the Sustainable Bethlehem Initiative, the Town of Bethlehem has identified both the improvement of
Traffic Impact Study. Westlake Elementary School Westlake, Ohio. TMS Engineers, Inc. June 5, 2017
 TMS Engineers, Inc. Traffic Impact Study Westlake Elementary School Westlake, Ohio June 5, 2017 Prepared for: Westlake City Schools - Board of Education 27200 Hilliard Boulevard Westlake, OH 44145 TRAFFIC
REGIONAL BICYCLE AND PEDESTRIAN DESIGN GUIDELINES
 REGIONAL BICYCLE AND PEDESTRIAN DESIGN GUIDELINES November 16, 2011 Deb Humphreys North Central Texas Council of Governments Bicycle and Pedestrian Advisory Committee Snapshot of the Guide 1. Introduction
Yellow and Red Intervals It s Just a Matter of Time. 58 th Annual Alabama Transportation Conference February 9, 2015
 Yellow and Red Intervals It s Just a Matter of Time 58 th Annual Alabama Transportation Conference February 9, 2015 Presentation Content Background on Timing Methodology Findings and Recommendations from
Appendix A: Crosswalk Policy
 Appendix A: Crosswalk Policy Appendix A: Crosswalk Policy Introduction This citywide Crosswalk Policy is aimed at improving pedestrian safety and enhancing pedestrian mobility by providing a framework
Off-road Trails. Guidance
 Off-road Trails Off-road trails are shared use paths located on an independent alignment that provide two-way travel for people walking, bicycling, and other non-motorized users. Trails specifically along
New in the MUTCD: The Flashing Yellow Arrow Presented at the 57 th Annual Traffic and Safety Conference May 17, 2006
 New in the MUTCD: The Flashing Yellow Arrow Presented at the 57 th Annual Traffic and Safety Conference May 17, 2006 David A. Noyce, Ph.D., P.E. University of Wisconsin - Madison The FYA Story Research
Do Bike Lane Stripes Calm Motor Traffic? Wayne Pein
 Do Bike Lane Stripes Calm Motor Traffic? Wayne Pein wpein@nc.rr.com January 2008 Introduction Among other alleged benefits, bike lane proponents often claim that narrowing a wide lane with bike lane striping
Appendix 3 Roadway and Bike/Ped Design Standards
 Appendix 3 Roadway and Bike/Ped Design Standards OTO Transportation Plan 2040 4/20/2017 Page A3-1 Adopted Standards The adopted OTO Design Standards and Major Thoroughfare Plan are contained herein.
NM-POLICY 1: Improve service levels, participation, and options for non-motorized transportation modes throughout the County.
 Transportation PRINCE WILLIAM COUNTY 2008 COMPREHENSIVE PLAN NON-MOTORIZED PLAN CONTENTS Goals, Policies, and Action Strategies Table 4 (Bike Facility Classifications and Descriptions) Table 5 (Bike Facility
UNCONTROLLED PEDESTRIAN CROSSING GUIDELINES
 City and County of Denver UNCONTROLLED PEDESTRIAN CROSSING GUIDELINES Prepared for: Prepared by: Adopted September 2016 This page is intentionally left blank. Contents for Denver Uncontrolled Pedestrian
City of Elizabeth City Neighborhood Traffic Calming Policy and Guidelines
 City of Elizabeth City Neighborhood Traffic Calming Policy and Guidelines I. Purpose: The City of Elizabeth City is committed to ensure the overall safety and livability of residential neighborhoods. One
Title: Modeling Crossing Behavior of Drivers and Pedestrians at Uncontrolled Intersections and Mid-block Crossings
 Title: Modeling Crossing Behavior of Drivers and Pedestrians at Uncontrolled Intersections and Mid-block Crossings Objectives The goal of this study is to advance the state of the art in understanding
Safety Effectiveness of Pedestrian Crossing Treatments
 Portland State University PDXScholar TREC Friday Seminar Series Transportation Research and Education Center (TREC) 10-13-2017 Safety Effectiveness of Pedestrian Crossing Treatments Christopher Monsere
Corpus Christi Metropolitan Transportation Plan Fiscal Year Introduction:
 Introduction: The Safe, Accountable, Flexible, Efficient Transportation Equity Act: A Legacy for Users (SAFETEA-LU) has continued the efforts started through the Intermodal Surface Transportation Efficiency
EUCLID AVENUE PARKING STUDY CITY OF SYRACUSE, ONONDAGA COUNTY, NEW YORK
 EUCLID AVENUE PARKING STUDY CITY OF SYRACUSE, ONONDAGA COUNTY, NEW YORK CITY OF SYRACUSE DEPARTMENT OF PUBLIC WORKS 1200 CANAL STREET EXTENSION SYRACUSE, NEW YORK 13210 DRAFT REPORT DATE: November 13,
TRAFFIC STUDY GUIDELINES Clarksville Street Department
 TRAFFIC STUDY GUIDELINES Clarksville Street Department 9/1/2009 Introduction Traffic studies are used to help the city determine potential impacts to the operation of the surrounding roadway network. Two
SANTA CLARA COUNTYWIDE BICYCLE PLAN August 2008
 SANTA CLARA COUNTYWIDE BICYCLE PLAN August 2008 To assist VTA and Member Agencies in the planning, development and programming of bicycle improvements in Santa Clara County. Vision Statement To establish,
Planning Guidance in the 2012 AASHTO Bike Guide
 Planning Guidance in the 2012 AASHTO Bike Guide Presentation by: RJ Eldridge Peter Lagerwey August 22, 2012 WEBINAR 2: PLANNING GUIDANCE IN THE 2012 AASHTO BIKE GUIDE Today s Webinar Significant Updates
EVALUATION OF A GREEN BIKE LANE WEAVING AREA IN ST. PETERSBURG, FLORIDA. William W. Hunter Senior Research Scientist
 EVALUATION OF A GREEN BIKE LANE WEAVING AREA IN ST. PETERSBURG, FLORIDA William W. Hunter Senior Research Scientist Raghavan Srinivasan Senior Transportation Research Engineer Carol A. Martell Senior Applications
Residential Traffic Calming Program Guide. Town of Ashland, Virginia
 Residential Traffic Calming Program Guide Town of Ashland, Virginia August 1, 2006 TABLE OF CONTENTS A. INTRODUCTION... 1 B. GOALS... 1 C. CRITERIA... 1 D. IDENTIFYING NEIGHBORHOOD TRAFFIC CONCERNS...
A Review of Literature:
 A Review of Literature: Intersection Treatments to Improve Bicycle Access and Safety Lynn Weigand, Ph.D. Portland State University Center for Urban Studies Center for Transportation Studies Initiative
Gordon Proctor Director Policy on Accommodating Bicycle and Pedestrian Travel on ODOT Owned or Maintained Facilities
 Approved: Policy: 20-004(P) Responsible Office: Planning Gordon Proctor Director Policy on Accommodating Bicycle and Pedestrian Travel on ODOT Owned or Maintained Facilities I. POLICY STATEMENT: This policy
RE: City of Portland Request to Experiment with HAWK/Bike signal
 October 4, 2005 Regina S. McElroy, Director Office of Transportation Operations HOTO Room 3401 400 7 th Street, S.W. Washington, D.C. 20590 RE: City of Portland Request to Experiment with HAWK/Bike signal
The 2009 Manual on Uniform Traffic Control Devices (MUTCD) (Brief) Highlights for Arizona Practitioners. Arizona Department of Transportation
 (Brief) Highlights for Arizona Practitioners. Arizona Department of Transportation") The 2009 Manual on Uniform Traffic Control Devices (MUTCD) (Brief) Highlights for Arizona Practitioners Arizona Department of Transportation New 2009 MUTCD 9 Parts (down from 10 in 2003) 816 pages (up
The 2009 Manual on Uniform Traffic Control Devices (MUTCD) (Brief) Highlights for Arizona Practitioners Arizona Department of Transportation New 2009 MUTCD 9 Parts (down from 10 in 2003) 816 pages (up
Broad Street Bicycle Boulevard Design Guidelines
 Broad Street Bicycle Boulevard Design Guidelines Building from the strategies introduced in the 2013 Bicycle Transportation Plan and community input received thus far, City Transportation Staff have identified
On Road Bikeways Part 1: Bicycle Lane Design
 On Road Bikeways Part 1: Bicycle Lane Design Presentation by: Nick Jackson Bill Schultheiss, P.E. September 04, 2012 FOLLOW THE CONVERSATION ON TWITTER Toole Design Group is live tweeting this webinar
IMPROVING PEDESTRIAN SAFETY AT UNCONTROLLED CROSSINGS. Guidelines for Marked Crosswalks
 IMPROVING PEDESTRIAN SAFETY AT UNCONTROLLED CROSSINGS Presented by Nazir Lalani P.E. Traffex Engineers Inc. N_lalani@hotmail.com Guidelines for Marked Crosswalks Source: FHWA, Safety Effects of Marked
Bicycle-Specific Traffic Control Is it "Bicycle-Friendly"?
 Bicycle-Specific Traffic Control Is it "Bicycle-Friendly"? Richard C. Moeur, P.E. In the United States, the Uniform Vehicle Code and most state laws treat bicyclists as having much the same rights and
Webinar: A Comprehensive Evaluation of Protected Cycling Facilities: Lessons from Five Cities
 Portland State University PDXScholar TREC Webinar Series Transportation Research and Education Center (TREC) 3-19-2015 Webinar: A Comprehensive Evaluation of Protected Cycling Facilities: Lessons from
General Design Factors
 Chapter 3: 3-1.0 Introduction General Design Factors Mn/DOT s goals include encouraging and accommodating safe bicycling. From a design perspective, these goals are achieved by first having an understanding
Cycling and risk. Cycle facilities and risk management
 Cycling and risk Cycle facilities and risk management Failure to recognize possibilities is the most dangerous and common mistake one can make. Mae Jemison, astronaut 6/11/2010 York Regional Council Cycling
TRAFFIC SIGNAL WARRANT STUDY
 TRAFFIC SIGNAL WARRANT STUDY 5 th STREET & ENCHANTED PINES DRIVE JANUARY 2013 TRAFFIC OPERATIONS ENGINEERING SERVICES/PUBLIC WORKS DEPARTMENT TABLE OF CONTENTS INTERSECTION LOCATION MAP ii INTRODUCTION
TRANSPORTATION ANALYSIS REPORT US Route 6 Huron, Erie County, Ohio
 TRANSPORTATION ANALYSIS REPORT US Route 6 Huron, Erie County, Ohio December 12, 2012 Prepared for: The City of Huron 417 Main Huron, OH 44839 Providing Practical Experience Technical Excellence and Client
Relationship of Road Lane Width to Safety for Urban and Suburban Arterials
 Relationship of Road Lane Width to Safety for Urban and Suburban Arterials Phd. Alma AFEZOLLI Polytechnic University of Tirana Construction and Infrastructure Department of Civil Engineering Faculty Tirana,
Active Transportation Facility Glossary
 Active Transportation Facility Glossary This document defines different active transportation facilities and suggests appropriate corridor types. Click on a facility type to jump to its definition. Bike
Physical Implications of Complete Streets Policies
 Presentation Overview Physical Implications of Complete Norm Cox, ASLA, LLA Landscape Architect Ann Arbor, Michigan, 10:45 to Noon What Are Complete Streets? What Matters to Bicyclists and Pedestrians
TRAFFIC CONTROLS FOR BICYCLE FACILITIES
 PART IX. TRAFFIC CONTROLS FOR BICYCLE FACILITIES A. GENERAL 9A-1 Requirements for Bicyclist Traffic Control Devices Traffic control devices, whether they are intended for motorists or bicyclists, must
Turn Lane Warrants: Concepts, Standards, Application in Review
 Turn Lane Warrants: Concepts, Standards, Application in Review David J. DeBaie P.E., P.T.O.E. 2004 ITE, District 1 Annual Meeting Burlington, Vermont Introduction Turning lanes at intersections reduce
ADVISORY BICYCLE LANES REALITY VERSUS DESIGN GUIDANCE
 Michael Williams 0 ADVISORY BICYCLE LANES REALITY VERSUS DESIGN GUIDANCE Michael Williams (Corresponding author) Alta Planning + Design SE Grand Avenue Portland, OR Email: michaelwilliams@altaplanning.com
TRAFFIC IMPACT STUDY And A TRAFFIC SIGNAL WARRANT ANALYSIS FOR A SENIOR LIVING AND APARTMENT DEVELOPMENT
 TRAFFIC IMPACT STUDY And A TRAFFIC SIGNAL WARRANT ANALYSIS FOR A SENIOR LIVING AND APARTMENT DEVELOPMENT DEERFIELD TOWNSHIP, WARREN COUNTY, OHIO Nantucket Circle and Montgomery Road () Prepared for: ODLE
Driver Behavior in the Presence of Pedestrians at Signalized Intersections Operating the Flashing Yellow Arrow
 Portland State University PDXScholar Civil and Environmental Engineering Faculty Publications and Presentations Civil and Environmental Engineering 2-2013 Driver Behavior in the Presence of Pedestrians
Transportation Impact Study for Abington Terrace
 Transportation Impact Study for Abington Terrace Abington Township, Montgomery County, PA Sandy A. Koza, P.E., PTOE PA PE License Number PE059911 Prepared by McMahon Associates, Inc. 425 Commerce Drive,
Transportation Curriculum. Survey Report
 Transportation Curriculum Survey Report Jennifer Dill, Ph.D. Lynn Weigand, Ph.D. Portland State University Center for Urban Studies Center for Transportation Studies Initiative for Bicycle and Pedestrian
NJDOT Complete Streets Checklist
 Background The New Jersey Department of Transportation s Complete Streets Policy promotes a comprehensive, integrated, connected multi-modal network by providing connections to bicycling and walking trip
Evaluation of Innovative Bicycle Facilities:
 Evaluation of Innovative Bicycle Facilities: SW Broadway Cycle Track & SW Stark/Oak Street Buffered Bike Lanes FINAL REPORT Prepared for: City of Portland Bureau of Transportation by: Christopher Monsere,
Appendix C. Bicycle Route Signage
 Appendix C Bicycle Route Signage This page intentionally left blank. APPENDIX C - BICYCLE ROUTE AND WAYFINDING SIGNAGE Bicycle route signs are wayfinding signs that guide bicyclists along preferred, designated
10.0 CURB EXTENSIONS GUIDELINE
 10.0 CURB EXTENSIONS GUIDELINE Road Engineering Design Guidelines Version 1.0 March 2017 City of Toronto, Transportation Services City of Toronto Page 0 Background In early 2014, Transportation Services
Who is Toole Design Group?
 2018 AASHTO Bike Guide Status Update NCHRP 15 60 Amalia Leighton Cody, PE, AICP & Kenneth Loen, PE Washington APWA October 4, 2018 Who is Toole Design Group? TDG is a full service engineering, planning
Webinar: Exploring Pedestrian Responsive Traffic Signal Timing Strategies in Urban Areas
 Portland State University PDXScholar TREC Webinar Series Transportation Research and Education Center (TREC) 1-29-2015 Webinar: Exploring Pedestrian Responsive Traffic Signal Timing Strategies in Urban
POLICY: TRAFFIC CALMING
 2006 MAY REFERENCE: COUNCIL APPROVED BY COUNCIL MAY 23, 2006 CITY OPERATIONS - NO. 608 POLICY: TRAFFIC CALMING A. All requests for traffic calming within the City shall be considered in accordance with
Synthesis of Safety For Traffic Operations. Leanna Belluz Transport Canada. Gerry Forbes, M.Eng., P.Eng., P.T.O.E. Intus Road Safety Engineering Inc.
 Synthesis of Safety For Traffic Operations Leanna Belluz Transport Canada Gerry Forbes, M.Eng., P.Eng., P.T.O.E. Intus Road Safety Engineering Inc. Paper prepared for presentation at the Traffic Operations
CITY OF OAKLAND. 27th Street Bikeway Feasibility and Design. Final Report (v3) March 23, Kimley-Horn and Associates, Inc.
 March 23, Kimley-Horn and Associates, Inc.") CITY OF OAKLAND 27th Street Bikeway Feasibility and Design Final Report (v3) March 23, 2007 PREPARED BY: Kimley-Horn and Associates, Inc. Table of Contents 1. Introduction 3 2. 27 th Street/Bay Place Corridor
CITY OF OAKLAND 27th Street Bikeway Feasibility and Design Final Report (v3) March 23, 2007 PREPARED BY: Kimley-Horn and Associates, Inc. Table of Contents 1. Introduction 3 2. 27 th Street/Bay Place Corridor
TRAFFIC IMPACT ANALYSIS
 TRAFFIC IMPACT ANALYSIS FOR THE CHAMPAIGN UNIT#4 SCHOOL DISTRICT PROPOSED HIGH SCHOOL (SPALDING PARK SITE) IN THE CITY OF CHAMPAIGN Final Report Champaign Urbana Urbanized Area Transportation Study 6/24/2014
Strategic Research PROGRAM FOLLOW-UP ASSESSMENT OF THE MOBILEYE SHIELD+ COLLISION AVOIDANCE SYSTEM
 165610-1 Strategic Research PROGRAM FOLLOW-UP ASSESSMENT OF THE MOBILEYE SHIELD+ COLLISION AVOIDANCE SYSTEM March 2017 1. Report No. TTI/SRP/17/165610-1 2. Government Accession No. 3. Recipient's Catalog
Stress Bikeway Network
 Building Portland s Low- Stress Bikeway Network Photo credit: Michael Anderson Bikeportland.org Designing Streets 2015 Austin, TX October 29 2015 Roger Geller Portland Background Existing low- and lower-stress
Date: April 4, Project #: Re: A Street/Binford Street Traffic/Intersection Assessment
 To: Peter Cavanaugh General Electric From: David Bohn, PE Ryan White, PE Date: April 4, 217 Project #: 13421. Re: / Traffic/Intersection Assessment Consistent with the Cooperation Agreement between the
D.13 Transportation and Traffic
 This section addresses transportation and traffic issues and impacts related to the Proposed Project. Section D.13.1 provides a description of the affected environment for the Proposed Project. Applicable
Evaluation of service quality for pedestrian crossing flow at signalized intersection
 Evaluation of service quality for pedestrian crossing flow at signalized intersection Assist. Prof. Dr. Mehdi Al-Kubaisi Republic of Iraq University of Anbar-College of Engineering- Civil Department Email:
In-Road Warning Lights: Revisiting Pedestrian Crosswalk Application Faisal Hamood, Emelinda M. Parentela, Zaki Mustafa and Crystal Killian
 In-Road Warning Lights: Revisiting Pedestrian Crosswalk Application Faisal Hamood, Emelinda M. Parentela, Zaki Mustafa and Crystal Killian Abstract This paper presents a case study on the condition of