Bridging the Gaps: How the Quality and Quantity of a Connected Bikeway Network Correlates with Increasing Bicycle Use
|
|
|
- Marylou Little
- 5 years ago
- Views:
Transcription
1 Bridging the Gaps: How the Quality and Quantity of a Connected Bikeway Network Correlates with Increasing Bicycle Use July 27, 2005 Word Count: 3,900 Authors: Mia Birk, Principal * Alta Planning + Design 1638 NE Davis St Portland, OR (503) fax: (503) miabirk@altaplanning.com Roger Geller, Bicycle Coordinator Portland, Oregon 1120 SW 5 th Ave, Room 800 Portland, OR (503) fax: (503) roger.geller@pdxtrans.org * Mia Birk was the Bicycle Program Manager for the City of Portland from Currently she is a Principal with the Portland office of Alta Planning + Design, a firm specializing in bicycle, pedestrian, and trail planning and design.
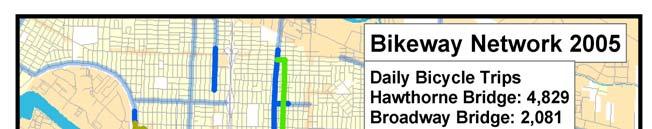
2 Abstract Since the mid-1990s Portland, Oregon has pursued a build it and they will come strategy by developing its bikeway network to promote increased bicycle use. Between 1992 and 2005 Portland increased its developed bikeway network by 215%, from 83 miles to 260 miles. During this same period, bicycle use in Portland soared. A comparison of 1990 and 2000 census data shows a doubling of bicycle commute trips citywide, with more dramatic increases in close-in neighborhoods. Annual bicycle counts on Portland s central city bridges, which connect close-in residential neighborhoods across the Willamette River to the city s primary commercial and employment center, show a 210% increase in bicycle trips between 1991 and This dramatic increase in bicycling occurred primarily in those corridors where the city has made significant investment to: improve bicycling conditions on the river bridges; create connected bicycle facilities leading to the bridges; and mitigate for traffic designs that are not particularly bicycle-friendly. The corridors where the network is most connected, and where the quality of the facilities is the highest, display the largest growth in bicycle trips. Data collected by Portland demonstrates a strong correlation between a connected, bikeway system constructed to the highest standards, and increases in bicycle use. The authors believe that the City s investments in specific facility improvements to its downtown Willamette River bridges, as well as to key bridge access routes and connections, have been the primary impetus behind increasing bicycle use.
3 Bridging the Gaps: How the Quality and Quantity of a Connected Bikeway Network Correlates with Increasing Bicycle Use Introduction One of the greatest challenges facing the bicycle and pedestrian field is the lack of documentation on usage and demand. Without accurate and consistent demand and usage figures, it is difficult to measure the positive benefits of investments in these modes, especially when compared to the other transportation modes such as the private automobile. The Institute of Transportation Engineers (ITE) Trip Generation Manual is the basis of automobile usage projections that lead to all manners of decisions about roadway and intersection capacity design. It is based on decades of experience with automobile counts. There is nothing comparable in the bicycle and pedestrian planning field as of yet; a national ITE-sponsored program has just begun development of such a database via systematic counts of bicyclists. The City of Portland has been a leader in conducting bicycle counts. Over the past two decades, it has developed an extensive count database. This has included: Before-and-after counts related to specific projects, Regular cordon counts of all entry points to the Downtown, and Annual counts on its Downtown bridges and key access routes. The count data reveals that bicycle use in the inner parts of Portland has soared. The authors believe that the City s investments in specific facility improvements to its downtown Willamette River bridges, as well as to key bridge access routes and connections, have been the impetus behind this trend. The authors analyze the City s bicycle count database related to these improvements, and discuss results and key factors in achieving success. Particular attention is given to both the quality and quantity (or level of bikeway network completion) of the facilities in specific corridors.
4 Background Portland s Willamette River cuts through the heart of the City and provides social, economic, and recreational benefits. The Willamette River bridges connect the City s east and west sides on the west side is Portland s vibrant and economically critical downtown, on the east side are light industries, emerging business districts, and pedestrian and bicycle-friendly neighborhoods. Simply put, the bridges are critical for mobility. In the early 1990s, the City embarked upon a major program to engage cyclists and potential cyclists in a dialogue about ways to increase cycling as a means of transportation. Overwhelmingly, improvements to the bridges approaches and spans, as well as to the network feeding the bridges 1, were seen as the highest priority because of the poor conditions. The City and its partners 2 then adopted a build it and they will come approach by investing in improving bridge facility quality and access. 3 They collaborated on an ISTEA-funded study called the Willamette River Bridges Access Project (WRBAP), for which consultants CH2MHill identified over $15 million in potential bicycle, pedestrian, and ADA improvements. The City and County subsequently implemented many of these via grants from ODOT, ISTEA, and through routine City of Portland, Multnomah County, and ODOT bridge and approach maintenance work. At the time, all bridges had access problems, such as: Cyclists having to cross motor vehicle ramps with no markings or yield control. Lack of bikeway facilities on approaching congested streets and structures. Conflicts between bicyclists and pedestrians on narrow sidewalks and other points. On the Steel Bridge upper deck, the sidewalks were so narrow that bicyclists were supposed to walk their bikes, while on the Morrison Bridge the sidewalks were and still are inaccessible and cross freeway exit ramps. On the Hawthorne and Broadway Bridges, cyclists could share narrow, slippery sidewalks and had no connecting bike lanes or curb cuts. On the Burnside and Morrison Bridges, 1 The network feeding the bridges is defined as those developed bikeways within approximately 3 miles of the bridge that, in our estimation, most directly serve cyclists either coming to or leaving the bridges. 2 Jurisdictional responsibility for the bridges is relatively complex. The City of Portland is responsible for signing, striping, and access to all bridges. Multnomah County owns and operates four of the bridges (Hawthorne, Morrison, Burnside, and Burnside), with split ownership and operation over the Steel Bridge between Multnomah County (upper deck) and the Union Pacific Railroad (the lower deck is a railroad bridge with mainline freight and passenger rail cars about once an hour.) 3 The City based its concept on a controlled cross-sectional study in Delft, Netherlands, in which households in an intervention suburb with improved bicycle connections reported a 3% increase in bicycle mode share compared to no net increase in bicycle mode share in the control area without bicycle improvements. 2
5 bicyclists could theoretically use the outside, relatively narrow 10 wide, fast-moving outside travel lanes. All in all, the entire situation was dismal. Improvements Implemented Over $12 million worth of improvements have been implemented, primarily on and leading to and from four of the downtown bridges: Hawthorne, Burnside, Steel, and Broadway. Preliminary design for improvements on the fifth downtown bridge Morrison is underway as of Fall The measures implemented on the four main bridges are shown in the photos below and described for each bridge in Table 1. The measures include: Improvements to bridge facilities (widening sidewalks on Hawthorne Bridge, sidewalk in-fill in approach areas, replacement of slippery sidewalk surface on both Hawthorne and Broadway Bridges, addition of shared use path on Steel Bridge). Striping bicycle lanes, signing (on the bridge span on Burnside Bridge, and on most approaches and access streets within about a mile of the bridges on Portland s inner eastside). Designation and then implementation of a network of feeder bicycle routes within about three miles, including striping bicycle lanes and implementing bicycle boulevards. 4 Focus on safety at conflict areas (closure of on-ramp from Naito to Hawthorne Bridge, reconstruction of conflict areas on approaches to Hawthorne and Broadway Bridges, blue bike lane implementation in conflict zones on approaches to Broadway and Hawthorne Bridges). Redesigning sidewalk ramps to meet ADA (all bridges). It should be noted that many of the improvements were made in conjunction with other bridge upgrade or reconstruction projects, thus costs for specific bike/pedestrian improvements are not always available. Also note that the City used blue pavement areas in bike/motor vehicle conflict areas on the approaches from the eastside for two bridges as a means to mitigate for roadway designs not generally considered bicycle-friendly. Blue bike lanes as a safety technique are discussed in the City of Portland publication, Blue Bike Lanes for Cycling Safety (City of Portland, 1997). 4 A bicycle boulevard is defined by the Portland Bicycle Master Plan as a shared roadway (bicycles and motor vehicles share the space without marked bicycle lanes) where the through movement of bicycles is given priority over motor vehicle travel on a local street. Traffic calming devices are used to control traffic speeds and discourage through trips by motor vehicles. Traffic control devices are designed to limit conflicts between automobiles and bicycles and favor bicycle movement on the boulevard street. Portland has a number of excellent, highly used boulevards that run parallel to major roadways. 3
6 It is also worth noting that the majority of improvements made to Portland s bikeway network were state of the art facilities that followed the highest standards and best practices in the U.S. Portland striped bicycle lanes of ample width and eliminated traffic hazards wherever possible. Transitions between bicycle lanes and off-street paths were well designed and clearly marked. Facilities were created with an emphasis on maximum connectivity. Boulevard arterial crossings are designed effectively and individually for each situation, and include bicycle-only signals where needed, adjustments to timing on other signals, and installation of bicycle boxes at one intersection to assign priority to cylcists. Portland also uses traffic calming techniques on boulevards when speeds are found to be too high. Six of Portland s ten blue bicycle lanes, which assign priority to bicyclists in an area of an auto-bicycle weave, are found along approaches to the Hawthorne and Broadway bridges. While Portland has striven to complete a large proportion of its bikeway network, it has tried to provide the highest quality of facilities possible. 4


7 Photo Gallery: Portland Bridge Improvements Photoset 1. Broadway Bridge Improvements 1992: Westside, westbound. Bike signal, no bike lanes. 2002: Westside, westbound. New bike signal splits bike movements. Bike lanes on approaches and connecting streets. 5


8 Photoset 2. Steel Bridge Improvements Before: Steel Bridge, upper deck. Bicyclists and pedestrians sharing one 5 sidewalk with guardrail. After: Steel Bridge Riverwalk on lower deck. It s a cantilevered 10 shared use path connecting to paths on either side 6

9 Photoset 3. Hawthorne Bridge Before Improvements Bikes/peds share 6 sidewalks Bikes make 70% deg. turn, yield to motor vehicles, which are often queued in crosswalk. (see photo page 8) No bike lanes connect to roadway entry Ramp from Naito with conflicts Hawthorne Bridge westside, eastbound, before improvements made. 7
 Ramp from Naito closed Bike lanes connect to")
10 Photoset 4. Hawthorne Bridge After Improvements Sidewalks widened to 10.5 Bike/ped movements split, motorists must stop, cyclist have through movement priority (see photo page 9) Ramp from Naito closed Bike lanes connect to roadway entry (off photo) Hawthorne Bridge westside, eastbound, after improvements made. 8


11 Photoset 5. Hawthorne Bridge Improvements before & after Before: Eastbound Hawthorne Bridge access to sidewalks bicyclists make sharp turn, yield to motorists. Note 6 wide sidewalks. After: Eastbound Hawthorne Bridge access to sidewalks bicyclists proceed straight, motorists yield, Note 10.5 wide sidewalks. 9


12 Photoset 6. Hawthorne Bridge Improvements before & after 2 Eastbound eastside, connecting to Hawthorne St. bike lanes Blue area on eastbound viaduct at off-ramp Eastbound, westside Westbound, eastside Hawthorne: Bike lanes added on all approaches. Bike lanes added to all connecting streets: SW Main, SW Madison, SE Hawthorne, SE Madison. Blue bike area used at areas where motorists cross bicycle lane. 10
13 Table 1: Bridge improvements, costs, funding sources Bridge Status Before Measures Implemented Cost* Remaining deficiencies Hawthorne Cyclists and pedestrians sharing six-foot wide sidewalks. No bike lanes and minimal sidewalks on approaches and access routes. Bicyclists shared roadway or used sidewalks to access. Problematic interaction between cyclists and motor vehicles in several areas. Burnside Bikes and pedestrians on 10 wide sidewalks. Bike access via bicycle boulevard treatment on SE Ankeny. Steel Bikes and pedestrians sharing approx 5-foot sidewalk on south side, upper deck. Some cyclists on roadway. Broadway Bikes and peds on 10 wide sidewalks with slippery surface. No bike lanes on connecting surface streets. Approaches with numerous ill-defined conflict areas. Sidewalks widened to 10.5-feet on each side. Bike lanes striped on all approaches and connecting roadways. Sidewalk in-fill on approaches. Curb ramps rebuilt to meet ADA. Eastbound approach, Westside: 1 st ramp from Naito Parkway closed, eliminating conflict area. Second ramp reconfigured to force motorists to stop and give cyclists and pedestrians priority, separate bike and pedestrian crossing areas. Blue bike lanes introduced in conflict zones on east side. Deck restriped with bike lanes by removing one travel lane in non-peak direction New 12 bike/ped path added to lower deck, along with new shared use path (Eastbank Esplanade) and bike lanes on eastside approaches. Bikes on roadway signing on upper deck. Sidewalk surface replaced (sidewalk width same). Bike lanes added to all connecting surface streets and ramps. Conflict areas on approaches modified and defined (by blue bike areas in two cases). Sidewalk widening: $1.2 million Other changes: $200, None. $20,000 Poor connections to/from SE Ankeny Bikeway and downtown $10 million Poor access on eastside through Rose Quarter $300,000 None.
14 Bridge Status Before Measures Implemented Cost* Remaining deficiencies Morrison Bikes and peds on narrow sidewalks. Very constrained. Dangerous conflict areas at highway ramps. Design underway as of Fall 2005, with wide esplanade to be added on south side, along with access improvements N/A See previous columns * Funding sources: Oregon Department of Transportation Bike/Pedestrian Grants; Federal Intermodal Surface Transportation Efficiency Act and Transportation Equity Act for the 21 st Century funding through Surface Transportation Program, Enhancements, and Congestion Mitigation Air Quality funds; local tax increment financing; and Multnomah County & Portland transportation funding 12
15 Data Collection and Evaluation Methodology Many methodologies claim to predict potential bicycle and pedestrian use given various changes to the physical environment. These range from surveys (discrete choice models) to comparisons with similar facilities (comparison models) to estimates based on demographic and land use data (sketch plan models). However, none of these have been correlated to actual use over time as of yet. In Portland, hand and automated tube counts have been used to track bicycle use in various locations around the city over a 20-year period. This gives Portland the ability to compare both trends over time and before and after correlations at specific locations. Each summer, the City works with students for the hand counts of downtown feeder routes. City data collection personnel also routinely count bicyclists and pedestrians whenever they conduct motorist hand counts (for intersection movements.) On routes with separated sidewalks or bicycle lanes 24-hour tube counts are utilized. Finally, the City has used video cameras for 24 hour counts in specific circumstances. The City typically gathers hand count data as two-hour peak-period counts. Through examination of 24-hour videotapes and 24-hour tube counts at many of these same locations, the City has determined that this peak two-hour period is approximately one-fifth of average daily bicycle traffic. Overall City Bicycle Usage Trends In terms of trends, based on extrapolations from peak-hour counts on the four key Willamette River bridges, Portland s ridership increased 210% between 1991 and During this time, the number of miles of overall bikeways increased 215%, from 65 miles in 1991 to over 230 miles in 2004 (see Figure 1). It should also be noted that during this time, bicycle use increase has eclipsed increases in overall population as well as motor vehicle trips on these same bridges. A Portland survey administered on the four bridges in 2001 showed that one-third of the 600 respondents began bicycle commuting within the past two years, with another one-third reporting began bicycle commuting within the past five years. Evaluation of before and after counts at specific locations around and over the Bridges will be discussed in the following section. The census has shown an increase as well (see Figure 2), with bicycle mode share rising from approximately 1% to 3%, with greater increases in specific areas (mostly the dense, flat inner City neighborhoods. 13
 Relative to Increasing Bikeway Network")
16 Figure 1: Portland Bridge Bicycle Traffic (Hawthorne, Broadway, Steel, and Burnside) Relative to Increasing Bikeway Network Mileage 14


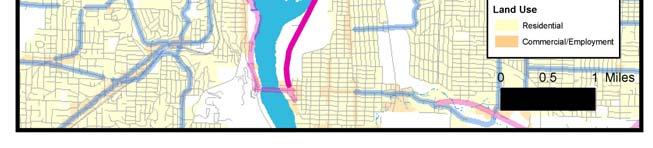
17 Figure 2: Bike mode split by census tract, 1990 and 2000, with bicycle network shown in black 15


18 Results/Analysis The City of Portland s count data shows an enormous increase over time in bicycle use on the four main bridges and their connecting bikeways. Recreational trips have increased enormously as well. Joggers and cyclists frequently use the Hawthorne and Steel bridges and their connecting paths as a downtown exercise loop during the day and on weekends. A clear correlation can be seen between the increased bike use and improved facilities on and leading to the four bridges discussed. On the Hawthorne, Burnside, and Broadway bridges alone, bike use went up 78% in the 1990s, compared with a 14% increase in the population and an 8% increase in motor vehicle use on these bridges. Based on our knowledge of these bridges, their access routes, and the trends we ve seen, we believe that there are two key factors at play: Quantity of facilities: Completeness of network (bikeways on all routes leading up to the bridge, gaps, clarity of route connections) Quality of facility itself: Separation on bridge spans versus bike lanes or shared lanes. On connector street routes, presence of bicycle lanes or bicycle boulevard improvements, and quality of intersection improvements. Below, we examine each bridge, the sequence of improvements made, and the resulting increases in bicycle use (see Table 2.) Bicycle count increases on these four bridges are shown in Figure 3. Figure 3: Average daily bicycle traffic, Willamette River Bridges 16
19 Table 2. Network Completion and Daily Trips Broadway Bridge Hawthorne Bridge Burnside Bridge Year % completion of network feeding bridge Daily Bicycle Trips % completion of network feeding bridge Daily Bicycle Trips % completion of network feeding bridge Daily Bicycle Trips Pre % % 1, % % % 1, % 1, % % 1, % 1, % % 1, % % % 1, % % % 2, % 1, % 1,205 63% 2,170 12% 1, % 1,854 72% 2,471 19% % 1,476 74% 3,154 22% % 1,405 77% 3,125 30% 1, % 1,680 77% 3,729 30% % 1,712 82% 3,682 30% % 1,683 99% 4,055 38% % * 99% 4,428 38% % 2, % 4,829 38% 1,170 * Broadway Bridge during season of count +No actual count assumption of 0 increase based on experience of previous 2 years. Hawthorne Bridge The Hawthorne Bridge has always carried the heaviest bicycle traffic of any Portland bikeway, reflecting the longer history of developed bicycle boulevards feeding it and its proximity to Downtown. By 1992 a network of bikeways brought cyclists close to the bridge. (See Figure 7.) By 1998 both arterial approaches to the Hawthorne were striped with bicycle lanes. These arterials in turn connected directly to the bicycle boulevard network, creating a stronger and more complete link to the bridge. The average daily bicycle traffic in the period before the arterials were striped ( ) was almost 1,900. The average daily traffic on the bridge grew steadily between 1997 and 2002 and averaged a bit more than 3,200 during this period. This represents an increase of approximately 70%. The most significant jump in use occurred in 1999, after the sidewalks were widened, from about 2400 cyclists to over 3100 a 32% increase in one year. In 2001, bicycle use jumped by over 20%. No specific improvements were made that year to the Hawthorne Bridge. However, this is the year that the Steel Bridge Riverwalk opened, which created a recreational/exercise loop using the Hawthorne Bridge, Eastbank Esplanade, Steel Bridge Riverwalk, and Tom McCall Waterfront Park. By 2003 Portland had built a riverfront pathway ( Springwater on the Willamette ) that connected between a large residential area to the south of the Central City and the Hawthorne Bridge. Prior to the construction of this pathway residents of this neighborhood had only an out-of-direction bikeway connection to the central city, with substandard facilities. With the opening of this pathway connection, ridership continued to grow across the Hawthorne. Daily bicycle trips on the bridge 17


20 averaged almost 4,500 between , with the highest number of daily trips recorded in From 2003 on, bicycle use increased 9-10% per year. All in all, bicycle traffic on the Hawthorne grew 220% between 1992 and 2005 (See Figures 7-12 showing the expansion of the bikeway network around the bridges. See Figure 4 showing the correlation of the network expansion with usage.) Figure 4. Increasing Bicycle Use on Hawthorne Bridge Broadway Bridge The Broadway Bridge itself has generally been amenable to bicycling during the study period. Sidewalks have 8.5 feet of clear space and mostly carry only one direction of bicycle travel. Pedestrians are few. However, the bikeway network feeding this bridge essentially did not exist until late into the 1990s. Prior to 1996, cyclists could choose to either wend their way through a local street network crossing arterial streets as they best were able or sharing arterial travel lanes with relatively high volumes of high speed motorists. Along the route they needed to negotiate dual right-turns onto a freeway on-ramp and various auto-bicycle crossovers and merges. Whether primarily riding arterial streets or local streets, all cyclists needed to ride on some segments of arterial streets in the final approach to the bridge, and also had to ride unstriped arterial streets after crossing the bridge. Daily bicycle trips across the Broadway, in the absence of bicycle facilities, averaged 640 during this period between pre-1992 through By 1996 Portland had striped a short segment of bicycle lanes on both an approach to the bridge and leading away from the bridge. Though short in length, the segment was high in quality, as it allowed cyclists on parallel local streets to avoid sharing arterial lanes in their final approach to the 18


21 bridge. Daily trip numbers across the bridge jumped to 950 cyclists in By 1997, improvements included bicycle lane striping on 1.5 miles of an arterial couplet that served the close-in residential neighborhoods east of the river, as well as bicycle lanes on a viaduct leading away from the bridge. Daily trips across the bridge jumped 25%. In 1998, the sidewalks on the Broadway Bridge s lift span were replaced with a non-slippery surface. A 54% increase in cycling occurred the year after the major improvements were made. Also, by 1998 Portland established a bikeway connection from the bridge to the edge of the Downtown core and bicycle trips jumped another 50% compared to the previous year. During this period between 1996 and 1998, when the network feeding the bridge grew from 8% to 27% complete, average daily ridership was 1,340, more than double that of the previous period, which had been characterized by its lack of developed bikeways. Between 2000 and 2005, the city made significant improvement in corridors serving the bridge. (See Figures ) These improvements included a major north-south bikeway and development of a bicycle boulevard east-west. By 2003, the bikeway network west of the bridge was continuous through the Downtown, and knitted through Portland (and Oregon s) most dense residential and mixed-use neighborhood. Broadway Bridge bicycle traffic counts between 2000 and 2005 averaged approximately 1,700 trips per day, representing an increase of 167% compared to the period one decade earlier. The highest recorded count on the bridge 2,081 daily trips was recorded in (See Figures 7-12 showing the expansion of the bikeway network around the bridges. See Figure 5 showing the correlation of the network expansion with usage.) Figure 5. Increasing Bicycle Use on Broadway Bridge 19


22 Steel Bridge On the Steel Bridge, bike use went up 220% after the Steel Bridge Riverwalk and Eastbank Esplanade opened in May In 2004, during the Broadway Bridge closure, the Steel Bridge absorbed much of this traffic. The Steel Bridge primarily serves recreational traffic due to the difficulty in accessing it from the eastside and Westside neighborhoods. Burnside Bridge On the Burnside Bridge, bike use tripled from 300 daily cyclists in the late 1980s to approximately 1,000 once bike lanes were installed in 1993, but has remained flat since that time. The current bikeway network feeding that bridge has been substantially in place since However, daily trips across the bridge have hardly grown at all. Why have the other three bicycle-friendly bridges experienced such a surge in bicycle traffic in the past decade and not the Burnside? Though in place, only approximately 40% of the network planned to feed the Burnside has been developed. This is a significant contrast to the almost 100% completion of the networks feeding the Broadway and Hawthorne bridges. In addition, the quality of access to the Burnside Bridge remains poor. The eastside Ankeny Street Bikeway ends two blocks before the bridgehead. The connection to the bridge requires navigating two extremely congested four-lane roadways, using auto lanes for turning. Only very confident cyclists handle these movements best. Portland cyclists have routinely ranked this area as one of the most difficult and in need of improvement. Westside downtown access is also unclear and somewhat challenging in both directions. These deficiencies clearly suppress potential bicycle use. In comparison, bikeways to access the Hawthorne and Broadway Bridges are on the most direct route, well signed, and continuous. It is crystal clear where you are supposed to ride and how you are supposed to do it. The quality of the bridge facility itself is also significant for this bridge. The Burnside Bridge is the only of the Willamette River Bridges that uses a bicycle lane rather than an off-street path (prior to Figure 6. Bicycle Use on the Burnside Bridge 20
23 1993 cyclists could share a sidewalk across the bridge with pedestrians). This exposes the cyclist more directly to traffic, which tends to drive faster on this half-mile open roadway. In addition, the bicycle lane drops in both directions when exiting the bridge, requiring cyclists to merge into arterial travel lanes. While experienced and confident cyclists can readily negotiate this route, it is not close to the quality of facilities one finds riding to and on the other bridges. (See Figure 6 showing the correlation of the network expansion with usage.) 21


24 Figures 7-12: The bikeway networks feeding the bridges are shown in bold. Other bikeway improvements in the same time period that do not directly feed the bridges are shown in a lighter screen. Figure 7. Network Feeding Bridges 1992 Figure 8. Network Feeding Bridges


25 Figure 9. Network Feeding Bridges 1998 Figure 10. Network Feeding Bridges


26 Figure 11. Network Feeding Bridges 2003 Figure 12. Network Feeding Bridges
27 Conclusions Portland s build it and they will come approach has proven largely successful in promoting increased bicycle use. This is especially true in Portland s inner city where factors other than the presence of bikeways contribute to conditions amenable to bicycling. These other factors include: a mixed-use land use pattern that results in short trip distances; relatively small, low-volume and lowspeed arterial streets; a grid street network that gives people alternative to riding on arterial streets. However, these other factors predate the past 12 years of bikeway improvements that Portland has undertaken. Thus, this paper demonstrates that the creation of well-connected and high quality facilities correlates with increasing bicycle use. As Portland s bikeway network feeding its central city bridges grew, so did bicycle use reliably and steadily grow. Where the bikeway network was not well connected and not of the highest quality, then bicycle use stayed essentially flat and at levels that existed prior to network expansion. Based on our knowledge of Portland s Central City bridges, their access routes, and the trends we ve seen, we believe that there are two key factors at play relating to the bikeways themselves: Quantity of facilities: Completeness of network (bikeways on all routes leading up to the bridge, gaps, clarity of route connections) Quality of the facility itself: Separation on bridge spans versus bike lanes or shared lanes. On connector street routes, presence of bicycle lanes or bicycle boulevard improvements, and quality of intersection improvements. A key to the heavy and increasing concentration of bicyclists on the Hawthorne, Steel and Broadway Bridges, as opposed to the Burnside and other bridges, is the fact that on these three bridges spans, bicyclists are off-street on either wide sidewalks or a shared use path, with bike lanes on the approaches. In addition, the City added bicycle lanes and boulevards to and improved intersections on all streets connecting to the Hawthorne, Steel and Broadway Bridges, overcoming major hurdle in getting people to the bridges. Caveats to this approach are: The bikeway network must be well connected, providing continuous, or near-continuous service to be effective Facilities must be constructed to the highest standards to as to minimize the potential for negative bicycle-automobile interactions and to maximize cyclists ease of use The use of bikeways seems best supported in areas where trip distances are relatively short and land use patterns and urban design supports bicycle use. The utilization of bicycle counts to gauge bicycle use trends has been effective in guiding the City toward these conclusions. The authors recommend that other cities participate in the ITE National Bicycle and Pedestrian Documentation program, conduct regular bicycle counts, and maintain and analyze a database of counts. Future research should be conducted to develop better methods of comprehensively counting bicycle trips; more accurately quantifying the qualitative aspects of bicycle facilities; and better assessing and quantifying users perceptions of the quantity and quality of specific corridor routes. 25
28 Such research will continue to assist planners, policy makers and engineers in designing urban areas in general, and bicycle facilities in particular. 26
The Transformation of Portland into a Two-Wheeled Mecca. Mia Birk, Principal, Alta Planning + Design
 The Transformation of Portland into a Two-Wheeled Mecca Mia Birk, Principal, Alta Planning + Design Development of Portland s Bikeway Network 1990 Early 1990s Infrastructure Growing Public Support Growing
Bikeway action plan. Bicycle Friendly Community Workshop March 5, 2007 Rochester, MN
 Bikeway action plan Summary The was held on March 5, 2007 at the Rochester Mayo Civic Center. The workshop was hosted by Rochester-Olmsted County Planning Department in collaboration with the League of
City of Gainesville Transportation/Roadway Needs PROJECT SUMMARY
 A1 Roadway Resurfacing $23,846,000 TYPE: Preservation of existing system Roadway resurfacing A2 Signal Replacement $6,000,000 TYPE: Preservation of existing system Replace traffic signals. B1 W 6th St
FEDERAL HIGHWAY ADMINISTRATION APPLICATION
 FEDERAL HIGHWAY ADMINISTRATION APPLICATION REQUEST FOR PERMISSION TO EXPERIMENT WITH A BICYCLE BOX INTERSECTION TREATMENT Submitted by: City of Columbus Department of Public Service Date: June 26, 2009
Goodlettsville Bicycle and Pedestrian Plan Executive Summary
 Goodlettsville Bicycle and Pedestrian Plan July 2010 In Cooperation with the Nashville Area Metropolitan Planning Executive Organization Summary Introduction Progressive and forward thinking communities
5 Circulation & Parking
 5 Circulation & Parking Downtown Parking & Circulation Strategy. Downtown Wayne has a somewhat disconnected system of local public streets to connect downtown with the residential neighborhoods, and primary
Perryville TOD and Greenway Plan
 Perryville TOD and Greenway Plan Greenway Glossary Pathway: A bicycle and pedestrian path separated from motorized vehicular traffic by an open space, barrier or curb. Multi-use paths may be within the
ACTIVE TRANSPORTATION
 ACTIVE TRANSPORTATION Mobility 2040 Supported Goals Improve the availability of transportation options for people and goods. Support travel efficiency measures and system enhancements targeted at congestion
Hennepin County Bicycle and Pedestrian Planning
 Hennepin County Bicycle and Pedestrian Planning 1 Value of bicycle and sidewalk systems Safety Livability Mobility Health Personal Finances Economic Sustainability Clean Air Recreation Parking and congestion
Planning Guidance in the 2012 AASHTO Bike Guide
 Planning Guidance in the 2012 AASHTO Bike Guide Presentation by: RJ Eldridge Peter Lagerwey August 22, 2012 WEBINAR 2: PLANNING GUIDANCE IN THE 2012 AASHTO BIKE GUIDE Today s Webinar Significant Updates
Solana Beach Comprehensive Active Transportation Strategy (CATS)
") Solana Beach Comprehensive Active Transportation Strategy (CATS) 3.0 Goals & Policies The Solana Beach CATS goals and objectives outlined below were largely drawn from the Solana Beach Circulation Element
Solana Beach Comprehensive Active Transportation Strategy (CATS) 3.0 Goals & Policies The Solana Beach CATS goals and objectives outlined below were largely drawn from the Solana Beach Circulation Element
Active Transportation Facility Glossary
 Active Transportation Facility Glossary This document defines different active transportation facilities and suggests appropriate corridor types. Click on a facility type to jump to its definition. Bike
Basalt Creek Transportation Refinement Plan Recommendations
 Basalt Creek Transportation Refinement Plan Recommendations Introduction The Basalt Creek transportation planning effort analyzed future transportation conditions and evaluated alternative strategies for
Welcome. Thank you for your interest in the Lewis & Clark Viaduct Concept Study
 Welcome Thank you for your interest in the Lewis & Clark Viaduct Concept Study Please use the arrows in the upper left hand corner to navigate through the presentation. Use the envelope icon to ask a question
CONNECTING PEOPLE TO PLACES
 CONNECTING PEOPLE TO PLACES 82 EAST BENCH MASTER PLAN 07 Introduction The East Bench transportation system is a collection of slow moving, treelined residential streets and major arteries that are the
TRANSPORTATION & MOBILITY
 TRANSPORTATION & MOBILITY ROADWAY SYSTEM There are approximately 40 miles of roadways in Manitou Springs. For planning purposes, roadways are typically assigned a functional classification which defines
Corpus Christi Metropolitan Transportation Plan Fiscal Year Introduction:
 Introduction: The Safe, Accountable, Flexible, Efficient Transportation Equity Act: A Legacy for Users (SAFETEA-LU) has continued the efforts started through the Intermodal Surface Transportation Efficiency
Bicycle Boulevards and Neighborhood Greenways
 Bicycle Boulevards and Neighborhood Greenways Traffic Safety is Improving for Everyone 90 80 70 60 50 40 30 20 10 0 PORTLAND: TOTAL TRAFFIC FATALITIES 1986-2008 1986 1987 1988 1989 1990 1991 1992 1993
Route 7 Corridor Study
 Route 7 Corridor Study Executive Summary Study Area The following report analyzes a segment of the Virginia State Route 7 corridor. The corridor study area, spanning over 5 miles in length, is a multi
Physical Implications of Complete Streets Policies
 Presentation Overview Physical Implications of Complete Norm Cox, ASLA, LLA Landscape Architect Ann Arbor, Michigan, 10:45 to Noon What Are Complete Streets? What Matters to Bicyclists and Pedestrians
Stress Bikeway Network
 Building Portland s Low- Stress Bikeway Network Photo credit: Michael Anderson Bikeportland.org Designing Streets 2015 Austin, TX October 29 2015 Roger Geller Portland Background Existing low- and lower-stress
City of Homewood Transportation Plan
 City of Homewood Transportation Plan Prepared for: City of Homewood, Alabama Prepared by: Skipper Consulting, Inc. May 2007 TABLE OF CONTENTS INTRODUCTION... 1 BACKGROUND INFORMATION... 1 EXISTING TRANSPORTATION
Clackamas County Comprehensive Plan
 ROADWAYS The County s road system permits the movement of goods and people between communities and regions, using any of a variety of modes of travel. Roads provide access to virtually all property. They
C C C
 C-012-001 Thank you for your support for the creation of new public space and nonmotorized access between downtown and the waterfront through the Overlook Walk, the East-West Connections, and the Promenade.
Chapter 7. Transportation. Transportation Road Network Plan Transit Cyclists Pedestrians Multi-Use and Equestrian Trails
 Chapter 7 Transportation Transportation Road Network Plan Transit Cyclists Pedestrians Multi-Use and Equestrian Trails 7.1 TRANSPORTATION BACKGROUND The District of Maple Ridge faces a number of unique
PORTLAND BICYCLE COUNTS 2007
 PORTLAND BICYCLE COUNTS 2007 The Portland Office of Transportation s (PDOT) annual bicycle counts constitute the City s primary means of assessing progress in its efforts to make the bicycle an integral
STUDY ADVISORY COMMITTEE. October 8, 2015
 STUDY ADVISORY COMMITTEE October 8, 2015 Study Purpose evaluate the long-term transportation strategies and investments needed to sustain the county s economic health and quality of life in the coming
West Dimond Blvd Upgrade Jodhpur Street to Sand Lake Road
 West Dimond Blvd Jodhpur St to Sand Lake CSS Transportation Project Summary Municipality of Anchorage Project # 05 005 Project Manager: John Smith, P.E. (MOA PM&E) Project Administrator: Julie Makela,
General Design Factors
 Chapter 3: 3-1.0 Introduction General Design Factors Mn/DOT s goals include encouraging and accommodating safe bicycling. From a design perspective, these goals are achieved by first having an understanding
City of Novi Non-Motorized Master Plan 2011 Executive Summary
 City of Novi Non-Motorized Master Plan 2011 Executive Summary Prepared by: February 28, 2011 Why Plan? Encouraging healthy, active lifestyles through pathway and sidewalk connectivity has been a focus
CITY OF BLOOMINGTON COMPLETE STREETS POLICY
 CITY OF BLOOMINGTON COMPLETE STREETS POLICY POLICY OBJECTIVE: The City of Bloomington will enhance safety, mobility, accessibility and convenience for transportation network users of all ages and abilities,
Duwamish Way-finding and CTR Report
 V. North Tukwila When the North Tukwila Manufacturing and Industrial Center was designated in 1992 as part of the region s land use and transportation plan, the plan called for the area to set a light-rail
I-105 Corridor Sustainability Study (CSS)
") I-105 Corridor Sustainability Study (CSS) Metro Streets and Freeways Subcommittee March 21, 2019 Gary Hamrick Cambridge Systematics, Inc. I-105 CSS Project History & Background Funded by Caltrans Sustainable
I-105 Corridor Sustainability Study (CSS) Metro Streets and Freeways Subcommittee March 21, 2019 Gary Hamrick Cambridge Systematics, Inc. I-105 CSS Project History & Background Funded by Caltrans Sustainable
Madison Urban Area and Dane County. Bicycle Transportation Plan Summary. September Introduction. Bicycle Plan Scope and Planning Process
 Bicycle Transportation Plan Summary Madison Urban Area and Dane County Introduction September 2000 Bicycling is an important mode of transportation in the Madison urban area and countywide that is available
Rochester Downtown Bicycle Study 2009
 Rochester Downtown Bicycle Study 2009 Relationship of ROCOG Long Range Transportation Plan to Rochester Comprehensive Plan Regional Long Range Transportation Plan (LRTP) is prepared under the auspices
TRANSPORTATION TRAINING TOPICS. April 6, 2010
 TRANSPORTATION TRAINING TOPICS April 6, 2010 Roles of Transportation Providers Context and Policy Makers Division of Transportation and Traffic Other City Operations Other Transportation Operators CMA
City of Seattle Edward B. Murray, Mayor
 City of Seattle Edward B. Murray, Mayor Department of Transportation Scott Kubly, Director Eastlake Community Council 117 E Louisa St. #1 Seattle, WA 98102-3278 January 28, 2016 RE: Roosevelt to Downtown
Multimodal Analysis in the 2010 Highway Capacity Manual
 Multimodal Analysis in the 2010 Highway Capacity Manual It s not just cars anymore! Jamie Parks, AICP HCAT Conference May 9-10, 2011 Multimodal LOS in the 2010 HCM History and background Overview of methods
Measuring Transportation: Traffic, Mobility and Accessibility
 Measuring Transportation: Traffic, Mobility and Accessibility THIS FEATURE COMPARES THREE APPROACHES TO MEASURING TRANSPORTATION SYSTEM PERFORMANCE. TRAFFIC-BASED MEASUREMENTS EVALUATE MOTOR VEHICLE MOVEMENT;
ADA Transition Plan. City of Gainesville FY19-FY28. Date: November 5, Prepared by: City Of Gainesville Department of Mobility
 ADA Transition Plan FY19-FY28 Date: November 5, 2018 Prepared by: City Of Gainesville Department of Mobility 1.0 INTRODUCTION 1.1 BACKGROUND The federal statute known as the Americans with Disabilities
Chapter 9: Pedestrians and Bicyclists
 Chapter 9: Pedestrians and Bicyclists Walking and bicycling are essential modes of transportation. These modes allow people to travel without contributing to congestion and air pollution, to access other
Circulation in Elk Grove includes: Motor vehicles, including cars and trucks
 Circulation, as it is used in this General Plan, refers to the many ways people and goods move from place to place in Elk Grove and the region. Circulation in Elk Grove includes: Motor vehicles, including
MCTC 2018 RTP SCS and Madera County RIFP Multi-Modal Project Eval Criteria GV13.xlsx
 MCTC 8 RTP SCS and Madera County RIFP Multi-Modal Project Eval Criteria GV.xlsx Madera County Transportation Commission Regional Transportation Plan / Sustainable Communities Strategy Multi-Modal Project
Los Altos Hills Town Council - June 18, 2015 Palo Alto City Council June 22, AGENDA ITEM #2.B Presentation
 Los Altos Hills Town Council - June 18, 2015 Palo Alto City Council June 22, 2015 AGENDA ITEM #2.B Presentation Previous Presentations Los Altos Hills Town Council in May 2014 and February 2015 Palo Alto
City of Wayzata Comprehensive Plan 2030 Transportation Chapter: Appendix A
 A1. Functional Classification Table A-1 illustrates the Metropolitan Council s detailed criteria established for the functional classification of roadways within the Twin Cities Metropolitan Area. Table
Welcome to the Sellwood Bridge Project Open House!
 Welcome to the Sellwood Bridge Project Open House! 5:30 7:30 pm Please sign in here Information stations and project staff are located throughout the room. Goals for Tonight s Meeting: Learn how the Preferred
SECTION 1 - TRAFFIC PLANNING
 SECTION 1 - TRAFFIC PLANNING 1.1 TRAFFIC OPERATIONS 1.1.1 Roadway Functional Classification The Multnomah County Comprehensive Framework Plan s Policy 34: Trafficways and the Functional Classification
PEDESTRIAN ACTION PLAN
 ATTACHMENT 2 CITY OF SANTA MONICA PEDESTRIAN ACTION PLAN CITY OF SANTA MONICA PEDESTRIAN ACTION PLAN This page intentionally left blank EXECUTIVE SUMMARY CHAPTER 1 EXECUTIVE SUMMARY Setting the Stage
Living Streets Policy
 Living Streets Policy Introduction Living streets balance the needs of motorists, bicyclists, pedestrians and transit riders in ways that promote safety and convenience, enhance community identity, create
o n - m o t o r i z e d transportation is an overlooked element that can greatly enhance the overall quality of life for the community s residents.
 N o n - m o t o r i z e d transportation is an overlooked element that can greatly enhance the overall quality of life for the community s residents. 84 Transportation CHAPTER 11 INTRODUCTION Transportation
Complete Street Analysis of a Road Diet: Orange Grove Boulevard, Pasadena, CA
 Complete Street Analysis of a Road Diet: Orange Grove Boulevard, Pasadena, CA Aaron Elias, Bill Cisco Abstract As part of evaluating the feasibility of a road diet on Orange Grove Boulevard in Pasadena,
Bicycle and Pedestrian Chapter TPP Update Overview. TAB September 20, 2017
 Bicycle and Pedestrian Chapter TPP Update Overview TAB September 20, 2017 Bicycling & Walking in the Twin Cities Where are we now? The Bike-Pedestrian system Current trends New developments Where are we
Attachment A: Columbus Area Metropolitan Transportation Plan Objectives, Performance Measures, and Targets
 OBJECTIVE: Reduce the percentage of commuters driving alone, and increase the percentage of commuters riding transit, ing Reducing single occupancy auto commutes and increasing commuters using alternative
MAG Town of Cave Creek Bike Study Task 6 Executive Summary and Regional Significance Report
 Page 1 MAG Town of Cave Creek Bike Study Task 6 Executive Summary and Regional Significance Report August 1, 2012 MAG Project #481 Page 2 Task 6 Executive Summary and Regional Significance Report Introduction
Overview. Illinois Bike Summit IDOT Complete Streets Policy Presentation. What is a Complete Street? And why build them? And why build them?
 Overview Illinois Bike Summit IDOT Complete Streets Policy Presentation Aren Kriks, P.E. District One Bicycle Coordinator and Bureau of Programming Project Engineer History of Complete Streets IDOT Policy
TRAFFIC IMPACT ANALYSIS
 TRAFFIC IMPACT ANALYSIS FOR THE CHAMPAIGN UNIT#4 SCHOOL DISTRICT PROPOSED HIGH SCHOOL (SPALDING PARK SITE) IN THE CITY OF CHAMPAIGN Final Report Champaign Urbana Urbanized Area Transportation Study 6/24/2014
CITY OF COCOA BEACH 2025 COMPREHENSIVE PLAN. Section VIII Mobility Element Goals, Objectives, and Policies
 CITY OF COCOA BEACH 2025 COMPREHENSIVE PLAN Section VIII Mobility Element Goals, Objectives, and Policies Adopted August 6, 2015 by Ordinance No. 1591 VIII MOBILITY ELEMENT Table of Contents Page Number
Non-Motorized Transportation 7-1
 Non-Motorized Transportation 7-1 Transportation facilities no longer mean just accommodating a vehicle powered by a combustion engine. Pedestrian and non-motorized facilities are important modes of travel
Classification Criteria
 SCHEDULE D TO RECOMMENDED OFFICIAL PLAN AMENDMENT NO. 40 SCHEDULE C-4 Road Criteria Criteria Traffic Service Objective Land Service/Access Typical Daily Traffic Volume Flow characteristics Travel Speed
Bicycle and Pedestrian Plans and Improvements
 Bicycle and Pedestrian Plans and Improvements Presented to the City Council By Randle Harwood, Planning and Development, and Richard Zavala, Parks and Community Services September 24, 2013 Purpose Review
SANTA CLARA COUNTYWIDE BICYCLE PLAN August 2008
 SANTA CLARA COUNTYWIDE BICYCLE PLAN August 2008 To assist VTA and Member Agencies in the planning, development and programming of bicycle improvements in Santa Clara County. Vision Statement To establish,
Cycle Track Design Best Practices Cycle Track Sections
 Design Best Practices Sections It is along street segments where the separation and protection methods of cycle tracks offer more comfort than conventional bicycle lanes, and are more attractive to a wide
The Bike Buzz in Richland. November 2017 Carl Berkowitz
 The Bike Buzz in Richland November 2017 Carl Berkowitz Richland has been growing by leaps and bounds with lots of new homes and roads throughout the community. Recognizing all the growth in the Queensgate
APPENDIX A: Complete Streets Checklist DRAFT NOVEMBER 2016
 APPENDIX A: Complete Streets Checklist DRAFT NOVEMBER 2016 Complete Streets Checklist MetroPlan Orlando s Complete Streets Checklist is an internal planning tool for staff to further implementation of
Bicycle Corrals Portland Designing Streets NYC October 25, 2012 Roger Geller, Bicycle Coordinator Portland, OR
 Bicycle Corrals Portland 8-80 Designing Streets NYC October 25, 2012 Roger Geller, Bicycle Coordinator Portland, OR Build it and they will come 1990 2012 Build it better 2012 background With bike boxes
Town of Babylon Sustainable Complete Streets Policy
 Town of Babylon Sustainable Complete Streets Policy Steve Bellone, Supervisor Adopted July 14, 2010 1 Table of Contents Vision... 3 Policy Statement... 3 Definition... 3 Road Users... 4 Network... 4 Roads...
Performance Criteria for 2035 Long Range Transportation Plan
 Minimizing Impacts on Natural, Historic, Cultural or Archeological Resources 2035 LRTP Weighting Factor: 7% Objective 1.1: Use appropriate planning and design criteria to protect and enhance the built
Draft North Industrial Area-Wide Traffic Plan
 Summary of North Industrial and Hudson Bay Industrial Recommended Improvements Table 1. Summary of s Item Location 1 2 3 4 5 6 7 8 9 10 11 12 Millar Ave north of 51st St Super 8 Motel back lane 400 Block
INTRODUCTION THOROUGHFARE SYSTEM CLASSIFICATIONS
 INTRODUCTION The thoroughfare plan will assist public officials in the development of a specialized system for efficient and safe movement of vehicular traffic while minimizing potential conflicts with
ADOT Statewide Bicycle and Pedestrian Program Summary of Phase IV Activities APPENDIX B PEDESTRIAN DEMAND INDEX
 ADOT Statewide Bicycle and Pedestrian Program Summary of Activities APPENDIX B PEDESTRIAN DEMAND INDEX May 24, 2009 Pedestrian Demand Index for State Highway Facilities Revised: May 29, 2007 Introduction
Tonight is for you. Learn everything you can. Share all your ideas.
 Strathcona Neighbourhood Renewal Draft Concept Design Tonight is for you. Learn everything you can. Share all your ideas. What is Neighbourhood Renewal? Creating a design with you for your neighbourhood.
Welcome and Introductions Overview of the Study to Date Community Involvement Intersection Improvement Concepts Bike-Ped Recommendations ITS
 Welcome and Introductions Overview of the Study to Date Community Involvement Intersection Improvement Concepts Bike-Ped Recommendations ITS Recommendations Transit Recommendations Next Steps Inventoried
New Measure A Expenditure Categories DEFINITIONS OF ELIGIBLE EXPENDITURES Adopted March 8, 2007
 New Measure A Expenditure Categories DEFINITIONS OF ELIGIBLE EXPENDITURES Adopted March 8, 2007 City Street and County Road Maintenance Program The preservation and keeping of public street and road rights-of-way
4 DISRUPTION MANAGEMENT PLAN HIGHWAY 7 RAPIDWAY CONSTRUCTION BETWEEN BAYVIEW AVENUE AND WARDEN AVENUE TOWNS OF MARKHAM AND RICHMOND HILL
 4 DISRUPTION MANAGEMENT PLAN HIGHWAY 7 RAPIDWAY CONSTRUCTION BETWEEN BAYVIEW AVENUE AND WARDEN AVENUE TOWNS OF MARKHAM AND RICHMOND HILL The Transportation Services Committee recommends the adoption of
2. Context. Existing framework. The context. The challenge. Transport Strategy
 Transport Strategy Providing quality connections Contents 1. Introduction 2. Context 3. Long-term direction 4. Three-year priorities 5. Strategy tree Wellington City Council July 2006 1. Introduction Wellington
Beyond First First Last Last Mile Strategies. APA National Conference April 3, 2016 Chelsea Richer, AICP Fehr & Peers
 Beyond First First Last Last Mile Strategies APA National Conference April 3, 2016 Chelsea Richer, AICP Fehr & Peers 1 Beyond First Last Mile Strategies APA National Conference Jeremy Klop, AICP, Fehr
Purpose and Need. Chapter Introduction. 2.2 Project Purpose and Need Project Purpose Project Need
 Chapter 2 Purpose and Need 2.1 Introduction The El Camino Real Bus Rapid Transit (BRT) Project (Project) would make transit and other transportation improvements along a 17.6-mile segment of the El Camino
Bicycle Master Plan Goals, Strategies, and Policies
 Bicycle Master Plan Goals, Strategies, and Policies Mobilizing 5 This chapter outlines the overarching goals, action statements, and action items Long Beach will take in order to achieve its vision of
STREET AND HIGHWAY PLAN
 STREET AND HIGHWAY PLAN Introduction The street and highway system in the Winston-Salem Urban Area consists of thousands of miles of traffic carrying facilities, ranging from short local residential streets
Proposed. City of Grand Junction Complete Streets Policy. Exhibit 10
 Proposed City of Grand Junction Complete Streets Policy Exhibit 10 1 City of Grand Junction Complete Streets Policy Vision: The Complete Streets Vision is to develop a safe, efficient, and reliable travel
City of Davis East Covell Corridor Plan
 Community Open House #2 January 22, 2014 6:00 8:00 p.m. Veterans Memorial Center, Club Room City of Davis Introduction The (ECCP) is a taking a comprehensive look at the existing transportation systems
Newport City Thoroughfare Plan
 Newport City Thoroughfare Plan Summary This plan is intended to review and make recommendations for Newport City s thoroughfare network, in consideration of the full range of uses of the city s streets.
Highway 217 Corridor Study. Phase I Overview Report
 Highway 217 Corridor Study Phase I Overview Report November 3, 24 BACKGROUND AND OVERVIEW Study purpose The Highway 217 Corridor Study is developing multi-modal transportation solutions for traffic problems
Chapter 2 Current and Future Conditions
 Chapter 2 Current and Future Conditions 2.1 An Overview of Ottawa s Transportation System The City of Ottawa is home to about 870,700 people. The city covers an area of 2,760 square kilometres of which
Sacramento Grid 2.0. The Downtown Transportation Study
 Sacramento Grid 2.0 The Downtown Transportation Study April 20, 2016 The Grid 4.25 square miles Street grid defined at birth of City Lettered and numbered streets spaced every 400 ft East-west alleys halfway
Durham Region Long Term Transit Strategy
 Durham Region Long Term Transit Strategy An adaptive, safe, reliable, frequent, accessible and desirable transit system that shapes and connects Durham Region and beyond in an economically and environmentally
TO: Board Members Vancouver Park Board FROM: General Manager Parks and Recreation SUBJECT: Seaside Greenway Improvements
 Date: October 1, 2013 TO: Board Members Vancouver Park Board FROM: General Manager Parks and Recreation SUBJECT: Seaside Greenway Improvements RECOMMENDATION A. THAT the Board approve the new bike paths
Regional Transportation Needs Within Southeastern Wisconsin
 Regional Transportation Needs Within Southeastern Wisconsin #118274 May 24, 2006 1 Introduction The Southeastern Wisconsin Regional Planning Commission (SEWRPC) is the official areawide planning agency
Employment 8,881 17,975 9,094. Households 18,990 31,936 12,946
 This section describes the future transportation environment of the UW Tacoma campus and surrounding area. A description of the future conditions on campus in terms of the street system, traffic and intersection
Chapter 6 Transportation Plan
 Chapter 6 Transportation Plan Transportation Plan Introduction Chapter 6 Transportation Plan Transportation Plan Introduction This chapter describes the components of Arvada s transportation system, comprised
El Paso County 2040 Major Transportation Corridors Plan
 El Paso County 2040 Major Transportation Corridors Plan Connect-our-County Online Transportation User Survey Preliminary Results June 24, 2010 Years of Residence 2. How many years have you LIVED HERE?
Evaluation of Innovative Bicycle Facilities:
 Evaluation of Innovative Bicycle Facilities: SW Broadway Cycle Track & SW Stark/Oak Street Buffered Bike Lanes FINAL REPORT Prepared for: City of Portland Bureau of Transportation by: Christopher Monsere,
Implementing Complete Streets in Ottawa. Project Delivery Process and Tools Complete Streets Forum 2015 October 1, 2015
 Implementing Complete Streets in Ottawa October 1, 2015 The Essentials Complete Streets Implementation Framework will become part of the routine delivery of City transportation projects Approach uses every
Proposed White Flint Separated Bike Lane Network September 2015
 Proposed White Flint Separated Bike Lane Network September 2015 Abstract This report includes a proposed separated bike lane network for the White Flint Sector Plan area. Separated bike lanes create a
Moving Cambridge. City of Cambridge Transportation Master Plan Public Consultation Centre. March 7, :00 8:00 PM.
 City of Cambridge Transportation Master Plan Public Consultation Centre March 7, 2018 5:00 8:00 PM Region of Waterloo City of Cambridge Transportation Master Plan Public Consultation Centre March 7, 2018
NM-POLICY 1: Improve service levels, participation, and options for non-motorized transportation modes throughout the County.
 Transportation PRINCE WILLIAM COUNTY 2008 COMPREHENSIVE PLAN NON-MOTORIZED PLAN CONTENTS Goals, Policies, and Action Strategies Table 4 (Bike Facility Classifications and Descriptions) Table 5 (Bike Facility
Flanders Crossing. Save Lives Save Money Saving Our Environment. Portland City Council April 30, 2008
 Flanders Crossing Save Lives Save Money Saving Our Environment Portland City Council April 30, 2008 NWSTELBRG-GLISANSTRAMP Expanding Portland s Bicycle Boulevards NW NAITO PKY Why this project? Part of
Who is Toole Design Group?
 2018 AASHTO Bike Guide Status Update NCHRP 15 60 Amalia Leighton Cody, PE, AICP & Kenneth Loen, PE Washington APWA October 4, 2018 Who is Toole Design Group? TDG is a full service engineering, planning
HARRISON STREET/OAKLAND AVENUE COMMUNITY TRANSPORTATION PLAN
 HARRISON STREET/OAKLAND AVENUE Community Workshop #4: Draft Plan Review December 3, 2009 D E S I G N, C O M M U N I T Y & E N V I R O N M E N T INTRODUCTIONS Key Project Staff: Alisa Shen, Project Manager,
Seattle Department of Transportation (SDOT) Preliminary Responses to Madison-Miller Community List of Site-Specific Concerns
 Preliminary Responses to Madison-Miller Community List of Site-Specific Concerns") Seattle Department of Transportation (SDOT) Preliminary Responses to Madison-Miller Community List of Site-Specific Concerns Background In July 2002 SDOT staff met with a small group of community residents
Seattle Department of Transportation (SDOT) Preliminary Responses to Madison-Miller Community List of Site-Specific Concerns Background In July 2002 SDOT staff met with a small group of community residents