Local Road Safety Plans
|
|
|
- Hubert Cameron
- 5 years ago
- Views:
Transcription


1 An Introduction to Local Road Safety Plans June 21, 2018

2 Today s Presenter Jerry Roche, P.E. Safety Analysis Program Manager FHWA Office of Safety Ames, IA 2


3 NACE Do-It-Yourself LRSP Pilot Six states, 25 Counties Including Champaign, Delaware, Franklin, Holmes and Warren Counties from Ohio Blended Delivery
4 Agenda Local Road Safety Plan (LRSP) Overview Strategic Highway Safety Plans (SHSPs) Developing a LRSP Washington s LRSP effort Thurston County, WA Case Study LRSP Examples and Resources 4
5 LRSP Overview 5
6 What is a Local Road Safety Plan? A document that identifies safety issues impacting local roads, and provides a framework to accomplish safety enhancements at the local level to reduce severe crashes Uses a data-driven, risk-based process to identify, analyze, and prioritize safety issues, and targets countermeasures and strategies to address severe crashes on local roads

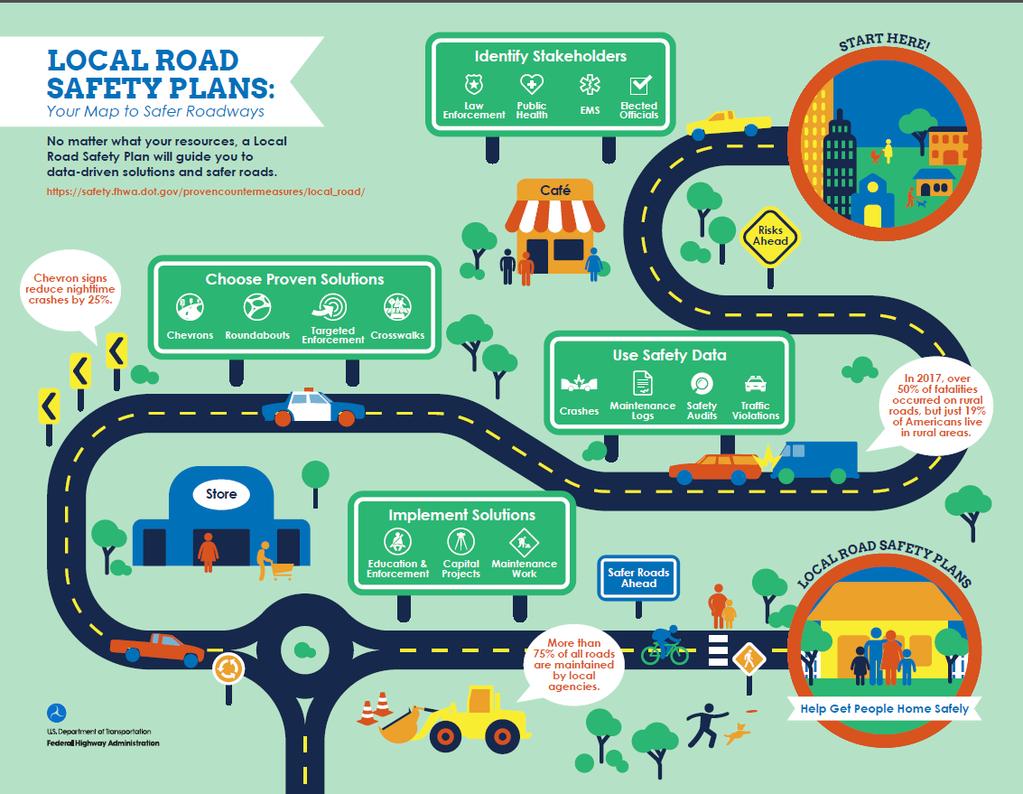
7 Why Local Road Safety Plans? More than 75% of all roads are maintained by local agencies Approximately 40-60% of fatalities occur on locally owned roadways LRSPS are a proven safety countermeasure 7

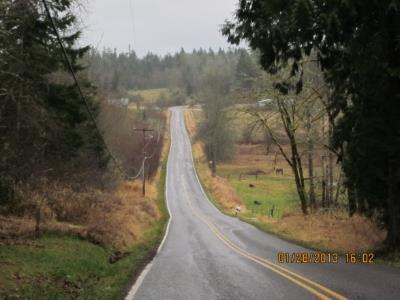
8 Clackamas County, OR Video 8
9 Why would a local agency use a local road safety plan? To help define safety priorities To prioritize safety investments To serve as a communication tool To develop lasting partnerships To position an agency to obtain outside funding (e.g., grants) To create a sustainable safety effort To reduce severe crashes occurring in their community 10 9
10 Strategic Highway Safety Plans 10
11 What is an SHSP? A statewide coordinated plan that provides a framework for reducing fatalities and serious injuries on all public roads Identifies a State s key safety needs Management/HighwaySafety/SHSP/Pages/default.aspx Guides investment decisions towards strategies and countermeasures with the most potential to save lives and prevent injuries 11
 Highway Safety Improvement Program (HSIP) Report submitted")

 Highway Safety Plan (HSP) Plan submitted annually Behavioral")
12 Core Safety Plans and Programs State Strategic Highway Safety Plan (SHSP) Highway Safety Improvement Program (HSIP) Report submitted annually Infrastructure improvements FHWA approved Updated at least every five years Infrastructure and behavioral countermeasures SHSP process approved by FHWA Requirement of HSIP Local Road Safety Plan (LRSP) Highway Safety Plan (HSP) Plan submitted annually Behavioral programs NHTSA approved 12

13 Local Roads in Ohio s SHSP OH ( ) Moving forward, Ohio will be placing greater emphasis on providing funding and resources to local governments, which are responsible for improving safety on the majority of Ohio roads. Local roads also have the highest numbers of traffic deaths and serious injuries involving: Bicycles 87% Pedestrians 83% Intersections 70% Alcohol 66% Speed 63% Motorcycles 63% Young drivers (ages 15-25) 63%
14 Developing a LRSP 14

15 The LRSP Development Process Step 1: Establish Leadership Step 2: Analyze the Safety Data Step 3: Determine Emphasis Areas Step 4: Identify Strategies Step 5: Prioritize and Incorporate Strategies Step 6: Evaluate and Update the LRSP FHWA Proven Safety Countermeasure LRSPs 15
16 16 16
17 LRSP Video 17


18 Step 1 Identify Stakeholders Cities Townships MPOs LTAP DOT Law Enforcement Public Health EMS Elected Officials Schools 18

19 Step 2 Use Safety Data & Risks Crash Roadway Traffic Volume Safety Data Enforcement Maintenance Logs Road Safety Audits 19
20 No Data? No Problem Anecdotal information Data from Existing Sources Traffic Violations Maintenance Logs Roadway Risk Factors Traffic volumes Lane Width Shoulder Width Roadside Slopes Curves Curve radii Driveways Presence of Lighting Traffic control Pedestrian and bicycle use & facilities Intersection skew Presence of turn lanes Pavement condition 20

")

21 Sources of Data Collision Reports & Roadway Attributes Maintenance History Citizen Requests Law Enforcement What if I do not have good local crash data? Strategic Highway Safety Plans Your state highway safety plan (SHSP) is always a good place to start. Although the SHSP may not be community specific it should provide statewide priorities which you can use to develop a emphasis areas for your community 21
22 Risks? 22
23 Analyze Data to Identify Focus/Priorities Basic crash details Primary crash type, junction relationship, fixed object struck Roadway conditions Weather, roadway surface condition, light condition Roadway details Roadway curvature, posted speed Driver details Contributing circumstances, vehicle type Pedestrian details Contributing circumstances, facility type used Cyclist details Contributing circumstances, facility type used 11 23

24 Example Crash Data Summary 24


25 Determine Emphasis Areas Roadway Departure Intersections Pedestrians Bicyclists Impaired Driving Seat Belt Usage Driver Age 25

26 Ohio SHSP Emphasis Areas 26

27 Safety Data by Roadway Type 27

28 Example Crash Tree Diagram 28

29 Example Crash Tree Diagram Y Y Co. 29

30 Example Crash Tree Diagram Y 30
 Analysis Source: https://saver.")
31 Plymouth County, Iowa Severe (Fatal & Serious Injury) Crash Locations: severe crashes over 5 years (approx. 1 per month) Analysis Source: 31
.")
32 Systemic Safety Analysis Assessing the potential for a specific type of severe crash to occur at a specific location because of the location s characteristics or features (roadway factors). 32

33 The Systemic Approach Implements a system-wide screening of a roadway network based on the presence of roadway characteristics correlated with severe crash types Source: FHWA Systemic Safety Project Selection Tool 33

34 Systemic Safety Project Selection Tool 34

35 Systemic Safety Analysis 35

36 Risk Factors for Crash Types FHWA s Systemic Safety Project Selection Tool (page 20) 36


37 Ranking Sites by Risk Factors FHWA Systemic Tool Page 46 37
 High, Medium, Low (traffic volumes, pedestrian volumes, crash frequency, etc.")
38 Qualitative Approach to Risk Use qualitative ratings when needed: Good, Fair, Not-So-Good (curve radius, roadside, etc.) High, Medium, Low (traffic volumes, pedestrian volumes, crash frequency, etc.) It is important to include the risk factors that are key to your roadway network 38
39 Step 3 Choose Proven Solutions Focus on crash or facility priorities Lane Departure Intersections Vulnerable Users Consider Proven Countermeasures 39

40 FHWA s Proven Safety Countermeasures 40


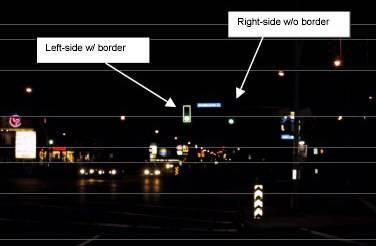
41 Enhanced Delineation and Friction for Horizontal Curves Enhanced Delineation Pavement Markings Post-mounted delineators Brighter/larger signs Dynamic curve warning signs Increased Pavement Friction Sharp Curves Wet Conditions Polished Surfaces Excessive Speeds 41
 deploy on a large scale low-cost countermeasures that address the risk factors contributing to crashes")
42 Systemic Application of Multiple Low-Cost Countermeasures at Stop Controlled Intersections (1) analyze systemwide data to identify a problem (2) look for similar risk factors present in severe crashes (3) deploy on a large scale low-cost countermeasures that address the risk factors contributing to crashes 42


43 Longitudinal Rumble Strips and Stripes Rumble strips and stripes are designed to address these crashes caused by distracted, drowsy, or otherwise inattentive drivers who drift from their lane. 43


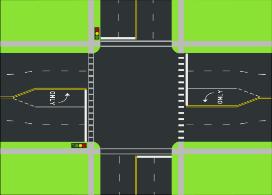
44 Leading Pedestrian Interval Increased visibility of crossing pedestrians Reduced conflicts between pedestrians and vehicles Increased likelihood of motorists yielding to pedestrians Enhanced safety for pedestrians who may be slower to start into the intersection 44

45 NHTSA s Countermeasures that work DOT HS Impaired Driving 2. Seatbelts 3. Speed Limits 4. Distracted Driving 5. Motorcycles 6. Young Drivers 7. License Renewal 8. Education Campaigns 9. Bicycle Helmets 45


46 Publicized Sobriety Checkpoints Authorized in 38 States + DC Documented Crash Reduction All Crashes: 10-15% Alcohol-related crashes: 17% Alcohol-related fatal crashes: 9% Page 1-21, countermeasuresthatwork8th.pdf 46
47 Short-Term High-Visibility Belt Law Enforcement Documented Belt Use Increase 16% increase Increased use in conjunction with public education/outreach and paid/donated media Page 2-17, countermeasuresthatwork8th.pdf 47
48 Nighttime Enforcement Belt Use 18% lower at nighttime 64% of nighttime fatalities are unbelted (vs. 47% of daytime fatalities) DWI and Speed-related fatalities also higher at night Page 2-20, countermeasuresthatwork8th.pdf 48

49 Step 4 Implement Solutions Do what you can, with what you have, where you are. - Theodore Roosevelt 49

50 Important Distinction Systematic Deploying countermeasures at ALL locations Systemic Deploying countermeasures at locations with the greatest potential for safety improvement Systemic Example: providing enhanced delineation on curves with radii between feet which were overrepresented in severe crashes 50


51 Activities and Strategies Education Enforcement Maintenance Capital Projects
52 Prioritized List of Roadway Sections 24 52
53 Rumble Strip/e Solution Decision Tree Example * Where regrading not required ** Not verified with video log *** After 6 miles/year of paving, enhanced edge line provided YES County Rumble preference? Grooves Allowed? NO YES ADT >200? NO Lane Width? Rumble StripE +Chevrons and Paving 2 inside shoulder in Critical Radius curves** Rumble StripE >=12 feet <12 feet PROJECT: PROJECT: 2 ft. shoulder paving* (up to 6 miles/year***) + rumble stripe + safety edge +Chevrons and Paving 2 inside shoulder in Critical Radius curves** PROJECT: Rumble Strip +Chevrons in Critical Radius curves** Rumble Strip Paved Shoulder? YES PROJECT: NO Rumble StripE +Chevrons and Paving 2 inside shoulder in Critical Radius curves** Lane Width? PROJECT: 6 Epoxy Wet Reflective in longitudinal groove +Chevrons and Paving 2 inside shoulder in Critical Radius curves >=12 feet <12 feet PROJECT: PROJECT: 6 Latex Edgeline +Chevrons and Paving 2 inside shoulder in Critical Radius curves 2 ft. shoulder paving* (up to 6 miles/year***) + rumble strip + safety edge +Chevrons and Paving 2 inside shoulder in Critical Radius curves** 53

54 Step 5 Evaluate & Update Plan Evaluate and Update the LRSP Monitor Progress Plan Evaluation Living Document 54
55 55 LRSPs Come in All Shapes and Sizes 55
56 56
57 Washington State County Road Safety Plans 57

58 Washington State Safety Facts Counties maintain 47% of the road miles in Washington State 16% of the total vehicle miles traveled occur on County roads The fatal crash rate is two times higher on county roads than on state highways. 58


59 Washington State Safety Facts Zero goal state Data driven process City 40% State 30% 70% of HSIP funds to local agencies County 30% Percent Fatal & Serious Collisions $190 million awarded to local agencies since 2009 For more information on Washington State s HSIP Program, visit 59
60 2014 County Road Safety Program $28 Million Available Required data driven safety plan Focus on fatal & severe crashes Emphasized use of systemic safety Provided five months to complete safety plans For more information on Washington State s HSIP Program, visit 60

61 County Training Program Workshops Systemic safety training Technical assistance & support Provide summary level crash data For more information on Washington State s HSIP Program, visit 61
62 County Road Safety Program Results 80% of Washington State Counties have local road safety plans now Each local road safety plan was different All the plans were completed by county staff For more information on Washington State s HSIP Program, visit 62
63 Survey of County Staff Most counties reported 80 hours of effort to prepare their LRSP 75% of counties said the funding award commensurate with the effort required All counties said the LRSP was useful to identify safety priorities and would prepare one again For more information on Washington State s HSIP Program, visit 63
64 Thurston County WA Case Study 64

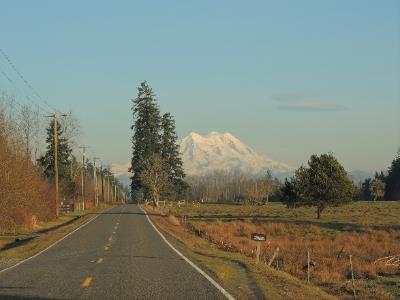
65 Where is Thurston County 65
66 Thurston County Safety Facts Thurston County maintains over 1000 miles of roads 131 severe crashes were reported from 2012 to % of the severe crashes are reported to be lane departures 66

67 Crash Data Challenges 67

68 Crash Information Provided by DOT First Step in process Easy to Use Can quickly ID priorities 68
69 Crash Information Identify Emphasis Area Collision Data Angle (left-turn) Intersection-Related Horizontal Curve Fatal/Serious Injury Crashes Only All roads 16% (2175) 33% (4557) 26% (3674) All Counties 13% (468) 22% (812) 39% (1419) Thurston County 9% (16) 19% (34) 45% (80) 69
 Local Roads (726 miles) Percent of Road Miles Percent Injury Crashes")
70 Crash Information Focus your efforts 1. Began with: 5000 total crashes 3. 77% (425) 81% (65) 67% Over 1000 centerline miles 33% 23% (127) 19% (15) 2. Focusing on curves: Over 1500 crashes Over 1000 centerline miles Arterial & Collectors (356 miles) Local Roads (726 miles) Percent of Road Miles Percent Injury Crashes Percent Severe 70
71 Crash Information Focus your efforts 77% (425) 81% (65) 67% Focus area reduced to about 350 centerline 33% 23% (127) 19% (15) miles Arterial & Collectors (356 miles) Local Roads (726 miles) Percent of Road Miles Percent Injury Crashes Percent Severe 71


72 Identification of Risk Factors Visual Traps Intersections proximity Traffic Volume Road Classification Roadside Clearance Source: FHWA Systemic Safety Project Selection Tool,


73 Data Collection Road Inventory Systems Considerations Staffing Availability Time frame Do you have data Is data readily available Road Video, GIS & Google Street View Field Data Collection 73
 Urban Principal Arterial (14) Urban Minor Urban Major Arterial (16) Collector (17) Spreadsheets & Pivot Tables Bar Graphs")
74 Data Analysis 80% 70% 60% 50% 40% 30% 20% 10% 0% Rural Minor Arterial (06) Rural Major Rural Minor Collector (07) Collector (08) Urban Principal Arterial (14) Urban Minor Urban Major Arterial (16) Collector (17) Spreadsheets & Pivot Tables Bar Graphs 74
75 Data Analysis Road Class 67% (289) 58% (209) 75% (49) Included as priority risk factor 15% Not Included as priority risk factor (54) 16% 17% 8% 9% 14% (34) (6) Rural Minor Arterial (06) Rural Major Collector (07) Rural Minor Collector (08) Urban Principal Arterial (14) Urban Minor Arterial (16) Road (356 miles) Injury (430) Fatal/Serious (65) Urban Major Collector (17) 75
76 Data Analysis Traffic Volume 30% 25% 20% 15% Included as priority risk factor 10% 5% 0% Percent Road Miles Percent Injury Crashes Percent Severe Crashes 76
 64% (170) 45% (102) Included as priority risk")

 Percent Injury (226) Percent Severe")
77 Data Analysis Roadside Rating 17% (45) 24% (54) 22% (8) 64% (170) 45% (102) Included as priority risk factor 42% (15) 36% 19% (52) 31% (70) (13) Edge Clearance 1 Edge Clearance 2 Edge Clearance 1 Edge Clearance 2 Edge Clearance 3 Percent of Curve Inventory (267) Percent Injury (226) Percent Severe (36) Edge Clearance 3 77
 Percent Injury Crashes (226) Percent Severe Crashes (36)")
78 Data Analysis - Intersection & Visual Traps 39% (103) 46% (104) 36% (13) 7% (18) 11% (24) 17% (6) Intersection Proximity Intersection Proxmity Visual Trap Percent of Curve Inventory (267) Percent Injury Crashes (226) Percent Severe Crashes (36) Visual Trap 78
 Major Rural")


79 Risk Factor Scoring (1 point) Major Rural Collectors Intersections Traffic Volume Shoulders Paved 4 feet Edge Clearance 80


80 Risk Factor Scoring (1/2 Point) Visual Traps Winding Roads Vertical Curves Speed Difference 81


81 Site Rankings Road Name 5 year Fatal or Serious crash rate Crash Scoring Hawks Prairie Rd 1.2 Yes 6 Johnson Point Rd 0.4 No 5.5 Waddell Creek Rd 10.3 Yes 5.5 Hawks Prairie Johnson Pt Waddle Creek 82
82 RISK SCORES Site Rankings Number of Curves by Risk Score NUMBER OF CURVES 83
83 Countermeasures Goals Proven Countermeasure Corridor Consistency Improved Roadside Low cost Wide Spread MUTCD compliance Enhanced Delineation Rumble Strips 84
84 Countermeasures Review TRAFFIC SIGNS Cost Permitting Right of Way Maintenance CMF Chevron Align or Large Arrow Low Low No Low 0.84 Florescent Yellow Signs Low Low No Low 0.82 Supplement Street Name Signs Low Low No Low 0.95 Increase advance curve/turn sign size Low Low No Low N/A Supplemental Curve/Turn Signs Low Low No Low N/A PAVEMENT MARKINGS Advance Curve Markings Low Low No Low N/A Enhanced Edge Lines (4 to 8 ) Low Low No Med 0.85 Dotted Extension Lines at intersections Low Low No Med 0.88 * Reflective Pavement Markers Low Low No Low 1 ROADWAY Widen Shoulder High High Yes Low 0.4 Reflective Barrier Delineation Low Low No Low N/A Shoulder Rumble Strips Low Low No Low 0.7 Traverse Rumble Strips Low Low No Low 0.94 ROADSIDE Object Removal Med Med No Low 0.62 Guardrail Med Med No Low 0.53 Flatten Side Slope High High Possible Low 0.82 OTHER (spot analysis improvements) Street Lighting Med Low No Med 0.5 High Friction Surface (wet road) Med Low No Med 0.5 Radar Speed Sign Med Low No Med 0.95 Roundabouts High High Yes Low 0.29 Intersection lane narrowing with rumble strips Med Low No Low 0.7 Roadway Safety Reviews Low Low No Low N/A *CMF s reviewed in 2012 so may not be consistent with current research 85
85 Countermeasures Selected Curve Signs (chevrons and arrows) Larger warning signs Enhanced Edge Lines Intersection extension lines Guardrail delineation Guardrail updates New guardrail Shoulder rumble strips Centerline rumble strips Raised reflective pavement markers (alternative) 86


86 Implementation 1500 Signs 28 miles 65 miles 35 intersections 75,000 lineal feet 30,000 RPM s 2 miles Note: Improvements were completed over several HSIP funding programs and also through local forces 88
87 Results Horizontal Curve Fatal and Serve Crashes 2006 to to % Reduction in curve crashes 89
88 Summary LSRP by County staff 270 Curves Ranked Used Proven Countermeasures 35% Reduction in severe curve crashes 90

89 91
90 LRSP Examples and Resources 92


91 93 LRSPs Come in All Shapes and Sizes 93


92 LRSP Template Do what you can, with what you have, where you are. Theodore Roosevelt 94
93 95 Example Plans Tribal Transportation Safety Example plans Washington State Local Road Safety Plan Webpage 68B8F89C6342/0/LocalRoadSafetyPlans.pdf North Dakota Local Road Safety Plan webpage
94 LRSP Resouces FHWA LRSP Video (New) FHWA LRSP Infographic unts/edc_4/ddsa_resources/lrsp.pdf FHWA Systemic Safety infographic unts/edc_4/ddsa_resources/ddsa_systemic_analy sis.pdf


95 Execute! A goal without a plan is just a wish - Antione de Saint-Exupery A good plan, violently executed now, is better than a perfect plan next week. - General George Patton 97
96 Safe Roads Ahead 98


97 For more information Jerry Roche, P.E. FHWA - Headquarters Office of Safety Jerry.Roche@dot.gov 99
Local Road Safety Plans
 Local Road Safety Plan Pilot 2.0 November 14, 2018 Agenda Welcome & Introductions Summary of Webinar 1 Travel Logistics for December Overview of LRSP Pilot WA Case Study Preparation for December workshop
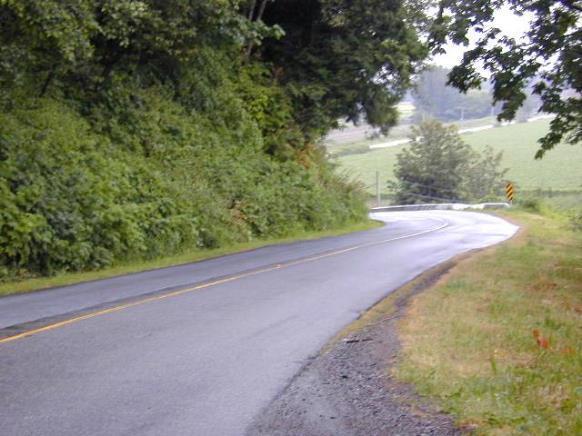
Where Did the Road Go? The Straight and Narrow about Curves
 Where Did the Road Go? The Straight and Narrow about Curves Renae Kuehl, SRF Consulting Group October 23, 2018 What is a County Roadway Safety Plan or CRSP?" CRSP Identifies priority location-specific
Lessons Learned from the Minnesota County Road Safety Plans. Richard Storm CH2M HILL
 Lessons Learned from the Minnesota County Road Safety Plans Richard Storm CH2M HILL May 21, 2014 Overview of the MN CRSP: Why Prepare Safety Plans for Local Systems? MAP-21: Requires states to address
What Engineering Can Do for You! Low Cost Countermeasures for Transportation Safety
 What Engineering Can Do for You! Low Cost Countermeasures for Transportation Safety Adam Larsen Safety Engineer Federal Highway Administration 360-619-7751 Adam.Larsen@DOT.GOV Adam Larsen TTP Safety Engineer
Engineering Countermeasures for Transportation Safety. Adam Larsen Safety Engineer Federal Highway Administration
 Engineering Countermeasures for Transportation Safety Adam Larsen Safety Engineer Federal Highway Administration 360-619-7751 Adam.Larsen@DOT.GOV Countermeasure Selection Resources Manual for Selecting
Toward Zero Deaths. Regional SHSP Road Show Meeting. Virginia Strategic Highway Safety Plan. presented by
 Toward Zero Deaths Regional SHSP Road Show Meeting presented by Virginia Strategic Highway Safety Plan December 1, 2016 1 Welcome & Introductions Purpose of the Meeting Objectives & Key Outcomes Agenda»
Systemic Safety. Doug Bish Traffic Services Engineer Oregon Department of Transportation March 2016
 Systemic Safety Doug Bish Traffic Services Engineer Oregon Department of Transportation March 2016 Oregon averages 1700 fatal and serious injury crashes each year. Some of the more common crash types include:
Designing for Pedestrians: An Engineering Symposium. Rutgers University March 21, 2013
 Designing for Pedestrians: An Engineering Symposium Rutgers University March 21, 2013 The Problem 2 Pedestrian Fatalities Pedestrian Fatalities by Year in US (1994-2010) 6000 5000 4000 3000 2000 1000 0
Acknowledgements. Mr. David Nicol 3/23/2012. Daniel Camacho, P.E. Highway Engineer Federal Highway Administration Puerto Rico Division
 Daniel Camacho, P.E. Highway Engineer Federal Highway Administration Puerto Rico Division Acknowledgements Mr. David Nicol Director, FHWA Office of Safety FHWA Office of Safety http://safety.fhwa.dot.gov/provencountermeasures/
Closing Plenary Session
 TRAFFIC SAFETY CONFERENCE Closing Plenary Session June 9, 2017 Las Colinas, TX Order of Report Out June 9, 2017 Las Colinas, TX Distracted Driving Prioritized Countermeasures Countermeasure 4a Systemically
A Strategic Highway Safety Plan. a coordinated and informed approach to reducing highway fatalities and serious injuries on all public roads.
 Introduction A Strategic Highway Safety Plan is a coordinated and informed approach to reducing highway fatalities and serious injuries on all public roads. A Strategic Highway Safety Plan is Based on
Pavement Markings (1 of 3)
") Pavement Markings (1 of 3) DESCRIPTION AND DEFINITION Disadvantages Relatively high cost (over typical Crash reduction as yet unknown painted edge line) No tactile effect The STOP AHEAD pavement marking
Pavement Markings (1 of 3) DESCRIPTION AND DEFINITION Disadvantages Relatively high cost (over typical Crash reduction as yet unknown painted edge line) No tactile effect The STOP AHEAD pavement marking
RSTF Measurements and Status
 RSTF Measurements and Status Items in green text are on or ahead of target. Items in red text need attention. Objective & Measures Status November, 2011 Winter, 3/8/12 Build, Maintain, & Leverage Partnerships
Highway Safety Improvement
 Highway Safety Improvement Tracy Turpin, PE. Highway Safety Improvement Program Manager Virginia Department of Transportation Presented at Chesapeake and Virginia Chapters of ATSSA Meeting October 13 th,2016
Lane Area Transportation Safety and Security Plan Vulnerable Users Focus Group
 Lane Area Transportation Safety and Security Plan Vulnerable Users Focus Group Agenda 1. Planning Process Review 2. What are Emphasis Areas? 3. Your Role Today 4. Data Review 5. Small group discussion
Road Safety Audit Course Participant Guidebook. August 22 & 23, Cleveland Avenue Columbus, Ohio
 Road Safety Audit Course Participant Guidebook August 22 & 23, 2017 Cleveland Avenue Columbus, Ohio 1 2 Table of Contents Executive Summary... 5 Cleveland Avenue City of Columbus... 6 Road Location Details...
Texas Intersection Safety Implementation Plan Workshop JUNE 2, 2016
 Texas Intersection Safety Implementation Plan Workshop JUNE 2, 2016 Why Intersection Safety? A small part of overall highway system, but Each year roughly 50% of all crashes estimated 3 million involve
Toward Zero Deaths: Proactive Steps for Your Community
 Est. Dec. 2014 Toward Zero Deaths: Proactive Steps for Your Community Presented by: Brian Roberts, P.E., National Association of County Engineers Marie Walsh, Ph.D., Louisiana Local Technical Assistance
SAFETY PERFORMANCE MEASURES AND TARGET SETTING. Transportation Subcommittee September 15, 2017
 SAFETY PERFORMANCE MEASURES AND TARGET SETTING Transportation Subcommittee September 15, 2017 ACTION REQUESTED No action is requested. This item is for presentation and discussion. PREVIOUS ACTION Presented
Olmsted County Highway Safety Plan
 TB072009008MKE Olmsted County Highway Safety Plan September 2009 Submitted to: Table of Contents 1. Introduction...1-1 2. Comprehensive Crash Analysis...2-1 3. Safety Emphasis Areas...3-1 4. Safety Strategies...4-1
DRIVING ZERO FATALITIES TO A REALITY ILLINOIS LOCAL SAFETY INITIATIVE
 DRIVING ZERO FATALITIES TO A REALITY ILLINOIS LOCAL SAFETY INITIATIVE Priscilla Tobias, PE State Safety Engineer Illinois Dept of Transportation Illinois Stats 102 Counties 145,000 Roadway Miles 900+ Fatalities
Speed Management Action Plan
 Speed Management Action Plan National Selection Criteria Criteria Description Fatalities The number of fatalities resulting from speeding-related crashes. Percentage Compares total fatalities in each State
RURAL HIGHWAY SHOULDERS THAT ACCOMMODATE BICYCLE AND PEDESTRIAN USE (TxDOT Project ) June 7, Presented by: Karen Dixon, Ph.D., P.E.
 June 7, Presented by: Karen Dixon, Ph.D., P.E.") RURAL HIGHWAY SHOULDERS THAT ACCOMMODATE BICYCLE AND PEDESTRIAN USE (TxDOT Project 0-6840) June 7, 2016 Presented by: Karen Dixon, Ph.D., P.E., TTI Team: Kay Fitzpatrick, Raul Avelar, & Subasish Das Project
RURAL HIGHWAY SHOULDERS THAT ACCOMMODATE BICYCLE AND PEDESTRIAN USE (TxDOT Project 0-6840) June 7, 2016 Presented by: Karen Dixon, Ph.D., P.E., TTI Team: Kay Fitzpatrick, Raul Avelar, & Subasish Das Project
CTDOT Pedestrian and Bicycle Safety Initiatives
 CTDOT Pedestrian and Bicycle Safety Initiatives 2017 Northeast Transportation Safety Conference Mark F. Carlino, P.E. Traffic Engineering Division Chief Bureau of Engineering and Construction Connecticut
Lane Departure. Key Facts
 Crash Certain types of vehicle crashes are more dangerous to drivers and other road users. The data show that crashes that involve lane departure and intersections are particularly perilous. Meanwhile,
Road Safety Assessments. Lt. Bob McCurdy Williamson County Sheriff s s Office Marion, IL.
 Road Safety Assessments Lt. Bob McCurdy Williamson County Sheriff s s Office Marion, IL. Why Are We Here? 2005 US Traffic Fatalities = 43,443 1429 4329 1361 1616 1534 3504 1729 3543 Illinois Annual Fatallities
Toolbox of Countermeasures and Their Potential Effectiveness to Make Intersections Safer
 8 Toolbox of Countermeasures and Their to Make Intersections Safer Introduction Studies included in the NCHRP 17-18 (3), Guidance for Implementation of the AASHTO Strategic Highway Safety Plan, as well
Developing a Local Road Safety Plan. April 9, 2017 Presented by: Nicole Waldheim, Danena Gaines, and Hillary Isebrands
 Developing a Local Road Safety Plan April 9, 2017 Presented by: Nicole Waldheim, Danena Gaines, and Hillary Isebrands Goal of this Workshop Familiarize county and local practitioners with different types
Now Let s Think Systemic
 Now Let s Think Systemic Remote Rural County Use of the Highway Safety Improvement Program TRINITY COUNTY DEPARTMENT OF TRANSPORTATION Richard Tippett Director MEET TRINITY COUNTY 3,208 square miles 13,786
Kansas Department of Transportation Strategic Highway Safety Plan. Intersections
 Kansas Department of Transportation Strategic Highway Safety Plan Intersections Introduction The Federal Highway Administration (FHWA) defines an intersection as a planned point of conflict in the roadway
Safety Data Resources. Multi-Discipline Safety Planning Forum March 10 & 11, 2008 Gateway Center
 Safety Data Resources Multi-Discipline Safety Planning Forum March 10 & 11, 2008 Gateway Center Tom McDonald, PE Safety Circuit Rider Iowa LTAP Jack Latterell,, PE Safety Consultant FHWA Safety Engineer,
Benefits of Center Line Rumble Strips on Rural 2-Lane Highways in Louisiana
 Benefits of Center Line Rumble Strips on Rural 2-Lane Highways in Louisiana Xiaoduan Sun, Ph.D., P.E. University of Louisiana at Lafayette 2018 Louisiana Transportation Conference Baton Rouge, February
APPENDIX G Lane Departure Action Plan
 APPENDIX G Introduction Lane Departure is one of nine emphasis areas of the North Carolina Strategic Highway Safety Plan. This emphasis area targets the following crashes: Ran Off Road Left Ran Off Road
Sponsored by the Office of Traffic and Safety of the Iowa Department of Transportation NOVEMBER 2001 CTRE
 PAVED SHOULDERS ON PRIMARY HIGHWAYS IN IOWA: AN ANALYSIS OF SHOULDER SURFACING CRITERIA, COSTS, AND BENEFITS EXECUTIVE SUMMARY Sponsored by the Office of Traffic and Safety of the Iowa Department of Transportation
HSIP Project Selection Criteria
 HSIP Project Selection Criteria The purpose of the Highway Safety Improvement Program (HSIP) is to reduce the number of fatal and injury crashes by targeting high crash locations and causes. Projects,
Reducing Fatalities and Serious Injuries on County Roads
 Reducing Fatalities and Serious Injuries on County Roads Brian C. Roberts, P.E. Executive Director National Association of County Engineers Washington, DC Housekeeping Please silence all mobile devices.
Traffic Signs (1 of 3)
") Traffic Signs (1 of 3) DESCRIPTION AND DEFINITION 5. Initiate Projects Implement sign upgrade projects and consider sign removal. In the analytical process to determine an agency s annual sign maintenance
Traffic Signs (1 of 3) DESCRIPTION AND DEFINITION 5. Initiate Projects Implement sign upgrade projects and consider sign removal. In the analytical process to determine an agency s annual sign maintenance
Table of Contents Kansas Highway Safety Improvement Program
 KANSAS Page 1 of 54 Table of Contents Table of Contents... 2 Disclaimer... 3 Executive Summary... 4 Introduction... 5 Program Structure... 5 Program Administration... 5 Program Methodology... 8 Project
PALM BEACH COUNTY LOCAL ROAD SAFETY PLAN
 PALM BEACH COUNTY LOCAL ROAD SAFETY PLAN JANUARY 2019 Street View Images Google 2018 Notice This document is disseminated under the sponsorship of the U.S. Department of Transportation in the interest
Education Emergency Medical Services Enforcement Engineering. north dakota strategic highway safety plan. Submitted by
 Education Emergency Medical Services Enforcement Engineering north dakota strategic highway safety plan Submitted by SEPTEMBER 2013 North Dakota Strategic Highway Safety Plan Prepared for North Dakota
Michael D. Turpeau Jr. State Safety Program Supervisor Georgia Department of Transportation
 Michael D. Turpeau Jr. State Safety Program Supervisor Georgia Department of Transportation Safety Programs Highway Safety Improvement Program (HSIP) Off-System Safety Program (OSSP) High Risk Rural Roads
Institute of Transportation Engineers Safety Action Plan
 I Institute of Transportation Engineers Safety Action Plan 1. Introduction 2. Intersection Crashes 3. Keep Vehicles on the Road 4. Minimize Consequences When Vehicles Leave the Road 5. School Crossing
Proven Safety Countermeasures. FHWA Office of Safety January 12, :00 p.m. to 2:00 p.m. Eastern Time
 Proven Safety Countermeasures FHWA Office of Safety January 12, 2012 1:00 p.m. to 2:00 p.m. Eastern Time Introduction and Background While States should still be considering the application of all of the
Roadside Safety Proven Countermeasures. Emmett McDevitt Transportation Safety Engineer Federal Highway Administration
 Roadside Safety Proven Countermeasures Emmett McDevitt Transportation Safety Engineer Federal Highway Administration Safety Statistics On average each year 43,000 + people die in traffic related crashes.
Street Smart - Regional Pedestrian Safety Campaign. Hopkins Grand Rounds July 16, 2014
 Street Smart - Regional Pedestrian Safety Campaign Hopkins Grand Rounds July 16, 2014 Baltimore Metropolitan Council (BMC) Who We Are The organization of the Baltimore region s elected executives, representing
REDUCING COLLISIONS AT HIGH CRASH LOCATIONS
 REDUCING COLLISIONS AT HIGH CRASH LOCATIONS Presented by Nazir Lalani P.E. Traffex Engineers Inc. N_lalani@hotmail.com ACCIDENTS AND SAFETY Why is safety important? Safety components Who is responsible?
Technical Memorandum SAFETY AND SECURITY. Prepared for: Prepared by:
 Technical Memorandum SAFETY AND SECURITY Prepared for: Prepared by: June 2013 TABLE OF CONTENTS 1. Introduction... 1 1.1 Background... 1 1.2 SAFETEA-LU... 1 1.3 MAP-21... 2 1.3.1 Highway Safety Improvement
Rebecca Szymkowski, P.E., PTOE Wisconsin Department of Transportation. ITE Midwestern District Annual Meeting June 30, 2015
 Rebecca Szymkowski, P.E., PTOE Wisconsin Department of Transportation ITE Midwestern District Annual Meeting June 30, 2015 Strategic Highway Safety Plan (SHSP) Roundabout Safety Analysis J-turn Experiences
INTERSECTION CRASH COUNTERMEASURES
 INTERSECTION CRASH COUNTERMEASURES ALL SEVERE INTERSECTION (include gap CRASHES High Friction Surface Treatment - Intersection Markings - advanced acceptance and intersection approaches to intersections
APPENDIX C. Systems Performance Report C-1
 APPENDIX C Systems Performance Report C-1 System Performance Report & Requirements According to the FAST Act, a long range transportation plan needs to include a system performance report and subsequent
Engineering Your Community Safe
 Engineering Your Community Safe Andi Bill Transportation Information Center thanks its partners for their support and assistance National Traffic Safety Goal Reasonable goal? Who s Involved? What can you
Final Report for the Minnesota County Roadway Safety Plans. Prepared for
 Final Report for the Minnesota County Roadway Safety Plans Prepared for January 2014 Contents Acronyms... ii Introduction / Overview... 1-1 Crash Data Analysis and Safety Emphasis Areas... 2-1 Safety Strategies...
TEXAS TRAFFIC SAFETY TASK FORCE. Jeff Moseley Texas Transportation Commission
 TEXAS TRAFFIC SAFETY TASK FORCE Jeff Moseley Texas Transportation Commission June 7, 2016 Fatalities and fatal crashes 2010 2015 4,000 3,500 3,417 3,407 3,536 3,533 3,000 3,061 3,067 2,782 2,803 3,037
Pedestrian Safety and the Highway Safety Improvement Program
 Pedestrian Safety and the Highway Safety Improvement Program Karen Scurry, FHWA Office of Safety Kohinoor Kar, Arizona Department of Transportation David Cohen, FHWA California Division March 13, 2014
South Carolina s Strategic Highway Safety Plan
 Target Zero South Carolina s Strategic Highway Safety Plan 215-218 March 4, 215 Dear Highway Safety Partner: The South Carolina Department of Public Safety (SCDPS) and the South Carolina Department of
Planning Guidance in the 2012 AASHTO Bike Guide
 Planning Guidance in the 2012 AASHTO Bike Guide Presentation by: RJ Eldridge Peter Lagerwey August 22, 2012 WEBINAR 2: PLANNING GUIDANCE IN THE 2012 AASHTO BIKE GUIDE Today s Webinar Significant Updates
Florida s Intersection Safety Implementation Plan (ISIP)
") Florida Department of TRANSPORTATION Florida s Intersection Safety Implementation Plan (ISIP) Alan El-Urfali, PE State Traffic Engineering and Operations Office March 28, 2017 Intersection Safety Implementation
Florida Department of TRANSPORTATION Florida s Intersection Safety Implementation Plan (ISIP) Alan El-Urfali, PE State Traffic Engineering and Operations Office March 28, 2017 Intersection Safety Implementation
Local Rural Road Safety
 Local Rural Road Safety County State Aid Highway (CSAH) 5 Freeborn County, Minnesota National Surface Transportation Policy & Revenue Study Commission Testimony submitted by: Susan G. Miller, P.E. County
Agenda. Overview PRINCE GEORGE S PLAZA METRO AREA PEDESTRIAN PLAN
 PRINCE GEORGE S PLAZA METRO AREA PEDESTRIAN PLAN May 28, 2008 Agenda Welcome and introductions Project overview and issue identification Planning context and strengths Design challenges and initial recommendations
Safety Corridors a Synthesis. Charlie Nemmers / Derek Vap University of Missouri
 Safety Corridors a Synthesis Charlie Nemmers / Derek Vap University of Missouri 1 Background: Safety Corridors Study Need grew from a four State Safety Summit Funding from Iowa, Kansas, Missouri DOTs and
City of Grand Forks Staff Report
 City of Grand Forks Staff Report Committee of the Whole November 27, 2017 City Council December 4, 2017 Agenda Item: Federal Transportation Funding Request Highway Safety Improvement Program Submitted
Title. Authors. Safety Benefits of Highway Infrastructure Investments (May 2017)
") Title Safety Benefits of Highway Infrastructure Investments (May 2017) Authors Douglas W. Harwood 1, Jessica M. Hutton 1, Zachary N. Hans 2, Reginald R. Souleyrette 3, Michael A. Fields 3 1MRIGlobal 2Iowa
Title Safety Benefits of Highway Infrastructure Investments (May 2017) Authors Douglas W. Harwood 1, Jessica M. Hutton 1, Zachary N. Hans 2, Reginald R. Souleyrette 3, Michael A. Fields 3 1MRIGlobal 2Iowa
Maine Highway Safety Facts 2016
 Maine Highway Safety Facts 216 216 MAINE HIGHWAY SAFETY FACTS The Bureau of Highway Safety and the Maine Department of Transportation are pleased to present the 216 edition of Maine Highway Safety Facts.
EMPHASIS AREA 1: PEDESTRIANS
 EMPHASIS AREA 1: PEDESTRIANS A pedestrian is seriously injured or killed every 3 days on Toronto s roads. Pedestrian collisions involve any person that is not riding in a vehicle or on a bicycle. 26% OF
REGIONAL SAFETY ADVISORY COMMITTEE North Central Texas Council of Governments Transportation Council Room Friday, April 27, :00 am 12:00 pm
 REGIONAL SAFETY ADVISORY COMMITTEE North Central Texas Council of Governments Transportation Council Room Friday, April 27, 2018 10:00 am 12:00 pm AGENDA 1. Approval of January 26, 2018 Meeting Summary
Access Management in the Vicinity of Intersections
 Access Management in the Vicinity of Intersections FHWA-SA-10-002 Technical Summary Photo: Ralph Bentley (used with permission) 0 Access Management is: The design, implementation and management of entry
SR 53 Corridor Study. Final Report Presentation. Friday, October 3, :00 AM to noon
 SR 53 Corridor Study Final Report Presentation Friday, October 3, 2014 10:00 AM to noon SR 53 Corridor Study Final Report Presentation Study Purpose: Investigate safety improvements along the SR 53 corridor
Strategies for Making Multimodal Environments Safer. Kim Kolody Silverman, CH2M
 Strategies for Making Multimodal Environments Safer Kim Kolody Silverman, CH2M Kim.kolody@ch2m.com 800 Fatalities in Illinois: Rural versus Urban Fatalities 700 600 500 400 300 200 100 0 2004 2005 2006
Implementing Strategies from Missouri s Blueprint for Safer Roadways Using System-wide Safety Solutions to Save Lives
 Implementing Strategies from Missouri s Blueprint for Safer Roadways Using System-wide Safety Solutions to Save Lives John Schaefer Sr. Traffic Studies Specialist Missouri Department of Transportation
SUCCESFUL HSIP APPLICATIONS CUUATS & CHAMPAIGN COUNTY
 SUCCESFUL HSIP APPLICATIONS CUUATS & CHAMPAIGN COUNTY Traffic Engineering and Safety Conference October 15, 2014 CUUATS and Champaign County The Champaign-Urbana Urbanized Area Transportation Study (CUUATS)
CE576: Highway Design and Traffic Safety
 CE576: Highway Design and Traffic Safety Predicting Crash Frequency for Two-Lane Rural Highway Segments Cross Sectional Elements Ahmed Abdel-Rahim, Ph.D., P.E. Civil Engineering Department University of
2003 road trauma for. Wairoa District. Road casualties Estimated social cost of crashes* Major road safety issues WAIROA DISTRICT JULY 2004
 WAIROA DISTRICT JULY 24 T he Land Transport Safety Authority (LTSA) has prepared this road safety issues report. It is based on reported crash data and trends for the 1999 23 period. The intent of the
Integrating Safety into the Transportation Decision Making Process
 Wednesday, February 17th, 2016 Integrating Safety into the Transportation Decision Making Process Priscilla Tobias, PE State Safety Engineer Illinois Department of Transportation Increased Focus of Safety
We believe the following comments and suggestions can help the department meet those goals.
 The Honorable Secretary Anthony Foxx The Secretary of Transportation United States Department of Transportation 1200 New Jersey Avenue, SE Washington, DC 20590 August 30, 2013 Dear Secretary Foxx, Thank
Proven Practices. Improving Road Safety in Your County
 Proven Practices Improving Road Safety in Your County ZERO is not an impossible goal. It will take ALL OF US to get there. The sum of all our efforts is ZERO. 60% of Fatalities Occur on Locally Owned
9:45-10:30 Understanding the Problem Overview of 15 Critical Strategies (from the CHSP, SHSP) Specific Strategies for Engineers
 Specific Strategies for Engineers") Course Agenda 8:30-9:00 Sign-in 9:00-9:45 Introducing the Issues Course Objective Present the need for safety Initiatives 9:45-10:30 Understanding the Problem Overview of 15 Critical Strategies (from the
Course Agenda 8:30-9:00 Sign-in 9:00-9:45 Introducing the Issues Course Objective Present the need for safety Initiatives 9:45-10:30 Understanding the Problem Overview of 15 Critical Strategies (from the
What is the problem? Transportation Safety Planning Purdue Road School. 42,636 Fatalities. Nearly 3M Injuries. Over 4M PDO crashes
 Transportation Safety Planning Purdue Road School March 29, 2006 What is the problem? 42,636 Fatalities Nearly 3M Injuries Over 4M PDO crashes $230B Cost to the Nation Trends in Motor Vehicle Fatality
SHSP Action Plan Development. Intersection EA Team
 SHSP Action Plan Development Intersection EA Team March 7, 2018 Agenda Welcome and Introductions Review Completed Action Plans Developed by Working Groups Next Steps STRATEGIES: INTERSECTION SAFETY EMPHASIS
Recent U.S. Research on Safety Evaluation of Low-Cost Road Engineering Safety Countermeasures Lessons for Canada
 Recent U.S. Research on Safety Evaluation of Low-Cost Road Engineering Safety Countermeasures Lessons for Canada Bhagwant Persaud Department of Civil Engineering, Ryerson University 350 Victoria Street,
2013 Traffic Safety Report
 Traffic Safety Report Introduction Every year on the more than 1, miles of unincorporated Larimer County roadways, about 375 vehicular traffic crashes occur. Those crashes include about 75 severe crashes
4. Transportation Safety
 4. Transportation Safety INTRODUCTION Safety is a key measure of the quality of the region s transportation system. In 2005, the federal legislation Safe, Accountable, Flexible, Efficient Transportation
KANSAS STRATEGIC HIGHWAY SAFETY PLAN (SHSP) The stakeholder group identified the following direction for the SHSP:
 The stakeholder group identified the following direction for the SHSP:") KANSAS STRATEGIC HIGHWAY SAFETY PLAN (SHSP) Executive Summary On February 2-3, 2006, the Kansas Department of Transportation hosted a safety summit to initiate the development of the Kansas Strategic Highway
KANSAS STRATEGIC HIGHWAY SAFETY PLAN (SHSP) Executive Summary On February 2-3, 2006, the Kansas Department of Transportation hosted a safety summit to initiate the development of the Kansas Strategic Highway
ACTIVE TRANSPORTATION
 ACTIVE TRANSPORTATION Mobility 2040 Supported Goals Improve the availability of transportation options for people and goods. Support travel efficiency measures and system enhancements targeted at congestion
BUILDING CHINARAP. Zhang Tiejun Research Institute of Highway (RIOH) Beijing, China
 Beijing, China") BUILDING CHINARAP Zhang Tiejun Research Institute of Highway (RIOH) Beijing, China E-mail: tj.zhang@rioh.cn Greg Smith International Road Assessment Programme (irap) Beijing, China E-mail: greg.smith@irap.org
BUILDING CHINARAP Zhang Tiejun Research Institute of Highway (RIOH) Beijing, China E-mail: tj.zhang@rioh.cn Greg Smith International Road Assessment Programme (irap) Beijing, China E-mail: greg.smith@irap.org
Hillsborough Pedestrian Safety Action Plan 2015 Update. Hillsborough MPO BPAC May 2015
 Hillsborough Pedestrian Safety Action Plan 2015 Update Hillsborough MPO BPAC May 2015 Presentation Overview Pedestrian Safety Action Plan (PSAP) Review Pedestrian Crash Trends Stakeholder Activities Engineering
Township Signing Practices
 Township Signing Practices The average Minnesota township has approximately 30 miles of roadway with an average of 6 total traffic signs per mile (both directions) 1 At a replacement cost of approximately
Texas Intersection Safety Implementation Plan (ISIP): Project Overview & Preliminary Findings. April 15, 2016
: Project Overview & Preliminary Findings. April 15, 2016") Texas Intersection Safety Implementation Plan (ISIP): Project Overview & Preliminary Findings April 15, 2016 2 Introductions North Central Texas Council of Governments (Dallas Fort Worth area) Capital
Texas Intersection Safety Implementation Plan (ISIP): Project Overview & Preliminary Findings April 15, 2016 2 Introductions North Central Texas Council of Governments (Dallas Fort Worth area) Capital
EVERY MOVE YOU MAKE. everymove.ohio.gov OHIO STRATEGIC HIGHWAY SAFETY PLAN
 EVERY MOVE YOU MAKE everymove.ohio.gov OHIO STRATEGIC HIGHWAY SAFETY PLAN A Comprehensive Plan to Reduce Fatalities and Serious Injuries 2014-2019 TABLE OF CONTENTS 1 Partner Pledge 2 Thank You to Our
KY s s RSA Evolution. Jo Anne Tingle, PE Kentucky Transportation Cabinet (KYTC) AASHTO TIG/FHWA RSA PEER Exchange Little Rock, AR - April 29, 2008
 AASHTO TIG/FHWA RSA PEER Exchange Little Rock, AR - April 29, 2008") KY s s RSA Evolution Jo Anne Tingle, PE Kentucky Transportation Cabinet (KYTC) AASHTO TIG/FHWA RSA PEER Exchange Little Rock, AR - April 29, 2008 Presentation Outline KY s s RSA History How we decided
KY s s RSA Evolution Jo Anne Tingle, PE Kentucky Transportation Cabinet (KYTC) AASHTO TIG/FHWA RSA PEER Exchange Little Rock, AR - April 29, 2008 Presentation Outline KY s s RSA History How we decided
Proven Safety Countermeasures Webinar Series
 1 Kansas LTAP Proven Safety Countermeasures Webinar Series November 14, 28, and December 5, 2017 10:00 a.m. to 11:00 p.m. CST 2 WELCOME Presenter: Mehrdad Givechi, PE, PTOE Program Engineer 785-864-2593
TRAFFIC CALMING GUIDE FOR TORONTO CITY OF TORONTO TRANSPORTATION SERVICES DIVISION
 TRAFFIC CALMING GUIDE FOR TORONTO CITY OF TORONTO TRANSPORTATION SERVICES DIVISION CITY OF TORONTO TRANSPORTATION SERVICES DIVISION 2016 TRAFFIC CALMING GUIDE FOR TORONTO TABLE OF CONTENTS Introduction
IMPROVING SAFETY PLANNING FOR SAFETY
 3 IMPROVING SAFETY Planning and building a safe multi-modal transportation system for the travelling public is the most critical goal of the RTC. Safety is involved in all types of transportation: driving,
NDDOT TRAFFIC OPERATIONS MANUAL
 Prepared By: North Dakota Department of Transportation Programming Division Traffic Operations Section June 05 Table of Contents TRAFFIC OPERATIONS OVERVIEW... 3 TRAFFIC OPERATIONS STUDIES RURAL SEGMENTS
Keep Customers and Ourselves Safe. Mark Shelton, District Engineer. Tracker. Measures of Departmental Performance
 Keep Customers and Ourselves Safe Mark Shelton, District Engineer Tracker Measures of Departmental Performance Safety is a daily commitment for all MoDOT employees. From design and construction to operations
6.8 Transportation Safety & Security
 6.8 Transportation Safety & Security This chapter addresses transportation safety and security as required under MAP-21 and California s Strategic Highway Safety Plan. Transportation safety and security
USDOT Bicycle and Pedestrian Safety Initiative: Safer People and Safer Streets. Barbara McCann, USDOT Office of Policy
 { USDOT Bicycle and Pedestrian Safety Initiative: Safer People and Safer Streets Barbara McCann, USDOT Office of Policy 4 Steps from policy to practice Creating multi-modal streets means: 1. Change Decision-Making
Ohio Department of Transportation Edition of the OMUTCD It s Here!
 Ohio Department of Transportation John R. Kasich, Governor Jerry Wray, Director 2012 Edition of the OMUTCD It s Here! June 6, 2012 Here are reasons why we have a Manual of Uniform Traffic Control Devices
FLORIDA STRATEGIC HIGHWAY SAFETY PLAN
 FLORIDA STRATEGIC HIGHWAY SAFETY PLAN 1 FLORIDA STRATEGIC HIGHWAY SAFETY PLAN Presenter: Joe Santos State Safety Engineer FDOT State Safety Office 2 Presentation 3/28/2017 3 FLORIDA STRATEGIC HIGHWAY SAFETY
SHRP 2. Strategic Highway Research Program. Accelerating solutions for highway safety and performance. Charles Fay, Sr.
 Strategic Highway Research Program SHRP 2 Accelerating solutions for highway safety and performance Charles Fay, Sr. Program Officer GIS-T Boise, ID 2013 Second Strategic Highway Research Program ( SHRP
PEDESTRIAN SAFETY IMPROVEMENT EVALUATION GUIDELINE FOR UNCONTROLLED CROSSINGS
 PEDESTRIAN SAFETY IMPROVEMENT EVALUATION GUIDELINE FOR UNCONTROLLED CROSSINGS Traffic Safety Engineering Division Updated: April 2018 EXECUTIVE SUMMARY NDOT Traffic Safety Engineering Division developed