Education Emergency Medical Services Enforcement Engineering. north dakota strategic highway safety plan. Submitted by
|
|
|
- Wendy Hicks
- 5 years ago
- Views:
Transcription


1 Education Emergency Medical Services Enforcement Engineering north dakota strategic highway safety plan Submitted by SEPTEMBER 2013
2 North Dakota Strategic Highway Safety Plan Prepared for North Dakota Department of Transportation Prepared by September 2013
3 Contents Section Page Acronyms... iv 1 Introduction and Background North Dakota Strategic Highway Safety Planning and Implementation Edition of the North Dakota SHSP NDDOT s Highway Safety Program Highlights SHSP Development Process Traffic Safety Partners National Context Renewed Focus on Severe Crashes Determining Safety Emphasis Areas Crash Data Overview National and State Context Traffic Fatalities North Dakota Traffic Fatalities and Incapacitating Injuries by Safety Emphasis Areas North Dakota Safety Emphasis Areas North Dakota Safety Goal Prioritizing Safety Strategies Safety Strategies and Prioritization Workshop Priority Safety Strategies for Safety Emphasis Areas Young Drivers Speeding or Aggressive Drivers Alcohol Related Unbelted Vehicle Occupants Lane Departure Intersections Other Priority Safety Strategies Older Drivers Involving Heavy Vehicles Addressing Severe Crash Potential Priority Facility Types for the Six Safety Emphasis Areas Severe Crashes Involving Older Drivers and Heavy Vehicles Western North Dakota Local Road System Issues Key Trends for Local Road Crashes Local Road Safety Programs Actions to Strengthen Local Road Safety Safety Investment Review Introduction Driver Behavior Program Investment Impaired Driving Prevention Vehicle Occupant Protection SEPTEMBER 2013 ii
4 6.2.3 Motorcycle Safety Speed Management Youth/Young Drivers Distracted Driving Additional Safety Programs Infrastructure Investment Intersections Lane Departure Conclusions Implementation Driver Behavior Program Implementation Infrastructure Implementation Emergency Response Improvement Crash Data Improvements Performance Measurement Appendixes A Severe Crash Fact Sheets B Strategy Tables C North Dakota Crash Trees SEPTEMBER 2013 iii
5 Acronyms 4Es AASHTO BAC CHSP DUI EMS FHWA FY GDL HSIP LEAD MAP 21 MMUCC NCHRP NDDOT NDLTAP NHTSA SAFETEA LU SHSP SOAR TraCS TRCC TSO USC YIELDD education, emergency medical services, enforcement, and engineering American Association of State Highway and Transportation Officials blood alcohol concentration Comprehensive Highway Safety Plan driving under the influence emergency medical services Federal Highway Administration fiscal year graduated driver licensing Highway Safety Improvement Program Listen, Educate, Ask, Discuss Moving Ahead for Progress in the 21st Century Model Minimum Uniform Crash Criteria National Cooperative Highway Research Program North Dakota Department of Transportation North Dakota Local Technical Assistance Program National Highway Traffic Safety Administration Safe, Accountable, Flexible, Efficient Transportation Equity Act: A Legacy for Users Strategic Highway Safety Plan Statewide Online Ambulance Reporting Traffic and Criminal Software Traffic Records Coordination Committee Traffic Safety Office United States Code Young Individuals Establishing Logical Driving Decisions SEPTEMBER 2013 iv
6 1 Introduction and Background 1.1 North Dakota Strategic Highway Safety Planning and Implementation The State of North Dakota, through the leadership of the North Dakota Department of Transportation (NDDOT), published its first Strategic Highway Safety Plan (SHSP) in 2006 using a process that built on the state s existing Comprehensive Highway Safety Plan (CHSP). With this revised SHSP, North Dakota is establishing a long term goal to eliminate all traffic fatalities on North Dakota s public roads. This approach reflects a growing national trend that no life lost or serious injury is acceptable. This 2013 North Dakota SHSP update was prepared to align traffic safety efforts across the state with this mentality and encourage responsible agencies and organizations to work together in a coordinated effort Edition of the North Dakota SHSP The 2006 North Dakota SHSP focused on the following safety emphasis areas: Reduce Alcohol Impaired Driving Increase the Use of Safety Restraints for all Occupants Younger Driver/Older Driver Safety Curb Aggressive Driving Improvements to Address Lane Departure Crashes Enhancing Emergency Medical Capabilities to Increase Survivability Improve Intersection Safety Strategies for each emphasis area were chosen and safety projects implemented were consistent with the SHSP. However, a review of North Dakota crash records revealed that despite these efforts, fatalities and incapacitating injuries have increased since NDDOT s Highway Safety Program Highlights The NDDOT manages federal safety funds directed towards driver behavior and infrastructure programs. A summary of past investments for these areas is provided in this subsection. Infrastructure Improvements through Highway Safety Improvement Program The Highway Safety Improvement Program (HSIP) includes federal funds intended to address hazardous highway locations and hazardous railway highway grade crossings. The HSIP program primarily addresses safety needs through infrastructure improvements. In fiscal years (FY) 2011 and 2012, approximately $5.75 million in FY 2011 and just over $8.8 million in FY 2012 were obligated for highway safety improvements. The analysis process to select candidate locations for HSIP funds has historically used site based analysis techniques, which focused largely on localized improvements identified through annual high crash listings rather than the systemic deployment of strategies. The analysis technique used by the NDDOT weights crashes by severity to help address locations where severe crashes have occurred. More recently, the NDDOT has begun implementing statewide strategies for lane departure and intersection SEPTEMBER
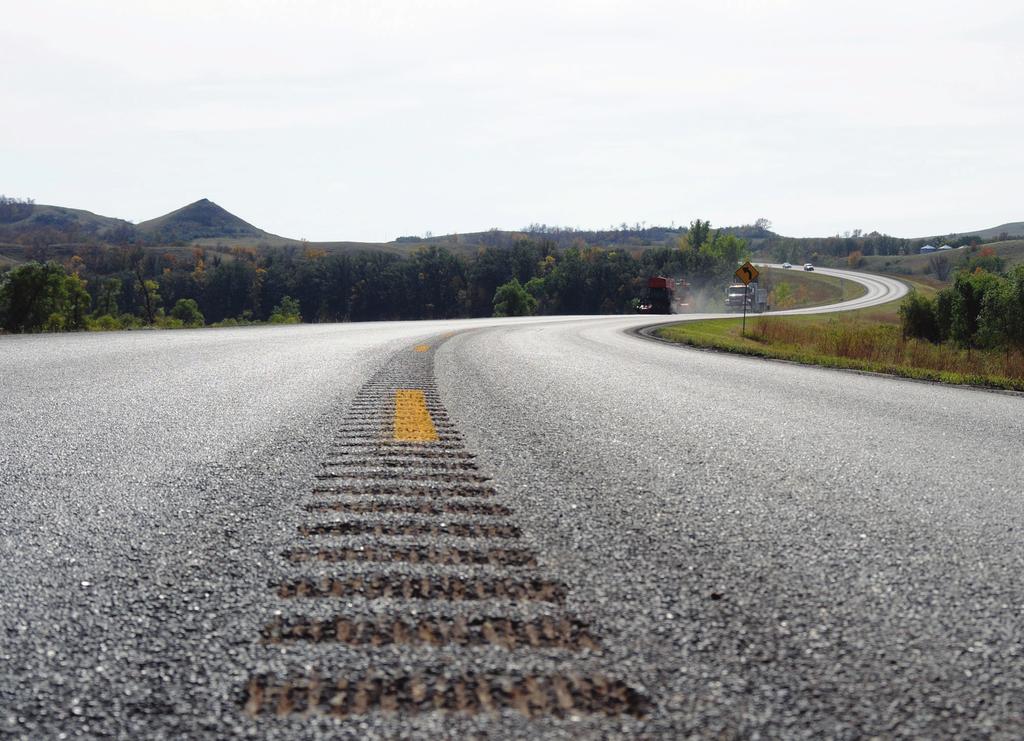
7 improvements based on roadway and traffic criteria. These and other projects implemented through the HSIP in FY are summarized as follows: The NDDOT has embarked on a program to address lane departure crashes by widely deploying centerline, edge line, or shoulder rumble strips on rural state highways. This program invested $3.8 million to improve nearly 750 miles of road. Approximately $46,000 was invested to install enhanced pavement markings on 2.54 miles of road to address lane departure crashes. A total of $55,000 was invested to install enhanced delineation at 10 sharp curves. Over $10.2 million was invested to improve 66 intersections with projects that included installation of turn lanes, increased sight distance, and improved geometry of pedestrian and bicycle facilities. Behavioral Program Highlights of the NDDOT Traffic Safety Office In collaboration with its safety partners, the NDDOT s Traffic Safety Office (TSO) annually invests approximately $4.5 million in new grant funds to accomplish its traffic safety performance goals. Programming highlights for the TSO include the following: Coordination of statewide impaired driving enforcement through the Regional Driving Under the Influence (DUI) Task Force program. Regional DUI Task Forces include state, county, city, university, and tribal law enforcement agencies collaborating to provide high visibility enforcement for impaired driving through regular saturation patrols and sobriety checkpoints. Regional DUI Task Forces facilitate the arrest, prosecution, and adjudication of DUI offenders. Agencies participate in the national impaired driving enforcement campaigns and conduct additional quarterly high visibility enforcement during high risk community events throughout the year. In addition, North Dakota has effectively used speed enforcement (enhanced by the purchase and use of radar/lidar units) as a trigger violation to enforce both impaired driving and seat belt violations. North Dakota s nationally recognized 24/7 Sobriety Program is a highly supervised, court monitoring program for DUI offenders to maintain sobriety 24 hours a day, 7 days a week through twice daily alcohol testing or the use of an alcohol monitoring ankle bracelet. To increase public awareness of the importance of seat belt use and its safety and enforcement consequences, the TSO conducts four annual Click It or Ticket events. Over 60 law enforcement agencies across the state participate in the high visibility campaign to increase public seat belt compliance. To help ensure the proper use and installation of child safety seats, North Dakota s comprehensive Child Passenger Safety program provides technical assistance, training, and resources to parents and caregivers; Child Passenger Safety technician certification; over 1,900 car seats given annually to the public; and Child Passenger Safety workshops and courses reaching approximately 400 participants annually across the state. The Tribal Outreach Program provides resources and technical assistance to North Dakota s tribes to establish and/or maintain a traffic safety outreach program that disseminates information on seat belt use, impaired driving, speeding, and distracted driving. The Parents LEAD (Listen, Educate, Ask, Discuss) program educates parents about the importance of their involvement and intervention to reduce underage alcohol consumption. A SEPTEMBER
8 featured component of the program is its website ( which offers a variety of prevention and communication resources and suggestions for parents. Effective, data driven traffic safety programs are built on reliable and timely crash data. North Dakota continues to expand law enforcement agencies conversion from paper crash reporting to electronic reporting using the NDDOT s Traffic and Criminal Software (TraCS). The state currently receives over 83 percent of all crash reports electronically. Each of the state s four tribes has expressed interest in implementing TraCS for crashes that occur on tribal lands. The TSO seeks to strengthen its understanding of the public s attitudes, perceptions, and behaviors regarding traffic safety. Traffic safety surveys (such as the DUI Offender Survey; annual statewide and county level seat belt observation surveys; Behavioral Risk Factor Surveillance Survey; Youth Risk Behavior Survey; and 2012 Statewide Traffic Safety Survey) shape the TSO s traffic safety programs to strengthen North Dakota s traffic safety culture, reinforce motorists safe driving behaviors, and reduce traffic fatalities and serious injuries. 1.2 SHSP Development Process The North Dakota SHSP incorporates federal guidance and is structured to accomplish specific goals. These goals are as follows: Be consistent with Federal Highway Administration (FHWA) procedural guidance. Establish a mission, vision, and goal for all traffic safety partners in North Dakota. Address the frequency, rate, and primary factors contributing to fatalities and incapacitating injuries in North Dakota through a comprehensive (addresses the 4Es of safety [education, enforcement, engineering, and emergency medical services]) and data driven process that considers all users on all roads. Incorporate input provided by safety partners representing national, state, tribal, and local agencies, and private safety advocacy groups. Guide future safety investments. Figure 1 1 illustrates the process used to update the North Dakota SHSP, beginning with the crash analysis and concluding with the SHSP report. Collect and Analyze Crash Records Select Safety Emphasis Areas Develop Comprehensive List of Safety Countermeasures Gather Stakeholder Input at Safety Workshop Identify Critical Strategies & Interim Safety Goal Identify Implementation Guidance Publish Updated North Dakota SHSP Implement & Evaluate Traffic Safety Programs FIGURE 1-1 North Dakota SHSP Update Development Process SEPTEMBER
.")
. Third, patterns in crash location, jurisdiction, and facility type to drive future implementation are identified (Chapter 4). 1.")
9 Through the SHSP development process, a three level prioritization of safety improvement projects takes place (Figure 1 2). First, key safety emphasis areas that represent the greatest opportunity to save lives and reduce injuries are identified (Chapter 2). Second, priority strategies are selected through FIGURE 1-2 North Dakota SHSP Update Development Process stakeholder input and considering the ability to address crashes in the selected emphasis areas, the implementation cost and effectiveness (Chapter 3). Third, patterns in crash location, jurisdiction, and facility type to drive future implementation are identified (Chapter 4). 1.3 Traffic Safety Partners The North Dakota SHSP was developed through coordination with stakeholders from public and private agencies. Invited participants (Table 1 1) represent a broad spectrum of agencies and organizations, allowing the North Dakota SHSP to be a truly comprehensive document. Participating stakeholders provided input on selecting an intermediate goal and helped identify priority strategies to address North Dakota s traffic safety issues. The participating stakeholders included many outside of the traditional safety planning process, including planning organizations, nonprofit agencies, universities, tribes, counties, and cities. Individuals representing the 4Es were also invited to participate in the SHSP process. TABLE 1-1 Invited North Dakota Safety Partners Participants Invited Based on MAP 21 Requirements Governor s Highway Safety Representative Metropolitan planning organizations Major modes of transportation State, tribal, and local law enforcement Rail grade crossing safety/operation Lifesavers Additional Invited Participants Affected families Insurance industry Emergency medical services Community coalitions (such as Safe Communities) North Dakota Association of Counties Motor Carrier Safety Assistance Program Administrator Motor vehicle services County transportation officials Non motorized transportation Major federal, state, tribal, and local safety stakeholders Traffic safety resource prosecutor NDDOT Safety and Engineering personnel Safe Routes to School North Dakota State University Upper Great Plains Transportation Institute Tribal transportation SEPTEMBER

10 1.4 National Context Renewed Focus on Severe Crashes Strategic safety planning, as performed today, first began when the American Association of State Highway and Transportation Officials (AASHTO) published a nationally focused SHSP in 1997, which was updated in In the document, AASHTO and FHWA noted that individual state efforts had not effectively lowered the number of fatal crashes in the past decade. Contributing to the lack of progress was that many state highway agencies were not coordinating efforts with their safety partners. In addition, states efforts were typically not being focused on the primary causes of fatal crashes and implemented safety projects were not effective at reducing traffic fatalities and injuries. In response to this lack of progress, the Safe, Accountable, Flexible, Efficient Transportation Equity Act: A Legacy for Users (SAFETEA LU) legislation required states to prepare an SHSP for the first time. The recommended SHSP development process considered all roads, was comprehensive, involved stakeholders, was data driven, and focused on severe crashes. The current federal transportation legislation, Moving Ahead for Progress in the 21st Century (MAP 21), continues the emphases identified under SAFETEA LU, including a focus on addressing the most severe crashes those crashes resulting in fatal and/or incapacitating injuries. MAP 21 also specifies that the SHSP will be a guiding document for safety investments in the states, identifying priorities, strategies, and key facilities where severe crashes occurred. MAP 21 also places greater emphasis on states meeting the needs of older drivers/pedestrians, especially if fatalities and incapacitating injuries per capita for these users increased during the most recent 2 year period for which data are available. SEPTEMBER
11 2 Determining Safety Emphasis Areas 2.1 Crash Data Overview National and State Context Traffic Fatalities Fatal and life changing injury (severe) crashes are a major public health issue in the United States. In 2011, the latest estimates showed that 32,310 people were killed in traffic crashes nationally nearly 90 people killed every day. From a peak of 54,589 fatalities in 1972, traffic related fatalities in the U.S. have been significantly reduced, but with fluctuations from year to year. This trend was interrupted beginning in the early 1990s and continuing through the early 2000s as traffic fatalities began to increase. However, since 2005, traffic fatalities have decreased dramatically to the lowest number of fatalities in recent history 33,833 in North Dakota s traffic fatality trend resembled the national trend through 2008, including traffic fatalities dropping in the state beginning in However, unlike the national trend, North Dakota s traffic fatalities have increased since 2008 (Figure 2 1). There are numerous possible reasons contributing to the difference between national and state trends, including, but not limited to: Shifts in the age of the driving population Steadily growing vehicle miles traveled in North Dakota, which is counter to the flat or decreasing national trend in travel Other states have a longer history using a systemic investment approach to focus on locations with risk factors The growing challenges of providing emergency medical response and quick access to advanced health care in rural areas North Dakota Traffic Fatalities and Incapacitating Injuries by Safety Emphasis Area The AASHTO SHSP focused on 22 specific highway safety challenges, or safety emphasis areas, that are divided into six parts or categories (Table 2 1). Disaggregating crash data by safety emphasis areas helps agencies and organizations identify safety priorities based on actual data. This step also reduces the universe of safety strategies considered to those associated with the most common types of severe crashes occurring on an agency s transportation system. Finally, crash data disaggregation and identification of key emphasis areas helps agencies select the most effective strategies for reducing crashes and determine where limited funds should be invested for the most positive impact. Table 2 2 shows the disaggregation of North Dakota s severe crashes. SEPTEMBER
12 FIGURE 2-1 Fatality Rate National and North Dakota TABLE Safety Emphasis Areas from the AASHTO State Highway Safety Plan Part 1: Drivers 1. Instituting Graduated Licensing for Young Drivers 2. Ensuring Drivers are Licensed and Fully Competent 3. Sustaining Proficiency in Older Drivers 4. Curbing Aggressive Driving 5. Reducing Impaired Driving 6. Keeping Drivers Alert 7. Increasing Driver Safety Awareness 8. Increasing Seat Belt Usage and Improving Airbag Effectiveness Part 2: Special Users 9. Make Walking and Street Crossing Safe 10. Ensuring Safer Bicycle Travel Part 3: Vehicles 11. Improving Motorcycle Safety and Increasing Motorcycle Awareness 12. Making Truck Travel Safer 13. Increasing Safety Enhancements in Vehicles Part 4: Highways 14. Reducing Vehicle Train Crashes 15. Keeping Vehicles on the Roadway 16. Minimizing the Consequences of Leaving the Road 17. Improving the Design and Operation of Highway Intersections 18. Reducing Head On and Across Median Crashes 19. Designing Safer Work Zones Part 5: Emergency Medical Services (EMS) 20. Enhancing Emergency Medical Capabilities to Increase Survivability Part 6: Management 21. Improving Information and Decision Support Systems 22. Creating More Effective Processes and Safety Management Systems Source: AASHTO Strategic Highway Safety Plan, American Association of State Highway and Transportation Officials, 1997 and SEPTEMBER
13 TABLE 2-2 North Dakota Fatal and Incapacitating Injury Crashes by AASHTO Safety Emphasis Area Statewide (All Roads) Safety Emphasis Area Percent Number Drivers Special Users Vehicles Highways Involving Driver Under Age 21 25% 493 Unlicensed drivers Involving drivers over the age of 64 14% 272 Excessive Speed or Aggressive Driving 27% 553 Alcohol Related 30% 607 Distracted, asleep, or fatigued drivers 11% 222 Safety awareness Unbelted Vehicle Occupants 48% 963 Pedestrians crashes 6% 119 Bicycle crashes 2% 47 Motorcycles crashes 13% 255 Heavy vehicle crashes 12% 243 Safety enhancements Train vehicle collisions 0% 7 Lane Departure Crashes Including both lane departure (844 severe crashes) and head on/ sideswipe opposing crashes (131 severe crashes) 48% 975 Intersection Crashes 23% 459 Work zone crashes 1% 25 EMS Enhancing emergency capabilities Management Information and decision support systems More effective processes Total Severe (Fatal and Incapacitating Injury) Crashes 2,012 Notes: North Dakota Crash Data Records, 2007 to 2011 Numbers in this table do not add up to the statewide crash numbers because one crash may be categorized into multiple emphasis areas. For example, one crash may involve a young driver at an intersection and therefore be included in both of these emphasis areas. SEPTEMBER


14 2.2 North Dakota Safety Emphasis Areas Based on crash records, the following six safety emphasis areas had the most associated severe crashes and were selected for the North Dakota SHSP (Figure 2 2): Younger drivers Unbelted vehicle occupants Speeding or aggressive drivers Lane departure Alcohol related Intersections Of these safety emphasis areas, lane departure has the most crashes (975 severe crashes) and intersections have the fewest crashes (459 severe crashes). Following intersections, there is a noticeable drop to the next highest emphasis area: older drivers with 272 related severe crashes, suggesting there is a natural breakpoint after the top six safety emphasis areas (shown as red bars in Figure 2 2 and red lines in Figure 2 3). However, further investigation of severe crashes involving older drivers reveals that fatal and incapacitating injury crashes increased in the most recent 2 year period in which data are available (shown as green line in Figure 2 3). In response to MAP 21 guidance, crashes involving older drivers are included in the SHSP for further consideration in subsequent steps. As shown in Figure 2 3, severe crashes involving heavy vehicles (blue line with long dash) were observed to have a distinct upward trend during the study period. While not selected as a safety emphasis area for the SHSP, severe crashes involving heavy vehicles continue to be a part of the discussion during the Plan s development. Fact sheets summarizing key information for each of the six selected safety emphasis areas were prepared during the SHSP development. These fact sheets are provided in Appendix A Related Severe Crashes Emphasis Area FIGURE 2-2 Safety Emphasis Areas Organized by North Dakota s Severe Crashes SEPTEMBER
15 250 Annual Fatal and Incapacitating Injury Crashes Lane Departure Unbelted Vehicle Occupants Alcohol Related Excessive Speed or Aggressive Driving Involving Driver Under Age 21 Intersection Crashes Involving Driver Over the Age 64 Motorcycle Crashes Heavy Vehicle Crashes Distracted, Asleep or Fatigued Drivers Pedestrian Crashes Bicycle Crashes Work Zone Crashes Train Vehicle Collisions FIGURE 2-3 Annual Severe Crashes (Fatal and Incapacitating Injuries) by Safety Emphasis Area 2.3 North Dakota Safety Goal As stated previously, North Dakota has established a long term goal to eliminate all traffic fatalities on North Dakota s public roads. The state recognizes that this is a long term vision, and achieving it will require many years and dramatic shifts in the safety culture for North Dakota residents. While it is widely recognized within the state that there is only one suitable long term goal, it is also acknowledged that intermediate (short term) goals are needed as benchmarks to measure progress. Intermediate goals also promote cooperation among agencies to accomplish these goals. Discussions were held with safety stakeholders to begin the process of selecting an intermediate goal. Due to the upward trend of traffic fatalities, there was unanimous support for an aggressive intermediate goal to reduce traffic fatalities, and several options were discussed. After considering the stakeholders input, the SHSP Steering Committee selected reducing the 3 year average of traffic fatalities to 100 or fewer by SEPTEMBER

16 3 Prioritizing Safety Strategies 3.1 Safety Strategies and Prioritization Workshop Following the selection of the safety emphasis areas, potential safety strategies were identified for each emphasis area. The initial list of strategies was compiled using Countermeasures That Work 1 and the National Cooperative Highway Research Program (NCHRP) Report 500 series 2. Both resources were developed to assist state and local agencies in implementing programs to reduce the number of fatalities and injuries in targeted emphasis areas. Additions and edits were made to the strategies to develop a comprehensive list that reflects North Dakota programs. On August 16, 2012, the North Dakota Steering Committee conducted a workshop for safety stakeholders and partners to provide input on North Dakota s priority safety strategies. The workshop began with group presentations to create a common understanding of the traffic safety issues in the state. Afternoon breakout sessions provided focused discussions of strategies and the workshop ended with a group strategy prioritization exercise. North Dakota s strategy tables with edits made during the workshop are provided in Appendix B. As the process of selecting priority strategies moved forward, the stakeholder input, along with information regarding effectiveness and cost, was used to determine the priority safety strategies for North Dakota s future safety investments. 3.2 Priority Safety Strategies for Safety Emphasis Areas Organized by safety emphasis area, the priority safety strategies are intended to help focus their implementation. Widespread use of these strategies is expected to reverse North Dakota s growing trend in traffic fatalities and incapacitating injuries. The priority safety strategies are outlined in the following subsections. However, these are not intended to be an all inclusive list of strategies. Other strategies intended to address the noted emphasis areas may also be deployed Young Drivers Strengthen current restricted teen driver licensing to meet graduated driver licensing (GDL) system requirements, including: - Require classroom education component. (Consider parental education requirement. Current studies underway suggest parental engagement influences safe driving behaviors of their teen drivers.) - Require 30 to 50 hours of supervised driving for drivers 16 to 17 years of age. 1 Countermeasures that Work, 6 th Edition. DOT HS National Highway Traffic Safety Administration, Washington, D.C. February National Cooperating Highway Research Program Report 500: Guidance for Implementation of the AASHTO Strategic Highway Safety Plan; Volumes Transportation Research Board, Washington, D.C. SEPTEMBER


17 - Implement passenger restrictions. - Implement minimum age of 17 to qualify for a full, unrestricted license. (Research demonstrates safety benefits of delaying licensure to provide additional driving skill development and experience.) Enact/support legislation requiring teen drivers subject to graduated driver licensing be identified via a vehicle decal to assist law officers in enforcing GDL provisions. Publicize and enforce teen driving license provisions. Publicize and enforce laws pertaining to underage drinking and driving Speeding or Aggressive Drivers Enact/support legislation to strengthen penalties such as increased fines for right of way and speed violations. Address the perception of widespread speeding by heavy vehicles by first conducting a statewide assessment of commercial vehicle speeds. In response to the assessment results, examine enforcement, safety education, and outreach safety strategies for priority regions or corridors identified as needing improvement. Strengthen speed detection and public perceived risk of being stopped and ticketed through sustained, well publicized, highly visible speed enforcement campaigns. Install speed signing using variable message signs in school zones Alcohol-Related Conduct a comprehensive assessment of impaired driving laws to strengthen criminal penalties and administrative license sanctions against best practices and recommend impaired driving policy changes. Included in this assessment will be an examination of the following key elements: - Extend/strengthen administrative license suspension for DUI offenders, including first time offenders. - Remove the option of blood alcohol content (BAC) test refusal. (Or at a minimum, establish stronger penalties for BAC test refusal than for test failure.) - Impose increased penalties for a 0.15 BAC and higher (Research demonstrates a higher risk of recidivism beginning at 0.15 BAC and significant life saving benefits of increased penalties at 0.15.). - Implement a mandatory ignition interlock program; require ignition interlocks as a condition for license reinstatement for first time and high BAC offenders. (Research demonstrates that approximately 60 percent of alcohol related fatalities involve offenders with no prior DUI offense. Mandatory ignition interlocks for first time offenders serve as an effective public deterrent to drinking and driving.) SEPTEMBER


18 - Apply holistic or ecological approaches (via persons, families, cultures, communities, and policies) to educate the motoring public and create a cultural awareness of the risks associated with excessive alcohol use. - Conduct highly publicized compliance checks and training for alcohol retailers and merchants to reduce sales to underage persons. - Conduct public outreach on accessible safe ride alternative transportation services. - Strengthen impaired driving detection and public perceived risk of arrest through sustained, well publicized, highly visible impaired driving enforcement, including sobriety checkpoints Unbelted Vehicle Occupants Enact primary seat belt legislation that includes primary enforcement of belt use for all passengers in all seating positions. Strengthen penalties for lack of seat belt use. Strengthen detection and the public perceived risk of being stopped and ticketed through sustained, well publicized, highly visible seat belt enforcement campaigns Lane Departure Deploy centerline, shoulder, and edge line rumble strips to alert drivers when they are leaving their lane of travel. Use enhanced edge line markings (for example, 6 inch edge lines, wet reflective material, or embedded pavement markings) where appropriate, such as sections with either unpaved or narrow paved shoulders among others. Provide enhanced shoulders, lighting, delineation (for example, Chevrons), or pavement markings for sharp horizontal curves. Improve roadway shoulders by eliminating drop offs from paved road to unpaved shoulder Intersections Signalized Intersections Supplement conventional enforcement of red light running with confirmation lights; include a public information campaign to increase awareness and compliance. Provide countdown timers, advanced walk phase, and other low cost pedestrian/bicycle facility improvements. Unsignalized Intersections Improve visibility of intersections by providing appropriate street lighting. Channelize or close median openings to restrict or eliminate turning maneuvers. Construct roundabouts at appropriate locations. Improve visibility of intersections by providing enhanced signing, delineation, or pavement markings/messages. SEPTEMBER
19 Install larger regulatory and warning signs at intersections, including the use of dynamic warning signs at appropriate intersections. At appropriate locations, provide or enhance (such as lengthen or offset) left turn and right turn lanes at intersections. These enhancements may include acceleration lanes on divided highway corridors or bypass lanes at T intersections. 3.3 Other Priority Safety Strategies Because of the increasing trend in severe crashes involving older drivers or heavy vehicles, the SHSP Steering Committee discussed key strategies that may be appropriate for these areas Older Drivers Regarding infrastructure approaches to reduce these severe crashes, the strategies focus on improving signing, installing intersection lighting, and adding turn lanes; which are already priority strategies in the Lane Departure and Intersection safety emphasis areas. Furthermore, the NDDOT is already implementing these kinds of projects across the state. Policy and program strategies identified as a priority to address issues with older drivers include the following: Review license renewal policies for older drivers identified as an excessive risk through screening by motor vehicle personnel (such as restrict vs. rescind, age and interval schedule for license renewal, etc.). Continue to evaluate policies and relevant data in the future. Develop informational resources and conduct outreach for older driver safety screening for family, friends, physicians, and law enforcement to report at risk drivers: - Establish a statewide "one stop" resource to guide the public on addressing driving skill assessments, educational courses, licensing, and safe mobility choices. - Provide educational and training opportunities to the general older driver population to assess their driving capabilities and limitations, improve skills, and voluntarily limit their driving to safer driving conditions. Establish a broad based coalition to plan for addressing older adults transportation needs and strengthen transportation options Involving Heavy Vehicles Many severe crashes involving heavy vehicles are either lane departure crashes, side swipe crashes, or angle crashes at intersections. The infrastructure priority strategies identified in the respective areas are considered appropriate for crashes involving heavy vehicles. Potential changes to driver behavior program and strategy implementation for crashes involving heavy vehicles would be influenced by the findings from the assessment identified in the Speeding and Aggressive Drivers safety emphasis area. Furthermore, when a heavy vehicle was involved in a severe crash with another vehicle, past crash records show that more drivers in the passenger vehicle were reported with contributing factor ( Therefore, the strategies to address driver behavior should also reduce severe crashes involving heavy vehicles. SEPTEMBER
20 4 Addressing Severe Crash Potential Severe crashes on North Dakota s roadways tend to be dispersed across the state s network of roads. With severe crash clusters relatively rare, the challenge is distinguishing the locations that have a greater potential for a future severe crash from all other sites. According to research, severe crash locations often change along a highway or roadway system. Therefore, improving specific locations simply because one or a small number of severe crashes could lead to a trend commonly called chasing fatals. In other words, locations targeted because of a severe crash during the previous year(s), may have no severe crash the following year even if the locations had not been the focus for a program or improvement. As a result, the investment could be an inefficient use of the state s resources. Instead, an approach addressing locations based on the risk or potential for a future severe crash, in combination with historic safety performance, will provide increased opportunity to prevent future crashes. This evolving approach to safety investment is known as the systemic safety process. The challenge of a systemic safety process is understanding those elements of the transportation system that have an increased risk for a future crash. Individually, severe crashes often appear to be at random locations, but in aggregate there may be patterns based on the facility type (rural county roads, urban signalized intersections, etc.), the locations characteristics (traffic volumes, speed limits, etc.), or persons involved (gender, age, vehicle type, etc.). The facility types and characteristics can be viewed as risk factors for crash potential, indicating which locations or individuals may have a greater potential for a severe crash in the future. This should not be interpreted to mean that the characteristic or risk factors caused the crash, but simply that the presence of the characteristics was noted at these locations. Risk factors combined with systemic strategies implementation wide use of low cost, effective strategies that address the predominant collision type are evolving to create a new approach to location prioritization and safety investment. All emphasis areas are prime candidates for systemic treatment because specific locations typically do not have multiple severe crashes year after year. While the systemic deployment of strategies is an evolving concept in infrastructure based safety, it has been used for some time in driver behavior programs. Driver behavior safety programs often begin by identifying demographic, time, or location characteristics that are overrepresented in severe crashes. In response, education and enforcement campaigns are developed to target these overrepresented characteristics. By understanding priority facility types and location risk factors, safety investment decisions can be guided to the appropriate locations. Directing programs to locations similar to where severe crashes occurred in the past or targeting drivers and passengers that tend to exhibit behavior that may contribute to severe crashes can be a much more effective way to invest safety funds. 4.1 Priority Facility Types for the Six Safety Emphasis Areas Crash trees are a graphic tool that can help identify some patterns for severe crashes based on facility types. The North Dakota crash trees were developed using severe crashes in the 2007 through 2011 crash records system (Appendix C). (Severe crashes were defined as any crash where there were one or more fatalities or incapacitating injuries.) Some observations based on the data include the following: Jurisdiction: To accomplish the goal to eliminate all traffic fatalities on North Dakota s public roads, a safety program must be comprehensive: it must address all roads susceptible to severe SEPTEMBER

21 crashes, regardless of the agency that maintains and operates the facility. Based on the North Dakota crash records, local roads account for 56 percent of severe crashes. This suggests a balanced approach between local and state facilities is needed to reduce or eliminate severe crashes on North Dakota roads. State Highways: On state highways, severe crashes were found to be overwhelmingly rural (818 crashes, or 92 percent) in their location. The severe rural crashes predominately occurred on roadway segments, as opposed to occurring at intersections. The severe segment crashes were mostly lane departure crashes (run offthe road, head on, and sideswipe opposite collisions). In addition, over 20 percent of the severe roadway segment crashes were reported in a curve. For severe rural intersection crashes, through STOP controlled was the most commonly reported intersection type when the traffic control was identified in the crash report. Local Streets and Highways: Severe crashes on local roads were split nearly equally between urban and rural locations during the study period, indicating that counties and cities are both important partners for a comprehensive safety program. Of the severe rural crashes, most occurred on county or township roads according to the crash records, but may have also occurred on federal roads (such as tribal roads). These crashes are roadway segment related (78 percent); and approximately 93 percent of the severe segment crashes are lane departure. On local facilities, approximately 26 percent of run off the road crashes occurred within a curve, but curves were not a primary factor in across centerline crashes. For severe rural intersection crashes, unsignalized was the most commonly reported intersection type when the traffic control was identified in the crash report. Of the 48 percent of local severe crashes in urban areas, most were on city streets, but may have also occurred on county facilities. Pedestrian and bicycle crashes represented a noticeable percentage (21 percent) of the severe urban local crashes an important factor that will be considered when developing safety programs for local urban systems. The remaining severe crashes are split between roadway segment and intersections. For severe intersection crashes, the same proportion of severe crashes occurred at signalized and unsignalized intersections. The crash trees and observed patterns included all severe crashes in North Dakota, regardless of crash type and contributing circumstances. However, the information in the fact sheets (Appendix A) has specific information regarding jurisdiction and location by the six safety emphasis areas. This information is detailed in the following bullets and summarized in Table 4 1: Jurisdiction: Following the overall trend for the state, severe crashes involving lane departure and unbelted vehicle occupants occurred nearly equally on state and local roads. The remaining emphasis areas, Young Drivers (67 percent), Alcohol Related (62 percent), Speeding or Aggressive Drivers (62 percent), and Intersections (70 percent), demonstrate an increasing proportion of severe crashes on local roads. For these four emphasis areas, it is important to include and address severe crashes on local roads in future safety project implementation. Location: The lowest number (44 percent) of severe intersection crashes occurred at rural locations. By contrast, more than half (56 percent) of the severe intersection crashes occurred at urban locations. This percentage includes the 52 percent of all severe intersection crashes that SEPTEMBER
22 occurred at local urban intersections which is a significantly higher number of crashes than occurred for the other safety emphasis areas. Other than urban intersections, most severe crashes occurred on rural roads; from 59 percent for Young Drivers to 81 percent for Unbelted Vehicle Occupants and 86 percent for Lane Departure. TABLE 4-1 Distribution of Severe Crashes for the Six Safety Emphasis Areas by Jurisdiction and Location Safety Emphasis Area Distribution by Jurisdiction and Location State Local Distribution by Jurisdiction Only Distribution by Location Only Rural Urban Rural Urban State Local Rural Urban Young Drivers 28% 5% 31% 36% 33% 67% 59% 41% Speeding or Aggressive Drivers 33% 5% 40% 22% 38% 62% 73% 27% Alcohol Related 35% 3% 42% 20% 38% 62% 77% 23% Unbelted Vehicle Occupants 44% 3% 37% 16% 47% 53% 81% 19% Lane Departure 46% 3% 40% 11% 49% 51% 86% 14% Intersections 26% 4% 18% 52% 30% 70% 44% 56% 4.2 Severe Crashes Involving Older Drivers and Heavy Vehicles Unlike severe crashes in the six safety emphasis areas, severe crashes involving older drivers or heavy vehicles were more frequent on state maintained facilities (Table 4 2); with 57 percent of older driver involved crashes on state highways and 81 percent of the severe crashes involving heavy vehicles. Like the six safety emphasis areas, the crashes were also primarily located in rural areas, including 91 percent of severe crashes involving heavy vehicles. Rural state facilities were identified as particularly important since these represent over half of the severe crashes in either area (52 percent for older drivers and 79 percent for heavy vehicles. TABLE 4-2 Distribution of Severe Crashes Involving Older Drivers or Heavy Vehicles Severe Crashes Involving Distribution by Jurisdiction and Location State Local Distribution by Jurisdiction Only Distribution by Location Only Rural Urban Rural Urban State Local Rural Urban Older Drivers 52% 5% 13% 30% 57% 43% 65% 35% Heavy Vehicles 79% 2% 12% 7% 81% 19% 91% 9% SEPTEMBER
23 4.3 Western North Dakota The economic growth due to oil drilling predominantly in 17 western counties has had a noticeable influence on severe crashes in those counties (Figure 4 3). In 2007, 75 percent of severe crashes were in the 36 counties with little/no oil drilling, with 25 percent of the severe crashes in the 17 oil producing counties. From 2008 to 2010, a smaller percentage of severe crashes occurred each year in the 36 counties. In 2011, severe crashes were equally split between the two regions. With the rapid economic growth and increase in severe crashes in the oil producing counties, the state intends to focus its traffic safety programs within this region. However, this focus will be balanced with the rest of the state, since approximately half of the severe crashes occurred in counties with little or no oil drilling Severe Crashes FIGURE 4-3 Severe Crashes by Counties Statewide Fatal and Serious Injury Crashes Other Counties (36) Oil Producing Counties (17) The economic growth in the oil production areas was observed to coincide with the increase in severe heavy vehicle crashes. Severe heavy vehicle crashes increased each year in the oil producing region, with 4 severe crashes in 2007 increasing to 81 severe crashes in Prior to 2010, more severe heavy vehicle crashes occurred annually in the 36 counties identified outside of the oil production area. In 2010, each region experienced 24 severe heavy vehicle crashes. In 2011, severe crashes involving heavy vehicles in the oil producing counties increased to 81 crashes, while the area outside the oil production reported 23 severe crashes. In the oil producing region, the increase observed in 2011 largely occurred on state highways, increasing from 20 severe crashes in 2010 to 64 severe crashes in In addition, severe crashes involving heavy vehicles on county and local roads increased from 4 crashes in 2010 to 17 crashes in SEPTEMBER

24 5 Local Road System Issues 5.1 Key Trends for Local Road Crashes Chapter 4 established the importance of safety improvements for local roads to eliminate traffic fatalities, since these roads account for approximately half of the severe crashes in North Dakota. However, there are just over 99,000 miles of roads under the authority of county, city, township, tribal, or federal agencies and less than 7,400 miles operated by the state highway agency. This means that local roads represent over 93 percent of all roadway miles in North Dakota. With a large roadway network, safety implementation has to be data driven and focused on the persons and locations with the greatest risk for involvement in a future severe collision. For example, over half of all severe intersection crashes in North Dakota were on the local, urban system, suggesting that intersection improvements need to be implemented in cooperation with municipalities. Severe crashes involving young drivers on local roads were nearly equally split between the urban and rural areas, inferring a balanced approach is best. Severe crashes in the remaining safety emphasis areas were more often reported on rural roads, which underscores the importance of safety improvements on local rural roads to eliminate traffic fatalities. Of the 99,000 miles of local roads, nearly 97,600 miles are rural. Approximately 7 percent of these roads are paved with the remaining 93 percent being unpaved. Of the severe crashes on the rural local road system (Table 5 1), slightly more than half in each safety emphasis area occurred on unpaved roads. Of all severe crashes on local rural roads, 49 percent were on unpaved roads. Based on these percentages, safety improvements on both paved and unpaved local rural roads are necessary to reach the traffic safety goal. However, with only 7 percent of the system paved but approximately half of the severe crashes on the paved roads, the paved roads have a higher density of severe crashes (that is, severe crashes per mile per year) compared to the unpaved roads. 5.2 Local Road Safety Programs Overall, the TSO s behavioral traffic safety program supports statewide implementation of safety strategies to reduce serious and fatal crashes on North Dakota roadways. The resource allocation and implementation of the TSO s statewide behavioral safety program include many components that support improved safety on both state and local roads, such as: Crash data improvement, problem identification, and crash analysis Law enforcement support (providing overtime enforcement grants/contracts, officer training, and recognition awards to law enforcement) High visibility enforcement for unbelted occupants, impaired, aggressive, and distracted drivers Purchase of speed and DUI enforcement and surveillance equipment, as well as alcohol monitoring devices for offenders SEPTEMBER
25 Technical assistance and resources for the prosecution and adjudication of DUI offenders Annual seat belt observation and public opinion surveys Public information outreach on seat belt use, impaired driving, speeding, and distracted driving Young driver outreach and education, and support toward school based driver education programs Traffic safety program management and evaluation In addition, when submitting its annual Highway Safety Plan outlining behavioral performance goals and supporting highway safety projects, the TSO includes certifications and assurances that the State of North Dakota complies with all applicable federal requirements. This compliance includes that at least 40 percent of all federal funds apportioned under 23 USC 402 will be expended by or for the benefit of the political subdivisions of the state to carry out local highway safety programs. Behavioral traffic safety programs that more directly target improving driver behavior on local and tribal roads include the following programs and services: Local Agency Crash Data Support The Upper Great Plains Transportation Institute develops crash data summaries for each law enforcement agency under contract with the TSO for overtime enforcement supporting impaired driving and seat belt enforcement campaigns. The crash data summaries demonstrate the priority crash factors and trends within each local agency s jurisdiction. Rural Seat Belt Observational Survey The TSO, in cooperation with Upper Great Plains Transportation Institute, conducts an annual statewide seat belt observation survey to evaluate the success of occupant protection programs and includes county level observational seat belt surveys on rural roadways. Regional DUI Task Forces DUI enforcement saturation patrols, sobriety checkpoints, and other enforcement initiatives conducted through the Regional DUI Task Force Program increases the visibility of enforcement, particularly in rural areas, during coordinated regional enforcement periods. With the required engagement of county, city, and tribal law enforcement, in cooperation with the state Highway Patrol, traffic safety is enhanced on local roads. Nearly 80 percent of city and county law enforcement agencies participate in a Regional DUI Task Force together with law enforcement from each of North Dakota s four reservations and the North Dakota Highway Patrol. Tribal Traffic Safety Outreach The TSO supports traffic safety outreach programs developed by four of North Dakota s Native American tribes (Standing Rock Sioux Tribe, Three Affiliated Tribes, Spirit Lake Nation, and Turtle Mountain Band of Chippewa) by providing resources and technical assistance to disseminate countermeasure strategy information to the reservations to increase seat belt use and deter impaired driving, distracted driving, and speeding. County Outreach Program The TSO, in cooperation with the North Dakota Association of Counties, launched its county based Traffic Safety Outreach program to provide advocacy and community mobilization, media support, public outreach, and training to address seat belt use, impaired driving, speeding, and distracted driving at the county level. County participants include law enforcement, transportation engineering, social services, public health, businesses, nonprofit agencies, faith based agencies, media, and other entities. SEPTEMBER
26 TABLE 5-1 Severe Crashes for the Six Safety Emphasis Areas by Jurisdiction, Location, and Road Surface Type Safety Emphasis Area State Jurisdiction Local Jurisdiction Rural Roads Urban Roads Rural Roads Urban Roads Paved Unpaved Paved Unpaved Paved Unpaved Paved Unpaved Overall Percent of Severe Crashes on Unpaved Roads Local Rural Percent of Severe Crashes on Unpaved Roads Young Drivers % 56% Speeding or Aggressive Drivers % 56% Alcohol Related % 51% Unbelted Vehicle Occupants % 52% Lane Departure % 56% Intersections % 28% Total % 49% SEPTEMBER

27 Regarding support given to local agencies in the areas of infrastructure, support is provided through either the HSIP or the North Dakota Local Technical Assistance Program (NDLTAP). Even though the HSIP process has been open to all agencies, local participation has been limited. One possible reason for few local agencies participating in North Dakota s safety program is a practice relating to the distribution of federal highway funds. In North Dakota, federal funds have been distributed to local agencies by formula, but if a local agency were successful in securing HSIP funds, then that amount would be deducted from their formula derived total. Consequently, this may have contributed to a low level of engagement by local agencies. Beginning in FY 2013, this funding practice has changed. Local HSIP projects will not affect the local federal fund allocation. Another possible reason for low local participation in the HSIP is lack of resources and specific safety knowledge. Assistance provided by NDLTAP to local agencies includes announcements of training opportunities, organizing local training and workshops, providing a Safety Circuit Rider that can advise local agencies, and conducting traffic safety evaluations for locations of concern. The NDLTAP also has access to crash records information for conducting safety analyses to support local agencies. Training available to counties of a safety nature include work zone safety and a web based operator course for gravel road maintenance. 5.3 Actions to Strengthen Local Road Safety The following actions are recommended to improve safety on North Dakota s local road system: 1. Enhance Regional DUI Task Forces on local roads to include seat belt enforcement. Nationally, 80 percent of impaired drivers killed are unbelted, while 82 percent of impaired drivers killed in North Dakota are unbelted. Expanding the enforcement and media outreach focus of the Regional DUI Task Forces to include unbelted occupants would strengthen belt use and improve safety on local roads. 2. Target enforcement on local roads during higher risk driving periods. Crash data analysis from 2007 through 2011 demonstrates that severe crashes occur more regularly on weekends (Friday through Sunday) and 33 percent of the fatal crashes occur from 3:00 p.m. to 9:00 p.m. 3. Focus high visibility enforcement for rural counties with most fatal and serious injury crashes. North Dakota s enforcement efforts have strong, locally based, earned media 3 components as well as paid statewide media for the core enforcement Click It or Ticket belt campaign and Drive Sober or Get Pulled Over impaired driving campaign. Focusing its highvisibility enforcement techniques (including multiple agency participation, signs, and vests, in addition to media outreach), on counties with the highest number of fatalities maximizes impact on local roads. 3 Earned media (or free media) refers to favorable publicity gained through promotional efforts other than advertising, as opposed to paid media, which refers to publicity gained through advertising. SEPTEMBER

28 4. Expand recognition of local enforcement agency participation during non grant funded enforcement. Local agencies are typically reimbursed by the grants for their overtime enforcement hours. However, by providing an opportunity for local enforcement agencies to be recognized for traffic safety enforcement during non grant funded periods, agencies are encouraged to commit on duty officers to traffic safety enforcement on local roads. 5. Promote local ordinances and tribal law to enact primary seat belt enforcement on local roads. To strengthen local support for primary seat belt enforcement and to provide a foundation for building statewide support for primary seat belt, provide communication tools and suggested language to local engineering, enforcement, public health, advocacy groups, and elected officials for the development of primary seat belt local ordinances and tribal laws. 6. Initiate a County Road Safety Planning Process for local, urban intersections and lane departure crashes on local, rural roads. Support the systemic implementation of low cost, effective safety strategies on county roads, by first developing strategic safety plans for counties. In the urban areas, the process should conduct further analysis of local, urban severe intersection crashes to determine the most common issues (for example, right angle crashes at signalized intersections, pedestrian/bicycle crashes at signalized intersections, and right angle crashes at unsignalized intersections) and the most common roadway and traffic characteristics at locations where a severe crash was reported. With this information, develop a program to assist local agencies to widely implement low cost and effective solutions at the intersections exhibiting the highest risk for a severe crash, reserving costly improvements for locations with the greatest need. For rural county roads, the planning process should focus on creating a program to systemically implement rumble strips (a lowcost and proven effective safety strategy) on paved rural roads. For locations that are identified in need of a safety investment but where rumble strips are not appropriate, other improvements (such as enhanced centerline and edge line markings, curve delineation, shoulder improvements, etc.) can be deployed. Given the inability to implement rumble strips and pavement markings on gravel roads, improvements would be focused on improved signing, especially Curve warning signs and Chevrons. 7. Remove financial barriers preventing local agency participation. Revise the safety project solicitation process to remove the barriers that limit local agency participation. This would include not reducing federal funds distributed by formula when a safety project is awarded. 8. Provide training and data to local agencies. Through the NDLTAP program, continue (or expand) services and outreach provided to local highway agencies. This may include information or training on how to develop systemic safety programs, funding for their implementation, and resources to conduct program evaluations. Incorporate any lessons learned from intersection and lane departure safety programs into services provided through the Safety Circuit Rider or traffic safety evaluations. Also continue to offer operator training for gravel road maintenance, expanding participation and evaluating if courses can include in the field training. The NDDOT SEPTEMBER
29 will also support the development of safety tracks for conferences directed towards local agencies. 9. Local community and political support. Local community and political support is critical to sustaining traffic enforcement in counties and cities and may prove necessary to implement some infrastructure improvements, such as rumble strips. The public information and media outreach conducted on the local level are the primary strategies for gaining that support. In addition, the NDDOT may consider contracting with enforcement or engineering liaisons to present to local city council and county board meetings the importance of traffic safety, provide local crash statistics, recognize community partners for their work, and thank the council/board for their support. SEPTEMBER
30 6 Safety Investment Review 6.1 Introduction Strategic highway safety plans are forward looking documents. However, a number of states have found it instructive to look back at historic safety investments and make a qualitative assessment whether those investments were consistent with the priorities established in their previous SHSP. The following sections provide a summary of this look back exercise relating to both driver behavior and infrastructure related investments. 6.2 Driver-Behavior Program Investment The NDDOT s TSO annually prepares a behavioral safety annual evaluation report a look back on program results for the previous federal fiscal year. This information, together with the identification of effective countermeasure strategies, serves to guide the annual Highway Safety Plan planning process and the resulting safety investments. The TSO invests approximately $4.5 million annually in grant and procurement funds to accomplish its traffic safety performance goals (Table 6 1). The review of the 2011 program expenditures and the 2012 Highway Safety Plan resulted in the following observations about recent behavioral traffic safety investments to improve safety in North Dakota. Percent expenditures by program area may appear lower than actual due to some of the Other program areas providing additional activities within the areas listed (such as impaired driving, occupant protection, etc.). Additionally, the apportionment of federal funds through the National Highway Traffic Safety Administration (NHTSA) impacts the investment per safety emphasis area by providing excess funds in some areas (for example, Section 410 for impaired driving prevention) and limited funding in other areas (Section 402 funds for remaining emphasis areas). TABLE 6-1 Historic North Dakota Driver-Behavior Investment Investment Area Annual Investment Percent of Expenditure Related Severe Crashes Impaired Driving $1.89 million 42% 30% Occupant Protection $0.72 million 16% 48% Motorcycle Safety $0.32 million 7% 13% Speed Management $0.13 million 3% 27% Youth/Young Drivers $0.05 million 1% 25% Distracted Driving $0.27 million 0.6% (or <1%) 11% Other $1.12 million 25% N/A Total $4.50 million 100% SEPTEMBER
 to reduce alcohol related serious injury and fatal crashes, primarily on the following program initiatives: Overtime enforcement/high visibility")
31 6.2.1 Impaired Driving Prevention The TSO spent approximately $1.8 million (42 percent of the annual budget) to reduce alcohol related serious injury and fatal crashes, primarily on the following program initiatives: Overtime enforcement/high visibility enforcement Regional DUI Task Forces Media and public information and education campaigns including Drive Sober or Get Pulled Over and Buzzed Driving is Drunk Driving national campaigns In car video camera surveillance systems for state and local law enforcement use Alcohol testing equipment including preliminary breath testing equipment, toxicology equipment, and Secure Continuous Remote Alcohol Monitoring (SCRAM) units Vehicle Occupant Protection The TSO spent approximately $0.68 million (16 percent of the annual budget) to reduce occupant protection related severe crashes, primarily on the following program initiatives: Sustained high visibility enforcement of North Dakota s occupant protection laws Sustained seat belt public outreach to the public through the placement of enforcement and non enforcement (that is, social norms) messages throughout the year Conducting annual statewide seat belt observation and county level observational seat belt surveys on rural roads to evaluate the success of occupant protection programs Administering the Child Passenger Safety program Motorcycle Safety To decrease motorcycle fatalities, the TSO invests approximately $0.29 million (7 percent of the annual budget) in the following: Statewide North Dakota Motorcycle Safety Program (NDMSP) for motorcycle rider training Conducting motorcycle safety public outreach and implementing Share the Road campaigns Speed Management The TSO spent approximately $0.12 million (3 percent of the annual budget) to provide resources to law enforcement to facilitate speed enforcement and reduce speed related serious injury crashes, primarily on the following initiatives: Technical assistance, resources, and equipment such as radar and lidar units to support speed enforcement High visibility speed enforcement including speed enforcement as a trigger violation to seat belt and impaired driving violations during Click It or Ticket and Drive Sober or Get Pulled Over enforcement campaigns SEPTEMBER
 in the following: North Dakota Driver Risk Prevention Curriculum instructor technical assistance and resource support Teen peer directed, traffic safety")
32 6.2.5 Youth/Young Drivers To improve teen driver and occupant behaviors to reduce teen involved serious injury crashes, the TSO invests approximately $0.04 million (1 percent of the annual budget) in the following: North Dakota Driver Risk Prevention Curriculum instructor technical assistance and resource support Teen peer directed, traffic safety media, education, and outreach Young Individuals Establishing Logical Driving Decisions (YIELDD) for first time juvenile offenders Driving Skills for Life program Distracted Driving The TSO invests approximately $0.26 million (11 percent of the annual budget) to promote distracted driving awareness through media outreach and informational materials Additional Safety Programs The TSO invests approximately $1.25 million (25 percent of the annual budget) in other behavioral safety program initiatives, including: Planning and Administration To provide program management to plan, develop, implement, monitor, and evaluate the annual statewide Highway Safety Program. Emergency Medical Services and Trauma To support the management of the EMS system data including the North Dakota Trauma Registry and the Statewide Online Ambulance Reporting (SOAR) system. Police Traffic Services To provide training, technical assistance, and resources to law enforcement to improve the enforcement, prosecution, and adjudication of traffic offenses. Community Traffic Safety Projects To provide statewide outreach to influence driver s safety attitudes, perceptions, and behaviors primarily through media programs and outreach programs to counties and tribes. Traffic Records To improve the accuracy, timeliness, completeness, uniformity, accessibility, and integration of traffic records data and systems including producing North Dakota s Crash Summary; installing the software and training to convert law enforcement to electronic crash reporting (using TraCS); convening the Traffic Records Coordination Committee (TRCC); and advancing the Model Minimum Uniform Crash Criteria (MMUCC) data elements. SEPTEMBER
33 6.3 Infrastructure Investment NDDOT s Office of Transportation Programs annually prepares a progress and evaluation report for the HSIP. A review of these reports for FY 2011 and FY 2012 indicates that NDDOT obligated nearly $6 million annually in HSIP funds for highway safety improvement projects (Table 6 2). In addition, approximately 95 percent of the spending was for projects located in rural areas in North Dakota and 98 percent of the spending was for projects deployed along the state s system of highways. A further review of these annual reports results in the following observations about recent HSIP spending. TABLE 6-2 Historic North Dakota Infrastructure Investment Investment Area Fiscal Year 2011 Investment Fiscal Year 2012 Total Percent of Expenditure Related Severe Crashes Intersections $4.07 million $5.90 million $9.97 million 86% 23% Turn Lanes, Sight Distance, etc. $3.02 million $5.90 million Pedestrian and Bicycle Improvements $1.05 million Lane Departure $1.41 million $0.28 million $1.69 million 14% 42% Edge Improvements and Enhanced Curve Delineation $1.27 million $0.06 million Miscellaneous $0.14 million $0.22 million Total Obligational Authority Used $5.48 million $6.18 million $11.66 million Intersections As shown in Table 6 2, approximately $5 million of HSIP funds have been invested annually in intersection safety projects, including; turning lanes, sight distance and pedestrian/bicycle improvements. This level of investment represents approximately 86 percent of HSIP expenditures Lane Departure As shown in Table 6 2, approximately $0.84 million of HSIP funds have been invested annually in lanedeparture related safety projects. These projects primarily involved edge line and centerline rumble strips, enhanced edge lines, and curve delineation along state highways. This level of investment represents approximately 14 percent of HSIP expenditures. 6.4 Conclusions The review of historic safety investments for both driver behavior and infrastructure found that most of the spending was directed at the emphasis areas that are considered a priority for North Dakota. However, the level of investment in some specific areas appears to be out of balance with the distribution of severe crashes. For example, 1 percent of the driver behavior related investments were directed at young drivers but young drivers were involved in 25 percent of severe crashes. Similarly, 14 percent of HSIP investments were directed at lane departure safety projects but lane departure crashes accounted for 42 percent of all severe crashes. As a result, the NDDOT will review the safety programs related to driver behavior and infrastructure, identify what reasons may exist for the unbalance (such as, that the past HSIP process was primarily site analysis driven, which directed projects to intersections where the strategies are inherently more expensive than lane departure strategies), and SEPTEMBER
34 investigate opportunities to bring safety spending more in line with the actual distribution of severe crashes. Again, percent expenditures by program area may appear lower than actual because some of the Other program areas providing additional activities within the areas listed (such as impaired driving, occupant protection, etc.). Additionally, the apportionment of federal funds through the NHTSA impacts the investment per safety emphasis area by providing excess funds in some areas (for example, Section 410 for impaired driving prevention) and limited funding in other areas (Section 402 funds for the remaining safety emphasis areas). SEPTEMBER
35 7 Implementation Since the publication of North Dakota s last Strategic Highway Safety Plan in 2006, the state made substantial efforts to reduce the number of fatal and severe injury crashes along the state s roadways. In the area of driver behavior, efforts have been primarily focused on high visibility enforcement relating to impaired driving, occupant protection, speeding, and improving the accuracy of the crash database. During this same period, the NDDOT obligated approximately 85 percent of the available HSIP funds to upgrading intersections and road edges along state highways in rural areas. It should also be noted that even though the application process for HSIP funds is open to all agencies in North Dakota, more than 95 percent of these funds supported implementation of projects along state highways. However, a review of historic trends indicates that in spite of these efforts, the annual number of fatal plus severe injury crashes has increased. Further review of the data indicates that this overall upward trend is primarily due to a substantial increase in severe crashes in the 17 oil producing counties. Moving forward, North Dakota s goal is to eliminate all traffic fatalities on North Dakota s public roads with an intermediate goal of reducing the 3 year average of traffic fatalities to 100 or fewer by 2020 (a reduction of approximately 3 percent per year). North Dakota also acknowledges that the development of this data driven SHSP and adopting crash reduction goals is only the first step plans do not save lives, implementation does. To reverse the current trend and achieve the crash reduction goal, North Dakota commits to a comprehensive statewide highway safety program with implementation of high priority safety strategies along roadway systems and facilities defined to be at risk. The basic components of this comprehensive program are implementing a driver behavior program, implementing infrastructure improvements, improving emergency response, and improving reporting of crashes. 7.1 Driver-Behavior Program Implementation The implementation of driver behavior related priority safety strategies seeks to provide safety benefits across the state. However, with the increase in severe crashes in the 17 oil producing counties, special consideration will be given to deploy priority safety strategies in these high risk counties as well as rural communities across the state. Unbelted Vehicle Occupants: Reducing unbelted severe injury crashes is North Dakota s greatest opportunity to strengthen road safety through improving driver behavior. With the increasing trend of severe unbelted crashes accounting for approximately 48 percent all severe crashes, and over 80 percent of these crashes occurring in rural areas of the state, coupled with a more recent decline in motorists observed seat belt use, the following are key safety commitments: Enact primary seat belt legislation that includes primary enforcement of belt use for all passengers in all seating positions. Strengthen penalties for lack of seat belt use. Shift resources to support highly visible seat belt enforcement campaigns particularly in rural areas. Consider combined enforcement programs where more than one safety emphasis area is enforced during a campaign period (for example, speeding, seat belt use, and impaired driving). Combined enforcement will stretch resources for overtime enforcement programs to allow enforcement of additional safety emphasis areas (such as speeding, youth/gdl, etc). SEPTEMBER

36 Alcohol Related: The growing trend of alcohol related severe crashes accounts for approximately 30 percent of all severe crashes in North Dakota 77 percent of these in rural communities and 62 percent on local roadways. In response to this trend, North Dakota has progressively increased its annual driver behavioral investments to address alcohol related severe injury crashes. With this increased investment of resources to combat impaired driving coupled with the increasing crash trend, North Dakota commits to examining new approaches through the following key safety commitments: Conduct a comprehensive assessment of impaired driving laws to strengthen administrative license sanctions and criminal penalties against best practices and recommend impaired driving policy changes. Included in this assessment will be an examination of the following key elements: - Extend/strengthen administrative license suspension for DUI offenders, including first time offenders. - Expand and implement a mandatory ignition interlock program requiring ignition interlocks as a condition for license reinstatement. - Remove the option of BAC test refusal or establish stronger penalties for BAC test refusal than for test failure. - Impose increased penalties for a 0.15 BAC and higher Strengthen impaired driving detection and public perceived risk of arrest in rural communities and on local roads by expanding the use of sobriety checkpoints during high visibility saturation patrols to combat impaired driving. Apply holistic or ecological approaches (via persons, families, cultures, communities, and policies) to create a cultural awareness of risk and to educate the motoring public during highvisibility enforcement campaigns. Conduct highly publicized compliance checks and training for alcohol retailers and merchants to reduce sales to underage persons. Conduct public outreach on accessible safe ride alternative transportation services during highvisibility enforcement campaigns. Speeding and Aggressive Driving: Speeding and aggressive driving continue to account for approximately 27 percent of all severe injury crashes in North Dakota with no significant crash trend improvements. In addition, 73 percent of speed related serious injury crashes occur in rural areas and 62 percent on local roads. Commitments to combat this ongoing, culturally accepted, high risk driving behavior include the following: Enact/support legislation to strengthen penalties such as increased fines for right of way and speeding violations. Address the perception of widespread speeding by heavy vehicles by first conducting a statewide assessment of commercial vehicle speeds. In response to the assessment results, examine enforcement, safety education, and public outreach safety strategies for priority regions or corridors identified as needing improvement. SEPTEMBER
Toward Zero Deaths. Regional SHSP Road Show Meeting. Virginia Strategic Highway Safety Plan. presented by
 Toward Zero Deaths Regional SHSP Road Show Meeting presented by Virginia Strategic Highway Safety Plan December 1, 2016 1 Welcome & Introductions Purpose of the Meeting Objectives & Key Outcomes Agenda»
Dear Fellow Nebraskans:
 Dear Fellow Nebraskans: In accordance with the provisions in the Safe, Accountable, Flexible, and Efficient Transportation Equity Act A Legacy for Users (SAFETEA LU), each state is required to develop
South Dakota Strategic Highway Safety Plan
 South Dakota Strategic Highway Safety Plan Lead Agency: South Dakota Department of Transportation February 2014 Contents Section Page Acronyms... iv Definitions... v Acknowledgements... vi Executive Summary...
Lessons Learned from the Minnesota County Road Safety Plans. Richard Storm CH2M HILL
 Lessons Learned from the Minnesota County Road Safety Plans Richard Storm CH2M HILL May 21, 2014 Overview of the MN CRSP: Why Prepare Safety Plans for Local Systems? MAP-21: Requires states to address
November 2, Government takes on the challenge of improving traffic safety
 November 2, 2006 Government takes on the challenge of improving traffic safety Edmonton... The Alberta government has taken on the challenge of improving traffic safety by moving ahead with a comprehensive,
Olmsted County Highway Safety Plan
 TB072009008MKE Olmsted County Highway Safety Plan September 2009 Submitted to: Table of Contents 1. Introduction...1-1 2. Comprehensive Crash Analysis...2-1 3. Safety Emphasis Areas...3-1 4. Safety Strategies...4-1
Toward Zero Deaths: Proactive Steps for Your Community
 Est. Dec. 2014 Toward Zero Deaths: Proactive Steps for Your Community Presented by: Brian Roberts, P.E., National Association of County Engineers Marie Walsh, Ph.D., Louisiana Local Technical Assistance
Minnesota Strategic Highway Safety Plan
 Minnesota Strategic Highway Safety Plan Executive Summary Minnesota s comprehensive and strategic safety planning process began in 2004, involved a cross-section of state, local and private safety partners
PRELIMINARY DRAFT FIRST AMENDMENT TO VISION 2050: A REGIONAL LAND USE AND TRANSPORTATION PLAN FOR SOUTHEASTERN WISCONSIN
 PRELIMINARY DRAFT FIRST AMENDMENT TO VISION 2050: A REGIONAL LAND USE AND TRANSPORTATION PLAN FOR SOUTHEASTERN WISCONSIN ESTABLISHING TARGETS FOR FEDERAL PERFORMANCE MEASURES: HIGHWAY SAFETY SOUTHEASTERN
INTERSECTION CRASH COUNTERMEASURES
 INTERSECTION CRASH COUNTERMEASURES ALL SEVERE INTERSECTION (include gap CRASHES High Friction Surface Treatment - Intersection Markings - advanced acceptance and intersection approaches to intersections
A Strategic Highway Safety Plan. a coordinated and informed approach to reducing highway fatalities and serious injuries on all public roads.
 Introduction A Strategic Highway Safety Plan is a coordinated and informed approach to reducing highway fatalities and serious injuries on all public roads. A Strategic Highway Safety Plan is Based on
Occ c u c pa p n a t pro r t O ec e t c i t O i n
 Occupant Protection Occupant Protection Introduction Buckling up or being buckled in is the most effective protection during a car crash. The simple truth is that the great majority of people ejected from
CDRT. Child Death Review Team Dallas County. Brief Report Traffic-related Child Deaths OVERVIEW
 Dallas County CDRT Child Death Review Team 2013 Brief Report Traffic-related Child Deaths 2006-2011 OVERVIEW In Dallas County, traffic-related injury death rates among children are typically less than
We believe the following comments and suggestions can help the department meet those goals.
 The Honorable Secretary Anthony Foxx The Secretary of Transportation United States Department of Transportation 1200 New Jersey Avenue, SE Washington, DC 20590 August 30, 2013 Dear Secretary Foxx, Thank
HSIP Project Selection Criteria
 HSIP Project Selection Criteria The purpose of the Highway Safety Improvement Program (HSIP) is to reduce the number of fatal and injury crashes by targeting high crash locations and causes. Projects,
TEXAS TRAFFIC SAFETY TASK FORCE. Jeff Moseley Texas Transportation Commission
 TEXAS TRAFFIC SAFETY TASK FORCE Jeff Moseley Texas Transportation Commission June 7, 2016 Fatalities and fatal crashes 2010 2015 4,000 3,500 3,417 3,407 3,536 3,533 3,000 3,061 3,067 2,782 2,803 3,037
South Carolina s Strategic Highway Safety Plan
 Target Zero South Carolina s Strategic Highway Safety Plan 215-218 March 4, 215 Dear Highway Safety Partner: The South Carolina Department of Public Safety (SCDPS) and the South Carolina Department of
PALM BEACH COUNTY LOCAL ROAD SAFETY PLAN
 PALM BEACH COUNTY LOCAL ROAD SAFETY PLAN JANUARY 2019 Street View Images Google 2018 Notice This document is disseminated under the sponsorship of the U.S. Department of Transportation in the interest
Department of Transportation
 Department of Transportation I. Internal Scan The number of older drivers in the United States will double over the next 30 years. By 2030 one in five Americans will be age 65 or older. On a licensed-driver
POLICY AGENDA For Elder Pedestrian Safety
 POLICY AGENDA For Elder Pedestrian Safety Older adults and people with disabilities often have mobility, cognitive, and sensory limitations that affect their behavior as pedestrians and place them at risk
Systemic Safety. Doug Bish Traffic Services Engineer Oregon Department of Transportation March 2016
 Systemic Safety Doug Bish Traffic Services Engineer Oregon Department of Transportation March 2016 Oregon averages 1700 fatal and serious injury crashes each year. Some of the more common crash types include:
Closing Plenary Session
 TRAFFIC SAFETY CONFERENCE Closing Plenary Session June 9, 2017 Las Colinas, TX Order of Report Out June 9, 2017 Las Colinas, TX Distracted Driving Prioritized Countermeasures Countermeasure 4a Systemically
FLORIDA TRANSPORTATION COMMISSION HIGHWAY SAFETY REPORT CALENDAR YEAR 2008
 FLORIDA TRANSPORTATION COMMISSION HIGHWAY SAFETY REPORT CALENDAR YEAR 2008 January 15, 2010 HIGHWAY SAFETY REPORT FOR CALENDAR YEAR 2008 January 15, 2010 2 TABLE OF CONTENTS INTRODUCTION 5 STRATEGIC HIGHWAY
The Florida Bicycle and Pedestrian Partnership Council
 The Florida Bicycle and Pedestrian Partnership Council Input to the Update of the Florida Transportation Plan March 2015 This document presents input from the Florida Bicycle and Pedestrian Advisory Council
Mission: The mission of FARS is to make vehicle crash information accessible and useful so that traffic safety can be improved
 Mission: The mission of FARS is to make vehicle crash information accessible and useful so that traffic safety can be improved NHTSA created FARS in 1975 National Center for Statistics and Analysis (NCSA)
Speed Management Action Plan
 Speed Management Action Plan National Selection Criteria Criteria Description Fatalities The number of fatalities resulting from speeding-related crashes. Percentage Compares total fatalities in each State
Engineering Countermeasures for Transportation Safety. Adam Larsen Safety Engineer Federal Highway Administration
 Engineering Countermeasures for Transportation Safety Adam Larsen Safety Engineer Federal Highway Administration 360-619-7751 Adam.Larsen@DOT.GOV Countermeasure Selection Resources Manual for Selecting
FLORIDA STRATEGIC HIGHWAY SAFETY PLAN
 FLORIDA STRATEGIC HIGHWAY SAFETY PLAN 1 FLORIDA STRATEGIC HIGHWAY SAFETY PLAN Presenter: Joe Santos State Safety Engineer FDOT State Safety Office 2 Presentation 3/28/2017 3 FLORIDA STRATEGIC HIGHWAY SAFETY
Kansas Department of Transportation Strategic Highway Safety Plan. Intersections
 Kansas Department of Transportation Strategic Highway Safety Plan Intersections Introduction The Federal Highway Administration (FHWA) defines an intersection as a planned point of conflict in the roadway
CITY OF LOS ANGELES INTER-DEPARTMENTAL MEMORANDUM
 CITY OF LOS ANGELES INTER-DEPARTMENTAL MEMORANDUM Date: December 12,2011 To: Honorable City Council c/o City Clerk, Room 395, City Hall Attention: Honorable Bill Rosendahl, Chair, Transportation Committee
Figure 1. Indiana fatal collisions by young driver involvement,
 INDIANA TRAFFIC SAFETY FACTS YOUNG DRIVERS 2016 MAY 2017 ISSUE 17-C06 IN 2016: In 2016, 13.4 percent of all drivers involved in Indiana collisions were young drivers. Young drivers were involved in 105
North Dakota Department of Transportation
 North Dakota Department of Transportation Keith Magnusson Deputy Deputy Director for Driver and Vehicle Services Safe Ways Great Ways Promoting Economic Growth Partners American Association of Motor Vehicle
Local Road Safety Plans
 An Introduction to Local Road Safety Plans June 21, 2018 Today s Presenter Jerry Roche, P.E. Safety Analysis Program Manager FHWA Office of Safety Ames, IA 2 NACE Do-It-Yourself LRSP Pilot Six states,
17 th Annual Northwest Tribal Transportation Symposium April 21, 2010 Northwest Region Division of Transportation Bureau of Indian Affairs
 17 th Annual Northwest Tribal Transportation Symposium April 21, 2010 Northwest Region Division of Transportation Bureau of Indian Affairs Strategic t Highway Safety Plan for Indian Lands (SHSP) Washington
DRIVING ZERO FATALITIES TO A REALITY ILLINOIS LOCAL SAFETY INITIATIVE
 DRIVING ZERO FATALITIES TO A REALITY ILLINOIS LOCAL SAFETY INITIATIVE Priscilla Tobias, PE State Safety Engineer Illinois Dept of Transportation Illinois Stats 102 Counties 145,000 Roadway Miles 900+ Fatalities
What Engineering Can Do for You! Low Cost Countermeasures for Transportation Safety
 What Engineering Can Do for You! Low Cost Countermeasures for Transportation Safety Adam Larsen Safety Engineer Federal Highway Administration 360-619-7751 Adam.Larsen@DOT.GOV Adam Larsen TTP Safety Engineer
Institute of Transportation Engineers Safety Action Plan
 I Institute of Transportation Engineers Safety Action Plan 1. Introduction 2. Intersection Crashes 3. Keep Vehicles on the Road 4. Minimize Consequences When Vehicles Leave the Road 5. School Crossing
Engineering Your Community Safe
 Engineering Your Community Safe Andi Bill Transportation Information Center thanks its partners for their support and assistance National Traffic Safety Goal Reasonable goal? Who s Involved? What can you
SAFETY PERFORMANCE MEASURES AND TARGET SETTING. Transportation Subcommittee September 15, 2017
 SAFETY PERFORMANCE MEASURES AND TARGET SETTING Transportation Subcommittee September 15, 2017 ACTION REQUESTED No action is requested. This item is for presentation and discussion. PREVIOUS ACTION Presented
Street Smart - Regional Pedestrian Safety Campaign. Hopkins Grand Rounds July 16, 2014
 Street Smart - Regional Pedestrian Safety Campaign Hopkins Grand Rounds July 16, 2014 Baltimore Metropolitan Council (BMC) Who We Are The organization of the Baltimore region s elected executives, representing
An Overview of Traffic Records. April 15, 2016 John Riemer
 An Overview of Traffic Records April 15, 2016 John Riemer What is traffic records? The traffic records office is required by state statue to maintain a database of motor vehicle crashes that occur on all
Final Report for the Minnesota County Roadway Safety Plans. Prepared for
 Final Report for the Minnesota County Roadway Safety Plans Prepared for January 2014 Contents Acronyms... ii Introduction / Overview... 1-1 Crash Data Analysis and Safety Emphasis Areas... 2-1 Safety Strategies...
BIKE PLAN CONTENTS GATEWAY
 CONTENTS Acknowledgments...vii Great Rivers Greenway District Board of Directors... vii Great Rivers Greenway District Staff... vii Project Consultants... vii Committees... viii Citizens Advisory Committee
APPENDIX G Lane Departure Action Plan
 APPENDIX G Introduction Lane Departure is one of nine emphasis areas of the North Carolina Strategic Highway Safety Plan. This emphasis area targets the following crashes: Ran Off Road Left Ran Off Road
Canadian Association of Chiefs of Police Association canadienne des chefs de police
 WHAT S IN THE KIT? Media Advisory Template To be used to invite the media to an event during Operation Impact. We suggest you reproduce this on your own police agency letterhead. News Release Template
CENTRAL ARIZONA GOVERNMENTS STRATEGIC TRANSPORTATION SAFETY PLAN FINAL REPORT
 CENTRAL ARIZONA GOVERNMENTS STRATEGIC TRANSPORTATION SAFETY PLAN FINAL REPORT JANUARY 2017 ENGINEERING ENFORCEMENT EDUCATION EMERGENCY RESPONSE This Report is subject to the provisions of 23 USC 409. Any
Toolbox of Countermeasures and Their Potential Effectiveness to Make Intersections Safer
 8 Toolbox of Countermeasures and Their to Make Intersections Safer Introduction Studies included in the NCHRP 17-18 (3), Guidance for Implementation of the AASHTO Strategic Highway Safety Plan, as well
Chapter 2. Bellingham Bicycle Master Plan Chapter 2: Policies and Actions
 Chapter 2 Bellingham Bicycle Master Plan Chapter 2: Policies and Actions Chapter 2: Policies and Actions The Bicycle Master Plan provides a road map for making bicycling in Bellingham a viable transportation
AMATS Complete Streets Policy
 AMATS Complete Streets Policy Table of Contents: Section 1. Definition of Complete Streets Section 2. Principles of Complete Streets Section 3. Complete Streets Policy Section 4. Consistency Section 5.
CERS Research and Outreach Activities. Keith Knapp, PE Center for Excellence in Rural Safety Annual Transportation Research Conference April 28, 2010
 CERS Research and Outreach Activities Keith Knapp, PE Center for Excellence in Rural Safety Annual Transportation Research Conference April 28, 2010 PRESENTATION CONTENT! Review Some Rural Crash Statistics!
TOWARD ZERO DEATHS: A NATIONAL STRATEGY ON HIGHWAY SAFETY
 TOWARD ZERO DEATHS: A NATIONAL STRATEGY ON HIGHWAY SAFETY June 2014 Dear Highway Safety Stakeholder: As associations that represent government agencies with a professional role in highway safety, we are
City of San Diego Vision Zero Draft Strategic Plan FY 2017
 City of San Diego Vision Zero Draft Strategic Plan FY 2017 Engineering Objective: To develop and implement a strategy that employs best planning, design and engineering practices. Background: Over the
Pedestrian Crosswalk Audit
 1200, Scotia Place, Tower 1 10060 Jasper Avenue Edmonton, Alberta T5J 3R8 edmonton.ca/auditor Pedestrian Crosswalk Audit June 19, 2017 The conducted this project in accordance with the International Standards
Reducing Fatalities and Serious Injuries on County Roads
 Reducing Fatalities and Serious Injuries on County Roads Brian C. Roberts, P.E. Executive Director National Association of County Engineers Washington, DC Housekeeping Please silence all mobile devices.
Florida Strategic Highway Safety Plan October
 Florida Transportation Plan Policy Element December 2015 The Florida Transportation Plan (FTP) is the single overarching statewide plan guiding Florida s transportation future. It is a plan for all of
Proposed. City of Grand Junction Complete Streets Policy. Exhibit 10
 Proposed City of Grand Junction Complete Streets Policy Exhibit 10 1 City of Grand Junction Complete Streets Policy Vision: The Complete Streets Vision is to develop a safe, efficient, and reliable travel
KANSAS STRATEGIC HIGHWAY SAFETY PLAN (SHSP) The stakeholder group identified the following direction for the SHSP:
 The stakeholder group identified the following direction for the SHSP:") KANSAS STRATEGIC HIGHWAY SAFETY PLAN (SHSP) Executive Summary On February 2-3, 2006, the Kansas Department of Transportation hosted a safety summit to initiate the development of the Kansas Strategic Highway
KANSAS STRATEGIC HIGHWAY SAFETY PLAN (SHSP) Executive Summary On February 2-3, 2006, the Kansas Department of Transportation hosted a safety summit to initiate the development of the Kansas Strategic Highway
NYC Pedestrian Safety Study & Action Plan. NYTMC Brown Bag Lunch Presentation December 15, 2010
 NYC Pedestrian Safety Study & Action Plan NYTMC Brown Bag Lunch Presentation December 15, 2010 1 Introduction DOT Safety Goal Strategic Plan: Reduce Fatalities by 50% by 2030 From 274 (2007) to 137 (2030)
Highway Safety Improvement
 Highway Safety Improvement Tracy Turpin, PE. Highway Safety Improvement Program Manager Virginia Department of Transportation Presented at Chesapeake and Virginia Chapters of ATSSA Meeting October 13 th,2016
What is the problem? Transportation Safety Planning Purdue Road School. 42,636 Fatalities. Nearly 3M Injuries. Over 4M PDO crashes
 Transportation Safety Planning Purdue Road School March 29, 2006 What is the problem? 42,636 Fatalities Nearly 3M Injuries Over 4M PDO crashes $230B Cost to the Nation Trends in Motor Vehicle Fatality
Safety Data Resources. Multi-Discipline Safety Planning Forum March 10 & 11, 2008 Gateway Center
 Safety Data Resources Multi-Discipline Safety Planning Forum March 10 & 11, 2008 Gateway Center Tom McDonald, PE Safety Circuit Rider Iowa LTAP Jack Latterell,, PE Safety Consultant FHWA Safety Engineer,
New York State Department of Transportation
 New York State Department of Transportation David A. Paterson, Governor Stanley Gee, Acting Commissioner New York State 2010 Strategic Highway Safety Plan TABLE OF CONTENTS Page VISION... 1 GOALS...
Safety at Unsignalized Intersections. Unsignalized Intersections
 Safety at FHWA Safety Focus Areas 2 National Statistics 3 National Statistics There were 41,059 highway fatalities in 2007. Where did they occur? Non-Intersections 79% About half of all crashes and half
VISION ZERO ACTION PLAN
 PALM BEACH Transportation Planning Agency VISION ZERO ACTION PLAN TPA Advisory Committee Meetings March 2019 PURPOSE Present the Data Analysis Key Findings and the Action Items from the Draft Action Plan
THE FUTURE OF THE TxDOT ROADWAY DESIGN MANUAL
 THE FUTURE OF THE TXDOT ROADWAY DESIGN MANUAL Kenneth Mora, P.E. (Design Division) 10/10/2017 Table of contents 1 2 Reduction in FHWA design controlling criteria Innovative Intersection Guidance 3-7 8-42
EVERY MOVE YOU MAKE. everymove.ohio.gov OHIO STRATEGIC HIGHWAY SAFETY PLAN
 EVERY MOVE YOU MAKE everymove.ohio.gov OHIO STRATEGIC HIGHWAY SAFETY PLAN A Comprehensive Plan to Reduce Fatalities and Serious Injuries 2014-2019 TABLE OF CONTENTS 1 Partner Pledge 2 Thank You to Our
BIA INDIAN HIGHWAY SAFETY PROGRAM FY2016 LAW ENFORCEMENT GRANT. SECTION A: General Information. This section must be completed for all applicants.
 SECTION A: General Information. This section must be completed for all applicants. Name of Tribe: Click here to enter text. Address : Click here to enter text. City: Click here to enter text. State: Click
BIA INDIAN HIGHWAY SAFETY PROGRAM FY2016 LAW ENFORCEMENT OVERTIME GRANT
 SECTION A: General Information. This section must be completed for all applicants. Name of Tribe: Click here to enter text. Address : Click here to enter text. City: Click here to enter text. State: Click
City of Elizabeth City Neighborhood Traffic Calming Policy and Guidelines
 City of Elizabeth City Neighborhood Traffic Calming Policy and Guidelines I. Purpose: The City of Elizabeth City is committed to ensure the overall safety and livability of residential neighborhoods. One
Texas Intersection Safety Implementation Plan Workshop JUNE 2, 2016
 Texas Intersection Safety Implementation Plan Workshop JUNE 2, 2016 Why Intersection Safety? A small part of overall highway system, but Each year roughly 50% of all crashes estimated 3 million involve
ADOT Statewide Bicycle and Pedestrian Program Summary of Phase IV Activities APPENDIX B PEDESTRIAN DEMAND INDEX
 ADOT Statewide Bicycle and Pedestrian Program Summary of Activities APPENDIX B PEDESTRIAN DEMAND INDEX May 24, 2009 Pedestrian Demand Index for State Highway Facilities Revised: May 29, 2007 Introduction
Transportation and Health Tool
 Working together to evolve the Transportation and Health Tool APHA Webinar March 22, 2016 Ann Steedly, PE Overview THT Development Context Development of Indicators Strategies, Interventions & Policies
Vision Zero Richmond Action Plan
 Vision Zero Richmond Action Plan COVER Acknowledgements This Vision Zero Action Plan was prepared by the Safe and Healthy Streets Commission and with numerous partners committed to safety in Richmond,
Access Location, Spacing, Turn Lanes, and Medians
 Design Manual Chapter 5 - Roadway Design 5L - Access Management 5L-3 Access Location, Spacing, Turn Lanes, and Medians This section addresses access location, spacing, turn lane and median needs, including
2003 road trauma for. Wairoa District. Road casualties Estimated social cost of crashes* Major road safety issues WAIROA DISTRICT JULY 2004
 WAIROA DISTRICT JULY 24 T he Land Transport Safety Authority (LTSA) has prepared this road safety issues report. It is based on reported crash data and trends for the 1999 23 period. The intent of the
RSTF Measurements and Status
 RSTF Measurements and Status Items in green text are on or ahead of target. Items in red text need attention. Objective & Measures Status November, 2011 Winter, 3/8/12 Build, Maintain, & Leverage Partnerships
Where Did the Road Go? The Straight and Narrow about Curves
 Where Did the Road Go? The Straight and Narrow about Curves Renae Kuehl, SRF Consulting Group October 23, 2018 What is a County Roadway Safety Plan or CRSP?" CRSP Identifies priority location-specific
ACTIVE TRANSPORTATION
 ACTIVE TRANSPORTATION Mobility 2040 Supported Goals Improve the availability of transportation options for people and goods. Support travel efficiency measures and system enhancements targeted at congestion
9:45-10:30 Understanding the Problem Overview of 15 Critical Strategies (from the CHSP, SHSP) Specific Strategies for Engineers
 Specific Strategies for Engineers") Course Agenda 8:30-9:00 Sign-in 9:00-9:45 Introducing the Issues Course Objective Present the need for safety Initiatives 9:45-10:30 Understanding the Problem Overview of 15 Critical Strategies (from the
Course Agenda 8:30-9:00 Sign-in 9:00-9:45 Introducing the Issues Course Objective Present the need for safety Initiatives 9:45-10:30 Understanding the Problem Overview of 15 Critical Strategies (from the
Minnesota Comprehensive Highway Safety Plan
 The Minnesota Comprehensive Highway Safety Plan (CHSP) was created in a coordinated effort between the Minnesota Departments of Transportation and Public Safety to reduce the number of traffic fatalities
Durham Vision Zero: Strategic Road Safety Action Plan
 If you require this document in an accessible format, please contact 905-666-8116 ext. 4733 September 11, 2017 Workshop #1 Durham Vision Zero: Strategic Road Safety Action Plan Introduction Region of Durham
Developing a Local Road Safety Plan. April 9, 2017 Presented by: Nicole Waldheim, Danena Gaines, and Hillary Isebrands
 Developing a Local Road Safety Plan April 9, 2017 Presented by: Nicole Waldheim, Danena Gaines, and Hillary Isebrands Goal of this Workshop Familiarize county and local practitioners with different types
Cycling and risk. Cycle facilities and risk management
 Cycling and risk Cycle facilities and risk management Failure to recognize possibilities is the most dangerous and common mistake one can make. Mae Jemison, astronaut 6/11/2010 York Regional Council Cycling
Designing for Pedestrians: An Engineering Symposium. Rutgers University March 21, 2013
 Designing for Pedestrians: An Engineering Symposium Rutgers University March 21, 2013 The Problem 2 Pedestrian Fatalities Pedestrian Fatalities by Year in US (1994-2010) 6000 5000 4000 3000 2000 1000 0
Chapter 5 DATA COLLECTION FOR TRANSPORTATION SAFETY STUDIES
 Chapter 5 DATA COLLECTION FOR TRANSPORTATION SAFETY STUDIES 5.1 PURPOSE (1) The purpose of the Traffic Safety Studies chapter is to provide guidance on the data collection requirements for conducting a
Evolving Roadway Design Policies for Walking and Bicycling
 Evolving Roadway Design Policies for Walking and Bicycling The 2016 Michigan Transportation Planning Conference Kalamazoo, MI July 13, 2016 Title 23 of the Code of Federal Regulations Title 23 was originally
SURFACE TRANSPORTATION SAFETY & INVESTMENT UPDATE ON PROGRESS SINCE 2000
 SURFACE TRANSPORTATION SAFETY & INVESTMENT UPDATE ON PROGRESS SINCE 2000 Requested by: American Association of State Highway and Transportation Officials (AASHTO) Prepared by: Timothy Neuman, P.E. CH2M
Acknowledgements. Mr. David Nicol 3/23/2012. Daniel Camacho, P.E. Highway Engineer Federal Highway Administration Puerto Rico Division
 Daniel Camacho, P.E. Highway Engineer Federal Highway Administration Puerto Rico Division Acknowledgements Mr. David Nicol Director, FHWA Office of Safety FHWA Office of Safety http://safety.fhwa.dot.gov/provencountermeasures/
Lane Departure. Key Facts
 Crash Certain types of vehicle crashes are more dangerous to drivers and other road users. The data show that crashes that involve lane departure and intersections are particularly perilous. Meanwhile,
City of Novi Non-Motorized Master Plan 2011 Executive Summary
 City of Novi Non-Motorized Master Plan 2011 Executive Summary Prepared by: February 28, 2011 Why Plan? Encouraging healthy, active lifestyles through pathway and sidewalk connectivity has been a focus
BIA INDIAN HIGHWAY SAFETY PROGRAM FY2016 TRAFFIC RECORDS GRANT. SECTION A: General Information. This section must be completed for all applicants.
 SECTION A: General Information. This section must be completed for all applicants. Name of Tribe: Click here to enter text. Address : Click here to enter text. City: Click here to enter text. State: Click
VISION ZERO: ELIMINATING TRAFFIC DEATHS BY 2024 MARCH 2015
 Through Vision Zero SF we commit to working together to prioritize street safety and eliminate traffic deaths in San Francisco by 2024 VISION ZERO: ELIMINATING TRAFFIC DEATHS BY 2024 MARCH 2015 VISION
Strategies for Making Multimodal Environments Safer. Kim Kolody Silverman, CH2M
 Strategies for Making Multimodal Environments Safer Kim Kolody Silverman, CH2M Kim.kolody@ch2m.com 800 Fatalities in Illinois: Rural versus Urban Fatalities 700 600 500 400 300 200 100 0 2004 2005 2006
6.8 Transportation Safety & Security
 6.8 Transportation Safety & Security This chapter addresses transportation safety and security as required under MAP-21 and California s Strategic Highway Safety Plan. Transportation safety and security
Bridgewater Complete Streets Prioritization Plan and Pedestrian Safety Assessment
 Bridgewater Complete Streets Prioritization Plan and Pedestrian Safety Assessment Presented by Luciano Rabito Manager of Complete Streets Presented to Bridgewater, MA Wednesday, April 26, 2017 6:30 P.M.
5. Pedestrian System. Accomplishments Over the Past Five Years
 5. Pedestrian System Accomplishments Over the Past Five Years The Alamo Area Metropolitan Planning Organization (MPO) and its partner agencies recognize the importance of improving pedestrian mobility.
NYC Pedestrian Safety Study & Action Plan. Research, Implementation & Safety Division of Traffic Operations
 NYC Pedestrian Safety Study & Action Plan Research, Implementation & Safety Division of Traffic Operations 1 Introduction DOT Safety GOAL Strategic Plan: Reduce Fatalities by 50% by 2030 From 274 (2007)
FHWA s Strategic Agenda for Pedestrian and Bicycle Transportation. Purdue Road School March 8, 2017
 FHWA s Strategic Agenda for Pedestrian and Bicycle Transportation Purdue Road School March 8, 2017 1 Strategic Agenda for Pedestrian and Bicycle Transportation Provides a framework for organizing FHWA
Road Safety Audit Course Participant Guidebook. August 22 & 23, Cleveland Avenue Columbus, Ohio
 Road Safety Audit Course Participant Guidebook August 22 & 23, 2017 Cleveland Avenue Columbus, Ohio 1 2 Table of Contents Executive Summary... 5 Cleveland Avenue City of Columbus... 6 Road Location Details...
CTDOT Pedestrian and Bicycle Safety Initiatives
 CTDOT Pedestrian and Bicycle Safety Initiatives 2017 Northeast Transportation Safety Conference Mark F. Carlino, P.E. Traffic Engineering Division Chief Bureau of Engineering and Construction Connecticut