SHRP 2. Strategic Highway Research Program. Accelerating solutions for highway safety and performance. Charles Fay, Sr.
|
|
|
- Randolf Floyd
- 5 years ago
- Views:
Transcription


1 Strategic Highway Research Program SHRP 2 Accelerating solutions for highway safety and performance Charles Fay, Sr. Program Officer GIS-T Boise, ID 2013
2 Second Strategic Highway Research Program ( SHRP 2) Naturalistic Driving Study C Fay Roadway Information Database O Smadi Q &A
3 Fact: drivers cause or contribute to over 90% of crashes Study goal: Improve traffic safety by obtaining objective information on driver behavior and driver interaction with the vehicle and the roadway(context) Collect data on the system: driver, vehicle, context Build the Naturalistic Driving Study (NDS) and Roadway Information (RID) databases Use the data: study key safety issues that can t be studied with other databases; use results to develop new countermeasures and improve existing countermeasures 3 pilot analysis projects underway


 RID (GIS)")


4 Existing Data characterize the environment in which the participant/ DAS operates: ~ 1950 DAS ~3000 participants ~ 5 million trips Passenger Car, Van, SUV, Pickup NDS Data (DAS GPS is Link) RID (GIS) roadway, crash, safety campaigns & laws, traffic, weather, work zones and infrastructure changes... New Roadway Data Collected and QA Application of Results: Safety Countermeasures
5 Method: continuous observation of volunteer drivers in ordinary driving for months or years What do drivers really do? Speeding, tailgating, cell phone, alcohol How do these actions affect crash risk? What were they doing just before they crashed? Usual crash studies can only guess. How do drivers react to cues and countermeasures from the vehicle and the roadway environment? Smaller previous naturalistic driving studies SHRP 2 NDS: 40 times larger, national scale; only one with roadway information (context).
6 ~ 4 petabytes of data ~ 1.4 million hrs of driving video ~ 3000 subjects (teens-elderly) ~ 5 million trips (continuously recorded) ~ 32 million miles driven ~ 4 billion GPS points Linked to the Roadway Information Database Provides context for each of the 5 million trips GIS: Roadway characteristics & features and other contextual information (crash histories, traffic, weather, safety campaigns )


7 NDS RID

8 Six NDS Data Collection Sites across the U.S. One Coordinator WA Data Collection NY Data Collection IN Data Collection NDS Data PA Data Collection NC Data Collection FL Data Collection

9 9
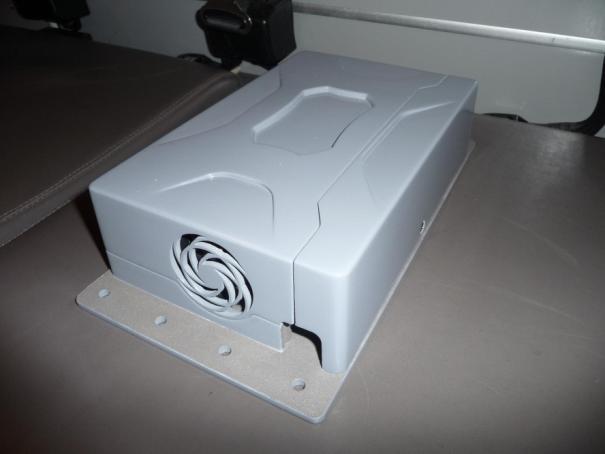
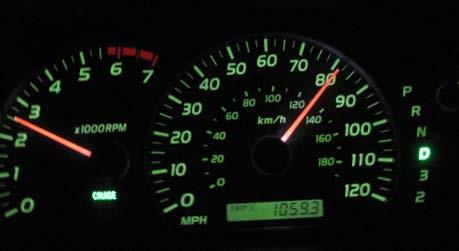
10 DAS Overview Multiple Videos Machine Vision Head Pose Monitor Lane Tracker Accelerometer Data (3 axis) Rate Sensors (3 axis) GPS Latitude, Longitude, Elevation, Time, Velocity Forward Radar X and Y positions X and Y Velocities Cell Phone ACN, health checks, location notification Health checks, remote upgrades Illuminance sensor Infrared illumination Passive alcohol sensor Incident push button Audio (only on incident push button) Turn signals Vehicle network data Accelerator Brake pedal activation ABS Gear position Steering wheel angle Speed Horn Seat Belt Information Airbag deployment Many more variables

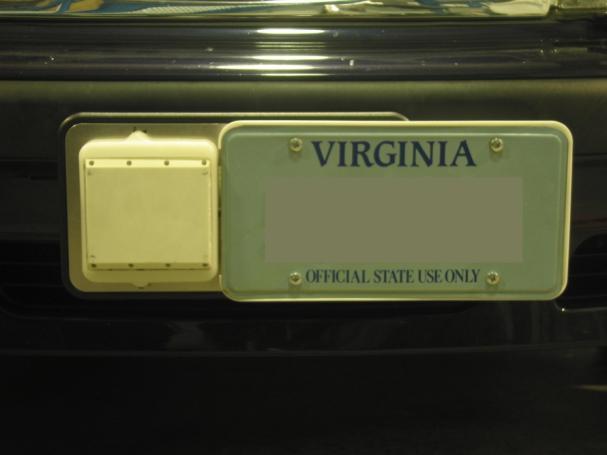
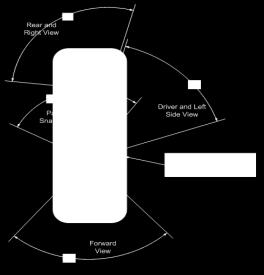
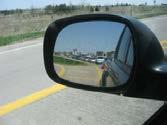
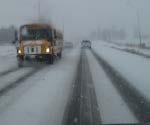
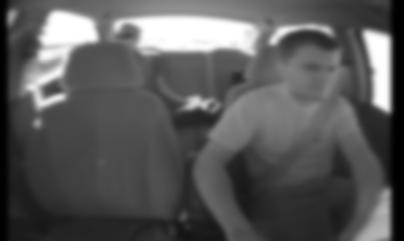
11 Camera Image Samples Video 15Hz; H 264 compression 1.4 million hours Forward View - color Driver Face Rotated for max pixel efficiency Right-Rear View Center stack Pedal Interactions; hands Periodic still cabin image, permanently blurred for passenger anonymity (child safety seat use?)
12 Data so far as of April 1, participants, active or completed 4 M trips(5m), 23 M (32M) miles of driving 310 known crashes (more in database not yet identified) Near crashes estimated at 10x crashes 7 more months of collection; end 11/2013

13 13
14 Existing Data characterize the environment in which the participant/ DAS operates: ~ 1950 DAS ~3000 participants ~ 5 million trips Passenger Car, Van, SUV, Pickup NDS Data (DAS GPS is Link) RID (GIS) roadway, crash, safety campaigns & laws, traffic, weather, work zones and infrastructure changes... New Roadway Data Collected and QA Application of Results: Safety Countermeasures
15


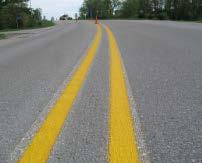
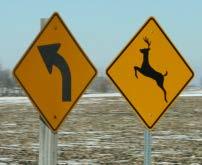
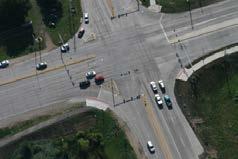
16 Run-off-road crashes on rural 2-lane curves Effects of signs, markers, chevrons CTRE, Iowa State University Offset left-turn lanes Effect on safety, design guidance MRIGlobal Driver glance behavior What glance patterns are safer SAFER Status Phase 1 proof of concept completed Phase 2 contract awards spring 2013 Final reports July
17 Size: the file is huge 4 petabytes = 4 million 1 gig flash drives 5 M trips; 32 M miles of driving Complexity: different data types Categorical data constant over a trip: driver age, vehicle type Sampled data: collected at different rates (once a trip up to 640 Hz during a crash): speed, acceleration, GPS position, radar, Video data from 4 cameras; must be interpreted and reduced Automated reduction: lane tracker, head tracker Manual reduction: all other items for specific analyses Roadway data linked to trip data via GPS Privacy considerations: personallyidentifying data 17
18 Trip summary files Categorical data on each trip to help users identify trips of interest Trip, roadway, vehicle, and driver variables Reduced data Trips or trip segments for specific research areas: trips with drivers who peel out from a stop; trips on rural 2-lane curves Retain only NDS and RID variables needed for research area Event files: crashes, near-crashes, baseline Brief (30 sec.) data segments at events of interest Near-crashes defined by sudden braking, steering Baseline events defined in various ways: random; match same driver, time, and road Public data De-identified data in various formats 18
19 Trip summary files Initial files: summer 2013 Enhanced files, updates: through spring 2014, as resources permit Reduced data files For 3 SHRP 2 analysis contractors and FHWA researcher: spring 2013 For other users: fall 2013, as resources permit Event files: crashes, near-crashes, baseline Crash and some near-crash files: spring 2013; updated thereafter Expanded near-crash and exposure files: fall 2013, as resources permit Public data files Initial files: summer 2013 Complete quality-controlled data files available spring
20 Benefits of the Study (sample safety related) These data are not available one of a kind database(s): decades of use Value not limited to Highway Safety Asset Management Highway Operations Baseline for autonomous/ connected vehicle and infrastructure? Model for how the system operates now? Improved understanding of baseline driving behaviors: Trip characteristics Driver performance profiles Adherence to laws and basic safety practices Improved understanding of unsafe behaviors and traffic events: Assess circumstances and motivations for speeding, red light running, etc. Deconstruct crashes and near-misses and examine causality How do driver, vehicle, roadway, and environmental factors influence behavior and impact crash risk? Improved ability to develop safety countermeasures for: Education and training Roadway design and traffic engineering Vehicle design Regulation and enforcement Ability to direct countermeasures at driver subgroups


21 GIS-T Meeting May 5 th, 2013 SHRP 2 Roadway Information Database (RID)


22 Project Goal Design, Build, and Populate Roadway Information Database Linked to Support Safety Analysis NDS Database


23 Roadway Data (RID) Naturalistic Driving Data (NDS) Analyses
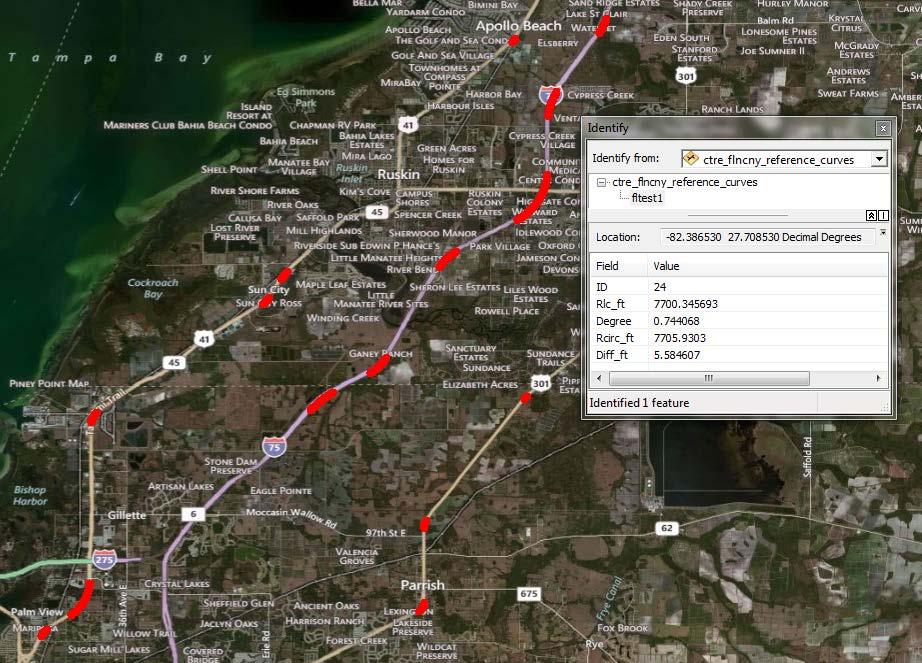
24 Data Sources/Database Design Mobile Van Data State DOT Data Database Design Private Data (ESRI) Supplemental Data Analysis Needs User Needs GIS Experience Long Term Management

25 Database Design and Specifications Objective: Develop the technical specifications and supporting management components for the SHRP2 Roadway Information Database Key Issues: Provide consistency across the six study area sites Account for inherent differences in available data across sites Facilitate user access to data Ensure compatibility with data from Mobile Data Ensure compatibility with Naturalistic Driving Database
26 Database Design and Specifications Locations Design Assumptions: Data will be linked to a geospatial roadway network (i.e., Geodatabase) Roadway features and attributes will be locationally referenced as linear or point events along the roadway network All linear and point event data will be stored as tables in a relational database management system (RDBMS) Route System Roadway Attributes Table LRMEquivalency Line feature class Roads Line feature class Routes Table LRMPosition Attributed relationship class LRMPositionHasGeoPosition Table Alignment Table Aspect Table Intersection Table Lane Table AspectType Many to Point feature class GeoPosition many Table SignAssembly Table Shoulder Table Sign
 Supplemental Information Critical in")

27 RID Data Sources (6 Sites) Existing (readily available DOT information) Supplemental Information Critical in further characterizing or analyzing operations of a roadway segment Mobile Van Data (~ 25,000 collection miles)
28 Supplemental Data Crash data (5 years before NDS and during) Traffic information Weather data State laws: Cell phone use Texting GDL Seat belt Aerial imagery Changes to infrastructure Work zone
29 FHWA Recent Efforts RDIP (Roadway Data Improvement Program) MIRE (Model Inventory Roadway Elements) FDE (Fundamental Data Elements) MAP-21
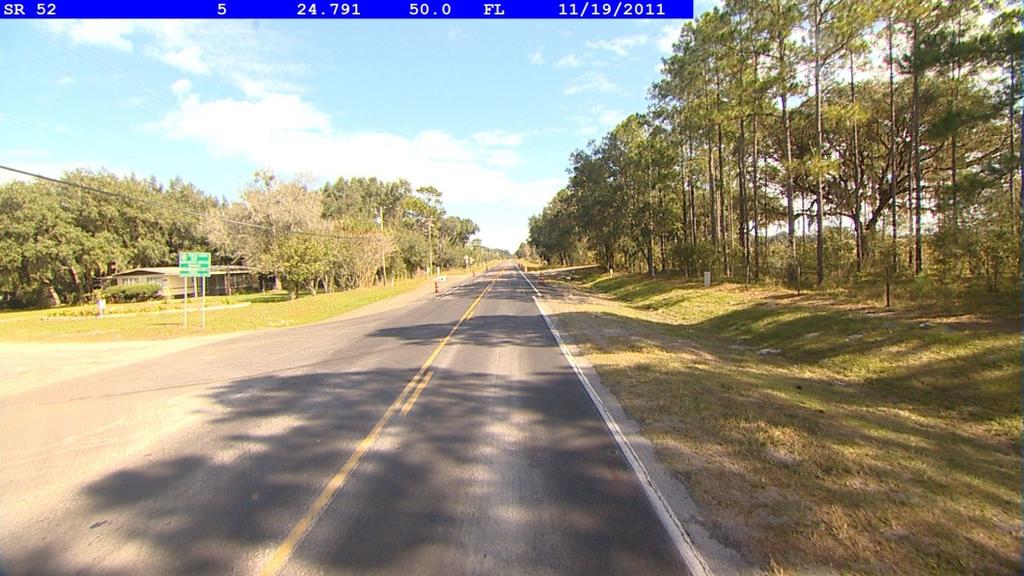
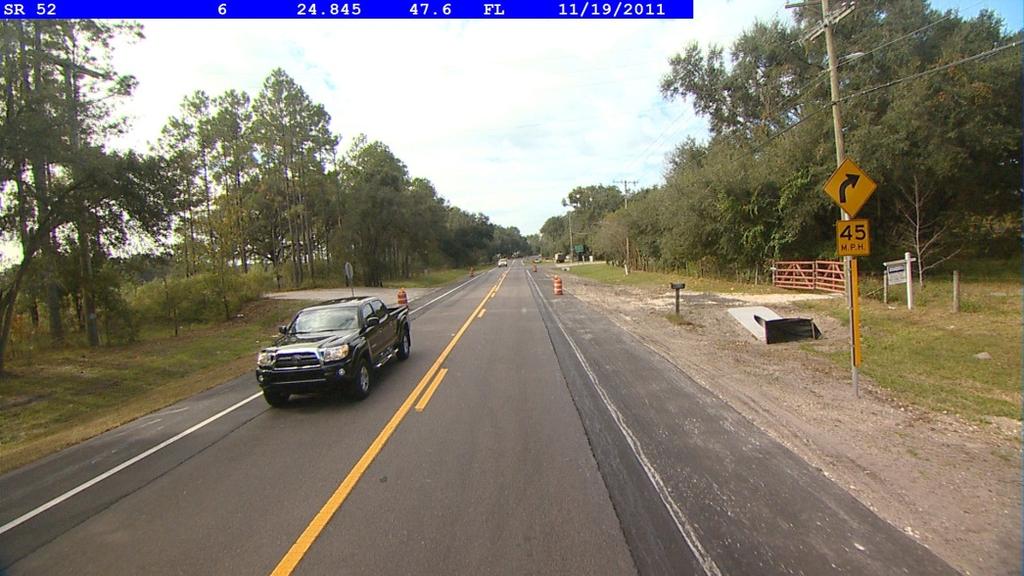
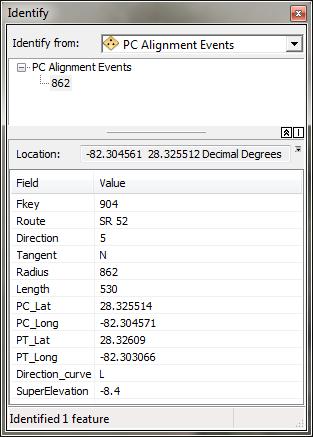
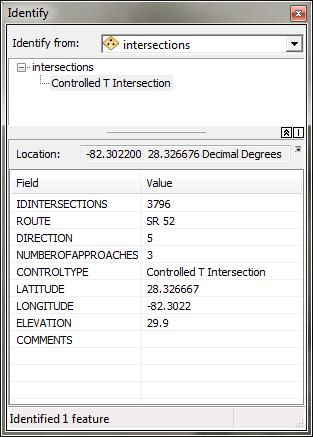
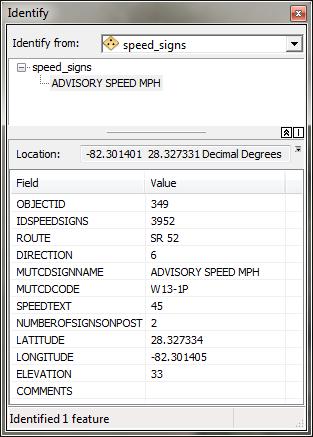
30 Mobile Data Data Element Curvature Length Curvature Radius Begin point and end point of curvature Grade (+ or -) and Cross Slope/Super Elevation Lane Width/Type Paved Shoulder Width/Type All MUTCD signs and Barriers Intersection Information Presence of Lighting/Medians/Rumble Strips Front Video Log


31 Evaluation: Roadway Section Horizontal Curves Grade Cross Slope Lane Width Shoulder Signs
32 Number of Vendors by Performance Positive Neutral Negative Roadway Feature: Curve: PC/PT Location Curve: Length Curve: Radius Roadway: Longitudinal Grade Roadway: Cross Slope Roadway: Lane Width Roadway: Paved Shoulder Width Sign: Location Sign: Message (MUTCD only) Positive: The majority of data met the minimum accuracy requirement. Neutral: Roughly half of the data met the minimum accuracy requirement. Negative: The majority of data did not meet the minimum accuracy requirement.
33 Mobile Data QA - Values Data Element Accuracy Requirement Curvature Length 100 feet (curves less than 1500 ft radius) Curvature Radius 100 feet (curves less than 1500 ft radius) PC 50 feet PT 50 feet Grade (+ or -) 1.0% Cross Slope/Super Elevation 1.0% Lane Width 1 foot Paved Shoulder Width 1 foot Inventory Features (signs) Location 7 feet Control sites (2 per location-urban and rural) Random checks


34 Mobile Data Collection Communications Plan Communication Model NAS Program Officer Project Team Project Team S04A Project Manager Project Team S04B Project Manager Project Team Ensures full compliance by all parties Provides consistency Identifies roles and responsibilities throughout the project


35 Mobile Data Collection Data Collection Manual
36 Mobile Data Collection NY: 520 collection miles NC: 615 collection miles FL: 705 collection miles A total of about 1,850 miles
37 Mobile Data Collection Completed data collection for: NC: 3,200 miles FL: 3,600 miles WA: 4,160 miles NY: 3,200 miles IN: 2,900 miles Total for 2012: 16,000 miles

38 Mobile Data Collection Proposed data collection for: IN: 1,700 miles PA: 3,800 miles Additional miles based on crashes
39
40 Lighting: N/A Rumble Strips: N/A Unpaved Shoulder: N/A Grade, Cross Slope Paved Shoulder 3 Mix/Combo N/A 3 Mix/Combo 4 Mix/Combo Median Flush Paint. N/A Flush (Painted) N/A Flush (Painted) N/A Flush Paint. Lanes Thru Lane: 1 (12 ) Thru Lane: 1 (11 ) Right Turn: 1 Thru Lane: 1 (12 ) Flush Paint. Lanes Median Thru Lane: 1 (12 ) Left Turn Lane: 1 Thru Lane: 1 (14 ) Deccel. Lane: 1 Thru Lane: 2 (11 ) Deccel. Lane: 1 Thru Lane: 1 (12 ) Accel. Lane: 1 N/A Flush (Painted) N/A Flush (Painted) N/A Thru Lane: 1 (21 ) Flush Paint. Paved Shoulder 2 Mix/Combo 0 Mix/Combo 3 Mix/Combo 2 Mix/Combo Grade, Cross Slope Unpaved Shoulder: N/A Rumble Strips: N/A Lighting: N/A


41 Linking Vehicle Driver Roadway
42

43 Questions? SHRP 2 Roadway Information Database
ANALYSIS OF RURAL CURVE NEGOTIATION USING NATURALISTIC DRIVING DATA Nicole Oneyear and Shauna Hallmark
 ANALYSIS OF RURAL CURVE NEGOTIATION USING NATURALISTIC DRIVING DATA Nicole Oneyear and Shauna Hallmark OUTLINE Background Objective Data Sources Site Selection Data Reduction Future work Benefits BACKGROUND
Development of Analytical Tools to Evaluate Road Departure Crashes Using Naturalistic Driving Study Data
 Development of Analytical Tools to Evaluate Road Departure Crashes Using Naturalistic Driving Study Data Safety Research Symposium Strategic Highway Research Program 2 Transportation Research Board July
Evaluating Road Departure Crashes Using Naturalistic Driving Study Data
 Evaluating Road Departure Crashes Using Naturalistic Driving Study Data Strategic Highway Research Program 2 Transportation Research Board Third Safety Research Symposium July 17 & 18, 2008 Research Team:
Closing Plenary Session
 TRAFFIC SAFETY CONFERENCE Closing Plenary Session June 9, 2017 Las Colinas, TX Order of Report Out June 9, 2017 Las Colinas, TX Distracted Driving Prioritized Countermeasures Countermeasure 4a Systemically
Designing for Pedestrians: An Engineering Symposium. Rutgers University March 21, 2013
 Designing for Pedestrians: An Engineering Symposium Rutgers University March 21, 2013 The Problem 2 Pedestrian Fatalities Pedestrian Fatalities by Year in US (1994-2010) 6000 5000 4000 3000 2000 1000 0
Safety Data Resources. Multi-Discipline Safety Planning Forum March 10 & 11, 2008 Gateway Center
 Safety Data Resources Multi-Discipline Safety Planning Forum March 10 & 11, 2008 Gateway Center Tom McDonald, PE Safety Circuit Rider Iowa LTAP Jack Latterell,, PE Safety Consultant FHWA Safety Engineer,
Chapter 5 DATA COLLECTION FOR TRANSPORTATION SAFETY STUDIES
 Chapter 5 DATA COLLECTION FOR TRANSPORTATION SAFETY STUDIES 5.1 PURPOSE (1) The purpose of the Traffic Safety Studies chapter is to provide guidance on the data collection requirements for conducting a
The 100 Car Study: A Pilot for Large-Scale Naturalistic Driving Research
 The 100 Car Study: A Pilot for Large-Scale Naturalistic Driving Research 241 drivers No instructions 80/20 own/leased 12-13 months 43,000 hours 2.0 MVMT Naturalistic Data Collection Approach Highly capable
Figure 1: Graphical definitions of superelevation in terms for a two lane roadway.
 Iowa Department of Transportation Office of Design Superelevation 2A-2 Design Manual Chapter 2 Alignments Originally Issued: 12-31-97 Revised: 12-10-10 Superelevation is the banking of the roadway along
Local Road Safety Plans
 An Introduction to Local Road Safety Plans June 21, 2018 Today s Presenter Jerry Roche, P.E. Safety Analysis Program Manager FHWA Office of Safety Ames, IA 2 NACE Do-It-Yourself LRSP Pilot Six states,
Safety Assessment of Installing Traffic Signals at High-Speed Expressway Intersections
 Safety Assessment of Installing Traffic Signals at High-Speed Expressway Intersections Todd Knox Center for Transportation Research and Education Iowa State University 2901 South Loop Drive, Suite 3100
Analysis of Run-Off-Road Crashes in Relation to Roadway Features and Driver Behavior
 Analysis of Run-Off-Road Crashes in Relation to Roadway Features and Driver Behavior Ertan Örnek University of Wisconsin, Madison Traffic Operations Lab 141 NW Barstow Street Waukesha, WI 53187 ornek@wisc.edu
Lessons Learned from the Minnesota County Road Safety Plans. Richard Storm CH2M HILL
 Lessons Learned from the Minnesota County Road Safety Plans Richard Storm CH2M HILL May 21, 2014 Overview of the MN CRSP: Why Prepare Safety Plans for Local Systems? MAP-21: Requires states to address
Performance-Based Approaches for Geometric Design of Roads. Douglas W. Harwood MRIGlobal 3 November 2014
 Performance-Based Approaches for Geometric Design of Roads Douglas W. Harwood MRIGlobal 3 November 2014 Traditional Approaches to Highway Geometric Design Based on established geometric design criteria
BUILDING CHINARAP. Zhang Tiejun Research Institute of Highway (RIOH) Beijing, China
 Beijing, China") BUILDING CHINARAP Zhang Tiejun Research Institute of Highway (RIOH) Beijing, China E-mail: tj.zhang@rioh.cn Greg Smith International Road Assessment Programme (irap) Beijing, China E-mail: greg.smith@irap.org
BUILDING CHINARAP Zhang Tiejun Research Institute of Highway (RIOH) Beijing, China E-mail: tj.zhang@rioh.cn Greg Smith International Road Assessment Programme (irap) Beijing, China E-mail: greg.smith@irap.org
Engineering Countermeasures for Transportation Safety. Adam Larsen Safety Engineer Federal Highway Administration
 Engineering Countermeasures for Transportation Safety Adam Larsen Safety Engineer Federal Highway Administration 360-619-7751 Adam.Larsen@DOT.GOV Countermeasure Selection Resources Manual for Selecting
GIS Based Non-Signalized Intersection Data Inventory Tool To Improve Traffic Safety
 GIS Based Non-Signalized Intersection Data Inventory Tool To Improve Traffic Safety UNIVERSITY OF ALABAMA JENNA SIMANDL JENNY BLEIHOLDER ANDREW GRAETTINGER TIM BARNETT LUKE TAYLOR RANDY SMITH Introduction
Toward Zero Deaths. Regional SHSP Road Show Meeting. Virginia Strategic Highway Safety Plan. presented by
 Toward Zero Deaths Regional SHSP Road Show Meeting presented by Virginia Strategic Highway Safety Plan December 1, 2016 1 Welcome & Introductions Purpose of the Meeting Objectives & Key Outcomes Agenda»
Acknowledgements. Mr. David Nicol 3/23/2012. Daniel Camacho, P.E. Highway Engineer Federal Highway Administration Puerto Rico Division
 Daniel Camacho, P.E. Highway Engineer Federal Highway Administration Puerto Rico Division Acknowledgements Mr. David Nicol Director, FHWA Office of Safety FHWA Office of Safety http://safety.fhwa.dot.gov/provencountermeasures/
Using SHRP 2 s NDS Video Data to Evaluate the Impact of Offset Left-Turn Lanes on Gap Acceptance Behavior Karin M. Bauer & Jessica M.
 Using SHRP 2 s NDS Video Data to Evaluate the Impact of Offset Left-Turn Lanes on Gap Acceptance Behavior Karin M. Bauer & Jessica M. Hutton 4 th International Symposium on Naturalistic Driving Research
Sponsored by the Office of Traffic and Safety of the Iowa Department of Transportation NOVEMBER 2001 CTRE
 PAVED SHOULDERS ON PRIMARY HIGHWAYS IN IOWA: AN ANALYSIS OF SHOULDER SURFACING CRITERIA, COSTS, AND BENEFITS EXECUTIVE SUMMARY Sponsored by the Office of Traffic and Safety of the Iowa Department of Transportation
Systemic Safety. Doug Bish Traffic Services Engineer Oregon Department of Transportation March 2016
 Systemic Safety Doug Bish Traffic Services Engineer Oregon Department of Transportation March 2016 Oregon averages 1700 fatal and serious injury crashes each year. Some of the more common crash types include:
Scientific Analysis of Road Traffic Accidents. Requirements and Training Needs. Saving Lives through Accident Research
 Saving Lives through Accident Research Scientific Analysis of Road Traffic Accidents Requirements and Training Needs SAFE Annual Convention Shimla Overview Importance of In-Depth Accident Data (the feedback
RURAL HIGHWAY SHOULDERS THAT ACCOMMODATE BICYCLE AND PEDESTRIAN USE (TxDOT Project ) June 7, Presented by: Karen Dixon, Ph.D., P.E.
 June 7, Presented by: Karen Dixon, Ph.D., P.E.") RURAL HIGHWAY SHOULDERS THAT ACCOMMODATE BICYCLE AND PEDESTRIAN USE (TxDOT Project 0-6840) June 7, 2016 Presented by: Karen Dixon, Ph.D., P.E., TTI Team: Kay Fitzpatrick, Raul Avelar, & Subasish Das Project
RURAL HIGHWAY SHOULDERS THAT ACCOMMODATE BICYCLE AND PEDESTRIAN USE (TxDOT Project 0-6840) June 7, 2016 Presented by: Karen Dixon, Ph.D., P.E., TTI Team: Kay Fitzpatrick, Raul Avelar, & Subasish Das Project
SHSP Action Plan Development. Intersection EA Team
 SHSP Action Plan Development Intersection EA Team March 7, 2018 Agenda Welcome and Introductions Review Completed Action Plans Developed by Working Groups Next Steps STRATEGIES: INTERSECTION SAFETY EMPHASIS
THE FUTURE OF THE TxDOT ROADWAY DESIGN MANUAL
 THE FUTURE OF THE TXDOT ROADWAY DESIGN MANUAL Kenneth Mora, P.E. (Design Division) 10/10/2017 Table of contents 1 2 Reduction in FHWA design controlling criteria Innovative Intersection Guidance 3-7 8-42
usrap: An Innovation in Data-Driven Safety Analysis
 Est. Dec. 2014 usrap: An Innovation in Data-Driven Safety Analysis Presented by: Bruce Hamilton, Roadway Safety Foundation Doug Harwood, MRIGlobal Webinar Logistics Duration is 11:00 AM - 12:30 PM Mountain
CHAPTER 1 STANDARD PRACTICES
 CHAPTER 1 STANDARD PRACTICES OBJECTIVES 1) Functions and Limitations 2) Standardization of Application 3) Materials 4) Colors 5) Widths and Patterns of Longitudinal Pavement Marking Lines 6) General Principles
Pavement Markings to Reduce Lane Departure Crashes. Paul Carlson, PhD, PE Road Infrastructure Inc.
 Pavement Markings to Reduce Lane Departure Crashes Paul Carlson, PhD, PE Road Infrastructure Inc. 1 6-inch Edge Lines 10 years ago Agencies liked the looks of wider edge lines but did not have evidence
Proven Safety Countermeasures. FHWA Office of Safety January 12, :00 p.m. to 2:00 p.m. Eastern Time
 Proven Safety Countermeasures FHWA Office of Safety January 12, 2012 1:00 p.m. to 2:00 p.m. Eastern Time Introduction and Background While States should still be considering the application of all of the
ROAD SAFETY PERFORMANCE REVIEW Capacity Building Workshop for Uganda. irap METHODOLOGY Racheal M. N. Nganwa AfricaRAP Lead 1 & 2 March 2018
 ROAD SAFETY PERFORMANCE REVIEW Capacity Building Workshop for Uganda irap METHODOLOGY Racheal M. N. Nganwa AfricaRAP Lead 1 & 2 March 2018 About irap: Registered charity Vision: a world free of high risk
2009 Manual on Uniform Traffic Control Devices
 2009 Manual on Uniform Traffic Control Devices Tori Brinkly, PE Highway Safety Engineer WFL-FHWA April 20, 2010 Paragraphs are numbered. Standard Statements are bolded. Guidance statements are italicized.
Pavement Markings (1 of 3)
") Pavement Markings (1 of 3) DESCRIPTION AND DEFINITION Disadvantages Relatively high cost (over typical Crash reduction as yet unknown painted edge line) No tactile effect The STOP AHEAD pavement marking
Pavement Markings (1 of 3) DESCRIPTION AND DEFINITION Disadvantages Relatively high cost (over typical Crash reduction as yet unknown painted edge line) No tactile effect The STOP AHEAD pavement marking
Section 3A.04 Colors. Section 3B.10 Approach Markings for Obstructions
 Section 3A.04 Colors Markings shall be yellow, white, red, or blue, or purple. The colors for markings shall conform to the standard highway colors. Black in conjunction with one of the above colors shall
What Engineering Can Do for You! Low Cost Countermeasures for Transportation Safety
 What Engineering Can Do for You! Low Cost Countermeasures for Transportation Safety Adam Larsen Safety Engineer Federal Highway Administration 360-619-7751 Adam.Larsen@DOT.GOV Adam Larsen TTP Safety Engineer
Figure 3B-1. Examples of Two-Lane, Two-Way Marking Applications
 Figure 3B-1. Examples of Two-Lane, Two-Way Marking Applications A - Typical two-lane, two-way marking with passing permitted in both directions B - Typical two-lane, two-way marking with no-passing zones
Human Factors for Limited-Ability Autonomous Driving Systems
 Human Factors for Limited-Ability Autonomous Driving Systems Jeremy Salinger, PhD GM Research and Development Jeremy.Salinger@gm.com Disclaimer A portion of this material is based upon work supported by
Road Safety Assessment
 Road Safety Assessment Incorporating Human Factors 66 th Illinois Traffic Engineering Safety Conference October 18, 2017 1 Definition of Human Factors IT S US Drivers Ability and Limitations to (1)Detect,
APPENDIX C. Systems Performance Report C-1
 APPENDIX C Systems Performance Report C-1 System Performance Report & Requirements According to the FAST Act, a long range transportation plan needs to include a system performance report and subsequent
TEXAS TRAFFIC SAFETY TASK FORCE. Jeff Moseley Texas Transportation Commission
 TEXAS TRAFFIC SAFETY TASK FORCE Jeff Moseley Texas Transportation Commission June 7, 2016 Fatalities and fatal crashes 2010 2015 4,000 3,500 3,417 3,407 3,536 3,533 3,000 3,061 3,067 2,782 2,803 3,037
444 North Capitol Street NW, Suite 249, Washington, DC (202) Fax: (202) ERRATA
 Fax: (202) ERRATA") Larry L. Butch Brown, Sr., President Executive Director, Mississippi Department of Transportation John Horsley, Executive Director 444 North Capitol Street NW, Suite 249, Washington, DC 20001 (202) 624-5800
Larry L. Butch Brown, Sr., President Executive Director, Mississippi Department of Transportation John Horsley, Executive Director 444 North Capitol Street NW, Suite 249, Washington, DC 20001 (202) 624-5800
Collision Avoidance based on Camera and Radar Fusion. Jitendra Shah interactive Summer School 4-6 July, 2012
 Collision Avoidance based on Camera and Radar Fusion Jitendra Shah interactive Summer School 4-6 July, 2012 Agenda Motivation Perception requirements for collision avoidance Situation classification and
CE576: Highway Design and Traffic Safety
 CE576: Highway Design and Traffic Safety Predicting Crash Frequency for Two-Lane Rural Highway Segments Cross Sectional Elements Ahmed Abdel-Rahim, Ph.D., P.E. Civil Engineering Department University of
How Might Connected Vehicles and Autonomous Vehicles Influence Geometric Design? October 10, 2017
 How Might Connected Vehicles and Autonomous Vehicles Influence Geometric Design? October 10, 2017 Overview Design Vehicle Design Driver Potential Geometric Impacts of Autonomous Vehicles Connected Vehicles
2014 FHWA Aging Road User Handbook. Recommendations to Accommodate Aging Pedestrians. Lifesaver National Conference. What is the Handbook?
 2014 FHWA Aging Road User Handbook Recommendations to Accommodate Aging Pedestrians Lifesaver National Conference March 17, 2015 Revised June 2014 1 What is the Handbook? 1998 1st Edition 2001 2nd Edition
Where Did the Road Go? The Straight and Narrow about Curves
 Where Did the Road Go? The Straight and Narrow about Curves Renae Kuehl, SRF Consulting Group October 23, 2018 What is a County Roadway Safety Plan or CRSP?" CRSP Identifies priority location-specific
November 2012: The following Traffic and Safety Notes were revised:
 CHANGE LIST for MDOT Traffic and Safety, TRAFFIC AND SAFETY NOTES Located at http://mdotcf.state.mi.us/public/tands/plans.cfm JANUARY 2014: The following Traffic and Safety Note was added: Note 705A Angled
Toolbox of Countermeasures and Their Potential Effectiveness to Make Intersections Safer
 8 Toolbox of Countermeasures and Their to Make Intersections Safer Introduction Studies included in the NCHRP 17-18 (3), Guidance for Implementation of the AASHTO Strategic Highway Safety Plan, as well
1.3.4 CHARACTERISTICS OF CLASSIFICATIONS
 Geometric Design Guide for Canadian Roads 1.3.4 CHARACTERISTICS OF CLASSIFICATIONS The principal characteristics of each of the six groups of road classifications are described by the following figure
INTERSECTION CRASH COUNTERMEASURES
 INTERSECTION CRASH COUNTERMEASURES ALL SEVERE INTERSECTION (include gap CRASHES High Friction Surface Treatment - Intersection Markings - advanced acceptance and intersection approaches to intersections
FREEWAY WORK ZONE SPEED MODEL DOCUMENTATION
 APPENDIX B FREEWAY WORK ZONE SPEED MODEL DOCUMENTATION B-1 APPENDIX B FREEWAY WORK ZONE SPEED MODEL DOCUMENTATION B.1 INTRODUCTION This software can be used for predicting the speed of vehicles traveling
IHSDM- HSM Predictive Methods. Slide 1
 IHSDM- HSM Predictive Methods Slide 1 Presentation Outline IHSDM Overview Relationship between HSM and IHSDM Crash Prediction Models and Data Needs IHSDM HSM Predictive Method 2011 Release Preview Questions
Traffic Signs and Markings. Instructor: Dr. Yahya Sarraj Associate Prof. Of Transportation
 and Markings Instructor: Dr. Yahya Sarraj Associate Prof. Of Transportation Definition; A traffic sign is defined as a device mounted on a fixed or portable support whereby a specific message is conveyed
Use of SHRP2 NDS Data to Evaluate Roadway Departure Characteristics
 Use of SHRP2 NDS Data to Evaluate Roadway Departure Characteristics Phase I Final Report and Phase II Proposal SHRP 2 Implementation Assistance Program Submitted by: Shauna Hallmark (shallmar@iastate.edu)
Austroads National Risk Assessment Model (ANRAM) Chris Jurewicz, ARRB
 Chris Jurewicz, ARRB") Austroads National Risk Assessment Model (ANRAM) Chris Jurewicz, ARRB Overview Context What is ANRAM? How it is used? Severe crash risk estimation ANRAM Toolkit Next steps 2 Context Diminishing blackspots
Austroads National Risk Assessment Model (ANRAM) Chris Jurewicz, ARRB Overview Context What is ANRAM? How it is used? Severe crash risk estimation ANRAM Toolkit Next steps 2 Context Diminishing blackspots
Road Safety Assessments. Lt. Bob McCurdy Williamson County Sheriff s s Office Marion, IL.
 Road Safety Assessments Lt. Bob McCurdy Williamson County Sheriff s s Office Marion, IL. Why Are We Here? 2005 US Traffic Fatalities = 43,443 1429 4329 1361 1616 1534 3504 1729 3543 Illinois Annual Fatallities
Safety Impacts: Presentation Overview
 Safety Impacts: Presentation Overview The #1 Theme How Access Management Improves Safety Conflict Points The Science of Access Management By Treatment Studies Themes for Texas Access Management Improve
Benefits of Center Line Rumble Strips on Rural 2-Lane Highways in Louisiana
 Benefits of Center Line Rumble Strips on Rural 2-Lane Highways in Louisiana Xiaoduan Sun, Ph.D., P.E. University of Louisiana at Lafayette 2018 Louisiana Transportation Conference Baton Rouge, February
Strategies for Making Multimodal Environments Safer. Kim Kolody Silverman, CH2M
 Strategies for Making Multimodal Environments Safer Kim Kolody Silverman, CH2M Kim.kolody@ch2m.com 800 Fatalities in Illinois: Rural versus Urban Fatalities 700 600 500 400 300 200 100 0 2004 2005 2006
Minnesota Crash Mapping Analysis Tool (MnCMAT) & Crash Data
 & Crash Data") Minnesota Crash Mapping Analysis Tool (MnCMAT) & Crash Data Brad Estochen State Traffic Safety Engineer Minnesota Department of Transportation 2012 Traffic Records Forum Biloxi, MS October 2012 Brief History
Minnesota Crash Mapping Analysis Tool (MnCMAT) & Crash Data Brad Estochen State Traffic Safety Engineer Minnesota Department of Transportation 2012 Traffic Records Forum Biloxi, MS October 2012 Brief History
TRAFFIC CHARACTERISTICS. Unit I
 TRAFFIC CHARACTERISTICS Unit I Traffic stream Characteristics Overview Overview of Traffic Stream Components To begin to understand the functional and operational aspects of traffic on streets and highways
Access Management in the Vicinity of Intersections
 Access Management in the Vicinity of Intersections FHWA-SA-10-002 Technical Summary Photo: Ralph Bentley (used with permission) 0 Access Management is: The design, implementation and management of entry
Road Safety Facilities Implemented in Japan
 Road Safety Facilities Implemented in Japan 1 Road Safety Facilities 1.Guard Fence 2.Road Lighting 3.Other Road Safety Facilities 2 Road Safety Facilities 1.Guard Fence 2.Road Lighting 3.Other Road Safety
Safety at Unsignalized Intersections. Unsignalized Intersections
 Safety at FHWA Safety Focus Areas 2 National Statistics 3 National Statistics There were 41,059 highway fatalities in 2007. Where did they occur? Non-Intersections 79% About half of all crashes and half
SR/CR A1A PEDESTRIAN SAFETY & MOBILITY STUDY RIVER TO SEA TRANSPORTATION PLANNING ORGANIZATION
 SR/CR A1A PEDESTRIAN SAFETY & MOBILITY STUDY RIVER TO SEA TRANSPORTATION PLANNING ORGANIZATION 2016 Florida Section ITE Annual Summer Meeting June 24, 2016 Today s Presenters Lois Bollenback Executive
Citywide Sidewalk and Crosswalk Programs
 Citywide Sidewalk and Crosswalk Programs Council Meeting October 20, 2015 Presented by Rita Hu and Jamal Mahmoud Program Goals Implement the City s comprehensive plan. Provide pedestrian with safe walking
(This page left intentionally blank)
") (This page left intentionally blank) 2011 Edition - Revision 1 Page 553 Section 5A.01 Function CHAPTER 5A. GENERAL 01 A low-volume road shall be defined for this Part of the Manual as follows: A. A low-volume
(This page left intentionally blank) 2011 Edition - Revision 1 Page 553 Section 5A.01 Function CHAPTER 5A. GENERAL 01 A low-volume road shall be defined for this Part of the Manual as follows: A. A low-volume
RE: 2007 NPA Text (Clean Version)
") 1 2 3 4 5 6 7 8 9 10 11 12 13 14 15 16 17 18 19 21 20 22 23 24 25 26 27 28 29 30 31 32 33 34 35 36 RE: 2007 NPA Text (Clean Version) P. 230, Lines 29-30 SECTION 3B.04 White Lane Line Pavement Markings
1 2 3 4 5 6 7 8 9 10 11 12 13 14 15 16 17 18 19 21 20 22 23 24 25 26 27 28 29 30 31 32 33 34 35 36 RE: 2007 NPA Text (Clean Version) P. 230, Lines 29-30 SECTION 3B.04 White Lane Line Pavement Markings
EMS professionals face many risks exposure to infectious diseases, violence, hazardous scenes, and oncoming traffic, to name a few.
 EMS professionals face many risks exposure to infectious diseases, violence, hazardous scenes, and oncoming traffic, to name a few. However, none of these risks compares to the potential for death and
Subject: Use of Pull-off Areas in Work Zones Page: 1 of 13. Brief Description: Guidance for the use and placement of pull-off area in work zones.
 6 - G2 Subject: Use of Pull-off Areas in Work Zones Page: 1 of 13 MdMUTCD REF. NO. None Date Issued: 09/09 Effective Date: 09/09 Brief Description: Guidance for the use and placement of pull-off area in
Understanding Interactions between Drivers and Pedestrian Features at Signalized Intersections
 Understanding Interactions between Drivers and Pedestrian Features at Signalized Intersections SHRP2 Implementation Assistance Program (IAP) Round 4 Concept to Countermeasures Research to Deployment Using
Toward Zero Deaths: Proactive Steps for Your Community
 Est. Dec. 2014 Toward Zero Deaths: Proactive Steps for Your Community Presented by: Brian Roberts, P.E., National Association of County Engineers Marie Walsh, Ph.D., Louisiana Local Technical Assistance
Department of Transportation
 Department of Transportation I. Internal Scan The number of older drivers in the United States will double over the next 30 years. By 2030 one in five Americans will be age 65 or older. On a licensed-driver
Traffic Engineering Research Centre Department of Civil and Environmental Engineering, NTNU
 Managed motorways Seminar Traffic Management and Control June 8 th 2017, Thon Hotel Bristol, Oslo Arvid Aakre Traffic Engineering Research Centre Department of Civil and Environmental Engineering, NTNU
Identify the letter of the choice that best completes the statement or answers the question.\
 Chapter 09 - Practice Questions Multiple Choice Identify the letter of the choice that best completes the statement or answers the question.\ 1) Riding the brake might cause the driver following you to
Geometric Design Tables
 Design Manual Chapter 5 - Roadway Design 5C - Geometric Design Criteria 5C-1 Geometric Design Tables A. General The following sections present two sets of design criteria tables - Preferred Roadway Elements
Evaluation of Left-Turn Lane Offset Using the Naturalistic Driving Study Data
 1 Hutton et al. 1 2 3 Evaluation of Left-Turn Lane Offset Using the Naturalistic Driving Study Data Jessica M. Hutton (Corresponding Author) Senior Traffic Engineer MRIGlobal 425 Volker Boulevard Kansas
4/27/2016. Introduction
 EVALUATING THE SAFETY EFFECTS OF INTERSECTION SAFETY DEVICES AND MOBILE PHOTO ENFORCEMENT AT THE CITY OF EDMONTON Karim El Basyouny PhD., Laura Contini M.Sc. & Ran Li, M.Sc. City of Edmonton Office of
Work Zone Traffic Safety
 Work Zone Traffic Safety Summary The Hazard: death or serious injury from being struck by vehicles or equipment in work zones. Who is at risk: streets/highways, utilities and other public works department
DISTRIBUTION: Electronic Recipients List TRANSMITTAL LETTER NO. (17-01) MINNESOTA DEPARTMENT OF TRANSPORTATION. MANUAL: Road Design English Manual
 MINNESOTA DEPARTMENT OF TRANSPORTATION. MANUAL: Road Design English Manual") DISTRIBUTION: Electronic Recipients List MINNESOTA DEPARTMENT OF TRANSPORTATION DEVELOPED BY: Design Standards Unit ISSUED BY: Office of Project Management and Technical Support TRANSMITTAL LETTER NO.
DISTRIBUTION: Electronic Recipients List MINNESOTA DEPARTMENT OF TRANSPORTATION DEVELOPED BY: Design Standards Unit ISSUED BY: Office of Project Management and Technical Support TRANSMITTAL LETTER NO.
Township Signing Practices
 Township Signing Practices The average Minnesota township has approximately 30 miles of roadway with an average of 6 total traffic signs per mile (both directions) 1 At a replacement cost of approximately
INDEX. Geometric Design Guide for Canadian Roads INDEX
 Acceleration lane, see Lanes, Acceleration Access, 8.1 Access Management and Functional Classification 8.2 Access Management by Design Classification 8.3 Access Configuration 8.4 Building Set-Back Guidelines
Chapter V TRAFFIC CONTROLS. Tewodros N.
 Chapter V TRAFFIC CONTROLS www.tnigatu.wordpress.com tedynihe@gmail.com Lecture Overview Traffic markings Longitudinal markings Transverse markings Object markers and delineator Traffic signs Regulatory
RSTF Measurements and Status
 RSTF Measurements and Status Items in green text are on or ahead of target. Items in red text need attention. Objective & Measures Status November, 2011 Winter, 3/8/12 Build, Maintain, & Leverage Partnerships
Chapter 4 Traffic Analysis
 Chapter 4 Traffic Analysis PURPOSE The traffic analysis component of the K-68 Corridor Management Plan incorporates information on the existing transportation network, such as traffic volumes and intersection
Recently Developed Intersection CMFs. Nancy Lefler, VHB ATSIP Traffic Records Forum, 2014
 Recently Developed Intersection CMFs Nancy Lefler, VHB ATSIP Traffic Records Forum, 2014 Overview General Methodology Treatments Installation of traffic signals - with and without left-turn lanes (NCDOT)
Florida s Intersection Safety Implementation Plan (ISIP)
") Florida Department of TRANSPORTATION Florida s Intersection Safety Implementation Plan (ISIP) Alan El-Urfali, PE State Traffic Engineering and Operations Office March 28, 2017 Intersection Safety Implementation
Florida Department of TRANSPORTATION Florida s Intersection Safety Implementation Plan (ISIP) Alan El-Urfali, PE State Traffic Engineering and Operations Office March 28, 2017 Intersection Safety Implementation
Recent U.S. Research on Safety Evaluation of Low-Cost Road Engineering Safety Countermeasures Lessons for Canada
 Recent U.S. Research on Safety Evaluation of Low-Cost Road Engineering Safety Countermeasures Lessons for Canada Bhagwant Persaud Department of Civil Engineering, Ryerson University 350 Victoria Street,
Rogue Valley Metropolitan Planning Organization. Transportation Safety Planning Project. Final Report
 Rogue Valley Metropolitan Planning Organization Transportation Safety Planning Project Final Report April 23, 2004 Table of Contents Introduction 2 Scope of Work Activities... 2 Activity #1...2 Activity
NCHRP Improved Prediction Models for Crash Types and Crash Severities. Raghavan Srinivasan UNC Highway Safety Research Center
 1 NCHRP 17-62 Improved Prediction Models for Crash Types and Crash Severities Raghavan Srinivasan UNC Highway Safety Research Center 2 The Project Team University of Connecticut Persaud & Lyon, Inc. University
Title. Authors. Safety Benefits of Highway Infrastructure Investments (May 2017)
") Title Safety Benefits of Highway Infrastructure Investments (May 2017) Authors Douglas W. Harwood 1, Jessica M. Hutton 1, Zachary N. Hans 2, Reginald R. Souleyrette 3, Michael A. Fields 3 1MRIGlobal 2Iowa
Title Safety Benefits of Highway Infrastructure Investments (May 2017) Authors Douglas W. Harwood 1, Jessica M. Hutton 1, Zachary N. Hans 2, Reginald R. Souleyrette 3, Michael A. Fields 3 1MRIGlobal 2Iowa
Designing Complete Streets: What you need to know
 Designing Complete Streets: What you need to know Getting from this to this. Continuous sidewalk Buffer w/trees Bicycle lane Raised median Buildings close to the street Flexibility in design Design and
Rebecca Szymkowski, P.E., PTOE Wisconsin Department of Transportation. ITE Midwestern District Annual Meeting June 30, 2015
 Rebecca Szymkowski, P.E., PTOE Wisconsin Department of Transportation ITE Midwestern District Annual Meeting June 30, 2015 Strategic Highway Safety Plan (SHSP) Roundabout Safety Analysis J-turn Experiences
Chapter 11 Highway and Rural Driving
 Chapter 11 Highway and Rural Driving 11-1 THE RURAL DRIVING ENVIRONMENT A. Complete each of the following sentences by writing the correct word or phrase in the space provided. 1. The most heavily traveled
Traffic Control Inspection Checklist Segment:
 Traffic Control Inspection Checklist Segment: Simon Contractors Simon Contractors Originator: Description Reviewed by: Initials Date Distribution: Traffic Quality Manager, Site Assistant Traffic Manager
Florida Transportation Commission. October 1, 2008
 Florida Transportation Commission October 1, 2008 CONGRATULATIONS TO THE FLORIDA DEPARTMENT OF TRANSPORTATION! FLORIDA DEPARTMENT OF TRANSPORTATION: Winner for On Time Small Project FLORIDA DEPARTMENT
Designing for Pedestrian Safety
 Designing for Pedestrian Safety Treatments at Unsignalized Pedestrian Crossings Presented by: Charlie Zegeer PBIC Director August 17, 2010 Crossing Crashes Part 1: General Principles 3 2 Why do people
FHWA Resources for Pedestrian and Bicycle Professionals
 FHWA Resources for Pedestrian and Bicycle Professionals Charlie Zegeer, UNC Highway Safety Research Center/PBIC Libby Thomas, UNC Highway Safety Research Center Dan Nabors, Vanasse Hangen Brustlin (VHB)
Relationship of Road Lane Width to Safety for Urban and Suburban Arterials
 Relationship of Road Lane Width to Safety for Urban and Suburban Arterials Phd. Alma AFEZOLLI Polytechnic University of Tirana Construction and Infrastructure Department of Civil Engineering Faculty Tirana,
Safety and Design Alternatives for Two-Way Stop-Controlled Expressway Intersections
 Safety and Design Alternatives for Two-Way Stop-Controlled Expressway Intersections Thomas H. Maze Center for Transportation Research and Education Iowa State University 2901 South Loop Drive, Suite 3100