The intelligent use of space in mobility management
|
|
|
- Hugh Woods
- 5 years ago
- Views:
Transcription
1 The intelligent use of space in mobility management Ajuntament de Barcelona Direcció de Serveis de Mobilitat IMPACTS Shared Space Shared Mobility June 2012
 New Bus network Diversity of use: Pedestrian zones.")
2 IMPACTS June 2012 Shared Space Shared Mobility 1- City public space: limited resource Mobility master plan (PMU ) Smart networks: Public bike system (Bicing) New Bus network Diversity of use: Pedestrian zones. Bus lanes Multiuse lanes Technology solutions 2
3 DISTRIBUTION OF THE SPACE IN THE CITY PUBLIC THOROUGHFARE %09/08 STREET Km ,06 1,317, , , , ,01-0,9% TOTAL BCN AREA (Km 2 ) 101,00 101,00 101,00 101,00 101,00 101,00 0,0% ROAD TRAFFIC AREA (Km 2 ) 11,00 11,00 11,01 9,52 9,52 9,52 0,0% PEDESTRIAN AREA (Km 2 ) * 12,18 12,01 12,27 14,51 14,51 14,55 0,3% * Pavements (8,25 km 2 ), parks and gardens (5,59 km 2 ) and pedestrian streets (0,71 km 2 ) included. - 17% OF THE SURFACE OF THE CITY BELONGS TO STREETS AND SQUARES. - 65,4% OF THE SURFACE OF THE STREETS BELONGS TO THE PEDESTRIANS. PEDESTRIANS AND ROAD TRAFFIC SURFACES EVOLUTION 16,00 14,00 12,00 10,00 8,00 6,00 PAVEMENTS AND ROADWAYS AREA AND STREETS LENGHT ROADWAYS m 2 PAVEMENTS m 2 STREETS linear m STREETS number ,00 2,00 0, Superficie PEDESTRIAN destinada AREA al (km 2 ) vianant (Km2)* Superficie ROAD TRAFFIC destinada AREA al (km 2 ) vehicle (Km2)
4 VEHICLES FLEET S EVOLUTION %10/09 TOTAL ,0% ,0% ,0% ,0% ,0% CARS ,0% ,3% ,5% ,1% ,9% -0,3% MOTORCYCLES ,7% ,7% ,6% ,3% ,0% 3,2% MOPEDS ,5% ,5% ,4% ,3% ,0% -2,8% VANS ,3% ,3% ,9% ,7% ,4% -7,5% TRUCKS ,3% ,2% ,0% ,9% ,8% -5,3% OTHER VEHICLES ,1% ,2% ,5% ,8% ,0% 7,6% TYPOLOGY OF VEHICLES 2010 VEHICLES FLEET HASN T PRESENTED AN IMPORTANT VARIATION WITH REGARD TO THE NUMBER OF CARS, TRUCKS AND VANS HAS PRESENTED A STRONG DECREASE. THE FLEET OF MOTORCYCLES CONTINUES GROWING AT A GOOD PACE, ON THE OTHER HAND THE MOPEDS DECREASE. THE TOTAL OF MOTORCYCLES AND MOPEDS SUPPOSES 30% OF THE FLEET OF PRIVATE VEHICLES.
5 COMPARATIVE WITH OTHER CITIES AND METROPOLITAN AREAS CITIES/ METROPOLITAN AREAS YEAR INHABITANTS (thousands) CARS (thousands) AREA (km 2 ) CARS/1000 INH INH/CARS BARCELONA ,5 599,5 102,2 369,7 2,7 METROPOLITAN AREA , ,9 586,5 389,3 2,6 MADRID , ,7 607,1 422,2 2,4 VALÈNCIA ,4 376,3 136,8 461,5 2,2 AMSTERDAM ,3 215,6 219,1 288,5 3,5 BELGRAD ,0 473, ,7 269,9 3,7 BERLIN , ,2 890,2 316,1 3,2 BERNA ,3 50,5 51,6 387,7 2,6 BOLONYA ,2 196,9 140,9 522,0 1,9 BUDAPEST ,3 596,5 525,2 350,4 2,9 ESTOCOLM ,2 296,2 215,9 372,5 2,7 FIRENZE ,9 202,5 102,4 549,0 1,8 FRANKFURT ,5 300,4 248,3 463,3 2,2 GENOVA ,7 284,8 239,6 467,1 2,1 HAMBURG ,2 715,4 755,3 403,2 2,5 HÈLSINKI ,6 224,9 186,8 390,0 2,6 LONDRES , , ,0 343,0 2,9 LUXEMBURG ,6 60,0 51,5 677,3 1,5 MILÀ ,5 716,4 182,1 547,9 1,8 MÜNIC ,2 594,6 310,4 435,8 2,3 NÀPOLS ,9 554,4 117, ,7 OSLO ,5 212,1 454,1 378,5 2,6 PRAGA ,3 633,7 496,1 517,2 1,9 ROMA , , ,3 701,0 1,4 TORINO ,5 562,0 130,2 617,9 1,6 VIENA ,3 657,2 415,0 389,5 2,6 ZURIC ,1 130,7 91,9 358,0 2,8
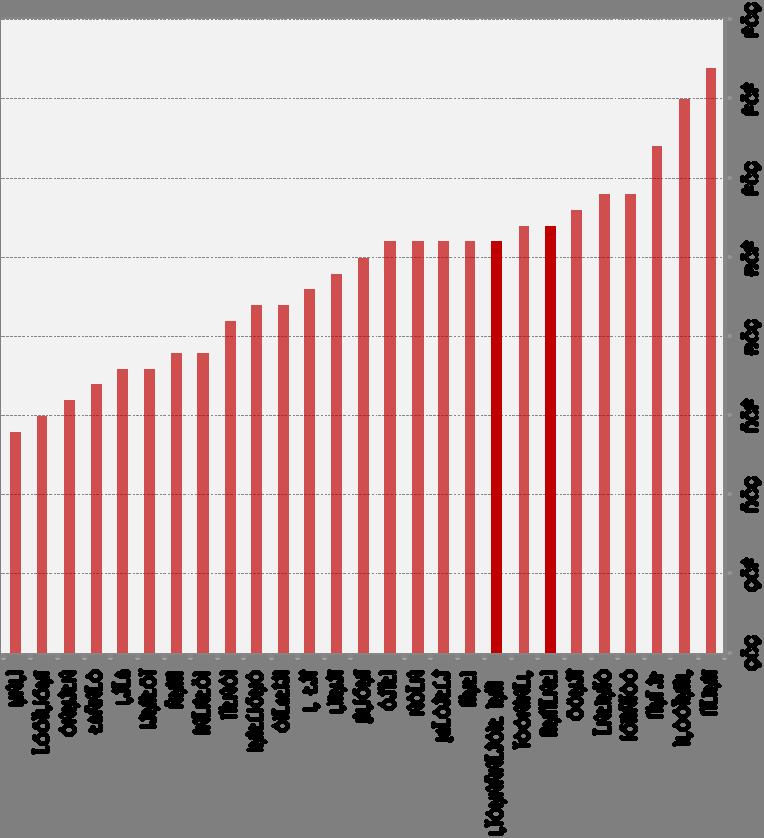

6 COMPARATIVE WITH OTHER CITIES AND METROPOLITAN AREAS


7 NUMBER OF STAGES OF DAILY DISPLACEMENTS_ 2010 CHARACTERISTICS OF THE STUDY: RESULT OF THE INFORMATIONS ANALYSIS OF STAGES, TRAFFIC COUNT SENSORS, TOURIST ACTIVITY, SCHOOL TRANSPORT, TRAFFIC COMPOSITION COUNTS, BICICLES AND PEDESTRIAN COUNTS. THERE ARE NOT BORN IN MIND THE DISPLACEMENTS OF LESS THAN 5 MINUTES. TOTAL 2007 % 2008 % 2009 % 2010 % %10/09 PUBLIC TRANSPORT ,74% ,07% ,76% ,74% 0,86% PRIVATE TRANSPORT ,14% ,37% ,90% ,52% -0,46% ON FOOT AND BICYCLE ,12% ,56% ,34% ,74% 2,15% TOTAL % % % % 0,91% THE STAGES OF THE TRIPS IN PRIVATE VEHICLE AND PUBLIC TRANSPORT HAVE INCREASED 0,46 AND 0,86 RESPECTIVELY DURING THE WAY ON FOOT AND BICYCLE ARE THOSE WHO MORE HAVE INCREASED WITH 2,15%. MODAL DISTRIBUTION
 TOTAL INTERNAL % CONNECTION % TOTAL %")


8 MODAL DISTRIBUTION OF THE STAGES (WORKING DAYS) TOTAL INTERNAL % CONNECTION % TOTAL % MODAL %10/09 PUBLIC TRANSPORT ,20% ,33% ,74% 0,86% PRIVATE TRANSPORT ,35% ,41% ,52% -0,46% ON FOOT AND BICYCLE ,46% ,26% ,74% 2,15% TOTAL % % % 0,91% STAGES IN INTERNAL DISPLACEMENTS: (63,39%)STAGES IN CONNECTION DISPLACEMENTS: (36,61%) THE PREDOMINANT WAY OF TRANSPORT INSIDE THE CITY IS TO GO ON FOOT, WHEREAS IN THE CONNECTION DISPLACEMENTS IT IS THE PUBLIC TRANSPORT.


9 STAGES IN INTERNAL DISPLACEMENTS: EVOLUTION INTERNAL 2007 % 2008 % 2009 % 2010 % %10/09 PUBLIC TRANSPORT ,47% ,16% ,73% ,20% 0,77% PRIVATE TRANSPORT ,37% ,12% ,79% ,35% -0,08% ON FOOT AND BICYCLE ,16% ,72% ,48% ,45% 4,46% TOTAL % % % % 2,33% IT REMAINS STABLE + 0,77 % IT REMAINS STABLE - 0,08 % GROWTH + 4,46 %
 20.263 0,4% 19.")

10 STAGES MODAL DISTRIBUTION IN INTERNAL DISPLACEMENTS (WORKING DAYS) STAGES IN INTERNAL DISPLACEMENTS EVOLUTION STAGES %10/09 ON FOOT ,7% ,5% ,5% 4,5% BUS ,4% ,6% ,9% -3,3% SUBWAY ,8% ,4% ,8% 5,4% FGC ,9% ,9% ,9% 0,0% RENFE (SUBURBAN) ,4% ,4% ,4% -5,8% TRAM ,8% ,8% ,8% -0,4% DISCRETIONARY COACH ,8% ,7% ,7% -2,9% TAXI ,0% ,8% ,8% -0,5% CAR DRIVER ,5% ,2% ,0% -0,5% CAR ACCOMPANIED ,6% ,5% ,5% -0,5% MOTORCYCLES DRIVER ,8% ,9% ,8% 0,7% MOTORCYCLES ACCOMP ,3% ,4% ,3% 0,7% BICYCLE ,1% ,0% ,0% 3,5% VAN / TRUCK ,9% ,8% ,7% -0,3% TOTAL % % % 2,3%
11 WAY OF TRANSPORT IN INTERNAL DISPLACEMENTS STAGES (WORKING DAYS) INTERNAL DISPLACEMENTS STAGES NOT MOTORIZED MOTORIZED ON FOOT (95,8%) BICYCLE (4.2%) PUBLIC TRANSPORT PRIVATE TRANSPORT COLLECTIVE INDIVIDUAL VAN / TRUCK (14,8%) DISCRETIONARY SUBWAY (49,7%) REGULAR BUS (14,8%) TAXI (8,1%) MOTORCYCLE (33,5%) CAR (51,7%) FGC (6,3%) RENFE (1,2%) BUSTMB (40,1%) TRAM (2,7%)
12 TOTAL DATA OF THE SYSTEM OF PUBLIC COLLECTIVE TRANSPORT DEMAND INFORMATION VALIDATIONS ( TRIPS IN MILLIONS/YEAR ) %11/08 %11/10 BUS TMB 194,87 196,00 189,44 188,40-3,32% -0,55% SUBWAY 376,37 361,60 381,22 389,00 3,36% 2,04% FGC 81,05 79,80 79,76 80,50-0,68% 0,93% SUBURBAN RENFE 114,39 110,10 103,69 106,20-7,16% 2,42% OTHERS BUSES 144,60 142,60 144,40 147,20 1,80% 1,94% TRAM 23,17 23,90 23,81 24,20 4,45% 1,64% TOTAL 934,45 914,00 922,32 935,50 0,11% 1,43% DURING 2011 RMB PUBLIC TRANSPORT SYSTEM TRANSPORTED 935,50 MILLION PASSENGERS, 13,18 MILLIONS MORE THAN IN 2010.


13 IMPACTS June 2012 Shared Space Shared Mobility 2- Mobility master plan (PMU ) 13

14 IMPACTS June 2012 Shared Space Shared Mobility 2- Mobility master plan (PMU ) 14

15 IMPACTS June 2012 Shared Space Shared Mobility 2- Mobility master plan (PMU ) 15


16 URBAN TRAFFIC FLOWS HEAVY INCREASE


17 URBAN TRAFFIC FLOWS LOWER INCREASE


18 START SITUATION (2006) MOBILITY TENDENCY AND FUTURE PROGNOSIS BASE SCENARIO MODE OF TRANSPORT INTERNAL % INT/EXT % TOTAL % PRIVATE CAR ,1% ,2% ,8% PUBLIC TRANSPORT ,6% ,8% ,6% FOOT AND BICYCLE ,2% ,9% ,7% ON FOOT 1.9 % PUBLIC 29.6 % ON FOOT 47.2 % PUBLIC 45.8 % PRIVATE 52.2 % PRIVATE 23.1 % INTERNAL TRIPS: INT-EXT TRIPS:
19 FUTURE TENDENCY (2018) MOBILITY TENDENCY AND FUTURE PROGNOSIS MODE OF TRANSPORT INTERNAL % INT/EXT % TOTAL % PRIVATE CAR ,3% ,1% ,7% PUBLIC TRANSPORT ,0% ,7% ,0% FOOT AND BICYCLE ,6% ,1% ,2% PRIVATE CAR TRIPS MEAN 20,8 MILION OF veh-km/day, OF WHICH 24,5% WILL BE DONE WITHIN CONGESTION LEVELS HIGHER THAN 90% ( 13% IN 2004) IT S NOT SUSTAINABLE IN MOBILITY AND ENVIRONMENTAL FRAMEWORK!!!
20 MOBILITY TENDENCY AND FUTURE PROGNOSIS FINAL MOBILITY MODEL MODE OF TRANSPORT INTERNAL % INT/EXT % TOTAL % PRIVATE CAR ,0% ,0% ,0% PUBLIC TRANSPORT ,0% ,0% ,0% FOOT AND BICYCLE ,0% ,0% ,0% TOTAL ,0% ,0% ,0% THE veh x km/day WOULD BE 6% LESS THAN NOWADAYS. INTERNAL PUBLIC TRANSPORT TRIPS SHOULD INCREASE 30% ( )! INTERNAL-EXTERNAL PUBLIC TRANSPORT TRIPS SHOULD INCREASE 65% ( ) - Revision of the Infrastructure Director Masterplan (ATM) - Revision of the Outskirts Train Masterplan (Adif, RENFE, FGC)
21 ACTION PROPOSALS OUTSTANDING ACTIONS 1.- TO INCREASE THE PRIVATE VEHICLE OCCUPATION RATE - INTRODUCE BUS / VAO LANE ON THE CITY ACCESSES: B-23, C-58, C-32,... - FOUND REVERSE DISCRIMINATION MEASURES: LOWER TOLL ROADS, EXEMPTION IN FRONT OF POSSIBLE RESTRICTIONS (EPISODES OF ELEVATE CONTAMINANT CONCENTRATIONS,...) 2.- TO INCREASE THE PUBLIC TRANSPORT MARKET SHARE OF THE INTERN MOBILITY - PDI - PROPOSALS FOR THE PDI REVISION 3.- TO INCREASE THE PUBLIC TRANSPORT MARKET SHARE OF THE CONNECTION MOBILITY - PDI - PROPOSALS FOR THE PDI REVISION - OUTSKIRTS RAILWAY MASTERPLAN


22 IMPACTS June 2012 Shared Space Shared Mobility 3- Smart Networks: Public bike system (Bicing) 22


23 IMPACTS June 2012 Shared Space Shared Mobility 3- Smart Networks: Public bike system (Bicing) Main figures: 23


24 IMPACTS June 2012 Shared Space Shared Mobility 3- Smart Networks: Public bike system (Bicing) Problem: Redistribution in some old districts (narrow streets). Solution: Hub & Spoke scheme. Results: Increase of service offer, with same resources. Problem: Disequilibrium of system. Solution: Management of demand: I-BICING. Information and communication with users. Results: Users show great acceptation. Smart use of the bike share system. 24


25 THE BICYCLE DAILY DISPLACEMENTS BY BICICLE 2008 % 2009 % 2010 % 2011 % %11/10 BICYCLE ,39% ,33% ,37% ,51% 10,92% CYCLE PATH %11/08 %11/10 CYCLE PATH (Km) 140,2 146,8 159,0 181,5 29,5% 14,2% BICYCLE PARKING %11/08 %11/10 PARKINGS IN SURFACE Thoroughfare ,8% 1,3% UNDERGROUND PARKINGS BSM SABA ,1% 0,0%

26 THE BICYCLE THE 42,1% OF THE BICYCLES RIDES ALONG THE CYCLE PATHS.
27 IMPACTS June 2012 Shared Space Shared Mobility 4- Smart Networks: New Bus Network New urban model Legible Effective New Bus Network Eficient 27
28 IMPACTS June 2012 Shared Space Shared Mobility 4- Smart Networks: New Bus Network 28


29 IMPACTS June 2012 Shared Space Shared Mobility 4- Smart Networks: New Bus Network New Bus Network 29

30 IMPACTS June 2012 Shared Space Shared Mobility 4- Smart Networks: New Bus Network Main characteristics The bus network becomes more legible. New model of bus network New model of city. Measures for increasing commercial speed in main routes. Increasing of frequency. Maintain the number of vehicles. 95% of trips, with maximum 1 line transfer. Maintain proximity services (neighbourhood lines, etc.). 30
. Distribution of merchandise.")
31 IMPACTS June 2012 Shared Space Shared Mobility 5- Diversity of use: Pedestrian zones Automatic bollards Controlled points: different uses during the day Pedestrian zones (commercial, tourism, old city, etc.). Distribution of merchandise. CONTROL POINTS / BOLLARDS %11/08 %11/10 CONTROLLED ZONES ,0% -4,5% CONTROL POINTS Incomes ,0% -1,4% Exits ,7% 0,0% 31
 2008 2009 2010 2011 %11/08 %11/10 CIUTAT VELLA 21,67 22,38 23,31 23,44 8,2% 0,6% EIXAMPLE 6,28 6,28 6,28 6,47 3,0% 3,0% SANTS - MONTJUÏC 3,58 3,74 3,82 3,83 7,0% 0,3% LES")
32 THE PEDESTRIANS DAILY DISPLACEMENTS ON FOOT 2008 % 2009 % 2010 % 2011 % %11/10 ON FOOT ,47% ,01% ,37% (*) 31,86% 1,92% * 93,8% are internal displacements. PEDESTRIANS ZONES Area (Ha) %11/08 %11/10 CIUTAT VELLA 21,67 22,38 23,31 23,44 8,2% 0,6% EIXAMPLE 6,28 6,28 6,28 6,47 3,0% 3,0% SANTS - MONTJUÏC 3,58 3,74 3,82 3,83 7,0% 0,3% LES CORTS 1,96 2,16 2,16 2,16 10,2% 0,0% SARRIÀ - ST GERVASI 3,27 3,72 3,72 3,78 15,6% 1,6% GRÀCIA 5,13 5,18 5,27 5,34 4,1% 1,3% HORTA - GUINARDÓ 2,76 3,12 3,19 3,99 44,6% 25,1% NOU BARRIS 6,19 6,55 6,55 6,75 9,0% 3,1% SANT ANDREU 7,97 7,98 8,07 8,07 1,3% 0,0% SANT MARTÍ 10,49 10,63 10,63 10,63 1,3% 0,0% TOTAL 69,30 71,74 73,00 74,46 7,4% 2,0%

33 PARKING LOTS FOR HANDICAPPED PERSONS IN ROADWAY %10/09 %10/07 CIUTAT VELLA ,1% 17,0% EIXAMPLE ,7% 29,8% SANTS - MONTJUÏC ,7% 34,2% LES CORTS ,6% 69,8% SARRIÀ - SANT GERVASI ,6% 54,5% GRÀCIA ,9% 17,7% HORTA - GUINARDÓ ,0% 23,6% NOU BARRIS ,3% 46,6% SANT ANDREU ,3% 32,4% SANT MARTÍ ,9% 24,0% TOTAL ,3% 32,4% PMR CARDS %10/09 %10/07 ISSUED CARDS ,3% 83,7% OUT OF ROADWAY BSM SABA THE NEW STOCK LIST HAS DETECTED PARKING LOTS IN ROADWAY FOR PMR, FOR A TOTAL OF ISSUED CARDS.


34 IMPACTS June 2012 Shared Space Shared Mobility 6- Diversity of use: Bus lanes Advantage for public transport Bus (urban and metropolitan) Taxi Shared with High-Occupancy Vehicle (VAO) 34


35 IMPACTS June 2012 Shared Space Shared Mobility 7- Diversity of use: Multiuse-bus lanes Streets with high traffic demand Commercial zones Merchandise distribution Limited space Bus lane 35


36 IMPACTS June 2012 Shared Space Shared Mobility 8- Technology solutions Electric vehicles: battery charge in public points Accessibility: adaptation of subway stations Elevators Trains 36
37 TRAFFIC MANAGEMENT MEDIUM DAILY INTENSITY OF VEHICLES %11/08 %11/10 ACCESSES ,7% -2,2% ROUTES SEA-MOUNTAIN ,8% -3,6% ROUTES BESOS-LLOBREGAT ,0% -0,3% TOTAL MAIN ROUTES ,9% -2,3% RONDA DE DALT ,6% -2,4% RONDA LITORAL ,0% -3,5% TOTAL RONDES ,9% -2,8% SPEED %11/08 %11/10 EXTERNAL CONNECTIVITY ROADS 22,9 22,9 25,8 24,8 24,0 4,8% -3,2% ROUTES SEA-MOUNTAIN 16,6 17,3 18,5 17,8 16,4-5,2% -7,9% ROUTES BESÒS-LLOBREGAT 23,6 24,2 26,9 23,8 22,5-7,0% -5,5% CITY SPEED AVERAGE 20,8 21,3 23,5 21,8 20,6-3,3% -5,5% RING ROADS 53,3 56,3 59,3 57,0 54,7-2,8% -4,0%
38
Regulating personal mobility vehicles and cycles with more than two wheels in Barcelona
 Regulating personal mobility vehicles and cycles with more than two wheels in Barcelona A pioneering set of regulations Barcelona has put together an unprecedented plan to regulate personal mobility vehicles
Traffic calming. Joan DELORT i MENAL Manager of Prevention, Safety and Mobility Barcelona Municipality. Thursday 15 May 2014
 Plenari del Pacte per la Mobilitat 5 de març de 2014 Traffic calming Joan DELORT i MENAL Manager of Prevention, Safety and Mobility Barcelona Municipality Thursday 15 May 2014 1. The city 2 1.1. Barcelona,
Konstantin Glukhenkiy Economic Affairs Officer
 Konstantin Glukhenkiy Economic Affairs Officer Rapid growth of urban areas Very rapid increase in motorisation Substantial increases in traffic congestion Relative decline of public transport usage and
The City. Population of BH. Population of RMBH. 2.4 million inhabitants. 5.7 million inhabitants. 6.3 million trips a day
 Implementing sustainable mobility solutions Rogério Carvalho Silva Architect President Adviser BHTRANS Belo Horizonte, Brazil The City Population of BH 2.4 million inhabitants Population of RMBH 5.7 million
The Moscow Department for Transport and Road Infrastructure
 Moscow Government The Moscow Department for Transport and Road Infrastructure Transport for Moscow. Green mobility. September, 2013. The main goal to improve the environmental situation will be achieved
Copenhagen Cycling Map. Red Lines Cycling facilities
 Copenhagen Cycling Map Red Lines Cycling facilities Copenhagen Cycling Facilities Design Approaches Transportation without Pollution Copenhagen s Strategy Where Cycling is one of the top key activities
Impact Assessment of a new parking pricing scheme in Madrid City Centre
 Impact Assessment of a new parking pricing scheme in Madrid City Centre Andres Monzon Professor of Transportation Transport Research Centre Universidad Politecnica de Madrid Spain María E. López-Lambas,
THE TWO BANKS OF THE TAGUS RIVER BY INTEGRATING THE BYCICLE INTO A MULTIMODAL SYSTEM
 TH 1.E Cycling to work, school, retail and for leisure LINKING THE TWO BANKS OF THE TAGUS RIVER BY INTEGRATING THE BYCICLE INTO A MULTIMODAL SYSTEM Summary A glimpse of Almada Transport impacts in Almada
Integrated Urban Mobility
 Integrated Urban Mobility The Berlin Experience Forum Urba 2015 Conference Montreal, 23 th March 2011 Maria Krautzberger Permanent Secretary of State, Senate Department for Urban Development, Berlin The
Mobility measures in Vitoria-Gasteiz
 CIVITAS Study Tour in Vitoria-Gasteiz, Spain 19 & 20 June 2014 Palacio Zulueta Public Space and Nature Environment Service, Paseo de la Senda 2, Vitoria-Gastez Giving back the public space to the people
STATION #3 INITIAL ALTERNATIVES
 www.dot.il.gov www.eisenhowerexpressway.com STATIO #3 IHB RR Heavy Rail Transit (HRT) High capacity transit mode serving urban areas:» Steel wheeled, high performance electric powered rail vehicles» Right-of-way
Parallel Workshop: Avoid
 Parallel Workshop: Avoid Vitoria-Gasteiz The commitment of a city towards active and sustainable mobility. Juan Carlos Escudero Environmental Studies Centre Vitoria-Gasteiz City Council A compact, diverse
It s a Public Bike System (PBS) launched in March 2007 in Barcelona
 launched in March 2007 in Barcelona") COST- BENEFIT EVALUATION OF BICING Workshop 6: The renaissance of cycling Authors: ECOMM Conference 2009 San Sebastián/Donostia, Spain 14 TH May 2009 Anaya, Esther /, p Bea, Miguel I. Introduction What
COST- BENEFIT EVALUATION OF BICING Workshop 6: The renaissance of cycling Authors: ECOMM Conference 2009 San Sebastián/Donostia, Spain 14 TH May 2009 Anaya, Esther /, p Bea, Miguel I. Introduction What
TRAVEL PLAN: CENTRAL EUROPEAN UNIVERSITY CAMPUS REDEVELOPMENT PROJECT TRAVEL PLAN. Central European University Campus Redevelopment Project.
 TRAVEL PLAN Central European University Campus Redevelopment Project Page 1 Table of Contents Introduction... 3 Background... 7 Building Users... 7 Transportation in Community Consultation... 7 Summary
Green mobility and traffic safety in Copenhagen
 Green mobility and traffic safety in Copenhagen / Steffen Rasmussen, Head of Projects City of Copenhagen The Technical and Environmental Administation 15 September 2018 Dramatic development over the last
OVERVIEW OF CIRCULATION
 OVERVIEW OF 1.Beijing Circulation 2. Development of Haidian District 3. Future Development 4. Project Site Overview 5. Road Types 6. Rail Corridor 7. Findings 8. Recommendations 1 of 22 BEIJING 2 of 22
Cooperative ITS and cities 2nd meeting of CODECS City Pool. Date 06/06/2016 Glasgow
 Cooperative ITS and cities 2nd meeting of CODECS City Pool Date Area of New Use Cases Public Transport Vulnerable Road Users Non Safety 2 Public Transport BUS/Tram Stopping Starting Turning Left/right
CITY OF VAUGHAN EXTRACT FROM COUNCIL MEETING MINUTES OF OCTOBER 30, 2012
 CITY OF VAUGHAN EXTRACT FROM COUNCIL MEETING MINUTES OF OCTOBER 30, 2012 Item 31, Report No. 39, of the Committee of the Whole, which was adopted without amendment by the Council of the City of Vaughan
We believe the following comments and suggestions can help the department meet those goals.
 The Honorable Secretary Anthony Foxx The Secretary of Transportation United States Department of Transportation 1200 New Jersey Avenue, SE Washington, DC 20590 August 30, 2013 Dear Secretary Foxx, Thank
VILNIUS SUMP. Gintarė Krušinskaitė International project manager place your logo here
 VILNIUS SUMP Gintarė Krušinskaitė International project manager Gintare.krusinskaite@vilniustransport.lt place your logo here 19 April, 2017 WHERE DID WE CAME FROM? Mobility management and mobility planning
Driverless Vehicles Potential Influence on Bicyclist Facility Preferences
 Driverless Vehicles Potential Influence on Bicyclist Facility Preferences MICHAEL BLAU, MCRP, LCI O T E C O C T O B E R 2 6, 2 0 1 6 S E S S I O N # 8 2 - E V A L U AT I N G T H E P E R F O R M A N C E
Roundtable on integrated and sustainable urban transport. Mio Suzuki (University of Tokyo) Hiroki Nakamura (Chuo University)
 Hiroki Nakamura (Chuo University)") Roundtable on integrated and sustainable urban transport Mio Suzuki (University of Tokyo) Hiroki Nakamura (Chuo University) Contents Current situation of cycling in Japan Public bike system in Japan Example
Roundtable on integrated and sustainable urban transport Mio Suzuki (University of Tokyo) Hiroki Nakamura (Chuo University) Contents Current situation of cycling in Japan Public bike system in Japan Example
PLANNING FOR SUSTAINABLE PEDESTRIAN INFRASTRUCTURE NALIN SINHA INITIATIVE FOR TRANSPORTATION & DEVELOPMENT PROG. (ITD), DELHI
, DELHI") PLANNING FOR SUSTAINABLE PEDESTRIAN INFRASTRUCTURE NALIN SINHA INITIATIVE FOR TRANSPORTATION & DEVELOPMENT PROG. (ITD), DELHI India s Road Network 5 million kms: Total road length 2.6 mn kms: Surfaced
PLANNING FOR SUSTAINABLE PEDESTRIAN INFRASTRUCTURE NALIN SINHA INITIATIVE FOR TRANSPORTATION & DEVELOPMENT PROG. (ITD), DELHI India s Road Network 5 million kms: Total road length 2.6 mn kms: Surfaced
West Village Mobility & Integration
 West Village Mobility & Integration PRESENTED TO TOPCA Town Hall November 9, 2017 [7189-21] Port Credit 2 West Village + Mobility AWalkable Community A CompleteCommunity A SustainableCommunity 3 Mobility
Report on trends in mode share of vehicles and people crossing the Canal Cordon to 2013
 Report on trends in mode share of vehicles and people crossing the Canal Cordon 2006 to 2013 Dublin City Council, National Transport Authority, Civic Offices, Dun Scèine, Wood Quay, Harcourt Lane, Dublin
Development, transport and traffic management in Copenhagen
 Development, transport and traffic management in Copenhagen / Mikkel Balskilde Hansen, Head of Traffic Unit The Technical and Environmental Administration 2. October 2017 Copenhagen facts INHABITANTS Municipality
EUROPEAN MOBILITY WEEK September 2015
 EUROPEAN MOBILITY WEEK 16-22 September 2015 Description and objective The European Mobility Week is an annual campaign on sustainable urban mobility, organised with the support of the Directorates General
Gerald Ollivier Lead Transport Specialist World Bank, New Delhi. Transforming Cities through Integrated Planning Corridor Scale
 Gerald Ollivier Lead Transport Specialist World Bank, New Delhi Transforming Cities through Integrated Planning Corridor Scale JOB ACCESSIBILITY: ZHENGZHOU A: LINE 1, 2, AND 3 AND WALKING: 12% B. SCENARIO
Preliminary Transportation Analysis
 Preliminary Transportation Analysis Goals of a Robust, Multimodal Transportation Network Safe Accessible/Connected Efficient Comfortable Context-Sensitive Motor Vehicle: Continue to analyze the data to
Capacity of transport infrastructure networks
 Most infrastructure extension work is concentrated on roads. The total length of the motorway network has increased dramatically during the past two decades (about 3 % per year). Construction of the high-speed
ABERDEEN: CITY OF THE FUTURE
 ABERDEEN: CITY OF THE FUTURE A contribution towards discussions on a future transport strategy for Aberdeen and its Region Prepared by the Centre for Transport Research University of Aberdeen June 2010
Cycling and traffic calming in Reggio Emilia urban area
 Cycling and traffic calming in Reggio Emilia urban area Alessandro Meggiato Municipality of Reggio Emilia mobility department manager Background In the middle of Padana Plane 1h.30 from Milan, 40 min.
SUMP of Ravenna: relevant experiences on travel behavior change
 SUMP of Ravenna: relevant experiences on travel behavior change Nicola Scanferla, Head of Mobility Planning Unit Giorgia Rambaldi, Mobility Planning Unit nscanferla@comune.ra.it giorgiarambaldi@comune.ravenna.it
INTEGRATED MULTI-MODAL TRANSPORTATION IN INDIA
 INTEGRATED MULTI-MODAL TRANSPORTATION IN INDIA Tejas Rawal (Corresponding Author) Ph.D. Research Scholar, Dept. of Architecture & Planning, Indian Institute of Technology-Roorkee, Roorkee-247 667 Email:
March, 2017 Christophe Najdovski, Deputy Mayor of Paris for transport, street network, mobility and public space. Roads and Mobility Parisian Policy
 March, 2017 Christophe Najdovski, Deputy Mayor of Paris for transport, street network, mobility and public space Roads and Mobility Parisian Policy Part 1 - Background Paris and its agglomeration, institutionnal
1 Road and HGV danger in London. Hannah White, Freight & Fleet Programme Manager November 2017
 1 Road and HGV danger in London Hannah White, Freight & Fleet Programme Manager November 2017 2 London and its transport networks London: 8.6m residents + 30m visitors 30m journeys per day 6.3m by bus
DON MILLS-EGLINTON Mobility Hub Profile
 Mobility Hub Profile Dundas Don Mills-Eglinton West-Bloor Anchor Hub Gateway Hub N MOBILITY HUBS: Places of connectivity between regional and rapid transit services, where different modes of transportation
SOCIALLY AND ENVIRONMENTALLY SUSTAINABLE URBAN TRANSPORT
 SOCIALLY AND ENVIRONMENTALLY SUSTAINABLE URBAN 1 Not only for clean air, but for basic human rights, those without cars must also be able to move without fear of being killed. 2 Bogotá is far from being
The Limassol SUMP Planning for a better future. Apostolos Bizakis Limassol, May 16, th Cyprus Sustainable Mobility and ITS conference
 The Limassol SUMP Planning for a better future Apostolos Bizakis Limassol, May 16, 2017 5 th Cyprus Sustainable Mobility and ITS conference Αbout Limassol Αbout Limassol The second largest city in Cyprus
May Canal Cordon Report 2017
 May 2018 Canal Cordon Report 2017 Report on trends in mode share of vehicles and people crossing the Canal Cordon to 2017 2 Analysis of trends in mode share of people crossing the canal cordon - 2017 Contents
DON MILLS-SHEPPARD Mobility Hub Profile
 DON MILLS-SHEPPARD Mobility Hub Profile Dundas Don Mills-Sheppard West-Bloor Anchor Hub Gateway Hub N MOBILITY HUBS: Places of connectivity between regional and rapid transit services, where different
NEWMARKET CENTRE Mobility Hub Profile
 Mobility Hub Profile Dundas Newmarket West-Bloor Centre Anchor Hub Gateway Hub N MOBILITY HUBS: Places of connectivity between regional and rapid transit services, where different modes of transportation
URBAN TRANSPORT FOR DEVELOPMENT Slobodan Mitric World Bank. CODATU XIII, November 2008 Ho Chi Minh City, Vietnam
 URBAN TRANSPORT FOR DEVELOPMENT Slobodan Mitric World Bank CODATU XIII, November 2008 Ho Chi Minh City, Vietnam Sources of the presentation A Framework for Urban Transport Projects Operational Guidance
Loughborough University Travel Planning
 Document Ti tle Client Name Loughborough University Travel Planning Loughborough University Travel Plan Executive Summary 2015-2020 23 December 2015 Loughborough University Travel Planning Project no:
Healthy and Environmental Friendly Transport in the City Region
 Healthy and Environmental Friendly Transport in the City Region Reindert Augustijn Team manager traffic and transport Arnhem Nijmegen City Region www.polisnetwork.eu/2014conference #polis14 Fact and figures
Developing a Birmingham Transport Space Allocation policy. David Harris Transport Policy Manager Economy Directorate Birmingham City Council
 Developing a Birmingham Transport Space Allocation policy David Harris Transport Policy Manager Economy Directorate Birmingham City Council Birmingham s Sustainable Urban Mobility Plan Birmingham Connected
MOBILITY CHALLENGES IN HILL CITIES
 MOBILITY CHALLENGES IN HILL CITIES Lalmuansanga Ralte, MCS Pvt Secretary to Minister & Under Secretary Urban Development & Poverty Alleviation Department Govt. of Mizoram DEMOGRAPHIC OVERVIEW INDIA MIZORAM
Camosun College Modal Split
 2010 Camosun College Modal Split How Does the College Community Get to Campus? Shannon Craig & Julie Higginson Camosun College 1/21/2011 Contents Introduction... 3 Methodology... 3 Results... 6 Mode Share
City of Szekesfehervar. Royal traditions Dominant economic role 1000 years of mobility
 City of Szekesfehervar Royal traditions Dominant economic role 1000 years of mobility Strategic location nowadays Graz Győr, Vienna Zagreb, Trieste Budapest 65 km Mid-East Transdanubian Region Capital
KIGALI CITY, RWANDA MODERNIZATION OF TRANSPORT INFRASTRUCTURE AND SERVICES. Presentation to ITC, UTwente Enschede 13 June 2018
 KIGALI CITY, RWANDA MODERNIZATION OF TRANSPORT INFRASTRUCTURE AND SERVICES Presentation to ITC, UTwente Enschede 13 June 2018 Dr. Eng. Alphonse NKURUNZIZA City Engineer, City of Kigali Kigali City Projected
Bike sharing in 10 European countries report. Module 7: Poland
 Working Document Number: D 2.4 Work package: Bike sharing in 10 European countries report. Module 7: Poland WP2 Date of Preparation: 29.11.2010 Author(s): Magdalena Kowalewska, Rafał Ejsmont Editor(s):
Progetto P.A.S.T.A Physical activity through sustainable transport approaches. Incentivare il cambiamento comportamentale nella mobilità
 Progetto P.A.S.T.A Physical activity through sustainable transport approaches Incentivare il cambiamento comportamentale nella mobilità The role of the Mobility Agency The Agency manages the bus service
Bikesharing in. Barcelona
 Bikesharing in Barcelona 01 THE EVOLUTION OF TRANSPORT MODEL FOR INDIVIDUALS USING BICYCLES 2 THE EVOLUTION OF TRANSPORT MODEL FOR INDIVIDUALS USING BICYCLES 80 s-90 s Private motorized vehicle as a the
Seoul Transportation. March Urban Transportation Division Seoul Metropolitan Government
 Seoul Transportation March 2016 Urban Transportation Division Seoul Metropolitan Government Conte nts Ⅰ. Pa st & Now 3 Ⅱ. Vision 1 5 Ⅲ. Imple me nta tion 1 9 Ⅰ. Pa st & Now 1. Pa st & Now Seoul transportation
Congestion Management in Singapore. Assoc Prof Anthony TH CHIN Department of Economics National University of Singapore
 Congestion Management in Singapore Assoc Prof Anthony TH CHIN Department of Economics National University of Singapore anthonychin@nus.edu.sg Introduction 2 Introduction and What is Traffic Congestion?
Parking space management and the promotion of energy-efficient transport modes. Tomasz Zwolinski City of Krakow
 Parking space management and the promotion of energy-efficient transport modes Tomasz Zwolinski City of Krakow Berlin, 22nd September 2015 City of Krakow area: 327 km² ~760 000 inhabitants ~150 000 students
Extracting Maximum Benefit from Parking Policy - 10 Years Experience in Perth, Australia. By Emmerson Richardson Sinclair Knight Merz
 Extracting Maximum Benefit from Parking Policy - 10 Years Experience in Perth, Australia By Emmerson Richardson Sinclair Knight Merz Snapshot of Perth > Metropolitan Area Population 1.7 million > 3.5 million
CIVITAS WEBINAR Bikes on buses in Madeira. Claudio Mantero 30 th of November 2015
 CIVITAS WEBINAR Bikes on buses in Madeira Claudio Mantero 30 th of November 2015 Funchal Madeira Portugal Total area (km 2 ) 76 801 92.090 Total inhabitants (thousands) Population density (inhab./km 2
Road Traffic Signs in Germany
 Warning signs Road Traffic Signs in Germany General danger Curve left Curve right Double curve Double curve Accident hazard Sliding danger Winter sports along road Soft shoulder Rough road edge Steep upgrade
21.07 TRANSPORT CONNECTIVITY AND INFRASTRUCTURE
 21.07 TRANSPORT CONNECTIVITY AND INFRASTRUCTURE 21.07-1 Connectivity and Choice Transport connectivity and mode choice are critical to achieving productive, sustainable and socially just cities. Travel
Improving Mobility Without Building More Lanes
 Improving Mobility Without Building More Lanes By Mike Salisbury and Will Toor July 2017 Copyright 2017 by Southwest Energy Efficiency Project. All rights reserved. Photo: Courtesy of the Denver Post Anyone
SUMP in Emilia Romagna Region and the national level»
 Local Public Transport and Sustainable Mobility Department SUMP in Emilia Romagna Region and the national level» Andrea Normanno Eleonora Tu SUMP in Europe: best practices and multi-level governance The
Long Term Strategies to reduce car dependency
 5 th European Conference on Sustainable Urban Mobility Plans 14-15 MAY 2018 NICOSIA, CYPRUS Long Term Strategies to reduce car dependency The Nicosia Integrated Mobility Master Plan Michael Lambrinos Ministry
University of Victoria Campus Cycling Plan Terms of Reference. 1.0 Project Description
 University of Victoria Campus Cycling Plan Terms of Reference 1.0 Project Description The Campus Cycling Plan, a first for the University, will provide a comprehensive and coordinated approach to support
New metro line in Turin: an analysis of the impacts on road traffic accidents and local mobility
 New metro line in Turin: an analysis of the impacts on road traffic accidents and local mobility 6th July 2015 Session: Thinking Mobility - Well Being, Awareness & Technology Selene Bianco 1, G. Melis
UNIT V 1. What are the traffic management measures? [N/D-13] 2. What is Transportation System Management (TSM)? [N/D-14]
![UNIT V 1. What are the traffic management measures? [N/D-13] 2. What is Transportation System Management (TSM)? [N/D-14]](/thumbs/87/95571671.jpg "UNIT V 1. What are the traffic management measures? [N/D-13] 2. What is Transportation System Management (TSM)? [N/D-14]") UNIT V 1. What are the traffic management measures? [N/D-13] Some of the well-known traffic management measures are: a) Restrictions on turning movements b) One - way streets c) Tidal - flow operations
UNIT V 1. What are the traffic management measures? [N/D-13] Some of the well-known traffic management measures are: a) Restrictions on turning movements b) One - way streets c) Tidal - flow operations
NORTH YORK CENTRE Mobility Hub Profile
 Mobility Hub Profile Dundas North York West-Bloor Centre Anchor Hub Gateway Hub N MOBILITY HUBS: Places of connectivity between regional and rapid transit services, where different modes of transportation
How To Encourage More Efficient Transportation in Brazilian Cities
 How To Encourage More Efficient Transportation in Brazilian Cities Todd Litman Victoria Transport Policy Institute Presented Seminar on Discouraging The Use Of Cars São Paulo, Brazil 3 September 2013 Creating
Performance Criteria for 2035 Long Range Transportation Plan
 Minimizing Impacts on Natural, Historic, Cultural or Archeological Resources 2035 LRTP Weighting Factor: 7% Objective 1.1: Use appropriate planning and design criteria to protect and enhance the built
DUNDAS WEST-BLOOR Mobility Hub Profile
 Mobility Hub Profile Dundas West-Bloor Anchor Hub Gateway Hub N MOBILITY HUBS: Places of connectivity between regional and rapid transit services, where different modes of transportation come together
Public Transport as a Necessity for Active Transport
 03.05.2017 Seite 1 Public Transport as a Necessity for Active Transport Manfred Breithaupt Urban Transport Consultant to GIZ Active Transport requires an attractive Public Transport System and its Integration
Innovation in bikes & MaaS
 Innovation in bikes & MaaS Stefanie de Hair TNO Raymond Gense Next Urban Mobility Stefanie.dehair@tno.nl Raymond.gense@next-mobility.nl 15 June 2017 STATEMENT 1 In the city of the future the bike will
mobile Bicycle promotion as part of transport and city planning
 mobile2020 11.09.2013 Bicycle promotion as part of transport and city planning Introduction IBC In the last decade a new paradigm on cities and urban transport is developing. New trends on accessibility
Transportation Master Plan Advisory Task Force
 Transportation Master Plan Advisory Task Force Network Alternatives & Phasing Strategy February 2016 BACKGROUND Table of Contents BACKGROUND Purpose & Introduction 2 Linking the TMP to Key Council Approved
Low Emission Zones as a Tool of Local Low-Carbon Mobility Policy - Case of Sárvár Hungary
 Low Emission Zones as a Tool of Local Low-Carbon Mobility Policy - Case of Sárvár Hungary Dr. Mihály Lados Martin Dan Pannon Business Network Association IX. Kongress Mobilności Aktywne European Solidarity
A MULTI-MODAL PUBLIC TRANSPORT SOLUTION FOR MALE, MALDIVES
 A MULTI-MODAL PUBLIC TRANSPORT SOLUTION FOR MALE, MALDIVES 11 TH CONFERENCE ON COMPETITION AND OWNERSHIP IN LAND PASSENGER TRANSPORT Delft University of Technology (The Netherlands) 20-25 September 2009
SUMP, TOD, BRT, Bike and Pedestrian
 Belo Horizonte: perspectives of Sustainable SUMP, TOD, BRT, Bike and Pedestrian Marcelo Cintra do Amaral Coordinator of Sustainable Policies - BHTRANS On the Move! Transport Strategies for a Low Carbon
OLDER PEOPLE INDEPENDENT MOBILITY FOR LIVEABLE COMMUNITIES. Christopher G B (Kit) Mitchell
 Mitchell") OLDER PEOPLE INDEPENDENT MOBILITY FOR LIVEABLE COMMUNITIES by Christopher G B (Kit) Mitchell Independent mobility is necessary for a high quality of adult life In developed countries, the automobile has
OLDER PEOPLE INDEPENDENT MOBILITY FOR LIVEABLE COMMUNITIES by Christopher G B (Kit) Mitchell Independent mobility is necessary for a high quality of adult life In developed countries, the automobile has
EXISTING CONDITIONS OF AND SOLUTIONS FOR THE DEVELOPMENT OF SUSTAINABLE URBAN TRANSPORT IN SOME MAJOR CITIES OF
 EXISTING CONDITIONS OF AND SOLUTIONS FOR THE DEVELOPMENT OF SUSTAINABLE URBAN TRANSPORT IN SOME MAJOR CITIES OF PhD. Phạm Hoài Chung Transport Development & Strategy Institute - TDSI Ministry of Transport
The VRUITS project: ITS applications for VRUs. Johan Scholliers, VTT
 The VRUITS project: ITS applications for VRUs Johan Scholliers, VTT Project Background ITS systems have facilitated the decrease of fatalities in the EU. ITS development has mainly been vehicle-centric
Cairo Traffic Congestion Study Phase 1
 Cairo Traffic Congestion Study Phase 1 Final Report November 2010 This report was prepared by ECORYS Nederland BV and SETS Lebanon for the World Bank and the Government of Egypt, with funding provided
Progetto P.A.S.T.A REGIO-MOB. Analisi delle buone pratiche di mobilità sostenibile
 Progetto P.A.S.T.A REGIO-MOB Analisi delle buone pratiche di mobilità sostenibile The role of the Mobility Agency The Agency manages the bus service contracts performed by ATAC, the PT Operator in charge
Municipality of Sofia Traffic Master Plan. Intelligent Transport Systems Strategy Andrew Walsh
 Municipality of Sofia Traffic Master Plan Intelligent Transport Systems Strategy Andrew Walsh Introduction Presentation to describe an ITS Strategy for Sofia developed as part of the Sofia Traffic Master
1LMR_ENG.jpg. Intelligent Transport Systems for urban development
 1LMR_ENG.jpg Intelligent Transport Systems for urban development AGENDA Key tasks for Transport development Integration of transport planning with Urban planning Improvement of Public transport Services
Cycling in the Netherlands The City and the region Utrecht
 Cycling in the Netherlands The City and the region Utrecht 8-5-2006 1 The ultimate European lesson? I think we need to make people aware that our traffic concepts of today are not sustainable and will
No-car lanes in Tyneside results from modelling and stakeholder analysis
 No-car lanes in Tyneside results from modelling and stakeholder analysis Dr Corinne Mulley, Newcastle University Dr Jessica Anderson, JMP Consulting Vilnius, September 2007 Belfast Brighton Glasgow Leeds
Travel Patterns and Characteristics
 DRAFT 2006 Transportation Fact Book SECTION 4 Travel Patterns and Characteristics 43 2006 Transportation Fact Book DRAFT 44 DRAFT 2006 Transportation Fact Book Why do we conduct travel surveys? The main
Inspiration toolkit. Toulouse: key facts EUROCITIES members Cities in action: grasping Berlin - shaping Berlin... 4
 Inspiration toolkit Mobility forum Innovative mobility for better urban spaces 16-18 October 2017, Toulouse Table of Contents Toulouse: key facts... 2 EUROCITIES members... 4 Cities in action: grasping
Project Development & Environment (PD&E) Study. November 17, SR 90 (SW 8th Street and SW 7th Street) SW 8 th Street/SW 7 th Street PD&E Study 1
 Study. November 17, SR 90 (SW 8th Street and SW 7th Street) SW 8 th Street/SW 7 th Street PD&E Study 1") Financial Management Number: 432639-6-22-01 Federal Aid Project Number: 0202-054-P Efficient Transportation Decision Making Number: 14230 Project Development & Environment (PD&E) Study SR 90 (SW 8th Street
Financial Management Number: 432639-6-22-01 Federal Aid Project Number: 0202-054-P Efficient Transportation Decision Making Number: 14230 Project Development & Environment (PD&E) Study SR 90 (SW 8th Street
June 2015 REGIONAL TRANSPORTATION SNAPSHOT
 June 2015 REGIONAL TRANSPORTATION SNAPSHOT THE REGION Who are we? The Greater Toronto and Hamilton Area (GTHA), consisting of Durham Region, Halton Region, the City of Hamilton, Peel Region, the City of
Presentation to the City of Ottawa Transit Commission. February 20, 2013
 Presentation to the City of Ottawa Transit Commission February 20, 2013 Background 1994: Comprehensive development plan for road networks and public transit(sto, MTQ,NCCandCUO) 1994: Commuter train study
BURGAS INTEGRATED PUBLIC TRANSPORT PROJECT. Information day, 5 th July 2011, Burgas
 BURGAS INTEGRATED PUBLIC TRANSPORT PROJECT Information day, 5 th July 2011, Burgas BRT TECHNICAL DESIGN TENDER Preliminary tender specifications and requirements Overview 1 Burgas BRT concept 2 Main outputs
City Deal: Call for Evidence
 CambridgePPF Approach: Opportunity for everyone in Greater Cambridge area to benefit from a better transport system Provision of choice how to travel, whether to own a car, how children get to school etc
Bike Routes Assessment: 95 Ave, 106 St & 40 Ave. Replace with appropriate image in View > Master.
 Bike Routes Assessment: 95 Ave, 106 St & 40 Ave Replace with appropriate image in View > Master. Transportation Committee October 15, 2014 City Council Direction What we are trying to achieve The Way Ahead:
Ajax: The Road to Complete Streets
 Ajax: The Road to Complete Streets Hubert Ng, Senior Transportation Planner Elysia Leung, Transportation Demand Management Coordinator Complete Streets Forum October 1, 2015 Overview 1 2 Introduction to
Can PRT overcome the conflicts between public transport and cycling?
 Can PRT overcome the conflicts between public transport and cycling? J. Meggs, F. Rupi, J. Schweizer Università di Bologna - DICAM Abstract Personal Rapid Transit (PRT) offers exceptional service characteristics,
BICYCLE PARKING IN RESIDENTIAL AREAS
 Infrastructure Give Cycling a Push INFRASTRUCTURE/ PARKING BICYCLE PARKING IN RESIDENTIAL AREAS Overview In residential areas, all residents should have safe overnight storage for a bicycle. This is crucial
Toronto Complete Streets Guidelines
 88 90 5.1 Cycling Design Principles 92 5.2 Context-sensitive Cycling Facilities 96 5.3 Key Cycling Elements Cycling infrastructure provides choice in how people are able to move around the city. Cyclists
Attractive, Sustainable and Healthy Mobility
 Attractive, Sustainable and Healthy Mobility Transport Policy in Berlin THE PEP 2011 SYMPOSIUM Genéve, 16 th November 2011 Burkhard Horn Senate Department for Urban Development, Berlin Overview 1. What
Safer Cycling: How the City of Vancouver is Proactively Improving Cycling Safety
 Safer Cycling: How the City of Vancouver is Proactively Improving Cycling Safety Brian Patterson, MCIP, RPP Urban Systems 2015 Canadian Association of Road Safety Professionals (CARSP) Conference Session