ARDMORE SEWAGE SCHEME MARINE OUTFALL SURVEY REPORT
|
|
|
- Bryce Hood
- 5 years ago
- Views:
Transcription
1 Document Ref.: 845/1/2001 ARDMORE SEWAGE SCHEME MARINE OUTFALL SURVEY REPORT Submitted to:- E. G. Pettit & Co. Limited, Consulting Engineers, Blackrock Road, Cork. Prepared by:- Irish Hydrodata Limited, Rathmacullig West, Ballygarvan, Co. Cork. Tel (021) Fax (021) th July 2001 Rev 10 th November 2003 EPA Export :02:19:39
2 Ardmore Sewerage Scheme - Marine Survey Report, July 2001(Rev Nov 03) CONTENTS Section Content Page 1. Introduction 2. Oceanographic Characteristics of Area 3. Field Survey Methodologies 4. Survey Results 5. Modelling Methods 6. Simulation of Discharges 7. Conclusions Appendix A - Model Output Plots EPA Export :02:19:39
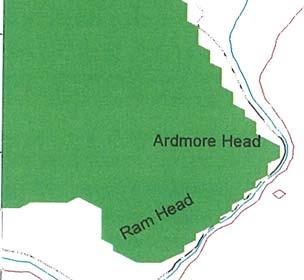
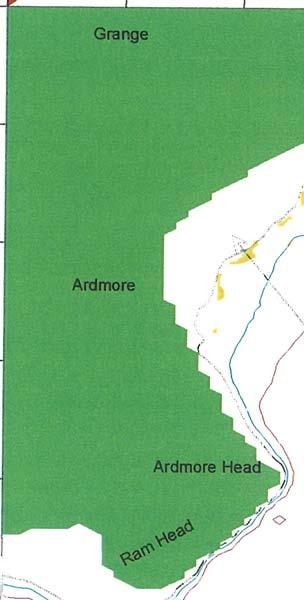
3 Ardmore Sewerage Scheme - Marine Survey Report, July 2001(Rev Nov 03) 1. INTRODUCTION 1.1 BACKGROUND TO STUDY This report presents the findings of marine survey studies conducted to assess the effects of a treated effluent discharge from the town of Ardmore to the sea. At present, partially treated municipal wastes discharge to the sea near the pier on the southern shoreline of the bay. Marine studies were conducted over a wide area as no preferred outfall route was identified prior to surveys commencing. The surveys locations and works were chosen to maximise information that could subsequently be used in assessing potential outfall locations. 1.2 STUDY BRIEF The objectives of the study as defined by E.G.Pettit & Co. was: - to make an assessment of the bacteriological effects of treated municipal waste water discharges to the sea for a number of outfall locations; - to select the most appropriate outfall location; The brief called for various scenarios to be focused on, particularly those relating to the summer season with onshore sea breezes. The study area was to include both Ardmore and Curragh bathing beaches to the south and north of the Black Rock. The legislatory requirements of the Urban Waste Water Treatment Directive and the Bathing Water Directive and the voluntary requirements of the Blue Flag Scheme were to be considered in making the assessment. 1.3 SUMMARY OF STUDY WORKS Following a full review of available data and bearing in mind the objectives of the brief the following study works were undertaken: - various field measurements in Ardmore Bay; - a two dimensional flow model was set-up for the sea area stretching from Ram 1 EPA Export :02:19:39
4 Ardmore Sewerage Scheme - Marine Survey Report, July 2001(Rev Nov 03) Head to Mine Head, a distance of approximately 12km. The model extended 5km offshore and was used to simulate water circulation; - a two dimensional dispersion model of the sea area outlined above was used to compare the impacts of discharges from various outfall points; The results of these works are described in the following sections of the report. 2 EPA Export :02:19:39
5 Ardmore Sewerage Scheme - Marine Survey Report, July 2001(Rev Nov 03) 2. OCEANOGRAPHIC CHARACTERISTICS OF AREA 2.1 BATHYMETRY AND TOPOGRAPHY The town of Ardmore is situated some kilometres west of Dungarvan and rates as a significant urban centre on the southern seaboard of Ireland. The coast is exposed to the Celtic Sea and the shoreline is fringed by lowland, lying mostly within 15 metres of sea level and carrying a mantle of drift material. Sandy bathing beaches are present adjacent to the town. For this study information relating to water depths and general bathymetric features of the area were obtained from Admiralty Chart No These were supplemented by bathymetric surveys conducted during the course of the study. 2.2 TIDES AND WATER LEVEL CHANGES Astronomical Tides The tidal regime off the south coast is almost purely semidiurnal with two high waters (HW) and two low waters (LW) each day (24 hours). Limited data is available in the Admiralty Tide Tables (ATT, ref:2) while accurate predictions are available for the nearest standard port of Cobh. Data recorded during the 2001 study provides additional information on the tidal patterns in the area. The main features are summarised in Table 2.1. (Note: Chart Datum -2.5m Malin Datum) LEVEL Malin Head Chart Datum Mean High Water Spring (MHWS) Mean High Water Neap (MHWN) Mean Low Water Neap (MLWN) Mean Low Water Spring (MLWS) Table Tidal statistics (m) relative to Malin Head and Chart Datum. Storm Surges Storm surge refers to the rise in water levels above expected tidally induced values due to the action of wind stress and atmospheric pressure on the water surface. In the absence of any site specific data recourse was made to results obtained from the Institute of Oceanographic Sciences (UK) Continental Shelf storm surge model. This predicts the 50-year storm surge elevation for the sea area off Ardmore to be about +0.75m (ref: 6). 3 EPA Export :02:19:39
6 Ardmore Sewerage Scheme - Marine Survey Report, July 2001(Rev Nov 03) 2.3 COASTAL TIDAL STREAMS AND CURRENTS The general circulation patterns of the Celtic Sea have been well documented (ref:1,5) through the years. Admiralty charts and tidal atlases provide a more specific indication of the current patterns. The tidal currents generally run parallel to the coast. Speeds are relatively low reaching maximum values of about 1.0 knots (.5m/s) during spring tides. 2.4 COASTAL WIND CLIMATE Met Eireann s network of coastal stations comprise a total of 8 sites at which reliable measurements of wind speed and direction have been collected over varying periods between 1940-to date. The coastal station closest to Ardmore is the one at Roches Point (40km). Information from this site (ref: 11) has been used to establish the likely wind patterns at Ardmore relevant to the study. During the bathing season (June-August) the onshore wind distribution will generally be as shown in Table 2.2a. The frequency of occurrence of moderate breezes (Force 4, 11 knots) from these directions (indicated as T, bearing from true North) are given in Table 2.2b while the occurrence of moderate to strong breezes (Force 5+, 17 knots) are given in Table 2.2c. SECTORS ( o T) June July August % 4.7% 6.0% % 7.1% 7.7% % 11.8% 11.6% Totals % 23.60% 25.30% Table 2.2a - Percentage occurrence of onshore winds (all speeds) for the months June-August. (Data: Roches Point Airport, , ref:11). SECTORS ( o T) June July August % 1.7% 2.1% % 1.3% 1.8% % 3.6% 4.4% Totals % 6.60% 8.30% Table 2.2b - Percentage occurrence of onshore winds greater than 11knots (5.5m/s) for the months June-August. (Data: Roches Point, , ref:11). SECTORS ( o T) June July August % 0.2% 0.3% % 0.1% 0.4% % 1.2% 1.4% Totals % 1.50% 2.10% Table 2.2c - Percentage occurrence of onshore winds greater than 17knots (8.5m/s) for the months June-August. (Data: Roches Point, , ref:11). 4 EPA Export :02:19:39
7 Ardmore Sewerage Scheme - Marine Survey Report, July 2001(Rev Nov 03) 3. FIELD STUDIES METHODOLOGY Various survey measurements were made in accordance with the specification prepared by the consulting engineers. The various operations are summarised briefly below. 3.1 Drogue Tracking Cruciform shaped drogues were released from various locations adjacent to the shoreline on two dates to establish the general water movements during spring and neap tides. These drogues were set to track the water mass at depths of 0.5m, 3.5m and 6m below the water surface. 3.2 Dye Releases The effects of the proposed discharges were simulated by discharging Rhodamine WT tracer dye at different locations on five occasions. The dye was diluted with water to provide a patch that would mix readily with the surrounding waters in the manner of municipal effluent. The volume of dye released varied from 200ml to 2000ml depending on the location. For one of the releases dye was discharged continuously for a 12h period at a rate of 5 ml/minute. 3.3 Current Metering Doppler current meter profiling was conducted at three transects over a 12h period on a spring tide to establish circulation patterns in the bay. Along each transect speed and direction data was recorded at approx. 2 second intervals. In the vertical data was recorded in 0.5m depth bins. 3.4 Anemometer. Wind speed and direction data was recorded at hourly intervals during each days field measurement using a hand held Deuta anemometer. 3.5 Recording Current Meter & Tide Gauge Recording tide and current instruments were deployed at offshore locations adjacent to the Black Rock for a period of 17 days. 3.6 Echo Sounding Detailed echo sounding surveys were conducted off Ardmore beach and Curragh beach. Depth data were reduced to Chart Datum ( -2.5m Malin Head). 5 EPA Export :02:19:39
8 Ardmore Sewerage Scheme - Marine Survey Report, July 2001(Rev Nov 03) 3.7 Horizontal Control The survey vessel was positioned by differential GPS with corrections taken from the nearest IALA transmitter. All positions are in Irish National Grid to an accuracy of +/- 1m. 3.8 Vertical Control All tidal heights and water depths are referenced to a TBM established on the northern end of the old pier. This was levelled in from Ordnance Survey benchmarks in the town. 3.9 Survey Activities The field works were conducted at various times during the months of May, June and July EPA Export :02:19:39
9 Ardmore Sewerage Scheme - Marine Survey Report, July 2001(Rev Nov 03) 4. SURVEY RESULTS 4.1 DROGUE TRACKING Drogue Tracking No.1-24/5/2001 This high water drogue release took place along a line extending out from the rocky headland to the north of Ardmore Beach. The line is approx 400m due south of the Black Rock which separates Ardmore Beach from Curragh Beach. Six drogues were released. Their sails were set to track at depths of 0.5, 3 and 6m below the surface. Weather conditions on the day were good with light winds from the southeast direction. Tidal conditions corresponded to a spring tide. As the tide ebbed the drogues followed a south-south westerly trajectory. The surface drogues were deflected to the west by the southeasterly winds. Over the duration of the ebb typical drogue excursions were approx. 1km. At low water a number of drogues were recovered and re-released at differing locations. All were tracked for the flooding tide and were recovered at high water having travelled distances of up to 1km. (Figure 4.1). Drogue Tracking No.2-19/6/2001 This drogue release took place along the same line as adopted for release number 1. Weather conditions on the day were initially good with light winds from the southeast direction early in the morning. However, as the day progressed the wind speeds increased to a moderate southerly Force 4. Tidal conditions corresponded to an average tide. The release commenced approx. 3 hours after high water on an ebbing tide. The surface drogues tracked to the northeast against the expected tidal flow direction, probably the result of wind induced surface water circulations or drogue drag, while the deeper drogues travelled to the south for a short period. (Figure 4.2). All drogues were recovered at local low water and re-released at the original drop points. The drogues moved rapidly to the northeast and were recovered as they approached the northern shoreline of the bay, 3 hours later, having travelled distances of approx. 1.6km. 7 EPA Export :02:19:39
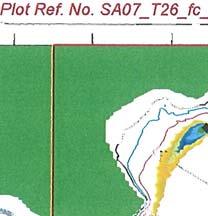
10 Ardmore Sewerage Scheme - Marine Survey Report, July 2001(Rev Nov 03) The drogues were re-released two more times over the duration of the tide and followed similar trajectories. 4.2 DYE TRACKING Dye Release No. 1-25/5/2001 This dye release took place at a distance of 300m from the shoreline, adjacent to Black Rock, during spring tides. Weather conditions on the day were good with moderate westerly winds that calmed later in the day. Two litres of Rhodamine dye were released on the sea surface. After release the patch moved steadily to the south (Figure 4.3). Five hours later, when the tide changed, the patch had expanded to a length of approx. 800m and was lying to the west of Ram Head. Dye Release No. 2 - Route 1-25/5/2001 This dye release took place at a distance of 300m to the east of Ardmore Point. Two litres of Rhodamine dye were again released on the sea surface. Winds were a moderate Force 4 from the south-south west. After release the patch moved steadily to the north-east (Figure 4.4) and away from Ardmore Bay. Tracking was discontinued after 4 hours when the winds increased to Force 5. Dye Release No. 3-13/7/2001 This dye release took place at a point adjacent to the southern shoreline approximately 200m from the high water mark. Weather conditions on the day were good with a light southerly wind (Force 1). One litre of Rhodamine dye was released on the sea surface. After release the patch remained relatively stationary for a long period of time, elongating in an east-west direction parallel to the shoreline. The patch moved eastwards around Ardmore Head as the tide changed. (Figure 4.5). Dye Release No. 4-13/7/2001 This dye release took place from a point in the centre of the bay at approx local low water. Winds were initially calm but later increased to a light Force 1-2 from the northwest. 8 EPA Export :02:19:40
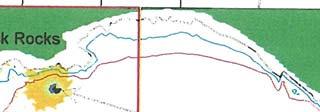
11 Ardmore Sewerage Scheme - Marine Survey Report, July 2001(Rev Nov 03) After release the patch moved towards the north and adjacent to a tide line. The patch then began to elongate very rapidly in an north-easterly direction as it was sheared by the current. At approx HW-3 hours the patch, which at this time had extended over a wide area, began to move in a southerly direction (Figure 4.6). Dye Release No. 5 20/6/2001 This continuous dye release took place 300m to the southeast of the shoreline adjacent to the Black Rock during average tides. Weather conditions on the day were good with light winds in the forenoon giving way to moderate to fresh westerly winds by evening. Initially the plume travelled in a southeasterly direction on the ebbing tide (Figure 4.7). Later in the day as slack water approached and the ebb commenced the plume rotated in a clockwise direction, sweeping around to the west. As the flood strengthened, the plume adopted a northeasterly track away from the shoreline. 4.3 TIDE & CURRENT MEASUREMENTS A bottom mounted tide gauge was deployed approx 100m off the Black Rock for 17 days. It recorded water levels at 20-minute intervals. These were corrected for atmospheric pressure fluctuations and reduced to Chart datum. A time series plot of the data is presented in Figure 4.8. A recording current meter was deployed approx 200m of the Black Rock in 6m of water. It operated for 1 day after which impact with an unknown body damaged the unit and resulted in invalid readings for the remainder of the deployment. Acoustic doppler current profiling was conducted along the transects shown in Figure 4.9 during spring tides of 23/5/2001. Current speed and direction data were recorded at approx. 5 m intervals in the horizontal and 0.5m intervals in the vertical every hour. Depth averaged information has been extracted from this data for various locations and time series produced. 4.4 ECHO SOUNDING Echo sounding was conducted over a wide area off Ardmore as indicated in Figure 4.10, to establish the bathymetry and identify any unusual seabed features. The seabed depths are generally in keeping with those indicated on the admiralty chart for the area. 9 EPA Export :02:19:40
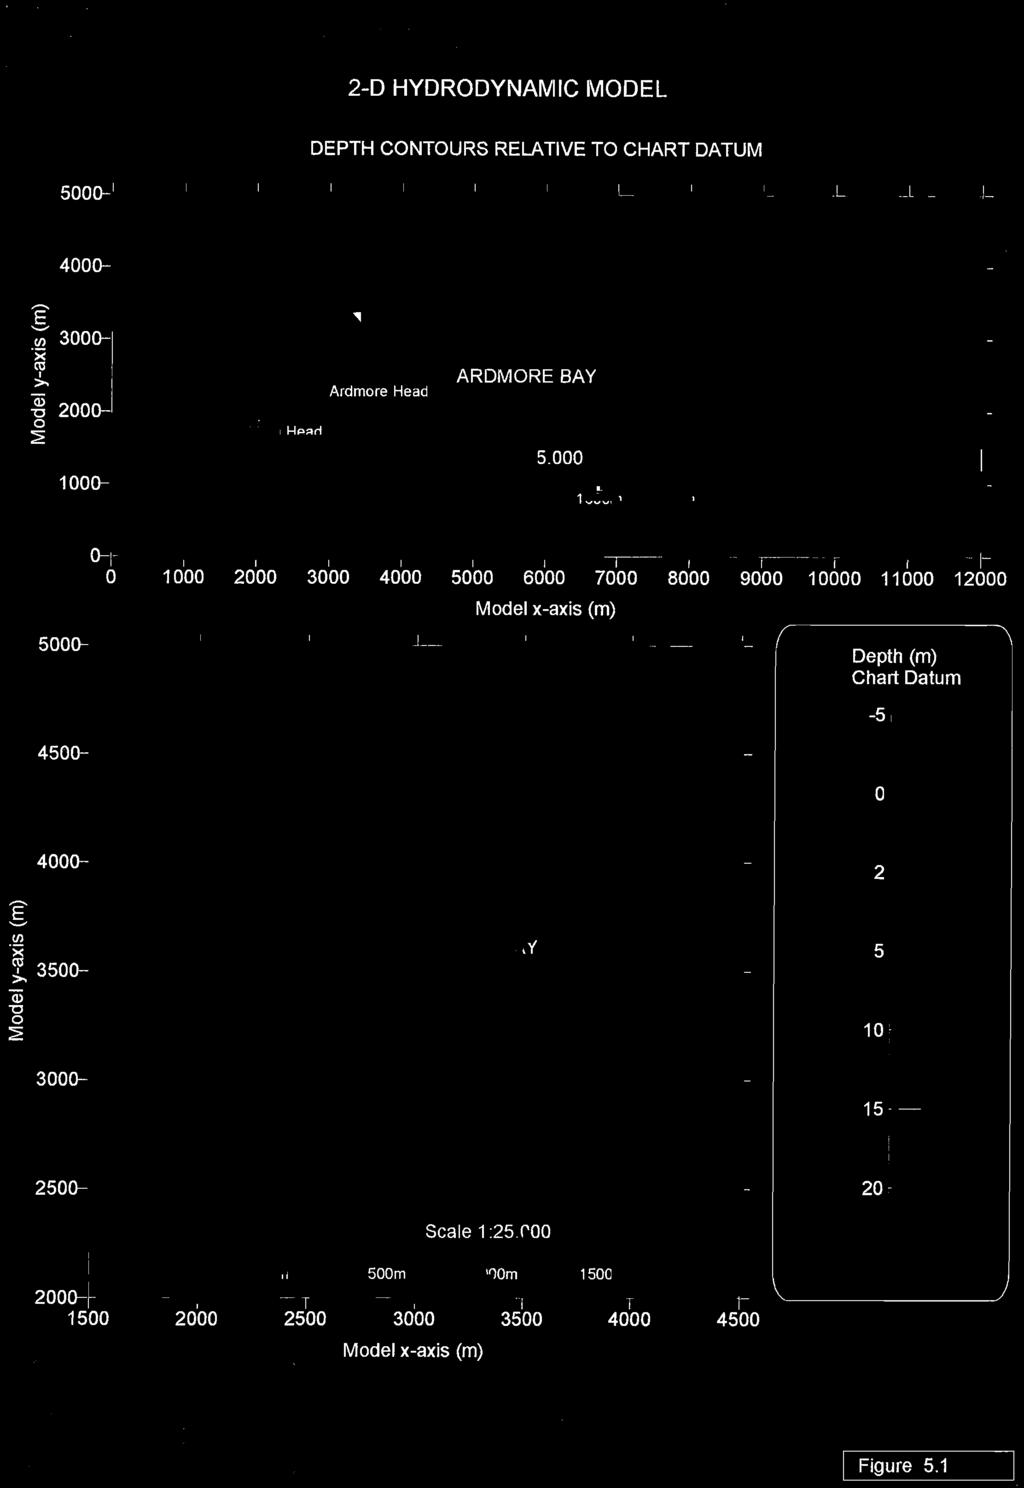
12 Ardmore Sewerage Scheme - Marine Survey Report, July 2001(Rev Nov 03) 5 PREDICTIVE MODEL OF WATER QUALITY 5.1 REQUIREMENTS The main requirements of the models were that they should be site-specific and capable of incorporating real bathymetry, topography and tidal variations. The modelling approaches adopted were: (i) a two-dimensional flow field model (ii) a two-dimensional effluent dispersion model. 5.2 OVERVIEW OF MODELLING APPROACH AND METHODS A two dimensional depth averaged flow model (M2D, ref:10) was used to simulate the tidal circulation in the study area and provide an half hourly flow pattern for both the spring and neap tidal cycles. The effects of wind were included in terms of enhanced horizontal mixing along the axis of the wind vector. The model used for predicting the effluent dispersion patterns (TRACK, ref: 9) is based on the concept of particle tracking. With this technique, the continuum of dispersed contaminant is simulated by a cloud of discrete particles. The model operates on the same grid as that employed in the flow model D - FLOW MODEL Model Framework In the 2D coastal circulation model the bathymetry was defined on a rectangular grid with cells of horizontal dimension 25m x 50m. The model extended for 242 grid cells east-west (12km) and 200 grid cells north south (5km) with Ardmore Bay towards the west of the model area. (Figure 5.1). The large model area was necessary to ensure that numerical boundary effects did not adversely impact the predicted flows in the Ardmore Bay region. Current Analysis Method The computer model (M2D) was used to determine the current flow patterns based on the bathymetric grid described above. The model is based on a finite difference solution of the equations of motion of fluid flow and incorporates non-linear effects, wind induced currents and drying bank features. Essentially the area to be modelled is divided into a large number of discrete cells that represent the shape and bathymetry of the site. Boundary conditions are then applied in the form of tidal 10 EPA Export :02:19:40
13 Ardmore Sewerage Scheme - Marine Survey Report, July 2001(Rev Nov 03) oscillations and the equations of motion solved for each cell at successive time steps. Boundary conditions were initially taken from co-tidal charts (ref:3) and other references. These indicate typical spring tidal amplitudes of approximately 3.6m and 3.7m on the western and eastern boundaries with a phase difference of about 1 o. Several model runs were then conducted for a range of boundary parameters to obtain simulations equivalent to mean neap and mean spring tides. 2 D - Flow Model Calibration The mechanics of water flow are particularly amenable to mathematical analysis by finite difference solutions as employed in M2D. Calibration of the model is achieved by comparing predicted current speeds with field measurements and adjusting model coefficients as required. The method is robust in that once bathymetry and tidal elevations are specified to a reasonable accuracy and typical model coefficients employed, good predictions will be obtained without the need for specific adjustments. A typical model output, for maximum flood and ebb on a spring tide, is presented in Figure 5.2. Highest speeds occur to the south of the area, near Ram Head while the slackest ones occur off Curragh Beach, north of the Black Rock. Figure 5.3 compares measured currents at profiling locations C and D (refer to Figure 4.9) with those predicted by the model. The main features of the flow are reproduced to an acceptable accuracy. Simulated mid-depth drogue trajectories corresponding to the spring tide release of 25/5/2001 (figure 4.1) are shown in Figures 5.4a and 5.4b. Excursions and trajectories are simulated to a good accuracy D - DISPERSION MODEL (TRACK) Model Approach Dispersion was simulated using the particle-tracking model TRACK. In the model, the discharge of effluent material is represented by a number of discrete particles. As the simulation progresses through time a series of particles are released at the outfall location. During each time step the particles are moved horizontally by the current flows. In addition to these advective steps, each particle is moved by random steps along the coordinate axes in order to simulate the effects of horizontal diffusion. The particle step length, which simulated diffusion in the models, was 11 EPA Export :02:19:40
14 Ardmore Sewerage Scheme - Marine Survey Report, July 2001(Rev Nov 03) selected randomly in the range +/- infinity according to an appropriate Gaussian probability density function. Dispersion Coefficients In shallow coastal waters dispersion results from a combination of physical mechanisms. These principally relate to the current and the manner in which it varies both vertically and laterally. The greater the 'velocity shear' the more rapid will be the dilution of the effluent. The horizontal diffusion coefficient was determined from the effective value arising from the shear dispersion. The effect of wind is to promote more rapid mixing. This was simulated by an increased diffusion coefficient. Decay The process of bacterial decay was included in the model by evaluation of the probability of decay for each particle during each time step. This was expressed as a function of T 90 where T 90 is the time for 90 percent decay. An actual decay event occurred when a random number was less than this probability. In the simulations produced for this study, the decay time was defined to be 12 hours and so the results achieved equilibrium within 10% after one tide and within 1% after two tides. Model Simulations The simulations made by the model were of 24.8 hours duration (two tides) using a time step of 10 minutes. Each time step 600 particles were released giving particles overall. However, due to the effects of decay (T 90 = 12 hours) there were particles remaining in the model at the end of each simulation. Wind Wind statistics from Roches Point were used to determine the wind conditions during the 'bathing' season. This data provides simultaneous occurrences of wind speed and direction in 10-degree angular sectors and 13 speed bands. Onshore winds were considered those in the sector 070 degrees to 180 degrees inclusive. The onshore wind speed which was exceeded for 8% of the time (during the bathing season) in this sector was found to be approx. 5.5m/s. (speed band knots). The higher speeds of 8.5m/s (speed band knots) is exceeded for only 2% of the time. Based on this data the wind speed corresponding to a 5% occurrence is estimated to be 7m/s. 12 EPA Export :02:19:40
15 Ardmore Sewerage Scheme - Marine Survey Report, July 2001(Rev Nov 03) Calculation of Bacterial Concentrations Concentrations of effluent were estimated by counting the number of particles in each model grid cell (25m x 50m). This produced the number of model particles in a volume of water which was determined by the horizontal cell dimensions and the water depth at that point. If the water depth exceeded 5m then the vertical dimension was set to 5m. 5.5 DISPERSION MODEL CALIBRATION Verification of the combined flow/particle track dispersion model was achieved by comparing simulated drogue tracks with field data and similarly patch releases with dye track data. Model drogues and dye patches were released and tracked in the current field. Examples of these simulations are shown in Figures 5.5 and 5.6. The agreement is good in that the excursions and patch dimensions are very similar to those recorded. 13 EPA Export :02:19:40
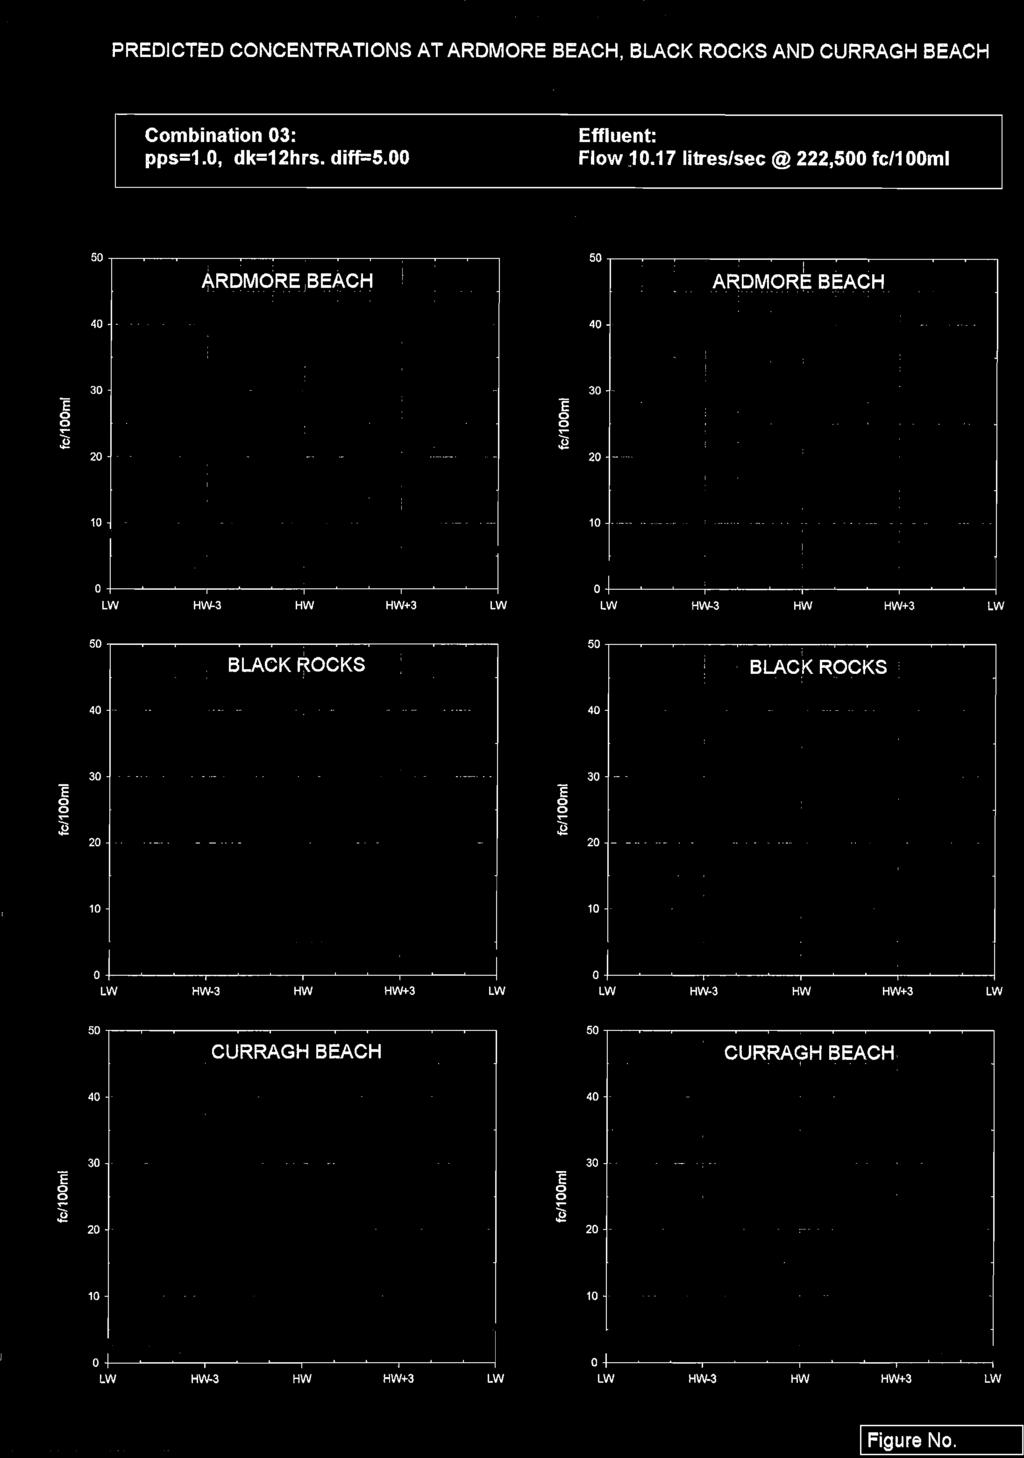
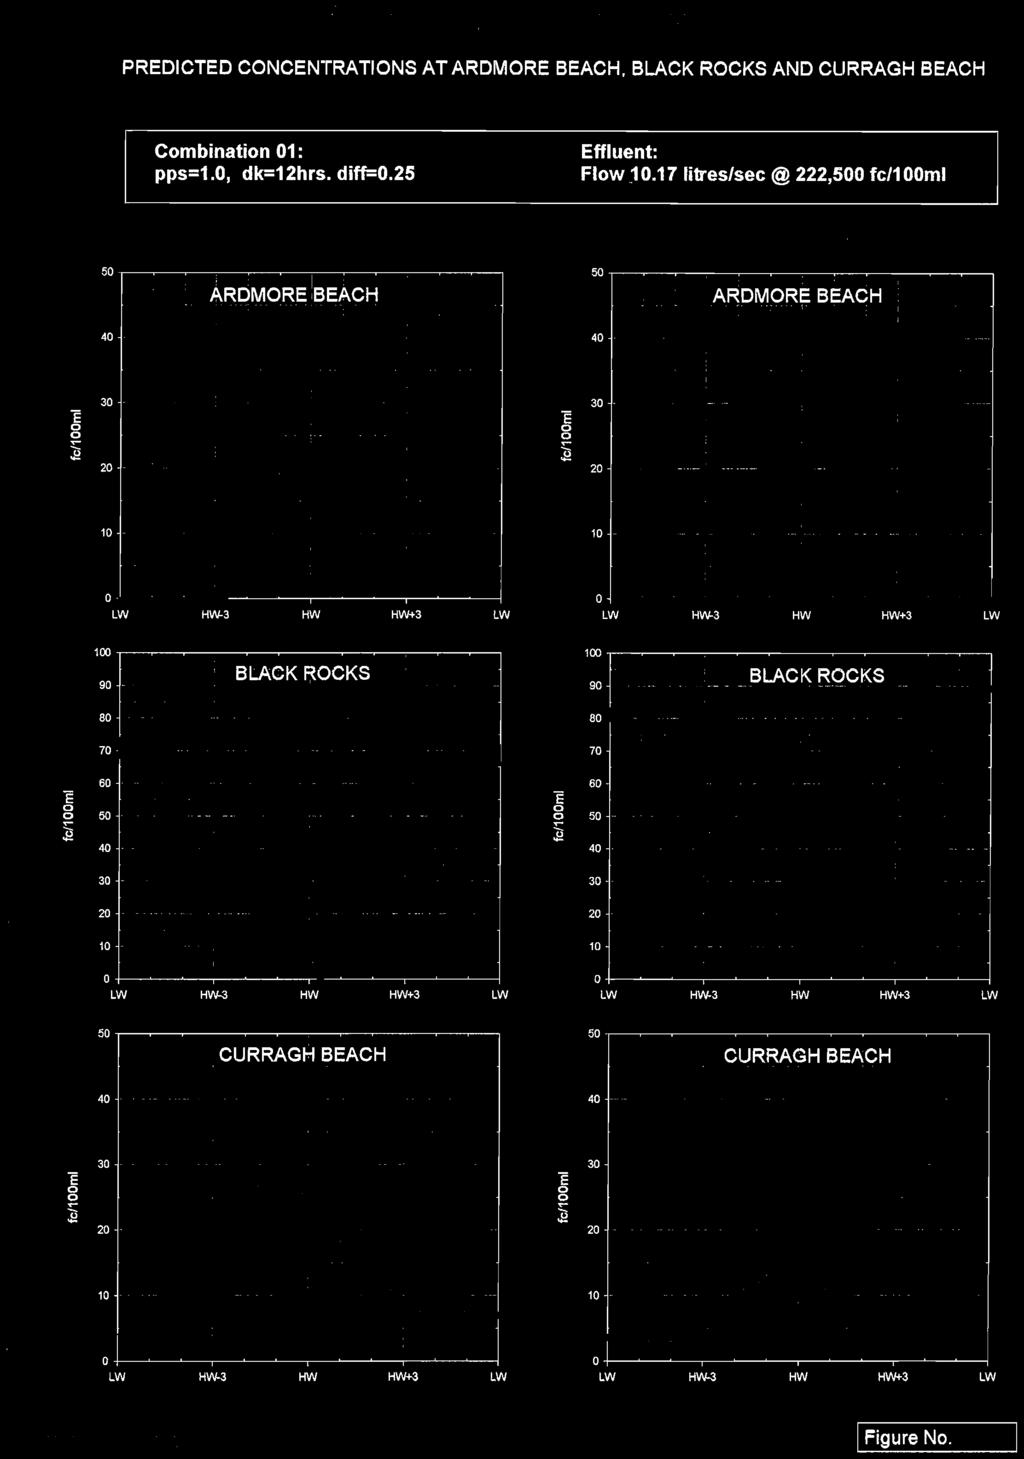
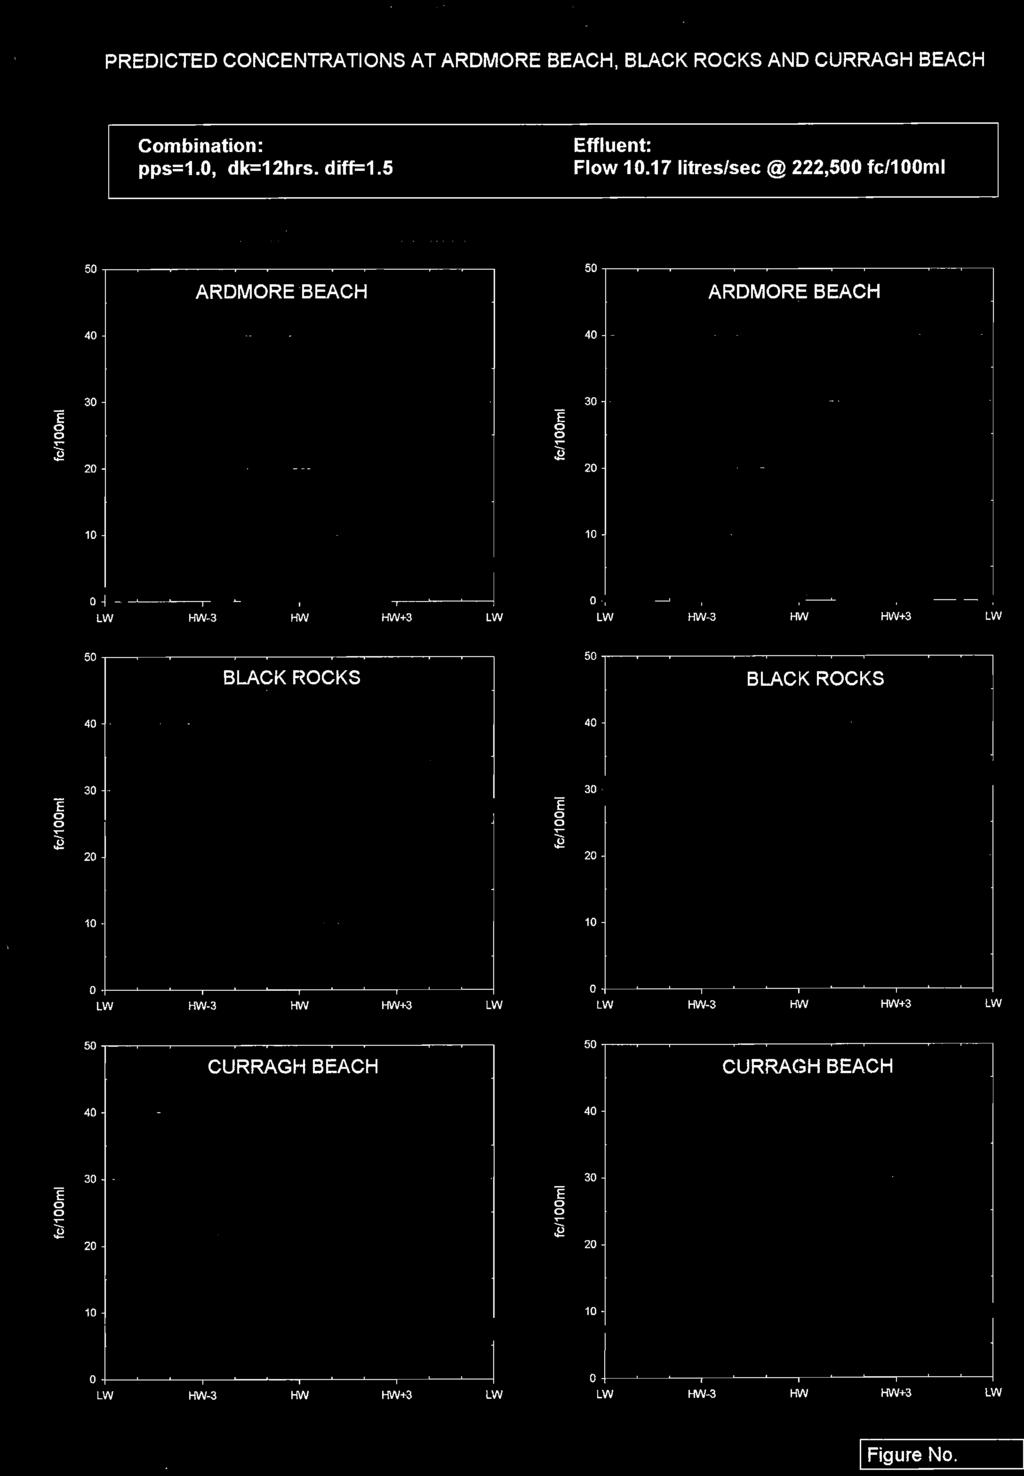
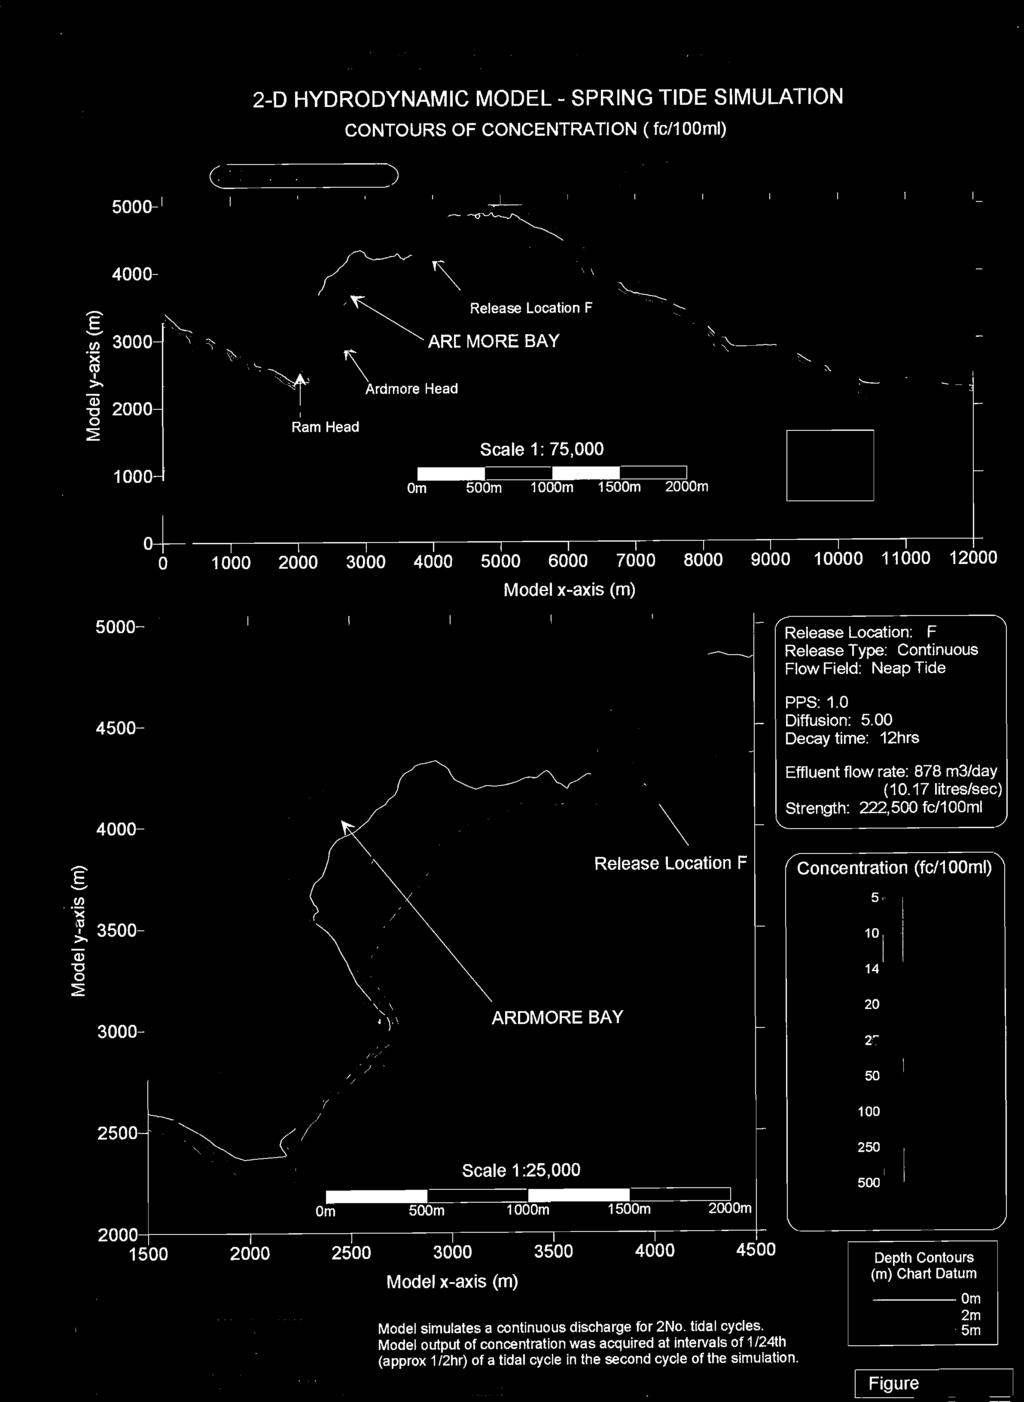
16 Ardmore Sewerage Scheme - Marine Survey Report, July 2001(Rev Nov 03) 6. SIMULATION OF EFFLUENT DISCHARGES Following evaluation of the field work data, modelling was undertaken to simulate effects of treated wastewater discharges to the bay. Six effluent release points (Figure 6.1) were chosen as being representative of wider conditions in the bay. The associated outfall parameters are listed in Table 6.1. Model simulations for each outfall location were made for spring and neap tides and various onshore wind conditions. In addition simulations were conducted for stream water discharges at points G, N and K. (Figure 6.1). Discharge Location Outfall Length from HW (m) A F J K L M Water Depth at Outer End (m Chart Datum) Table Outfall Dimensions. (Note: Chart Datum approximates to lowest tide level) 6.1 EFFLUENT CHARACTERISTICS Effluent parameters used in the simulations were: Flow Rate: Bacterial Concentration: Decay Time: litres per second; fc/100ml; T 90 = 12 hours The freshwater stream entering Ardmore Bay, adjacent to beach contains bacterial contamination. The level of contamination is variable but for the purposes of this study typical high and low values, as listed below, were adopted. Stream Flow Rate: Stream Faecal Bacterial Concentration: Decay Time: 120 litres per second; 5000 and fc/100ml; T 90 = 12 hours The decay time of 12 hours represents a conservative value, typically adopted for coastal waters. 6.2 MODEL RESULTS 14 EPA Export :02:19:40
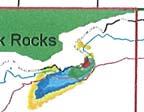
17 Ardmore Sewerage Scheme - Marine Survey Report, July 2001(Rev Nov 03) The model simulations were run for two tidal cycles and outputs generated at 0.5-hour intervals. Outputs are presented in two formats: (a) (b) contour plots of bacterial concentration; time series plots of bacterial concentration on selected shoreline sites. The contour plot output (a) shows the movement of the effluent plume as it is advected and dispersed over the tidal cycle. Only high and low waters are presented in this report (Appendix A) corresponding approximately to times of maximum flood and ebb excursion. During calm or light wind conditions the plots show that plumes remain relatively compact with clearly defined trajectories. Increasing wind speed leads to greater mixing and greater dispersion of the plume. Simulations of dispersion corresponding to onshore wind conditions of 7m/s and 10m/s are presented. While the contour plot output (a) provides a good indication of the plume s impact on the shoreline it is possible to miss worst-case situations unless each output time (24 per simulation) is examined. Therefore, the time series plot output (b) is provided as a more rigorous method of comparing the impacts of differing discharge locations. The output represents the average plume bacterial concentration where it enters a shoreline strip and is derived from all model output times. The chosen shoreline strip locations are indicated in Figure 6.2 and are representative of Ardmore Beach, the Black Rock and Curragh Beach. Time series output plots for each strip are included in Appendix A with a summary of predicted bacterial concentrations extracted from these in Tables 6.2 to 6.4. During calm conditions all outfall locations are predicted to ensure compliance with Blue Flag requirements (<100fc/100ml) on the bathing beaches at Ardmore and Curragh. Onshore wind (7m/s) simulations indicate that the discharge locations are also satisfactory under these conditions. (Location J was not modelled for a 7m/s wind as this is a longer outfall than those at locations A and M and assumed to produce better results). A F J K L M Ardmore Beach 1 4 < Black Rock Curragh Beach < Table Predicted Faecal Coliform Concentration fc/100ml for Calm Conditions. A F J K L M Ardmore Beach Black Rock EPA Export :02:19:40
18 Ardmore Sewerage Scheme - Marine Survey Report, July 2001(Rev Nov 03). Curragh Beach Table Predicted Faecal Coliform Concentration fc/100ml. for Onshore Wind - 7m/s (5% ile). A F J K L M Ardmore Beach Black Rock Curragh Beach Table Predicted Faecal Coliform Concentration fc/100ml. for Onshore Wind - 10m/s ( 2% ile). The impact of the freshwater stream can be significant as it discharges in the immediate proximity of bathing waters. In a worst case scenario bacterial levels in the stream plume may approach source levels (5000 to 50000fc/100ml). Results from model simulations of the discharges are presented in Table 6.5. These indicate peak calm weather values of 250fc/100ml for a source concentration of 5000 fc./100ml. (Note that the model averages over a 25m x 50m cell). Onshore wind promotes increased mixing reducing the bacterial levels accordingly. Location Length from HWM Calm Wind 7m/s Wind 10m/s Stream Stream Stream <5 <5 Table Predicted Faecal Coliform Concentration (fc/100ml.) on Ardmore Bathing Beach resulting from the freshwater stream with a bacterial concentration of 5000 fc/100ml. 16 EPA Export :02:19:40
19 Ardmore Sewerage Scheme - Marine Survey Report, July 2001(Rev Nov 03) 7. CLOSURE 7.1 This report presents the findings of a marine study of the proposed treated wastewater discharges from the town of Ardmore. This study assesses the dispersive characteristics of the bay and makes recommendations for siting the outfall so as to ensure that local bathing beaches will maintain Blue Flag status. 7.2 The general oceanography of the region is typical of open coastal sites. The tidal currents flow parallel to the shoreline, sweeping in to the bay, with peak speeds in excess of 0.25m/s. Dispersion characteristics are good as shown by dye and drogue data. Tidal ranges in the area are approx. 3.7m on springs and 1.8m on neaps. 7.3 A two-dimensional flow model together with a particle track dispersion model was used to simulate the discharges. Recorded data from current meter, drogue and dye releases were used for calibration and validation purposes. Results in the form of graphical plots were prepared for 24 separate simulations. These are presented in Appendix A. 7.4 The impacts of proposed discharges on bathing water quality at three shoreline strip locations are summarised in Tables 7.1 and 7.2. These data are maximum values and have been extracted from the detailed data in Appendix A. Discharge Location Ardmore Beach Black Rock Headland A 1 11 <1 F J <1 0 0 Curragh Beach K L M Table Predicted Maximum Average Coliform levels (fc/100ml) at Selected Shoreline Locations for calm conditions. Discharge Ardmore Beach Black Rock Curragh Beach Location Headland A F J K L M Table Predicted Maximum Average Coliform levels (fc/100ml) at Selected Shoreline Locations for onshore wind conditions (5% ile). 7.5 The model results show that for the level of treatment provided any of the locations modelled will provide sufficient dilution to ensure bacterial levels on the bathing beaches remain within Blue Flag limits. 17 EPA Export :02:19:40
20 Ardmore Sewerage Scheme - Marine Survey Report, July 2001(Rev Nov 03) 7.6 The freshwater stream flowing onto the south western corner of Ardmore Beach (model location G) represents a significant source of bacterial contamination on the beach. The impact of this will depend on the bacterial concentration in the stream waters and flow rate at the particular time. For the characteristics adopted (120 litres/sec and 5000 fc/100ml) the model predicts calm weather bacterial levels on Ardmore Beach to be 250 fc/100ml. 18 EPA Export :02:19:40
21 Ardmore Sewerage Scheme - Marine Survey Report, July 2001(Rev Nov 03) REFERENCES & BIBLIOGRAPHY 1. Admiralty, 1968, Irish Coasts Pilot. The Hydrographer of the Navy, London. 2. Admiralty, 2001, Admiralty Tide Tables. The Hydrographer of the Navy, Taunton. 3. Admiralty, 1980, Chart 5058, Co-tidal and Co-range Lines for the British Isles and adjacent waters. 4. Admiralty, 1979, Chart 12049, Old Head of Kinsale to Tuskar Rock. 5. Admiralty, 1974 Tidal Stream Atlas for the Celtic Sea, NP Department of Energy, 1990, Offshore Installations: Guidance on Design, Construction and Certification. HMSO. 7. EC, 1976, (76/160/EEC), Council Directive of 8 December 1975 on the quality of bathing water. 8. EC, 1991, (91/271/EEC), Council Directive of 21st May 1991 concerning municipal wastewater treatment. 9. Hunter, J.R., 1986, The Application of Lagrangian Particle-Tracking Techniques to Modelling of Dispersion in the Sea, In: Numerical Modelling - Applications to Marine Systems (Ed. J. Noye), North- Holland. 10. Hunter, J.R., 1987, User manual for numerical hydrodynamic models of marine systems and associated plotting package, Centre for Marine Science and Technology, Curtin University of Technology, Report C Meteorological Service, Meteorological data for coastal station at Roches Point 19 EPA Export :02:19:40


22 EPA Export :02:19:40


23 EPA Export :02:19:40


24 EPA Export :02:19:40


25 EPA Export :02:19:40


26 EPA Export :02:19:40
27 EPA Export :02:19:40


28 EPA Export :02:19:41


29 EPA Export :02:19:41


30 EPA Export :02:19:41


31 EPA Export :02:19:41


32 EPA Export :02:19:41


33 EPA Export :02:19:41


34 EPA Export :02:19:41


35 EPA Export :02:19:41


36 EPA Export :02:19:41


37 EPA Export :02:19:41


38 EPA Export :02:19:41
39 EPA Export :02:19:41
40 EPA Export :02:19:41


41 EPA Export :02:19:41


42 EPA Export :02:19:41


43 EPA Export :02:19:41


44 EPA Export :02:19:41
45 EPA Export :02:19:41


46 EPA Export :02:19:42


47 EPA Export :02:19:42


48 EPA Export :02:19:42


49 EPA Export :02:19:42
50 EPA Export :02:19:42


51 EPA Export :02:19:42


52 EPA Export :02:19:42


53 EPA Export :02:19:42


54 EPA Export :02:19:42
55 EPA Export :02:19:42
56 EPA Export :02:19:42


57 EPA Export :02:19:42


58 EPA Export :02:19:42


59 EPA Export :02:19:42


60 EPA Export :02:19:42
61 EPA Export :02:19:42


62 EPA Export :02:19:42


63 EPA Export :02:19:42


64 EPA Export :02:19:43


65 EPA Export :02:19:43
66 EPA Export :02:19:43


67 EPA Export :02:19:43


68 EPA Export :02:19:43


69 EPA Export :02:19:43


70 EPA Export :02:19:43
Currents measurements in the coast of Montevideo, Uruguay
 Currents measurements in the coast of Montevideo, Uruguay M. Fossati, D. Bellón, E. Lorenzo & I. Piedra-Cueva Fluid Mechanics and Environmental Engineering Institute (IMFIA), School of Engineering, Research
PROPERTIES OF NEARSHORE CURRENTS
 Terry Hendricks PROPERTIES OF NEARSHORE CURRENTS During this past year, we have initiated a program to obtain a better understanding of the properties of the currents flowing over the nearshore shelf area
Sconser Quarry, Caol Mor
 Sconser Quarry, Caol Mor AUTODEPOMOD MODELLIN G REPORT 4.2017 Registered in Scotland No. 138843 Registered Office, 1st Floor, Admiralty Park, Admiralty Road, Rosyth, FIFE, KY11 2YW Marine Harvest ( Scotland)
MAY0 COUNTY COUNCIL W.ESTPORT MARINE SURVEY
 MAY0 COUNTY COUNCIL W.ESTPORT MARINE SURVEY VOLUME 1 HYDRODYNAMIC & WATER QUALITY MODELLINQ Tolaphano 0232 667914 Fwlmlk a=z 668288 Morton PREFACE,*.--. -- - -I Kirk McClure Morton, in conjunction with
SURFACE CURRENTS AND TIDES
 NAME SURFACE CURRENTS AND TIDES I. Origin of surface currents Surface currents arise due to the interaction of the prevailing wis a the ocean surface. Hence the surface wi pattern (Figure 1) plays a key
HYDROGRAPHIC AND SITE SURVEY REPORT
 HYDROGRAPHIC AND SITE SURVEY REPORT Proposed Pen Site at Dounie, Sound of Jura Prepared for: Kames Fish Farming Ltd Kilmelford Argyll PA34 4XA Tel: +44 (0)1631 720699 TransTech Limited www.transtechltd.com
Bagh Dail nan Ceann ( BDNC) Salmon Farm, Loch Shuna
 Salmon Farm, Loch Shuna") Bagh Dail nan Ceann ( BDNC) Salmon Farm, Loch Shuna AUTODEPOMOD MODELLIN G REPORT 09. 2016V1 REPORT WRITTEN BY ENVIRONMENTA L ANALYST) CHECKED BY ENVIRONMENTAL MAN AGER) Registered in Scotland No. 138843
Bagh Dail nan Ceann ( BDNC) Salmon Farm, Loch Shuna AUTODEPOMOD MODELLIN G REPORT 09. 2016V1 REPORT WRITTEN BY ENVIRONMENTA L ANALYST) CHECKED BY ENVIRONMENTAL MAN AGER) Registered in Scotland No. 138843
Tide Gauge 00,04 13, /09/90 03J9 15, /09/ /09/90 03,44 16,09 04,44 16,19 05,14 17,04
 DATE Tide Tables Tide Gauge Tide Tables Tide Gauge 30/08/90 00,lO 12,52 00,04 13,04 2.9 3.1 3.10 3.40 31/08/90 02,03 14,18 02.19 14.19 3.0 3.3 3.01 3.49 01/09/90 03,12 15,16 03J9 15,14 3.2 3.5 3.39 3.78
1 st Tidal and Water Level Working Group Meeting DHN, Niteroi, Brazil 31/03/09 02/04/09 Vertical Offshore Reference Framework (VORF) Chris Jones
 Chris Jones") 1 st Tidal and Water Level Working Group Meeting DHN, Niteroi, Brazil 31/03/09 02/04/09 Vertical Offshore Reference Framework (VORF) Chris Jones United Kingdom Hydrographic Office Presentation Structure
1 st Tidal and Water Level Working Group Meeting DHN, Niteroi, Brazil 31/03/09 02/04/09 Vertical Offshore Reference Framework (VORF) Chris Jones United Kingdom Hydrographic Office Presentation Structure
Appendix M: Durras Lake Tailwater Conditions
 Appendix M: Durras Lake Tailwater Conditions M.1 Preamble WRL has completed a tailwater condition assessment for the entrance to Durras Lake, to be used as an ocean boundary condition for a future flood
ASL Environmental Sciences inc.
 A Member of the SNC LAVALIN Group ASL Environmental Sciences inc. Gros Cacouna LNG Terminal Final report Drifter tracking study 501728 December 2004 Rev. 02 ENVIRONMENT Drifter tracking study Procean
APPENDIX A Hydrodynamic Model Qualicum Beach Waterfront Master Plan
 Page 1 of 21 CLIENT: Town of Qualicum Beach PROJECT: SIGNATURE DATE CONTRIBUTORS : M. Marti Lopez REVIEWED BY : P. St-Germain, EIT APPROVED BY: J. Readshaw, P.Eng ISSUE/REVISION INDEX Issue Details Code
Chart Specifications of the IHO Publication S-4 (Formerly M-4)
") TWLWG3/4/11A Publication S-4 (Formerly M-4) Attached to this document is an extract from IHO Publication S-4 which relate to Tidal and Water Level Information. The TWLWG is requested to review this information
TWLWG3/4/11A Publication S-4 (Formerly M-4) Attached to this document is an extract from IHO Publication S-4 which relate to Tidal and Water Level Information. The TWLWG is requested to review this information
FINAL REPORT APPENDIX A. Physical Description of the Shubenacadie River
 FINAL REPORT APPENDIX A Physical Description of the Shubenacadie River Smart Solutions for Engineering, Science and Computing Physical Description of the Shubenacadie River Martec Technical Report # TR-07-12
E4014 Construction Surveying. Hydrographic Surveys
 E4014 Construction Surveying Hydrographic Surveys Charts And Maps Hydrographic Chart an information medium and a tool for maritime traffic for the safety and ease of navigation contains information on
TRIAXYS Acoustic Doppler Current Profiler Comparison Study
 TRIAXYS Acoustic Doppler Current Profiler Comparison Study By Randolph Kashino, Axys Technologies Inc. Tony Ethier, Axys Technologies Inc. Reo Phillips, Axys Technologies Inc. February 2 Figure 1. Nortek
Appendix 5: Currents in Minas Basin. (Oceans Ltd. 2009)
") Appendix 5: Currents in Minas Basin (Oceans Ltd. 29) Current in Minas Basin May 1, 28 March 29, 29 Submitted To: Minas Basin Pulp and Power P.O. Box 41 53 Prince Street Hansport, NS, BP 1P by 22, Purdy
Appendix 5: Currents in Minas Basin (Oceans Ltd. 29) Current in Minas Basin May 1, 28 March 29, 29 Submitted To: Minas Basin Pulp and Power P.O. Box 41 53 Prince Street Hansport, NS, BP 1P by 22, Purdy
Figure 4, Photo mosaic taken on February 14 about an hour before sunset near low tide.
 The Impact on Great South Bay of the Breach at Old Inlet Charles N. Flagg and Roger Flood School of Marine and Atmospheric Sciences, Stony Brook University Since the last report was issued on January 31
13. TIDES Tidal waters
 Water levels vary in tidal and non-tidal waters: sailors should be aware that the depths shown on the charts do not always represent the actual amount of water under the boat. 13.1 Tidal waters In tidal
HURRICANE SANDY LIMITED REEVALUATION REPORT UNION BEACH, NEW JERSEY DRAFT ENGINEERING APPENDIX SUB APPENDIX D SBEACH MODELING
 HURRICANE SANDY LIMITED REEVALUATION REPORT UNION BEACH, NEW JERSEY DRAFT ENGINEERING APPENDIX SUB APPENDIX D SBEACH MODELING Rev. 18 Feb 2015 1 SBEACH Modeling 1.0 Introduction Following the methodology
GNSS Technology for the Determination of Real-Time Tidal Information
 GNSS Technology for the Determination of Real-Time Tidal Information Benjamin Kidder C-Nav Positioning Solutions European region Outline of Topics Covered Introduction to Tides Past and Present Methods
Training program on Modelling: A Case study Hydro-dynamic Model of Zanzibar channel
 Training program on Modelling: A Case study Hydro-dynamic Model of Zanzibar channel Mayorga-Adame,C.G., Sanga,I.P.L., Majuto, C., Makame, M.A., Garu,M. INTRODUCTION Hydrodynamic Modeling In understanding
INTRODUCTION TO COASTAL ENGINEERING
 The University of the West Indies Organization of American States PROFESSIONAL DEVELOPMENT PROGRAMME: COASTAL INFRASTRUCTURE DESIGN, CONSTRUCTION AND MAINTENANCE A COURSE IN COASTAL DEFENSE SYSTEMS I CHAPTER
Appendix D: SWAN Wave Modelling
 Appendix D: SWAN Wave Modelling D.1 Preamble The Eurobodalla Shire Council area is subject to extreme waves originating from offshore storms. When swell waves approach the coast, they are modified by the
WOODFIBRE LNG VESSEL WAKE ASSESSMENT
 Woodfibre LNG Limited WOODFIBRE LNG VESSEL WAKE ASSESSMENT Introduction Woodfibre LNG Limited (WLNG) intends to build a new LNG export terminal at Woodfibre, Howe Sound, British Columbia. WLNG has engaged
Impact of Dredging the Lower Narrow River on Circulation and Flushing
 Impact of Dredging the Lower Narrow River on Circulation and Flushing Craig Swanson Ph.D. Swanson Environmental Alex Shaw Ocean Engineering, URI Prof. Malcolm L. Spaulding Ocean Engineering, URI 29 January
Case Studies. Georg Umgiesser and Natalja Čerkasova KU, Lithuania
 Case Studies Georg Umgiesser and Natalja Čerkasova KU, Lithuania Case 1: A beach in the Curonian Lagoon Beach Current situation in Curonian lagoon Beach in Kintai In the past, especially in Baltic inner
Measurement and simulation of the flow field around a triangular lattice meteorological mast
 Measurement and simulation of the flow field around a triangular lattice meteorological mast Matthew Stickland 1, Thomas Scanlon 1, Sylvie Fabre 1, Andrew Oldroyd 2 and Detlef Kindler 3 1. Department of
Appendix 3. Hydrodynamic and sedimentation studies
 Appendix 3 Report EX 4945 Rev 3.0 November 2004 Document Information Project Report title Client Borough of Poole Client Representative Mr Stuart Terry Project No. DDR3553 Report No. EX 4945 Doc. ref.
: Hydrodynamic input for 2D Vessel Simulations (HY- 0027)
") Technical Note To : Christian Taylor (PoHDA) From : Rohan Hudson Cc : Ben Gray Date : 1/04/2015 (Final Draft) Subject : Hydrodynamic input for 2D Vessel Simulations (HY- 0027) Introduction This Technical
Technical Note To : Christian Taylor (PoHDA) From : Rohan Hudson Cc : Ben Gray Date : 1/04/2015 (Final Draft) Subject : Hydrodynamic input for 2D Vessel Simulations (HY- 0027) Introduction This Technical
Technical Brief - Wave Uprush Analysis Island Harbour Club, Gananoque, Ontario
 Technical Brief - Wave Uprush Analysis RIGGS ENGINEERING LTD. 1240 Commissioners Road West Suite 205 London, Ontario N6K 1C7 October 31, 2014 Table of Contents Section Page Table of Contents... i List
Examples of Carter Corrected DBDB-V Applied to Acoustic Propagation Modeling
 Naval Research Laboratory Stennis Space Center, MS 39529-5004 NRL/MR/7182--08-9100 Examples of Carter Corrected DBDB-V Applied to Acoustic Propagation Modeling J. Paquin Fabre Acoustic Simulation, Measurements,
IMPACTS OF COASTAL PROTECTION STRATEGIES ON THE COASTS OF CRETE: NUMERICAL EXPERIMENTS
 IMPACTS OF COASTAL PROTECTION STRATEGIES ON THE COASTS OF CRETE: NUMERICAL EXPERIMENTS Tsanis, I.K., Saied, U.M., Valavanis V. Department of Environmental Engineering, Technical University of Crete, Chania,
Evaluation of the Klein HydroChart 3500 Interferometric Bathymetry Sonar for NOAA Sea Floor Mapping
 Evaluation of the Klein HydroChart 3500 Interferometric Bathymetry Sonar for NOAA Sea Floor Mapping Yuhui Ai, Straud Armstrong and Dean Fleury L-3 Communications Klein Associates, Inc. 11 Klein Dr. Salem,
An Atlas of Oceanic Internal Solitary Waves (February 2004) by Global Ocean Associates Prepared for Office of Naval Research Code 322 PO
 by Global Ocean Associates Prepared for Office of Naval Research Code 322 PO") Overview The is located in the North Atlantic Ocean between southern Ireland and southwest England (Figure 1). The Sea s western edge covers a continental shelf region characterized by rough and irregular
Overview The is located in the North Atlantic Ocean between southern Ireland and southwest England (Figure 1). The Sea s western edge covers a continental shelf region characterized by rough and irregular
Taranaki Tsunami Inundation Analysis. Prepared for Taranaki Civil Defence Emergency Management Group. Final Version
 Taranaki Tsunami Inundation Analysis Prepared for Taranaki Civil Defence Emergency Management Group Final Version June 2012 AM 12/07 HBRC Plan Number 4362 Asset Management Group Technical Report Prepared
Predicting the Surface Currents of Guanabara Bay Dr Andrew McCowan 1, Elise Lawry 2, Ryan Dermek 3
 Dr Andrew 1, Elise Lawry 2, Ryan Dermek 3 1 Managing Director, Water Technology Pty Ltd, Melbourne, Australia E-mail: Andrew.@watertech.com.au 2 Senior Engineer, Water Technology Pty Ltd, Melbourne, Australia
Real Time Surveying GPS and HYDRO Software for Tide and Swell Compensation
 Real Time Surveying GPS and HYDRO Software for Tide and Swell Compensation by Mr Michael Walker, B.Surv. (Otago) HYDRO Division Trimble Navigation New Zealand Ltd. Abstract This paper focuses on the use
OFFICE OF STRUCTURES MANUAL FOR HYDROLOGIC AND HYDRAULIC DESIGN CHAPTER 11 APPENDIX B TIDEROUT 2 USERS MANUAL
 OFFICE OF STRUCTURES MANUAL FOR HYDROLOGIC AND HYDRAULIC DESIGN CHAPTER 11 APPENDIX B TIDEROUT 2 USERS MANUAL APRIL 2011 APRIL 2011 Page 1 Preface TIDEROUT 2, Build 1.22 dated June 29, 2006 is the current
Oil spill drift study for NORTHER By V. Dulière and S. Legrand
 October 2011 Oil spill drift study for NORTHER By V. Dulière and S. Legrand 1. Introduction The risk for navigation accident and therefore also for oil spilled at sea increases with the installation of
Undertow - Zonation of Flow in Broken Wave Bores
 Nearshore Circulation Undertow and Rip Cells Undertow - Zonation of Flow in Broken Wave Bores In the wave breaking process, the landward transfer of water, associated with bore and surface roller decay
Technical Brief - Wave Uprush Analysis 129 South Street, Gananoque
 Technical Brief - Wave Uprush Analysis 129 South Street, Gananoque RIGGS ENGINEERING LTD. 1240 Commissioners Road West Suite 205 London, Ontario N6K 1C7 June 12, 2013 Table of Contents Section Page Table
LONG WAVES OVER THE GREAT BARRIER REEF. Eric Wolanski ABSTRACT
 LONG WAVES OVER THE GREAT BARRIER REEF by Eric Wolanski k ABSTRACT Low-frequency forcing of water currents over the continental shelf f Australia is quite strong and should be taken into account when the
STUDIES ON THE TRANQUILITY INSIDE THE GOPALPUR PORT
 STUDIES ON THE TRANQUILITY INSIDE THE GOPALPUR PORT INTRODUCTION Sundar. V 1, Sannasiraj. S. A 2 and John Ashlin. S 3 Gopalpur port is an artificial harbor located in Odisha state. The geographical location
Tidal regime along Vietnam coast under impacts of sea level rise
 VNU Journal of Science, Earth Sciences 28 (2012) 133-139 Tidal regime along Vietnam coast under impacts of sea level rise Tran Thuc, Duong Hong Son* Vietnam Institute of Meteorology, Hydrology and Environment
Tidal analysis and prediction of the flow characteristics around Abu Dhabi Island
 Tidal analysis and prediction of the flow characteristics around Abu Dhabi Island K.A. Mohamed & M.E. El-Dahshan Research Center, Abu Dhabi Water and Electricity Authority Abstract In coastal seas and
Exploring Localized Mixing Dynamics During Wet Weather in a Tidal Fresh Water System
 Exploring Localized Mixing Dynamics During Wet Weather in a Tidal Fresh Water System Ramona McCullough & Phil Duzinski Delaware Estuary Science & Environmental Summit January 27, 2015 Background and objectives
Contents. Tables and Figures. G Models for assessing the use of medicines in bath treatments
 Regulation and monitoring of marine cage fish farming in Scotland - a procedures manual G-1 of 16 G Models for assessing the use of medicines in bath treatments Contents G.1 Introduction G-2 G.2 Environmental
Appendix E Cat Island Borrow Area Analysis
 Appendix E Cat Island Borrow Area Analysis ERDC/CHL Letter Report 1 Cat Island Borrow Area Analysis Multiple borrow area configurations were considered for Cat Island restoration. Borrow area CI1 is located
Volume and Shoreline Changes along Pinellas County Beaches during Tropical Storm Debby
 Volume and Shoreline Changes along Pinellas County Beaches during Tropical Storm Debby Ping Wang and Tiffany M. Roberts Coastal Research Laboratory University of South Florida July 24, 2012 Introduction
Modelling study of the dispersal of pollutants at SHo Jacinto submarine outfall (Aveiro, Portugal)
") Modelling study of the dispersal of pollutants at SHo Jacinto submarine outfall (Aveiro, Portugal) M. Ramosl, M. Almeidal, P. Silval, J. Dubertl & J. Antunes do Carrno2 l Department of Physics, University
Modelling study of the dispersal of pollutants at SHo Jacinto submarine outfall (Aveiro, Portugal) M. Ramosl, M. Almeidal, P. Silval, J. Dubertl & J. Antunes do Carrno2 l Department of Physics, University
Bathing Water Profile - Carne (2017)
") Bathing Water Profile - Carne (2017) Bathing Water: Bathing Water Code: Local Authority: River Basin District: Monitoring Point: Carne IESEBWC050_0000_0300 Wexford County Council South Eastern 312952E,
Bathing Water Profile - Carne (2017) Bathing Water: Bathing Water Code: Local Authority: River Basin District: Monitoring Point: Carne IESEBWC050_0000_0300 Wexford County Council South Eastern 312952E,
DUXBURY WAVE MODELING STUDY
 DUXBURY WAVE MODELING STUDY 2008 Status Report Duncan M. FitzGerald Peter S. Rosen Boston University Northeaster University Boston, MA 02215 Boston, MA 02115 Submitted to: DUXBURY BEACH RESERVATION November
14/10/2013' Bathymetric Survey. egm502 seafloor mapping
 egm502 seafloor mapping lecture 10 single-beam echo-sounders Bathymetric Survey Bathymetry is the measurement of water depths - bathymetry is the underwater equivalent of terrestrial topography. A transect
COMPARISON OF DEEP-WATER ADCP AND NDBC BUOY MEASUREMENTS TO HINDCAST PARAMETERS. William R. Dally and Daniel A. Osiecki
 COMPARISON OF DEEP-WATER ADCP AND NDBC BUOY MEASUREMENTS TO HINDCAST PARAMETERS William R. Dally and Daniel A. Osiecki Surfbreak Engineering Sciences, Inc. 207 Surf Road Melbourne Beach, Florida, 32951
WAVE MECHANICS FOR OCEAN ENGINEERING
 Elsevier Oceanography Series, 64 WAVE MECHANICS FOR OCEAN ENGINEERING P. Boccotti Faculty of Engineering University of Reggio-Calabria Feo di Vito 1-89060 Reggio-Calabria Italy 2000 ELSEVIER Amsterdam
Study of Passing Ship Effects along a Bank by Delft3D-FLOW and XBeach1
 Study of Passing Ship Effects along a Bank by Delft3D-FLOW and XBeach1 Minggui Zhou 1, Dano Roelvink 2,4, Henk Verheij 3,4 and Han Ligteringen 2,3 1 School of Naval Architecture, Ocean and Civil Engineering,
Structure and discharge test cases
 Chapter 28 Structure and discharge test cases 28.1 Introduction Three test case have been implemented to test the performance and applicability of the structures and discharges modules. drythin Simulates
The Continuing Evolution of the New Inlet
 The Continuing Evolution of the New Inlet Charles N. Flagg, Roger Flood and Robert Wilson School of Marine and Atmospheric Sciences, Stony Brook University It is now a year plus since super storm Sandy
Atmosphere, Ocean and Climate Dynamics Fall 2008
 MIT OpenCourseWare http://ocw.mit.edu 12.003 Atmosphere, Ocean and Climate Dynamics Fall 2008 For information about citing these materials or our Terms of Use, visit: http://ocw.mit.edu/terms. Problem
Request Number IR1-12: Flow Passage. Information Request
 Request Number IR1-12: Flow Passage Information Request Provide additional information about the 100 metre flow passage channel scenario between the Westshore Terminals and the proposed Project terminal
OPERATIONS SEAFARER CERTIFICATION GUIDANCE NOTE SA MARITIME QUALIFICATIONS CODE. Deck: Chart Work
 Page 1 of 6 Compiled by Approved by Chief Examiner Syllabus Committee: 26 February 2013 OPERATIONS SEAFARER CERTIFICATION GUIDANCE NOTE SA MARITIME QUALIFICATIONS CODE Deck: Chart Work Page 2 of 6 COLUMN
Undertow - Zonation of Flow in Broken Wave Bores
 Lecture 22 Nearshore Circulation Undertow - Zonation of Flow in Broken Wave Bores In the wave breaking process, the landward transfer of water, associated with bore and surface roller decay within the
The events associated with the Great Tsunami of 26 December 2004 Sea Level Variation and Impact on Coastal Region of India
 The events associated with the Great Tsunami of 26 December 2004 Sea Level Variation and Impact on Coastal Region of India Satish R. Shetye National Institute of Oceanography, Goa Tsunamis are shallow-water
Available online at ScienceDirect. Procedia Engineering 116 (2015 )
") Available online at www.sciencedirect.com ScienceDirect Procedia Engineering 116 (2015 ) 320 325 8th International Conference on Asian and Pacific Coasts (APAC 2015) Department of Ocean Engineering, IIT
Available online at www.sciencedirect.com ScienceDirect Procedia Engineering 116 (2015 ) 320 325 8th International Conference on Asian and Pacific Coasts (APAC 2015) Department of Ocean Engineering, IIT
Wind Regimes 1. 1 Wind Regimes
 Wind Regimes 1 1 Wind Regimes The proper design of a wind turbine for a site requires an accurate characterization of the wind at the site where it will operate. This requires an understanding of the sources
Chapter 10 Lecture Outline. The Restless Oceans
 Chapter 10 Lecture Outline The Restless Oceans Focus Question 10.1 How does the Coriolis effect influence ocean currents? The Ocean s Surface Circulation Ocean currents Masses of water that flow from one
Poole Harbour Channel Deepening and Beneficial Use Review of Physical monitoring in Poole Harbour Technical Note 2 WITHOUT PREJUDICE
 Poole Harbour Channel Deepening and Beneficial Use Review of Physical monitoring in Poole Harbour Technical Note WITHOUT PREJUDICE. Introduction This technical note reviews the physical data that was collected
Wave-Current Interaction in Coastal Inlets and River Mouths
 DISTRIBUTION STATEMENT A. Approved for public release; distribution is unlimited. Wave-Current Interaction in Coastal Inlets and River Mouths Tim T. Janssen Department of Geosciences, San Francisco State
South Bay Coastal Ocean Observing System California Clean Beaches Initiative
 South Bay Coastal Ocean Observing System California Clean Beaches Initiative Quarterly Report September 2003 to City of Imperial Beach Eric Terrill 1 1 Scripps Institution of Oceanography, University of
SUPPLEMENTAL DOCUMENT SEA LEVEL RISE SCENARIO SELECTION AND DESIGN TIDE CALCULATION
 SUPPLEMENTAL DOCUMENT SEA LEVEL RISE SCENARIO SELECTION AND DESIGN TIDE CALCULATION FOR THE GUIDANCE FOR INCORPORATING SEA LEVEL RISE INTO CAPITAL PLANNING IN SAN FRANCISCO: ASSESSING VULNERABILITY AND
DUKC DYNAMIC UNDER KEEL CLEARANCE
 DUKC DYNAMIC UNDER KEEL CLEARANCE Information Booklet Prepared in association with Marine Services Department 10/10/2005 Dynamic Under Keel Clearance (DUKC) integrates real time measurement of tides and
Visualising seasonal-diurnal trends in wind observations
 Visualising seasonal-diurnal trends in wind observations Nicholas J. Cook Highcliffe on Sea, Dorset Introduction One of the most amazing inherent attributes of the human brain is its ability to see patterns
CROSS-SHORE SEDIMENT PROCESSES
 The University of the West Indies Organization of American States PROFESSIONAL DEVELOPMENT PROGRAMME: COASTAL INFRASTRUCTURE DESIGN, CONSTRUCTION AND MAINTENANCE A COURSE IN COASTAL DEFENSE SYSTEMS I CHAPTER
Offshore engineering science
 Offshore engineering science In this research stream theoretical models advanced geotechnical models and new numerical techniques were used in applied offshore engineering topics such as loading, design
Theory and Application Introductory Oceanography Ray Rector: Instructor
 OCEAN TIDES Theory and Application Introductory Oceanography Ray Rector: Instructor Tidal Concepts Tides are extremely swift, very long-wavelength, shallow-water waves Tides are periodic short-term changes
Tides. Tides: longest waves. or seas. or ripples
 Tides or ripples or seas Tides: longest waves Tides Definition: The rise and fall of sea level due to the gravitational forces of the Moon and Sun and the rotation of the Earth. Why tides are important?
Chapter 22, Section 1 - Ocean Currents. Section Objectives
 Chapter 22, Section 1 - Ocean Currents Section Objectives Intro Surface Currents Factors Affecting Ocean Currents Global Wind Belts (you should draw and label a diagram of the global wind belts) The Coriolis
Modeling of Oxygen Injection Experiment in Savannah Harbor
 593 Modeling of Oxygen Injection Experiment in Savannah Harbor S. Davie 1, H. Moorer 2, H. Rodriguez 1, Y. Plis 1 1 Tetra Tech, Inc., 2110 Powers Ferry Road, Suite 202, Atlanta, GA 30339, PH (770) 850-0949;
Hydrologic Feasibility of Storm Surge Barriers
 Hydrologic Feasibility of Storm Surge Barriers Malcolm J. Bowman, School of Marine and Atmospheric Sciences State University of New York, Stony Brook, NY. Presented at Against the Deluge: Storm Surge Barriers
EFFECTS OF WAVE, TIDAL CURRENT AND OCEAN CURRENT COEXISTENCE ON THE WAVE AND CURRENT PREDICTIONS IN THE TSUGARU STRAIT
 EFFECTS OF WAVE, TIDAL CURRENT AND OCEAN CURRENT COEXISTENCE ON THE WAVE AND CURRENT PREDICTIONS IN THE TSUGARU STRAIT Ayumi Saruwatari 1, Yoshihiro Yoneko 2 and Yu Tajima 3 The Tsugaru Strait between
INTERNATIONAL HYDROGRAPHIC SURVEY STANDARDS
 INTERNATIONAL HYDROGRAPHIC SURVEY STANDARDS by Gerald B. MILLS 1 I. Background The International Hydrographic Organization (IHO) traces its origin to the establishment of the International Hydrographic
TERMINALE DI RICEZIONE E RIGASSIFICAZIONE GAS NATURALE LIQUEFATTO (GNL) TARANTO STUDIO DI IMPATTO AMBIENTALE (SIA) ALLEGATO 15.2
 TARANTO STUDIO DI IMPATTO AMBIENTALE (SIA) ALLEGATO 15.2") TERMIALE DI RICEZIOE E RIGASSIFICAZIOE GAS ATURALE LIQUEFATTO (GL) TARATO STUDIO DI IMPATTO AMBIETALE (SIA) ALLEGATO 15.2 documento Foglio Rev: documento Cliente.: 03255-E&E-R-0-001 1 di 1 0 1 ALLEGATO
TERMIALE DI RICEZIOE E RIGASSIFICAZIOE GAS ATURALE LIQUEFATTO (GL) TARATO STUDIO DI IMPATTO AMBIETALE (SIA) ALLEGATO 15.2 documento Foglio Rev: documento Cliente.: 03255-E&E-R-0-001 1 di 1 0 1 ALLEGATO
Preliminary Wake Wash Impact Analysis Redwood City Ferry Terminal, Redwood City, CA
 Technical Memorandum Preliminary Wake Wash Impact Analysis Redwood City Ferry Terminal, Redwood City, CA 1. Introduction The following preliminary wake wash impact analysis was initiated by the Port of
Laboratory and Numerical Modelling Compared with Field Trials of Dilution at the Sydney Desalination Plant Outfall
 International Symposium on Outfall Systems, 2016 Organized by: IAHR-IWA Joint Committee on Marine Outfall Systems May 10 th -13 th, 2016, Ottawa, Canada Laboratory and Numerical Modelling Compared with
Prediction of Nearshore Waves and Currents: Model Sensitivity, Confidence and Assimilation
 Prediction of Nearshore Waves and Currents: Model Sensitivity, Confidence and Assimilation H. Tuba Özkan-Haller College of Oceanic and Atmospheric Sciences Oregon State University, 104 Ocean Admin Bldg
APPENDIX A APPENDIX B APPENDIX C APPENDIX D APPENDIX E APPENDIX F APPENDIX G SEDIMENT ANALYSIS APPENDIX A WAVE & SEDIMENT MODELS CRYSTAL BALL ANALYSIS
 APPENDIX A WAVE & SEDIMENT MODELS APPENDIX B SEDIMENT ANALYSIS APPENDIX A WAVE & SEDIMENT MODELS APPENDIX C CRYSTAL BALL ANALYSIS APPENDIX D SBEACH ANALYSIS APPENDIX E GENESIS ANALYSIS APPENDIX F PREFERRED
Uncertainty Estimates in Satellite Derived Bathymetry
 Uncertainty Estimates in Satellite Derived Bathymetry Richard Flemmings, TCarta #chcnsc2018 Introduction and Overview 1. TCarta 2. Satellite Derived Bathymetry Overview 3. Satellite Derived Bathymetry
Pathogen Transport in Coastal Environments: Case Studies of Urban Runoff in Southern California
 Pathogen Transport in Coastal Environments: Case Studies of Urban Runoff in Southern California A presentation to the Center for Water Sciences MSU Pathogens Workshop, April 20, 2007 Stanley B. Grant Henry
ITTC Recommended Procedures and Guidelines
 Page 1 of 6 Table of Contents 1. PURPOSE...2 2. PARAMETERS...2 2.1 General Considerations...2 3 DESCRIPTION OF PROCEDURE...2 3.1 Model Design and Construction...2 3.2 Measurements...3 3.5 Execution of
Case Studies Georg Umgiesser and Natalja Čerkasova KU, Lithuania
 Case Studies Georg Umgiesser and Natalja Čerkasova KU, Lithuania Case 1: A beach in the Curonian Lagoon 1 Beach Current situation in Curonian lagoon Beach in Kintai In the past, especially in Baltic inner
COMPARISON OF CONTEMPORANEOUS WAVE MEASUREMENTS WITH A SAAB WAVERADAR REX AND A DATAWELL DIRECTIONAL WAVERIDER BUOY
 31 Bishop Street, Jolimont Western Australia 6014 T +61 8 9387 7955 F +61 8 9387 6686 E info@rpsmetocean.com W rpsmetocean.com & rpsgroup.com.au COMPARISON OF CONTEMPORANEOUS WAVE MEASUREMENTS WITH A SAAB
Beach Wizard: Development of an Operational Nowcast, Short-Term Forecast System for Nearshore Hydrodynamics and Bathymetric Evolution
 Beach Wizard: Development of an Operational Nowcast, Short-Term Forecast System for Nearshore Hydrodynamics and Bathymetric Evolution Ad Reniers Civil Engineering and Geosciences, Delft University of Technology
April 7, Prepared for: The Caribbean Disaster Emergency Response Agency Prepared by: CEAC Solutions Co. Ltd.
 April 7, 2006 Prepared for: The Caribbean Disaster Emergency Response Agency Prepared by: Introduction CEAC Solutions Co. Ltd was commissioned in May 2005 to prepare coastal beach erosion hazard maps for
TIDES. Theory and Application
 TIDES Theory and Application Tidal Concepts Tides are extremely swift, very long-wavelength, shallow-water waves Tides are periodic short-term changes in sea level at a particular place caused by the gravitational
A Review of the Bed Roughness Variable in MIKE 21 FLOW MODEL FM, Hydrodynamic (HD) and Sediment Transport (ST) modules
 and Sediment Transport (ST) modules") A Review of the Bed Roughness Variable in MIKE 1 FLOW MODEL FM, Hydrodynamic (HD) and Sediment Transport (ST) modules by David Lambkin, University of Southampton, UK 1 Bed roughness is considered a primary
A Review of the Bed Roughness Variable in MIKE 1 FLOW MODEL FM, Hydrodynamic (HD) and Sediment Transport (ST) modules by David Lambkin, University of Southampton, UK 1 Bed roughness is considered a primary
The Impact on Great South Bay of the Breach at Old Inlet Charles N. Flagg School of Marine and Atmospheric Sciences, Stony Brook University
 The Impact on Great South Bay of the Breach at Old Inlet Charles N. Flagg School of Marine and Atmospheric Sciences, Stony Brook University The previous report provided a detailed look at the conditions
ICES Guidelines for Multibeam Echosounder Data (Compiled September 2006)
") ICES Guidelines for Multibeam Echosounder Data (Compiled September 2006) If you are considering producing a hydrographic survey please read the following information first. Your survey could be used to
ICES Guidelines for Multibeam Echosounder Data (Compiled September 2006) If you are considering producing a hydrographic survey please read the following information first. Your survey could be used to
2. Water levels and wave conditions. 2.1 Introduction
 18 2. Water levels and wave conditions 2.1 Introduction This Overtopping Manual has a focus on the aspects of wave run-up and wave overtopping only. It is not a design manual, giving the whole design process
7.4 Temperature, Salinity and Currents in Jamaica Bay
 7.4 Temperature, Salinity and Currents in Jamaica Bay Arnold Gordon, Bruce Huber and Robert Houghton 7.4.1 INTRODUCTION Jamaica Bay stratification is weakly indicative of a shallow, tidally active environment,