Validation of QuikSCAT wind vectors by dropwindsonde data from DOTSTAR. Department of Atmospheric Sciences, Chinese Culture University, Taipei, Taiwan
|
|
|
- Colleen Mosley
- 6 years ago
- Views:
Transcription
1 Validation of QuikSCAT wind vectors by dropwindsonde data from DOTSTAR Kun-Hsuan Chou Department of Atmospheric Sciences, Chinese Culture University, Taipei, Taiwan Chun-Chieh Wu*, Po-Hsiung Lin Department of Atmospheric Sciences, National Taiwan University, Taipei, Taiwan Sharanya Majumdar RSMAS Division of Meteorology and Physical Oceanography, University of Miami Kun-Hsuan Chou, Department of Atmospheric Sciences, Chinese Culture University, 55, Hwa- Kang Road, Yang-Ming-Shan, Taipei 111, Taiwan. *Chun-Chieh Wu (Corresponding author), Department of Atmospheric Sciences, National Taiwan University, Taiwan. Po-Hsiung Lin, Department of Atmospheric Sciences, National Taiwan University, Taiwan. Sharanya J. Majumdar, Rosenstiel School of Marine and Atmospheric Science, University of Miami, Miami, FL 33149, USA.
2 Abstract The accuracy of 10-meter wind vectors derived from the QuikSCAT satellite near tropical cyclones is validated against soundings from 457 GPS dropwindsondes deployed by DOTSTAR (Dropwindsonde Observations for Typhoon Surveillance near the Taiwan Region) during To maximize the database, the surface to 40-m wind speed in the dropwindsondes is averaged and interpolated to the 10-m wind speed by linear regression. After removing rain-flagged data, the root-mean-squared differences between QuikSCAT and dropwindsonde data were 2.6 m s -1 or 18% (wind speed) and 17 (wind direction) based on 896 matching samples. Further analyses also indicate that the QuikSCAT data slightly underestimates the wind speed of medium wind regime (between 10 and 17.2 m s -1 ) and possesses some clockwise directional bias in the high wind regime (above 17.2 m s -1 ). In summary, this study suggests that the QuikSCAT wind vectors below tropical storm wind strength (17.2 m s -1 ) are accurate enough for forecasters to determine the critical wind radius of 34-kt wind, while a new error bound of the QuikSCAT wind estimate in high-wind regimes near tropical cyclones is suggested to be set at about 4 m s -1.
3 Introduction Given the paucity of routine in-situ wind observations at the ocean surface with wide spatial coverage, ocean surface vector winds measured by spaceborne scatterometers have become tremendously useful for marine analysis and forecasting (Atlas et al. 2001, Chelton et al. 2006). The leading example to date has been SeaWinds on board NASA s Quick Scatterometer (QuikSCAT), which was launched in Via backscatter values sampled from two microwave pencil-beams, values of 10-meter wind speed and direction at every point in a 1800-km wide swath are derived at 25 km resolution, subject to a sufficient lack of contamination of the beam by heavy rain (Huddleston and Stiles 2000). These wind fields derived from QuikSCAT have proven to be important to NOAA s Ocean Prediction Center in the issuance of marine warnings, and specifically their ability to consistently observe or infer the intensity and areal extent of winds of hurricane force (32.9 ms -1 ) in extratropical cyclones and marine weather over the open ocean (Von Ahn et al. 2006). Additionally, the utility of assimilating QuikSCAT data into global numerical weather prediction models has been demonstrated by Atlas et al. (2001). Several studies have been performed to evaluate the accuracy of scatterometer winds against surface buoy data. Freilich and Dunbar (1999) compared winds from NSCAT, the predecessor to QuikSCAT, with those measured by 43 buoys offshore of the eastern and western United States. They found the root-mean-squared (rms) differences in wind speed and direction to be 1.3 m s -1 and 17 respectively. In a comparison between QuikSCAT winds and nearshore and offshore buoy data, Pickett et al. (2003) showed that the wind differences nearshore were larger than those offshore, with the rms differences in wind speed and direction decreasing from 1.3 ms -1 and 26 nearshore to 1.0 ms -1 and 15 offshore. These values are similar to those obtained by Ebuchi et al. (2002), who found that the rms differences between QuikSCAT and offshore buoy data were 1.0 m s -1 and 20.
4 These previous studies demonstrated that the rms differences between scatterometer and buoy data lied within the satellite s design specifications for wind speed (±2 m s -1 ) and close to that for direction (±20 ) (Pickett et al. 2003). Though studies such as the above have demonstrated the accuracy of winds derived from QuikSCAT in a variety of applications, their accuracy in heavily precipitating regimes such as tropical cyclones (TCs) is severely compromised due to the contamination of backscatter. Mindful of this reservation, tropical analysts and forecasters routinely use QuikSCAT data in their 45 preparation of surface wind analyses in the environment of TCs (Brennan et al. 2009). For example, the U.S. National Hurricane Center regularly prepares manual analyses of directional ambiguities to detect whether a closed surface circulation exists in a developing TC, and their Tropical Analysis and Forecast Branch uses QuikSCAT data to issue wind warnings associated with fronts, cyclones, and gap wind events. However, the effects of rain, resolution and signal saturation severely limit the ability of operational forecasters to determine the wind speed of the TC. An additional operational use of the QuikSCAT data, most relevant to this paper, is the detection of the radius of tropical storm force winds (17.2 m s -1 ), which is important both for wind warnings and for classification of whether a TC has reached tropical storm strength. While Brennan et al. (2009) have stated that wind radii information from QuikSCAT is particularly valuable for TCs not sampled for aircraft reconnaissance, the comparisons between scatterometer winds and in-situ data in the environment of the TC are rare. The first study of scatterometer observations and validation by in-situ observations over TCs was accomplished by SEASAT-A Satellite Scatterometer (SASS) for use in determination of TC gale force wind radii in Hawkins and Black (1983) and Black et al. (1985). They first investigated the SASS wind statistics near the storm center by fifty matching samples of SASS derived wind speeds with surface truth values. The rms error of non-rain
5 contaminated wind was 0.8 m s -1 for wind speed and 11 for wind direction, and rms error of rain contaminated wind indicated larger errors of 1.6 m s -1 and It is worth noting that the wind speeds in the storm areas are often considerably stronger than those in the aforementioned papers on QuikSCAT data comparison, and there is the additional risk of rain contamination from rainbands. In this paper, we perform a comparison between QuikSCAT winds and equivalent wind observations from the Global Positioning System (GPS) dropwindsonde, for TCs over the northwest 67 Pacific Ocean. The tropospheric soundings obtained from DOTSTAR (Dropwindsonde Observations for Typhoon Surveillance near the Taiwan Region) surveillance aircraft missions provide a unique dataset for the validation and calibration of remotely sensed data for TCs in this region (Wu et al. 2005; 2007a,b; Chou and Wu 2008). An improved characterization of the accuracy of QuikSCAT winds in the environment of TCs would lead to better operational analyses of tropical storm force winds, higher quality reanalysis fields used routinely in TC research, and improved initial conditions in forecast models that yield better forecasts of TC track and intensity. The results will also serve to provide a benchmark upon which data from future generations of scatterometers are expected to improve, in the environment of TCs. In Section 2, we review the data and techniques used to increase the size and quality of the sample. Results for different wind regimes are provided in Section 3, followed by a discussion and conclusions in Sections 4 and 5 respectively Data a. QuikSCAT The QuikSCAT data used for this study are taken from the observations archived at Remote Sensing Systems ( The 13.4 GHz Ku-band scatterometer transmits
6 two microwave pencil-beam pulses with slightly different angles of incidence, which are scanned in a circle about the nadir. The backscattered power from ocean surface capillary waves is then converted into wind vectors at 10 meters height, assuming a neutrally stable atmosphere (Liu and Tang 1996). The wind data have been retrieved by the Ku-2001 model function, which is a distant relative of the NSCAT-1 model function developed for NSCAT (Wentz and Smith 1999). In addition to the geophysical model function, their wind data processing uses contemporaneous microwave radiometer measurements by three Special Sensor Microwave Imagers and the Tropical Rainfall Measuring Mission Microwave Imager for rain flagging and sea ice detection. For further details of the QuikSCAT platform and wind retrieval techniques, the reader is referred to Hoffman and Leidner (2005). Rain is a well-known problem affecting the Ku-band scatterometers, and it tends to result in erroneous cross track vectors and/or unrealistically high speeds. Recently, a simple wind/rain backscatter model is used with co-located precipitation radar data to evaluate the effect of rain on QuikSCAT scatterometers by Draper and Long (2004). Using the wind/rain model, there is a threshold where wind speeds are high enough that rain impacts are negligible regardless of rain rate, and accurate retrievals can be made. Furthermore, a model for the effects of rain on scatterometer-derived winds has been proposed by Hilburn et al. (2006). This model accounts for contamination, rain roughening of the sea surface, and volumetric backscatter. The error statistics of the rain-contaminated QuikSCAT data as verified against the nearby dropwindsonde data is also investigated and will be discussed in section 3. b. GPS dropwindsonde The NCAR (National Center for Atmospheric Research) GPS (Global Positioning System) dropwindsonde provided the first set of reliable wind measurements with abundant high-wind
7 records near the sea surface. The dropwindsonde has four main components: the pressure, temperature, humidity sensor module; the digital microprocessor circuitry; the GPS receiver module; and the 400-MHz transmitter. With a sampling rate of 2 Hz and a near-surface fall rate of m s -1, the vertical resolution of both the wind and thermodynamic observations from the dropwindsonde in the lower troposphere is approximately 5 m. The estimated typical measurement errors in the wind speed are m s -1 (Hock and Franklin 1999). The dataset used for the validation in this study consists of 457 dropwindsonde atmospheric sounding profiles obtained during the seasons, during the 28 observation missions for typhoons in DOTSTAR. Of the 457 profiles, most are deployed within km from the center of the typhoon. The quality control of all dropwindsonde data are performed through the Aspen (Atmospheric Sounding Processing Environment) system originally designed by NCAR. The splash location of dropwindsonde is used for the validation in this study c. Definition of M40 the average wind between the surface and 40 m Although the GPS dropwindsonde has a sampling interval of 0.5 s, not all the dropwindsondes directly measure the 10-m wind (U 10 ). In the dataset used in this study, only 178 (39%) of the dropwindsondes recorded U 10. Thus, in order to obtain a larger sampling database, the surface to 40-m averaged wind speed (M40) is calculated and interpolated to U 10 by a regression fit that we describe here. The M40 is calculated if at least one valid wind between 0-40 m is available. As shown in Fig. 1a, the calculation indicates that 357 dropwindsondes (78% of all dropwindsondes) are available for the M40 calculation, where the averaged sampling layers is 4.4 and the maximum sampling layers is 8. The rms difference between each sample point and M40 for all 1581 samples is only 0.6 m s -1 (or roughly 5%), which means that the dropwindsonde measurements are quite stable when falling from 40-m to the surface (Fig. 1a). The scatter diagram between the M40 and
8 U 10 (Fig. 1b) indicates that the values of M40 matches very well with U 10. The corresponding best-fit regression line between the M40 and U 10 values is given by U M M , with the correlation coefficient square (R 2 ) of 0.996, where U 10-M40 is the estimated 10-m wind based on the 357 GPS dropwindsondes. For the 178 dropwindsondes that directly measured U 10, the rms difference in wind speed (direction) between U10 M 40 and U 10 is only 0.3 m s -1 (1.4 ) (Figure 1c). The regression fits between the U 10 and the averaged marine boundary-layer wind (MBL, surface to 500-m averaged wind; Franklin et al. 2003) and between U 10 and surface to 150-m averaged wind (M150) are also conducted in this study. It should be noted that the M150 calculation originated from the WL150 method (Franklin et al. 2003; Uhlhorn et al. 2007). The WL150 is calculated based on data at the lowest 150 m above 10 m, and is only valid if valid winds are obtained below about 350 m. In other words, the lowest level of WL150 is m, and the highest is m. The operational procedure at the National Hurricane Center in the U.S. is then to convert these values to U 10 using an empirical function that depends upon the mid-height of the 150-m layer. It should be noted that the reason for going to WL150 from original MBL wind estimate in TC is that in the near core the dropsondes frequently lost wind measurement below 150 m (loose locking on GPS signal due to low-level turbulence). This limitation of GPS dropsonde implies that WL40 would not be so useful in eyewall of TC, but likely would be very useful elsewhere in TC, such as the dropwindsonde observations from the DOTSTAR and NOAA G-IV surveillance missions. The calculation of M150 in this study is simplified as the m averaged wind. The scatter plot and wind difference between the U 10 and the marine boundary layer (MBL) and those between the U 10 and the M150 are shown in Fig. 2. The best-fit regression line is U MBL MBL for comparison between U10 and MBL, and 10 U M M for comparison between U10 and M150. It is found that the R
9 (0.921) of between U 10 and MBL and R 2 (0.961) of between U 10 and M150 are smaller than that (0.996) between U 10 and M40. In addition, the rms difference between U 10 MBL and U 10 and those between U10 M 150 and U 10 increases to 1.3 and 0.9 m s -1 in wind speed and 9.7 and 5.6 in wind direction. The cyclonic shift in wind direction in the MBL is likely related to the deeper boundary layer depth used for the calculation. Since the main motivation in this research is to validate the QuikSCAT wind vectors, we surmise that it is reasonable to use M40 method in this study to represent the 10-m wind for comparison d. Time-matching of observations The DOTSTAR GPS dropwindsondes are usually released between -3 h and 3 h of 0000 and 1200 UTC, within N and E. The QuikSCAT swath passes this area at around 2200 and 1000 UTC. Thus, the data observed by the GPS dropwindsondes and QuikSCAT are usually not concurrent, and a method to adjust the data to match the times is necessary. The data are transformed in storm-relative coordinates at the time of the satellite overpass. The observations are compared when QuikSCAT and GPS dropwindsondes are within 0.25 degree radius of each other, or roughly one QuikSCAT footpoint Results a. Comparison of wind speed and direction Figure 3a shows the scatter diagram of the wind speed and direction difference between the QuikSCAT surface wind and dropwindsonde estimated surface wind for all the matched samples, without employing the storm-relative coordinate transformation for the dropwindsondes (see section 2d). Based on the calculation for 1021 available QuikSCAT-dropwindsonde matched samples, the mean speed difference is -0.1 m s -1, and the mean direction difference is 1.8 clockwise. Although
10 the mean wind difference is small, the mean absolute difference and rms wind differences are larger. The absolute mean and rms difference of wind speed are 2.2 and 3.2 m s -1 respectively, while those of wind direction are 13.8 and 21.8 respectively. However, when the QuikSCAT data are compared with the dropwindsonde data in storm-relative coordinates, the scatter becomes slightly more concentrated towards the center, and the wind differences become smaller (Figure 3b). The rms value of wind speed decreases from 3.2 to 2.8 m s -1 and that of wind direction from 21.8 to This result indicates that the conversion to storm relative coordinates of the dropwindsonde locations increases the consistency between the dropwindsonde and QuikSCAT wind fields. For the subset of data points for which only rain-flagged data are included, the QuikSCAT rain contaminated data have an obvious 2.0 m s -1 and 9.2 counterclockwise bias (Figure 3c), indicating that the QuikSCAT winds are on average too strong, with a corresponding increased cyclonic component. The rms differences are 3.9 m s -1 for wind speed and 39.7 for wind direction. For the complementary subset in which all rain-flagged data are removed, Figure 3d illustrates that the rms differences are smaller than when all data are included (2.6 m s -1 for wind speed, 16.9 for wind direction). The wind error statistics of the rain and non-rain contaminated data of QuikSCAT calculated in this study is generally consistent with the finding of Hawkins and Black (1983) which contains limited (50) sample numbers b. Analysis of different wind regimes Though the rms value of wind direction calculated by this QuikSCAT-dropwindsonde comparison is similar to previous QuikSCAT-buoy comparisons (Freilich and Dunbar 1999, Ebuchi et al. 2002, Pickett et al. 2003), the rms difference in wind speed is slightly larger than their findings and exceeds the satellite s design specifications for wind speed (±2 m s -1 ). To examine the reason
11 for these increased differences, the comparison is now stratified by different dropwindsonde estimated surface wind speeds. Figure 4 shows the QuikSCAT-dropwindsonde comparison for three different wind speed regimes: below 10 m s -1 (V1), between m s -1 (V2), and above 17.2 m s -1 (V3), classified by the magnitude of U 10-M40. For the rain-contaminated-data-only subset (Figs. 4a, c, e), although the sample amounts are fewer, the aforementioned wind speed bias mainly occurs at lower wind speeds and the counterclockwise bias appears in all regimes. For the rain-flagged-data-removed subset (Figs. 4b, d, f), the scatter is more widespread in the regime of strongest winds (Figure 4f), with higher rms values for both wind speed and direction. The rms differences in wind direction are within the instrument design specifications for wind direction (±20, Pickett et al. 2003) in the two regimes of higher wind, but slightly outside the specifications for wind speeds below 10 m s -1. This large wind direction error for low winds is 208 consistent with the findings of Pickett et al. (2003). Furthermore, a systematic clockwise bias (~7 ) of wind direction can be found in locations of high wind (Fig. 4f). Statistical examination by the paired test with two-sided distribution for the wind direction of QuikSCAT and dropwindsonde are calculated. The result indicates that the bias of wind speed is different from zero and statistically significant at the 99% confidence level. This result has not been discussed in the literature and warrants further investigation. If the data are instead sorted by their distance from the center of the TC, this systematic clockwise bias of wind direction is observed for locations closest to the center (figures not shown). The rms values for low wind speeds (below 17.2 m s -1 ; Figs. 4b, d) are under 2.0 m s -1, consistent with the results from previous QuikSCAT-buoy comparisons. However, in high winds (above 17.2 m s -1 ; Figs. 4f) the rms value is considerably larger (4.1 m s -1 ). This result is similar to
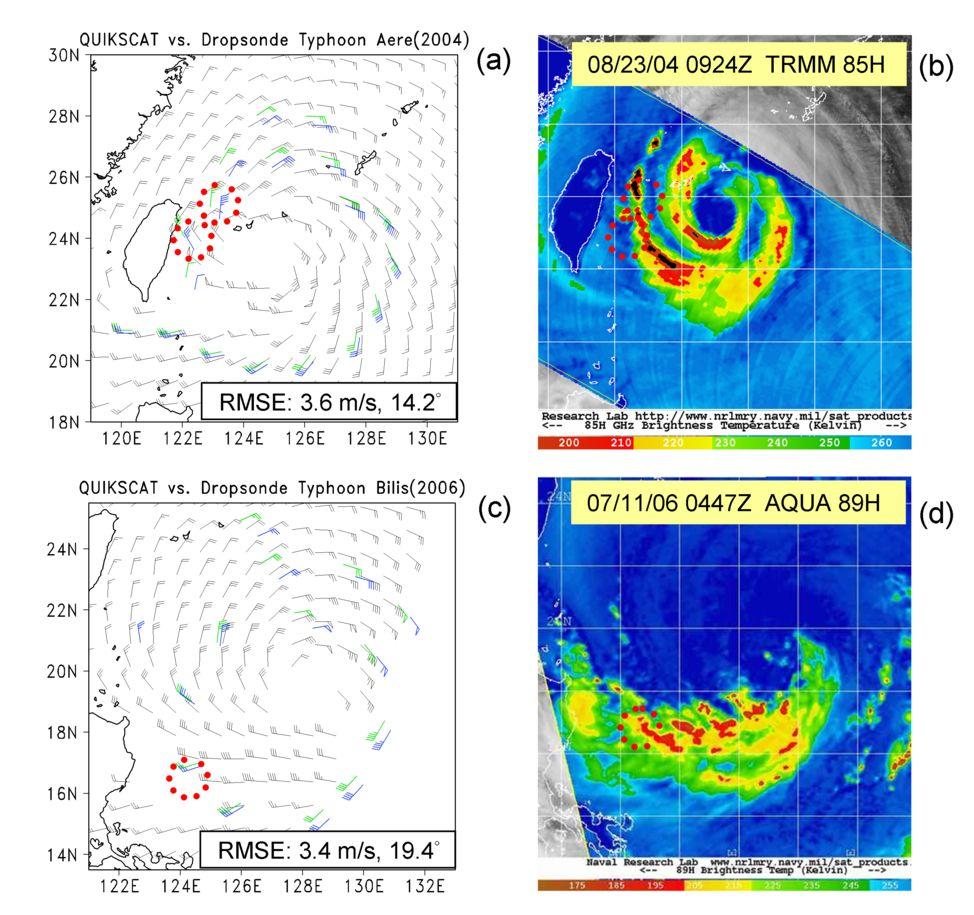
12 that obtained from the QuikSCAT-buoy comparison in Ebuchi et al. (2002), in which obvious biases in high wind are shown in their Fig. 4. Figure 5a shows the distributions of QuikSCAT-dropwindsonde wind speed differences for cases with all the rain-flagged data removed. Except for the slow wind regime, the QuikSCAT wind has a slight negative bias of about -0.5 m s -1 as compared with the dropwindsonde data. The difference range (shown in the standard deviation) increases with wind speed from 1.2 m s -1 in V1, 1.9 m s -1 in V2, to 4.1 m s -1 in V3, with a value of about 2.5 m s -1 for all the matched samples. The wind speed difference in percentage is also shown Fig. 5b. The mean of the difference in percentage between QuikSCAT and dropwindsonde data each wind regime is within 5%, with the value of -2.5% for all the matched samples. A larger difference range (25%) is found in regime V1 compared with regimes V2 (15%) and V3 (20%). Overall, the standard deviation of the percentage between QuikSCAT and dropwindsonde wind speed data for all the matched samples is about 18% Discussion The question of why a larger difference between the QuikSCAT wind and dropwindsonde wind exists in high wind regimes requires further research. As an initial step, two examples [Typhoon Aere (2004) and Typhoon Bilis (2006)] are investigated, with a particular focus on the existence of large wind speed differences in areas of convection in outer spiral rainbands. As is evident in Fig. 6, most of the QuikSCAT wind vectors are close to the dropwindsonde wind vectors in both cases. However, large differences exist in some dropwindsonde locations, exceeding 10.0 m s -1 to the northwest of Aere (Fig. 6a) and to the southwest of Bilis (Fig. 6c), as indicated by the red dotted 239 circles. Figure 6b shows the Tropical Rainfall Measuring Mission Microwave imager (TRMM/TMI) 85-GHz brightness temperature at 0924 UTC, only 30 min before the QuikSCAT swath passed. It is clear that the area of large wind difference coincides with a heavily convective
13 rainband of Typhoon Aere. The same result can also be inferred from the 89-GHz brightness temperature microwave image of the Aqua satellite in Bilis (Fig. 6d). On the contrary, Figures 7a, c demonstrates the well-matched wind vectors between the QuikSCAT and dropwindsonde observations in the cases of Typhoon Longwang (2005) and Saomai (2006), in which no active outer rainbands exist around the TCs (Figs. 7b, d). Given that the rain-flagged data have been removed from the QuikSCAT wind vectors, based on the corresponding microwave images, we speculate that the current QuikSCAT processing algorithm could not effectively identify the narrow rain band structure. Although it is found that large errors exist in the rainband areas, the accuracy of QuikSCAT vectors in these areas is generally high. This finding suggests that the QuikSCAT data are generally reliable near TCs in regions with no rain contamination Concluding remarks In this study, the accuracy of QuikSCAT wind vectors in the environment of tropical cyclones (TCs) in the western North Pacific basin is determined via comparison with GPS dropwindsonde winds from DOTSTAR missions between The dropwindsonde locations are converted to the storm-relative coordinates to the time that the QuikSCAT swath passed in order to account for the different observing times between the platforms. A regression fit is formulated between the surface to 40-m averaged wind speed (M40) and 10-m surface wind speed (U 10 ) in order to obtain a large database for the comparison. Comparing with the previous averaged wind methods MBL and M150 (similar with WL150), M40 method not only provides the best regression fit in wind speed, but also minimizes the wind direction errors. This result indicates the potential for using the M40 boundary layer wind to estimate U 10 for future dropwindsonde observations. In general, based on the calculation from 896 available rain-flagged-removed
14 QuikSCAT-dropwindsonde matched samples, the rms difference between the QuikSCAT and dropwindsonde winds is 2.6 m s -1 (or 18%) for wind speed and 17 in terms of wind direction. The rms value of wind direction is similar to that computed in previous QuikSCAT-buoy comparisons in non-tc areas, while the rms value of wind speed is slightly larger than their findings and exceeds the satellite s design specifications (±2 m s -1 ). Large wind speed differences occur for higher wind regimes, and large wind direction differences occur for low wind regimes. Nevertheless, we are able to conclude that QuikSCAT winds below tropical storm force wind strength (17.2 m s -1 ) are accurate enough for the application to determine one of the key parameter of the TC structure, namely the radius of the critical wind radius of the 34-kt (tropical storm force) wind. It is important to note that QuikSCAT errors may be larger for weaker TCs where the 34-kt winds are confined to regions where heavy rain is occurring. Meanwhile, the error bound of the QuikSCAT wind estimate in high-wind regimes can be set at about 4 m s -1, indicating that the QuikSCAT data still can be useful for forecasters to estimate the radius of tropical storm force winds within these error bounds, and the data could be assimilated into numerical models with new error characteristics. In the future, the work will be extended to evaluate the wind speed accuracy within the inner core of TCs, using GPS dropwindsondes deployed by the United States Air Force Reserve C-130 and Naval Research Laboratory P-3 aircraft during the Tropical Cyclone Structure (TCS-08) field experiment and T-PARC (Elsberry and Harr 2008; Velden 2008, personal communication). The issue of correcting the rain contamination wind vector bias as shown in this work can be addressed further, making use of the originally discarded rain contaminated data as in Draper and Long (2004). a reprocessing would be necessary in order to include extra rain-flagged data, though it is beyond the scope of this paper.
15 Another important representativeness issues when comparing the areal averaged QuikSCAT winds and point dropwindsonde winds in the highly-variable TC environment need to be addressed. A follow-up study is ongoing in which high spatial- and temporal-resolution data from numerical simulations of TCs are used to investigate the representativeness and time-averaging issues (1-minute-averaged wind vs. 10-minute-averaged wind) of TC wind. We anticipate that this work will provide a basic knowledge on the accuracy of satellite-derived wind products, especially in TCs, for use in forecaster analysis and for initializing numerical forecast models. Moreover, the errors estimated here provide a benchmark upon which future scatterometers must improve. 296 Acknowledgments. The work is supported by the National Science Council of Taiwan through 297 Grant NSC M MY2 and NSC M , the Office of Naval Research 298 Grants N and N G007, National Taiwan University Grant 97R0302, and 299 the Central Weather Bureau Grant MOTC-CWB-96-6M-02. The authors thank all DOTSTAR team 300 members for their help in conducting the observation missions. S. J. Majumdar acknowledges 301 support from the NASA Ocean Vector Winds Science Team. QuikScat data are produced by 302 Remote Sensing Systems and sponsored by the NASA Ocean Vector Winds Science Team, which are 303 available at
16 304 References 305 Atlas R., R. N. Hoffman, S. M. Leidner, J. Sienkiewicz, T.-W. Yu, S. C. Bloom, E. Brin, J. Ardizzone, 306 J. Terry, D. Bungato, and J. C. Jusem (2001), The effects of marine winds from scatterometer 307 data on weather analysis and forecasting, Bull. Amer. Meteor. Soc., 82, Black, P. G., R. C. Gentry, V. J. Cardone and J. D. Hawkins (1985), Seasat microwave wind and rain 309 observations in severe tropical and midlatitude marine storms, Satellite Oceanic Remote 310 Sensing, B. Saltzman, Ed., Adv. in Geophysics, 27, , Academic Press, Inc., Orlando. 311 Brennan M. J., C. C. Hennon and R. D. Knabb (2009), The Operational Use of QuikSCAT Ocean 312 Surface Vector Winds at the National Hurricane Center. Weather and Forecasting, 24, Chelton, D.B., M.H. Freilich, J.M. Sienkiewicz, and J.M. Von Ahn, 2006: On the Use of QuikSCAT 315 Scatterometer Measurements of Surface Winds for Marine Weather Prediction. Mon. Wea. Rev., , Chou, K.-H., and C.-C. Wu (2008), Development of the typhoon initialization in a mesoscale 318 model Combination of the bogused vortex with the dropwindsonde data in DOTSTAR, Mon. 319 Wea. Rev., 136, Draper D. W., D. G. Long (2004), Evaluating the effect of rain on SeaWinds scatterometer 321 measurements, J. Geophys. Res., 109, C02005, doi: /2002jc
17 322 Ebuchi, N., H. C. Graber, and M. J. Caruso (2002), Evaluation of wind vectors observed by 323 QuikSCAT/SeaWinds using ocean buoy data, J. Atmos. Oceanic Technol., 19, Elsberry, R. L., and P. A. Harr (2008), Tropical cyclone structure (TCS08) field experiment science 325 basis, observational platforms, and strategy, Asia-Pacific J. Atmos. Sci., 44, Franklin, J. L., M. L. Black, and K. Valde (2003), GPS dropwindsonde wind profiles in hurricanes 327 and their operational implications, Wea. Forecasting, 18, Freilich, M. H., and R. S. Dunbar (1999), The accuracy of the NSCAT vector winds: Comparisons 329 with National Data Buoy Center buoys, J. Geophys. Res., 104, Hawkins, J. D. and P. G. Black (1983), Seasat scatterometer detection of gale force winds near 331 tropical cyclones, J. Geophys. Res., 88, Hock, T. F., and J. L. Franklin (1999), The NCAR GPS dropwindsonde, Bull. Amer. Meteor. Soc., 80, Hoffman, R. N. and Leidner, S. M. (2005), An introduction to near real-time QuikSCAT data, 335 Weather and Forecasting, 20, pp Hilburn, K. A, F. J. Wentz, D. K. Smith and others (2006), Correcting active scatterometer data for 337 the effects of rain using passive microwave data, Journal of Applied Meteorology and 338 Climatology, 45, Huddleston, J. N., and B. W. Stiles, 2000: Multidimensional Histogram (MUDH) Rain Flag Product
18 340 Description (Version 3.0). Jet Propulsion Laboratory, Pasadena, CA, 17 pp. Available online at 341 ftp://podaac.jpl.nasa.gov/quikscat/qscat_doc.html 342 Liu, W. T., and W. Tang (1996), Equivalent neutral wind, JPL Publ., 96-17, 16 pp. 343 Pickett, M. H., W. Tang, L. K. Rosenfeld, and C. H. Wash (2003), QuikSCAT satellite comparison 344 with nearshore buoy wind data off the U.S. west coast, J. Atmos. Oceanic Technol., 20, Uhlhorn, E. W., P. G. Black, J. L. Franklin, M. Goodberlet, J. Carswell, and A. S. Goldstein (2007), 347 Hurricane Surface Wind Measurements from an Operational Stepped Frequency Microwave 348 Radiometer, Mon. Wea. Rev., 135, Von Ahn, J. M., J. M. Sienkiewicz, and P. S. Chang (2006), Operational Impact of QuikSCAT Winds 350 at the NOAA Ocean Prediction Center. Wea. Forecasting, 21, Wentz, F. J., and D. K. Smith (1999), A model function for the ocean normalized radar cross section 352 at 14 GHz derived from NSCAT observations, Journal of Geophysical Research, 104, C5, Wu, C.-C., and coauthors (2005), Dropwindsonde observations for typhoon surveillance near the 355 Taiwan region (DOTSTAR): An overview, Bull. Amer. Meteor. Soc., 86, Wu, C.-C., K.-H. Chou, P.-H. Lin, S. D. Aberson, M. S. Peng, and T. Nakazawa (2007a), The impact 357 of dropwindsonde data on typhoon track forecasts in DOTSTAR, Weather and Forecasting, 22,
19 Wu, C.-C., J.-H. Chen, P.-H. Lin, and K.-H. Chou (2007b), Targeted observations of tropical 360 cyclones based on the adjoint-derived sensitivity steering vector, J. Atmos. Sci., 64,
20 Table and Figure captions Table 1. Comparison of wind speed (m s -1 ) and direction (degree clockwise, value in parentheses) 363 between QuikSCAT and dropwindsonde data. 364 Figure 1. (a) Relationship between the averaged 0-40 m wind (M40) and GPS-measured wind 365 speed at 0-40 m. (b) Scatter diagram of the wind speed with the linear regression fit line for the 10-m wind speed (U 10 ) and the averaged 0-40 m wind (M40). (c) Scatter diagram of the wind speed and direction difference between the U 10 and U10 M 40 (the estimated 10-m wind 368 by M40 method). 369 Figure 2. (a) Scatter diagram of the wind speed with the linear regression fit line for U 10 and the 370 MBL (surface to 500-m averaged wind). (b) Scatter diagram of the wind speed and 371 direction difference between U 10 and U 10 MBL (the estimated 10-m wind by MBL method). 372 (c) and (d) as (a) and (b), but for comparison between U 10 and M150 (surface to 150-m 373 averaged wind). 374 Figure 3. Scatter diagram of the wind speed and direction difference between the QuikSCAT 375 surface wind and the estimated 10-m wind (U 10-M40 ). (a) all QuikSCAT winds are verified 376 with the dropwindsondes where the deployed locations are not modified. (b) as in (a), 377 except that the dropwindsonde locations have been transformed to storm-relative coordinates, 378 (c) as in (b), but for only the rain flagged data, and (d) as in (c), but for all the non-rain
21 379 flagged data. 380 Figure 4. The same as Figs. 3c,d, but sorted by wind speed of the (U 10-M40 ) for (a), (b) below 10 m 381 s -1, (c), (d) m s -1, (e), (f) above 17.2 m s Figure 5. Distribution of differences between the QuikSCAT surface wind and the estimated 10-m 383 wind for all the rain-flagged data removed and three wind regimes (V1, V2, and V3): (a) 384 wind speed differences, unit in m s -1, and (b) wind speed differences in percentage, unit in %. 385 Black square indicates the mean of difference and vertical line represents the difference range 386 within one standard deviation from the mean. 387 Figure 6. (a) The rain-flagged removed QuikSCAT surface wind (black wind barb, full barb is knots), and dropwindsonde estimated 10-m wind U 10-M40 (original locations in green, 389 storm-relative locations in blue) for Typhoon Aere (2004). (b) The Tropical Rainfall 390 Measuring Mission Microwave Imager (TRMM/TMI) 85-GHz brightness temperature at UTC 23 August for Typhoon Aere. (c) The same as (a), but for the case of Typhoon 392 Bilis (2006). (d) The same as (b), but for the AQUA 89-GHz brightness temperature at UTC 11 July for Typhoon Bilis. (from the website of NRL/Monterey.) 394 Figure 7. (a) and (c) The same as Fig. 6, but for Typhoon Longwang in 2005 and Typhoon Saomai 395 in (b) the microwave image for the F-16 SSMIS 91-GHz brightness temperature at UTC 29 September for Typhoon Longwang, and (d) F-15 SSMI 85-GHz brightness
22 397 temperature at 2149 UTC 8 August for Typhoon Saomai.
23 Table 1. Comparisons of wind speed (m s -1 ) and direction (degree clockwise, value in parentheses) between QuikSCAT and dropwindsonde data. QuikSCAT data Bias Mean absolute difference RMS difference No. of matching samples Non-rain-flagged data All -0.4 (3.2) 1.9 (11.3) 2.6 (16.9) 896 V1: below10 m s (2.1) 0.9 (14.9) 1.2 (22.4) 182 V2: between m s (2.1) 1.6 (9.6) 2.0 (12.8) 502 V3: above 17.2 m s (6.6) 3.3 (12.5) 4.1 (19.7) 212 Rain-flagged data All 2.0 (-9.2) 2.9 (24.9) 3.9 (39.7) 111 V1: below10 m s (-11.3) 3.0 (20.6) 3.9 (31.7) 50 V2: between m s (-7.9) 2.6 (28.0) 3.7 (45.6) 45 V3: above 17.2 m s (-6.7) 3.2 (29.5) 4.5 (44.2) 16
24
25
26
27
28
29
30
SENSOR SYNERGY OF ACTIVE AND PASSIVE MICROWAVE INSTRUMENTS FOR OBSERVATIONS OF MARINE SURFACE WINDS
 SENSOR SYNERGY OF ACTIVE AND PASSIVE MICROWAVE INSTRUMENTS FOR OBSERVATIONS OF MARINE SURFACE WINDS N. Ebuchi Institute of Low Temperature Science, Hokkaido University, N19-W8, Kita-ku, Sapporo 060-0819,
Assessment of the ASCAT wind error characteristics by global dropwindsonde observations
 JOURNAL OF GEOPHYSICAL RESEARCH: ATMOSPHERES, VOL. 118, 9011 9021, doi:10.1002/jgrd.50724, 2013 Assessment of the ASCAT wind error characteristics by global dropwindsonde observations Kun-Hsuan Chou, 1
Reprocessed QuikSCAT (V04) Wind Vectors with Ku-2011 Geophysical Model Function
 Wind Vectors with Ku-2011 Geophysical Model Function") Reprocessed QuikSCAT (V04) Wind Vectors with Ku-2011 Geophysical Model Function Lucrezia Ricciardulli and Frank Wentz Introduction In April 2011, we reprocessed the QuikSCAT ocean wind vectors using a
Reprocessed QuikSCAT (V04) Wind Vectors with Ku-2011 Geophysical Model Function Lucrezia Ricciardulli and Frank Wentz Introduction In April 2011, we reprocessed the QuikSCAT ocean wind vectors using a
CHANGE OF THE BRIGHTNESS TEMPERATURE IN THE MICROWAVE REGION DUE TO THE RELATIVE WIND DIRECTION
 JP4.12 CHANGE OF THE BRIGHTNESS TEMPERATURE IN THE MICROWAVE REGION DUE TO THE RELATIVE WIND DIRECTION Masanori Konda* Department of Geophysics, Graduate School of Science, Kyoto University, Japan Akira
J4.2 AUTOMATED DETECTION OF GAP WIND AND OCEAN UPWELLING EVENTS IN CENTRAL AMERICAN GULF REGIONS
 J4.2 AUTOMATED DETECTION OF GAP WIND AND OCEAN UPWELLING EVENTS IN CENTRAL AMERICAN GULF REGIONS Xiang Li*, University of Alabama in Huntsville Huntsville, AL D. K. Smith Remote Sensing Systems Santa Rosa,
OCEAN vector winds from the SeaWinds instrument have
 IEEE GEOSCIENCE AND REMOTE SENSING LETTERS, VOL. 6, NO. 3, JULY 2009 413 Coastal Validation of Ultra-High Resolution Wind Vector Retrieval From QuikSCAT in the Gulf of Maine A. M. Plagge, Student Member,
High resolution wind retrieval for SeaWinds
 High resolution wind retrieval for SeaWinds David G. Long and Jeremy B. Luke Brigham Young University, 459 Clyde Building, Provo, UT 84602, USA ABSTRACT The SeaWinds instrument on the QuikSCAT satellite
PRELIMINARY STUDY ON DEVELOPING AN L-BAND WIND RETRIEVAL MODEL FUNCTION USING ALOS/PALSAR
 PRELIMINARY STUDY ON DEVELOPING AN L-BAND WIND RETRIEVAL MODEL FUNCTION USING ALOS/PALSAR Osamu Isoguchi, Masanobu Shimada Earth Observation Research Center, Japan Aerospace Exploration Agency (JAXA) 2-1-1
Evaluation of Marine Surface Winds Observed by SeaWinds and AMSR on ADEOS-II
 Journal of Oceanography, Vol. 62, pp. 293 to 301, 2006 Evaluation of Marine Surface Winds Observed by SeaWinds and AMSR on ADEOS-II NAOTO EBUCHI* Institute of Low Temperature Science, Hokkaido University,
Development of SAR-Derived Ocean Surface Winds at NOAA/NESDIS
 Development of SAR-Derived Ocean Surface Winds at NOAA/NESDIS Pablo Clemente-Colón, William G. Pichel, NOAA/NESDIS Frank M. Monaldo, Donald R. Thompson The Johns Hopkins University Applied Physics Laboratory
Deborah K. Smith, Frank J. Wentz, and Carl A. Mears Remote Sensing Systems
 JP 4.9 RESULTS OF QUIKSCAT HIGH WIND DATA VALIDATION Deborah K. Smith, Frank J. Wentz, and Carl A. Mears Remote Sensing Systems ABSTRACT Traditional validation of satellite-derived winds includes comparison
RapidScat wind validation report
 Ocean and Sea Ice SAF Technical Note SAF/OSI/CDOP2/KNMI/TEC/RP/228 25 and 50 km wind products (OSI-109) Anton Verhoef, Jur Vogelzang and Ad Stoffelen KNMI Version 1.1 March 2015 DOCUMENTATION CHANGE RECORD
Satellite information on ocean vector wind from Scatterometer data. Giovanna De Chiara
 Satellite information on ocean vector wind from Scatterometer data Giovanna De Chiara Why is Scatterometer important? The scatterometer measures the ocean surface winds (ocean wind vector). Ocean surface
Assessment and Analysis of QuikSCAT Vector Wind Products for the Gulf of Mexico: A Long-Term and Hurricane Analysis
 Sensors 2008, 8, 1927-1949 sensors ISSN 1424-8220 2008 by MDPI www.mdpi.org/sensors Full Research Paper Assessment and Analysis of QuikSCAT Vector Wind Products for the Gulf of Mexico: A Long-Term and
The Effects of Gap Wind Induced Vorticity, the ITCZ, and Monsoon Trough on Tropical Cyclogenesis
 The Effects of Gap Wind Induced Vorticity, the ITCZ, and Monsoon Trough on Tropical Cyclogenesis Heather M. Holbach and Mark A. Bourassa Center for Ocean-Atmospheric Prediction Studies Department of Earth,
WindSat Applications for Weather Forecasters and Data Assimilation
 WindSat Applications for Weather Forecasters and Data Assimilation Thomas Lee, James Goerss, Jeffrey Hawkins, Joseph Turk Naval Research Laboratory 7 Grace Hopper Avenue Monterey CA Zorana Jelenak, Paul
Impact of the loss of QuikSCAT on National Hurricane Center operations: Current mitigation efforts and future plans
 Impact of the loss of QuikSCAT on National Hurricane Center operations: Current mitigation efforts and future plans Rick Danielson1 and Mike Brennan NOAA/NWS/NCEP National Hurricane Center 1 UCAR visiting
THE QUALITY OF THE ASCAT 12.5 KM WIND PRODUCT
 THE QUALITY OF THE ASCAT 12.5 KM WIND PRODUCT Jur Vogelzang, Ad Stoffelen, Maria Belmonte, Anton Verhoef, and Jeroen Verspeek Royal Netherlands Meteorological Institute, Wilhelminalaan 10, 3732 GK, De
JET PROPULSION LABORATORY INTEROFFICE MEMORANDUM
 JET PROPULSION LABORATORY INTEROFFICE MEMORANDUM 3348-99-008 June 16, 1999 To: From: CC: Subject: Philip S. Callahan Young-Joon Kim SAPIENT, SVT Validation of the NOAA Processor through a comparison with
The Cross-Calibrated Multi-Platform (CCMP) Ocean Vector Wind Analysis (V2.0)
 Ocean Vector Wind Analysis (V2.0)") The Cross-Calibrated Multi-Platform (CCMP) Ocean Vector Wind Analysis (V2.0) Carl A. Mears, L. Ricciardulli, J. Scott and F. J. Wentz Remote Sensing Systems Ross Hoffman, S. Mark Leidner Robert Atlas Atmospheric
The Cross-Calibrated Multi-Platform (CCMP) Ocean Vector Wind Analysis (V2.0) Carl A. Mears, L. Ricciardulli, J. Scott and F. J. Wentz Remote Sensing Systems Ross Hoffman, S. Mark Leidner Robert Atlas Atmospheric
The Ice Contamination Ratio Method: Accurately Retrieving Ocean Winds Closer to the Sea Ice Edge While Eliminating Ice Winds
 The Ice Contamination Ratio Method: Accurately Retrieving Ocean Winds Closer to the Sea Ice Edge While Eliminating Ice Winds David Long Department of Electrical and Computer Engineering Brigham Young University
Jackie May* Mark Bourassa. * Current affilitation: QinetiQ-NA
 Jackie May* Mark Bourassa * Current affilitation: QinetiQ-NA Background/Motivation In situ observations (ships and buoys) are used to validate satellite observations Problems with comparing data Sparseness
Climate-Quality Intercalibration of Scatterometer Missions
 Climate-Quality Intercalibration of Scatterometer Missions Lucrezia Ricciardulli and Frank Wentz Remote Sensing Systems, Santa Rosa, California IOVWST meeting Sapporo, Japan, May 2016 Photo Courtesy: 1
First six months quality assessment of HY-2A SCAT wind products using in situ measurements
 Acta Oceanol. Sin., 2013, Vol. 32, No. 11, P. 27-33 DOI: 10.1007/s13131-013-0374-5 http://www.hyxb.org.cn E-mail: hyxbe@263.net First six months quality assessment of HY-2A SCAT wind products using in
SEA SURFACE TEMPERATURE RETRIEVAL USING TRMM MICROWAVE IMAGER SATELLITE DATA IN THE SOUTH CHINA SEA
 SEA SURFACE TEMPERATURE RETRIEVAL USING TRMM MICROWAVE IMAGER SATELLITE DATA IN THE SOUTH CHINA SEA Mohd Ibrahim Seeni Mohd and Mohd Nadzri Md. Reba Faculty of Geoinformation Science and Engineering Universiti
THE EFFECT OF RAIN ON ASCAT OBSERVATIONS OF THE SEA SURFACE RADAR CROSS SECTION USING SIMULTANEOUS 3-D NEXRAD RAIN MEASUREMENTS
 THE EFFECT OF RAIN ON ASCAT OBSERVATIONS OF THE SEA SURFACE RADAR CROSS SECTION USING SIMULTANEOUS 3-D NERAD RAIN MEASUREMENTS David E. Weissman Hofstra University Hempstead, New York 11549 Mark A. Bourassa
The RSS WindSat Version 7 All-Weather Wind Vector Product
 2010 International Ocean Vector Winds Meeting Barcelona, Spain May 18 20, 2010 The RSS WindSat Version 7 All-Weather Wind Vector Product Thomas Meissner Lucrezia Ricciardulli Frank Wentz Outline 1. Overview:
THE EFFECT OF THE OCEAN EDDY ON TROPICAL CYCLONE INTENSITY
 TE EFFECT OF TE OCEAN ON TROPICAL CYCLONE INTENSITY 3C.1 Chia-Ying Lee and Chun-Chieh Wu* Department of Atmospheric Sciences, National Taiwan University, Taipei, Taiwan 1. INTRODUCTION It has been widely
STUDY OF LOCAL WINDS IN MOUNTAINOUS COASTAL AREAS BY MULTI- SENSOR SATELLITE DATA
 STUDY OF LOCAL WINDS IN MOUNTAINOUS COASTAL AREAS BY MULTI- SENSOR SATELLITE DATA Werner Alpers Institute of Oceanography, University of Hamburg, Bundesstrasse 53, D-20146 Hamburg, Germany E-mail: alpers@ifm.uni-hamburg.de
Review of Equivalent Neutral Winds and Stress
 Review of Equivalent Neutral Winds and Stress Mark A. Bourassa Center for Ocean-Atmospheric Prediction Studies, Geophysical Fluid Dynamics Institute & Department of Earth, Ocean and Atmospheric Science
Singularity analysis: A poweful technique for scatterometer wind data processing
 Singularity analysis: A poweful technique for scatterometer wind data processing M. Portabella (ICM-CSIC) W. Lin (ICM-CSIC) A. Stoffelen (KNMI) A. Turiel (ICM-CSIC) G. King (ICM-CSIC) A. Verhoef (KNMI)
8A.4 OBSERVATIONS OF GULF OF TEHUANTEPEC GAP WIND EVENTS FROM QUIKSCAT: AN UPDATED EVENT CLIMATOLOGY AND OPERATIONAL MODEL EVALUATION
 8A.4 OBSERVATIONS OF GULF OF TEHUANTEPEC GAP WIND EVENTS FROM QUIKSCAT: AN UPDATED EVENT CLIMATOLOGY AND OPERATIONAL MODEL EVALUATION Michael J. Brennan*, Hugh D. Cobb, III, and Richard D. Knabb NOAA/NWS/NCEP/National
Satellite Observations of Equatorial Planetary Boundary Layer Wind Shear
 Satellite Observations of Equatorial Planetary Boundary Layer Wind Shear David Halpern and Michael Garay NASA / California Institute of Technology Jet Propulsion Laboratory Pasadena, California, USA Thanks
Scatterometer-Based Assessment of 10-m Wind Analyses from the Operational ECMWF and NCEP Numerical Weather Prediction Models
 FEBRUARY 2005 C H E L T O N A N D F R E I L I C H 409 Scatterometer-Based Assessment of 10-m Wind Analyses from the Operational ECMWF and NCEP Numerical Weather Prediction Models DUDLEY B. CHELTON AND
Correction of the Effect of Relative Wind Direction on Wind Speed Derived by Advanced Microwave Scanning Radiometer
 Journal of Oceanography, Vol., pp. 39 to, Correction of the Effect of Relative Wind Direction on Wind Speed Derived by Advanced Microwave Scanning Radiometer MASANORI KONDA 1 *, AKIRA SHIBATA, NAOTO EBUCHI
High Resolution Sea Surface Roughness and Wind Speed with Space Lidar (CALIPSO)
") High Resolution Sea Surface Roughness and Wind Speed with Space Lidar (CALIPSO) Yongxiang Hu NASA Langley Research Center Carl Weimer Ball Aerospace Corp. 1 CALIPSO Mission Overview CALIPSO seeks to improve
High Resolution Sea Surface Roughness and Wind Speed with Space Lidar (CALIPSO) Yongxiang Hu NASA Langley Research Center Carl Weimer Ball Aerospace Corp. 1 CALIPSO Mission Overview CALIPSO seeks to improve
Statistics of wind and wind power over the Mediterranean Sea
 Conférence Méditerranéenne Côtière et Maritime EDITION 2, TANGER, MAROC (2011) Coastal and Maritime Mediterranean Conference Disponible en ligne http://www.paralia.fr Available online Statistics of wind
A. Bentamy 1, S. A. Grodsky2, D.C. Fillon1, J.F. Piollé1 (1) Laboratoire d Océanographie Spatiale / IFREMER (2) Univ. Of Maryland
 Laboratoire d Océanographie Spatiale / IFREMER (2) Univ. Of Maryland") Calibration and Validation of Multi-Satellite scatterometer winds A. Bentamy 1, S. A. Grodsky2, D.C. Fillon1, J.F. Piollé1 (1) Laboratoire d Océanographie Spatiale / IFREMER (2) Univ. Of Maryland Topics
Calibration and Validation of Multi-Satellite scatterometer winds A. Bentamy 1, S. A. Grodsky2, D.C. Fillon1, J.F. Piollé1 (1) Laboratoire d Océanographie Spatiale / IFREMER (2) Univ. Of Maryland Topics
IMPROVEMENTS IN THE USE OF SCATTEROMETER WINDS IN THE OPERATIONAL NWP SYSTEM AT METEO-FRANCE
 IMPROVEMENTS IN THE USE OF SCATTEROMETER WINDS IN THE OPERATIONAL NWP SYSTEM AT METEO-FRANCE Christophe Payan CNRM-GAME, Météo-France and CNRS, 42 avenue Gaspard Coriolis, Toulouse, France Abstract Significant
Characterization of ASCAT measurements based on buoy and QuikSCAT wind vector observations
 Ocean Sci., 4, 265 274, 2008 Author(s) 2008. This work is distributed under the Creative Commons Attribution 3.0 License. Ocean Science Characterization of ASCAT measurements based on buoy and QuikSCAT
Towards a consolidated wind reference for assessing scatterometer high and extreme-force wind capabilities
 Towards a consolidated wind reference for assessing scatterometer high and extreme-force wind capabilities Federica Polverari1, Wenming Lin2, Joe Sapp3, Marcos Portabella1, Ad Stoffelen4, Alexis Mouche5,
COMPARISON OF CONTEMPORANEOUS WAVE MEASUREMENTS WITH A SAAB WAVERADAR REX AND A DATAWELL DIRECTIONAL WAVERIDER BUOY
 COMPARISON OF CONTEMPORANEOUS WAVE MEASUREMENTS WITH A SAAB WAVERADAR REX AND A DATAWELL DIRECTIONAL WAVERIDER BUOY Scott Noreika, Mark Beardsley, Lulu Lodder, Sarah Brown and David Duncalf rpsmetocean.com
Air-Sea Interaction Spar Buoy Systems
 DISTRIBUTION STATEMENT A: Distribution approved for public release; distribution is unlimited Air-Sea Interaction Spar Buoy Systems Hans C. Graber CSTARS - University of Miami 11811 SW 168 th Street, Miami,
ValidatingWindProfileEquationsduringTropicalStormDebbyin2012
 Global Journal of Researches in Engineering: e Civil And Structural Engineering Volume 4 Issue Version. Year 24 Type: Double Blind Peer Reviewed International Research Journal Publisher: Global Journals
A comparison of a two-dimensional variational analysis method and a median filter for NSCAT ambiguity removal
 JOURNAL OF GEOPHYSICAL RESEARCH, VOL. 108, NO. C6, 3176, doi:10.1029/2002jc001307, 2003 A comparison of a two-dimensional variational analysis method and a median filter for NSCAT ambiguity removal J.
SeaWinds wind Climate Data Record validation report
 Ocean and Sea Ice SAF Technical Note SAF/OSI/CDOP2/KNMI/TEC/RP/221 SeaWinds wind Climate Data Record validation report 25 and 50 km wind products (OSI-151) Anton Verhoef, Jur Vogelzang and Ad Stoffelen
Typhoon Vamei: An Equatorial Tropical Cyclone Formation
 1 Typhoon Vamei: An Equatorial Tropical Cyclone Formation C.-P. Chang, Ching-Hwang Liu 1, Hung-Chi Kuo 2 Department of Meteorology, Naval Postgraduate School, Monterey, CA Abstract. Due to the diminishing
SeaWinds Validation with Research Vessels
 1 SeaWinds Validation with Research Vessels Mark A. Bourassa 1, David M. Legler 1,, James J. O'Brien 1, and Shawn R. Smith 1 Abstract. The accuracy of vector winds from the SeaWinds scatterometer on the
EVALUATION OF ENVISAT ASAR WAVE MODE RETRIEVAL ALGORITHMS FOR SEA-STATE FORECASTING AND WAVE CLIMATE ASSESSMENT
 EVALUATION OF ENVISAT ASAR WAVE MODE RETRIEVAL ALGORITHMS FOR SEA-STATE FORECASTING AND WAVE CLIMATE ASSESSMENT F.J. Melger ARGOSS, P.O. Box 61, 8335 ZH Vollenhove, the Netherlands, Email: info@argoss.nl
Synthetic Aperture Radar imaging of Polar Lows
 Oslo Polar Low workshop 21-22 May 2012 Extended abstract Synthetic Aperture Radar imaging of Polar Lows Birgitte Furevik, Gunnar Noer and Johannes Röhrs met.no Forecasting polar lows is to a large degree
SIMON YUEH, WENQING TANG, ALEXANDER FORE, AND JULIAN CHAUBELL JPL-CALTECH, PASADENA, CA, USA GARY LAGERLOEF EARTH AND SPACE RESEARCH, SEATTLE, WA, US
 Applications of L-Band Scatterometry and Radiometry to Aquarius and SMAP SIMON YUEH, WENQING TANG, ALEXANDER FORE, AND JULIAN CHAUBELL JPL-CALTECH, PASADENA, CA, USA GARY LAGERLOEF EARTH AND SPACE RESEARCH,
Validation of 12.5 km Resolution Coastal Winds. Barry Vanhoff, COAS/OSU Funding by NASA/NOAA
 Validation of 12.5 km Resolution Coastal Winds Barry Vanhoff, COAS/OSU Funding by NASA/NOAA Outline Part 1: Determining empirical land mask Characterizing σ 0 near coast Part 2: Wind retrieval using new
Quantifying variance due to temporal and spatial difference between ship and satellite winds
 JOURNAL OF GEOPHYSICAL RESEARCH, VOL. 116,, doi:10.1029/2010jc006931, 2011 Quantifying variance due to temporal and spatial difference between ship and satellite winds Jackie C. May 1,2,3 and Mark A. Bourassa
THE SEAWINDS scatterometer was flown twice, once on
 IEEE TRANSACTIONS ON GEOSCIENCE AND REMOTE SENSING 1 Land-Contamination Compensation for QuikSCAT Near-Coastal Wind Retrieval Michael P. Owen and David G. Long, Fellow, IEEE Abstract The QuikSCAT scatterometer
Walker Circulation and El Niño / La Niña Sea Surface Temperature, Rainfall, and Zonal Wind
 Walker Circulation and El Niño / La Niña Sea Surface Temperature, Rainfall, and Zonal Wind David Halpern NASA / California Institute of Technology Jet Propulsion Laboratory Pasadena, CA 91109, USA Contents
QuikScat/Seawinds Sigma-0 Radiometric and Location Accuracy Requirements for Land/Ice Applications
 Brigham Young University Department of Electrical and Computer Engineering 459 Clyde Building Provo, Utah 84602 QuikScat/Seawinds Sigma-0 Radiometric and Location Accuracy Requirements for Land/Ice Applications
Impact of Typhoons on the Western Pacific: Temporal and horizontal variability of SST cooling Annual Report, 2011 James F. Price
 DISTRIBUTION STATEMENT A: Distribution approved for public release; distribution is unlimited. Impact of Typhoons on the Western Pacific: Temporal and horizontal variability of SST cooling Annual Report,
Validation of Vector Magnitude Datasets: Effects of Random Component Errors
 695 Validation of Vector Magnitude Datasets: Effects of Random Component Errors MICHAEL H. FREILICH College of Oceanic and Atmospheric Sciences, Oregon State University, Corvallis, Oregon (Manuscript received
SENSITIVITY OF DEVELOPING TROPICAL CYCLONES TO INITIAL VORTEX DEPTH AND THE HEIGHT OF ENVIRONMENTAL DRY AIR
 6D.6 SENSITIVITY OF DEVELOPING TROPICAL CYCLONES TO INITIAL VORTEX DEPTH AND THE HEIGHT OF ENVIRONMENTAL DRY AIR Peter M. Finocchio*, Sharanya J. Majumdar, David S. Nolan University of Miami - RSMAS, Miami,
Prediction of Nearshore Waves and Currents: Model Sensitivity, Confidence and Assimilation
 Prediction of Nearshore Waves and Currents: Model Sensitivity, Confidence and Assimilation H. Tuba Özkan-Haller College of Oceanic and Atmospheric Sciences Oregon State University, 104 Ocean Admin Bldg
Validation of 12.5 km and Super-High Resolution (2-5 km)
") Coastal and Orographic Wind Analyses from High Resolution QuikSCAT and SeaWinds Measurements M.H. Freilich, COAS/OSU D.B. Chelton, COAS/OSU D.G. Long, BYU Clive Dorman, SIO Barry Vanhoff, COAS/OSU OVWST
Coastal and Orographic Wind Analyses from High Resolution QuikSCAT and SeaWinds Measurements M.H. Freilich, COAS/OSU D.B. Chelton, COAS/OSU D.G. Long, BYU Clive Dorman, SIO Barry Vanhoff, COAS/OSU OVWST
Super-parameterization of boundary layer roll vortices in tropical cyclone models
 DISTRIBUTION STATEMENT A. Approved for public release; distribution is unlimited. Super-parameterization of boundary layer roll vortices in tropical cyclone models PI Isaac Ginis Graduate School of Oceanography
Analysis of NAM Forecast Wind Shear for Dissipation of Mesoscale Convective Systems
 Analysis of NAM Forecast Wind Shear for Dissipation of Mesoscale Convective Systems MATTHEW P. HOFFMAN Meteorology Program, Iowa State University, Ames, IA Mentor: David Flory Department of Geological
Global Observations of Land Breeze Diurnal Variability
 GEOPHYSICAL RESEARCH LETTERS, VOL., NO., PAGES 1 11, Global Observations of Land Breeze Diurnal Variability Sarah T. Gille Scripps Institution of Oceanography and Department of Mechanical and Aerospace
Buoy observations from the windiest location in the world ocean, Cape Farewell, Greenland
 Click Here for Full Article GEOPHYSICAL RESEARCH LETTERS, VOL. 35,, doi:10.1029/2008gl034845, 2008 Buoy observations from the windiest location in the world ocean, Cape Farewell, Greenland G. W. K. Moore,
Climatology of the 10-m wind along the west coast of South American from 30 years of high-resolution reanalysis
 Climatology of the 10-m wind along the west coast of South American from 30 years of high-resolution reanalysis David A. Rahn and René D. Garreaud Departamento de Geofísica, Facultad de Ciencias Físicas
OPERATIONAL AMV PRODUCTS DERIVED WITH METEOSAT-6 RAPID SCAN DATA. Arthur de Smet. EUMETSAT, Am Kavalleriesand 31, D Darmstadt, Germany ABSTRACT
 OPERATIONAL AMV PRODUCTS DERIVED WITH METEOSAT-6 RAPID SCAN DATA Arthur de Smet EUMETSAT, Am Kavalleriesand 31, D-64295 Darmstadt, Germany ABSTRACT EUMETSAT started its Rapid Scanning Service on September
JCOMM Technical Workshop on Wave Measurements from Buoys
 JCOMM Technical Workshop on Wave Measurements from Buoys Val Swail Chair, JCOMM Expert Team on Wind Waves and Storm Surges Neville Smith Vincent Cardone Peter Janssen Gerbrand Komen Peter Taylor WIND WAVES
Investigation on Atmospheric Boundary Layers: Field Monitoring and Wind Tunnel Simulation
 Investigation on Atmospheric Boundary Layers: Field Monitoring and Wind Tunnel Simulation Chii-Ming Cheng 1, 2, Ming-Shu Tsai 2, Yuan-Lung Lo 1, 2, Chun-Han Wang 2 1 Department of Civil Engineering, Tamkang
Atmospheric Waves James Cayer, Wesley Rondinelli, Kayla Schuster. Abstract
 Atmospheric Waves James Cayer, Wesley Rondinelli, Kayla Schuster Abstract It is important for meteorologists to have an understanding of the synoptic scale waves that propagate thorough the atmosphere
Scales of Atmospheric Motion Scale Length Scale (m) Time Scale (sec) Systems/Importance Molecular (neglected)
 Time Scale (sec) Systems/Importance Molecular (neglected)") Supplement Wind, Fetch and Waves Scales of Atmospheric Motion Scale Length Scale (m) Time Scale (sec) Systems/Importance Molecular 10-7 - 10-2 10-1 (neglected) Coriolis not important Turbulent 10-2 10
Supplement Wind, Fetch and Waves Scales of Atmospheric Motion Scale Length Scale (m) Time Scale (sec) Systems/Importance Molecular 10-7 - 10-2 10-1 (neglected) Coriolis not important Turbulent 10-2 10
Subsurface Ocean Indices for Central-Pacific and Eastern-Pacific Types of ENSO
 Subsurface Ocean Indices for Central-Pacific and Eastern-Pacific Types of ENSO Jin-Yi Yu 1*, Hsun-Ying Kao 1, and Tong Lee 2 1. Department of Earth System Science, University of California, Irvine, Irvine,
Institut Français pour la Recherche et l Exploitation de la MER
 Institut Français pour la Recherche et l Exploitation de la MER Laboratoire d'océanographie Physique et Spatiale Satellites Interface Air- Mer June 2017 Document IFREMER/LOPS/Long Time Series Satellite
Global Observations of the Land Breeze
 GEOPHYSICAL RESEARCH LETTERS, VOL., NO., PAGES 1 10, Global Observations of the Land Breeze Sarah T. Gille Scripps Institution of Oceanography and Department of Mechanical and Aerospace Engineering, University
Mesoscale air-sea interaction and feedback in the western Arabian Sea
 Mesoscale air-sea interaction and feedback in the western Arabian Sea Hyodae Seo (Univ. of Hawaii) Raghu Murtugudde (UMD) Markus Jochum (NCAR) Art Miller (SIO) AMS Air-Sea Interaction Workshop Phoenix,
TRMM TMI and AMSR-E Microwave SSTs
 TMI and AMSR-E Microwave SSTs Chelle Gentemann, Frank Wentz, & Peter Ashcroft Gentemann@remss.com www.remss.com TMI/AMSR-E MW SST algorithm development Validation Results Sensor Issues Useful for Climate
Cross-Calibrating OSCAT Land Sigma-0 to Extend the QuikSCAT Land Sigma-0 Climate Record
 Cross-Calibrating OSCAT Land Sigma-0 to Extend the QuikSCAT Land Sigma-0 Climate Record David G. Long Department of Electrical and Computer Engineering Brigham Young University May 2013 0 Scatterometer
An Intercomparison of TOPEX, NSCAT, and ECMWF Wind Speeds: Illustrating and Understanding Systematic Discrepancies
 780 MONTHLY WEATHER REVIEW An Intercomparison of TOPEX, NSCAT, and ECMWF Wind Speeds: Illustrating and Understanding Systematic Discrepancies GE CHEN Ocean Remote Sensing Institute, Ocean University of
COMPARISON OF CONTEMPORANEOUS WAVE MEASUREMENTS WITH A SAAB WAVERADAR REX AND A DATAWELL DIRECTIONAL WAVERIDER BUOY
 31 Bishop Street, Jolimont Western Australia 6014 T +61 8 9387 7955 F +61 8 9387 6686 E info@rpsmetocean.com W rpsmetocean.com & rpsgroup.com.au COMPARISON OF CONTEMPORANEOUS WAVE MEASUREMENTS WITH A SAAB
Observed near-surface currents under high wind speeds
 JOURNAL OF GEOPHYSICAL RESEARCH, VOL. 117,, doi:10.1029/2012jc007996, 2012 Observed near-surface currents under high wind speeds Y.-C. Chang, 1 G.-Y. Chen, 1 R.-S. Tseng, 1 L. R. Centurioni, 2 and Peter
SMAP Radiometer-Only Tropical Cyclone Size and Strength
 SMAP Radiometer-Only Tropical Cyclone Size and Strength Alexander Fore, Simon Yueh, Wenqing Tang, Bryan SCles, Akiko Hayashi Jet Propulsion Laboratory, California InsCtute of Technology 218 California
ASSESSMENT OF SEA BREEZE CHARACTERISTICS FROM SODAR ECHOGRAMS
 ASSESSMENT OF SEA BREEZE CHARACTERISTICS FROM SODAR ECHOGRAMS SUNEETHA RANI. JUPUDI Prof. M. PURNACHANDRA RAO Department of Physics, Andhra University, Visakhapatnam, India. ABSTRACT The SODAR echograms
Wind Stress Working Group 2015 IOVWST Meeting Portland, OR
 Wind Stress Working Group 2015 IOVWST Meeting Portland, OR Summary of Research Topics, Objectives and Questions James B. Edson University of Connecticut SPURS Mooring, Farrar, WHOI Background Motivation
4.9 ASSIMILATION OF SCATTEROMETER AND IN SITU WINDS FOR REGULARLY GRIDDED PRODUCTS
 4.9 ASSIMILATION OF SCATTEROMETER AND IN SITU WINDS FOR REGULARLY GRIDDED PRODUCTS Mark A. Bourassa*, Shawn R. Smith, and James J. O Brien Center for Ocean-Atmospheric Prediction Studies (COAPS), Florida
Mesoscale and synoptic-scale effects on the validation of NSCAT winds by means of data buoy reports
 JOURNAL OF GEOPHYSICAL RESEARCH, VOL. 104, NO. C5, PAGES 11,437-11,447, MAY 15, 1999 Mesoscale and synoptic-scale effects on the validation of NSCAT winds by means of data buoy reports Shermane Austin
Determination of the Spatial Variation of the Atmosphere and Ocean Wave Fields in Extremely Light Wind Regimes
 Determination of the Spatial Variation of the Atmosphere and Ocean Wave Fields in Extremely Light Wind Regimes Gennaro H. Crescenti U.S. Dept. Commerce / NOAA Air Resources Laboratory Field Research Division
HIGH RESOLUTION WIND RETRIEVAL FOR SEAWINDS ON QUIKSCAT. Jeremy B. Luke. A thesis submitted to the faculty of. Brigham Young University
 HIGH RESOLUTION WIND RETRIEVAL FOR SEAWINDS ON QUIKSCAT by Jeremy B. Luke A thesis submitted to the faculty of Brigham Young University in partial fulfillment of the requirements for the degree of Master
Conditions for Offshore Wind Energy Use
 Carl von Ossietzky Universität Oldenburg Institute of Physics Energy Meteorology Group Detlev Heinemann Conditions for Offshore Wind Energy Use Detlev Heinemann ForWind Carl von Ossietzky Universität Oldenburg
A R e R v e iew e w on o n th t e h e Us U e s s e s of o Clou o d u - (S ( y S s y t s e t m e )-Re R sol o ving n Mod o e d ls Jeff Duda
-Re R sol o ving n Mod o e d ls Jeff Duda") A Review on the Uses of Cloud- (System)-Resolving Models Jeff Duda What is a Cloud-Resolving-Model (CRM)? General definition: A model with the following properties Resolution high enough to be able to
A Review on the Uses of Cloud- (System)-Resolving Models Jeff Duda What is a Cloud-Resolving-Model (CRM)? General definition: A model with the following properties Resolution high enough to be able to
The Setting - Climatology of the Hawaiian Archipelago. Link to Video of Maui Waves
 The Setting - Climatology of the Hawaiian Archipelago Link to Video of Maui Waves What caused this week s weather? What caused this weekend s weather? Today s Objective: Provide overview and description
An algorithm for Sea Surface Wind Speed from MWR
 An algorithm for Sea Surface Wind Speed from MWR Carolina Tauro 1, Yazan Heyazin 2, María Marta Jacob 1, Linwood Jones 1 1 Comisión Nacional de Actividades Espaciales (CONAE) 2 Central Florida Remote Sensing
SCIENTIFIC COMMITTEE SEVENTH REGULAR SESSION August 2011 Pohnpei, Federated States of Micronesia
 SCIENTIFIC COMMITTEE SEVENTH REGULAR SESSION 9-17 August 2011 Pohnpei, Federated States of Micronesia CPUE of skipjack for the Japanese offshore pole and line using GPS and catch data WCPFC-SC7-2011/SA-WP-09
Post-mortem study on structural failure of a wind farm impacted by super typhoon Usagi
 Downloaded from orbit.dtu.dk on: Nov 26, 2018 Post-mortem study on structural failure of a wind farm impacted by super typhoon Usagi Chen, Xiao; Li, Chuan Feng; Xu, Jian Zhong Publication date: 2015 Document
ERS-1/2 Scatterometer new products: mission reprocessing and data quality improvement
 ERS-1/2 Scatterometer new products: mission reprocessing and data quality improvement Giovanna De Chiara (1), Raffaele Crapolicchio (1), Pascal Lecomte (2) (1) Serco SpA Via Sciadonna 22-24 Frascati (Roma),
Offshore wind resource mapping in Europe from satellites
 Offshore wind resource mapping in Europe from satellites Charlotte Bay Hasager Seminar at University of Auckland, Dept. of Physics 1 April 2015 Content DTU Wind Energy Offshore wind turbines New European
EXTREME WIND GUSTS IN LARGE-EDDY SIMULATIONS OF TROPICAL CYCLONES
 The National Center for Atmospheric Research (NCAR) is sponsored by the National Science Foundation (NSF) EXTREME WIND GUSTS IN LARGE-EDDY SIMULATIONS OF TROPICAL CYCLONES George Bryan National Center
SEASONDE DETECTION OF TSUNAMI WAVES
 SEASONDE DETECTION OF TSUNAMI WAVES Belinda Lipa, John Bourg, Jimmy Isaacson, Don Barrick, and Laura Pederson 1 I. INTRODUCTION We here report on preliminary results of a study to assess the capability
Supplementary Material for Satellite Measurements Reveal Persistent Small-Scale Features in Ocean Winds Fig. S1.
 Supplementary Material for Satellite Measurements Reveal Persistent Small-Scale Features in Ocean Winds by D. B. Chelton, M. G. Schlax, M. H. Freilich and Ralph F. Milliff Fig. S1. Global 4-year average
Monitoring Conditions Offshore with Satellites
 Downloaded from orbit.dtu.dk on: Dec 15, 2017 Monitoring Conditions Offshore with Satellites Karagali, Ioanna; Hasager, Charlotte Bay; Badger, Merete; Bingöl, Ferhat; Ejsing Jørgensen, Hans Publication
Are Hurricanes Becoming More Furious Under Global Warming?
 Are Hurricanes Becoming More Furious Under Global Warming? Z H A N L I U N I V E R S I T Y O F U T A H A T M O S P H E R I C S C I E N C E S D E P A R T M E N T T U E S D A Y, M A R C H 1 6, 2 0 1 0 OUTLINE