Jurnal Teknologi. Seasonal Variation of Surface Circulation Along Peninsular Malaysia' East Coast. Full paper
|
|
|
- Rudolph Wilkerson
- 5 years ago
- Views:
Transcription

1 Jurnal Teknologi Full paper Seasonal Variation of Surface Circulation Along Peninsular Malaysia' East Coast Muhammad Faiz Pa'suya a, Kamaludin Mohd Omar b, Benny N. Peter b, Ami Hassan Md Din b and Mohd Fadzil Mohd Akhir c a Faculty of Architecture, Planning and Surveying, Universiti Teknologi MARA Perlis b Faculty of Geoinformation and Real Estate, Universiti Teknologi Malaysia c Faculty of Maritime Studies and Marine Science, Universiti Malaysia Terengganu * Corresponding author: mhmdfaiz86@gmail.com Article history Received :6 February 2014 Received in revised form : 24 July 2014 Accepted :9 October 2014 Abstract The sea surface circulation pattern over the coast of Peninsula Malaysia's East Coast during Northeast Monsoon (NE) and Southwest Monsoon (SW) are derived using the seasonally averaged sea level anomaly (SLA) data from altimetric data and Mean Dynamic Ocean Topography. This altimetric data has been derived from multi-mission satellite altimeter TOPEX, ERS-1, ERS-2, JASON-1, and ENVISAT for the period of nineteen years (1993 to 2011) using the Radar Altimeter Database System (RADS). The estimated sea level anomaly (SLA) have shown similarity in the pattern of sea level variations observed by four tide gauges. Overall, the sea surface circulations during the NE and SW monsoons shows opposite patterns, northward and southward respectively. During the SW monsoon, an anti-cyclonic circulation has been detected around the Terengganu coastal area centred at (about 5.5 N E) and nearly consistent with previous study using numerical modelling. The estimated geostrophic current field from the altimeter is consistent with the trajectories of Argos-tracked Drifting Buoys provided by the Marine Environmental Data Services (MEDS) in Canada. Keywords: Surface current circulation; Monsoon; RADS; Peninsular Malaysia; Satellite altimetry Abstrak Corak peredaran arus permukaan laut di sepanjang pantai timur pentas benua Semenanjung Malaysia semasa Monsun Timur Laut (TL) dan Monsun Barat Daya (BD) yang diperolehi menggunakan data purata paras laut dari data altimeter dan model Mean Dynamic Ocean Topography. Data altimeter ini telah diperolehi daripada satelit altimeteri pelbagai misi TOPEX, ERS -1, ERS -2, Jason -1, dan ENVISAT bagi tempoh sembilan belas tahun ( ) dengan menggunakan Pangkalan Data Radar Altimeter (PDRA). Anggaran anomali paras laut (SLA) telah menunjukkan persamaan dalam corak perubahan paras laut seperti yang di ukur dari empat stesen pasang surut. Secara keseluruhannya, peredaran permukaan laut semasa monsoon TL dan BD menunjukkan corak bertentangan, iaitu masingmasing ke arah utara dan selatan. Semasa Monsun BD, peredaran anti- siklon telah dikesan di sekitar kawasan pantai Terengganu berpusat di (kira-kira 5.5 N E) dan hampir konsisten dengan kajian sebelum ini yang menggunakan model berangka. Anggaran arus geostrophik dari altimeter adalah konsisten dengan corak pergerakan boya Argos yang dibekalkan oleh Marine Environmental Data Services (MEDS) di Kanada. Kata kunci: Peredaran arus permukaan; Monsun; PDRA; Semenanjung Malaysia; Satelit Altimetri 2013 Penerbit UTM Press. All rights reserved. 1.0 INTRODUCTION The eastern continental shelf of Peninsular Malaysia (MPECS) is a part of the Sunda Shelf and located at the southern region of the South China Sea (SSCS). This region is shallower water region in the SCS where depth is less than 100m as shown in Figure 1. MEPCS is connected with Java Sea and Indian Ocean through Karimatra Strait and Malacca Strait, respectively. The ocean circulation pattern in the region become the essential information to support the marine activities such as 71:4 (2014) eissn
 71:4 (2014) 25 33 commercial shipping, offshore oil operation and fisheries that have been growing rapidly and contributing significantly to the Malaysia's")
2 26 Muhammad Faiz Pa'suya et al. / Jurnal Teknologi (Sciences & Engineering) 71:4 (2014) commercial shipping, offshore oil operation and fisheries that have been growing rapidly and contributing significantly to the Malaysia's economy. Previous studies have pointed out that the seasonal ocean circulation of SCS is controlled predominantly by the seasonal monsoon season [1,2,3,4,5,6] with two main seasons driven the SCS circulation; the Northeast monsoon (NE) and the Southwest monsoon (SW). Only limited number of studies which are focused the surface circulation of MPECS [e.g., 5,6,7,8,9,10,]. Most of previous studies have proved that surface currents of the SCS move in the opposite direction when the monsoon changes. During SW monsoon and NE monsoon, the surface circulation is directed to southward and northward, respectively. Simulation of the MPECS circulation by [6] and [8] using wave tide circulation coupled model and Princeton Ocean Model (POM), respectively have revealed an anti-cyclonic eddy in MPECS region during SW Monsoon as shown in Figure 2. [11] and Idris and [12] have studied the sea surface circulation at the South China Sea using single mission satellite altimeter data. However, both studies which rely to single mission satellite altimetry not reveal the anti-cyclonic eddy in the MPECS. Figure 1 Bathymetry of the South China Sea [11] Combination of multi-mission will gives an improved estimation of the mesoscale features of surface circulation compared to the results derived from only one altimeter [13,14]. Thus, the aim of this study to describe the seasonal variation of circulation pattern in the MPECS with use of altimetric data from multi mission-mission satellite altimetry (ERS1&2, TOPEX/POSEIDON, JASON 1&2, and ENVISAT). Nineteen years of multi-mission satellite altimetry data from 1993 to 2011 have been derived from the Radar Altimeter Database System (RADS) to estimate the surface current in the study area. 2.0 ALTIMETER DATA PROCESSING The multi-mission satellite altimetry data for the period of January 1993 to June 2011 have been processed in the present study derived using Radar Altimeter Database System (RADS). It consists 10 years of TOPEX/POSEIDON, eight years of
 71:4 (2014) 25 33 JASON-1, three years of JASON-2, four years of ERS-1, 17 years of ERS-2 and nine years of ENVISAT observation.")
3 27 Muhammad Faiz Pa'suya et al. / Jurnal Teknologi (Sciences & Engineering) 71:4 (2014) JASON-1, three years of JASON-2, four years of ERS-1, 17 years of ERS-2 and nine years of ENVISAT observation. The sea surface height from altimetry data have been corrected for orbital altitude, altimeter range corrected for instrument, sea state bias, ionospheric delay, dry and wet tropospheric corrections, solid earth and ocean tides, ocean tide loading, pole tide, electromagnetic bias and inverse barometer correction. The summary of environmental corrections which applied in altimeter data processing is showed in the Table 1. In order to merge data from different satellite platforms, homogeneous and cross-calibrated sea are required. According to this, the reference frame biases between the different satellite missions that reflect the differences in the orbits are applied and as well as some other geographical differences in the altimeter dependent models. A so-called dual-crossover minimization analysis are performed in which the orbit of the TOPEX-class satellites fix as a reference and those of the ERS-class satellites are adjusted simultaneously. The area used for the crossover minimization is much larger than the study to have sufficient crossover information. Gaussian Weighting Functions (low pass filter) with sigma 0.5º has been applied to reduce the noise signal from SLA. Then ERS-class and TOPEX-class data were merged and gridded to sea level anomaly grids with block size Table 1 Summary of environmental correction 3.0 ESTIMATION OF GEOSTROPHIC CURRENT Assuming the geostrophic balance, the geostrophic current anomaly is computed from the multi-year average of 19 years ( ) SLA using the following equation [15,16,17]: u = g ζ f y f = 2Ωsin (φ) v = g ζ f x where ζ is the SLA, u and v are the east and north velocity components of sea surface geostrophic current, g is the local acceleration due to gravity, f is the Corriolis parameter with Ω being the earth rotational rate ( x 10-5), φ is the latitude, and x and y are the local rectangular coordinate. In order to compute absolute geostrophic current, the mean currents obtained from the Mean Dynamic Ocean Topography (Figure 2) are adding to the geostrophic current anomaly velocities. This model has been developed using joint data of satellite altimetry, near-surface drifters, National Centers for Environmental Prediction (NCEP) wind and Gravity Recovery and Climate Experiment (GRACE) (Maximenko, 2009). The data a can be downloaded at Asia- Pacific Data-Research Center website ( Details of MDOT model are given in [18]. Since the geostrophic current equation is not valid near the equator where Coriolis force almost zero, the surface geostrophic current is not estimated within about 2 of the equator.
![28 Muhammad Faiz Pa'suya et al. / Jurnal Teknologi (Sciences & Engineering) 71:4 (2014) 25 33 Figure 2 1992-2002 Mean Dynamic Ocean Topography by [18] 4.](/docs-images/80/81674900/images/4-0.jpg "0 RESULTS AND DISCUSSION In order to evaluate the estimated SLA from altimetric data, the result are compared with the monthly time series of four tide gauge along the east coast of")

 method to compute the monthly time series of SLA.")

4 28 Muhammad Faiz Pa'suya et al. / Jurnal Teknologi (Sciences & Engineering) 71:4 (2014) Figure Mean Dynamic Ocean Topography by [18] 4.0 RESULTS AND DISCUSSION In order to evaluate the estimated SLA from altimetric data, the result are compared with the monthly time series of four tide gauge along the east coast of Peninsular Malaysia. Meanwhile, the estimated geostrophic current are compared with the track of drifting buoys provided by Marine Environmental Data Services (MEDS) of Canada. 4.1 Comparison of SLA with tide gauge data The selected tide gauge station; Cendering, Geting, Tanjung Gelang, Pulau Tioman, and Tanjung Sedili are provided by Jabatan Ukur & Pemetaan Malaysia (JUPEM) and the location of stations is shown in Figure 1. The monthly averages of SLA are computed and interpolated onto the tide gauge position using Inverse Distance Weighting (IDW) method to compute the monthly time series of SLA. The result is shown in Figure 3. Based on the result, the variation pattern of sea level between tide gauge and altimeter, present a quite uniform pattern and indicate good agreement between tide gauge and altimetry data. 4.2 Seasonal variations of surface circulation pattern Geostrophic currents are computed from the long term averaged SLA ( ) and plotted based on the monsoon season. Here, each season are defined as NE Monsoon from December to January and SW Monsoon from June to September, in terms of variations of the monsoo
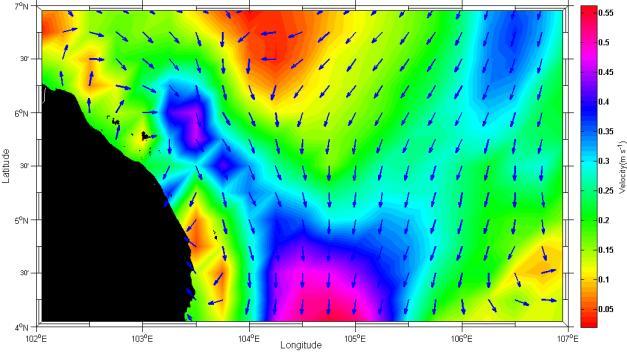
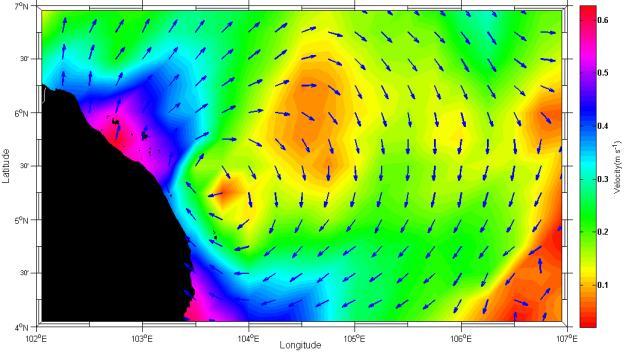
5 29 Muhammad Faiz Pa'suya et al. / Jurnal Teknologi (Sciences & Engineering) 71:4 (2014) Figure 3 Plot of monthly sea level variation from (a) Cendering (b) Geting (c) Tanjung Gelang (d) Pulau Tioman tide gauge station NE Monsoon Figure 4 shows the composite plots of average absolute geostrophic current for NE Monsoon superimposed on the geostrophic current velocity. During the NE monsoon winds blow from the northeast and surface current known as Vietnam Coastal Current (VCC; [19]) flows southward along the coast of Vietnam. After leaving the coast of Vietnam, the VCC can be seen splitting into two branches over the Sunda Shelf (4 N- 6 N), one flowing eastward approaching Natuna and Borneo Islands. Another branch continues to flow along the Peninsular Malaysia towards Karimatan Strait.In order to verify the current pattern during NE Monsoon, the result have been compared with drifter trajectories. Table 2 list the elected drifter's information and the trajectories of drifter is shown in Figure 5. It can be seen that the current pattern during NE Monsoon closely consistent to track of drifter 22513,22571 and All the drifter were released during the NE Monsoon moved all the way along the coast of Vietnam before turn to southward at near 6 N-7.5 N and flowing along the east of Peninsular Malaysia. The trajectories of these drifter have confirmed the VCC and circulation pattern along east of Peninsular Malaysia during NE Monsoon. Figure 4 Averaged geostrophic current for nineteen years during NE Monsoon. At around 6 N, part of the southward flowing current turns cyclonically to northward before entering the Gulf of Thailand (GOT) and flowing northward along the west coast of GOT. The changes in the direction are probably due to the geometry of the coastal area which is blocked part of the southward current to flow along the Peninsular Malaysia east coast. Interestingly, the surface current pattern have confirmed by the drifter as shown in Figure 5.
 71:4 (2014) 25 33 Table 2 Drifting buoys information Drifter ID Start End Date Lat ( o N) Long ( o E) Date Lat ( o N) Long ( o E) 22513 1995/09/21 14.")
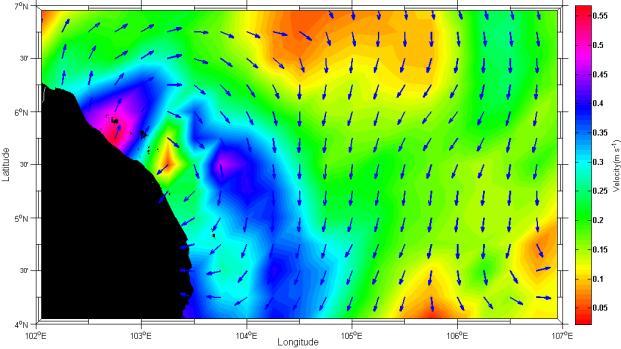
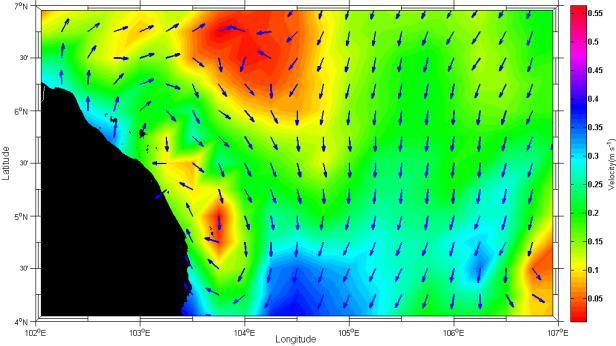
6 30 Muhammad Faiz Pa'suya et al. / Jurnal Teknologi (Sciences & Engineering) 71:4 (2014) Table 2 Drifting buoys information Drifter ID Start End Date Lat ( o N) Long ( o E) Date Lat ( o N) Long ( o E) /09/ /12/ /11/ /02/ /12/ /02/ /12/ /03/ Figure 5 Trajectories of Argos-tracked drifter in the Vietnam and Peninsular coastal area SW Monsoon During SW Monsoon, the features of circulation in the SCS almost the opposite direction to that seen during NE Monsoon as shown in Figure 6. The circulation pattern in the MPECS during SW Monsoon is rather complex than during NE Monsoon. The pattern shows MPECS current is flowing southward. The interesting feature to discuss here is the existence of an anti-cyclonic eddy centered at (about 5.5 N E) near the east coast of Peninsular Malaysia nearly consistent to what has been reported by [6] and [8]. The surface current in the southern part east coast of Peninsular Malaysia flow north-westward towards coastal area after influenced by the eddy system and continues flowing along east coast of Peninsula Malaysia before turning direction to north-eastward (about 6 N-7 N) and flowing along the southeast of Vietnam coastal area. The current continues flowing along the southeast of Vietnam coastal area. The current continues flowing along the southeast of Vietnam coastal area and leaves the Vietnam coast at near 9.5 N-13 N after converging with southward current around 10.5 N. [2] have called this current as southeast Vietnam offshore current (SEVOC). An anti-cyclonic eddy also has formed in the east coast of Vietnam and north of Natuna Island.

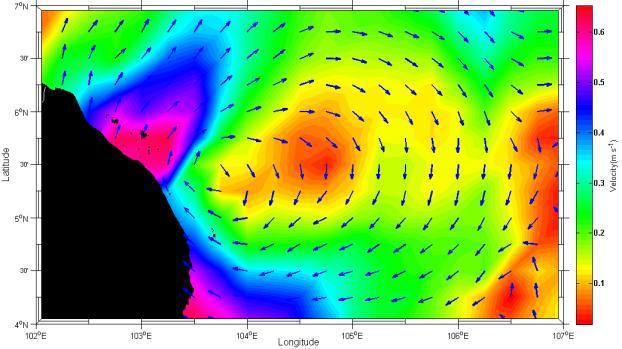
7 31 Muhammad Faiz Pa'suya et al. / Jurnal Teknologi (Sciences & Engineering) 71:4 (2014) Figure 6 Averaged geostrophic current for nineteen years during SW Monsoon. 4.3 Anti-cyclonic eddy in the MPECS during SW monsoon The geostrophic current in the Malaysian region is analyzed in detail to demonstrate the formation of anti-cyclonic eddy near the east coast of Peninsular Malaysia. Figure 7 and Figure 8 show the climatology of monthly geostrophic current. During NE Monsoon, December, January and February, the current pattern is almost the same. Originating from the Vietnam Jet, the current is flowing southward along the east coast of Peninsular Malaysia.In March, the current still flow southward along the east coast of Peninsular Malaysia. However in April. and May, the current begins to flow cyclonically southward and the anti-cyclonic eddy forms near the coastal area in May. In June, the anti-cyclonic eddy is well developed and prevails through July until September. During second inter-monsoon, the anti- cyclonic eddy that formed in SW Monsoon season still exists up to October, but has weakened and in November, the eddy disappears. In November and December, NE Monsoon wind begins to influence the current pattern where, the current change direction to southward.


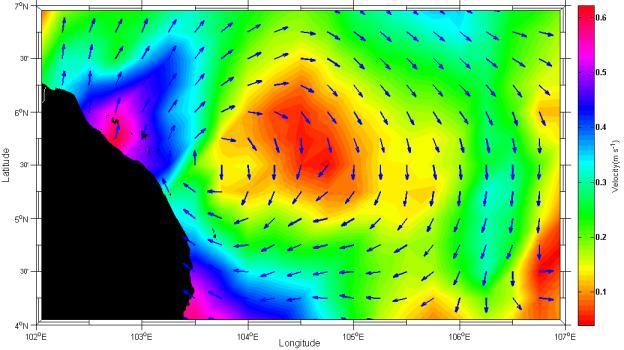
8 32 Muhammad Faiz Pa'suya et al. / Jurnal Teknologi (Sciences & Engineering) 71:4 (2014) Jan Feb Mac Apr May Jun July Aug Sept Oct Figure 7 Monthly average geostrophic current from January to October


9 33 Muhammad Faiz Pa'suya et al. / Jurnal Teknologi (Sciences & Engineering) 71:4 (2014) Nov Dec Figure 8 Monthly average geostrophic current for November and December 5.0 CONCLUSION The present study derives the surface circulation along Eastern Continental Shelf of Peninsular Malaysia using altimeter data. The geostrophic current pattern derived from the altimeter data agrees well with the drifter moving pattern. The surface circulation patterns during the NE and SW monsoons are in opposite directions, northward and southward respectively. During the SW, an anti-cyclonic eddy has been detected around the Terengganu coastal area centred at (about 5.5 o N o E). Comparison of the surface current pattern during NE Monsoon with the drifting buoys have confirmed the VCC and circulation pattern along east of Peninsular Malaysia. Also, ocean current data from ADCP observations in the southern of Peninsular east coast during SW Monsoon is consistent with the surface current pattern derived in this study. Acknowledgments The authors would like to thank the TUDelft NOAA and Altimetrics LLC for providing altimetry data. Special thanks are due to MOHE, UTM & VOTE NO.(00J78). The mean ocean dynamic topography data has been obtained from Nikolai Maximenko (IPRC) and Peter Niiler (SIO). References [1] Dale, W. L Wind and drift currents in the South China Sea. Malaysian. Journal of Tropical Geography. 8:1 31 [2] Wyrtki, K Scientific Result of Marine Investigation of the South China Sea and Gulf of Thailand. NAGA Report [3] Saadon, M.N and Camerlengo, A. L Response of the Ocean Mixed Layer, Off the East Coast of Peninsula Malaysia, During the Northeast and Southwest monsoon. Geoacta, : [4] Shaw, P.T., and Chao, S.Y Surface Circulation In the South China Sea. Deep-Sea Research I. 41 : [5] Camerlengo, A.L., and Demmler, M.I Wind-driven circulation of Peninsular Malaysia s eastern continental shelf. Scientia Marina. 61(2): [6] Tanggang, F., Xia, C., Qiao, F., Juneng, L. and Shan, F Seasonal. Circulations In the Malay Peninsula Eastern Continental Shelf From A Wave Tide Circulation Coupled Model. Ocean Dynamics. DOI /s [7] Saadon, M.N and Marghany, M.M Surface Circulation off Kuala Terengganu in the Transitional Period Between the Northeast and Southwest Monsoons. Pertanika Journal of Science & Technology (1) : M. S. [8] Muhamad, H., Tanggang, F. and Juneng, L Modeling Of Climatological Wind-Driven Circulation and Thermohaline Structures Of Peninsular Malaysia s Eastern Continental Shelf Using Princeton Ocean Model. Proceedings of Universiti Malaysia Terengganu International Annual Symposium, Kuala Terengganu July [9] Akhir, M.F.(2011). Seasonal variation of South China Sea Physical Characteristics off the East Coast of Peninsular Malaysia From Datasets. International Journal of Environmental Sciences. ISSN Vol.2, No 2 [10] Akhir, M.F Surface Circulation and Temperature Distribution of Southern South China Sea From Global Ocean Model (OCCAM). Sains Malaysiana. 41(6) : [11] Morimoto, A., Yoshimoto, K. and Yanagi,T Characteristics of Sea Surface Circulation and Eddy Field In the South China Sea Revealed by Satellite Altimetric Data. Journal of Oceanography. 56(3) : [12] Idris, N.H and Seeni Mohd, M.I Sea Surface Current Circulation Pattern in the South China Sea Derived from Satellite Altimetry. Proceedings of the 28th Asian Conference on Remote Sensing. Kuala Lumpur. November [13] Ducet, N., P.Y. Le Traon, and G.Reverdin Global high resolution mapping of ocean circulation from the combination of TOPEX/POSEIDON and ERS1/2. Journal Geophysical Research. C8: [14] Le Traon, P.Y., and G.Dibarboure An illustration of the unique contribution of the TOPEX/Poseidon-Jason-1 tandem mission to mesoscale variability studies. Marine Geodesy. 27:3 13. [15] Hwang C. and Chen S Circulation and eddies over the South China Sea derived from TOPEX/Poseidon altimetry. Journal of Geophysical Research. 105(C10): [16] Wahr J. M., Jayne, S. R. and Bryan, F. O A Method of Inferring Changes In Deep Ocean Currents From Satellite Measurements of Time-variable Gravity. Journal of Geophysical Research. 107 C12 : [17] Benny, N. P., Ambe, D., and Imawaki, S Eulerian Mean Sea Surface Velocity of the South Indian Ocean Derived by Combining Satellite Altimeter and Drifter Data. Report of Research Institute for Applied Mechanics, Kusyu University. 135 : [18] Maximenko, N., Niiler, P., Rio, M.-H., Melnichenko, O., Centurioni, L., Chambers, D., Zlonicki, V., and Galperin,B Mean Dynamic Topography of The Ocean Derived from Satellite and Drifting Buoy Data Using Three Different Techniques. Journal of Atmospheric and Oceanic Technology. 26 (9) : [19] Yang, H., Liu, Q., Liu, Z., Wang, D., and Liu, X A General Circulation Model Study of the Dynamics of The Upper Ocean Circulation of the South China Sea. Journal of Geophysical Research. 107 (C7) : 3085 [20] Fang, G., Fang, W., Fang, Y., Wang, K A Survey of Studies On the South China Sea Upper Ocean Circulation. Acta Ocenographica Taiwan. 37:1 6
Research Article Intermonsoon Variation of Physical Characteristics and Current Circulation along the East Coast of Peninsular Malaysia
 International Oceanography, Article ID 2787, 9 pages http://dx.doi.org/.11/214/2787 Research Article Intermonsoon Variation of Physical Characteristics and Current Circulation along the East Coast of Peninsular
Geostrophic and Tidal Currents in the South China Sea, Area III: West Philippines
 Southeast Asian Fisheries Development Center Geostrophic and Tidal Currents in the South China Sea, Area III: West Philippines Anond Snidvongs Department od Marine Science, Chulalongkorn University, Bangkok
COMMUNICATION Surface Circulation off Kuala Terengganu in the Transitional Period between the Northeast and Southwest Monsoons
 Pertanika J. Sci. & Techno!. 4(1): 141-148 (1996) ISSN:0128-7680 Penerbit Universiti Pertanian Malaysia COMMUNICATION Surface Circulation off Kuala Terengganu in the Transitional Period between the Northeast
SEASONAL SEA LEVEL VARIABILITY AND ANOMALIES IN THE SINGAPORE STRAIT
 Proceedings of International Conference in Ocean Engineering, ICOE Proceedings 2009 of ICOE 2009 Seasonal IIT sea Madras, level Chennai, variability India. and anomalies in the Singapore Strait 1-5 Feb.
Applications of Collected Data from Argos Drifter, NOAA Satellite Tracked Buoy in the East Sea
 Applications of Collected Data from Argos Drifter, NOAA Satellite Tracked Buoy in the East Sea Young-Sang Suh (yssuh@nfrdi.re.kr) Ocean Research Team, National Fisheries Research and Development Institute,
Lecture 13 El Niño/La Niña Ocean-Atmosphere Interaction. Idealized 3-Cell Model of Wind Patterns on a Rotating Earth. Previous Lecture!
 Lecture 13 El Niño/La Niña Ocean-Atmosphere Interaction Previous Lecture! Global Winds General Circulation of winds at the surface and aloft Polar Jet Stream Subtropical Jet Stream Monsoons 1 2 Radiation
Outline. 1 Background Introduction. 3 SST Amphidrome 4 Niño Pipe 5. SST in China Seas. Seasonality Spiral. Eddy Tracking. Concluding Remarks
 GHRSST XVIII Outline 1 Background Introduction 2 SST in China Seas 3 SST Amphidrome 4 Niño Pipe 5 Seasonality Spiral 5 stories in S(S)T oceanography 6 7 Eddy Tracking Concluding Remarks 2 Welcome to a
A CYCLONIC EDDY NORTH OF LOMBOK *)
") A CYCLONIC EDDY NORTH OF LOMBOK *) by George Cresswell ABSTRACT A satellite drifter that passed from south to north through Lombok Strait in early 1988 became trapped in a cyclonic eddy 100 km north of
A CYCLONIC EDDY NORTH OF LOMBOK *) by George Cresswell ABSTRACT A satellite drifter that passed from south to north through Lombok Strait in early 1988 became trapped in a cyclonic eddy 100 km north of
IX. Upper Ocean Circulation
 IX. Upper Ocean Circulation World Ocean Covers 71% of Earth s surface Contains 97% of surface water Arctic Ocean NH: 61% ocean, 39% land Pacific Ocean Atlantic Ocean Southern Ocean Indian Ocean SH: 81%
3 The monsoon currents in an OGCM
 3 The monsoon currents in an OGCM The observations show that both Ekman drift and geostrophy contribute to the surface circulation in the north Indian Ocean. The former decays rapidly with depth, but the
SEA SURFACE TEMPERATURE RETRIEVAL USING TRMM MICROWAVE IMAGER SATELLITE DATA IN THE SOUTH CHINA SEA
 SEA SURFACE TEMPERATURE RETRIEVAL USING TRMM MICROWAVE IMAGER SATELLITE DATA IN THE SOUTH CHINA SEA Mohd Ibrahim Seeni Mohd and Mohd Nadzri Md. Reba Faculty of Geoinformation Science and Engineering Universiti
THE DYNAMICS OF CURRENT CIRCULATION AT NEARSHORE AND VICINITY OF ISLAND IN TERENGGANU WATERS NURUL RABITAH BINTI DAUD
 THE DYNAMICS OF CURRENT CIRCULATION AT NEARSHORE AND VICINITY OF ISLAND IN TERENGGANU WATERS NURUL RABITAH BINTI DAUD Thesis Submitted in Fulfillment of the Requirement for the Degree of Master of Science
MIKE 21 Toolbox. Global Tide Model Tidal prediction
 MIKE 21 Toolbox Global Tide Model Tidal prediction MIKE Powered by DHI 2017 DHI headquarters Agern Allé 5 DK-2970 Hørsholm Denmark +45 4516 9200 Telephone +45 4516 9333 Support +45 4516 9292 Telefax mike@dhigroup.com
The Various Components of the Circulation in the Singapore Strait Region: Tidal, Wind and Eddy-driven Circulations and Their Relative Importance
 The Various Components of the Circulation in the Singapore Strait Region: Tidal, Wind and Eddy-driven Circulations and Their Relative Importance Haoliang Chen CENSAM, Singapore-MIT Alliance for Research
Temperature, Salinity, Dissolved Oxygen and Water Masses of Vietnamese Waters
 Southeast Asian Fisheries Development Center Temperature, Salinity, Dissolved Oxygen and Water Masses of Vietnamese Waters Penjan Rojana-anawat, Siriporn Pradit, Natinee Sukramongkol and Somboon Siriraksophon
TABLE OF CONTENTS CHAPTER TITLE PAGE LIST OF TABLES LIST OF FIGURES LIST OF ABBREVIATIONS LIST OF SYMBOLS LIST OF APPENDICES
 vii TABLE OF CONTENTS CHAPTER TITLE PAGE AUTHOR S DECLARATION DEDICATION ACKNOWLEDGEMENTS ABSTRACT ABSTRAK TABLE OF CONTENTS LIST OF TABLES LIST OF FIGURES LIST OF ABBREVIATIONS LIST OF SYMBOLS LIST OF
The Setting - Climatology of the Hawaiian Archipelago. Link to Video of Maui Waves
 The Setting - Climatology of the Hawaiian Archipelago Link to Video of Maui Waves What caused this week s weather? What caused this weekend s weather? Today s Objective: Provide overview and description
Wave Energy Atlas in Vietnam
 Wave Energy Atlas in Vietnam Nguyen Manh Hung, Duong Cong Dien 1 1 Institute of Mechanics, 264 Doi Can Str. Hanoi, Vietnam nmhungim@gmail.com; duongdienim@gmail.com Abstract Vietnam has achieved remarkable
Seasonal Currents in the Bay of Bengal and Andaman Sea Revealed by Reprocessed Observations
 2012 International Conference on Environment Science and Engieering IPCBEE vol.3 2(2012) (2012)IACSIT Press, Singapoore Seasonal Currents in the Bay of Bengal and Andaman Sea Revealed by Reprocessed Observations
Influence of enhanced convection over Southeast Asia on blocking ridge and associated surface high over Siberia in winter
 5th Session of the East Asia winter Climate Outlook Forum (EASCOF-5), 8-10 November 2017, Tokyo, Japan Influence of enhanced convection over Southeast Asia on blocking ridge and associated surface high
Wind Driven Circulation Indian Ocean and Southern Ocean
 Wind Driven Circulation Indian Ocean and Southern Ocean Lecture 18 MAR 350 Spring 2017 Reading: Knauss Chapter 7 ECCO2 model animation ecco2_sst_flow (2).mp4 Mean surface height and currents DPO Fig. 11.1
Oceans and the Global Environment: Lec 2 taking physics and chemistry outdoors. the flowing, waving ocean
 Oceans and the Global Environment: Lec 2 taking physics and chemistry outdoors the flowing, waving ocean Peter Rhines 1 Eric Lindahl 2 Bob Koon 2, Julie Wright 3 www.ocean.washington.edu/courses/has221a-08
Wind-Driven South China Sea Deep Basin Warm-Core/ Cool-Core Eddies
 Journal of Oceanography, Vol. 54, pp. 347 to 360. 1998 Wind-Driven South China Sea Deep Basin Warm-Core/ Cool-Core Eddies PETER C. CHU 1, YUCHUN CHEN 2 and SHIHUA LU 2 1 Naval Postgraduate School, Monterey,
Section 3: Atmospheric Circulation
 Section 3: Atmospheric Circulation Preview Key Ideas The Coriolis Effect Global Winds Local Winds Maps in Action Key Ideas Explain the Coriolis effect. Describe the global patterns of air circulation,
Lecture 5: Climate Tapestry. Sea/Land Breeze. Thermal Energy to Kinetic Energy
 Lecture 5: Climate Tapestry JS JP Thermal Energy to Kinetic Energy Hadley Cell Ferrel Cell (driven by eddies) Pressure and Wind Global Wind Patterns Polar Cell L H L H Effect of Earth s Rotation On Winds
PROC. ITB Eng. Science Vol. 36 B, No. 2, 2004,
 PROC. ITB Eng. Science Vol. 36 B, No. 2, 2004, 133-139 133 Semiannual Kelvin Waves Propagation along the South Coast of Sumatra-Jawa-Bali and the Lesser Sunda Islands Observed by TOPEX/POSEIDON and ERS-1/2
Ocean Circulation, Food Webs and Climate What does the wind have to do with feeding fish (and feeding us)?
?") Ocean Circulation, Food Webs and Climate What does the wind have to do with feeding fish (and feeding us)? El Niño: Tropical Oceans and Global Climate Reading: 9.10-9.13, 9.15 Graphic: Upwelling off Cape
Ocean Circulation, Food Webs and Climate What does the wind have to do with feeding fish (and feeding us)? El Niño: Tropical Oceans and Global Climate Reading: 9.10-9.13, 9.15 Graphic: Upwelling off Cape
CHAPTER 7 Ocean Circulation
 1 2 3 4 5 6 7 8 9 10 11 12 13 14 CHAPTER 7 Ocean Circulation Words Ocean currents Moving seawater Surface ocean currents Transfer heat from warmer to cooler areas Similar to pattern of major wind belts
SIO 210 Problem Set 3 November 4, 2011 Due Nov. 14, 2011
 SIO 210 Problem Set 3 November 4, 2011 Due Nov. 14, 2011 1. At 20 N, both the ocean and the atmosphere carry approximately 2 PW of heat poleward, for a total of about 4 PW (see figure). If (at this latitude)
Data Analysis of the Seasonal Variation of the Java Upwelling System and Its Representation in CMIP5 Models
 Data Analysis of the Seasonal Variation of the Java Upwelling System and Its Representation in CMIP5 Models Iulia-Mădălina Ștreangă University of Edinburgh University of Tokyo Research Internship Program
The development of high resolution global ocean surface wave-tidecirculation
 PICES Annual Meeting in Qingdao The development of high resolution global ocean surface wave-tidecirculation coupled model Fangli Qiao, Qi Shu and Bin Xiao First Institute of Oceanography, SOA, China Oct
SEASONDE DETECTION OF TSUNAMI WAVES
 SEASONDE DETECTION OF TSUNAMI WAVES Belinda Lipa, John Bourg, Jimmy Isaacson, Don Barrick, and Laura Pederson 1 I. INTRODUCTION We here report on preliminary results of a study to assess the capability
Development of SAR-Derived Ocean Surface Winds at NOAA/NESDIS
 Development of SAR-Derived Ocean Surface Winds at NOAA/NESDIS Pablo Clemente-Colón, William G. Pichel, NOAA/NESDIS Frank M. Monaldo, Donald R. Thompson The Johns Hopkins University Applied Physics Laboratory
Synthesis of marine debris modeling and observations: recent progress in understanding and applications
 2016 New Year Symposium on Marine Litter Ministry of the Environment, Government of Japan, Tokyo University of Marine Science and Technology, January 23-24, 2016 Synthesis of marine debris modeling and
Current mooring observations in the area of the South Kuril Islands
 Current mooring observations in the area of the South Kuril Islands Georgy Shevchenko, Gennady Kantakov 2* and Valery Chastikov 2 Institute of Marine Geology and Geophysics FEB RAS, Yuzhno-Sakhalinsk,
Atmospheric and Ocean Circulation Lab
 Atmospheric and Ocean Circulation Lab name Key Objectives: The main goal of this lab is to learn about atmospheric and oceanic circulation and how these two processes are strongly inter-dependent and strongly
Kathleen Dohan. Wind-Driven Surface Currents. Earth and Space Research, Seattle, WA
 Updates to OSCAR and challenges with capturing the wind-driven currents. Wind-Driven Surface Currents Kathleen Dohan Earth and Space Research, Seattle, WA ENSO OSCAR Surface currents from satellite fields
Intraseasonal Variability in Sea Level Height in the Bay of Bengal: Remote vs. local wind forcing & Comparison with the NE Pacific Warm Pool
 Intraseasonal Variability in Sea Level Height in the Bay of Bengal: Remote vs. local wind forcing & Comparison with the NE Pacific Warm Pool Shang-Ping Xie 1,3, Xuhua Cheng 2,3, Julian P. McCreary 3 1.
Directional Wave Spectra from Video Images Data and SWAN Model. Keywords: Directional wave spectra; SWAN; video images; pixels
 Jurnal Teknologi Full paper Directional Wave Spectra from Video Images Data and SWAN Model Muhammad Zikra a*, Noriaki Hashimoto b, Masaru Yamashiro b, Kojiro Suzuki c a Department of Ocean Engineering,
Hui Wang, Mike Young, and Liming Zhou School of Earth and Atmospheric Sciences Georgia Institute of Technology Atlanta, Georgia
 Water Cycle between Ocean and Land and Its Influence on Climate Variability over the South American-Atlantic Regions as Determined by SeaWinds Scatterometers Rong Fu Hui Wang, Mike Young, and Liming Zhou
Atmospheric Circulation. Recall Vertical Circulation
 Today s topics: Atmospheric circulation: generation of wind patterns on a rotating Earth Seasonal patterns of climate: Monsoons and Sea Breezes Tropical Cyclones: Hurricanes and typhoons Atmospheric Circulation
ENSO Cycle: Recent Evolution, Current Status and Predictions. Update prepared by Climate Prediction Center / NCEP 8 March 2010
 ENSO Cycle: Recent Evolution, Current Status and Predictions Update prepared by Climate Prediction Center / NCEP 8 March 2010 Outline Overview Recent Evolution and Current Conditions Oceanic Niño Index
An Atlas of Oceanic Internal Solitary Waves (February 2004) by Global Ocean Associates Prepared for Office of Naval Research Code 322 PO
 by Global Ocean Associates Prepared for Office of Naval Research Code 322 PO") Overview covers approximately 5500 km of coast between Western Sahara (22 o N, 17 o W) and Angola (5 o S, 12 o E) (Figure 1). The continental shelf in the region varies significantly in width. The region
Overview covers approximately 5500 km of coast between Western Sahara (22 o N, 17 o W) and Angola (5 o S, 12 o E) (Figure 1). The continental shelf in the region varies significantly in width. The region
Seasonal Variation of Stratification in the Gulf of Thailand
 Journal of Oceanography, Vol. 57, pp. 461 to 470, 2001 Seasonal Variation of Stratification in the Gulf of Thailand TETSUO YANAGI 1 *, SUHENDAR I SACHOEMAR 2, TOSHIYUKI TAKAO 3 and SHUNJI FUJIWARA 4 1
Currents measurements in the coast of Montevideo, Uruguay
 Currents measurements in the coast of Montevideo, Uruguay M. Fossati, D. Bellón, E. Lorenzo & I. Piedra-Cueva Fluid Mechanics and Environmental Engineering Institute (IMFIA), School of Engineering, Research
Variability in the tropical oceans - Monitoring and prediction of El Niño and La Niña -
 Variability in the tropical oceans - Monitoring and prediction of El Niño and La Niña - Jun ichi HIROSAWA Climate Prediction Division Japan Meteorological Agency SST anomaly in Nov. 1997 1 ( ) Outline
An Atlas of Oceanic Internal Solitary Waves (February 2004) by Global Ocean Associates Prepared for Office of Naval Research Code 322 PO
 by Global Ocean Associates Prepared for Office of Naval Research Code 322 PO") Overview The is located in the western Pacific Ocean north of the Indonesian Island of Celebes and south of the Sulu Sea and the Philippines (Figure 1). It is a deep-water sea, roughly circular with several
Overview The is located in the western Pacific Ocean north of the Indonesian Island of Celebes and south of the Sulu Sea and the Philippines (Figure 1). It is a deep-water sea, roughly circular with several
2 Observations. 2.1 Ekman drift
 2 Observations To define the monsoon currents and the associated circulation in the north Indian Ocean, we use climatological wind-stress data to estimate the surface Ekman drift, and hydrography and altimeter
Central American Pacific Coast
 Overview The Pacific coast of Central America extends approximately 3700 km from central Mexico (20 o N, 106 o W) to the edge of South America (7 o N, 78 o W). A significant continental shelf exists from
Simulation of current using a two-dimensional numerical model in the Aceh Barat Daya waters, Indonesia
 IOP Conference Series: Earth and Environmental Science PAPER OPEN ACCESS Simulation of current using a two-dimensional numerical model in the Aceh Barat Daya waters, Indonesia To cite this article: S Rizal
Yellow Sea with contributions by John R. Apel
 with contributions by John R. Apel Overview The is a shallow inland sea lying between northeastern China and the Korean Peninsula, with depths in its central north-south trough in excess of 60 to 80 m
Assessment Schedule 2016 Earth and Space Science: Demonstrate understanding of processes in the ocean system (91413)
") NCEA Level 3 Earth & Space Science (91413) 2016 page 1 of 6 Assessment Schedule 2016 Earth and Space Science: Demonstrate processes in the ocean system (91413) Evidence Statement Q Evidence with with Excellence
NCEA Level 3 Earth & Space Science (91413) 2016 page 1 of 6 Assessment Schedule 2016 Earth and Space Science: Demonstrate processes in the ocean system (91413) Evidence Statement Q Evidence with with Excellence
Wind and Air Pressure
 Wind and Air Pressure When air moves above the surface of the Earth, it is called wind. Wind is caused by differences in air pressure. When a difference in pressure exists, the air will move from areas
Intersatellite Calibrated HIRS Upper Tropospheric Water Vapor
 Intersatellite Calibrated HIRS Upper Tropospheric Water Vapor Lei Shi and John J. Bates NOAA National Climatic Data Center Asheville, North Carolina, U.S.A. 1 NOAA National Climatic Data Center ITSC-XVI
Analysis of 2012 Indian Ocean Dipole Behavior
 Analysis of 2012 Indian Ocean Dipole Behavior Mo Lan National University of Singapore Supervisor: Tomoki TOZUKA Department of Earth and Planetary Science, University of Tokyo Abstract The Indian Ocean
Wednesday, September 15, 2010 Coriolis force, 3 dimensions (p 65)
") Wednesday, September 15, 2010 Coriolis force, 3 dimensions (p 65) Weather fronts (p 63) General circulation on a rotating Earth (p 65) Geostrophy force balance (p 66) Local effects (no coriolis force)
Wednesday, September 15, 2010 Coriolis force, 3 dimensions (p 65) Weather fronts (p 63) General circulation on a rotating Earth (p 65) Geostrophy force balance (p 66) Local effects (no coriolis force)
Chapter 6: Atmospheric Pressure, Wind, and Global Circulation
 Discovering Physical Geography Third Edition by Alan Arbogast Chapter 6: Atmospheric Pressure, Wind, and Global Circulation Factors That Influence Air Pressure Air Pressure is the measured weight of air
6.28 PREDICTION OF FOG EPISODES AT THE AIRPORT OF MADRID- BARAJAS USING DIFFERENT MODELING APPROACHES
 6.28 PREDICTION OF FOG EPISODES AT THE AIRPORT OF MADRID- BARAJAS USING DIFFERENT MODELING APPROACHES Cecilia Soriano 1, Darío Cano 2, Enric Terradellas 3 and Bill Physick 4 1 Universitat Politècnica de
Chapter 7: Circulation And The Atmosphere
 Chapter 7: Circulation And The Atmosphere Highly integrated wind system Main Circulation Currents: series of deep rivers of air encircling the planet Various perturbations or vortices (hurricanes, tornados,
1 st Tidal and Water Level Working Group Meeting DHN, Niteroi, Brazil 31/03/09 02/04/09 Vertical Offshore Reference Framework (VORF) Chris Jones
 Chris Jones") 1 st Tidal and Water Level Working Group Meeting DHN, Niteroi, Brazil 31/03/09 02/04/09 Vertical Offshore Reference Framework (VORF) Chris Jones United Kingdom Hydrographic Office Presentation Structure
1 st Tidal and Water Level Working Group Meeting DHN, Niteroi, Brazil 31/03/09 02/04/09 Vertical Offshore Reference Framework (VORF) Chris Jones United Kingdom Hydrographic Office Presentation Structure
The Coriolis force, geostrophy, Rossby waves and the westward intensification
 Chapter 3 The Coriolis force, geostrophy, Rossby waves and the westward intensification The oceanic circulation is the result of a certain balance of forces. Geophysical Fluid Dynamics shows that a very
UNIVERSITI PUTRA MALAYSIA
 UNIVERSITI PUTRA MALAYSIA COASTAL CIRCULATION OFF KUALA TERENGGANU MAGED MAHMOUD MARGHANY FPV 1994 1 COASTAL CIRCULATION OFF KUALA TERENGGANU MAGED MAHMOUD MARGHANY MASTER OF SCIENCE UNIVERSITI PERTANIAN
Seasonal Circulation in the Yellow and the East China Seas driven by the monsoon winds
 Seasonal Circulation in the Yellow and the East China Seas driven by the monsoon winds Ig-Chan Pang 1 and Jae-Hong Moon 2 1 : Cheju National University 2 : Department of Earth System Science and Technology,
Satellite Observations of Equatorial Planetary Boundary Layer Wind Shear
 Satellite Observations of Equatorial Planetary Boundary Layer Wind Shear David Halpern and Michael Garay NASA / California Institute of Technology Jet Propulsion Laboratory Pasadena, California, USA Thanks
Ocean Currents Unit (4 pts)
") Name: Section: Ocean Currents Unit (Topic 9A-1) page 1 Ocean Currents Unit (4 pts) Ocean Currents An ocean current is like a river in the ocean: water is flowing traveling from place to place. Historically,
Name: Section: Ocean Currents Unit (Topic 9A-1) page 1 Ocean Currents Unit (4 pts) Ocean Currents An ocean current is like a river in the ocean: water is flowing traveling from place to place. Historically,
Section 1. Global Wind Patterns and Weather. What Do You See? Think About It. Investigate. Learning Outcomes
 Chapter 5 Winds, Oceans, Weather, and Climate Section 1 Global Wind Patterns and Weather What Do You See? Learning Outcomes In this section, you will Determine the effects of Earth s rotation and the uneven
APPENDIX B NOAA DROUGHT ANALYSIS 29 OCTOBER 2007
 APPENDIX B NOAA DROUGHT ANALYSIS 29 OCTOBER 2007 ENSO Cycle: Recent Evolution, Current Status and Predictions Update prepared by Climate Prediction Center / NCEP October 29, 2007 Outline Overview Recent
GNSS Technology for the Determination of Real-Time Tidal Information
 GNSS Technology for the Determination of Real-Time Tidal Information Benjamin Kidder C-Nav Positioning Solutions European region Outline of Topics Covered Introduction to Tides Past and Present Methods
SIO 210 Final examination Wednesday, December 11, PM Sumner auditorium Name:
 SIO 210 Final examination Wednesday, December 11, 2013 2-5 PM Sumner auditorium Name: Turn off all phones, ipods, etc. and put them away. This is a closed book exam. You may use one page of notes, both
Mean Sea Level Pressure and Wind Climatology over the North Indian Ocean: Quality control, Validation and Biases
 Mean Sea Level Pressure and Wind Climatology over the North Indian Ocean: Quality control, Validation and Biases M. Rajeevan and S.K.Dikshit India Meteorological Department Pune. India Introduction India
Jurnal Teknologi. Super Yatch Design Study for Malaysian Sea (Langkawi Island) Full paper
 Full paper") Jurnal Teknologi Full paper Super Yatch Design Study for Malaysian Sea (Langkawi Island) Koh K. K. a*, Ibrahim M. I. H. M., Kader A. S. A., Agoes P., Rahimuddin, Arib M. N., Zan U. I., Lok K. B., Wira
Jurnal Teknologi Full paper Super Yatch Design Study for Malaysian Sea (Langkawi Island) Koh K. K. a*, Ibrahim M. I. H. M., Kader A. S. A., Agoes P., Rahimuddin, Arib M. N., Zan U. I., Lok K. B., Wira
Lecture Outlines PowerPoint. Chapter 18 Earth Science 11e Tarbuck/Lutgens
 Lecture Outlines PowerPoint Chapter 18 Earth Science 11e Tarbuck/Lutgens 2006 Pearson Prentice Hall This work is protected by United States copyright laws and is provided solely for the use of instructors
Climate & Earth System Science. Introduction to Meteorology & Climate. Chapter 07. Lecture 14. Global Scale Winds. Simple Introductory Examples:
 Climate & Earth System Science Introduction to Meteorology & Climate MAPH 10050 Peter Lynch Peter Lynch Meteorology & Climate Centre School of Mathematical Sciences University College Dublin Meteorology
Ocean Currents Shortcut method by to learn faster
 Ocean Currents Shortcut method by to learn faster In our geography notes on the hydrosphere, we have seen the major movements of the ocean water. They are waves, tides and ocean currents. Having covered
Ocean Currents Shortcut method by to learn faster
 Ocean Currents Shortcut method by to learn faster In our geography notes on the hydrosphere, we have seen the major movements of the ocean water. They are waves, tides and ocean currents. Having covered
Atmosphere, Ocean and Climate Dynamics Fall 2008
 MIT OpenCourseWare http://ocw.mit.edu 12.003 Atmosphere, Ocean and Climate Dynamics Fall 2008 For information about citing these materials or our Terms of Use, visit: http://ocw.mit.edu/terms. Problem
McKnight's Physical Geography 11e
 Chapter 2 Lecture McKnight's Physical Geography 11e Lectures Chapter 5 Atmospheric Pressure and Wind Michael Commons Ohio Northern University Atmospheric Pressure and Wind The Nature of Atmospheric Pressure
OCN 201 Surface Circulation
 OCN 201 Surface Circulation Excess heat in equatorial regions requires redistribution toward the poles 1 In the Northern hemisphere, Coriolis force deflects movement to the right In the Southern hemisphere,
Training program on Modelling: A Case study Hydro-dynamic Model of Zanzibar channel
 Training program on Modelling: A Case study Hydro-dynamic Model of Zanzibar channel Mayorga-Adame,C.G., Sanga,I.P.L., Majuto, C., Makame, M.A., Garu,M. INTRODUCTION Hydrodynamic Modeling In understanding
Behavior of the Wyrtki Jet observed with surface drifting buoys and satellite altimeter
 GEOPHYSICAL RESEARCH LETTERS, VOL. 36, L18607, doi:10.1029/2009gl039120, 2009 Behavior of the Wyrtki Jet observed with surface drifting buoys and satellite altimeter Yun Qiu, 1 Li Li, 1 and Weidong Yu
Impacts of intraseasonal oscillation on the onset and interannual variation of the Indian summer monsoon
 Chinese Science Bulletin 2009 SCIENCE IN CHINA PRESS Springer Impacts of intraseasonal oscillation on the onset and interannual variation of the Indian summer monsoon QI YanJun 1,2,3, ZHANG RenHe 2, LI
Modification of the Stratification and Velocity Profile within the Straits and Seas of the Indonesian Archipelago
 DISTRIBUTION STATEMENT A. Approved for public release; distribution is unlimited. Modification of the Stratification and Velocity Profile within the Straits and Seas of the Indonesian Archipelago Amy Ffield
Introduction to Oceanography OCE 1001
 Introduction to Oceanography OCE 1001 Lecture Notes Chantale Bégin & Jessica Fry Version 2.1 10. Ocean Circulation (Trujillo, Chapter 7) Major ocean currents are stable and predictable; they have been
Monsoon variability over South and East Asia: statistical downscaling from CMIP5 models
 Monsoon variability over South and East Asia: statistical downscaling from CMIP5 models AMITA PRABHU* Jaiho OH, P. Bhaskar, R.H. Kripalani Indian Institute of Tropical Meteorology Pune 411008, India *Presenter:
Wednesday, September 27, 2017 Test Monday, about half-way through grading. No D2L Assessment this week, watch for one next week
 Wednesday, September 27, 2017 Test Monday, about half-way through grading No D2L Assessment this week, watch for one next week Homework 3 Climate Variability (due Monday, October 9) Quick comment on Coriolis
Investigation of Common Mode of Variability in Boreal Summer Intraseasonal Oscillation and Tropospheric Biennial Oscillation
 Investigation of Common Mode of Variability in Boreal Summer Intraseasonal Oscillation and Tropospheric Biennial Oscillation 5. Introduction The Asian summer monsoon is one of the most vigorous and energetic
LONG- TERM CHANGE IN PRE- MONSOON THERMAL INDEX OVER CENTRAL INDIAN REGION AND SOUTH WEST MONSOON VARIABILITY
 LONG- TERM CHANGE IN PRE- MONSOON THERMAL INDEX OVER CENTRAL INDIAN REGION AND SOUTH WEST MONSOON VARIABILITY *S.S. Dugam Indian Institute of Tropical Meteorology, Pune-411008 *Author for Correspondence
THE CIRCULATION IN THE NORTERN PART OF THE DENMARK STRAIT AND ITS VARIABILITY ABSTRACT
 ICES em 19991L:06 THE CIRCULATION IN THE NORTERN PART OF THE DENMARK STRAIT AND ITS VARIABILITY Steingrimur J6nsson Marine Research Institute and University of Akureyri, Glenirgata 36, 600 Akureyri, Iceland,
W3 Global Circulation Systems
 W3 Global Circulation Systems Which regions of Earth receive the most energy from the Sun? If not for global circulation systems There would only be two narrow regions that would support life What
Remote influence of Interdecadal Pacific Oscillation on the South Atlantic Meridional Overturning Circulation variability
 Remote influence of Interdecadal Pacific Oscillation on the South Atlantic Meridional Overturning Circulation variability 2017 US AMOC Science Team Meeting May 24 th, 2017 Presenter: Hosmay Lopez 1,2 Collaborators:
Mechanistic links between the tropical Atlantic and the Indian monsoon in the absence of El Nino Southern Oscillation events
 Mechanistic links between the tropical Atlantic and the Indian monsoon in the absence of El Nino Southern Oscillation events Vijay Pottapinjara 1*, Roxy Mathew Koll2, Raghu Murtugudde3, Girish Kumar M
Summary of Lecture 10, 04 March 2008 Introduce the Hadley circulation and examine global weather patterns. Discuss jet stream dynamics jet streams
 Summary of Lecture 10, 04 March 2008 Introduce the Hadley circulation and examine global weather patterns. Discuss jet stream dynamics jet streams arise because the Coriolis force prevents Hadley-type
PHSC 3033: Meteorology Air Forces
 PHSC 3033: Meteorology Air Forces Pressure Gradient P/ d = Pressure Gradient (Change in Pressure/Distance) Horizontal Pressure Gradient Force (PGF): Force due to pressure differences, and the cause of
SUPPLEMENTARY INFORMATION
 doi: 1.138/nature877 Background The main sis of this paper is that topography produces a strong South Asian summer monsoon primarily by insulating warm and moist air over India from cold and dry extratropics.
Your web browser (Safari 7) is out of date. For more security, comfort and the best experience on this site: Update your browser Ignore
 is out of date. For more security, comfort and the best experience on this site: Update your browser Ignore") Your web browser (Safari 7) is out of date. For more security, comfort and the best experience on this site: Update your browser Ignore L A NIÑA El Niño-Southern Oscillation (ENSO) For the complete encyclopedic
Your web browser (Safari 7) is out of date. For more security, comfort and the best experience on this site: Update your browser Ignore L A NIÑA El Niño-Southern Oscillation (ENSO) For the complete encyclopedic
Tidal regime along Vietnam coast under impacts of sea level rise
 VNU Journal of Science, Earth Sciences 28 (2012) 133-139 Tidal regime along Vietnam coast under impacts of sea level rise Tran Thuc, Duong Hong Son* Vietnam Institute of Meteorology, Hydrology and Environment
Lecture 8: Pressure and Wind
 Lecture 8: Pressure and Wind Pressure Distribution Forces Affect Wind Earth s Rotation Coriolis Force Geostrophic Balance Energy (Heat) The first law of thermodynamics Air Temperature Air Pressure Air
Lornshill Academy. Geography Department Higher Revision Physical Environments - Atmosphere
 Lornshill Academy Geography Department Higher Revision Physical Environments - Atmosphere Physical Environments Atmosphere Global heat budget The earth s energy comes from solar radiation, this incoming
Variability of surface transport in the Northern Adriatic Sea from Finite-Size Lyapunov Exponents" Maristella Berta
 Variability of surface transport in the Northern Adriatic Sea from Finite-Size Lyapunov Exponents" Maristella Berta Marseille, 29 November 2011 Outline Geographical setting (winds and circulation of Adriatic
ATMS 310 Tropical Dynamics
 ATMS 310 Tropical Dynamics Introduction Throughout the semester we have focused on mid-latitude dynamics. This is not to say that the dynamics of other parts of the world, such as the tropics, are any