This file is part of the following reference: Access to this file is available from:
|
|
|
- Tracy Griffith
- 5 years ago
- Views:
Transcription


1 This file is part of the following reference: Shahriar, Mohammad Abu Naser (2014) Settlement of shallow foundations due to rise of water table in granular soils. PhD thesis, James Cook University. Access to this file is available from: The author has certified to JCU that they have made a reasonable effort to gain permission and acknowledge the owner of any third party copyright material included in this document. If you believe that this is not the case, please contact ResearchOnline@jcu.edu.au and quote
2 Settlement of Shallow Foundations Due to Rise of Water Table in Granular Soils Thesis submitted by Mohammad Abu Naser Shahriar BSc. (Hons) In November 2014 For the degree of Doctor of Philosophy In the College of Science, Technology and Engineering James Cook University
3 STATEMENT OF ACCESS I, the undersigned, the author of this thesis, understand that James Cook University will make it available for use within the University Library and, by microfilm or other means, allow access to users in other approved libraries. All users consulting this thesis will have to sign the following statement: In consulting this thesis, I agree not to copy or closely paraphrase it in whole or in part without the written consent of the author; and to make proper public written acknowledgement for any assistance which I have obtained from it. Beyond this, I do not wish to place any restriction on access to this thesis. 28/11/2014 Signature Date ii
4 STATEMENT OF SOURCES DECLARATION I declare that this thesis is my own work and has not been submitted in any form of another degree or diploma at any university or other institution of tertiary education. Information derived from the published or unpublished work of others has been acknowledged in the text and a list of references is given. 28/11/2014 Signature Date DECLARATION- ELECTRONIC COPY I, the undersigned, the author of this work, declare that to the best of my knowledge, the electronic copy of this thesis submitted to the library at James Cook University is an accurate copy of the printed thesis submitted. 28/11/2014 Signature Date iii
5 ACKNOWLEDGEMENTS I would like to express my deepest appreciation to all the professors, supervisors, friends and my family members for their incredible support, sincere guidance and encouragement throughout the tenure of my post graduate research study. I would like to express my special appreciation and thanks to my principal supervisor A/Professor Dr. Nagaratnam Sivakugan, who has been a tremendous mentor for me. I would like to thank my associate supervisors Dr. Vincent Wang and Professor Braja M. Das for encouraging my research and providing me excellent research training. I want to thank Mr Warren O Donnell for his valuable advice and guidance. I would also like to thank all my friends and colleagues, especially Hasan Mahmud, Shanka Widisinghe, Dhanya Ganesalingam for their ongoing support and valuable assistance. A special thanks to my family. I wish to express my sincere love and gratitude to my beloved wife Afrin Mehjabeen and my parents Abdul Latif Sarker and Nazma Ahmed for their understanding and endless love throughout the duration of my studies. iv
6 ABSTRACT Shallow foundations are designed to limit settlements within tolerable limits. Rise of water level due to seasonal changes produce additional settlements of footings resting on granular soils and can threaten the integrity of the structure. Effect of water table rise on shallow foundation settlement was addressed by various researchers. Terzaghi s intuitive suggestion was to double the predicted settlement in dry sand to get the settlement in submerged condition. Analytical, experimental and numerical works by others were aimed at developing a correction factor to account for the effect of water table rise on foundation settlement. The objective of this study is to investigate the effect of water level rise on shallow foundation settlement in granular soils through numerical, analytical and experimental studies. This study revisits Schmertmann s (1970) strain influence factor diagrams and modified influence factor diagrams for footings of various shapes (strip, circular, square, rectangular) are proposed using linear elastic models in FLAC and FLAC 3D. Then a rational method is proposed, based on proposed strain influence factors, to predict the additional settlement produced by the rise of water table on a footing resting on sands. The proposed method is validated by extensive laboratory test data where model footings of five different shapes were loaded in sand placed at two relative densities, where water level was raised from the bottom while the additional settlements were measured. This study also investigates how the additional settlement due to submergence is affected by various soil parameters. Nine different granular soils with wide range of variety in grain size distribution, uniformity and void ratio range were used for laboratory model study, and the results were analysed to determine the effect of different soil properties on settlement in submerged condition. Effect of fines content on settlement increment was investigated and additional settlements in loose and dense sands were compared. Particle shape parameters of the nine soils were determined by analysing microscopic images of soil grains and effect of particle shapes on additional settlement due to submergence was studied. The study undertaken has also used explicit finite difference code FLAC and FLAC 3D to simulate the rise of ground water table in granular soil and the resulting additional settlement was studied. The numerical results were compared with the laboratory test data and the proposed rational method for water table correction factor prediction. Elastic, nonlinear elastic and elasto-plastic constitutive models were used to investigate the variation of water v
7 table correction factor with water table depth. Effect of various parameters (footing embedment depth, Poison s ratio, finite layer thickness and layered soil system etc.) on additional settlement due to water level rise is also discussed in this study. The results obtained in this study will be valuable in understanding effect of different soil parameters and ground conditions on additional settlement that might occur as a result of water table rise. The rational method proposed herein will be useful for design engineers in predicting settlement correction factor for water table rise in granular soils. The findings from this dissertation have been disseminated through the following technical papers, technical notes, and conference papers. 1. Shahriar, M. A., Sivakugan, N., Das, B.M. (2012a). Strain Influence Factors for Footings on an Elastic Medium. Proceedings, 11 th Australia New Zealand conference on geomechanics, Melbourne, Shahriar, M.A., Sivakugan, N., and Das, B.M. (2012b). "Settlements of shallow foundations in granular soils due to rise of water table A critical review." International Journal of Geotechnical Engineering, J Ross Publishing, 6(4), Shahriar, M.A., Sivakugan, N., Urquhart, A., Tapiolas, M., and Das, B.M. (2013a) A study on the influence of ground water level on foundation settlement in cohesionless soil. Proceedings of the 18th International Conference on Soil Mechanics and Geotechnical Engineering: challenges and innovations in geotechnics, Paris, Shahriar, M. A., Sivakugan, N., and Das, B.M. (2013b). "Settlement correction for future water table rise in granuular soils: a numerical modelling approach." International Journal of Geotechnical Engineering, Maney Publishing, 7 (2), Shahriar, M. A., Sivakugan, N., Das, B.M., Urquhart, A., Tapiolas, M. (2014). Water Table Correction Factors for Settlements of Shallow Foundations in Granular Soils. International Journal of Geomechanics, ASCE (published online ahead of print). vi
8 Contents STATEMENT OF ACCESS... ii STATEMENT OF SOURCES... iii ACKNOWLEDGEMENTS... iv ABSTRACT... v List of figures...xi List of Tables... xv List of Symbols... xvi Chapter 1 Introduction General Effect of Water Table Rise on Settlement Current State-of-the-Art Objectives and Scope of the Research Relevance of the research... 7 Chapter 2 Literature Review General Settlement prediction methods for shallow footings on granular soils Rise of water table and its effect on shallow foundation settlement Effect of watertable on N value Further Developments Theoretical Analysis Field Investigations Laboratory Model Tests Conclusion Chapter 3 Strain Influence Factor Diagrams for Footings on an Elastic Medium General Strain Influence Factor Diagrams Derivation of Strain Influence Factor Diagrams using FLAC and FLAC 3D Linear elastic analysis Effect of Poisson s ratio Non-linear elastic analysis Equation for Modified Strain Influence Factor Diagrams vii
9 3.7 Conclusion Chapter 4 Laboratory Modelling of Shallow Footings and the Effects of Water Level Rise on Granular Soils on Settlements General Properties of granular soils used in the test Properties of soil used in settlement tank test Properties of soil used in small mould test Settlement tank test Experimental Program Apparatus Testing Procedure Small Mould Test Experimental Program Apparatus Testing Procedure Scale effect Capillary Rise Conclusion Chapter 5 Interpretation of Laboratory Test Results General Settlement tank test Settlement Tank Test Results Water table rise in granular soils Proposed model for determining C w Interpretation of settlement tank test data Model validation Additional settlement due to change in water level within the influence zone Cylindrical Mould Test Interpretation of small mould test data Relationship between Standard Penetration Number (N) and C w,max Effect of fines content on C w,max Effect of void ratio range on C w,max Effect of Volumetric Strain Potential on C w,max Soil Gradation and Water Table Correction Factor viii
10 5.4 Effect of particle shape on water table correction factor Summary and Conclusion Chapter 6 Numerical Modelling of Water Table Rise in Granular Soil General Review of FLAC and FLAC 3D Numerical Modelling of water table rise in settlement tank in the laboratory Sensitivity Analysis Comparison of Numerical and Experimental Results Comparison of the numerical and experimental results with C w prediction method proposed in Chapter Use of various constitutive models in determining C w Linear Elastic Model Hyperbolic Non-linear Elastic Model Mohr-Coulomb Elasto-plastic Model Comparison of different constitutive models Effect of various parameters on water table correction factor Effect of embedment depth Effect of Poisson s ratio Effect of finite layer thickness Effect of layered soil profile Effect of Gibson Soil Profile Summary and Conclusion Chapter 7 Summary, Conclusions and Recommendations Summary Conclusions Recommendations for Future Research Reference APPENDIX A APPENDIX B Settlement tank test result on loose dry sand Settlement tank test result on dense dry sand Settlement tank test result on loose saturated sand Settlement tank test result on dense saturated sand Appendix C ix
11 Double tangent method applied in settlement tank tests Appendix D Appendix D x
12 List of figures Figure Description Page No. Figure 1. 1 : Schematic diagram of foundation 3 Figure 1. 2 : Water table correction factors proposed by various researchers, when Df =0 (adapted after US Army Corps of Engineers,1991) 5 Figure 2. 1 : Schematic diagram of foundation 13 Figure 2. 2 : Water table correction factors proposed by various researchers, (a) when Df=0, (b) when Df=0.5B, (c) when Df=B (adapted after US Army Corps of Engineers, 1991) 16 Figure 2. 3 : Water table correction factors obtained by analytical methods (adapted after Bazaraa, 1967) 18 Figure 2. 4 : Load-settlement curve obtained from field investigation by Ferreira and Da Silva (1961) 21 Figure 2. 5 : Load-settlement curve for circular plates on clayey sandy gravel in dry (solid line) and submerged (dotted line) condition (adapted after Dvorák, 1963) 21 Figure 2. 6 : Correction factor for varying water table depth from laboratory model tests of Agarwal and Rana (1987) 24 Figure 2. 7 : Settlement of 6 cm x 6 cm model footing in dry and submerged condition (adapted after Murtaza et al, 1995) 24 Figure 2. 8 : Additional settlement due to water table rise obtained from laboratory experiments by Morgan et al. (2010) 25 Figure 3. 1 : Strain influence factor diagrams- a) Schmertmann (1970), b) Schmertmann et at. (1978), c) Terzaghi et al. (1996) (adapted after Sivakugan and Das 2010) 31 Figure 3. 2 : Strain influence factor diagrams obtained from linear elastic analysis 33 Figure 3. 3 : Effect of Poisson s ratio on strain influence factor diagrams- a) circular footing, b) strip footing 34 Figure 3. 4 : Vertical strain at different loading conditions in nonlinear elastic analysis 35 Figure 3. 5 : Comparison of derived influence factor diagrams and diagrams based on Eq for, a) circular footing, b) square footing (B/L = 1.0), c) Rectangular Footing (B/L = 0.75), d) Rectangular Footing (B/L = 0.50), e) Rectangular Footing (B/L = 0.25), f) strip footing 37 Figure 4. 1 : Photographs of the granular soils used in the test with mm scale, (a)soil 1, (b)soil 2,(c) soil 3, (d) soil 4,(e) soil 5,(f) soil 6,(g) soil 5a,(h) soil 5b, (i) soil 5c 46 Figure 4. 2 : Grain size distribution curves for the nine soils used in the model tests 46 Figure 4. 3 : The Perspex tank used in the settlement tank test 48 xi
13 Figure 4. 4 : Model footings used in the settlement tank test 49 Figure 4. 5 : Experimental setup for for settlement test in the laboratory: (a) filling the settlement tank in layers, (b) details of load and settlement measurement system, (c) experimental setup, (d) schematic diagram of the test setup. 50 Figure 4. 6 : Simulation of water level rise during the settlement tank test 52 Figure 4. 7 : Experimental setup for settlement test in the laboratory, (a) schematic diagram, (b) photograph. 54 Figure 4. 8 : Experimental setup for soil in (a) dry condition, (b) wet condition 56 Figure 4. 9 : Results of footing tests on Fuji river sand relating critical state line (adapted after Fellenius and Altaee(1994) 58 Figure : Grain size distribution of the soil used in settlement tank before and after sieving 59 Figure : Capillary test of sieved soil using Perspex tubes protruding from water 60 Figure : Capillary rise comparison of the sieved soil and original soil at a) 10% relative density b) 80% relative density 61 Figure : Variation of capillary rise of the sieved sand with time 62 Figure : Degree of saturation and additional effective stress with elevation above water table in unsaturated zone in dense sand after five minutes 63 Figure 5. 1 : Applied pressure vs. settlement curve for model footings resting on dry loose sand 67 Figure 5. 2 : Bearing capacity determination using double tangent method for rectangular footing (B/L=0.25) resting on dry loose sand. 68 Figure 5. 3 : Pressure-settlement plot for model footings resting on dense sand (77% relative density) in dry condition 68 Figure 5. 4 : Cw-z/B variation for dense and loose sands: from the model tests on (a) dense sand, (b) loose sand 69 Figure 5. 5 : Applied pressure-settlement test in wet tests for footings resting on a) loose sands, b) dense sands 70 Figure 5. 7 : Comparison of strain influence factor diagrams proposed in Chapter 3 to those proposed by Schmertmann et al. (1978) 72 Figure 5. 6 : (a) Schematic diagram, (b) Strain influence factor, and(c) Water table correction factor Cw 72 Figure 5. 8 : Effects of n on Cw z variation based on proposed strain influence factors for square footings (Cw,max = 2). 74 Figure 5. 9 : Cw z variation for different strain influence factors for square footings (Cw,max = 2, n = 1) 74 Figure : Variation of Aw//At of various footings with water table depth 75 Figure : Water table correction factor diagrams based on proposed semi-empirical equation for (a) dense sand, and (b) loose sand 77 Figure : Cw-z/B variation from the model tests: (a) circular footing in dense sand, (b) rectangular (B/L = 0.5) footing in dense sand, (c) circular footing in loose sand, and (d) rectangular (B/L = 0.5) footing in loose sand. 78 xii
14 Figure : Change in water level within the depth of influence 79 Figure : Applied pressure-settlement diagram and the application of double tangent method for Soil 3 in dense and dry state 81 Figure : Variation of Cw,max of soil 1 with relative density obtained from settlement tank test and small mould test 83 Figure : Variation of Cw,max with normalized standard penetration number (N1)60 obtained from Eq Figure : Effect of fine contents on Cw,max of soil 5 in loose and dense state. Inset: Cw,max vs. fines content for dense state. 85 Figure : Variation of Cw,max with fine contents for all soils in loose and dense state. Inset: Cw,max vs. fines content for dense state. (Soil number given alongside corresponding data point) 86 Figure : Variation of Cw,max ratio in loose sand to dense sand with fine contents 86 Figure : Change in Cw,max ratio with void ratio range 87 Figure : Variation of Cw,max in dense sands with void ratio range. Inset: Cw,max vs. void ratio range for emax-emin> Figure : Change in Cw,max ratio on loose sand to dense sand with volumetric strain potential. 88 Figure : Change in Cw,max ratio with coefficient of uniformity in uniform and well graded soils 89 Figure : Particle shape determination. 90 Figure : Optical micro-photograph of soil 2 91 Figure : Particle shape parameter determination method using Autodesk Inventor Figure : Effect of sphericity on a) Cw,max in loose and dense state, b) Cw,max ratio in loose state to dense state 94 Figure : Effect of roundness on a) Cw,max in loose and dense state, b) Cw,max ratio in loose state to dense state 95 Figure : Effect of regularity on a) Cw,max in loose and dense state, b) Cw,max ratio in loose state to dense state 96 Figure 6. 1 : Schematic diagram of the settlement tank used in laboratory test and in numerical modelling 100 Figure 6. 2 : Distribution of mesh density zones in FLAC 102 Figure 6. 3 : Distribution of elements in 100x25x1mesh density combination 103 Figure 6. 4 : Settlement at various mesh combinations 104 Figure 6. 5 : Variation of vertical stress at a depth 0.5B below the centreline of the footing at various mesh densities. 104 Figure 6. 6 : Radially graded mesh around brick shape used in modelling square and rectangular footings on FLAC 3D 106 Figure 6. 7 : Settlement at various mesh combinations 106 Figure 6. 8 : Stress distribution below the footing due an applied load of 10 kpa for a) circular footing and b) rectangular footing, obtained from FLAC and FLAC3D, xiii
15 respectively. 107 Figure 6. 9 : : Comparison of percentage of additional settlement of circular footing at various water table depths obtained from numerical and experimental results on, a) dense sand, b) loose sand 109 Figure : Comparison of percentage of additional settlement of rectangular footing resting on dense sand at various water table depths obtained from numerical and experimental results 110 Figure : Comparison of proposed method and experimental results with numerical results using FLAC and FLAC 3D for a) circular footing, b) rectangular footing (B/L=0.5) 112 Figure : Additional Settlements due to rise in water table, based on linear elastic constitutive model 113 Figure : Cw versus Dw /B for a circular footing on a hyperbolic non-linear elastic medium: (a) For ᶲ = 40 and different stress levels, and (b) At same applied load (150 kpa) and different friction angles 115 Figure : Settlement corrections in circular footings for water table rise based on the three different soil models under working loads. 116 Figure : Settlement in dry and submerged soil in (a) elastic medium, and (b) hyperbolic soil model (Young s modulus of the dry sand E = 20 MPa, Poisson s ratio = 0.2, dry unit weight of the sand = 17.2 kn/m 3, saturated unit weight = 20.1 kn/m 3, and submerged unit weight of the sand = 10.3 kn/m 3 ) 117 Figure : Applied pressure vs. settlement curve for different models in dry and submerged condition based on three different constitutive models 118 Figure : Variation of water table correction factor with normalized water table depth at different embedment depths 120 Figure : Variation of Cw with normalized water table depth at Df =B, based on numerical results and works by other researchers. 120 Figure : Variation of Aw/At with water table depth at various Poisson s ratio 122 Figure : Schematic diagram of Influence factor diagram and Aw/At diagram for a footing resting on a soil underlain by an incompressible stratum. 123 Figure : Variation of Aw/At plot against the normalized water table depth at various values of hf 124 Figure : Variation of C1 and C2 with hf 125 Figure : Validation of Eq. 6.4 with numerical modelling results at, a) hf = 2B and b) hf = 10B 125 Figure : Schematic diagram of a two layered soil profile 126 Figure : Comparison of numerical results and proposed method of water table correction factor determination in a two layer system 129 Figure : Percentage of total additional settlement due to water level rise at various water level depths for different values of β 130 xiv
16 Table List of Tables Description 2.1 Equations for water table correction factors 3.1 Values of strain influence factors at various depths for different footing shapes 4.1 Laboratory test program for granular soils used in the tests 4.2 Properties of sand used in settlement tank test 4.3 Basic Soil Properties of the nine soils used in the model tests 5.1 Aw/At values at different depths for various footing shapes 5.2 Cw,max and Dr of the sands tested. 5.3 Particle shape parameters of the nine soils used in the test 6.1 Grid size, number of elements, vertical displacements and vertical stresses at 0.5B below the centre of footing in FLAC 6.2 Grid size, number of elements and vertical displacements of the centre of footing xv
17 List of Symbols β = Gibson modulus ratio γ = Unit weight of sand γ w = Unit weight of water ε = Axial strain ε z = Vertical normal strain at depth z єv = Volumetric strain potential ν = Poisson s ratio ξ = Regularity σ = Effective stress σ = Total stress / σ 0 = Effective overburden pressure at footing level σ r = Radial stress increase due to applied load σ, σ = Principal stresses in x, y and z direction 1 σ 2, ( σ σ 3 1 3) max = Asymptotic value of stress difference σ z = Vertical stress increase due to applied load / σ v0 = Overburden pressure at the depth where peak occurs φ = Friction angle φ c = Friction angle at zero dilation Ψ = Distance from critical state line At = Total area of the influence factor diagram Aw = Area of the influence factor diagram that is submerged B = Foundation width C = Footing shape factor C 1 = Embedment depth correction factor C 2 = Time correction factor Cc = Coefficient of curvature Cu = Coefficient of uniformity C w = Water table correction factor Cw,max = Maximum value of water table correction factor d50 = Median grain size xvi
18 d max in = Maximum/largest inscribed circle within a sand particle d max in = Minimum/smallest circumscribed circle of a sand particle d10 = Effective grain size D f = Footing depth of embedment D w = Water table depth D r = Soil relative density emax-emin = Void ratio range E = Young s modulus of the dry sand E 0 = Young s modulus of soil at the base of the footing E i = Initial tangent modulus E z = Elastic modulus of soil at depth z EI = Elongation index Fc = Percentage of fines content in soils hf = Depth of thickness of the soil mass I Z = Influence factor at depth z K 0 = Coefficient of earth pressure at rest l1 = Length of major axis l2 = Length of intermediate axis n = Curve-fitting parameter (N1)60 = Standard Penetration Test (SPT) number, corrected for overburden pressure and hammer efficiency N60 = SPT number, corrected for hammer efficiency N = Field Standard Penetration Number N γ = Bearing capacity factor q = Applied pressure q c = Cone resistance obtained from cone penetration test (CPT) q net = Net applied pressure ri = Radius of curvature of the of the particle corners R = Roundness s = Settlement of footing S = Sphericity xvii
19 S r = Degree of saturation (%) t = Time (in years) z a = Elevation above the water table in the unsaturated zone Z I = Depth of influence zone
20 Chapter 1 Chapter 1 Introduction 1.1 General Foundations are the lowest part of a structure which transmit the load from the structure to the underlying soil or rock. They have two major classes - shallow foundations and deep foundations. Foundations having the embedment depth lesser than the breadth are called shallow foundations. When the structural load is transferred deeper into the ground by piles or drilled shafts, they are called deep foundations. Shallow foundations are usually of three types - pad, strip and raft foundations. Pad footings spread the column load uniformly into the ground, whereas strip footings carry the line load from the wall. Mat or raft foundations carry the loads from multiple columns and/or walls. Shallow foundations are the most economical, conventional foundations and are usually preferred by geotechnical engineers, when the soil conditions are suitable. There are two main considerations in the design of shallow foundations - settlement and bearing capacity. The designers have to ensure that the foundation is safe with respect to bearing capacity failure into the underlying soil, and also the expected settlements are within tolerable limits. Shallow foundations are designed for specific column or wall loads and ideally they are designed such that their expected settlement is limited to 25 mm and there is safety factor of three against possible bearing capacity failure. It is believed that settlements are more critical than the bearing capacity for most foundations in granular soils, especially when the foundation width exceeds1.5 meters (this is often the case). Settlement pattern in cohesive and cohesionless soil varies significantly. In granular soil, the settlement is almost instantaneous and there might be some long-term creep. In case of fine grained soil, settlement occurs in three stages - immediate settlement, primary and secondary consolidation settlement. Unlike cohesive soils, it is very hard to get undisturbed soil samples for granular soils, which makes the laboratory determination of soil stiffness extremely difficult. This is why in situ test results are used to get the soil stiffness in many settlement prediction methods. There are more than 40 different settlement prediction techniques available to estimate settlements of shallow foundations in granular soils, many more than for cohesive soils. These can be divided into two major categories- 1) empirical or semi-empirical methods that 1
21 Chapter 1 correlate settlements with in situ test results and 2) analytical methods based on elastic theory. In spite of all these different techniques and advancement in the computing power, the current state-of-the-art in the design of shallow foundations in granular soils remains very poor (Sivakugan and Johnson 2004). The most important factors for shallow foundation design are applied pressure, soil stiffness, and width, depth and shape of the footing. Variation in the water table depth also plays an important role. When the water table is shallow, appropriate design parameters are used to account for the lower stiffness of the soil beneath the water table. When future rise in water table is expected, due to rain, floods or seasonal changes, the foundation settlements can increase substantially and jeopardize the integrity of the structure. Terzaghi (1943) suggested that the soil stiffness (Young s modulus) of saturated granular soil is approximately 50% of that of the dry soil, without any strong experimental evidence. Usually a correction factor for the presence of water table is used in the design of shallow foundations. Various researchers proposed various correction factors to account for water table fluctuation below the footing. A few field investigations and some small scale laboratory experiments have been conducted so far to quantify the additional settlement due to submergence in granular soils. Predicting shallow foundation settlements on granular soils involve significant uncertainties, which can further increase if the ground water level rises below the footing level. Therefore, it is important to have a rational method to predict additional settlement due to water level rise, which should be verified by comprehensive experimental results and numerical analysis. 1.2 Effect of Water Table Rise on Settlement Shallow foundations are designed such that their expected settlements are limited to 25 mm, and the safety factor against possible bearing capacity failure is three. When the water table is close to the footing, appropriate design parameters are used to reflect the less stiff soil beneath the water table. Owing to floods, heavy rainfall or seasonal fluctuations, the water table can rise below the footing and induce additional settlements that may not have been accounted for. There are various reasons for this additional settlement. Some soils contain soluble salts that can create strong bonding with soil grains in dry state. The salt gets dissolved when submerged and this can create significant additional settlement in cohesionless soils (US Army Corps of engineers, 1990). Fine grains presented in granular soil 2
22 Chapter 1 create bonding with coarse grains in dry condition, which is lost when the soil is saturated. This results in additional settlement. Also, the lubrication mechanism of soil particle due to presence of water causes additional settlement (US Army Corps of engineers, 1990). However, the controlling factor for the settlement increment is the loss of soil stiffness due to saturation. Terzaghi (1943) suggested intuitively that the soil stiffness (i.e. Young s modulus) of a saturated soil is 50% of that of the dry soil. He noted that the effective stresses within the soil, and hence the confining stresses, are reduced by 50% when the granular soil gets submerged. As a result, when water rises from very deep, and reaches the footing level, the settlement gets doubled. Fig. 1.1 shows the schematic diagram of a shallow foundation in granular soil. Throughout this thesis, the correction factor for water table, foundation width, depth of water table below the foundation and the depth of embedment of the footing are denoted by Cw, B, Dw and Df, respectively, as illustrated in Fig Footing Figure 1. 1 : Schematic diagram of foundation Very limited work has been conducted so far to study the effect of water table rise on shallow foundation settlement in granular soils. Some researchers accounted for the additional settlement due to fluctuating water table by using a correction factor, Cw, which varies with the water table height, reaching the maximum value when the water level reaches the base of the footing. The settlement calculated for dry sand is multiplied by this correction factor Cw, to get the settlement in submerged soil. 1.3 Current State-of-the-Art The traditional approach to account for the additional settlement caused by rise in water level is to use a correction factor Cw. This is used as a multiplier to settlement in dry condition, to 3
23 Chapter 1 get the settlement in submerged condition. The value of correction factor is greater than or equal to 1 and it increases with water table rise. It is defined as: settlement with water table below the footing level C w = (1.1) settlement in dry sand Various researchers used the correction factor Cw to account for the effect of rising ground water level on shallow foundation settlement (Terzaghi and Peck 1948; Teng 1962; Alpan 1964; Bazaraa 1967; Peck 1974; Bowles 1977; Department of the Navy 1982). The depth below the footing where the water table fluctuation will not have any effect is not unanimously agreed upon. The depth of embedment of the footing also affects the influence of water table on settlement, as the surcharge due to embedment increases the settlement in raised groundwater level. The different C w factors proposed by various researchers as function of the water table depth are summarised in Fig In all these cases, it is assumed that initially the water table is well below a depth where it can cause any effect on the settlement. Bazaraa (1967) suggested that the settlement increases by 75% when the water table rises to the footing level, and that there is no effect of the water table rise when it is at a depth greater than 0.5B below the footing. All others, in agreement with Terzaghi s (1943) recommendation, suggested that the settlement increase would be 100%, when the water table rises from very deep to the footing level. In other words, C w becomes 2.0 when the water table reaches the footing level. The depth at which the water table rise starts influencing the settlement varies from 1B (Teng 1962; Peck et al. 1974; Bowles 1977) to 2B (Terzaghi & Peck 1967; Alpan 1964). It can be seen from Fig. 1.2 that there is considerable variation in the suggested values for C. For example, when the water table rises to a depth of 0.5B below w the footing, the suggested factors range from 1.00 to
24 Chapter 1 0 Watertable Correction Factor Bazaraa (1967) Watertable dpeth (D w /B) Peck et al. (1974)& Teng (1962) NAVFAC (1982) Bowles (1977) Terzaghi and Peck (1997) also Alpan (1964) 2 Figure 1. 2 : Water table correction factors proposed by various researchers, when Df =0 (adapted after US Army Corps of Engineers,1991) Various researchers have investigated the effect of submergence on settlement of shallow foundations by analytical studies, field tests and laboratory model tests. Bazaraa (1967) used settlement prediction methods proposed by Vargas (1961) and Brinch Hansen (1966) to quantify the effect of submergence, and found that the maximum value of correction factor Cw can be 1.7, when the water table reaches the footing level. Limited field investigations (Khanna et al. 1953; Ferreira and Da Silva 1961) reported in the literature show that the settlement gets doubled when the soil below the footing gets saturated, suggesting a correction factor of 2.0, supporting Terzaghi s suggestion. A few laboratory experiments have been conducted so far to investigate the effect of rising water level on settlement, and contradictory results were reported. Agarwal and Rana (1987) used three square model footings in their experiments and the results suggested a correction factor of 2.0 at complete submergence, which support Terzaghi s (1943) proposition. Three different sizes of square model footings were used by Murtaza et al. (1995) at three different soil densities, who observed significantly higher additional settlements, up to 8 to 12 times more than that in the dry sand when the sand beneath the footing is fully submerged. This implies maximum Cw values of 8-12, which are significantly higher than the values reported by the others. Morgan et al. (2001) used a single model square footing at very dense and very loose condition, and reported that the settlement increase in submerged soil can be 5.3 times 5
25 Chapter 1 (i.e. Cw=5.3) more than the settlement in dry condition. However, the contradictory results obtained from these small scale experiments justify the need for a systematic laboratory model study on the effects of the water table rise on the settlements of footings on sands. 1.4 Objectives and Scope of the Research The primary goal of this dissertation is to investigate the effect of water table rise on settlement of shallow foundation resting on cohesionless soils, based on numerical modelling, comprehensive laboratory testing and theoretical analysis. The scope of the study includes the following: To revisit Schmertmann s (1970) influence factors and develop strain influence factor diagrams for footings of various shapes (strip, circular, square, rectangular) using explicit finite difference codes, and the theory of elasticity. To propose a rational method, based on strain influence factors and experimental results, to predict the additional settlement produced by the rise of water table on a footing resting on sands. To simulate the rise of ground water table in granular soil by using explicit finite difference code FLAC and FLAC 3D and study the resulting additional settlement. To quantify the effect of varying footing shapes, water table depth, ground conditions and relevant soil parameters on additional settlement of footings due to submergence through laboratory modelling and numerical simulation. The study will involve numerical modelling, laboratory modelling and theoretical analysis. While simulating the water table rise in granular soils using FLAC and FLAC 3D, laboratory modelling of the footings will be performed concurrently and the results will be compared to verify the accuracy of the proposed method. The research will result in: Better understanding of the effect of water table rise on shallow foundation settlement resting on granular soils. A rational methodology to predict the water table correction factor that will have the flexibility to account for the varying soil properties, footing shapes and water table depths. Simple design charts and tables to assist the designers in selecting appropriate water table correction factors, which are based on sound fundamentals and verified by numerical and experimental results. 6
26 Chapter Relevance of the research A large number of settlement prediction methods for foundations resting on cohesionless soil are available in the literature, mainly due to the difficulties involved in determining soil compressibility. Yet the current state-of-the-art for settlement prediction is very poor. This is well documented in the literature. The additional settlements produced by the rise of water table below the footing can bring in further uncertainties. Therefore, it is desirable to have some rational method for determining the additional settlements induced by the water table rise that can occur due to floods, rain fall or rise in sea level. There is no widely accepted procedure to quantify the increase in settlement due to rise in water table. Various researchers proposed correction factors for water table depth based on theoretical analysis, laboratory modelling and field test results. These factors differ from each other in magnitude and also vary with water table depth. Theoretical studies conducted by Vargas (1961), Brinch Hansen (1966b) and Bazaraa (1967) suggest that when water table rises up to the footing level, the correction factor is 1.7. A few field investigations performed by Ferreira and Da Silva (1961) and Khanna et al. (1953) suggest that the correction factor is 2.0, which support Terzaghi s (1943) prediction. A few small scale laboratory experiments by Murtaza et al. (1995) and Morgan et al. (2010) have reported significantly higher values of correction factor. None of these investigated the effect of foundation shape on additional settlement caused by rising water level. Therefore, it is important to conduct a comprehensive laboratory experimental program to investigate the additional settlement induced by water table rise with varying footing shape, soil density and water table depth. The tests should be conducted with granular soils of various grain size distributions, representing well graded and poorly graded soils, in a wide range of grain sizes. The results can be analysed to determine the effect of different soil properties on settlement in submerged condition. Most of the past studies on settlement increment due to submergence are based on analytical and experimental results, and there is a lack of research efforts involving numerical modelling. Footings of different shapes can be modelled using FLAC and FLAC 3D. Circular footing can be modelled as an axisymmetric problem and strip footing as plain strain problem in FLAC. For square and rectangular footings the problem becomes three dimensional and FLAC 3D can be used. Settlement behaviour of model footings can be observed by simulating water table rise below the footings and the results can be compared with the experimental results in order to fully understand the effect of submergence on shallow foundation 7
27 Chapter 1 settlement. Influence of foundation embedment depth, Poisson s ratio, finite layer thickness and other parameters can also be studied by numerical modelling. 8
28 Chapter 2 Chapter 2 Literature Review Settlements play a critical role in the designs of shallow foundations in granular soils. Future rise in water table below the foundation can produce additional settlements, which can threaten the integrity of the structure. The tolerable settlements of shallow foundations are generally small, in the order of 25 mm, and hence any such additional settlements have to be estimated with good care. A critical review of the current state-of-the-art for estimating settlements due to water table rise is presented in this Chapter. This includes analytical studies, laboratory model tests and field tests. Terzaghi s (1943) hypothesis that settlement is doubled in granular soils when the water table rises to the ground level is supported by some analytical studies and limited field data. Laboratory model tests suggest that the settlement increase can be significantly larger, especially at higher stress-levels. 2.1 General Shallow foundations include pad, strip and raft foundations. These are often the most economical and conventional foundations that are the preferred choice of geotechnical engineers when the soil conditions are favourable. Settlements and bearing capacity are the two main considerations in the design of shallow foundations. While ensuring that the foundation is safe with respect to bearing capacity failure into the underlying soil, it is also necessary to ensure that the expected settlements are within tolerable limits. Generally, shallow foundations are designed to limit the settlements to 25 mm and to have a safety factor of at least three against bearing capacity failure. For most foundations in granular soils, it is believed that settlements are more critical than the bearing capacity, especially when the foundation width is greater than 1.5 meters, which is often the case. Settlement of a structure is not a big concern when the entire structure settles evenly. But if differential settlement occurs, that is, the adjacent footings experience a considerable difference in settlement values, there is a serious threat to the structure. The differential settlements can be controlled by limiting the total settlements of the various isolated footings that support the columns and walls. In case of shallow foundations in granular soils, the most important factors that govern the settlements are the applied pressure, soil stiffness, and the dimensions including the width, depth and shape of the footing. Variation in the water table also plays an important role as it 9
29 Chapter 2 causes fluctuation in the settlement of the shallow foundations. The soil below the water table has less stiffness, and this induces additional settlement. The groundwater level can rise up to or beyond the footing level, due to flood or rain, causing substantial additional and unforeseen settlements which can exceed the tolerable limits. The N value from standard penetration test (SPT) is used widely by geotechnical engineers for settlement prediction. Rise of water table also affects the blow count in SPT in granular soils. There is no widely accepted procedure to quantify the increase in settlement due to the rise of water table. Terzaghi (1943) intuitively proposed that the stiffness of granular soil reduces to half as it gets saturated, which in turn doubles the settlement. When the watertable rises to some depth below the footing, a correction factor for the new location of watertable is used in the design of shallow foundations. Various researchers (Terzaghi 1948; Teng 1962; Alpan I. 1964; Bazaraa 1967; Peck 1974; Bowles 1977; Department of the Navy 1982) proposed correction factors to quantify the additional settlement due to the watertable rise below the footing. These correction factors are multiplied by the settlement in dry sands, to get the settlement in submerged sands. These correction factors differ from each other in magnitude and also vary with water table depth reaching the maximum value when the water table reaches the foundation level. Limited field investigations suggest that submergence of granular soil doubles the settlement when compared to dry condition, agreeing with Terzaghi s proposition. However, only limited laboratory studies have been conducted so far (Agarwal and Rana 1987; Murtaza et al. 1995; Morgan et al. 2010), and contradictory results have been found showing that the settlements increase by 12 times due to submergence. The extensive laboratory model tests carried out by the author in this dissertation also support these findings. These are critically reviewed in this Chapter. 2.2 Settlement prediction methods for shallow footings on granular soils In the design of shallow foundations, two major criterions are taken into consideration - bearing capacity and settlement. When the foundation breadth is more than 1.5 m, settlement becomes more important than bearing capacity. Settlement of shallow foundations has two major components - elastic settlement and consolidation settlement. If the foundation is resting on granular soils, only the elastic settlement needs to be considered. In case of granular soil, it is very hard to get undisturbed soil sample which creates difficulty in determining the compressibility of the soil mass. This is why a large number of settlement prediction methods are available in the literature for footings on sand, much more than for 10
30 Chapter 2 clays. Douglas (1986) reported 40 different settlement prediction methods for cohesionless soil. These can be classified in two general categories: 1. Empirical or semi-empirical methods based on observed settlement of structures. These methods correlate settlement with various in situ tests, for example, standard penetration test (SPT), cone penetration test (CPT), dilatometer test, etc. 2. Methods that use theoretical relationships obtained from the elastic theory. Methods of this category use the Young s modulus to predict foundation settlement. Some of the most popular settlement methods were proposed by Terzaghi and Peck (1967); Schmertmann et al. (1978); Burland and Burbidge (1985); Berardi and Lancellotta (1994); Mayne and Poulos (1999). These methods were reviewed by Das and Sivakugan (2007) who also listed the empirical correlations that can be used for determining the soil stiffness. The settlement prediction exercise carried out in Texas in 1994 clearly demonstrated the inadequacy in the current state-of-the-art for settlement predictions of footings in sands (Briaud and Gibbens 1994). Here, 31 international experts were given soil data from a very extensive laboratory and in situ testing program, and were required to predict the column loads that would produce 25 mm and 150 mm settlements of the five footings prior to the load test. The predictions were quite poor, with significant difference between the predicted and actual loads. Settlements predicted by the different methods have been compared by Jeyapalan and Boehm (1986); Tan and Duncan (1991); Papadopoulos (1992); Berardi and Lancellotta (1994); and Sivakugan et al. (1998). The general observation is that most of the settlement prediction methods are conservative and hence overestimate the settlements and underestimate the allowable bearing pressures. Noting the uncertainty associated with the different methods, Sivakugan and Johnson (2004) proposed probabilistic design charts that can be used with some settlement prediction methods. These charts quantify the probabilities that the actual settlements can exceed specific values. Some researchers tried to develop settlement prediction methods using artificial neural network (Sivakugan et al. 1998; Shahin 2003). 2.3 Rise of water table and its effect on shallow foundation settlement Rise of water table in cohesionless soil causes additional settlements. This can be attributed to various reasons. Some soils have soluble salts which, due to their ionic nature, create 11
31 Chapter 2 strong bonding with the soil grains when dry. Rise in water table makes the salt get dissolved and the bonding is lost. This might create large additional settlement in loose granular soils (U S Army Corps of Engineers 1990). Presence of fines in granular soil mass can induce additional settlement when the water table rises. These fines create bonding with coarse grains in dry state, which is lost when they are saturated. Moreover, the lubrication mechanism of soil grains by water can result in additional settlement (US Army Corps of Engineers 1990). Another important reason for the increased settlement is the loss of capillary tension when the granular soil gets saturated. Capillary tension exists in partially saturated soil that exist above the water table. This causes an apparent cohesion in the granular soil mass, increases the effective stress and hence the shear strength. When the water table rises, the capillary suction is lost and additional settlement occurs (US Army Corps of Engineers 1990). But the most important cause for the additional settlement is the loss of soil stiffness which is described in the following section. Terzaghi and Peck (1948) suggested that settlement of a footing in sand depends on initial tangent modulus of soil (slope of the initial straight segment of the stress-strain curve) and increases with the decrease in the tangent modulus. As the initial modulus depends on the confining stress and confining stress is roughly proportional to effective vertical stress, it can be said that the soil modulus changes with change in effective vertical stress. In the presence of water table, the effective stress reduces roughly to half when compared to the dry condition, which in turn lowers the soil stiffness (elastic modulus) to half. Hence, the settlement gets doubled. Meyerhof (1956, 1965) noted that Terzaghi and Peck (1948) settlement calculation method is conservative and hence the correction for the presence of ground water table is not necessary. He also suggested that the effect of water table is already reflected on the value of the field standard penetration number N, and that is why further correction is not required. But if the water table rises after the determination of N value, there might be a significant increase in settlement value. Peck and Bazaraa (1969) also supported Meyerhof s (1965) view about correction for water table, but they recognised the existence of field evidence of doubling the settlement due to water table rise to the footing level. They suggested that, when the water table rises into the influence zone in the vicinity of the foundation, the settlement on dry soil should be multiplied by the following factor 12
32 Chapter 2 C w σ 0 in dry sand = (2.1) σ / 0 in submerged sand where, σ 0 = total overburden pressure at 0.5B below the footing base / σ 0 = effective overburden pressure at 0.5B below the footing base Burland and Burbridge (1985) proposed a settlement prediction method based on the statistical analysis of 200 settlement records of foundations, tanks and embankments on granular soil. In majority of the cases, water table was close to the foundation level. Among those, a few cases were noted where significantly larger settlement occurred when compared with the dry sand. Burland and Burbridge (1985) carried out a statistical analysis on 15 cases where the depth of water table was more than five meters, and found that their settlement was only about 13% less when compared to the complete data set. Another analysis was carried out on 24 plate load tests where water table was deeper than the depth of B below the plates. It gave 25% less settlement value than the best estimate of all settlement records. Based on these, Burland and Burbridge (1985) concluded that there is no statistically significant effect of the water table depth on settlement value. But it does not mean that there is no effect of water level rise on settlement. While the presence of water table is reflected on the value of the field standard penetration number N, any future rise in water table can still cause significant increase in settlement. Figure 2. 1 : Schematic diagram of foundation Various researchers have taken into account the effect of water table on foundation settlement in their settlement estimation methods. Usually, the effect is reflected as a correction factor 13
33 Chapter 2 Cw which is greater than 1. The correction factor is used to multiply the settlement calculated in dry condition to get the settlement in submerged condition. It is not unanimously agreed on the depth below which the rise in water table will have no effect on settlement. Generally it is taken as one to two times the width of the footing below the base of the footing. Depth of embedment also influences the effect of water table on settlement. The surcharge due to embedment results in increasing the settlement caused by water table fluctuation. In this thesis, the water table correction factor, foundation width, depth of embedment and water table depth will be denoted byc w, B, D and D w,respectively (as shown in Fig. 2.1). Table f 2.1 summarises the correction factors ( C w ) proposed by various researchers, and some of these are also shown graphically in Fig. 2.2 for D f / B = 0, 0.5 and Effect of watertable on N value The N value from standard penetration test is widely used in many settlement prediction methods. Hence, it is important to understand the effect of water table on the N value. The soil stiffness gets reduced when the soil gets saturated from dry state. Water lubricates the soil grains which reduce the intergranular shear resistance and increases slip potential. Also the apparent cohesion caused by capillary suction which contributes to the measured resistance, gets lost upon saturation. These affect the blow count in SPT test. 14
34 Chapter 2 Table 2.1: Equations for water table correction factors Reference Equation for Water table Correction Factor, C w Teng (1962) C w base 1 = D [ w D B f < 2.0 for water at end below footing ] Alpan (1964) C w Dw = ( ) for D w = D f (approximately)>1.0 B Terzaghi and Peck (1967) C w Dw = 2 (for surface footings) >1.0 2B Bazaraa (1967) C w / γ ( D f + B / 2) = γ / ( D + B / 2) f no water water present Peck, Hanson and 1 Cw = >1.0 Thornburn (1974) Dw [ ] D + B f Bowles (1977) C w Dw = 2 >1.0 D + B f NAVFAC(1982) C w Dw D f = 2 > B Agarwal and Rana (1987) Dw Cw = >1.0 B 15
35 Chapter 2 Watertable dpeth (D w /B) Watertable Correction Factor Bazaraa (1967) Peck et al. (1974)& Teng (1962) Bowles (1977) NAVFAC (1982) Terzaghi and Peck (1997) also Alpan (1964) (a) -0.5 Watertable Correction Factor Watertable Correction Factor Watertable Depth(Dw/B) Footing Level Bazaraa (1967) Bowles (1977) Peck Teng et al. (1962) ( 1974) NAVFAC (1982) Watertable Depth Footing Level Bazaraa (1967) Bowles (1977). Peck et al. (1974) Teng NAVFAC (1962) (1982) (b) (c) Figure 2. 2 : Water table correction factors proposed by various researchers, (a) when Df=0, (b) when Df=0.5B, (c) when Df=B (adapted after US Army Corps of Engineers, 1991) Schultze and Menzenbach (1965) and Bazaraa (1967) have shown that submergence has little effect on N value in the case of coarse granular soil. However, there are contradicting observations for fine and silty sands. Terzaghi and Peck (1948) suggested reducing the N value for dense submerged fine or silty sand by the following, NN = (N-15), when N>15 (2.2) 16
36 Chapter 2 This was contradicted by the laboratory test results of Gibbs and Holtz (1957) and Schultz and Melzer (1965). They investigated the effect of submergence on dynamic penetration value in very fine sands and observed that the penetration value gets substantially reduced in submerged sands. A large scale SPT test above and below the watertable was conducted by Bazaraa (1967) and he concluded that the N value for all fine and silty sands should be corrected by the following which is applicable for any value of N, NN = 0.6N, (2.3) Burland and Burbridge (1985) conducted statistical analysis with 8 cases of submerged fine and silty sands. Applying correction for N value suggested by Terzaghi and Peck (1948) gives better results, whereas applying Bazaraa s correction yields poorer compressibility assessment. Hence, based on the limited evidence, Burland and Burbridge (1985) concluded that Terzaghi and Peck (1948) correction gives better assessment of foundation subgrade compressibility. 2.5 Further Developments In addition to the above semi-empirical multiplication factors provided by various researchers, there were few more rational analytical studies as well as field and laboratory model tests. These are discussed in this section Theoretical Analysis Vargas (1961) proposed a method to describe the settlement behaviour of Brazilian sand. The method assumes that the elastic modulus of soil ( E z ) at any depth z depends on the vertical and radial stresses at that point by: E z ( ) σ z σ r = = α( K0. γz + σ r ) (2.4) ε z where, σ z = vertical stress increase due to applied load σ r = radial stress increase due to applied load ε z = vertical normal strain at depth z 17
37 Chapter 2 α = a constant which varies with soil type K 0 = coefficient of earth pressure at rest γ = unit weight of sand The settlement (s) of soil mass can be obtained by integrating the vertical strain ε z in Eq. 2.4, which gives: 1 σ z σ r s = dz α K z γ σ r (2.5) Figure 2. 3 : Water table correction factors obtained by analytical methods (adapted after Bazaraa, 1967) Bazaraa (1967) used the method proposed by Vargas (1961) to study the effect of submergence on granular soil. He assumed the pressure on a circular footing resting on ground surface varies as a function of foundation width. Moreover, the pressure was chosen in such a way that it matches those of the buildings in Brazil and sufficient safety factor was maintained against bearing capacity failure. The vertical and radial stress changes were calculated using elastic theory assuming the Poisson s ratio as 0.3. The settlement values were calculated for different positions of water table below the foundation and the values are shown in Fig It was found that the settlement increases approximately by 70% when the water table rises up to the footing level. 18
38 Chapter 2 Brinch Hansen s (1966b) method can also be used to quantify the effects of submergence. This method requires the values of some constants that can be obtained from oedometer and triaxial tests. Brinch Hansen proposed that the vertical strain ε1of sand can be obtained from general stress-strain relationship by using following equations: s ε = f σ + σ + σ ) (1 + C + ) (2.6) 1 ( C13 f r = be s 1+ 2K ) (1 + 2K K ) (2.7) ( o 0 c K = 1 sinφ (2.8) 0 K c 2 0 φc = tan (45 + ) (2.9) 2 C 12 σ 1 ( m 1) Kc σ 2 = m 1 n d 12 (2.10) σ 1 d 12 = (cosecφ 1)( 1) (2.11) σ 2 C 13 σ1 ( m 1) Kc σ 3 = m 1 n d 13 (2.12) σ 1 d 13 = (cosecφ 1)( 1) (2.13) σ 3 φ = sin 1 σ 1 σ 3 ( ) σ + σ 1 3 (2.14) where, σ 1, σ 2, σ 3 are principal stresses, φ c is the friction angle at zero dilation and s, b, r, m, n are constants. These constants depend on soil type, and Brinch Hansen (1966b, 1966a) gave the values for Asnoes sand in Denmark (s = 0.46, b = 2.6, r = 2.25, m = 4.5, n = 2). Bazaraa (1967) considered a surface tank resting on semi-infinite soil medium having similar properties as Asnoes sand and investigated the effect of water table rise on settlement. The tank was assumed to be circular with a diameter of B (m) and subjected to a pressure of q 19
39 Chapter 2 (kn/m 2 ) = 1.57B. Additional settlement due to water table rise was calculated using Brinch Hansen s method (1966b) for various positions of water table. The result also exhibits that settlement in submerged condition is 1.7 times the settlement in dry condition as shown in Fig Field Investigations There are limited data available on field investigation of settlements in submerged and dry conditions. Khanna et al (1953) conducted some plate loading tests on square plate having an area of 928 cm 2 embedded to meter. The tests were conducted in dry and rainy periods. The results indicated that submergence increases the settlement to around 2.1 times in case of sandy loam, and 1.4 times for coarse gravelly soil. Ferreira and Da Silva (1961) conducted three plate loading tests on marine sand in Angola. The first test was conducted on sand at natural moisture content in dry weather (curve a of Fig. 2.4). The second one was carried out at the same natural moisture content for up to kpa and then in submerged condition for higher loads (curve c ). The last test was run on submerged sand (curve b ). The results reveal that the submerged condition reduces the bearing capacity significantly and causes 2.5 times more settlement when compared to the natural moisture content. Moreover, the comparison of curve a and b indicates that the additional settlement due to submergence is much higher at high footing pressures. Ferreira and Da Silva (1961) have found iron and aluminium compounds in that soil which broke down in submerged condition and contributed to additional settlements. 20
40 Chapter 2 Figure 2. 4 : Load-settlement curve obtained from field investigation by Ferreira and Da Silva (1961) Figure 2. 5 : Load-settlement curve for circular plates on clayey sandy gravel in dry (solid line) and submerged (dotted line) condition (adapted after Dvorák, 1963) Dvorák (1963) conducted plate loading tests on clayey sandy gravel. The soil was composed of more than 60% gravel and the rest was clayey sand. He used a square plate measuring 21
41 Chapter m X m and carried out tests in dry and submerged condition. Fig. 2.5 shows the results of the tests. The solid line shows the load-settlement curve for dry soil, and the dotted line is the curve for submerged soil. The settlement in submerged sand was approximately 2.2 times than of the dry sand. In general, these limited field investigations suggest that submergence almost doubles the settlement in granular soil, supporting Terzaghi s (1943) proposition. Bazaraa (1967) collected some field investigation data for situations where the sand was partially submerged. However, these failed to give any clear picture on the effect of water table rise at different depths Laboratory Model Tests Agarwal and Rana (1987) investigated the effect of water table on foundation settlement in sand and proposed an equation for water table correction. In this series of model tests, settlement under a given load was measured for different depth of water table underneath the footing. They conducted tests on square footings of size 20 cm x 20 cm, 15 cm x 15 cm and 10 cm x 10 cm. The sand used was poorly graded, air dried and was deposited to dry unit weights of 15.5 kn/m 3 and 15.7 kn/m 3. Uniform density throughout the layer was ensured by applying rainfall method. First, an initial settlement of a specific value was applied on the footing placed on dry sand, which was followed by gradual rise of water table from the bottom of the tank up to the base of footing, and the increment in settlement was observed. A correction factor C w was proposed which is the ratio of settlement value at different water table level to the settlement on a dry soil. Fig shows the variation of water table correction factor at different water table depths ( fitted along with the line of best fit given by: D w ). The data points plotted in Fig. 2.6 were Dw Cw = (2.15) B The equation shows that the settlement increases by a factor of 1.95 when the water table rises up to the footing level. The correction factor is 1.67 when D w = 0.5 B and 1.38 when D w = 1.0 B. These experimental findings support Terzaghi s (1943) proposal that the settlement doubles when water table rises to the base of the footing and that the increase is linear. 22
42 Chapter 2 Murtaza et al (1995) conducted a settlement test on three model footings to observe the effect of submergence on settlement at different stress levels. They used three square footings of 6 cm x 6 cm, 8 cm x 8 cm and 10 cm x 10 cm placed on sand in a circular tank of 50 cm diameter and 25 cm height. Vertical load was applied in increments, and the corresponding settlement was measured. From the load-settlement curve of the dry sand, ultimate bearing capacity in each case was determined by double tangent method. The double tangent method requires that tangents be drawn to the pressure-settlement plot at the two linear segments. The intersections of these two tangents define the ultimate bearing capacity. This was divided by 1.5, 2.0 and 3.0 to get the working load at different factors of safety. These working loads were then applied on each of the footings under dry and submerged conditions. The results showed that settlement increased significantly, in the order of 8 to 12 times in wet sands. In submerged condition, settlement increased eight times for a factor of safety of 3 and twelve times for a factor of safety of 1.5 when compared to the dry conditions. Fig. 2.7 shows the applied pressure vs. settlement curves for 6 cm x 6 cm footing in submerged and dry conditions, for loose, medium and dense sands. Rekowski (2001) investigated the additional settlements at various depths of ground water level. He used uniformly graded sand (soil A) and uniform gravels (soil B) for the research. The soils were tested at different relative densities ranging from 20% to 95%. A square model footing of 100 mm width was used. Soil was placed in the test tank by pouring from a funnel held vertically. The footing was loaded to one third of its bearing capacity and the settlement at dry state was recorded. Then water level was raised and the additional settlement corresponding to different water level was recorded. The results showed that the water table correction factor Cw varied from 1.42 to 3.28 for soil 1 and from 1.51 to 2.52 for soil 2, with looser soils having higher correction factor value and vice versa. The plot of correction factor vs. water table depth was convex upwards for all cases in his study, showing higher rate of increment in the additional settlements with the water table rise. 23
43 Chapter 2 Figure 2. 6 : Correction factor for varying water table depth from laboratory model tests of Agarwal and Rana (1987) Figure 2. 7 : Settlement of 6 cm x 6 cm model footing in dry and submerged condition (adapted after Murtaza et al, 1995) Morgan et al. (2010) carried out settlement and oedometer tests to investigate the additional settlement caused by water table rise in granular soil. They filled a cubical glass tank of 500 mm side length with granular soil and placed a model square footing measuring 100 mm X 100 mm on the surface. Two types of soil were used- soil 1 was coarse sand with very little 24
44 Chapter 2 silt, and soil 2 was gravelly sand of sub-rounded grains. The test was carried out in very loose and very dense state with relative density D r =0% and 100%, respectively. Water was poured into the tank through a hollow section at the corner of the tank and the additional settlement was measured. Fig. 2.8 shows the additional foundation settlement compared to dry soil caused by the presence of water table at various depths. The results indicate that the additional settlement due to submergence can be as high as 5.3 times the settlement in dry soil. Figure 2. 8 : Additional settlement due to water table rise obtained from laboratory experiments by Morgan et al. (2010) Mohamed et al. (2012) conducted plate load tests (PLT) and model cone penetration tests (CPT) in saturated and unsaturated conditions and proposed a settlement estimation method based on the test results. They used 150 mm x 150 mm plates (i.e., model footings) placed on the sand surface, at a embedment depth equal to footing width. A test tank with plan dimensions of 1500 mm x 1200 mm and 1060 height was used. The test was carried out at different water level and matric suction values. The test results were analysed along with stress-settlement relationship proposed by Mohamed and Vanapalli (2006) considering the influence of average matric suction within the influence zone (which was taken as 1.5 B). A series of CPT tests were also carried out with the same sand under saturated and unsaturated conditions. Based on the results they proposed a modification of Schemertman et al. (1978) settlement prediction method. Schemertman et al. (1978) proposed the following equation for predicting shallow foundation settlement resting on granular soils- 25
45 Chapter 2 2B I zd z s = C1C2qnet (2.16) E 0 z / σ0 where, C 1 = embedment depth correction factor = q / σ 0 = effective overburden pressure at footing level q = applied pressure C 2 = time correction factor t = log( ) 0.1 t = time (in years) Bowles (1996) suggested an expression to obtain elastic modulus E, from cone penetration resistance, where, C = 0 E = C + C ) (2.17) ( q c and, C 4 = for normally consolidated sand Mohamed et al. (2012) proposed a modification to Eq suggested by Bowles (1996). They proposed to replace the parameter C 4 by two correlation factors, namely, f 1 and f 2. These factors were obtained by regression analysis and are dependent on relative density ( D ) of the soil. The soil condition (saturated or unsaturated) determines which factor should be used, this means 2 ( D 100) 3) f 1 1.5* +, for saturated sands = r ( 100) 3.75) 2 + f 1.2*, for unsaturated sands with D < 50% 2 = Dr ( 100) 3.75) 2 + f 2 = 1.7* Dr, for unsaturated sands with D r 50% r r 26
46 Chapter Conclusion The effect of water table rise on settlement of shallow foundation in sand was firstly discussed by Terzaghi (1943) who suggested that the saturation halves the soil stiffness and doubles the settlement. Since then, many researchers tried to investigate how the shallow foundation settlement changes due to the variation of water table depth. Various correction factors have been proposed based on analytical and experimental studies. These factors differ from each other in magnitude and with water table depth. Theoretical studies (Vargas 1961; Brinch Hansen 1966b; Bazaraa 1967) described in this Chapter suggest a correction factor of 1.7, when the water level reaches the footing surface. A few field investigations (Ferreira 1961; Khanna 1953) support Terzaghi s (1943) prediction that the water table correction factor should be two when the water table rises to the base of the footing. Some small scale laboratory experiments (Murtaza et al 1995; Morgan et al. 2010) have reported significantly higher values of additional settlements, whereas experiments conducted by Agarwal and Rana (1987) and Rekowski (2001) suggested lower water table correction factors. However, none of these studies considered the effect of footing shapes or soil properties on the additional settlements due to water table rise. In summary, the absence of any widely accepted procedure to account for the effect of water table rise in the literature, very limited field and laboratory tests and scarcity of numerical modelling studies on the effects of water table rise indicate the need for further research in this area. 27
47 Chapter 3 Chapter 3 Medium Strain Influence Factor Diagrams for Footings on an Elastic 3.1 General Settlement is one of the key considerations in designing shallow foundations. Shallow foundations in granular soils are designed such that the settlements are within tolerable limits, usually in the range of 25 mm in the case of isolated footings. Schmertmann s (1970) method is one of the most rational methods for computing settlements of footings in granular soils, and is commonly used world-wide. The method relies on a strain influence factor that varies with depth. To consider the effect of footing shape on foundation settlement, Schmertmann et al. (1978) proposed separate strain influence factors for axi-symmetric and plane strain loading situations, representing circular and strip footings, respectively. It was further modified by Terzaghi et al. (1996). The literature suggests that the researchers were not in unanimous agreement upon on the magnitude of influence factor below the footing, the depth at which it reaches the maximum and the depth it is extended below the footing. In this Chapter, Schmertmann s influence factors were revisited using FLAC and FLAC 3D, explicit finite difference codes used widely in geotechnical modelling, and the theory of elasticity. Linear elastic and non-linear elastic constitutive models were used in the analysis. The influence factors derived are compared with those proposed by Schmertmann. For square and rectangular footings, the problem becomes three-dimensional and therefore FLAC 3D was used in the analysis. The strain influence factors are developed for footings with breadth/length ratios of 0.25, 0.50, 0.75 and 1.0. The strain influence factors for the rectangular footings are presented along with those for the circular and strip footings. The effect of Poisson s ratio is also investigated. The strain influence factors proposed for the rectangular footings will be valuable in the design of shallow foundations on granular soils. The use of non-linear elastic constitutive model is more realistic than the traditional linear elastic model, and the differences are discussed. For practical use of geotechnical engineers, a mathematical form of derived strain influence factor is proposed along with a table showing influence factor values at different depth below the footing. 3.2 Strain Influence Factor Diagrams In the design of shallow foundations, two major criteria s are taken into consideration- bearing capacity and settlement. If the foundation is resting on granular soil, settlement is 28
48 Chapter 3 believed to be more critical than bearing capacity in most cases. Usually, an acceptable limit of 25 mm settlement is maintained in the design of shallow footings. In case of cohesionless soil, it is hard to get undisturbed soil sample which creates difficulty in determining compressibility of the soil mass. As a result, a large number of settlement prediction methods are available in the literature for footings on granular soil, much more than cohesive soils. Schmertmann (1970) proposed a settlement prediction method which is based on cone penetration test results and relies on strain influence factor which is a function of depth. This method is used by geotechnical engineers all over the world for its simplicity and reliability. Burland and Burbridge (1985) proposed a semi-empirical method for settlement calculation which is being more commonly used recently. The concept of strain influence factor is straightforward and simple. If a uniform pressure q is applied over a large area on an elastic half space, the resulting strain at any depth z becomes q/ E z. If the load is applied over a limited width B, the resulting strain at a depth z along the centreline will obviously be less and can be expressed as: q ε z = I z (3.1) E z where, E Z = elastic modulus at depth z I Z = influence factor at depth z The strain influence factor can be used to determine the vertical settlement s of shallow footing resting on granular soil. Schmertmann (1970) considered elastic theory, finite element analysis and load test on model footings and proposed a settlement prediction approach using the following equation, 0 I zd z s = C1C2qnet (3.2) E 2B z / σ 0 where, C 1 = embedment depth correction factor = q / σ 0 = effective overburden pressure at footing level q = applied pressure 29
49 Chapter 3 C 2 = time correction factor t = log 0.1 t = time (in years) After careful observation of theoretical and experimental results, Schmertmann (1970) proposed a simplified 2B-0.6 diagram as shown in Fig. 3.1(a). This shows that the influence factor is zero at the foundation level, increases linearly to peak at 0.6 at a depth of 0.5 B, and then decreases linearly to 0 at a depth of 2B. The Young s modulus E z can be obtained by using the equation Ez = 2q c (3.3) where, q c = cone resistance obtained from cone penetration test (CPT) To account for the effect of foundation shape on settlement, Schmertmann et al.(1978) modified the 2B-0.6 diagram as shown in Fig. 3.1(b). For square and circular footing, the value of I Z at the footing level is 0.1; it reaches its peak at a depth of 0.5B and reduces to zero at 2B. In case of strip footing, I Z value is 0.2 at foundation level, peaks at z = B and becomes zero at z = 4B. The influence factor diagram for a rectangular foundation can be obtained by interpolating between these two. The peak value of influence factor can be calculated by: I q = (3.4) σ z, peak net / vo / where, qnet is the net applied pressure and σ is the overburden pressure at the depth where peak occurs. The relationship of Young s modulus with penetration resistance was also modified by: v0 E = 2. 5, for square/ circular footing (3.5) z q c E = 3. 5, for strip footing (3.6) z q c 30
50 Chapter 3 Terzaghi et al. (1996) suggested a simpler influence factor diagram as shown in Fig. 3.1(c). They proposed I Z = 0.2 at footing level and peak of 0.6 at 0.5B depth for all footings. The depth of influence ( Z I ) was kept same as Schmertmann et al. (1978) for circular and strip footing but for rectangular footing, it should be interpolated by: L Z I = 2B[1 + log( )] forl / B 10 (3.7) B Mayne and Poulos (1999) proposed a spreadsheet integration technique to obtain the strain influence factor at various depths to calculate the foundation settlement. This technique can be used in settlement calculation on homogeneous to non-homogeneous soils having finite to infinite soil layer thicknesses. Figure 3. 1 : Strain influence factor diagrams- a) Schmertmann (1970), b) Schmertmann et at. (1978), c) Terzaghi et al. (1996) (adapted after Sivakugan and Das 2010) Despite the popularity of Schmertmann s strain influence factor method, it is very conservative (Sivakugan et al. 1998) and lacks accuracy (Tan and Duncan 1991). So, there is plenty of scope to work further on the influence factor diagrams, thus improving the settlement prediction method. In this study, linear and non-linear elastic models in FLAC 3D and FLAC to derive strain influence factors for all regular foundation shapes. Also, the depth to maximum strain, depth of influence and the effect of Poisson s ratio were investigated. 31
51 Chapter Derivation of Strain Influence Factor Diagrams using FLAC and FLAC 3D Linear elastic analysis In this study, explicit finite difference codes FLAC and FLAC 3D and the elastic theory were used to revisit Schmertmann s strain influence factors. Influence factors for all regularly shaped footings (including circular, square, rectangular and strip footings) were derived using linear elastic model. FLAC was used to model axi-symmetric and plane strain loading conditions and FLAC 3D to model square and rectangular cases. The strain influence factors were developed for footings with breadth/length ratios of 0.25, 0.5, 0.75 and 1.0. The modelling was done keeping the horizontal and rectangular boundaries 6.0 B away from the centreline of the footing and the footing width was fixed at 1.0 m. The elastic modulus was taken as 30 MPa and Poisson s ratio (ν) was fixed at 0.2 for all cases. The footings were placed on ground surface and a uniform pressure of 100 kpa was applied. Using FLAC and FLAC 3D, vertical and horizontal stresses were obtained at various depths along the centreline below the footing, which were then used to calculate the vertical strain using the constitutive relationship of Hooke s Law: where, 1 ε z = [ σ z ν ( σ x + σ y )] (3.8) E ε z and z Ez are the vertical normal strain and elastic modulus respectively at a depth z below the centreline of the footing, and σ, σ, σ are the normal stresses along x, y and z directions. x y z 32
52 Chapter 3 Figure 3. 2 : Strain influence factor diagrams obtained from linear elastic analysis The influence factor was then obtained by: I z ε zez = (3.9) q Fig. 3.2 shows the strain influence factor diagrams for footings of various shapes obtained from linear elastic analysis. The diagrams show some variations when compared to Schmertmann s (1970) originally proposed influence factor diagram as shown in the figure. Unlike the original diagram, the influence factors range between at the base of the footing, peak at around 0.83 at a depth of and extend to a greater depth. The strain influence factors extend to depth well below 4B proposed by Schmertmann for strip footing, and the factors are significantly larger. For rectangular footings also, there are noticeable strains at depths of z = 2B to 4B, and beyond. The shape of the strain influence factor plot was very similar for all footing shapes. The strain influence factor diagrams obtained from linear elastic analysis do not vary with Young s modulus, but their value changes with Poisson s ratio which is discussed in the next section Effect of Poisson s ratio There are some difficulties involved in laboratory triaxial testing (for example, capping problems, seating errors, non-uniformity of stress etc.) which result in higher Poisson s ratio value, ranging from (Lo Presti1995). Nowadays, these can be avoided by mounting 33
53 Chapter 3 local strain devices at midlevel of soil specimen and measuring strain internally (Tatsuoka and Shibuya 1992). Tatsuoka et al. (1994) showed that the drained value of Poisson s ratio for elastic continuum solutions ranges from 0.1 to 0.2 in sands. Therefore, strain influence factors for ν = 0.1 and 0.2 were derived using linear elastic model in FLAC. Fig. 3.3 shows the effect of Poisson s ratio on the strain influence factors in circular and strip footings. The figure shows that variation of Poisson s ratio affects the influence factor diagram up to a depth of 0.5 B in circular footing. For strip footing, it affects the influence factor for a depth of 1.0 B below the footing. Figure 3. 3 : Effect of Poisson s ratio on strain influence factor diagrams- a) circular footing, b) strip footing Non-linear elastic analysis Hyperbolic nonlinear elastic soil model in FLAC was used to investigate the variation of vertical strain with depth. The nonlinear elastic soil model is based on the hyperbolic stressstrain relationship proposed by Kondner and Zelaska (1963): ( σ σ ) = E i ε ε + ( σ σ ) 1 3 max (3.10) where: ( σ σ 1 3) max = asymptotic value of principal stress difference ε = axial strain 34
54 Chapter 3 E i = initial tangent modulus Fig. 3.4 shows the vertical strain distribution below the centreline of a circular footing resting on the surface of a homogeneous granular soil. Three different loading conditions were considered- 0.5, 1.0 and 1.5 times the working load of the soil (one-sixth, one-third and half of the bearing capacity of the soil). The results show that the depth of maximum vertical strain occurs at a depth of 0.3 B below the footing for all cases. This is little higher than what was obtained from linear elastic modelling (0.2 B) but less than Schmertmann s (1970) simple triangular approximation (0.5 B). Fig. 3.4 shows that elastic analysis. I z, peak occurs at 0.3B in nonlinear Figure 3. 4 : Vertical strain at different loading conditions in nonlinear elastic analysis 3.4 Equation for Modified Strain Influence Factor Diagrams For the benefit of practising engineers, it is important that the strain influence factor diagrams can be used easily in routine design. The strain influence factor diagram proposed by Schmertmann (1970) was simple and has a mathematically defined shape which makes it easy to use for routine design. Further modifications proposed by Schmertmann et al. (1978) and Terzaghi et al. (1996) also have simple mathematically defined shapes. For strain influence factor diagrams proposed in this Chapter, an equation is proposed based on several curve fitting trials. The strain influence factor Iz at a depth z can be expressed as- I z = e C( z 0.16) 0.59 ln( z + 0.2) (3.11) ( z + 0.2) where, C is the footing shape factor and can be defined as 35
55 Chapter 3 B C = (3.12) L Eq can be used for any rectangular, strip or circular footing and influence factor at any given depth can be determined by substituting the depth and appropriate footing shape factor in Eq Fig. 3.5 shows how the influence factor diagrams using Eq match with the diagrams derived in this Chapter. A careful observation of the diagrams clearly indicates that equation Eq and 3.12 can be used for proposed influence factor diagrams with reasonable accuracy. Strain influence factors for different footings at various depths are also given in Table 3.1. Anyone who is interested in using the proposed strain influence factor diagrams can either use the diagrams in Fig. 3.2 or strain influence factor equation given in Eq. 3.11, or the values given in Table
56 Chapter 3 0 Strain Influence Factor (Iz) Strain Influence Factor (Iz) Normalized Depth (Z/B) Equation (3.11) Derived Influence Factor Diagrams Normalized Depth (Z/B) Equation (3.11) Derived Influence Factor Diagrams 6 6 (a) (b) 0 Strain Influence Factor (Iz) Strain Influence Factor (Iz) Normalized Depth (Z/B) Derived Influence Factor Diagrams Equation (3.11) Normalized Depth (Z/B) Equation (3.11) Derived Influence Factor Diagrams 6 (c) Strain Influence Factor (Iz) (d) Strain Influence Factor (Iz) Normalized Depth (Z/B) Equation (3.11) Derived Influence Factor Diagrams Normalized Depth (Z/B) Equation (3.11) Derived Influence Factor Diagrams 6 (e) 6 Figure 3. 5 : Comparison of derived influence factor diagrams and diagrams based on Eq for, a) circular footing, b) square footing (B/L = 1.0), c) Rectangular Footing (B/L = 0.75), d) Rectangular Footing (B/L = 0.50), e) Rectangular Footing (B/L = 0.25), f) strip footing (f) 37
57 Chapter 3 Table 3.1: Values of strain influence factors at various depths for different footing shapes Normalized Strain Influence Factor (Iz) Depth (z/b) Circular Square Rectangular Rectangular Rectangular Strip Footing Footing Footing Footing Footing Footing (B/L=0.75) (B/L=0.50) (B/L=0.25) Conclusion Strain influence factor diagrams for footings of various shapes (strip, circular, square, rectangular) were developed using linear elastic models in FLAC and FLAC 3D. The diagrams were then compared with Schmertmann s (1970) simple triangular approximation. Unlike the original strain influence diagram, the proposed diagrams start at at footing level, 38
58 Chapter 3 rises up to 0.83 at 0.2B-0.25B depth and extend to a greater depth. Effect of Poisson s ratio on the diagrams was discussed and presented graphically for circular and strip footings. It was observed that the variation of Poisson s ratio affects the influence factor diagram up to a depth of 0.5 B in circular footing, and up to 1.0 B for strip footing. Also a simple hyperbolic nonlinear model was used to investigate the depth at which maximum vertical strain occurs. The result shows that the peak occurs at 0.3B (whereas I z, peak occurs at 0.2B in linear elastic modelling) for axi-symmetric loading at any stress level. At the end, an equation is proposed that can be used to obtain strain influence factor at any depth for different footing types. Also, influence factors at various depths are given for different footing shapes in tabular form. 39
59 Chapter 4 Chapter 4 Laboratory Modelling of Shallow Footings and the Effects of Water Level Rise on Granular Soils on Settlements 4.1 General Various researchers used different techniques, namely analytical, field tests and laboratory model studies to investigate the effect of water table rise on shallow foundation settlement resting on granular soils (Bazaraa, 1967; Vargas 1961; Brinch Hansen 1966a; Khanna et al. 1953; Ferreira and Da Silva 1961; Agarwal and Rana 1987; Murtaza et al. 1995; Morgan et al. 2001). Very little laboratory studies have been conducted so far and contradictory results have been found. Agarwal and Rana (1987) conducted tests on square footings of three different sizes (20 cm x 20 cm, 15 cm x 15 cm and 10 cm x 10 cm). Their results support Terzaghi s proposition that the settlement gets doubled when the sand gets submerged. Murtaza et al. (1995) also used three different sized square footings (6 cm x 6 cm, 8 cm x 8 cm and 10 cm x 10 cm) and conducted the tests with loose, medium dense and dense sands. The results showed 8 to 12 times more settlement in submerged condition. Morgan et al. (2010) carried out settlement tests with a square footing in two different types of soils and found that the increase in settlement in submerged sand can be 5.3 times the dry sand. However, these experimental programs were small in scale and none of these considered the effect of varying footing shapes and soil grain size distribution. An important objective of this study is to conduct comprehensive laboratory model testing and develop a rational method for predicting additional footing settlement due to water table rise based on the experimental results. This Chapter describes the experimental program that was designed to include the effect of footing shape, soil gradation and varying water table depth on settlement increment of shallow footings subjected to water level rise. For successful modelling of shallow footings, scale effect and effect of capillary rise on the test results were considered, and the experimental program was developed in such a way that their effects can be avoided. 4.2 Properties of granular soils used in the test The experimental program was divided into two parts. Firstly, model tests were performed in a rectangular tank 600 mm high and 800 mm x 800 mm plan dimensions. Model footings of different shapes were used to rest on a uniformly graded granular soil and settlements were measured in dry and submerged condition. The objective of the test was to propose a rational 40
60 Chapter 4 method to predict water table correction factor based on the test results that can incorporate the effect of footing shape. Also the variation of water table correction factor with depth of water table below the footing level was investigated in this test. Once a rational method to predict water table correction factor is proposed and the variation of correction factor with water table depth is established, the next aim was to investigate how the water table correction factor varies for different soils, when the water table is at the footing level. This was investigated in the second part of the laboratory test program, where a small cylindrical mould was used to carry out model tests on nine different cohesionless soils. The soils were chosen so that there is wide variety of grain size distributions, void ratio ranges and percentages of fine content. Since only the additional settlement due to water table rise up to the footing level was investigated in this test, it was not required to record settlements at different water table depths. This also allows using a small cylindrical mould, and the effort required to fill the mould was small in this test. A series of laboratory tests were conducted to obtain the properties of the test sand. The tests were carried out following the relevant Australian standards listed in Table 4.1. Table 4.1: Laboratory test program for granular soils used in the tests Properties Grain size distribution Australian Standard used AS (Standard method of analysis by sieving) (Standards Australia 2009) AS (Standard method of fine analysis by using a hydrometer) (Standards Australia 2009) Maximum and minimum dry density AS (Standards Australia 1998a) Specific gravity AS (Standards Australia 2006) Friction angle of sand AS (R2013) (Standards Australia 2013) 41
61 Chapter Properties of soil used in settlement tank test A locally available granular soil was used in the settlement tank test. In a model footing having smaller dimensions, the settlement might get affected by change in soil stiffness in a partially saturated area. From laboratory testing, it was observed that the capillary rise is higher in well graded soil. Hence, it is important to use a uniformly graded soil with soil grains large enough to significantly reduce the capillary height. Capillary effects were minimised by screening out the fines and very fine sands, using a 0.6 mm sieve, and removing any grains larger than 4.75 mm. The soil properties of sieved out sand are summarised in Table 4.2. Two different relative densities (38% and 77%) of the sand were used. Since the model tests represent the larger footings with higher densities in the field, maximum relative density was limited to 77% Properties of soil used in small mould test A total of nine soils were used in the small mould test, including the sand used in settlement tank test. The sands were chosen so that they represent wide range of variety in void ratio, uniformity, gradation and percentage of fine contents. Initially, tests were carried out on six soils which were termed as soil 1 to 6. Among them, soil 1 was the same soil used in the settlement tank test. Later on, silty fine grains (finer than 75 µm) were added with soil 5 in different quantities to make sands containing 10%, 15% and 20% fines and were termed as soil 5a, 5b and 5c respectively. Fig. 4.1 shows the photographs of the soils tested with millimetre scale. Fig. 4.2 shows the grain size distribution curves for all the soils. The basic soil properties of the sands are listed in Table 4.3.The soil property tests were carried out following Australian standards as in Table 4.1. Soils 1, 2 and 3 were basically uniformly graded soils having no fine contents. The other soils contained fine grains at different percentages to facilitate the study on effect of fines content on additional settlement due to submergence. 42
62 Chapter 4 Table 4.2: Properties of sand used in settlement tank test Parameter Value Effective grain size D10 (mm) 0.67 Coefficient of uniformity Cu 1.64 Coefficient of curvature Cc 0.89 Specific gravity of the grains 2.61 Maximum dry density (t/m 3 ) 1.53 Minimum void ratio Minimum dry density (t/m 3 ) 1.38 Maximum void ratio Relative densities (Dr) of the sands tested 38% and 77% USCS symbol SP 43
63 Chapter 4 Table 4.3: Basic Soil Properties of the nine soils used in the model tests. Parameter Soil Soil Soil 3 Soil 4 Soil 5 Soil Soil Soil Soil 5c a 5b Effective grain size D10 (mm) Coefficient of uniformity Cu Coefficient of curvature Cc Specific gravity of the grains Maximum dry density (t/m 3 ) Minimum void ratio, emin Minimum dry density (t/m 3 ) Maximum void ratio, emax Void ratio range, emax-emin Fines Content (%) USCS symbol SP SP SP SM SP SM SP- SM SM SM 44
 (b)")
 (f)")

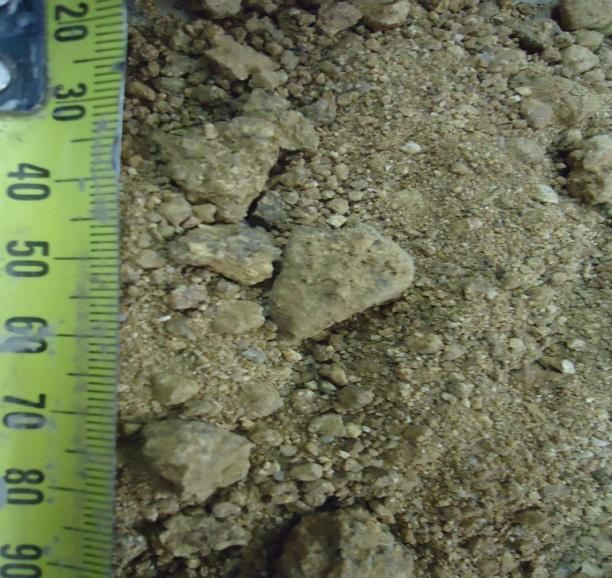


64 Chapter 4 (a) (b) (c) (d) (e) (f) 45
soil 1,(b)soil")
 80% 60% 40% 20% Series1 Soil 1 Series2 Soil 2 Series3 Soil 3")
 Figure 4.")
65 Chapter 4 (g) (h) (i) Figure 4. 1 : Photographs of the granular soils used in the test with mm scale, (a)soil 1,(b)soil 2,(c) soil 3, (d) soil 4,(e) soil 5,(f) soil 6,(g) soil 5a,(h) soil 5b, (i) soil 5c 100% Percent Passing (%) 80% 60% 40% 20% Series1 Soil 1 Series2 Soil 2 Series3 Soil 3 Series4 Soil 4 Series5 Soil 5 Series6 Soil 6 Series7 Soil 5a Series8 Soil 5c Series9 Soil 5b 0% Grain Size (mm) Figure 4. 2 : Grain size distribution curves for the nine soils used in the model tests 46
66 Chapter Settlement tank test Experimental Program The objective of the settlement tank test was to investigate the effect of footing shape and varying water table depth on additional settlement due to submergence, and propose a rational method for predicting water table correction factor. A series of laboratory model tests were carried out on rectangular tank (800 mm x 800 mm in plan and 600 mm high) containing same sand placed at constant relative densities throughout. Six footings of different shapes, including square, circle and rectangles (B/L = 0.25, 0.50 and 0.75 where B and L are the width and length, respectively.), were used in the study. The tests were carried out on sand placed in loose (Dr = 38%) and dense (Dr = 77%) states. The water table was raised from bottom of the tank in increment, and additional settlement was measured with water at different depths below the footing, varying from 6B to 0B Apparatus Rectangular Tank The settlement tank was made of Perspex with plan dimensions of 800 mm x 800 mm and height of 600 mm. All model footings had width of 100 mm, and placing them on the centre of the soil filled tank makes the horizontal and vertical boundaries 6.0 B and 4.0 B away from the footing centre. This was sufficient to eliminate the influence of the boundary distance on the test results. Water was allowed to enter the tank through the bottom. A vertical glass tube was attached to the tank wall to monitor the water level within the tank, which can also be seen through the Perspex wall. A ruler was fixed near the glass tube, to facilitate measurement of water table height throughout the test. Fig. 4.3 shows the rectangular tank used in the model tests. 47

67 Chapter 4 Figure 4. 3 : The Perspex tank used in the settlement tank test Model Footings A circular footing of 100 mm diameter and square and rectangular footings with width B =100 mm and width to length ratio = 1.0, 0.75, 0.50, 0.25 were used in the model tests. The footings were made of steel and were roughened at the bottom to simulate rough footings used in the field (as shown in Fig. 4.4). The width of 100 mm was taken so that the influence zone is well contained in the settlement tank. The strain influenced factor diagrams proposed in Chapter 3 extends to a greater depth than it was originally suggested by Schmertmann (1970). This indicates that water table rise can affect the settlement at greater depths. Testing with 100 mm wide model footings allows us to observe the effect of rising water level from a depth of 6.0 B. Loading and Measurement Apparatus A hydraulic jack was used to apply the loading on the model footings. It was suspended from a frame that was fixed at the floor. A load cell was used to measure the applied load. The load cell was placed in between the hydraulic jack and the model footing and was equipped with a strain gauge that gives reading through a voltmeter when a load is applied. It was calibrated to determine the load in kilograms. Footing settlement was measured by two dial gauges accurate to mm. 48
, maintaining the lift height equal to the footing width, B.")
68 Chapter Testing Procedure Figure 4. 4 : Model footings used in the settlement tank test Filling the tank The tank was filled with soil in six layers (100 mm each), maintaining the lift height equal to the footing width, B. The soil mass for each layer was calculated from the required relative density. To achieve uniform density in every layer, the soil was poured through a funnel held vertically and moved around the tank maintaining a specific height of fall. Each layer was compacted and levelled with a wooden float with same compacting effort. The tank was marked outside in every 100 mm to facilitate the sand placing in required density. Small square cans were placed at various levels to check the achieved density. The results showed that the achieved density was close to the expected density in all cases. Test Setup Once the tank is filled with sand, the surface was levelled carefully using spirit levels. The model footings were placed at the centre of the tank. These were then checked to ensure they were horizontal. A load cell was placed on top of the model footing to measure the load applied by the hydraulic jack. Two dial gauges were attached to the loading frame with the help of magnetic bases. A thin steel plate was placed in between the load cell and the hydraulic jack to hold the dial gauge pins. The experimental setup is shown in Fig. 4.5 along with the schematic diagram. 49
 (d) Figure 4.")
 details of load and settlement measurement system, (c) experimental setup, (d) schematic diagram of the")


69 Chapter 4 Hydraulic Jack Dial Gauge Load Cell Footing (a) (b) Hydraulic Jack Dial Gauge Footing Settlement Tank (c) (d) Figure 4. 5 : Experimental setup for for settlement test in the laboratory: (a) filling the settlement tank in layers, (b) details of load and settlement measurement system, (c) experimental setup, (d) schematic diagram of the test setup. Determination of working load of model footings in dry state The objective of the test was to determine additional settlements of shallow footings due to water table rise and while they are subjected to working load. To determine the working load of footings in dry condition, tests were carried out on dry soils. Once the footings are placed on the sand bed and the test setup is ready, load was applied through the hydraulic jack in increments. After each loading, the voltmeter was allowed some time to stabilize and 50
70 Chapter 4 settlement corresponding to the load was recorded. The average value of settlement reading of the two dial gauges was used in the study. Initially, an applied pressure-settlement curve was obtained by applying vertical pressure in increments and recording corresponding settlements of the footings placed on oven-dried sand. From the load-settlement plot, ultimate bearing capacity of the footings on loose sands were obtained by using double tangent method i.e. drawing tangents from two linear segments of the pressure-settlement curves and taking their intercept as the ultimate bearing capacity. The pressure-settlement curves of footings on dense sands clearly indicated the failure load and use of double tangent method was not required for these footings. The working loads of the footings were obtained by dividing the ultimate bearing capacity values by three, maintaining a safety factor of 3. Simulation of water table rise Once the working load of the model footings at a particular relative density is obtained, the next step is to subject the model footing to working load, raising the water level and recording additional settlement during the water table rise. The water table was raised from the bottom of the tank at 100 mm lifts (equal to footing width, B) until it reached up to 100 mm below the footing level. From there, a lift height of 20 mm (=B/5) was maintained until the water level reaches the base of the footing, and the additional settlements were recorded. The load on the footing was constantly adjusted to maintain the working load throughout the test. The duration between two successive increments of water level was generally about five minutes, where the capillary rise was about 50 mm. Fig. 4.6 shows the rise in water level during the test. The water table correction factor diagrams for all footings were then obtained by comparing the measured additional settlements under water table rise with the initial settlement under working load in dry condition. 4.4 Small Mould Test Experimental Program In the settlement tank test, effect of varying footing shapes and water table depths on additional settlement of footings due to submergence were investigated. Based on the test results, a rational method to predict water table correction factor due to water table rise was proposed which is discussed in the next Chapter. Also, the variation of water table correction factor with water table depth was established in the settlement tank test. In the small mould tests, a further attempt is made to understand the effect of difference in soil types on correction factor when the water table rises up to the footing level. Unlike the settlement tank test, it was not required to measure additional settlement at different water table depths. A 51

71 Chapter 4 cylindrical mould was used instead of the settlement tank and laboratory model tests were carried out on nine different sands. Using a small cylindrical mould instead of large settlement tank reduced the effort required to run the tests, which allowed using more sands for the tests. Sands were placed in dense and loose states and a circular model footing was placed on top the sands. The footing was subjected to working load and was tested under dry and submerged conditions to get the water table correction factors. Hydraulic Jack Dial Gauge Settlement Tank Footing Level of Water Figure 4. 6 : Simulation of water level rise during the settlement tank test Apparatus Cylindrical Mould The metal mould used in the settlement test was cylindrical in shape having 152 mm diameter, mm height and wall thickness of 5 mm. Considering the significant effort required in carrying out the model tests on nine sands, placed at two different densities, in dry and saturated conditions, the mould size for this set of tests was limited to the above values. The mould had a metal extension collar and a perforated metal extension base plate. It was identical to the moulds used in California Bearing Ratio Tests that follows Australian Standard The perforated base plate allowed the water to get into the mould and wetting the soil in submerged tests. Model Footings Circular model footings were used and the footing width was carefully chosen with two main considerations- to minimize the particle size effect and to contain most of the stress bulb within the mould. Kusakabe (1995) recommended that footing width (B) to median grain size (d50) ratio in model tests should be greater than in order to avoid scale effect. Soil 1,2 and 3 have greater median grain size and footing diameter on these soils were selected to be 52
72 Chapter 4 76 mm, other soils had considerably smaller d50 value, and 53.2mm diameter footings were used on these soils. This makes the vertical and horizontal boundaries 1B and 2.35B away from the centre of 76 mm footing, and 1.43B and 3.35B away from 53.2 mm footing centre. Numerical modelling in FLAC (Itasca, 2008) shows that 92.5% and 93.4% of the stress bulb below the footing were contained within this zone for 76 mm and 53.2 mm diameter footing, respectively. The footings were made of steel and were roughened at the bottom to simulate rough footings used in the field. Loading Frame, Loading and Measurement Apparatus The cylindrical mould was placed on a loading frame and a hanger assembly was used for applying the load. The hanger was loaded directly by dead weights and if needed, it was loaded through a lever system. The hanger applied the normal load centrally on the model footing through a ball bearing in a spherical seating. Settlement was measured by a dial gauge placed on top of the footing Testing Procedure Filling the mould The mould was placed on the loading frame and a filter paper was put on top of the perforated base plate so that sand grains don t clog the pores. Each of the nine soils was tested at two different relative densities. For the uniformly graded soils (1, 2, 3 and 5), the relative densities used were 10% and 90%. For other soils Dr=38% and 77% were used. The mould was filled with soil in three layers (59.5 mm each). The soil mass for each layer was calculated from the required relative density. To achieve uniform density in every layer, the soil was poured through a funnel held vertically and moved around the mould maintaining a specific height of fall. Each layer was compacted and levelled with a wooden float with same compacting effort. The cylindrical mould was marked inside in three layers as guidance for placing the sand in required density. Test Setup After filling the mould in three layers, the sand surface was levelled carefully with spirit levels. Then the circular footing was placed concentrically with the centre of the mould and was checked for even level. A dial gauge was attached to the loading frame with the help of magnetic base and its pin was placed on top of the model footing. The hanger assembly was placed on top of the footing so that the load can be transferred through a ball bearing. The schematic diagram of the experimental setup and a photograph of the setup are shown in Fig
")
73 Chapter 4 (a) (b) Figure 4. 7 : Experimental setup for settlement test in the laboratory, (a) schematic diagram, (b) photograph. 54
74 Chapter 4 Determination of working load of model footings in dry state Initially, an applied pressure versus settlement curve was obtained by applying vertical pressure in increments and recording corresponding settlements of the footings placed on oven-dried sand. From the load-settlement plot, ultimate bearing capacity of the footings on loose sands was obtained by using double tangent method. This method involves drawing tangents from two linear segments of the pressure-settlement curves and taking their intercept as the ultimate bearing capacity. The working loads of the footings were obtained by dividing the ultimate bearing capacity values by three, maintaining a safety factor of three. Settlement test on saturated soil The main objective of this test was to study the additional settlement when ground water table rises up to the footing level. This requires saturating the soil below the footing and measure additional settlement due to saturation. Similar setup was used for the wet test, but this time the mould was placed on a bucket. The footing was then subjected to a constant pressure representing the working load, and the bucket was filled with water up to the footing level. The additional settlements due to rise in the water table was then recorded. The correction factor for the water table at the footing level was then obtained by dividing settlement at submerged sand by settlement on dry sand. Fig. 4.8 shows the test setup for soil tested in dry and submerged condition. The same procedure was applied for all the nine soils at two different densities. 4.5 Scale effect Fine grained soils (silts and clays) have very small particle size and are little affected by the foundation size. For the same footing size, there might be thousands of grains beneath the small model footing for a clayey soil, whereas there could be a few hundreds of sand grains under the model footing. This indicates that scale dependence of granular soils is much larger than that of cohesive soils. This is why it is important to account for the scale effect before using the small scale model footing test results for prototype footings. Various researchers have addressed the scale effect phenomenon. Berry (1935) first presented results which indicated that the bearing capacity factor, Nγ decreases with increasing footing size. This observation was termed as scale effect by De Beer (1963); Tatsuoka et al. (1991, 1994) suggested that two factors contribute to the footing size effect, namely, stress level dependency of mechanical properties of granular soils and the variation of footing width to 55

 wet")
75 Chapter 4 (a) (b) Figure 4. 8 : Experimental setup for soil in (a) dry condition, (b) wet condition 56
76 Chapter 4 mean grain size (B/d50) ratio. The second factor is also termed as particle size effect. Based on modelling experiments, various researchers (Ovesen 1975; Yamaguchi et al. 1977; Bolton and Lau 1989) reported that there is a threshold value of B/d50 ratio for small model tests above which the particle size effect is negligible. Kusakabe (1995) recommended that B/d50 ratio should be greater than in order to avoid scale effect. The scale effect seen in model footings is partly dependent on the mean stress felt underneath the footing (Cerato and Lutenegger 2007). Larger footing causes higher mean stress and lower friction angle. From the curvature of Mohr-Coulomb failure envelope theory, it can be said that the friction angle decreases with increase in mean stress. Therefore, the decrease in Nγ can be directly related to footing size- larger the footing, higher the mean stress, lower the friction angle and lower the bearing capacity factor. The critical state concept can be used for explaining the scale effect observed in model footings. The critical state line is a unique line on a void ratio versus mean stress graph and it defines the state at which no volume change occurs. Fellenius and Altaee (1994) used Fuji river sand for footing tests and developed three different relationships with critical state line (shown in Fig. 4.9). The first study was conducted on three different sized footings resting on sand of same voids ratio i.e. same density (represented in line 1 of Fig. 4.9). The larger footing had higher mean stress and was closer to the critical state line. It behaved as if it was in a looser soil. The smaller footing was farthest from the critical state line and acted like resting on denser soil. Each footing size was tested at three different embedment depth- Df= 0.0 B, 1.0 B and 2.0 B denoted as a, b, c respectively, in Fig The result shows that in spite of resting on the soil of same density, the footings exhibit scale effect due to difference in mean stress. In the second study, a footing of a particular size and hence contact pressure was tested on soils of different densities (represented in line 2). The footing on densest soil was farthest from the critical state line and it showed the highest stress-settlement value. In the third study, different sized footings were used at void ratios parallel to the steady state line (represented in line 3) and the stress- settlement behaviour for these footings was found similar. This indicates that the foundations of different sizes will behave similarly if the distance from critical state line ( Ψ ) is same. This is an important finding which can be used for modelling small scale footings. The stress-settlement behaviour of model footings used in the laboratory emulates that behaviour of much larger prototype footings in the field resting 57
77 Chapter 4 on granular soils having higher relative densities. This is why the settlement investigation using a model footing should be conducted on soils with lower densities (Cerato and Lutenegger 2007). Figure 4. 9 : Results of footing tests on Fuji river sand relating critical state line (adapted after Fellenius and Altaee(1994) In this study, scale effect was considered carefully based on the suggestions in the literature so that the model tests can successfully emulate the stress-settlement relationship of full scale test. To avoid the particle size effect, B/d50 ratio should be greater than as recommended by Kusakabe (1995). The footing width of settlement tank tests was 100 mm, large enough to eliminate particle size effect. In case of small mould test, soil 1, 2 and 3 have greater median grain size and footing diameter on these soils were selected to be 76 mm. Other soils had considerably smaller d50 value, and 53.2mm diameter footings were used on these soils. Since the model tests performed in a smaller footing simulates the stress settlement behaviour of a larger footing resting on denser sand, the tests were conducted at a lower relative density. Maximum relative density used on the laboratory was restricted to 77.4% for the settlement tank test, and 90% for the small mould test. 4.6 Capillary Rise Capillary rise of water through soils is a well known phenomenon. Rise of capillary water can vary from a few millimetres in gravels to several meters in clays. Capillary pressure is similar to suction and it increases effective stress. In case of clays, capillary suction is usually higher and it can significantly increase the effective stress. On the other hand, cohesionless soils have larger voids and capillary rise in this kind of soil is usually low. For prototype footings 58
78 Chapter 4 on sands, the capillary rise is negligible considering the large footing dimensions. However, in the model tests on 100 mm wide footings, it is important to account for the capillary rise adequately. The soil stiffness varies in a partially saturated capillary zone, which can affect the settlement of a model footing. In the small mould tests, as all the readings were taken with the water table on the footing level, the capillary rise did not come into play in the model tests. However, in case of settlement tank test, settlement readings were taken at varying water table depths and it was important to ensure that capillary rise did not affect the test results. Figure : Grain size distribution of the soil used in settlement tank before and after sieving From capillary tests carried out in soil filled Perspex tubes, using different types of granular soils, it was observed that the capillary height is more in well graded sands than in uniformly graded sands. The capillary height depends on the effective pore size, and the bigger pore size in a uniformly graded soil reduces the capillary rise. For this reason, the finer grains of the granular soil to be used in the settlement tank were sieved out to get a uniformly graded soil having larger pore size, and hence minimise the possible capillary rise. Two sieves, namely, 0.6 mm and 4.75 mm sieves were used to remove the grains smaller than the former sieve size and grains larger than the second sieve. This makes the soil fairly uniform with lower capillary height. Fig shows the soil grain size distribution before and after sieving. The capillary rise of the sieved soil sample was then tested using soil filled Perspex tubes protruding from water (as shown in Fig. 4.11). The height of capillary rise was 59

79 Chapter 4 measured with time. Fig shows how the capillary height was minimized by increasing soil uniformity, by comparing the capillary rise of the soil before and after sieving both for loose and dense condition. Fig shows the capillary rise of the sieved soil of 10% and 80% relative densities with time. From Fig. 4.13, the capillary height observed at 5 minutes were 40 mm and 53 mm in loose sand and dense sand respectively. During the settlement tests, five minute was the maximum time required to get the settlement reading to stabilise between successive rises in water table. Therefore, the capillary rise is not expected to exceed 50 mm during each load increment applied over duration of five minutes in the settlement tank test. Figure : Capillary test of sieved soil using Perspex tubes protruding from water 60
80 Chapter 4 Figure : Capillary rise comparison of the sieved soil and original soil at a) 10% relative density b) 80% relative density 61
81 Chapter 4 Figure : Variation of capillary rise of the sieved sand with time Vanapalli and Mohamed (2007) showed that the elastic modulus of granular soil, which is a key parameter in shallow foundation settlement, can be significantly influenced by matric suction in unsaturated sand. However, the unsaturated zones of the model tests were kept quite small by limiting the capillary rise and hence the effect of matric suction on foundation settlement was negligible. In a partially saturated zone, the effective stress increases due to negative pore water pressure, and hence the soil elastic modulus increases. Barnes (2010) proposed the following equation as a reasonable approximation of effective stress in unsaturated zone: σ = σ + γ w z a ( S r /100) (4.1) where σ = effective stress σ = total stress γ = unit weight of water w z = elevation above the water table in the unsaturated zone a S = degree of saturation (%) r The elevation above water level ( z a ) was plotted against the degree of saturation ( S r ) curves for the test sand in loose and dense state after five minutes from capillary rise tests with soil 62
82 Chapter 4 filled Perspex tubes that was separated into rings, and the increase in effective stresses due to capillary rise was calculated using Eq The result showed that the increase in effective stress is insignificant, which means that the change in soil elastic modulus due to matric suction was negligible. Fig shows the degree of saturation ( S ) and additional effective stress in dense sand due to capillary rise with elevation above water table ( z a ) in unsaturated zone after five minutes. With increasing z a, the degree of saturation decreases rapidly and the additional effective stress due to capillary rise peaks to 0.27 kpa at 36 mm above the water table in dense sand, where the degree of saturation is 77.1%. Compared to the initial overburden stress added to the stress applied through the footing, this increase in insignificant. More importantly, when the sand beneath the footing is fully submerged, with the water level coinciding with the footing level, there is no capillary effect to account for. This was the case with the second set of tests carried out in the small cylindrical mould. r Figure : Degree of saturation and additional effective stress with elevation above water table in unsaturated zone in dense sand after five minutes 4.7 Conclusion The details of comprehensive laboratory modelling of shallow footing settlement subjected to water level rise on granular soil is described in this Chapter. The objective of the model tests was to understand the effect of varying footing shape, water table depth, soil gradation, fines content on the additional settlement due to submergence. Properties of the granular soils used in the tests were obtained from basic laboratory tests following Australian Standards. Laboratory modelling was divided in two parts- settlement tank test and the small cylindrical mould tests. The apparatus used in the tests and the procedures adopted were discussed in 63
83 Chapter 4 details. Effect of capillary rise and scale effect of modelling prototype footings were considered, and the experimental program was carefully designed to avoid these effects on laboratory modelling. 64
84 Chapter 5 Chapter 5 Interpretation of Laboratory Test Results 5.1 General Although settlement in granular soil is almost instantaneous, there is a risk of additional settlement in future which may occur due to rise in water level below the footing. Floods, heavy rain falls or any other seasonal changes including high tides may raise the groundwater level, which reduce soil stiffness and cause additional settlement. Substantial additional settlement may occur due to rise in water level, which can threaten the integrity of the structure. Various researchers used the correction factor Cw to account for the effect of rising ground water level on shallow foundation settlement (Terzaghi and Peck 1948; Teng 1962; Alpan 1964; Bazaraa 1967; Peck et al 1974; Bowles 1977; Department of the Navy 1982). Here, Cw is the ratio of the settlement under the water table rise to the settlement in dry sand. It is always larger than one and increases with the water table rise. When water table reaches the ground level, Cw takes the maximum value of Cw,max.These were reviewed in Chapter 2. According to the previous research, Cw,max varies from 1 to 2 and the depth of water table that causes additional settlement varies between 0.4 B and 2.0 B. However, laboratory experiments conducted by Murtaza et al. (1995); and Morgan et al. (2010) have suggested significantly higher values for Cw,max. Morgan et al. (2010) also observed that the depth at which the rise of water table induces additional settlement can be as much as 5B. A comprehensive laboratory experimental program was described in Chapter 4 which was carried out to investigate the additional settlement induced by water table rise with varying footing shape, soil density, soil gradation and water table depth. The experimental program was divided into two parts: (a) settlement tank tests and (b) cylindrical mould tests. One objective of the settlement tank test was to study the additional settlements when the water table is at different depths below the footing and to develop the trend and hence plot variation of Cw with normalized water table depth. The results show that the trend is similar for soils at different relative densities and the only thing that varies is Cw,max at the top when the sand is submerged. Since the trend is developed from settlement tank test, it was not further required to obtain Cw at different water table depths in the cylindrical mould tests. Therefore, a small cylindrical mould was used in the next set of tests which took much smaller efforts to conduct a test and hence enables to carry out tests on variety of soils at different relative densities. Here the only objective is to determine Cw,max for different soils at different relative densities. 65
85 Chapter 5 Based on the experimental results of settlement tank tests and strain influence factors proposed in Chapter 3, a rational method is proposed in this Chapter for estimating the additional settlement produced by the rise of water table. The method is independent of the different settlement prediction methods suggested in the literature, and relies only in the strain influence factors assumed. Repeated laboratory model tests using the settlement tank show that the water table correction factor equation proposed in this Chapter with strain influence factors proposed in Chapter 3 work well provided the right value of Cw,max is selected. This Chapter also describes the interpretations of cylindrical mould test data in an attempt to further evaluate Cw,max which is one of the key parameters in the proposed method. Based on the tests carried out on nine different sands, a method is proposed to estimate Cw,max from the standard penetration number (N1)60. The effect of fine content and the maximumminimum void ratio range are investigated. The effect of soil particle shape on water table correction factor was also investigated by analysing the microscopic images of sand grains used in the tests. 5.2 Settlement tank test The settlement tank test was carried out in a rectangular tank using 100 mm wide model footings of different shapes. The objective of this test was to quantify the effect of footing shape, soil density and varying water table depth on additional settlement of shallow footings due to rise of water level. A locally available sand was used and the test was carried out in two different densities, on five different footing shapes and at varying water table depths. The detail of the test setup was given in Chapter 4. This section describes the test results obtained from the settlement tank test. Based on the interpretation of test data, a rational method is proposed to quantify the effect of water table rise on shallow foundation settlement Settlement Tank Test Results Initially, settlement tank tests were carried out on dry sand. The rectangular tank was filled with dry sands and the model footing was placed on the soil surface. Pressure was applied using hydraulic jack and settlement was measured using dial gauges. From the experimental data, applied pressure versus settlement curves were obtained for various footing shapes in loose and dense conditions. Fig. 5.1 shows the applied pressure versus settlement curve for model footings resting on dry loose sand (38% relative density). Fig. 5.1 shows that the failure load is not well defined in the applied pressure-settlement curves and local shear failure occurred as the tests were carried out on relatively loose sand. Only a slight heave occurred at the ground level near the model footings. 66
86 Chapter 5 Figure 5. 1 : Applied pressure vs. settlement curve for model footings resting on dry loose sand Unlike the general shear failure, the failure load cannot be defined straightaway from the pressure-settlement curves in local and punching shear failure mode. In this case, the bearing capacity of footing can be determined indirectly. Murtaza et al. (1995) used double tangent method to determine the bearing capacity of footings in their study. Same technique was used in this study to get the failure load of footings resting on loose sands. The method requires drawing tangents from the two relatively straight segments of the pressure-settlement curve and taking the point of interception of the two tangents as the bearing capacity of the footing on that sand. Fig. 5.2 shows the application of double tangent method for a rectangular footing (B/L=0.25). From the interception of the two tangents, the failure load obtained for the footing is 21.0kPa. Fig. 5.3 shows the applied pressure-settlement curve for footings resting on dense sands (77% relative density) in dry states. Unlike the loose sands, the failure load can be defined easily from the pressure-settlement curve as general shear failure occurred in the dense soil condition. The figure shows that the ultimate bearing capacity is lower in circular footing compared to the square footing and in case of rectangular footing; the bearing capacity tends to increase as the foundation width to length ratio (B/L ratio) decreases. This phenomenon matches well with the previous research findings and prevailing bearing capacity equations. 67
87 Chapter 5 Figure 5. 2 : Bearing capacity determination using double tangent method for rectangular footing (B/L=0.25) resting on dry loose sand. Figure 5. 3 : Pressure-settlement plot for model footings resting on dense sand (77% relative density) in dry condition 68
88 Chapter 5 0 Water Table Correction Factor, C w Watertable Depth, (z/b) Series1 Square Footing (B/L=1.0) Series2 Rectangular Footing (B/L=0.5) Series3 Circular footing 6 (a) 0 Water Table Correction Factor, C w Water Table Depth (z/b) Series1 Rectangular Footing (B/L=0.25) Series2 Rectangular footing (B/L=0.5) Series3 Square footing (B/L=1.0) Series4 Rectangular Footing (B/L=0.75) Series5 Circular Footing (b) Figure 5. 4 : Cw-z/B variation for dense and loose sands: from the model tests on (a) dense sand, (b) loose sand The designers usually use a safety factor of three to provide sufficient safety against bearing capacity failure, i.e., they divide the soil bearing capacity by three and take that as allowable working load. This study also used the same safety factor of three. Bearing capacity of soils obtained from the pressure-settlement curves in loose and dense sands in dry condition was divided by three to get the working load. In the next step of the settlement tank test, the footing was subjected to the working load in dry condition and settlement was measured. Then water level was allowed to rise from the bottom and the additional settlements were observed. The water table correction factor Cw for each depth of water level was obtained by dividing the observed settlement at that water level by the settlement in dry condition. Fig. 69
89 Chapter shows the variation of the correction factor Cw with normalized water table depth z/b for all the tests. (a) (b) Figure 5. 5 : Applied pressure-settlement test in wet tests for footings resting on a) loose sands, b) dense sands 70
90 Chapter 5 After the water level rose up to the footing level, the test was carried out further by increasing the applied pressure until the footing failed under bearing capacity. Fig. 5.5 shows the pressure-settlement curve obtained from the wet tests. Here, the initial straight line portion shows the settlement of the footing at working load in dry condition. Then a sharp increase in settlement was observed as the water level rises from the bottom and reaches the footing level while the applied pressure remained constant. The last segment of the load-settlement curve was obtained by increasing the pressure in submerged condition Water table rise in granular soils Fig. 5.6(a) shows the schematic diagram of a footing in sands where the water table is well below the footing level initially, when the settlement is computed. When the water table rises into the influence zone, it reduces the soil stiffness and induces additional settlement. Fig. 5.6(b) shows the variation of the strain influence factor Iz with depth z. The strain influence factor was originally proposed by Schmertmann (1970), and can be seen as an entity that reflects the vertical normal strain at a specific depth due to the footing load. The depth at which the strain influence becomes zero varies with the shape of the footing. Schmertmann et al. (1978) suggested that this depth can be taken as 2B for square and 4B for strip footings, and modified the strain influence factor proposed by Schmertmann (1970). The strain influence factors proposed in Chapter 3 suggested slightly different influence factors that vary with the footing shape, and extending to depths below 5B. The experimental work conducted in this study also support that the settlements can be influenced when the water table rises from a depth significantly greater than that proposed by Schmertmann et al. (1978). Schmertmann et al. (1978) strain influence factors and influence factors proposed in Chapter 3 are shown in Fig The water table correction factor Cw is defined as the ratio of the settlement when the water table rises to a specific depth to the settlement in the dry sand where the water table is below the zone of influence. Therefore, Cw is always greater than unity and increases with the water table rise, to the maximum value of Cw,max when the water table reaches the footing level (Fig. 5.6 c). When the water table rises, it can be seen in Fig. 5.6(b) that a portion of the strain influence diagram is submerged, where the soil stiffness is reduced substantially. Terzaghi (1943) suggested that the reduction in soil stiffness due to saturation is about 50% and proposed that the settlement doubles when the water table rises to the footing level. That makes the Cw,max as two. 71
 Schematic diagram, (b) Strain influence factor, and(c) Water table correction factor Cw Figure 5.")
91 Chapter 5 GL 0 I z C w,max C w After z B At - Aw 2B Aw Depth, z 3B Depth, z Before 4B (a) (b) (c) Figure 5. 6 : (a) Schematic diagram, (b) Strain influence factor, and(c) Water table correction factor Cw Figure 5. 7 : Comparison of strain influence factor diagrams proposed in Chapter 3 to those proposed by Schmertmann et al. (1978) Water table correction factors were also proposed by Teng (1962); Alpan (1964); Bazaraa (1967); Terzaghi and Peck (1967); Peck et al. (1974); Bowles (1977); and NAVFAC (1982). These were discussed in detail in Chapter 2. The general trend is that the variation of Cw with depth was linear or convex upwards, similar in shape to the one in Fig. 5.6(c). The main differences were in: (a) Cw,max, the maximum value of Cw which occurs when the water table rises to the footing level, and (b) the depth at which the water table rise starts to induce additional settlements. The Cw,max varies from 1 to 2 in all the cases. The depth at which the water table starts inducing additional settlements varies between 0.4 B and 2.0 B, where B is the width of the footing. 72
92 Chapter 5 A few laboratory experiments have been conducted so far to investigate the effect of rising water table on settlement, and contradictory results were reported. Agarwal and Rana (1987) used three square model footings in their experiments and the results suggested Cw,max of 2.0, which support Terzaghi s (1943) proposition. Murtaza et al. (1995) carried out model tests in the laboratory on sands at three different relative densities, and reported Cw,max values in the range of Morgan et al. (2010) carried out some model tests on two different sands and showed that the additional settlements are greater in loose sands than in dense sands, and Cw,max varied in the range of The shape of the Cw-z plot was convex upwards, similar to Fig. 5.6(c). Additional settlements were induced when water table was at 5B below the footing levels. Numerical modelling conducted in Chapter 6 also shows that the Cw-z plot is convex upwards, implying that additional settlements increase at a faster rate when the water table approaches the footing level Proposed model for determining Cw It can be seen intuitively that when the water table is below the strain influence zone, Cw = 1 (i.e. no additional settlement occurs). When the water table rises to the footing level, where Aw = At, the water table correction factor reaches its maximum value of Cw,max. Based on settlement tank tests and the influence factor diagram proposed in Chapter 3, the following equation is proposed for the water table correction factor Cw as a function of Aw/At, which varies with depth of z of the water table below the footing level. C w = ( C A 1) n w 1+ w, max (5.1) At Aw is the area of the influence factor diagram that is submerged and At is the total area of the influence factor diagram (see Fig. 5.6b). Cw,max is the maximum value of Cw that occurs when the water table rises to the footing level. n is a curve-fitting parameter that controls the shape of the Cw-z plot which depends on the relative density of the sand. Fig. 5.8 shows the variation of Cw with depth of water table for a square footing, for different values of n, assuming strain influence factors proposed in Chapter 3, and Cw,max of 2.0 suggested by Terzaghi (1943). It can be seen that the curves are convex upwards for all values of n assumed in the plot and for n = , and the curves fall within a narrow band. 73
93 Chapter 5 0 Water table correction factor, C w Water Table Depth, z/b C w,max =2.0 B/L=1.0 Series1 n= 0.85 Series2 n= 1.0 Series3 n= Figure 5. 8 : Effects of n on Cw z variation based on proposed strain influence factors for square footings (Cw,max = 2). Fig. 5.9 shows the variation of Cw with depth of water table z for a square footing based on the influence factors proposed by Schmertmann (1970), with the modification suggested by Terzaghi et al. (1996), and the suggested modification in Chapter 3. Here n is assumed as 1.0, and Cw,max is assumed as 2.0. Unlike the model proposed by Alpan (1964); Bazaraa (1967); Terzaghi and Peck (1967); Bowles (1977); and NAVFAC (1982); the proposed variation of Cw with depth is convex upwards. This compares with the shape proposed by Teng (1962); Peck et al. (1974) and the numerical predictions shown in Chapter 6. Water Table Correction Factor, Cw Water table depth, z/b Series4 Terzaghi et al. (1996) Series5 Schmertmann (1970) Series6 This study C w,max =2.0 B/L=1.0 6 Figure 5. 9 : Cw z variation for different strain influence factors for square footings (Cw,max = 2, n = 1) 74
94 Chapter 5 The value of Aw/At obtained by using strain influence factors of Chapter 3 for various footing shapes at different depths are shown in Fig and summarized in Table 5.1. This will help practising engineers to use Eq. 5.1 by simply substituting Aw/At value from the table or from Fig A w / A t Water Table Depth, z/b Series1 Square Series2 Rectangular (B/L=0.75) Series3 Rectangular (B/L=0.50) Series4 Rectangular (B/L=0.25) Series5 Circular Series6 Strip Figure : Variation of Aw//At of various footings with water table depth Table 5.1: Aw/At values at different depths for various footing shapes Water Footing Shape table Circular Square Rectangular Rectangular Rectangular depth Footing Footing Footing Footing Footing (Dw/B) (B/L=1) (B/L=0.75) (B/L=0.50) (B/L=0.25) Strip Footing (B/L=0)
95 Chapter Interpretation of settlement tank test data For all levels of the water table, the correction factor Cw was determined as the ratio of the settlement with the raised water table to the settlement when the sand was dry. Fig shows the variation of Cw with normalised depth z/b, for the dense and loose sands, derived from the model tests. The following observations are made from these tests. 1. The additional settlements due to rise of water table are more pronounced in loose sands than in dense sands. This is true for all six footing shapes, with the Cw being larger for loose sands at all water levels. 2. The values for Cw,max for loose sands lie in the range of for the different footing shapes, and for dense sands it lies in the range of Additional settlements are induced when water table is at 6B below the footing level. A careful observation of the correction factor diagrams obtained from the experimental results show that the rise of water table produce significant additional settlement even at depths as high as 5B and the settlement due to submergence is further influenced by the soil density and footing shape. 4. The rate of increment in additional settlement with rising water level is not linear; rather, the increase is faster when the water table is at the vicinity of the foundation level. The Cw-z variation is convex upwards for all footing shapes and both densities. This was evident in Fig. 5.6(c). This trend suggests that when the water table rises, the rate of increase in Cw increases throughout. 5. Cw,max values were determined when the entire sand bed is saturated and hence there is no capillary effect to account for. The very slight influence of capillary was only present when water level was below the footing level, which has been neglected in the analysis. After several curve fitting trials, it was decided to take Cw,max and n in Eq. 5.1 as 6.3 and 0.85 for loose sands, and 3.4 and 1.1 for dense sands. Thus, Eq. 5.1 can be written as: 0.85 A w C = w for loose sands (5.2) At A 2.4 w C = + w for dense sands (5.3) At 76
96 Chapter 5 Figure : Water table correction factor diagrams based on proposed semi-empirical equation for (a) dense sand, and (b) loose sand Eqs. 5.2 and 5.3 incorporate the relative density and the footing shape into the water table correction factor Cw. Fig. 5.11(a) shows the variation of Cw with the water table rise, for different footing shapes, in dense sands assuming n = 1.1 (Eq. 5.3). This is reproduced for loose sands in Fig. 5.11(b) for n = These are derived from the two equations 5.2 & 5.3 and the strain influence factors proposed in Chapter two. While the rate of increase in Cw becomes larger at shallower depths, this is more pronounced for square or circular footings than strip footings Model validation Fig shows the variation of Cw with z/b, for circular and rectangular (B/L=0.5) footings as determined from the model tests for dense and loose sands. Also shown in the figure are 77
97 Chapter 5 Figure : Cw-z/B variation from the model tests: (a) circular footing in dense sand, (b) rectangular (B/L = 0.5) footing in dense sand, (c) circular footing in loose sand, and (d) rectangular (B/L = 0.5) footing in loose sand. the theoretical variations determined using Eq. 5.2 and 5.3. There is very good agreement between the theoretical and experimental plots, suggesting that Eq. 5.2 and 5.3 would give reasonable estimates for the water table correction factor for this sand used in the model tests. It also suggests that assuming the same Cw,max for various footing shapes resting on the same soil at same relative density gives good agreement between the theoretical and experimental plots. Noting that n is very close to unity for the loose and dense sands tested here, as a first approximation, n can be taken as unity for all relative densities. It can also be seen from Fig. 5.8 that taking n as 1 has very little influence on Cw. Thus, Eq. 5.1 becomes, ( C ) C 1 A w w = 1+ w, max (5.4) At 78
98 Chapter 5 where, Cw,max has to be determined for the specific sand by measuring the additional settlement by inundating the entire sand. This exercise can be carried out in a smaller tank and using smaller footings since the capillary effects do not come into play when the sand bed is fully saturated. The work reported herein is based on strain influence factors proposed in Chapter 3 that extend to 6B below the footing. The original and modified strain influence factor diagrams proposed by Schmertmann (1970); Schmertmann et al. (1978) and Terzaghi et al. (1996) extend to shallower depths (e.g. 2B below the footing level for circular and square footing) and hence cannot explain the increase in foundation settlement with rising water table at a greater depth as observed in the model tests. The modified strain influence factor diagrams proposed in Chapter 3 extend to a greater depth as shown in Fig. 5.7 and can be effectively used for predicting water table correction factor diagram. For designers still wanting to use Schmertmann et al. (1978) influence factors, Eq. 5.4 is still applicable, with appropriate value for Cw,max. GL 0 I z After z 2 Z1 At - Aw Before Depth, z Aw Figure : Change in water level within the depth of influence Additional settlement due to change in water level within the influence zone The method can also be used to compute the additional settlement in situations where the water table is already within the depth of influence (i.e. less than 5B) and rises subsequently, by employing the principle of superposition. As shown in Fig. 5.13, if the water level rises from a depth of z1 to z2, the submerged area of influence factor diagram also increases from Aw1 (dark hatched area) to Aw2 (entire hatched area). The water table correction factor at water 79
99 Chapter 5 table depth z1 and z2 can be termed as Cw1 and Cw2 respectively, and the correction factor equation can be written as, A = 1+ (5.5) ( C ) w1 Cw 1 w,max 1 At A = (5.6) ( C ) w2 Cw2 1+ w,max 1 At The settlement at water table depth z1 and z2 can be termed as Sz1 and Sz2, and can be obtained by multiplying the water table correction factor with settlement at dry condition Sd, S * z 1 = Cw 1 Sd (5.7) S * = z2 Cw2 S (5.8) d Dividing Eq. 5.8 by Eq. 5.7 and rearranging, we get C S = S (5.9) w2 z2 * z 1 Cw 1 At + ( Cw,max 1) * Aw 1 or, S z2 = * S z1 (5.10) A + ( C 1) * A t w,max w2 So, if the settlement at water table depth z1 is known, settlement due to further change in water level can be obtained using Eq. 5.9 or Eq Cylindrical Mould Test In the previous section, a rational method for predicting the water table correction factor is proposed from data analysis of the settlement tank tests. The small cylindrical mould tests were carried out as a continuation of the settlement tank tests in an attempt to further understand the water table correction factor when the water level rises up to the footing level. Effect of fine grains and soil gradation on additional settlement due to water level rise is also investigated in the small mould tests. Instead of the large settlement tank, a small cylindrical mould was used. Nine different soils were used in the tests in dense and loose states and in dry and saturated conditions. The test setup was prepared as detailed in Chapter 4. Initially, the test was run on dry soils. After filling the mould with soil of required density, the model footing was placed at the centre and load was applied through the loading arrangement. The applied pressuresettlement plots were obtained from dry tests of all nine soils in loose and dense condition. 80
100 Chapter 5 The bearing capacity of the model footing was then obtained from the pressure-settlement diagram using double tangent method. Fig shows the applied pressure-settlement diagram and the application of double tangent method for Soil 3 in dense and dry state. Applied Pressure (kpa) kpa Tangent Settlement (mm) Tangent Figure : Applied pressure-settlement diagram and the application of double tangent method for Soil 3 in dense and dry state Using a safety factor of three, the working load was obtained by dividing the bearing capacity by three. For the wet test, the footing was initially subjected to the working load at dry condition and the settlement corresponding to the applied pressure was recorded. Then water was allowed to rise up to the footing level and final settlement was recorded. Cw,max for each of the soil was obtained by diving the settlement of footing when water table reaches the footing level with the settlement of footing when the soil is dry. Cw,max obtained this way was then used to correlate with various soil parameters Interpretation of small mould test data From laboratory model tests, Cw,max for the nine soils in different densities were obtained which were then used in correlating various soil parameters including standard penetration number (N1)60 corrected for overburden & energy ratio, void ratio range, fines content Fc, volumetric strain potential єv etc. Cw,max values of the soils are given in Table 5.2 along with the relative densities of the sands tested. The uniformly graded soils (soil 1, 2, 3 and 5) were tested at Dr=10% and 90% and others at Dr=38% and 77%. For uniformly graded soils, the void ratio ranges (emax-emin) were too small. Since, small amount of soil was required to fill the small cylindrical mould, smaller relative density difference in uniform soils would result in only a few grams of difference between loose and dense soils. This is why; the relative 81
101 Chapter 5 density difference for uniformly graded soils was increased. However, for consistency in analysis, Cw,max of all the soils should be measured at same densities. Cw,max of soil 1 was determined in a significantly larger settlement tank as discussed in the previous section at Dr= 38 and 77%, whereas it was tested at 10% and 90% Dr in this study. Fig shows the variation of Cw,max with Dr obtained from the settlement tank test and small mould test. It shows that Cw,max linearly decreases with increasing Dr. This finding was useful to interpolate Cw,max of the other uniform sands (soil 4, 5a, 5b, 5c and 6) at Dr= 38% and 77%. These two relative densities were then used in analysis in this study. Cw,max at Dr= 38 and 77% of all the soils are noted in Table 5.2. Table 5.2: Cw,max and Dr of the sands tested. Soil No. Cw,max and Dr of the sands tested Cw,max at Dr=38% Dr Cw,max Dr Cw,max Dr Cw,max Dr=77% Cw,max at 1 10% % % 7 90% % % % % % % % % a 38% % b 38% % c 38% %
102 Chapter D r =10% D r =38% Cw,max 4 D r =77% 2 10% 37.50% Small Small Mould Mould Test Test Tests Settlement by Shahriar Tank et Test al. (2014) D r =90% 0 0% 20% 40% 60% 80% 100% Relative Density, Dr Figure : Variation of Cw,max of soil 1 with relative density obtained from settlement tank test and small mould test Relationship between Standard Penetration Number (N) and C w,max The deformation and strength characteristics of granular soils are mainly influenced by two parameters- the material properties and the physical state of the soil. The conventional parameters used in identifying sand behaviour are the mean grain size and the fine content Fc. However, Cubrinovski and Ishihara (1999, 2002) pointed that soils having identical fines content can show remarkably different stress-strain characteristics. They proposed that the void ratio range (emax-emin) i.e., the difference between the void ratio of sand in loosest and densest packing, is more indicative of the overall grain size distribution and deformation behaviour of granular soil as it allows for the effects of relevant material properties. Das and Sivakugan (2011) also suggested that void ratio range can be used as a controlling parameter for predicting strength and compressibility of cohesionless soils. The field standard penetration (SPT) number in granular soils (N60) is dependent on effective overburden pressure (σ / 0) and it can be normalized with an overburden pressure of 98 kpa by the following (Liao and Whitman, 1986): ( N1) 60 = N60 / (5.11) σ0( kpa) where, (N1)60= SPT number, corrected for overburden pressure and hammer efficiency Cubrinovski and Ishihara (1999) proposed an empirical correlation between (N1)60, relative density Dr, and void ratio range (emax-emin) which is applicable to granular soils including clean sands, sands with silts and gravelly sands. The expression is: 83
103 Chapter 5 ( N ) D r = ( e e ) (5.12) max min Using Eq. 5.12, (N1)60 for the test conditions of the nine soils at different densities were obtained. The results were then plotted against Cw,max as shown in Fig Soil 1,2,3 are very uniform with small emax-emin values that results in very high and unrealistic values of (N1)60 derived from Eq For this reason, data points from these soils were excluded from Fig The figure clearly indicates that correction factor drops with higher SPT number. Based on the best fit curve in Fig. 5.16, the relation between Cw,max and (N1)60 can be proposed as : C w (5.13) 0.57, max = *( N1) c(l) 30 6 (l) Series1 Power (Series1) Soil Number (l=loose/d=dense) Cw,max b(l) 5a(l) 4(l) 4(d) 5(l) 5b(d) 6(d) 5c(d) 5a(d) 5(d) Normalized Standard Penetration Number, (N1)60 Figure : Variation of Cw,max with normalized standard penetration number (N1)60 obtained from Eq Field SPT value for dense sand usually ranges within Substituting these in Eq shows that the maximum correction factor should range between 2.5 to 3.3 in dense sand. If the void ratio range for a particular granular soil is known, Cw,max for that soil at a given relative density can be obtained using Eq and Alternately, the field SPT number can be used to obtain maximum correction factor by using Eq It is also possible to find the correction factor at any water level by substituting Cw,max value in Eq Effect of fines content on C w,max Another objective of the study was to investigate the effect of fines content on the additional settlement due to rise in water level. To investigate that, fine grains were added to soil 5 to make soils containing 10%, 15% and 20% fines and were named as soil 5a, 5b and5c 84
104 Chapter 5 respectively. Fig shows variation of Cw,max with increasing fines contents in soil 5 in both loose and dense conditions. As structures are usually built on dense soil, characteristics of dense soil are of particular interest for practicing engineers. Therefore, the variation of Cw,max with dense soils is shown in the inset. Fig shows the Cw,max against percentage fines curve for all nine soils with dense soils curve in the inset. Both the figures indicate the same trend that compressibility of submerged granular soil significantly increases when fine content is more than 15% of the soil mass. The rate of settlement increase with increase in percentage of fines is much higher in loose state. Additional settlement in dense state is less significant up to a fine content of 15% but beyond that, it increases considerably. The ratio of Cw,max in loose sand to that in dense sand also increases with presence of fines, as shown in Fig It means that soils having high percentage of fines become more compressible in loose state at submerged condition. The increase in fines contents increase the void ratio range of the soil and makes the soil more compressible Cw,max Cw,max % 5% 10% 15% 20% Percentage of Fines Series2 Dense Sand Series1 Loose Sand 0 0% 5% 10% 15% 20% Percentage of Fines Figure : Effect of fine contents on Cw,max of soil 5 in loose and dense state. Inset: Cw,max vs. fines content for dense state. 85
105 Chapter 5 C w,max C w,max Series1 Series3 5 5a Series2 Series b Loose Sand Dense Sand Percentage of Fines (%) 5a 5a 4 6 Percentage Fines (%) 5c 5b 5b c 5c Figure : Variation of Cw,max with fine contents for all soils in loose and dense state. Inset: Cw,max vs. fines content for dense state. (Soil number given alongside corresponding data point) Effect of void ratio range on C w,max ratio in loose to dense state was also investigated against void ratio range of the Cw,max granular soils. Fig shows that Cw,max ratio increases exponentially with increasing void C w,max (loose) / C w,max (dense) a Percentage of fines (%) 5b 4 6 5c Ser Soil Number Figure : Variation of Cw,max ratio in loose sand to dense sand with fine contents ratio range of the soil. The void ratio range is usually low for uniformly graded sands and gravels (<0.3), medium for clean sands ( ) and higher for sands with fines (>0.5) (Cubrinovski and Ishihara 1999). This means that loose sands with fines are more compressible in submerged conditions than loose uniform sands. 86
106 Chapter 5 C w,max(loose) /C w,max(dense) a b 5c Void Ratio Range (e max -e min ) 4 Soil Ser Number 6 Figure : Change in Cw,max ratio with void ratio range C w,max (dense state) C w,max (dense) Void Ratio Range (e max -e min ) Current Study Rekowski (2001) Morgan et al. (2010) Agarwal & Rana (1985) Void Ratio Range (e max - e min ) Figure : Variation of Cw,max in dense sands with void ratio range. Inset: Cw,max vs. void ratio range for emaxemin>0.2 Cw,max of dense sands were also investigated with the void ratio range, as shown in Fig Results from previous laboratory investigations of Agarwal and Rana (1985); Rekowski (2001); and Morgan et al. (2010) are also included in the figure. The figure shows that there is no observable correlation between void ratio range and Cw,max for dense uniform soils and gravel (emax-emin<0.2). However, for soils having void ratio range greater than 0.2, Cw,max of dense sands increases with emax-emin, as shown in the inset of Fig Effect of Volumetric Strain Potential on C w,max Another measure of soil compressibility is volumetric strain potential єv, which is the strain that a soil undergoes as the soil turns into densest possible state from loosest state i.e., void ratio changes to emin from emax. The expression for єv is: 87
107 Chapter 5 e e max min ε v = (5.14) 1+ emin Das and Sivakugan (2011) proposed and empirical equation for єv based on the results of Cubrinovski and Ishihara (2002) and Patra et al. (2010), which is: ε = 22( e e ) 11 (5.15) v (%) max min + Cw,max ratio of loose to dense soil was plotted against volumetric strain potential for both the expressions in Eq and 5.15 as shown in Fig The figure shows that Cw,max ratio increases exponentially with volumetric strain indicating that soils having higher potential for volumetric strain are likely to experience more submergence induced settlement in loose condition than in dense condition. 10 Cw,max(loose) /Cw,max(dense) Series1 Eq. (6) Series2 Eq. (7) 0 0% 10% 20% 30% 40% 50% Volumetric Strain Potential (Є v ) Figure : Change in Cw,max ratio on loose sand to dense sand with volumetric strain potential Soil Gradation and Water Table Correction Factor Schultze and Moussa (1961) and Oda (1972) suggested that at the same initial void ratio, a well graded soil is more compressible than a uniformly graded soil. Among the nine soils tested in the small mould test, three soils are well graded (soil 4, 6 and 5b) i.e. coefficient of uniformity Cu>6 and coefficient of curvature Cc=1-3. Soil 1, 2, 3 and 5 were fairly uniform. Fig shows the Cw,max ratio for well graded and uniform soils. The soils are divided by the Cu=6 line. The figure clearly shows that Cw,max ratios for uniformly graded sands tend to be much less than that of well graded sands. This means loose well graded sands are more compressible than loose uniform soils when submerged. 88
108 Chapter 5 C w,max(loose) /C w,max(dense) Series1 Uniform Soil Series2 WellGraded Soil C u =6 line Coefficient of Uniformity (Cu) Figure : Change in Cw,max ratio with coefficient of uniformity in uniform and well graded soils 5.4 Effect of particle shape on water table correction factor Another objective of this study was to study the effect of particle shape on additional settlement of shallow footings due to water level rise. Soil grain size distribution and particle shape plays an important role in determining soil behaviour and this is widely recognized. The stress-strain behaviour of soil mass results from interaction of grains which is affected by grain size and shape. Soil particle shape can be characterized by different parameters including sphericity (S), roundness(r), regularity (ξ) and elongation index (EI) all less than unity. For a perfectly spherical grain, they become one. The definitions of these parameters are given below (Wadell 1932; Krumbein 1941; Powers 1953; Krumbein and Sloss 1963; Barrett 1980): Sphericity sphericity reflects the similarity of a grains length, width and height. It can be quantified as the square root of the diameter ratio of maximum inscribed circle and the minimum circumscribed circle, as shown in Fig
109 Chapter 5 Figure : Particle shape determination. Sphericity, S= d d max in min cir (5.16) where, d max in = maximum /largest inscribed circle within a sand particle d max in = minimum /smallest circumscribed circle of a sand particle Roundness- Roundness is a measure of angularity of particle corners. Roundness can be obtained by averaging the radius of corners of the particle relative to the radius of maximum inscribed circle and employing the following equation- N ri i= 1 N Roundness, R= (5.17) r max in Here, ri is the radius of curvature of the of the particle corners and N is the total number of inscribed circles. Regularity is average of roundness and sphericity and is obtained by the following equation- ξ =(R+S)/2 (5.18) 90

110 Chapter 5 Elongation index is ratio between the length of intermediate axis (l2) and major axis (l1) of the particle. It reflects the relationship between the two principal axes of the particle in a two dimensional image. In this study, the particle shape parameters were determined using the definitions stated above. Images of nine sands were obtained using optical microscope. For each soil, 30 soil grains were analysed using Autodesk Inventor 2002 and S, R, ξ and EI were obtained. Fig shows a photograph of the optical microscope and Fig shows the method of determining particle shape parameters. The particle shape parameters for the nine soils are summarized in Table mm Figure : Optical micro-photograph of soil 2 91

111 Chapter 5 Figure : Particle shape parameter determination method using Autodesk Inventor 2012 Roundness and sphericity are important parameters in determining soil behaviour of cohesionless soils (Fatt 1958; Meady 1966; Ridgway and Rupp 1969). The physical properties which are influenced by particle sphericity and roundness are void ratio, pore size distribution, compressibility, strength and cohesion (Morris 1959; Meade 1966; Ingles and grant 1975). Effect of sphericity and roundness on angle of internal friction is well documented in the literature. Zelasko et al. (1975) suggested that decrease in sphericity increases soil angle of friction. Richards and Green (1986) and Holubec and D Appolonia (1973) found that friction angle of spherical glass beads are much less than sands of similar particle size. Decrease in roundness also increases soil angle of friction (Zelasko et al. 1975; Norris 1977). Since decrease in sphericity and roundness increases soil friction angle, decrease in regularity also increases friction angle, as it is the average of roundness and sphericity. Increase friction angle is associated with higher soil stiffness, which means reduction in roundness and sphericity results in higher soil elastic modulus. 92
112 Chapter 5 Table 5.3: Particle shape parameters of the nine soils used in the test Elongation Index (EI) Sphericity, Roundness, Regularity, Maximum Minimum Average Standard Soil S R ξ Deviation a b c
113 Chapter 5 C w,max Series1 Loose Series2 Dense Loose 10 5 Dense Sphericity (a) 8 C w,max(loose) /C w,max(dense) Sphrericity (b) Figure : Effect of sphericity on a) Cw,max in loose and dense state, b) Cw,max ratio in loose state to dense state The soil particle shape parameters were compared with water table correction factors obtained from small mould tests. The variation of Cw,max in loose and dense soils with sphericity, roundness and regularity are shown in Figs. 5.27, 5.28 and 5.29, respectively. The ratio of correction factors in loose and dense sands was also compared with these parameters. The figures show that Cw,max decreases with decreasing sphericity, roundness and regularity and rate of decline in loose sands is higher than that of dense sands. This indicates that additional settlement due to submergence is higher for soils having higher sphericity, roundness and regularity. This matches well with previous findings that lower roundness and sphericity is associated with denser and stiffer soils. Rate of increase in Cw,max of loose sands with increasing sphericity, roundness and regularity is higher than that of dense sands, which is reflected in the plots of Cw,max ratio verses shape parameters, as in Figs. 5.27, 5.28 and This means that loose soils with round spherical shapes are more compressible in submerged condition. 94
114 Chapter Loose Series2 Dense Series3 C w,max Loose 5 Dense Roundness (a) 10 C w,max(loose) /C w,max(dense) Roundness (b) Figure : Effect of roundness on a) Cw,max in loose and dense state, b) Cw,max ratio in loose state to dense state 95
115 Chapter Loose Series1 Dense Series2 C w,max Loose Dense Regularity (a) C w,max(loose) /C w,max(dense) Regularity (b) Figure : Effect of regularity on a) Cw,max in loose and dense state, b) Cw,max ratio in loose state to dense state 5.5 Summary and Conclusion There are significant uncertainties associated with the predictions of settlements of shallow foundations in granular soils. This is well documented in the literature. The additional settlements produced by the rise of water table below the footing can bring in further uncertainties. Therefore, it is desirable to have some rational method for determining the additional settlements induced by the water table rise that can occur due to floods, rain fall or rise in sea level. Model tests on a rectangular tank were carried out on square, circular and rectangular footings on sands placed at loose and dense states subjected to allowable loads. Water table was raised from the bottom of the tank to the footing level, and the additional settlements were recorded at water table depths of 0, 0.2B, 0.4B, 0.6B, 0.8B, B, 2B, 3B, 4B, 5B and 6B below the footings. It was shown that the Eq. 5.1 can effectively model the water table rise in 96
116 Chapter 5 sands and can be used for determining the water table correction factor Cw at all water table depths. C w = ( C A 1) n w 1+ w, max (5.1) At It was shown that n varies in a narrow range of for loose and dense sands, and can be assumed as unity for all practical purposes, and especially as a first estimate. Cw,max has to be determined for a specific sand. This can be determined in a smaller model since the entire sand is inundated during the test and the capillary effects do not come into play when determining Cw,max. It is also suggested that for designers wanting to use Schmertmann et al. (1978) strain influence factors can continue to use them in Eq Model tests were also carried out with small moulds on nine soil samples to investigate effect of various relevant soil properties on settlement increase due to submergence. The results suggests an expression for Cw,max in Eq. 5.13, which shows that maximum value of correction factor of any soil can be determined simply from field SPT value or from relative density and void ratio range of the soil. Cw,max can also be used to predict correction factor for any depth of water table, by using in Eq Also, effect of fines content on water table correction factor was investigated which shows that Cw,max increases significantly for granular soils containing more than 15% fines contents. Ratio of Cw,max in loose sand to dense sand was investigated against void ratio range and volumetric strain potential which shows that the ratio increases exponentially with rising emax-emin and єv value. The rational method developed from small mould tests to predict Cw,max can be used in conjunction with the method based on settlement tank test results and will assist designers to account for future water table rise while predicting settlement of shallow footings in cohesinless soils. 97
117 Chapter 6 Chapter 6 Numerical Modelling of Water Table Rise in Granular Soil 6.1 General Numerical modelling has become a useful tool in most branches of science and engineering. It is routinely used to solve complex problems that are difficult to model in the laboratory or to solve analytically. Numerical modelling is now widely used in geotechnical problems including ground condition analysis, seismic studies, slope stability analysis, foundation design etc. In geomechanics, numerical modelling provides the benefit of using more realistic non-linear material behaviour, fast and systematic solutions and fast parametric studies. These features result in cost reduction and optimization of geotechnical engineering problems. Various finite element and finite difference codes are being used to simulate geotechnical problems. The most commonly used software in geotechnical applications are FLAC, FLAC 3D, PLAXIS, ANSYS and ABAQUS. Usually, the selection of a geotechnical modelling software depends on factors like availability, solution approach, time and cost considerations and industry application. There has been very little work reported in the literature on the effects of water table rise on the settlements of footings in sands. None of these considered the effect of foundation shape on additional settlement due to water table rise. There has been suggestions on the use of a water table correction factor, in the range of 1-2, that can used as a multiplier on the settlement computed for the footing on dry sands. In this Chapter, explicit finite difference code FLAC 7.0 (Itasca, 2011) and FLAC 3D 5.0 (2012) were used to simulate the rise of ground water table in granular soil and the resulting additional settlement was studied. The numerical results were compared with the laboratory test data and the semi empirical equation developed in Chapter 5. Elastic, nonlinear elastic and elasto-plastic constitutive models were used to investigate the variation of water table correction factor with water table depth. Effect of various parameters (footing embedment depth, Poisson s ratio, finite layer thickness and layered soil system, etc.) on additional settlement due to water level rise is also discussed in this Chapter. Characterization of stress-strain relationship and failure behaviour of granular soils are complex due to their particulate nature. This is why a number of constitutive models have been proposed in the literature to predict the behaviour of granular soils. Bathurst and 98
118 Chapter 6 Rothenberg (1988) and Jenkins and Strack (1993) proposed constitutive relations to address the discrete particle to particle description of granular soils. On the other hand, a continuum approach that consists of macroscopic constitutive model based on plasticity theory, along with some stress dilatancy rules, is most commonly used by researchers. Some of the earlier constitutive models were proposed by Drucker et al. (1957), Roscoe et al. (1963), Poorooshasb et al. (1967), Roscoe and Burland (1968) and Lade and Kim (1988). There have been recent developments in developing constitutive models those address more complicated issues such as cyclic loading and strain localization (Vermeer, 1984; Darve,1984; Dafalias,1986). 6.2 Review of FLAC and FLAC 3D Nowadays, various finite element and finite difference codes are being used to simulate geotechnical problems. FLAC, FLAC 3D, PLAXIS, ANSYS and ABAQUS are the most commonly used software in geotechnical applications. Usually, the selection of a geotechnical modelling software depends on various factors including solution approach, availability, time and cost considerations etc. In this study, FLAC and FLAC 3D were used considering the above factors and their suitability to the research problem. FLAC (Fast Lagrangian Analysis of Continua) and FLAC 3D are widely used explicit finite difference codes. Though they were developed originally for modelling geotechnical and mining problems, they can be also used for various civil and mechanical engineering applications. FLAC and FLAC 3D simulate the behaviour of soil, rock or other materials where the materials are represented by a grid system. FLAC is normally used to simulate two dimensional and axisymetric problems whereas FLAC 3D is used for modelling three dimensional cases. It is important in geotechnical modelling to define the material behaviour when subjected to loading. It can be defined by using appropriate constitutive models. There are various built-in constitutive models in FLAC and FLAC 3D. These include linear elastic model as well as plastic models such as Mohr-Coulomb, Drucker-Prager, Modified Cam-Clay, Strain Hardening, Strain Softening etc. An important feature of FLAC and FLAC 3D is FISH, a builtin programming language, which is used to write users own functions and to implement userdefined constitutive models. FLAC uses the finite difference method for solving geotechnical problems. The difference between finite difference method (FDM) and finite element method (FEM) lies in the 99
119 Chapter 6 solution scheme. An explicit, time marching solution scheme is adopted in FDM and FEM uses implicit, matrix-oriented solution scheme. An explicit solution scheme is used by FLAC for solving equations (Coetzee et al., 1998), which is achieved by time stepping. Time stepping is an iterative process where adjustments are made in each node in the mesh through a series of steps. In the explicit method, calculation of wave speed is always kept ahead of the physical wave speed that allows the equations to always function on known values fixed for the duration of calculations. 6.3 Numerical Modelling of water table rise in settlement tank in the laboratory A settlement tank and a small cylindrical mould were used in laboratory modelling of shallow footings as described in Chapter 4 and 5. In this section, the model tests using settlement tank is simulated in FLAC and FLAC 3D. The schematic diagram of the settlement tank is given in Fig Circular, square and rectangular model footings were used in the settlement tank tests in the laboratory. Square and rectangular footings were modelled in FLAC 3D. Only a quarter of the tank was modelled in FLAC 3D since there is symmetry between each quarter. Circular footing was modelled as an axi-symmetric problem and the strip footing was modelled as a plane strain problem using FLAC. The vertical boundaries were assumed to be rollers that allow vertical deformation only, and restrict any horizontal deformations. The bottom boundary was fixed in both horizontal and vertical directions. Three different constitutive models, namely, linear elastic, non-linear elastic and elasto-plastic models were considered in modelling the sand behaviour. The mesh density was determined by sensitivity analysis as discussed in section The FLAC code of the model is given in Appendix A mm Model Footing 800 mm Roller Support 800 mm Figure 6. 1 : Schematic diagram of the settlement tank used in laboratory test and in numerical modelling 100
120 Chapter Sensitivity Analysis For sensitivity analysis, the constitutive model, initial condition and boundary conditions were selected in such a way that they effectively represent the laboratory testing condition. Linear elastic model was used and the following parameters were assumed: The Young s modulus of the dry sand E = 20 MPa, Poisson s ratio ν = 0.2, dry unit weight of the sand = kn/m 3 (this represents dense sand). Gravitational stresses were not considered since the in situ stress has no effect on elastic settlement. Following the settlement tank test conditions, the vertical boundary was placed horizontally 4B away from the centreline of the footing and the horizontal boundary was placed vertically 6B away from the footing centre. Numerical modelling in FLAC with boundaries far away from the centre of footing (30B away vertically and 20B away horizontally from the centre) shows that 99% of the stress bulb can be contained in a boundary condition similar to the laboratory model (i.e., vertical and horizontal boundaries 4B and 6B away respectively from the centreline of the footing). Roller supports have been used in plane of symmetry and in vertical boundary, and pin support was used in the horizontal boundary. To eliminate the uncertainties associated in numerical modelling, comprehensive sensitivity analysis was conducted on all important parameters. This helped to increase accuracy of the model and made it more representative to the field condition. The pressure distribution below a flexible footing due to a uniform load is assumed to be uniform if the load is concentric. Change in vertical stress due to applied pressure is high immediately below the footing, and lower stresses are observed at greater depths. It is important to take this into consideration while modelling, and stress elements (or zones) need to be smaller at the zone of higher stress concentration and vice versa. This means the mesh should be finer immediately below the footing and coarser at the far end where the stress change is negligible. FLAC While modelling circular and strip footing using FLAC, the mesh density below the footing was divided into three zones, as shown in Fig Each zone had different mesh density depending on the stress concentration in that zone. Zone 1 extends laterally 1B away from the centre of the footing, and to a depth of 1B below the footing. This is the zone with higher stress concentration and hence, the mesh size is finer in this zone. Zone 2 starts from 1B away from the centre of the footing and extends to a distance of 2B, both vertically and 101
121 Chapter 6 horizontally. The soil located at distance is greater than 2B away laterally and vertically downwards falls in zone 3 where coarser mesh is used due to relatively small stress concentration in that area. The mesh density was established by gradually refining the grid and comparing the results. Five different sets of mesh density combination were used, namely, 16x4x1, 100x25x1, 400x100x4, 1600x400x25, and 6400x1600x100. Here, each number indicates the number of elements within a square area of 1B side length in the respective zone. A mesh density of 100x25x1 indicates that there are 100 elements within zone 1, 25 elements in a 1B x 1B square area of zone 2 and 1 element within a 1B x 1B square area of zone 3. Distribution of elements in mesh density combination 100x25x1is shown in Fig. 6.3 Figure 6. 2 : Distribution of mesh density zones in FLAC 0 1B 0 1B 2B 3B 4B 102
122 Chapter 6 Figure 6. 3 : Distribution of elements in 100x25x1mesh density combination The settlement immediately below the centre of a circular footing due to 50 kpa applied uniform pressure was investigated for various mesh density combinations and plotted in Fig Also, variation of vertical stresses at a depth 0.5B below the centreline of the footings were plotted against various mesh densities in Fig The results are also given in tabular form in Table 6.1. Since higher number of elements requires longer computation time and higher computer specification, optimum grid size should be selected that will have lesser elements and higher accuracy. Based on the results shown in Fig. 6.4 and Fig. 6.5, mesh combination 1600x400x25 was selected that has 3300 elements. 103
123 Chapter Settlement (in mm) X100X4 1600X400X X1600X X25X1 16X4X Number of elements Figure 6. 4 : Settlement at various mesh combinations 35 Vertical stress at 0.5B (in kpa) X100X4 1600X400X X1600X X25X1 16X4X Number of elements Figure 6. 5 : Variation of vertical stress at a depth 0.5B below the centreline of the footing at various mesh densities. Table 6.1: Grid size, number of elements, vertical displacements and vertical stresses at 0.5B below the centre of footing in FLAC Grid Size Number of Elements Vertical Displacement (mm) Vertical Stress at 0.5 B below the footing (kpa) 16x4x
124 Chapter 6 100x25x x100x x400x x1600x FLAC 3D While modelling square and rectangular footings, the problem becomes three dimensional and FLAC 3D was used. There are two planes of symmetry for square and rectangular footings. For ease of computation and reducing the overall computation time, only a quarter of the footing and the surrounding soil were modelled. The stress distribution pattern of shallow footings shows that most of the stress is concentrated within the depth of 2B below the footing base. Beyond the depth of 2B, the stress due to the applied load is little, and greater the depth, lower is the stress. This should be reflected properly when selecting the mesh densities for the different locations. Among the regular mesh shapes in FLAC 3D, the radially graded mesh around brick elements can be used effectively to model the shallow footing resting on ground surface and subjected to an applied pressure. There are two parts in radially graded mesh around brick shape; the brick shape will represent the higher stress concentration zone immediately below the footing, and the radially graded mesh that will represent the outer area that has lower stress concentration. The shape is shown in Fig The brick mesh extended to a distance of 2B laterally and vertically downward from the centre of the footing. A denser mesh was used in this region to account for the higher stress concentration. The radially graded mesh was made of coarser mesh size and greater the distance, the mesh size got larger. For mesh sensitivity analysis, four different mesh densities were used and results were compared to get the optimum mesh size. The mesh sizes used were 20x10, 24x12, 32x16 and 40x20. Here, 20x10 means that there were 20 elements along the length 2B of the brick mesh in x, y and z direction, and 10 elements in the radially graded mesh in each direction. The vertical displacement of a rectangular footing (B/L=0.5) due an applied uniform pressure of 50 kpa was obtained for each mesh density and plotted in Fig The results are also tabulated in Table 6.2. It can be noted from Fig. 6.6 that the mesh combination of 32x16 gives fairly accurate result and will save computation time. This mesh size was chosen for 105
 0.2 0.15 20x10 24x12 32x16 40x20 0.")
125 Chapter 6 further analysis using FLAC 3D. Fig. 6.8 shows the stress distribution below the footing due an applied load of 10 kpa for circular and rectangular footing, obtained from FLAC and FLAC 3D. Figure 6. 6 : Radially graded mesh around brick shape used in modelling square and rectangular footings on FLAC 3D 0.25 Settlement (in mm) x10 24x12 32x16 40x Number of elements Figure 6. 7 : Settlement at various mesh combinations 106


126 Chapter 6 (a) (b) for quarter of the footing Figure 6. 8 : Stress distribution below the footing due an applied load of 10 kpa for a) circular footing and b) rectangular footing, obtained from FLAC and FLAC3D, respectively. 107
Bearing Capacity and Settlement Response of PMS Tanks on Cohesionless Soil Lithology in Lekki, Lagos of Nigeria
 Available online at www.scholarsresearchlibrary.com European Journal of Applied Engineering and Scientific Research,, ():- (http://scholarsresearchlibrary.com/archive.html) ISSN: 8 Bearing Capacity and
UNIT-I SOIL EXPLORATION
 SIDDHARTH GROUP OF INSTITUTIONS :: PUTTUR Siddharth Nagar, Narayanavanam Road 517583 QUESTION BANK (DESCRIPTIVE) Subject with Code : Geotechnical Engineering - II (16CE127) Year & Sem: III-B.Tech & II-Sem
Prof. B V S Viswanadham, Department of Civil Engineering, IIT Bombay
 43 Module 3: Lecture - 5 on Compressibility and Consolidation Contents Stresses in soil from surface loads; Terzaghi s 1-D consolidation theory; Application in different boundary conditions; Ramp loading;
Analysis of dilatometer test in calibration chamber
 Analysis of dilatometer test in calibration chamber Lech Bałachowski Gdańsk University of Technology, Poland Keywords: calibration chamber, DMT, quartz sand, FEM ABSTRACT: Because DMT in calibration test
THE EFFECT OF EMBEDMENT DEPTH ON BEARING CAPACITY OF STRIP FOOTING IN COHESIVE FRICTIONAL MEDIUM
 Proceedings of the 4 th International Conference on Civil Engineering for Sustainable Development (ICCESD 2018), 9~11 February 2018, KUET, Khulna, Bangladesh (ISBN-978-984-34-3502-6) THE EFFECT OF EMBEDMENT
Influence of Settlement on Bearing Capacity Analysis of Shallow Foundations on Sandy Clays in the Niger Delta, Nigeria
 Available online at www.scholarsresearchlibrary.com European Journal of Applied Engineering and Scientific Research, 201, 2 (4):20-27 (http://scholarsresearchlibrary.com/archive.html) ISSN: 22 0041 Influence
Vertical Uplift Capacity of a Group of Equally Spaced Helical Screw Anchors in Sand
 SECM/15/080 Vertical Uplift Capacity of a Group of Equally Spaced Helical Screw Anchors in Sand S. Mukherjee 1* and Dr. S. Mittal 2 1 Amity University, Noida, India 2 Indian Institute of Technology, Roorkee,
This document downloaded from vulcanhammer.net vulcanhammer.info Chet Aero Marine
 This document downloaded from vulcanhammer.net vulcanhammer.info Chet Aero Marine Don t forget to visit our companion site http://www.vulcanhammer.org Use subject to the terms and conditions of the respective
Pressuremeters in Geotechnical Design
 Pressuremeters in Geotechnical Design B.G. CLARKE Department of Civil Engineering University of Newcastle upon Tyne BLACK1E ACADEMIC & PROFESSIONAL An Imprint of Chapman & Hall London Glasgow Weinheim
m v = 1.04 x 10⁻⁴ m 2 /kn, C v = 1.29 x 10⁻² cm 2 /min
 2.10 Problems Example 2.1: Design of Shallow Foundation in Saturated Clay Design a square footing to support a column load of 667 kn. The base of the footing will be located 1 m below the ground level
CENGRS GEOTECHNICA PVT. LTD. Job No Sheet No. 1
 CENGRS GEOTECHNICA PVT. LTD. Job No. 214030 Sheet No. 1 INTERIM REPORT ON GEOTECHNICAL INVESTIGATION FOR PROPOSED 66 KV GRID PLOT AT G-7, DWARKA, NEW DELHI. 1.0 INTRODUCTION 1.1 Project Description M/s.
Application of Expansive Soil Geotechnical Procedures
 Application of Expansive Soil Geotechnical Procedures FPA PRESENTATION John T. Bryant, Ph.D., P.G., P.E with Robert L. Lytton, Ph.D., PE. And Mr. Dean Read HOUSTON, TEXAS WEDNESDAY DECEMBER 10, 2008 2008
INSTITUTE OF AERONAUTICAL ENGINEERING (Autonomous) Dundigal, Hyderabad
 Dundigal, Hyderabad") INSTITUTE OF AERONAUTICAL ENGINEERING (Autonomous) Dundigal, Hyderabad - 500 043 CIVIL ENGINEERING Tutorial Question Bank Name : FOUNDATION ENGINEERING Code : A60126 Class : III B. Tech II Semester Branch
INSTITUTE OF AERONAUTICAL ENGINEERING (Autonomous) Dundigal, Hyderabad - 500 043 CIVIL ENGINEERING Tutorial Question Bank Name : FOUNDATION ENGINEERING Code : A60126 Class : III B. Tech II Semester Branch
Cubzac-les-Ponts Experimental Embankments on Soft Clay
 Cubzac-les-Ponts Experimental Embankments on Soft Clay GEO-SLOPE International Ltd. www.geo-slope.com 1, 7 - th Ave SW, Calgary, AB, Canada TP T Main: +1 3 9 Fax: +1 3 39 Introduction In the 197 s, a series
CHAPTER 5: VACUUM TEST WITH VERTICAL DRAINS
 CHAPTER 5: VACUUM TEST WITH VERTICAL DRAINS 5.1 Introduction Using surcharging as the sole soil consolidation mean can take a long time to reach the desired soil settlement. Soil consolidation using prefabricated
Typical factors of safety for bearing capacity calculation in different situations
 Typical factors of safety for bearing capacity calculation in different situations Density of soil: In geotechnical engineering, one deals with several densities such as dry density, bulk density, saturated
computed using Equation 3-18 by setting the 2nd term equal to 0 and K A equal to K o and using the pressure distribution as shown in Figure 3-23.
 computed using Equation 3-18 by setting the 2nd term equal to 0 and K A equal to K o and using the pressure distribution as shown in Figure 3-23. (2) For the resisting side, passive pressure theory indicates
REPORT GEO-TECHNICAL INVESTIGATION FOR THE PROPOSED BLOCK-1 SUB-STATION SY NO-44, NEAR KYATAGANACHERLU VILLAGE
 REPORT ON GEO-TECHNICAL INVESTIGATION FOR THE PROPOSED BLOCK-1 SUB-STATION SY NO-44, NEAR KYATAGANACHERLU VILLAGE CLIENT: KARNATAKA SOLAR POWER DEVELOPMENT CORPORATION BANGALORE 0 GEO-TECHNICAL INVESTIGATION
REPORT GEO-TECHNICAL INVESTIGATION FOR THE PROPOSED BLOCK-7 SUB-STATION SY NO-225, NEAR RAYACHERLU VILLAGE
 REPORT ON GEO-TECHNICAL INVESTIGATION FOR THE PROPOSED BLOCK-7 SUB-STATION SY NO-225, NEAR RAYACHERLU VILLAGE CLIENT: KARNATAKA SOLAR POWER DEVELOPMENT CORPORATION BANGALORE 0 GEO-TECHNICAL INVESTIGATION
INSTITUTE OF AERONAUTICAL ENGINEERING (Autonomous) Dundigal, Hyderabad CIVIL ENGINEERING TUTORIAL QUESTION BANK
 Dundigal, Hyderabad CIVIL ENGINEERING TUTORIAL QUESTION BANK") INSTITUTE OF AERONAUTICAL ENGINEERING (Autonomous) Dundigal, Hyderabad - 00 04 CIVIL ENGINEERING TUTORIAL QUESTION BANK Course Name Course Code Regulation Course Structure Course Coordinator Course Faculty
INSTITUTE OF AERONAUTICAL ENGINEERING (Autonomous) Dundigal, Hyderabad - 00 04 CIVIL ENGINEERING TUTORIAL QUESTION BANK Course Name Course Code Regulation Course Structure Course Coordinator Course Faculty
ENTUCKY RANSPORTATION C ENTER. College of Engineering
 Research Report KTC-05-34/SPR-297-05-1I T K ENTUCKY RANSPORTATION C ENTER College of Engineering USE OF ULTRA-LIGHTWEIGHT GEOFOAM TO REDUCE STRESSES IN HIGHWAY CULVERT EXTENSIONS Our Mission We provide
Saturated-Unsaturated Consolidation
 Introduction Saturated-Unsaturated Consolidation This example looks at the volume change behavior of a saturated-unsaturated column under loading, wetting and drying conditions. Feature Highlights GeoStudio
1 CHAPTER 1. Standard Penetration Test: Corrections and Correlations. 1.1 General. 1.2 Standard Penetration Test (SPT)
") Page1 1 CHAPTER 1 Standard Penetration Test: Corrections and Correlations 1.1 General This chapter mainly focuses on the Standard Penetration Test, its correction and correlations with different soil properties.
Page1 1 CHAPTER 1 Standard Penetration Test: Corrections and Correlations 1.1 General This chapter mainly focuses on the Standard Penetration Test, its correction and correlations with different soil properties.
Analysis of Shear Lag in Steel Angle Connectors
 University of New Hampshire University of New Hampshire Scholars' Repository Honors Theses and Capstones Student Scholarship Spring 2013 Analysis of Shear Lag in Steel Angle Connectors Benjamin Sawyer
CONE PENETRATION TESTS
 February 25, 2015 John Doe, P.E. Acme Engineering and Testing 1234 Test Avenue, Suite 204 Lake Wales, FL 33853 Re: Sample CPT Soundings Dear Mr. Doe, Direct Push Services, LLC (DPS) was retained by Acme
SUMMARY OF SUBSURFACE STRATIGRAPHY AND MATERIAL PROPERTIES
 Page 1 of 101 Written by: Ming Zhu Date: 08/20/2008 Reviewed by: R. Kulasingam/J. Beech Date: 08/20/2008 SUMMARY OF SUBSURFACE STRATIGRAPHY AND MATERIAL PROPERTIES 1. INTRODUCTION This Summary of Subsurface
Module 7 Lecture 1. Swelling and Collapse Behavior
 Swelling and Collapse Behavior Module 7 Lecture 1 Collapse and swelling phenomena occur in unsaturated soils during the saturation process. The compacted unsaturated soils, on the dry of optimum, have
An Introduction to Deep Foundations
 An Introduction to Deep Foundations J. Paul Guyer, P.E., R.A. Paul Guyer is a registered mechanical engineer, civil engineer, fire protection engineer and architect with over 35 years experience in the
DEVELOPMENT OF A ROBUST PUSH-IN PRESSUREMETER
 DEVELOPMENT OF A ROBUST PUSH-IN PRESSUREMETER Roger Failmezger, P.E. In-Situ Soil Testing, L.C., Lancaster, Virginia, USA ABSTRACT A push-in pressuremeter was developed using slotted steel casing with
Plastic non-symmetric bifurcation buckling of circular cylinders under uniform external hydrostatic pressure
 icccbe 2010 Nottingham University Press Proceedings of the International Conference on Computing in Civil and Building Engineering W Tizani (Editor) Plastic non-symmetric bifurcation buckling of circular
Tension Cracks. Topics Covered. Tension crack boundaries Tension crack depth Query slice data Thrust line Sensitivity analysis.
 Tension Cracks 16-1 Tension Cracks In slope stability analyses with cohesive soils, tension forces may be observed in the upper part of the slope. In general, soils cannot support tension so the results
Mechanical Stabilisation for Permanent Roads
 Mechanical Stabilisation for Permanent Roads Tim Oliver VP Global Applications Technology Tensar International toliver@tensar.co.uk Effect of geogrid on particle movement SmartRock Effect of geogrid on
The Bubble Dynamics and Pressure Field Generated by a Seismic Airgun
 The Bubble Dynamics and Pressure Field Generated by a Seismic Airgun Katrina L. de Graaf B.Eng(Naval Architecture)(Hons) National Centre for Maritime Engineering and Hydrodynamics Australian Maritime College
Behavior of Square Footing Resting on Reinforced Sand Subjected to Static Load
 IJIRST International Journal for Innovative Research in Science & Technology Volume 3 Issue 02 July 2016 ISSN (online): 2349-6010 Behavior of Square Footing Resting on Reinforced Sand Subjected to Static
Investigation of Stresses in Ring Stiffened Circular Cylinder
 International Journal of Engineering and Technical Research (IJETR) ISSN: 2321-869, Volume-2, Issue-9, September 214 Investigation of Stresses in Ring Stiffened Circular Cylinder Neetesh N. Thakre, Dr.
EXPERIMENTAL INVESTIGATION ON OPTIMUM INSTALLATION DEPTH OF PVD UNDER VACUUM CONSOLIDATION ABSTRACT
 EXPERIMENTAL INVESTIGATION ON OPTIMUM INSTALLATION DEPTH OF PVD UNDER VACUUM CONSOLIDATION EXPERIMENTAL INVESTIGATION ON OPTIMUM INSTALLATION DEPTH OF PVD UNDER VACUUM CONSOLIDATION J.-C CHAI i), N. MIURA
Critical face pressure and backfill pressure in shield TBM tunneling on soft ground
 Critical face pressure and backfill pressure in shield TBM tunneling on soft ground Kiseok Kim 1), Juyoung Oh 2), Hyobum Lee 3) and Hangseok Choi 4) 1), 3), 4) Department of civil engineering, Korea University,
Tightening Evaluation of New 400A Size Metal Gasket
 Proceedings of the 8th International Conference on Innovation & Management 307 Tightening Evaluation of New 400A Size Metal Gasket Moch. Agus Choiron 1, Shigeyuki Haruyama 2, Ken Kaminishi 3 1 Doctoral
Theory of a vertically loaded Suction Pile in CLAY
 11 Theory of a vertically loaded Suction Pile in CLAY Mainly based on the et Norske Veritas NV-RP-E303 1. Convention Water COG h L Soil COG t Figure 1 Suction Pile Figure 2 Suction pile with main parameters
GROUND IMPROVEMENT USING RAPID IMPACT COMPACTION
 13 th World Conference on Earthquake Engineering Vancouver, B.C., Canada August 1-, Paper No. 9 GROUND IMPROVEMENT USING RAPID IMPACT COMPACTION Henrik KRISTIANSEN 1, Michael DAVIES SUMMARY Geotechnical
EXPERIMENTAL STUDY ON THE HYDRODYNAMIC BEHAVIORS OF TWO CONCENTRIC CYLINDERS
 EXPERIMENTAL STUDY ON THE HYDRODYNAMIC BEHAVIORS OF TWO CONCENTRIC CYLINDERS *Jeong-Rok Kim 1), Hyeok-Jun Koh ), Won-Sun Ruy 3) and Il-Hyoung Cho ) 1), 3), ) Department of Ocean System Engineering, Jeju
EXPERIMENTAL STUDY OF WIND PRESSURES ON IRREGULAR- PLAN SHAPE BUILDINGS
 BBAA VI International Colloquium on: Bluff Bodies Aerodynamics & Applications Milano, Italy, July, 2-24 8 EXPERIMENTAL STUDY OF WIND PRESSURES ON IRREGULAR- PLAN SHAPE BUILDINGS J. A. Amin and A. K. Ahuja
Department of Civil & Geological Engineering GEOE Engineering Geology
 Department of Civil & Geological Engineering GEOE 218.3 Engineering Geology Assignment #3, Head, Pore Pressure & Effective Stress Due 08 Oct, 2010 NOTE: Numbered subscripts indicate depth, in metres, below
INTERNATIONAL JOURNAL OF CIVIL AND STRUCTURAL ENGINEERING Volume 1, No 4, 2010
 Effect of geometric dimensions on the transmission coefficient of floating breakwaters Mohammad Hosein Tadayon, Khosro Bargi 2, Hesam Sharifian, S. Reza Hoseini - Ph.D student, Department of Civil Engineering,
3. Types of foundation
 Foundation Engineering CE 48. Types of foundation & foundation materials Contents Introduction Shallow Foundations Deep Foundations Introduction Why different types of? General types of Introduction Why
Influence of Fly Ash Content on Compaction Characteristics of Fly Ash Clay Mixture
 Jordan Journal of Civil Engineering, Volume, No. 1, 16 Influence of Fly Ash Content on Compaction Characteristics of Fly Ash Clay Mixture Ashis Kumar Bera 1)* and Sayan Kundu 2) 1) Associate Professor
Construction Dewatering
 Construction Dewatering Introduction The control of groundwater is one of the most common and complicated problems encountered on a construction site. Construction dewatering can become a costly issue
Copyright ASTM International, 100 Barr Harbor Drive, PO Box C700, West Conshohocken, PA , United States.
 LastD 4429 93 standard and is intended only to provide the user of an ASTM standard an indication of what changes have been made to the previous version. Because it may not be technically possible to adequately
OP CHECKLIST FOR 1D CONSOLIDATION LABORATORY TEST
 Page 1 of 5 WORK INSTRUCTIONS FOR ENGINEERS NHB Compiled by : LSS Checked by : GSS Approved by : OP-3-31. CHECKLIST FOR 1D CONSOLIDATION LABORATORY TEST Page 2 of 5 31.0 CHECKLIST ITEMS *(refer to respective
Desaturating sand deposit by air injection for reducing liquefaction potential
 Desaturating sand deposit by air injection for reducing liquefaction potential M. Ishihara, M. Okamura & T. Oshita Public Works Research Institute, Tsukuba City, Japan. ABSTRACT: It has been known that
CIVE 554/650. Geotechnical Engineering. Rock. Soil. Water. Site Investigation Techniques. CIVE Knight 1. 1/8/2006 CIVE Knight 1
 CIVE 554/650 Site Investigation Techniques 1/8/2006 CIVE 554 - Knight 1 Geotechnical Engineering Soil Rock Water 1/8/2006 CIVE 554 - Knight 2 CIVE 554 - Knight 1 Key Soil Engineering Properties Compressibility
Influence of rounding corners on unsteady flow and heat transfer around a square cylinder
 Influence of rounding corners on unsteady flow and heat transfer around a square cylinder S. K. Singh Deptt. of Mech. Engg., M. B. M. Engg. College / J. N. V. University, Jodhpur, Rajasthan, India Abstract
A VALID APPROACH TO CORRECT CAPILLARY PRESSURE CURVES- A CASE STUDY OF BEREA AND TIGHT GAS SANDS
 SCA2009-4 /6 A VALID APPROACH TO CORRECT CAPILLARY PRESSURE CURVES- A CASE STUDY OF BEREA AND TIGHT GAS SANDS Gbenga M. Funmilayo, Shameem Siddiqui: Texas Tech University, Lubbock USA This paper was prepared
Critical Gust Pressures on Tall Building Frames-Review of Codal Provisions
 Dr. B.Dean Kumar Dept. of Civil Engineering JNTUH College of Engineering Hyderabad, INDIA bdeankumar@gmail.com Dr. B.L.P Swami Dept. of Civil Engineering Vasavi College of Engineering Hyderabad, INDIA
Pore-Air Entrapment during Infiltration
 Pore-Air Entrapment during Infiltration GEO-SLOPE International Ltd. www.geo-slope.com 1200, 700-6th Ave SW, Calgary, AB, Canada T2P 0T8 Main: +1 403 269 2002 Fax: +1 888 463 2239 Introduction Infiltration
Title Tsunami during 2011 East Japan Eart. The final publication is available より本文ファイルは に公開.
 Title Combined Failure Mechanism of a Bre Tsunami during 2011 East Japan Eart Author(s) Iai, Susumu Citation Geotechnical, Geological and Earthq 37: 177-186 Issue Date 2015-04-16 URL http://hdl.handle.net/2433/198459
from ocean to cloud HEAVY DUTY PLOUGH PERFORMANCE IN VERY SOFT COHESIVE SEDIMENTS
 HEAVY DUTY PLOUGH PERFORMANCE IN VERY SOFT COHESIVE SEDIMENTS Geoff Holland, Sarah Dzinbal (Alcatel-Lucent Submarine Networks) Email: geoff.holland@alcatel-lucent.com Alcatel-Lucent Submarine Networks
For a cantilever pile wall shown in Figure 1, assess the performance of the system and answer the following questions.
 Question 1 For a cantilever pile wall shown in Figure 1, assess the performance of the system and answer the following questions. Figure 1 - Cantilever Pile Wall i. Estimate the net resulting horizontal
SOIL IMPROVEMENT BY VACUUM PRELOADING FOR A POWER PLANT PROJECT IN VIETNAM
 18 th Southeast Asian Geotechnical & Inaugural AGSSEA Conference 29-31 May 213, Singapore Leung, Goh & Shen (eds) SOIL IMPROVEMENT BY VACUUM PRELOADING FOR A POWER PLANT PROJECT IN VIETNAM GOUW TJIE-LIONG
Applying Hooke s Law to Multiple Bungee Cords. Introduction
 Applying Hooke s Law to Multiple Bungee Cords Introduction Hooke s Law declares that the force exerted on a spring is proportional to the amount of stretch or compression on the spring, is always directed
EDEXCEL NATIONALS UNIT 6 MECHANICAL PRINCIPLES and APPLICATIONS. ASSIGNMENT No. 4
 EDEXCEL NATIONALS UNIT 6 MECHANICAL PRINCIPLES and APPLICATIONS ASSIGNMENT No. 4 NAME: I agree to the assessment as contained in this assignment. I confirm that the work submitted is my own work. Signature
Quantitative Risk of Linear Infrastructure on Permafrost Heather Brooks, PE. Arquluk Committee Meeting November 2015
 Slide 1 Quantitative Risk of Linear Infrastructure on Permafrost Heather Brooks, PE Arquluk Committee Meeting November 2015 Welcome to the meeting of the committee for Arquluk s Quantitative Risk of Linear
E.2 CAP SETTLEMENT RA D AND OUTBOARD
 DRAFT ONONDAGA LAKE CAPPING, DREDGING AND HABITAT INTERMEDIATE DESIGN E.2 CAP SETTLEMENT RA D AND OUTBOARD Parsons P;\Honeywell-SYR\444576 2008 Capping\09 Reports\9.1 Capping and Dredge Area & Depth IDS\Appendices\Appendix
Ground Failure Mechanism of Micoropiled-raft
 Ground Failure Mechanism of Micoropiled-raft T. H. Hwang 1), H. J. Kim 2), and * J.H. Shin 3) 1), 2), 3) Department of Civil Engineering, Konkuk University, Seoul 143-701, Korea 3) jhshin@konkuk.ac.kr
Displacement-based calculation method on soil-pile interaction of PHC pipe-piles
 Seattle, WA Displacement-based calculation method on soil-pile interaction of PHC pipe-piles Dr. Huang Fuyun Fuzhou University 31 st May, 217 Outline Background ing introduction ing results Simple calculation
Reinforced Soil Retaining Walls-Design and Construction
 Lecture 32 Reinforced Soil Retaining Walls-Design and Construction Prof. G L Sivakumar Babu Department of Civil Engineering Indian Institute of Science Bangalore 560012 Example calculation An 8 m high
SUPPORTING NOTES FOR THE EVALUATION OF UNBOUND ROAD BASE AND SUB-BASE AGGREGATES
 SUPPORTING NOTES FOR THE EVALUATION OF UNBOUND ROAD BASE AND SUB-BASE AGGREGATES (These notes are guidelines only and must not be included in the Contract Documents). 1. SCOPE These Notes are guidelines
The learning of complex whole body activity (Downhill skiing) by simulation
 by simulation") The learning of complex whole body activity (Downhill skiing) by simulation Eddi Pianca Bachelor of Applied Science in Environmental Design(CCAE) Mechanical Engineering Certificate (ACT TAFE) A thesis
The learning of complex whole body activity (Downhill skiing) by simulation Eddi Pianca Bachelor of Applied Science in Environmental Design(CCAE) Mechanical Engineering Certificate (ACT TAFE) A thesis
Calibration and Validation of the Shell Fatigue Model Using AC10 and AC14 Dense Graded Hot Mix Asphalt Fatigue Laboratory Data
 Article Calibration and Validation of the Shell Fatigue Model Using AC10 and AC14 Dense Graded Hot Mix Asphalt Fatigue Laboratory Data Mofreh Saleh University of Canterbury, Private Bag 4800, Christchurch,
RELIABILITY ASSESSMENT, STATIC AND DYNAMIC RESPONSE OF TRANSMISSION LINE TOWER: A COMPARATIVE STUDY
 RELIABILITY ASSESSMENT, STATIC AND DYNAMIC RESPONSE OF TRANSMISSION LINE TOWER: A COMPARATIVE STUDY Yusuf Mansur Hashim M. Tech (Structural Engineering) Student, Sharda University, Greater Noida, (India)
Stress and deformation of offshore piles under structural and wave loading
 Stress and deformation of offshore piles under structural and wave loading Author Eicher, Jackie, Guan, Hong, Jeng, Dong-Sheng Published 2003 Journal Title Ocean Engineering DOI https://doi.org/10.1016/s0029-8018(02)00031-8
3 1 PRESSURE. This is illustrated in Fig. 3 3.
 P = 3 psi 66 FLUID MECHANICS 150 pounds A feet = 50 in P = 6 psi P = s W 150 lbf n = = 50 in = 3 psi A feet FIGURE 3 1 The normal stress (or pressure ) on the feet of a chubby person is much greater than
Behavior of Dry Dense Sand-Foundation System Acted upon by Impact Loads
 Journal of Civil Engineering Research 6, 6(4): 86-3 DOI:.593/j.jce.664. ehavior of Dry Dense Sand-Foundation System Acted upon by Impact Loads Adnan F. Ali, Mohammed Y. Fattah,*, alqees A. Ahmed Civil
SOIL ANCHORS ETSAB/UPC J.Llorens - ETSAB/UPC PASSIVE ANCHORS - ANTECEDENTS
 SOIL ANCHORS ignasi.llorens@upc.edu ETSAB/UPC - 2013 PASSIVE ANCHORS - ANTECEDENTS Antecedents of passive anchors can be found in Nature. Roots feed plants and provide uplift resistance against the wind
σ = force / surface area force act upon In the image above, the surface area would be (Face height) * (Face width).
 * (Face width).") Aortic Root Inflation Introduction You have already learned about the mechanical properties of materials in the cantilever beam experiment. In that experiment you used bending forces to determine the Young
Aortic Root Inflation Introduction You have already learned about the mechanical properties of materials in the cantilever beam experiment. In that experiment you used bending forces to determine the Young
Time rate of swelling of compacted highly plastic clay soil from Sudan
 Time rate of swelling of compacted highly plastic clay soil from Sudan 1 A M Elsharief, 2 Mai Sufian 1 University of Khartoum, Khartoum, Sudan 2 Sudan University of Science and Technology, Khartoum, Sudan
Accurate Measurement of Steam Flow Properties
 Accurate Measurement of Steam Flow Properties Kewen Li and Roland N. Horne Stanford Geothermal Program, Stanford University (Proceedings of 1999 GRC Annual Meeting on October 17-20, Reno, California, USA)
Wind Pressure Distribution on Rectangular Plan Buildings with Multiple Domes
 Wind Pressure Distribution on Rectangular Plan Buildings with Multiple Domes Astha Verma, Ashok K. Ahuja Abstract Present paper describes detailed information of the experimental study carried out on the
The Adequacy of Pushover Analysis to Evaluate Vulnerability of Masonry Infilled Steel Frames Subjected to Bi-Directional Earthquake Loading
 The Adequacy of Pushover Analysis to Evaluate Vulnerability of Masonry Infilled Steel Frames Subjected to Bi-Directional Earthquake Loading B.Beheshti Aval & M. Mohammadzadeh K.N.Toosi University of Technology,
Appendix E BACKGROUND TO STRAIN GAUGE AND EXTENSOMETER CALIBRATIONS. R. Frederking and D. Sudom
 Appendix E BACKGROUND TO STRAIN GAUGE AND EXTENSOMETER CALIBRATIONS R. Frederking and D. Sudom Table of contents 1. Strain Gauge Calibrations... 1 1.1 Variation of strain gauge factor with location around
Experimental Investigation of Clear-Water Local Scour at Pile Groups
 Experimental Investigation of Clear-Water Local Scour at Pile Groups B. Ataie-Ashtiani 1 and A. A. Beheshti 2 Abstract: Experiments of local scour around pile groups are carried out under steady clear-water
Modeling of thin strip profile during cold rolling on roll crossing and shifting mill
 University of Wollongong Research Online Faculty of Engineering and Information Sciences - Papers: Part A Faculty of Engineering and Information Sciences 2013 Modeling of thin strip profile during cold
The tensile capacity of suction caissons in sand under rapid loading
 Frontiers in Offshore Geotechnics: ISFOG 25 Gourvenec & Cassidy (eds) 25 Taylor & Francis Group, London, ISBN 415 3963 X The tensile capacity of suction caissons in sand under rapid loading Guy T. Houlsby,
APPLICATION OF PUSHOVER ANALYSIS ON EARTHQUAKE RESPONSE PREDICATION OF COMPLEX LARGE-SPAN STEEL STRUCTURES
 APPLICATION OF PUSHOVER ANALYSIS ON EARTHQUAKE RESPONSE PREDICATION OF COMPLEX LARGE-SPAN STEEL STRUCTURES J.R. Qian 1 W.J. Zhang 2 and X.D. Ji 3 1 Professor, 3 Postgraduate Student, Key Laboratory for
Engineering Practice on Ice Propeller Strength Assessment Based on IACS Polar Ice Rule URI3
 10th International Symposium on Practical Design of Ships and Other Floating Structures Houston, Texas, United States of America 2007 American Bureau of Shipping Engineering Practice on Ice Propeller Strength
SPECIFICATION FOR REPEATED LOAD TRIAXIAL (RLT) TESTING FOR PAVEMENT MATERIALS
 TESTING FOR PAVEMENT MATERIALS") SPECIFICATION FOR REPEATED LOAD TRIAXIAL (RLT) TESTING FOR PAVEMENT MATERIALS 1. SCOPE This specification details the six (6) stage permanent strain Repeated Load Triaxial (RLT) test for unbound and modified
SPECIFICATION FOR REPEATED LOAD TRIAXIAL (RLT) TESTING FOR PAVEMENT MATERIALS 1. SCOPE This specification details the six (6) stage permanent strain Repeated Load Triaxial (RLT) test for unbound and modified
Application of pushover analysis in estimating seismic demands for large-span spatial structure
 28 September 2 October 2009, Universidad Politecnica de Valencia, Spain Alberto DOMINGO and Carlos LAZARO (eds.) Application of pushover analysis in estimating seismic demands for large-span spatial structure
TYPES OF FOUNDATION. Superstructure. Substructure. Foundation
 TYPES OF FOUNDATION Introduction: The lowest artificially built part of a structure which transmits the load of the structure to the soil lying underneath is called foundation. The supporting part of a
Impact Fatigue on Suction Valve Reed: New Experimental Approach
 Purdue University Purdue e-pubs International Compressor Engineering Conference School of Mechanical Engineering 2004 Impact Fatigue on Suction Valve Reed: New Experimental Approach Michele Libralato ACC
BURIED PIPE RESPONSE SUBJECTED TO TRAFFIC LOAD EXPERIMENTAL AND NUMERICAL INVESTIGATIONS
 Geotec., Const. Mat. & Env., ISSN:2186-2990, Japan, DOI: https://doi.org/10.21660/2017.39.91957 BURIED PIPE RESPONSE SUBJECTED TO TRAFFIC LOAD EXPERIMENTAL AND NUMERICAL INVESTIGATIONS *Ahdyeh Mosadegh
Application of Simulation Technology to Mitsubishi Air Lubrication System
 50 Application of Simulation Technology to Mitsubishi Air Lubrication System CHIHARU KAWAKITA *1 SHINSUKE SATO *2 TAKAHIRO OKIMOTO *2 For the development and design of the Mitsubishi Air Lubrication System
 FIGURES APPENDIX A SYMBOL SAMPLING DESCRIPTION Location of sample obtained in general accordance with ASTM D 1586 Standard Penetration Test with recovery Location of sample obtained using thin-wall
Hours / 100 Marks Seat No.
 17421 21415 3 Hours / 100 Marks Seat No. Instructions : (1) All Questions are compulsory. (2) Answer each next main Question on a new page. (3) Illustrate your answers with neat sketches wherever necessary.
CHAPTER 3 PROJECT DESCRIPTION AND SITE CONDITION
 19 CHAPTER 3 PROJECT DESCRIPTION AND SITE CONDITION 3.1 OVERVIEW This chapter describes Route 44 relocation project. General project information is provided along with details related to the subsurface
International Journal of Technical Research and Applications e-issn: , Volume 4, Issue 3 (May-June, 2016), PP.
, PP.") DESIGN AND ANALYSIS OF FEED CHECK VALVE AS CONTROL VALVE USING CFD SOFTWARE R.Nikhil M.Tech Student Industrial & Production Engineering National Institute of Engineering Mysuru, Karnataka, India -570008
DESIGN AND ANALYSIS OF FEED CHECK VALVE AS CONTROL VALVE USING CFD SOFTWARE R.Nikhil M.Tech Student Industrial & Production Engineering National Institute of Engineering Mysuru, Karnataka, India -570008
A Review of the Bed Roughness Variable in MIKE 21 FLOW MODEL FM, Hydrodynamic (HD) and Sediment Transport (ST) modules
 and Sediment Transport (ST) modules") A Review of the Bed Roughness Variable in MIKE 1 FLOW MODEL FM, Hydrodynamic (HD) and Sediment Transport (ST) modules by David Lambkin, University of Southampton, UK 1 Bed roughness is considered a primary
A Review of the Bed Roughness Variable in MIKE 1 FLOW MODEL FM, Hydrodynamic (HD) and Sediment Transport (ST) modules by David Lambkin, University of Southampton, UK 1 Bed roughness is considered a primary
Deformation parameters of soils determined by the cone penetration test
 MATEC Web of Conferences 117, 0002 (2017) DOI: 10.101/ matecconf/20171170002 Deformation parameters of soils determined by the cone penetration test Roman Bulko 1*, Filip Gago 2 1 University of Žilina,
Learn more at
 Full scale model tests of a steel catenary riser C. Bridge 1, H. Howells 1, N. Toy 2, G. Parke 2, R. Woods 2 1 2H Offshore Engineering Ltd, Woking, Surrey, UK 2 School of Engineering, University of Surrey,
Aalborg Universitet. Published in: Proceedings of Offshore Wind 2007 Conference & Exhibition. Publication date: 2007
 Aalborg Universitet Design Loads on Platforms on Offshore wind Turbine Foundations with Respect to Vertical Wave Run-up Damsgaard, Mathilde L.; Gravesen, Helge; Andersen, Thomas Lykke Published in: Proceedings
Influence of effective stress on swelling pressure of expansive soils
 ES Web of Conferences 9, 06 (06) DOI: 0.0/ esconf/060906 E-UNSAT 06 Influence of effective stress on swelling pressure of expansive soils,a Wiebke Baille, Linzhi Lang, Snehasis Tripathy and Tom Schanz