WALLIS ISLANDS IN THE GLOBAL CLIMATE CHANGE.
|
|
|
- Garey Logan
- 6 years ago
- Views:
Transcription


1 WALLIS ISLANDS IN THE GLOBAL CLIMATE CHANGE. Authors: Michel ALLENBACH 1, Thierry HOIBIAN1, Arnaud COUTURIER 1, TOURAIVANE 1, Sébastien POUILLET 1, 1 Université de la Nouvelle-Calédonie, U.N.C, Nouméa
2 Plan Introduction The ocean national monitoring program relating to the climate change in the overseas territories Organizations involved Material and methods Results /observations examples Sea water temperature variations during seasonal changes Circulation balance through the passes Conclusions Web map server
3 Introduction An oceanologic survey of the Wallis lagoon has been undertaken with financial and scientific help of : IFRECOR (French Initiative for Coral Reefs), M.O.M. (Ministry of Overseas Territories) O.N.E.R.C. (National Observatory of Climate Studies and Research). SENV (Service of the Environment of Wallis and Futuna) It s a part of a long term shore survey program on Wallis and Futuna for the definition of an adaptation strategy to sea level rise, due to the global warming, It is also part of the GIZC [Integrated Coastal Areas Management] as defined by the guidelines of the French Ministry of Sustainable Development.

4 Location Wallis archipelago is a French overseas Territory lying in the South West Pacific at South, West, 2100 km far from New Caledonia, in the north east.

5 Wallis islands The main island, Uvea, is 15 km long and 6 km wide. It is surrounded by a continuous barrier reef that stretches for 24 km in the north-south direction and 15 km in an east-west direction.
 three in the western part Avatolu, (10 m - 15 m depth) Fuga Uvea (10 m -")
6 Wallis lagoon The barrier reef borders a lagoon with a width of 3 to 5 km It has an average depth of 20 m and pits where it exceeds 50 m. Fatumanini Fuga Uvea This lagoon is open to the ocean in four passes ; Avatolu one in the south Honikulu (30 m depth) three in the western part Avatolu, (10 m - 15 m depth) Fuga Uvea (10 m - 15 m depth) Fatumanini. (10 m - 15 m depth) Honikulu

7
 at a depth of 6.66 meters for the survey of and sea water temperatur,e waves, tides, and sea level variations.")
8 Tides and waves gauge recorder SBE 26 Various instruments have been used: A tide and wave gauge recorder SBE 26 from Seabird Electronic installed on a static reference station at Mata Utu (main harbour) at a depth of 6.66 meters for the survey of and sea water temperatur,e waves, tides, and sea level variations. Tides are measured at various intervals from 5 to 20 minutes, depending on the accuracy needed and memory endurance. Waves bursts are acquired every 3 hours at a step of 0.5 s for 1024 to 2048 points during about 8.5 to 17 minutes.


9 Acoustic Dopler Current Profiler An acoustic Doppler Current Profiler Nortek 600 khz, recording current speeds and directions through the water column. It also records sea water temperature, hydrostatic pressure and directional swells. This device has been set up in the passes (channels) and inside the lagoon

10 Acoustic Dopler Current Profiler ADCP records the motion of particles passing through «cells» in 3D : Cells are defined by : their thickness their distance to the acoustic source Conversion of the signal gives current speeds and directions for each cell and sample Sampling interval may change depending on memory and battery endurance. Intervals have been set up from 10 to 30 minutes depending on the lasting of the session and precision needed


11 A WTW 197i field conductimeter It is used for profiling T/S through depth in the lagoon down to 60 meters


12 Devices bases The devices are set on their bases by Enelio Liufau, a scuba diver from the Service de l Environnement of Wallis and data are collected every 3 months.


.")
13 Meteorological data Our oceanic records database is completed and correlated with recordings of meteorological services or models outputs such as : Meteo France Nouvelle-Caledonie for the meteorological data at Hihifo weather station (Wallis airport) and Mapo opo weather station in Futuna (Malae). The CEPMMT models for winds and waves prevision (previously).
 for tide forecast.")
14 External data on server or program Our oceanic databases are completed and correlated with data from international oceanographic services and models outputs such as: SHOM (Service Océanologique et Océanographique de la Marine) for tide forecast. Mercator Ocean research program of observation and prevision of a numeric models of the global ocean for temperature, salinity, currents, El nino forecast, [M. Gasc]. CNES Aviso Oceanobs for sea level variations from remote sensing observations [F. Mertz]. Iowaga IFREMER a world wide ocean model based on WaveWatch III program coupled with the International Meteorological Organization for the sea state and winds of the global ocean. [F. Ardhuin]. WebTide from the Office des Pêches du Canada
15 International computer science litterature and programs C.S.I.R.O. B.O.M. N.I.W.A. University of British Columbia University of Rimouski Mathworks file Exchange SEAMAT LEGOS Pêches et Océan Canada CETMEF IGN IRD All authors are thanked as: Pr. Rich Pawlowicz s, Pr. Urs Neumeier, Pr. James Kirby, Pr. Fengyang Shi, Pr. René Bonnefille, Pr. Jean Bougis, Fabrice Ardhuin, Trevor Mac Dougall, Paul Barker, Gerd Masselink, Marjj Puitonen, and a lot of others
16 Two examples of what we have observed will be submitted: Sea water temperature variations during seasonal changes Evaluation of the circulation balance through the passes

17
 29,1 plot of sea water temperatures at Mata Utu station for one year records [06-2006 06-2007], follows more or less")
 the maximum temperature exceed 31 C considered as critical for corals but this doesn't seems to have any incidence")
18 Temperatures Mata Utu harbour tide station Maximum temperature ( C) 31,4 Minimum temperature ( C) 26,5 Average temperature ( C) 29,1 plot of sea water temperatures at Mata Utu station for one year records [ ], follows more or less the seasonal temperature variations of the ocean. dispersion of extrema is quite important : 5 C (4.960 C ) the maximum temperature exceed 31 C considered as critical for corals but this doesn't seems to have any incidence locally (no coral bleaching)

19 Ocean temperature variations Wallis Animation of gridded temperatures of the SW Pacific for one year session at Mata Utu station from may 2006 to june 2007 (
20 Ocean temperature variations Wallis State of sea surface temperatures of the SW Pacific in May Position of the «warm pool» southerly

21 Ocean temperature variations Wallis Mercator Ocean south pacific grid show that sea water mean level may present important variations with time as Wallis is on the south side of the «warm pool».


22 Temperatures inside the lagoon Comparison of temperatures at Mata Utu station and Fatumanini passe winter session 0907 Comparison of temperatures at Mata Utu stations and Honikulu passe - summer session 0409 Comparison of temperatures inside the lagoon and in the passes; oceanic waters are more stable than the lagoon ones; cooler in summer, warmer in winter, due to a greater thermic inertia of the ocean.


23
24 Data processing Two methods are used for the data processing of the recordings from the ADCP Nortek : a comprehensive statistical analysis for all data in a session, regardless of the time, a detailed analysis based on tide cycles, either neap tide or spring tide

25 Comprehensive statistical analysis contour plot temperature time series Hydrostatic pressure Current speeds at Avatolu passe from the Nortek software ExploreP

26 Comprehensive statistical analysis contour plot temperature time series Hydrostatic pressure Current directions at Avatolu passe from Nortek software ExploreP


27 Comprehensive statistical analysis speeds directions scatterplot rose C1 C3 C5
28 Detailed statistical analysis This analysis is organized according to the 6 hours and to the 15 days tidal cycles: The 6 hours basic cycle is decomposed in six tidal hours which lasts differently from a tide to another. This division let us establish a statistical table of speeds and direction for each tide hour category as; HT+1, HT+2, HT+3,..., HT+5, LT,... The analysis is valid for a short period of 3 to 5 days and concerns a series of records of neap tide or spring tide
 and for a level.")

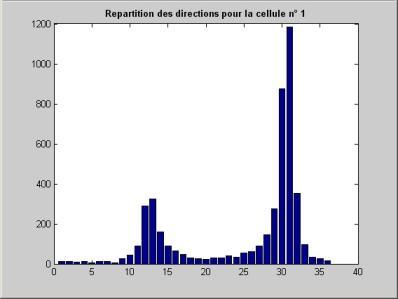
29 Data processing A gui has been programmed to select records for a short time (3 to 5 days) and for a level. (cell 1) Data processing is launched for the selected data The results are tables, graphs, plots and animations presented after


30 Data processing Speed and directions curves of selected data are sampled for each tide hour LT+1, LT+2, LT+3, HT, Or HT+1, HT+2, HT+3, LT Selected data are processed to creates statistics tables and plots This operation is made for each cell ad for two type of tide ; spring tide or neap tide


31 Graphics spring tides rose neap tide rose triggers scatterplot Various graphics are plotted to illustrate events vectors
32 Graphics Animations for Avatolu passe Flow Ebb Scatterplots of currents vectors, for three hours after low tide (flow) and three hours after high tide (ebb )

33 Graphics Relation of current speeds and directions with tides level Speeds Directions Tides level

34 Graphics Speeds Directions Tide level Example of speed and direction curves of currents during neap tide at Avatolu passe (note the lack of south east directions for a few days).

35 Data processing Standard results : tables
36 Data processing Standard results : scatterplots
37 Graphics Scatterplots of sampled vectors currents in neap tide Scatterplots of sampled current vectors in spring tide Examples of difference between spring tide and neap tide circulation at Avatolu passe.

38 Animations Animations of 3D current vectors at Avatolu passes

39 Observation of hydrological regimes in the three passes were analysed : results of Honikulu, Fuga Uvea and Avatolu show great similarity. This leads us to define a global hydrological scheme according to the type of tide: in spring tides, currents flows in the channels following a classical scheme with an incoming current during the flow and an outward current during the ebb. The greater the maximum tidal level is, the higher are the speeds in neap tide, there is a continual drain from the lagoon to the ocean. During ebbing time currents flow outward normally, but during flow time it only slow down in the same direction and stop at high tide. There is a persistent emptying process for several successive days.
40 Assessment of circulation With the aim to compute an assessment of circulation two methods have been used a computation for one tide cycle (neap or spring tide) a computation for the whole session
41 Assessment of circulation As currents are oriented narrowly in the axis of the channel, current vectors may be projected on this axis A positive sign is attributed to the flow direction and a negative one to the ebb direction. New diagrams are plotted for projected vectors Either for one tide cycle or for the whole session


42 Assessment of circulation One tide cycle spring tide neap tide Projected currents on channel axis for each tide hour and two types of tide ; spring tide and neap tide for a whole tide cycle (12 tide hours).
43 Assessment of circulation Comparison of the circulation balance between spring tide and neap tide
44 Assessment of circulation In order to quantify the phenomenon, a computation of the circulation balance was made for the entire duration of a tidal cycle, according to the formula below (1). A positive sign is assigned to the current flow and a negative sign to the ebb current.


45 Assessment of circulation spring tide neap tide spring tide Projected currents on channel axis for each tide hour and for a whole session - Avatolu passe - session 0610 cell C3
46 Assessment of circulation Global budget of circulation for each cell and for a whole session at Avatolu channel, session 0610.

47 Comparison of the circulation budget between spring tides and neap tides leads to the conclusion that the circulation budget was oriented offshore even during spring tide This indicates that the waves breaking over the barrier reef plays an important role in the circulation in the lagoon, even if currents speed is more dependant of the tide amplitude than of the waves height Measurements taken in the inner part of the lagoon shown that currents were weak and not oriented significantly most of the time. This seems to indicate also that circulation occurs mainly along the barrier reef This could have some implication on biological process as fish reproduction and fixation of larvae's of benthic species.

48 Web map server Maps and data are available on a web server at the university of New Caledonia, at adress Then choose wallis on the map

49 Web map server You get a GIS of Wallis on the browser

50 Web map server Choose layers to add in the menus as: stations, road, buildings,

51 Web map server for example the marine stations are displayed as red spots

52 Web map server while clicking on the red spots, you can choose data and reports to download
53 Thank you for your attention

54
Tidal modulation of wave-setup and wave-induced currents on the Aboré coral reef, New Caledonia
 18th April 2007 Tidal modulation of wave-setup and wave-induced currents on the Aboré coral reef, New Caledonia Philippe BONNETON, Jean-Pierre LEFEBVRE, Patrice BRETEL, Sylvain OUILLON, Pascal DOUILLET
Currents measurements in the coast of Montevideo, Uruguay
 Currents measurements in the coast of Montevideo, Uruguay M. Fossati, D. Bellón, E. Lorenzo & I. Piedra-Cueva Fluid Mechanics and Environmental Engineering Institute (IMFIA), School of Engineering, Research
Earth s oceans covers 71 % _ of the planet s surface. In reality, Earth s ocean waters are all. interconnected as part of a single large global ocean.
 Ocean Motion Met 101: Introduction to the World's Oceans Produced by The COMET Program Geography: Name Pd. Earth s oceans covers 71 % _ of the planet s surface. In reality, Earth s ocean waters are all
CORIOLIS, A FRENCH PROJECT FOR IN SITU OPERATIONAL OCEANOGRAPHY. S. Pouliquen, A. Billant, Y. Desaubies, G. Loaec, F. Gaillard, G.
 CORIOLIS, A FRENCH PROJECT FOR IN SITU OPERATIONAL OCEANOGRAPHY S. Pouliquen, A. Billant, Y. Desaubies, G. Loaec, F. Gaillard, G. Maudire IFREMER, BP70, 29280 Plouzané, France Sylvie.Pouliquen@ifremer.fr
Appendix 5: Currents in Minas Basin. (Oceans Ltd. 2009)
") Appendix 5: Currents in Minas Basin (Oceans Ltd. 29) Current in Minas Basin May 1, 28 March 29, 29 Submitted To: Minas Basin Pulp and Power P.O. Box 41 53 Prince Street Hansport, NS, BP 1P by 22, Purdy
Appendix 5: Currents in Minas Basin (Oceans Ltd. 29) Current in Minas Basin May 1, 28 March 29, 29 Submitted To: Minas Basin Pulp and Power P.O. Box 41 53 Prince Street Hansport, NS, BP 1P by 22, Purdy
TRIAXYS Acoustic Doppler Current Profiler Comparison Study
 TRIAXYS Acoustic Doppler Current Profiler Comparison Study By Randolph Kashino, Axys Technologies Inc. Tony Ethier, Axys Technologies Inc. Reo Phillips, Axys Technologies Inc. February 2 Figure 1. Nortek
Sea level and temperature variations from a tide and waves gauge recording at Wallis Islands, during the recent pause of global warming
 XV èmes Journées Nationales Génie Côtier Génie Civil La Rochelle, 29 au 31 mai 2018 DOI:10.5150/jngcgc.2018.094 Editions Paralia CFL disponible en ligne http://www.paralia.fr available online Sea level
Offshore Wind Energy Stringent quality assurance and quality control. Coastal and Freshwater Fast responding and flexible organisation
 Services Oceanographic and Positioning Equipment Rental Meteorological and Oceanographic Surveys Data Analysis and Characterisation Marine Energy Resource Assessment Real-Time Monitoring Founded in 2010,
APPENDIX G WEATHER DATA SELECTED EXTRACTS FROM ENVIRONMENTAL DATA FOR BCFS VESSEL REPLACEMENT PROGRAM DRAFT REPORT
 APPENDIX G WEATHER DATA SELECTED EXTRACTS FROM ENVIRONMENTAL DATA FOR BCFS VESSEL REPLACEMENT PROGRAM DRAFT REPORT Prepared for: B.C. Ferries Services Inc. Prepared by: George Roddan, P.Eng. Roddan Engineering
Name Class Date. Use the terms from the following list to complete the sentences below. Each term may be used only once. Some terms may not be used.
 Assessment Chapter Test B The Movement of Ocean Water USING KEY TERMS Use the terms from the following list to complete the sentences below. Each term may be used only once. Some terms may not be used.
The Movement of Ocean Water. Currents
 The Movement of Ocean Water Currents Ocean Current movement of ocean water that follows a regular pattern influenced by: weather Earth s rotation position of continents Surface current horizontal movement
Background. that may differ from the rest of the world.
 Background ¾Climate Change impacts in the Pacific very serious and will impact the lives and livelihoods of the people people. ¾Sea level rise is a major threat need to help reduce carbon emission. One
Well, Well, Well. BACKGROUND Seasonal upwelling is a very important process in the coastal ocean of the Pacific Northwest.
 Well, Well, Well SUMMARY In this activity students investigate the relationship between winds, surface currents, sea surface temperature and upwelling and downwelling off the coast of OR and WA. Students
Variability in the tropical oceans - Monitoring and prediction of El Niño and La Niña -
 Variability in the tropical oceans - Monitoring and prediction of El Niño and La Niña - Jun ichi HIROSAWA Climate Prediction Division Japan Meteorological Agency SST anomaly in Nov. 1997 1 ( ) Outline
Nortek Technical Note No.: TN-021. Chesapeake Bay AWAC Evaluation
 Nortek Technical Note No.: TN-021 Title: Chesapeake Bay AWAC Evaluation Last Edited: October 5, 2004 Authors: Eric Siegel-NortekUSA, Chris Malzone-NortekUSA, Torstein Pedersen- Number of Pages: 12 Chesapeake
HYDROGRAPHIC AND SITE SURVEY REPORT
 HYDROGRAPHIC AND SITE SURVEY REPORT Proposed Pen Site at Dounie, Sound of Jura Prepared for: Kames Fish Farming Ltd Kilmelford Argyll PA34 4XA Tel: +44 (0)1631 720699 TransTech Limited www.transtechltd.com
Tidal regime along Vietnam coast under impacts of sea level rise
 VNU Journal of Science, Earth Sciences 28 (2012) 133-139 Tidal regime along Vietnam coast under impacts of sea level rise Tran Thuc, Duong Hong Son* Vietnam Institute of Meteorology, Hydrology and Environment
SAND BOTTOM EROSION AND CHANGES OF AN ACTIVE LAYER THICKNESS IN THE SURF ZONE OF THE NORDERNEY ISLAND
 SAND BOTTOM EROSION AND CHANGES OF AN ACTIVE LAYER THICKNESS IN THE SURF ZONE OF THE NORDERNEY ISLAND Kos'yan R. 1, Kunz H. 2, Podymov l. 3 1 Prof.Dr.,The Southern Branch of the P.P.Shirshov Institute
Mass coral mortality under local amplification of 2 C ocean warming
 Mass coral mortality under local amplification of C ocean warming Thomas M. DeCarlo, Anne L. Cohen, George T.F. Wong, Kristen A. Davis, Pat Lohmann, Keryea Soong correspondence to: tdecarlo@uwa.edu.au
Sconser Quarry, Caol Mor
 Sconser Quarry, Caol Mor AUTODEPOMOD MODELLIN G REPORT 4.2017 Registered in Scotland No. 138843 Registered Office, 1st Floor, Admiralty Park, Admiralty Road, Rosyth, FIFE, KY11 2YW Marine Harvest ( Scotland)
Marine Renewables Industry Association. Marine Renewables Industry: Requirements for Oceanographic Measurements, Data Processing and Modelling
 Marine Renewables Industry Association Marine Renewables Industry: Requirements for Oceanographic Measurements, Data Processing and Modelling October 2009 Table of Contents 1. Introduction... 1 2. Measurements
13. TIDES Tidal waters
 Water levels vary in tidal and non-tidal waters: sailors should be aware that the depths shown on the charts do not always represent the actual amount of water under the boat. 13.1 Tidal waters In tidal
SHORT- AND LONG- TERM MODELLING IN SUPPORT OF SEA LICE BATH TREATMENTS AZAMETHIPHOS, CYPERMETHRIN AND DELTAMETHRIN
 ANDERSON MARINE SURVEYS LTD. Croabh, Tighnabruaich, Argyll. PA21 2DY Tel/Fax: 01700 811677 Email: amsl@sol. co.uk Report To: The Scottish Salmon Company Ltd Report No: 14/12.2 Issued By: Checked By: Status:
7.4 Temperature, Salinity and Currents in Jamaica Bay
 7.4 Temperature, Salinity and Currents in Jamaica Bay Arnold Gordon, Bruce Huber and Robert Houghton 7.4.1 INTRODUCTION Jamaica Bay stratification is weakly indicative of a shallow, tidally active environment,
GLOBE Data Explorations
 Rainfall in the GLOBE Africa Region: A GLOBE Data Exploration Purpose Through explorations of GLOBE rain depth data from Africa, students learn about seasonal patterns in locations affected by monsoons.
The Air-Sea Interaction. Masanori Konda Kyoto University
 2 The Air-Sea Interaction Masanori Konda Kyoto University 2.1 Feedback between Ocean and Atmosphere Heat and momentum exchange between the ocean and atmosphere Atmospheric circulation Condensation heat
Compiled by Uwe Dornbusch. Edited by Cherith Moses
 REPORT ON WAVE AND TIDE MEASUREMENTS Compiled by Uwe Dornbusch. Edited by Cherith Moses 1 Aims...1 2 Summary...1 3 Introduction...1 4 Site selection...1 5 Wave recorder settings...2 6 Results...2 6.1 Water
from a decade of CCD temperature data
 (Some of) What we have learned from a decade of CCD temperature data Craig Gelpi and Karen Norris Long Beach Aquarium of the Pacific August 15, 2008 Introduction Catalina Conservancy Divers collected temperature
OCN 201 Lab Fall 2009 OCN 201. Lab 9 - El Niño
 OCN 201 Lab Fall 2009 OCN 201 Lab 9 - El Niño El Niño is probably one of the most widely publicized oceanic phenomena. If there s one single reason for that it s probably the fact that El Niño s presence
South Bay Coastal Ocean Observing System California Clean Beaches Initiative
 South Bay Coastal Ocean Observing System California Clean Beaches Initiative Quarterly Report September 2003 to City of Imperial Beach Eric Terrill 1 1 Scripps Institution of Oceanography, University of
SURFACE CURRENTS AND TIDES
 NAME SURFACE CURRENTS AND TIDES I. Origin of surface currents Surface currents arise due to the interaction of the prevailing wis a the ocean surface. Hence the surface wi pattern (Figure 1) plays a key
On the use of a high resolution wind forcing in the operational coastal wave model WW3
 On the use of a high resolution wind forcing in the operational coastal wave model WW3 A. Dalphinet (1), L. Aouf (1), C. Bataille (1), H. Michaud (2) (1) Météo-France (2) SHOM Île de Sein (Brittany) 05/02/2014
Predicting the Surface Currents of Guanabara Bay Dr Andrew McCowan 1, Elise Lawry 2, Ryan Dermek 3
 Dr Andrew 1, Elise Lawry 2, Ryan Dermek 3 1 Managing Director, Water Technology Pty Ltd, Melbourne, Australia E-mail: Andrew.@watertech.com.au 2 Senior Engineer, Water Technology Pty Ltd, Melbourne, Australia
Bonriki Inundation Vulnerability Assessment
 Bonriki Inundation Vulnerability Assessment Zulfikar Begg, Jens Kruger Bonriki Inundation Vulnerability Assessment (BIVA) Zulfikar Begg Jens Kruger Aseri Baleilevuka Copyright Secretariat of the Pacific
Current measurements in Lakes Rotorua and Rotoehu 2010 and 2011
 Current measurements in Lakes Rotorua and Rotoehu 21 and 211 NIWA Client Report: HAM211-15 February 211 NIWA Project: BOP1123 Current measurements in Lakes Rotorua and Rotoehu 21 and 211 Max Gibbs Rod
Impact of Dredging the Lower Narrow River on Circulation and Flushing
 Impact of Dredging the Lower Narrow River on Circulation and Flushing Craig Swanson Ph.D. Swanson Environmental Alex Shaw Ocean Engineering, URI Prof. Malcolm L. Spaulding Ocean Engineering, URI 29 January
Title: SYSTEM OF PLANKTON DATABASE OPENING TO THE PUBLIC IN LAKE BIWA. Satoshi ICHISE*,Tetsuya WAKABAYASHI*, Kenji YAMASHITA*and Shigeru AOKI*
 Title: SYSTEM OF PLANKTON DATABASE OPENING TO THE PUBLIC IN LAKE BIWA Satoshi ICHISE*,Tetsuya WAKABAYASHI*, Kenji YAMASHITA*and Shigeru AOKI* *Shiga prefectural Lake Biwa Environmental Research Institute
The Wave Glider: A Mobile Buoy Concept for Ocean Science. 009 Liquid Robotics Inc.
 The Wave Glider: A Mobile Buoy Concept for Ocean Science 009 Liquid Robotics Inc. J. Manley & T. Richardson: Liquid Robotics Inc. DBCP XXV Paris September 28, 2009 1 Wave Glider Overview Unique Two Part
Section 6. The Surface Circulation of the Ocean. What Do You See? Think About It. Investigate. Learning Outcomes
 Chapter 5 Winds, Oceans, Weather, and Climate Section 6 The Surface Circulation of the Ocean What Do You See? Learning Outcomes In this section, you will Understand the general paths of surface ocean currents.
APPENDIX A Hydrodynamic Model Qualicum Beach Waterfront Master Plan
 Page 1 of 21 CLIENT: Town of Qualicum Beach PROJECT: SIGNATURE DATE CONTRIBUTORS : M. Marti Lopez REVIEWED BY : P. St-Germain, EIT APPROVED BY: J. Readshaw, P.Eng ISSUE/REVISION INDEX Issue Details Code
MAPCO2 Buoy Metadata Report Project Title:
 MAPCO2 Buoy Metadata Report Project Title: Autonomous Multi-parameter Measurements from a Drifting Buoy During the SO GasEx Experiment Funding Agency: NOAA Global Carbon Cycle program PI(s): Christopher
Modelling and Assessment of Marine Renewable Energy Resources. Andrew Cornett Canadian Hydraulics Centre National Research Council Canada May 2008
 Modelling and Assessment of Marine Renewable Energy Resources Andrew Cornett Canadian Hydraulics Centre National Research Council Canada May 2008 Background Pan-Canadian resource inventory in 2005/06 Canada
SEDIMENT BUDGET OF LIDO OF PELLESTRINA (VENICE) Written by Marcello Di Risio Under the supervision of Giorgio Bellotti and Leopoldo Franco
 Written by Marcello Di Risio Under the supervision of Giorgio Bellotti and Leopoldo Franco") SEDIMENT BUDGET OF LIDO OF PELLESTRINA (VENICE) Written by Marcello Di Risio Under the supervision of Giorgio Bellotti and Leopoldo Franco Table of contents: 1. Introduction...3 2. Protection structures
SEDIMENT BUDGET OF LIDO OF PELLESTRINA (VENICE) Written by Marcello Di Risio Under the supervision of Giorgio Bellotti and Leopoldo Franco Table of contents: 1. Introduction...3 2. Protection structures
Figure 1 Location of the ANDRILL SMS 2006 mooring site labeled ADCP1 above.
 ANDRILL McMurdo Sound Tidal Current Analysis Richard Limeburner, Robert Beardsley and Sean Whelan Department of Physical Oceanography Woods Hole Oceanographic Institution Woods Hole, MA 02543 rlimeburner@whoi.edu
WAVE FORECASTING FOR OFFSHORE WIND FARMS
 9 th International Workshop on Wave Hindcasting and Forecasting, Victoria, B.C. Canada, September 24-29, 2006 WAVE FORECASTING FOR OFFSHORE WIND FARMS Morten Rugbjerg, Ole René Sørensen and Vagner Jacobsen
OECS Regional Engineering Workshop September 29 October 3, 2014
 B E A C H E S. M A R I N A S. D E S I G N. C O N S T R U C T I O N. OECS Regional Engineering Workshop September 29 October 3, 2014 Coastal Erosion and Sea Defense: Introduction to Coastal Dynamics David
6.28 PREDICTION OF FOG EPISODES AT THE AIRPORT OF MADRID- BARAJAS USING DIFFERENT MODELING APPROACHES
 6.28 PREDICTION OF FOG EPISODES AT THE AIRPORT OF MADRID- BARAJAS USING DIFFERENT MODELING APPROACHES Cecilia Soriano 1, Darío Cano 2, Enric Terradellas 3 and Bill Physick 4 1 Universitat Politècnica de
Observational approaches to oxygen depletion
 Observational approaches to oxygen depletion Denis Gilbert Institut Maurice-Lamontagne Pêches et Océans Canada Mont-Joli, Québec Workshop on Ocean Biology Observatories Venezia, Italia, September 17, 2009
Appendix E Mangaone Stream at Ratanui Hydrological Gauging Station Influence of IPO on Stream Flow
 NZ Transport Agency Peka Peka to North Ōtaki Expressway Hydraulic Investigations for Expressway Crossing of Mangaone Stream and Floodplain Appendix E Mangaone Stream at Ratanui Hydrological Gauging Station
Appendix E Cat Island Borrow Area Analysis
 Appendix E Cat Island Borrow Area Analysis ERDC/CHL Letter Report 1 Cat Island Borrow Area Analysis Multiple borrow area configurations were considered for Cat Island restoration. Borrow area CI1 is located
Case Studies Georg Umgiesser and Natalja Čerkasova KU, Lithuania
 Case Studies Georg Umgiesser and Natalja Čerkasova KU, Lithuania Case 1: A beach in the Curonian Lagoon 1 Beach Current situation in Curonian lagoon Beach in Kintai In the past, especially in Baltic inner
Assessment Schedule 2016 Earth and Space Science: Demonstrate understanding of processes in the ocean system (91413)
") NCEA Level 3 Earth & Space Science (91413) 2016 page 1 of 6 Assessment Schedule 2016 Earth and Space Science: Demonstrate processes in the ocean system (91413) Evidence Statement Q Evidence with with Excellence
NCEA Level 3 Earth & Space Science (91413) 2016 page 1 of 6 Assessment Schedule 2016 Earth and Space Science: Demonstrate processes in the ocean system (91413) Evidence Statement Q Evidence with with Excellence
System of Plankton Database Opening to the Public in Lake Biwa
 Sengupta, M. and Dalwani, R. (Editors). 2008 Proceedings of Taal2007: The 12 th World Lake Conference: 597-602 System of Plankton Database Opening to the Public in Lake Biwa Satoshi Ichise,Tetsuya Wakabayashi,
Bagh Dail nan Ceann ( BDNC) Salmon Farm, Loch Shuna
 Salmon Farm, Loch Shuna") Bagh Dail nan Ceann ( BDNC) Salmon Farm, Loch Shuna AUTODEPOMOD MODELLIN G REPORT 09. 2016V1 REPORT WRITTEN BY ENVIRONMENTA L ANALYST) CHECKED BY ENVIRONMENTAL MAN AGER) Registered in Scotland No. 138843
Bagh Dail nan Ceann ( BDNC) Salmon Farm, Loch Shuna AUTODEPOMOD MODELLIN G REPORT 09. 2016V1 REPORT WRITTEN BY ENVIRONMENTA L ANALYST) CHECKED BY ENVIRONMENTAL MAN AGER) Registered in Scotland No. 138843
Training program on Modelling: A Case study Hydro-dynamic Model of Zanzibar channel
 Training program on Modelling: A Case study Hydro-dynamic Model of Zanzibar channel Mayorga-Adame,C.G., Sanga,I.P.L., Majuto, C., Makame, M.A., Garu,M. INTRODUCTION Hydrodynamic Modeling In understanding
General Introduction to Climate Drivers and BoM Climate Services Products
 General Introduction to Climate Drivers and BoM Climate Services Products Climate Information Services Australian Bureau of Meteorology Yuriy Kuleshov El Niño Southern Oscillation (ENSO) El Niño Southern
Figure 4, Photo mosaic taken on February 14 about an hour before sunset near low tide.
 The Impact on Great South Bay of the Breach at Old Inlet Charles N. Flagg and Roger Flood School of Marine and Atmospheric Sciences, Stony Brook University Since the last report was issued on January 31
ASL Environmental Sciences inc.
 A Member of the SNC LAVALIN Group ASL Environmental Sciences inc. Gros Cacouna LNG Terminal Final report Drifter tracking study 501728 December 2004 Rev. 02 ENVIRONMENT Drifter tracking study Procean
Overview. Learning Goals. Prior Knowledge. UWHS Climate Science. Grade Level Time Required Part I 30 minutes Part II 2+ hours Part III
 Draft 2/2014 UWHS Climate Science Unit 3: Natural Variability Chapter 5 in Kump et al Nancy Flowers Overview This module provides a hands-on learning experience where students will analyze sea surface
(679) Dive Line (679) FAX (679)
 Dive Line (679) FAX (679)") (679) 867 7513 Dive Line (679) 888 1111 FAX (679) 888-1333 www.nakiafiji.com DESCRIPTION OF TOURS AND COURSES October 2009 All prices are in US dollars (US$) and do not include local taxes of 15% Thank
(679) 867 7513 Dive Line (679) 888 1111 FAX (679) 888-1333 www.nakiafiji.com DESCRIPTION OF TOURS AND COURSES October 2009 All prices are in US dollars (US$) and do not include local taxes of 15% Thank
Wade Reynolds 1 Frank Young 1,2 Peter Gibbings 1,2. University of Southern Queensland Toowoomba 4350 AUSTRALIA
 A Comparison of Methods for Mapping Golf Greens Wade Reynolds 1 Frank Young 1,2 Peter Gibbings 1,2 1 Faculty of Engineering and Surveying 2 Australian Centre for Sustainable Catchments University of Southern
Case Studies. Georg Umgiesser and Natalja Čerkasova KU, Lithuania
 Case Studies Georg Umgiesser and Natalja Čerkasova KU, Lithuania Case 1: A beach in the Curonian Lagoon Beach Current situation in Curonian lagoon Beach in Kintai In the past, especially in Baltic inner
U.S. Army Engineer Institute for Water Resources
 Sea Level Change Curve Calculator (2014.88) (DRAFT) U.S. Army Engineer Institute for Water Resources Table of Contents 1. INTRODUCTION... 2 1.1 BACKGROUND... 2 1.1.1 INFORMATION QUALITY ACT... 2 1.2 OVERVIEW...
HOURLY OCEANOGRAPHIC AND ACOUSTIC VARIATIONS IN THE STRAIT OF GIBRALTAR, AND MULTIBEAM ECHOSOUNDER TECHNOLOGY
 International Hydrographic Review, Monaco, LXXIII(2), September 1996 HOURLY OCEANOGRAPHIC AND ACOUSTIC VARIATIONS IN THE STRAIT OF GIBRALTAR, AND MULTIBEAM ECHOSOUNDER TECHNOLOGY by RUIZ-CANAVATE,1 A.
Database of Winds and Waves. -internet version-
 2009.1.6 Database of Winds and Waves -internet version- http://www.nmri.go.jp/wavedb/wave2.html National Maritime Research Institute CONTENTS 1. Outline of the Database... 1 2. Use of the Database on the
The Setting - Climatology of the Hawaiian Archipelago. Link to Video of Maui Waves
 The Setting - Climatology of the Hawaiian Archipelago Link to Video of Maui Waves What caused this week s weather? What caused this weekend s weather? Today s Objective: Provide overview and description
Level 3 Earth and Space Science, 2018
 91413 914130 3SUPERVISOR S Level 3 Earth and Space Science, 2018 91413 Demonstrate understanding of processes in the ocean system 2.00 p.m. Thursday 22 November 2018 Credits: Four Achievement Achievement
On the assimilation of SAR wave spectra of S-1A in the wave model MFWAM
 On the assimilation of SAR wave spectra of S-1A in the wave model MFWAM Lotfi Aouf and Alice Dalphinet Météo-France, Département Marine et Océanographie,Toulouse 14 th wave forecasting and hindcasting,
N. Robinson and A. Pyne
 ISSN 0375 8192 March 2004 Antarctic Data Series No 26 WATER COLUMN CURRENT PROFILE ANALYSIS FROM BENEATH THE MCMURDO ICE SHELF AT WINDLESS BIGHT AND UNDER THE SEA ICE IN GRANITE HARBOUR, ANTARCTICA N.
Long term observations of internal waves with shore based video cameras. Ata Suanda and John A. Barth
 Long term observations of internal waves with shore based video cameras Ata Suanda and John A. Barth Internal wave? What is an internal wave? Interior oscillations What is an internal wave? Interior oscillations
Water circulation in Dabob Bay, Washington: Focus on the exchange flows during the diurnal tide transitions
 Water circulation in Dabob Bay, Washington: Focus on the exchange flows during the diurnal tide transitions Jeong-in Kang School of Oceanography University of Washington (206) 349-7319 nortiumz@u.washington.edu
Data Analysis of the Seasonal Variation of the Java Upwelling System and Its Representation in CMIP5 Models
 Data Analysis of the Seasonal Variation of the Java Upwelling System and Its Representation in CMIP5 Models Iulia-Mădălina Ștreangă University of Edinburgh University of Tokyo Research Internship Program
Atmosphere, Ocean and Climate Dynamics Fall 2008
 MIT OpenCourseWare http://ocw.mit.edu 12.003 Atmosphere, Ocean and Climate Dynamics Fall 2008 For information about citing these materials or our Terms of Use, visit: http://ocw.mit.edu/terms. Problem
10.6 The Dynamics of Drainage Flows Developed on a Low Angle Slope in a Large Valley Sharon Zhong 1 and C. David Whiteman 2
 10.6 The Dynamics of Drainage Flows Developed on a Low Angle Slope in a Large Valley Sharon Zhong 1 and C. David Whiteman 2 1Department of Geosciences, University of Houston, Houston, TX 2Pacific Northwest
Figure 1 Example feature overview.
 1. Introduction This case focuses on the northeastern region of Onslow Bay, NC, and includes an initial shoreline, regional contour, wave gauges, inlets, dredging, and beach fills. Most of the features
Real Time Surveying GPS and HYDRO Software for Tide and Swell Compensation
 Real Time Surveying GPS and HYDRO Software for Tide and Swell Compensation by Mr Michael Walker, B.Surv. (Otago) HYDRO Division Trimble Navigation New Zealand Ltd. Abstract This paper focuses on the use
South Bay Coastal Ocean Observing System California Clean Beaches Initiative
 South Bay Coastal Ocean Observing System California Clean Beaches Initiative Quarterly Report March 2004 to City of Imperial Beach Eric Terrill 1 1 Scripps Institution of Oceanography, University of California,
Undertow - Zonation of Flow in Broken Wave Bores
 Nearshore Circulation Undertow and Rip Cells Undertow - Zonation of Flow in Broken Wave Bores In the wave breaking process, the landward transfer of water, associated with bore and surface roller decay
Temperature, salinity, density, and the oceanic pressure field
 Chapter 2 Temperature, salinity, density, and the oceanic pressure field The ratios of the many components which make up the salt in the ocean are remarkably constant, and salinity, the total salt content
MEASUREMENT COMMUNICATION INSIGHT
 Temperature & Depth MEASUREMENT COMMUNICATION INSIGHT CONTENTS Introduction to Aquatec Measuring Temperature and Depth 2 3 Aquatec s Temperature and Depth Loggers AQUAlogger 520 AQUAlogger 530 AQUAlogger
ENVIRONMENT AGENCY GREAT OUSE AND 100 FT DRAIN QUARTERLY BATHYMETRIC SURVEY DECEMBER 2013 SITE SURVEY REPORT NO. H6787
 ENVIRONMENT AGENCY GREAT OUSE AND 100FT DRAIN QUARTERLY BATHYMETRIC SURVEY DECEMBER 2013 NO. H6787 LONGDIN & BROWNING (SURVEYS) LIMITED CHERRY TREE HOUSE CARMARTHEN ROAD SWANSEA SA1 1HE H6787 1 Measured
and the Link between Oceans, Atmosphere, and Weather
 Geography Worksheet Instructions Using a map, atlas, or any other materials your teacher suggests, label the following on the blank map provided. 1. Label East, West, North, and South. 2. Label the following
The role of the inter-bar depressions in hydrodynamic and sediment transport processes of sandy macrotidal beaches
 The role of the inter-bar depressions in hydrodynamic and sediment transport processes of sandy macrotidal beaches Adrien CARTIER 1,2, Arnaud HÉQUETTE 1,2 and Philippe LARROUDE 3 1. Laboratoire d Océanologie
COMPARISON OF DEEP-WATER ADCP AND NDBC BUOY MEASUREMENTS TO HINDCAST PARAMETERS. William R. Dally and Daniel A. Osiecki
 COMPARISON OF DEEP-WATER ADCP AND NDBC BUOY MEASUREMENTS TO HINDCAST PARAMETERS William R. Dally and Daniel A. Osiecki Surfbreak Engineering Sciences, Inc. 207 Surf Road Melbourne Beach, Florida, 32951
Tidal analysis and prediction of the flow characteristics around Abu Dhabi Island
 Tidal analysis and prediction of the flow characteristics around Abu Dhabi Island K.A. Mohamed & M.E. El-Dahshan Research Center, Abu Dhabi Water and Electricity Authority Abstract In coastal seas and
Surf Survey Summary Report
 Port Otago Limited 15 Beach Street Port Chalmers Surf Survey Summary Report August 13-September 1 Leigh McKenzie Summary of Surf Locations of Interest Port Otago Ltd is undertaking monitoring of changes
3.6 Magnetic surveys. Sampling Time variations Gradiometers Processing. Sampling
 3.6 Magnetic surveys Sampling Time variations Gradiometers Processing Sampling Magnetic surveys can be taken along profiles or, more often, on a grid. The data for a grid is usually taken with fairly frequent
A FINAL REPORT BY PARTRAC LIMITED: MAY 2006
 A FINAL REPORT BY PARTRAC LIMITED: MAY 26 Measurement of Suspended Sediment Concentration & Tidal Current During Dredging Operations and Post-Dredge at the Offshore Disposal Area, Poole, Dorset QUALITY
(20 points) 1. ENSO is a coupled climate phenomenon in the tropical Pacific that has both regional and global impacts.
 1. ENSO is a coupled climate phenomenon in the tropical Pacific that has both regional and global impacts.") SIO 210 Problem Set 4 Answer key December 1, 2014 Due Dec. 12, 2014 (20 points) 1. ENSO is a coupled climate phenomenon in the tropical Pacific that has both regional and global impacts. (2 points) a)
SIO 210 Problem Set 4 Answer key December 1, 2014 Due Dec. 12, 2014 (20 points) 1. ENSO is a coupled climate phenomenon in the tropical Pacific that has both regional and global impacts. (2 points) a)
FINAL REPORT APPENDIX A. Physical Description of the Shubenacadie River
 FINAL REPORT APPENDIX A Physical Description of the Shubenacadie River Smart Solutions for Engineering, Science and Computing Physical Description of the Shubenacadie River Martec Technical Report # TR-07-12
IMPACTS OF COASTAL PROTECTION STRATEGIES ON THE COASTS OF CRETE: NUMERICAL EXPERIMENTS
 IMPACTS OF COASTAL PROTECTION STRATEGIES ON THE COASTS OF CRETE: NUMERICAL EXPERIMENTS Tsanis, I.K., Saied, U.M., Valavanis V. Department of Environmental Engineering, Technical University of Crete, Chania,
: Hydrodynamic input for 2D Vessel Simulations (HY- 0027)
") Technical Note To : Christian Taylor (PoHDA) From : Rohan Hudson Cc : Ben Gray Date : 1/04/2015 (Final Draft) Subject : Hydrodynamic input for 2D Vessel Simulations (HY- 0027) Introduction This Technical
Technical Note To : Christian Taylor (PoHDA) From : Rohan Hudson Cc : Ben Gray Date : 1/04/2015 (Final Draft) Subject : Hydrodynamic input for 2D Vessel Simulations (HY- 0027) Introduction This Technical
Surface Tracking Feature
 TELEDYNE RD INSTRUM ENTS A Teledyne Technologies Company Application Note FSA-022 (June 2008) Surface Tracking Feature 1 Introduction The following Application Note serves as a guide of how to use the
Wave research at Department of Oceanography, University of Hawai i
 Wave research at Department of Oceanography, University of Hawai i Hawaii wave climate. Directional waverider buoys around Hawaii. Past and present wave-related research projects. Effect of tides on wave
TECHNICAL INFORMATION BOLLARDPULL TRIALCODE. ForTugs with SteerpropPropulsion. Steerprop
 TECHNICAL INFORMATION BOLLARDPULL TRIALCODE ForTugs with SteerpropPropulsion Steerprop A Skogman / 22 March 2001 BOLLARD PULL TRIAL CODE FOR TUGS This Bollard Pull Trial Code is established to define the
The Islands. Barbados. A prefeasibility study. R. Drieman M. Hinborch M. Monden E.A.J. Vendrik
 The Islands Barbados A prefeasibility study R. Drieman M. Hinborch M. Monden E.A.J. Vendrik General notice to the reader: In the academic programme for Hydraulic Engineering we have in the 4th year (i.e.
Wave Energy Atlas in Vietnam
 Wave Energy Atlas in Vietnam Nguyen Manh Hung, Duong Cong Dien 1 1 Institute of Mechanics, 264 Doi Can Str. Hanoi, Vietnam nmhungim@gmail.com; duongdienim@gmail.com Abstract Vietnam has achieved remarkable
NATURAL VARIABILITY OF MACRO-ZOOPLANKTON AND LARVAL FISHES OFF THE KIMBERLEY, NW AUSTRALIA: PRELIMINARY FINDINGS
 Holliday, D. and Beckley, L.E. (2011) Preliminary investigation of macro-zooplankton and larval fish assemblages off the Kimberley coast, North West Australia. Kimberley Marine & Coastal Science Symposium,
Shoreline changes and reef strengthening at Kavaratti island in Lakshadweep Archipelago - A case study
 Indian Journal of Geo-Marine Sciences Vol. 43(7), July 2014, pp. 1140-1144 Shoreline changes and reef strengthening at Kavaratti island in Lakshadweep Archipelago - A case study T.N.Prakash*, L.Sheela
Implications of climate change for fisheries in the tropical Pacific: Economic development and food security
 Implications of climate change for fisheries in the tropical Pacific: Economic development and food security Johann Bell Vulnerability assessment 88 scientists from 36 institutions Supported by Pacific