Evaluating Extreme Storm Power and Potential Implications to Coastal Infrastructure Damage, Oregon Coast, USA
|
|
|
- Brianna Stokes
- 5 years ago
- Views:
Transcription
1 Evaluating Extreme Storm Power and Potential Implications to Coastal Infrastructure Damage, Oregon Coast, USA 1.0 INTRODUCTION Heidi P. Moritz, P.E. and Hans R. Moritz, P.E. U. S. Army Corps of Engineers, Portland District P.O. Box 2946, Portland, OR Tel: ; FAX: Storm intensity and its effect on coastal infrastructure and shorelines is clearly not just a function of maximum wave height. Recent storm years on the Oregon coast have shown the significant additional effects of storm duration, wave period, storm surge, and wave direction on coastal impacts. In addition, particularly with respect to shorelines, the effects of a series of storms or a series of stormy years can be devastating. In order to better understand the magnitude of the relative forces accompanying each storm and series of storms, storm events need to be described in terms of overall storm power which includes other critical variables. Dolan and Davis (1994) investigated the relative power of Northeasters along the Atlantic Coast. They developed a classification of northeasters analogous to the Saffir-Simpson Scale for hurricanes. Their analysis evaluated 1564 storms over a 50 year period and developed five classes of storm intensity. Since they were using hindcasted data and generally did not have wave period data, they defined storm power as (maximum significant wave height)^2 x duration in hours. Their analysis utilized a storm threshold of 1.5 m. This investigation utilizes hourly wave data from the National Data Buoy Center s buoy #46029 (Columbia River) making wave period available to provide a more complete calculation of wave power. Storm power is evaluated using two methods: (1) Dolan/Davis method to provide a comparison to that study and (2) storm power calculated using the theoretical wave energy flux calculation, P o =½E o C o. Power is then summed over the storm duration to calculate power of individual storms, storm seasons, and storm years. The variability of storm power with wave direction is presented. The correlation of shoreline erosion and coastal infrastructure damage with historical storm power is identified when possible. 2.0 METHOD Hourly wave data was obtained for this analysis from the historical record of National Data Buoy Center (NDBC) buoy #46029, Columbia River. This is a 3 m discus buoy located in a water depth of 128 m approximately 20 miles seaward of the Mouth of the Columbia River. Figure 1 illustrates the location of the NDBC buoy. Period of record utilized for the analysis extended from 1984 to Some data gaps occurred during the period of analysis, the most significant of which extended from 2/87 to 9/91. Directional data was available beginning in the fall of
2 fff Mouth of Columbia River Tillamook Coos Bay Figure 1. Location of NDBC Wave Data In order to assess the minimum wave height cutoff defining a storm event, wave height values from October 1 to March 30 (typical storm season) were summarized. Average wave height and average wave height plus one standard deviation were calculated. The average wave height plus one standared deviation was used to define the storm threshold for this analysis. The Columbia River buoy showed thresholds around 4.3 m so a value of 4.0 m was used to define a storm event. Further analysis of the data was conducted in order to identify individual and independent storm events from the record. The peak over threshold method of extremal wave height analysis chooses local maxima above a chosen threshold. Mathiesen et al (1994) recommend that the auto-correlation function be computed for different time lags from the sampled wave height time series. They also recommend that the minimum time interval between local maxima be somewhat longer than the time lag for which the auto-correlation function is 0.3 to 0.5. Figure 2 illustrates results from an earlier analysis of wave data along the Oregon coast (Moritz, 2004). At auto-correlations of 0.3 and 0.5 for typical Oregon coast data, maximum time lags for all but the 1998 data set yield values of 40 to 60 hrs. To ensure independence of events, the time period between local maxima was chosen at 72 hrs. Wave data was separated into storm years extending from August to June of the following year. Although storm events were identified during this entire time period, the typical storm season for the Columbia River buoy data extends from October through March with the most significant storm 2
3 Minimum time interval between local maxima be somewhat longer than the time lag for which the autocorrelation function is 0.3 to 0.5. (Mathiesen et al, 1994) Auto-Correlation hrs 60 hrs hrs Lag, hours Figure 2. Auto-correlation Values for Oregon Coast Wave Data months being the five months of November through March. Figure 3 illustrates the storm population and calculated power by month over the period of record. The greatest number of storms occur November through January. Storm Population and Power by Month Number, Storm Power (joules (10 10 ) per meter wave crest) Number Average Power Maximum Power 0 August Sept Oct Nov Dec Jan Feb Mar Apr May June Month Figure 3. 3
4 3.0 STORM POWER ANALYSIS PROCEDURE Since this analysis utilized wave buoy data, wave period was available for the calculation of wave power. The rate at which energy is transported toward the shore is the wave power or wave energy flux defined by the following equations for deep water: (USACE, 1984) P = ½ E o C o where: P = wave power (N*m/s per meter wave crest) E o = energy density (kg/s 2 ) C o = wave celerity (m/s). E o = ρgh 2 8 where: E o = energy density (kg/s 2 ) ρ = density of seawater (kg/m 3 ) g = acceleration of gravity (m/s 2 ) H = wave height (m). C o = gt 2π P/hr = P*(3600 s) hr where: C o = wave celerity (m/s) g = acceleration of gravity (m/s 2 ) T = wave period (s). where: total power = joules/hr per meter wave crest. Wave power was calculated for each hour of storm event and then summed over the duration of the storm. Figure 4 illustrates wave height and period plotted against hourly wave power for the entire data set analyzed. This figure illustrates a strong correlation of wave power to wave height, as expected. It also illustrates that while storm events with periods of 20 to 25 seconds have been measured, the most powerful wave power occurred for wave periods of 16.7 seconds. 4.0 ANALYSIS RESULTS Final results of storm power were evaluated as individual storms as well as cumulative per storm year. Figure 5 displays the relationship between individual storm power and maximum wave height and duration. Total storm power is strongly controlled by these two variables with the correlation to duration being stronger. Storm power ranges from approximately 1 to 30 joules (10 10 ) per meter wave crest. Based on the distribution of power, 5 storm categories have been identified as illustrated in figure 5 and in table 1. Storm categories range from mild to extreme at 5 joules (10 10 ) increments. For this 18 year analysis (1987 to1990 are not included), 4 extreme events were identified: 24 November 1998, 2 January 2003, 15 December 2002, and 5 February
5 Hourly Storm Power vs Wave Height and Period Wave Height Period Poly. (Wave Height) Wave Height (m), Period (s) y = x x R 2 = Hourly Storm Power (joules (10 8 ) per meter wave crest) Figure 4. Energy Flux Storm Power vs Wave Height, Duration Maximum Wave Height (m), Duration/10 (hrs) mild moderate strong very strong extreme Maximum Wave Height Duration/10 y = x R 2 = y = x R 2 = Total Storm Power (Joules (10 10 ) per Meter Wave Crest) Figure 5. 5
6 Table 1. Columbia River Buoy Storm Population by Strength Category Storm Category Power Total Percent (J(10 10 )per m wave crest) Number Population Mild 0 < P < Moderate 5 < P < Strong 10 < P < Very Strong 15 < P < Extreme P > In this analysis, 89% of the storm events fell into the mild to moderate range, while 11% fell into the strong to extreme range. Figure 6 displays the relationship between individual storm power and mean wave direction. For the storm categories of strong to extreme, 57% of the storm events were out of the south to southwest, 25% were out of the west, and 18% were out of the northwest. The greatest number of storms, however, were out of the west to northwest. 360 Mean Wave Direction vs Storm Power ( ) Mean Wave Direction (degrees) Northwest West Southwest Storm Power (joules (10 10 ) per meter wave crest Figure 6. 6
7 Figure 7 displays storm duration as a function of maximum wave height. There is a significant amount of scatter in the data. Two storms stand out, however, exhibiting extremely high wave heights but with relatively short duration. These storms seem to be from another storm population different than the rest of the data points. Those two storms occurred 3 March 1999 and 4 February 2006 with maximum wave heights of 12.8 m and 13.4 m, respectively. Due to their short storm durations, neither storm falls within the top 20 most powerful storms. Duration vs Maximum Wave Height 250 with high events without high events y = x R 2 = Duration (hrs) y = x R 2 = Wave Height (m) Figure 7. Tables 2 and 3 summarize the top 20 storm events given both storm power methods. Table 2 lists top 20 storm events using the Dolan/Davis classification method. Table 3 lists the top 20 storm events using the wave energy flux storm power method. Blue shaded lines in both tables indicate storms that occurred in both top 20 lists, however the rank is not necessarily the same. Approximately 60% of the top 20 events occur on both tables. Both methods resulted in the 24 November 1998 storm being the most powerful storm. That storm is illustrated in figure 8. The primary control for the power of the November 98 storm was its duration of 213 hours. Maximum wave height was 9.53 m. The storm year, 1998/99 had multiple high power storm events. An illustration of the importance of duration is seen in figure 9 which compares the 4th, 5th, and 26 th -ranked storms which all occurred in While the 3 March event had a much larger wave height, its duration placed it at number 26 in the ranking. The horizontal axis is divided up into 72 hour increments. The maximum wave height of 7
8 individual storm events must be at least 72 hours apart. Segments of wave record which clearly show building wave heights to the maximum wave height are considered part of the total storm record. Table 2. Dolan / Davis Storm Power Top 20 Storms Date Maximum Average Maximum Average Mean Wave Duration Storm Wave Height Wave Height Wave Period Wave Period Direction Power (m) (m) (s) (s) (degrees) (hrs) (m 2 - hrs) 24-Nov N/A Nov N/A Oct N/A Dec Mar Dec Dec N/A Feb Feb Jan Dec Jan N/A Dec Oct Jan N/A Dec N/A Feb Feb N/A Mar N/A Dec indicates storm was included in both top 20 storm lists. Table 3. Wave Energy Flux Top 20 Storms Storm Date Maximum Average Maximum Average Mean Wave Duration Power Wave Height Wave Height Wave Period Wave Period Direction (Joules (10 10 ) per (m) (m) (s) (s) (degrees) (hrs) m wave crest) 24-Nov N/A Jan Dec N/A Feb Feb Nov Dec Dec Dec Nov Dec Nov N/A Dec Jan Jan Mar N/A Jan N/A Dec Jan N/A Feb indicates storm was included in both top 20 storm lists. 8
9 Wind Direction/100, Wave Height (m) Hourly Wave Height Record 14 November to 5 December,1998 Date: 24 Nov 98 Rank #1 H=9.53 m T=16.7 s Duration = 213 hrs Power=28.9 joules (10 10 )per meter wave crest Wind Direction Wave Height Date Figure 8. Hourly Wave Height Record 2 February to 5 March, 1999 Wind Direction/100, Wave Height (m) Date: 5 Feb 99 Rank #4 H = 8.92 m T = 16.7 s Duration = 182 hrs Power = 24.2 joules (10 10 ) per meter wave crest Wind Direction Wave Height Date: 24 Feb 99 Rank #5 H = 8.73 m T = 16.7 s Duration = 185 hrs Power = 19.9 joules (10 10 ) per meter wave crest Date: 3 Mar 99 Rank #26 H = 12.8 m T = 16.7 s Duration = 96 hrs Power = 11.8 joules (10 10 ) per meter wave crest Date Figure 9. 9
10 Table 4 provides a ranking of the storms by maximum wave height alone. The events highlighted by rose shaded background indicate events that also occur on the top 20 energy flux storm power table. Note that neither of the top 2 events with maximum wave heights greater than 12 m made the top 20 wave energy flux storm power table. Those two storm events are categorized as Strong. Storm ranking is also different between tables. Table 4. Maximum Wave Height Top 20 Storms Storm Date Maximum Average Maximum Average Mean Wave Duration Power Wave Height Wave Height Wave Period Wave Period Direction (joules (10 10 ) per (m) (m) (s) (s) (degrees) (hrs) m wave crest) 4-Feb Mar Dec Feb Oct Nov N/A Nov N/A Oct Dec N/A Nov Jan N/A Mar N/A Feb Oct Jan Nov N/A Jan N/A Oct Mar Oct indicates storm was included in top 20 energy flux storm list. Cumulative storm power was calculated for each storm year analyzed. Figure 10 illustrates those results. Cumulative power is given as total power per 100 meters of shoreline. The yellow dotted line at the bottom of the graph indicates the typical daily power output of Bonneville Dam as a reference of relative power of the storm events. Most of the years after 98/99 stand out as high cumulative power years. Figure 11 shows the number of each category storm documented for each storm year evaluated. This figure also shows a higher number of moderate to very strong events occurring after There has been much speculation regarding the relative impact of El Nino and La Nina cycles on storm climate. Figure 12 provides one display of El Nino and La Nina cycles which charts sea temperatures as documented by Scripps Institution of Oceanography. Red anomalies in the cycle correlate to El Nino years and blue anomalies in the cycle correlate to La Nina years. Figure 13 illustrates the total power per storm year over the analysis period with respect to El Nino and La Nina years. Red outlines and blue outlines indicate El Nino and La Nina years, respectively. The extreme storm power year 1998/1999 occurred during a La Nina cycle. 10
11 Cumulative Storm Power per 100 Meter Shoreline Columbia River Buoy to 2006 Cumulative Storm Power (Joules ( ) per 100 meter wave crest) / / / / / / / / / / / / / / / /2006 Bonneville Dam Daily Power Output 98/99 05/06 01/02 02/03 03/04 30-Jul 29-Aug 29-Sep 29-Oct 29-Nov 29-Dec 29-Jan 28-Feb 31-Mar 30-Apr 31-May 30-Jun Day - Storm Year Figure 10. Storm Category Occurrence Number of Storms Mild Moderate Strong Very Strong Extreme Storm Year Figure
 Total Storm Power by Year (El Nino and La Nina Effects) 25000 Total Power of Storm Year")
12 Figure 12. Illustration of El Nino vs La Nina Cycles (source: Scripps Institute of Oceanography) Total Storm Power by Year (El Nino and La Nina Effects) Total Power of Storm Year (joules (10 8 ) per meter wave crest) Year (ref: NOAA, Scripps) Figure
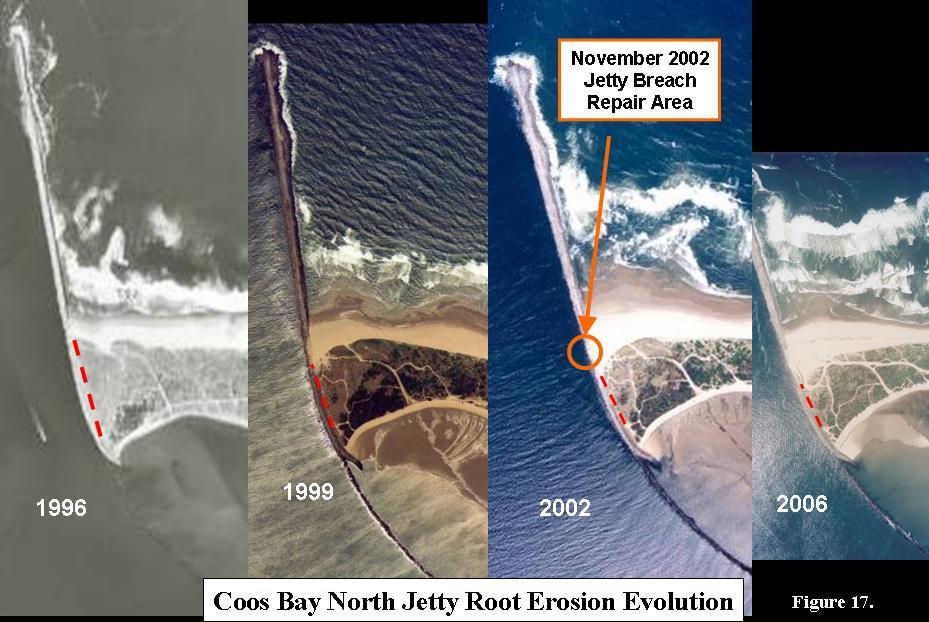
13 5.0 STORM POWER RELATIONSHIP TO COASTAL INFRASTRUCTURE DAMAGE Individual storm power and cumulative storm power per year have been calculated. Establishing a cause and effect relationship with observed coastal structure and shoreline damages is not always straight-forward. Close annual monitoring utilizing photographs of potential problem areas is key to capturing progression of damage and correlation to storms. Budgetary restrictions often limit such close monitoring. In addition, damages to structures, particularly rubblemound structures, and erosion of shorelines can sometimes respond to a series of storms or a series of stormy years prior to visible failure. The preliminary stages can include erosion of foundation or beach/foredune. Figures 14 through 20 provide some visual responses particularly to the storm years of 1998 through The location of projects referred to in these photographs (Mouth of the Columbia River, Coos Bay, and Tillamook) are identified on figure 1. Figures 14 through 16 illustrate conditions at the south jetty at the Mouth of the Columbia River. Figure 14 illustrates Mild storm conditions along the south jetty and identifies an area along the shoreward half of the jetty that has been experiencing increasing damage rates over the past 5 to 8 years. Figure 15 shows a significant notch in the seaward half of the south jetty that has increased in size over the 2005/06 winter storm season. Figure 16 illustrates increased foredune erosion at the root of the south jetty over the same time period. Figures 17 and 18 illustrate erosional impacts to the shoreline immediately north of the north jetty at Coos Bay, specifically over the time period of 1998 through Figure 17 shows the shoreline condition for the years 1996, 1999, 2002, and The width of beach at the jetty root was significantly reduced after the 1998/99 storm season. It appears that subsequent years, 2001/2002 storm season in particular, may have further weakened the area. In November 2002, the root of the North Jetty breached as illustrated in figure 18. Erosion is also illustrated in the log spiral embayment in back of the spit area, also due to storm/wave driven forces. Figures 19 and 20 illustrate losses to jetty length at the Tillamook Bay project. Both jetties, but particularly the South Jetty, have lost length during the time period of late 1990 s to the present. Accelerated erosion also occurred during the same timeframe along the shoreline at the tie-in with the north jetty, necessitating the construction of a protective revetment to stabilize the foredune. 6.0 CONCLUSIONS The primary intent of this analysis was to develop a more useful and definitive method for describing total power of storms and storm years which incorporates wave period and duration. This method was applied to the NDBC buoy data closest to the Mouth of the Columbia River, NDBC buoy #46029, using a lower storm threshold of 4 m wave height. General categories of storms were identified from mild to extreme. Storm power calculations were compared, in general, to a similar classification using the Dolan/Davis method of storm power calculation. The most powerful storms and the most powerful storm years were identified as well as the 13
14 parameters which seemed to contribute most to those classifications. The stormiest months were found to be November through March, with November and December having the most powerful storm events. Storm power was closely correlated to both maximum wave height as well as duration. The most powerful storms had dominant wave periods of 16.7 seconds. Fifty-seven percent of the strongest storm events came out of the south to southwest direction band, while a greater number of storm events came out of the west to northwest direction band. In a comparison of the Dolan/Davis storm power method and the wave energy flux storm power method, 60% of the maximum storm power events occurred in the top 20 storms of both methods. The events with the highest wave height did not come in as the most powerful storms as their duration was significantly less then other storms. La Nina cycles coincide with strong storm event years. The period of record since 1998/1999 stands out as a more powerful time period. It is not known whether this is an indication of an upward trend or just a characteristic of the cycle. Further investigations into series of storm events and series of stormy years with respect to coastal damages and erosion may lead to a better cause and effect understanding of the larger processes involved. With this information, advanced planning for damaging sequences of events can be applied. An evaluation of other buoys along the Oregon and Washington coasts can also supply more information to the overall storm power and coastal response scenario. 7.0 REFERENCES Dolan, R. and Davis, R., An Intensity Scale for Atlantic Coast Northeast Storms, Journal of Coastal Research, Volume 8, No. 4, pp Dolan, R. and Davis, R., Coastal Storm Hazards, Journal of Coastal Research Special Issue No. 12: Coastal Hazards, pp Mathiesen, M., Goda, Y., Hawkes, P.J., Mansard, E., Martin, M.J., Peltier, E., Thompson, E.F., and Van Vledder, G., Recommended Practice for Extreme Wave Analysis, Journal of Hydraulic Research, Vol. 32, No. 6, pp Moritz, H. and Moritz, H., Discrepancies in Design Wave Based on Source and Location of Wave Data, Ocean Wave Measurement and Analysis, Proceedings of the Fourth International Symposium Waves, 2001, San Francisco, CA. Moritz, H. and Moritz, H., Regional Analysis of Extremal Wave Height Variability, Oregon Coast, USA, 8 th International Waves Workshop on Hindcasting and Forecasting, 2004, Turtle Bay, Oahu. U.S. Army Corps of Engineers, Shore Protection Manual, Waterways Experiment Station, Vicksburg, Mississippi. 14
15 Mouth of the Columbia River - South Jetty 12 Jan 2006 Interim Repair Reach A Coast Guard Photos - wave height 16 ft and building Wind south at kts Area of Significant Damage Sustained Within Last 5-8 years Figure
16 9 FEB 2006 Mouth of the Columbia River Ocean Side View of South Jetty Tide elevation in picture = +3 ft MLLW. High tide elevation = +8 ft MLLW Notch in south jetty due to Winter 06 storm waves. A notch was present prior to Feb 06. Recent damage lowered notch by ft. Lowest point of notch is at + 8 ft MLLW. Figure 15. SEP 2003 View to east from ocean side 16
17 7/29/03 Wave-induced erosion of primary dune protecting un-secured jetty root and low elevation backshore. DUNE 2/04/06 DUNE View to east along Mouth of the Columbia River south jetty root Figure
18 18
19 Coos Bay North Jetty Accelerated Damages to Weakened Structure November 8, 2002 North Jetty Breach Shoreline before Breach Sediment Transport through Breach Severe Erosion Log-Spiral Bay Storm Surge and Wave Runup at Runnel Wave Overtopping at Weakened Jetty Root High tide flow through jetty root transports ~ 50,000 cubic yards of sand into channel Figure
20 Tillamook Jetty Length Impacts Figure 19. Shoreline / Jetty Tie-in Erosion Area 20
21 View to NE Nehalem Bay TILLAMOOK BAY 384 of submerged North Jetty North Jetty Root Erosion Weakened North Jetty along Root South Jetty 666 of submerged South Jetty Figure
Regional Analysis of Extremal Wave Height Variability Oregon Coast, USA. Heidi P. Moritz and Hans R. Moritz
 Regional Analysis of Extremal Wave Height Variability Oregon Coast, USA Heidi P. Moritz and Hans R. Moritz U. S. Army Corps of Engineers, Portland District Portland, Oregon, USA 1. INTRODUCTION This extremal
Mouth of the Columbia River Jetties Three-Phase Construction Plan
 Mouth of the Columbia River Jetties Three-Phase Construction Plan Project Overview October 9, 2012 US Army Corps of Engineers MCR Jetties Major Rehabilitation Sand Island pile dikes 1930-1935 Columbia
Response of a Newly Created Marsh-Wetland Affected by Tidal Forcing, Upland Discharge, and Groundwater Interaction
 Response of a Newly Created Marsh-Wetland Affected by Tidal Forcing, Upland Discharge, and Groundwater Interaction Mouth of Columbia River, Cape Disappointment State Park, Washington 12 Hans R. Moritz
STATUS REPORT FOR THE SUBMERGED REEF BALL TM ARTIFICIAL REEF SUBMERGED BREAKWATER BEACH STABILIZATION PROJECT FOR THE GRAND CAYMAN MARRIOTT HOTEL
 August 23 STATUS REPORT FOR THE SUBMERGED REEF BALL TM ARTIFICIAL REEF SUBMERGED BREAKWATER BEACH STABILIZATION PROJECT FOR THE GRAND CAYMAN MARRIOTT HOTEL performed by Lee E. Harris, Ph.D., P.E. Consulting
Nearshore Dredged Material Placement Pilot Study at Noyo Harbor, CA
 1 Nearshore Dredged Material Placement Pilot Study at Noyo Harbor, CA Noyo Cove N 2011 National Conference on Beach Preservation Technology 9-11, February 2011 Lihwa Lin, Honghai Li, Mitchell Brown US
Wave Transformation, Prediction, and Analysis at Kaumalapau Harbor, Lanai, Hawaii
 Wave Transformation, Prediction, and Analysis at Kaumalapau Harbor, Lanai, Hawaii Jessica H. Podoski, P.E. Coastal Engineer, USACE Honolulu District Christopher Goody, P.E. Sea Engineering, Inc. Thomas
Figure 4, Photo mosaic taken on February 14 about an hour before sunset near low tide.
 The Impact on Great South Bay of the Breach at Old Inlet Charles N. Flagg and Roger Flood School of Marine and Atmospheric Sciences, Stony Brook University Since the last report was issued on January 31
Comparison of Predicted and Measured Shoaling at Morro Bay Harbor Entrance, California
 Comparison of Predicted and Measured Shoaling at Morro Bay Harbor Entrance, California by Edward F. Thompson, Inocencio P. DiRamos, and Robert R. Bottin, Jr. PURPOSE: This Coastal and Hydraulics Engineering
Buckland Wind Resource Report
 Buckland Wind Resource Report By: Douglas Vaught, P.E., V3 Energy LLC, Eagle River, Alaska Date: September 17, 2010 Buckland met tower; D. Vaught photo Contents Summary... 2 Test Site Location... 2 Photographs...
Town of Duck, North Carolina
 Tracking No. 00.00.2010 Erosion Mitigation And Shoreline Management Feasibility Study Town of Duck, North Carolina Coastal Planning & Engineering of North Carolina August 15, 2012 Tom Jarrett Robert Neal
CMS Modeling of the North Coast of Puerto Rico
 CMS Modeling of the North Coast of Puerto Rico PRESENTED BY: Dr. Kelly Rankin Legault, Ph.D., P.E. 1 Dr. Alfredo Torruella, Ph.D. 2 1 USACE Jacksonville District 2 University of Puerto Rico October 2016
Chapter 15 SEASONAL CHANGES IN BEACHES OP THE NORTH ATLANTIC COAST OF THE UNITED STATES
 Chapter 15 SEASONAL CHANGES IN BEACHES OP THE NORTH ATLANTIC COAST OF THE UNITED STATES By John M. Darling Hydraulic Engineer, Research Division U. S. Army Coastal Engineering Research Center Corps of
Site Description: Tower Site
 Wind Resource Summary for Elizabeth Site Final Report Colorado Anemometer Loan Program Monitoring Period: 7/3/6 /15/7 Report Date: December 22, 7 Site Description: The site is.6 miles northeast of the
Dune Monitoring Data Update Summary: 2013
 Dune Monitoring Data Update Summary: 13 Shoreline Studies Program Virginia Institute of Marine Science College of William & Mary Gloucester Point, Virginia September 13 Dune Monitoring Data Update Summary:
HURRICANE SANDY LIMITED REEVALUATION REPORT UNION BEACH, NEW JERSEY DRAFT ENGINEERING APPENDIX SUB APPENDIX D SBEACH MODELING
 HURRICANE SANDY LIMITED REEVALUATION REPORT UNION BEACH, NEW JERSEY DRAFT ENGINEERING APPENDIX SUB APPENDIX D SBEACH MODELING Rev. 18 Feb 2015 1 SBEACH Modeling 1.0 Introduction Following the methodology
Properties. terc.ucdavis.edu 8
 Physical Properties 8 Lake surface level Daily since 1900 The lowest lake level on record was 6,220.26 feet on Nov. 30, 1992. Since 1900, lake level has varied by more than 10 feet. Lake level typically
Atqasuk Wind Resource Report
 Atqasuk Wind Resource Report Report by: Douglas Vaught, P.E., V3 Energy LLC, Eagle River, Alaska Date of Report: August 26, 2010 Atqasuk met tower; D. Vaught photo Contents Summary... 2 Test Site Location...
Wind Resource Assessment for NOME (ANVIL MOUNTAIN), ALASKA Date last modified: 5/22/06 Compiled by: Cliff Dolchok
, ALASKA Date last modified: 5/22/06 Compiled by: Cliff Dolchok") 813 W. Northern Lights Blvd. Anchorage, AK 99503 Phone: 907-269-3000 Fax: 907-269-3044 www.akenergyauthority.org SITE SUMMARY Wind Resource Assessment for NOME (ANVIL MOUNTAIN), ALASKA Date last modified:
813 W. Northern Lights Blvd. Anchorage, AK 99503 Phone: 907-269-3000 Fax: 907-269-3044 www.akenergyauthority.org SITE SUMMARY Wind Resource Assessment for NOME (ANVIL MOUNTAIN), ALASKA Date last modified:
Site Description: LOCATION DETAILS Report Prepared By: Tower Site Report Date
 Wind Resource Summary for Holyoke Site Final Report Colorado Anemometer Loan Program Monitoring Period:: 6/21/26 /6/27 Report Date: December 2, 27 Site Description: The site is 17.4 miles south of the
Sand Bank Passage. Fiji nearshore wave hindcast ' ' 19 00'
 Sand Bank Passage Fiji nearshore wave hindcast 1 00' 1 00' 1 30' 1 00' 177 00' 177 30' 17 00' 17 30' 17 30' Figure 1. Location maps of the site. The map on the left shows the region. The map on the right
North Shore of Long Island, Feasibility Study
 North Shore of Long Island, Asharoken New York Asharoken, Feasibility Study Asharoken, NY Public Meeting June 30, 2015 US Army Corps of Engineers US Army Corps of Engineers New York BUILDING STRONG BUILDING
SACO RIVER AND CAMP ELLIS BEACH SACO, MAINE SECTION 111 SHORE DAMAGE MITIGATION PROJECT APPENDIX F ECONOMIC ASSESSMENT
 SACO RIVER AND CAMP ELLIS BEACH SACO, MAINE SECTION 111 SHORE DAMAGE MITIGATION PROJECT APPENDIX F ECONOMIC ASSESSMENT Department of the Army New England District, Corps of Engineers 696 Virginia Road
Technical Note AN EMPIRICAL. METHOD FOR DESIGN OF BREAKWATERS AS SHORE PROTECTION STRUCTURES
 CETN III-23 (Rev 3/95) Coastal Engineering Technical Note AN EMPIRICAL. METHOD FOR DESIGN OF BREAKWATERS AS SHORE PROTECTION STRUCTURES PURPOSE: To present an empirical method that can be used for preliminary
Beach Nourishment Impact on Beach Safety and Surfing in the North Reach of Brevard County, Florida
 Beach Nourishment Impact on Beach Safety and Surfing in the North Reach of Brevard County, Florida Prepared by John Hearin, Ph.D. Coastal Engineering Vice Chairman Cocoa Beach Chapter Port Canaveral Patrick
Wind Resource Assessment for CHEFORNAK, ALASKA
 813 W. Northern Lights Blvd. Anchorage, AK 99503 Phone: 907-269-3000 Fax: 907-269-3044 www.akenergyauthority.org Wind Resource Assessment for CHEFORNAK, ALASKA Date last modified: 3/15/2006 Compiled by:
Sussex County, DE Preliminary Study Overview
 Sussex County, DE Preliminary Study Overview Coastal study scope: 102 miles of entire County shoreline Revised 102 panels for coastal study Riverine study scope: 14 streams, 67.1 miles, within the Nanticoke
City of Del Mar Local Coastal Plan (LCP) Amendment for Sea Level Rise and Coastal Flooding
 Amendment for Sea Level Rise and Coastal Flooding") City of Del Mar Local Coastal Plan (LCP) Amendment for Sea Level Rise and Coastal Flooding 6/22/17 Presentation to Sea Level Rise Stakeholder- Technical Advisory Committee (STAC) Nick Garrity, P.E. Lindsey
City of Del Mar Local Coastal Plan (LCP) Amendment for Sea Level Rise and Coastal Flooding 6/22/17 Presentation to Sea Level Rise Stakeholder- Technical Advisory Committee (STAC) Nick Garrity, P.E. Lindsey
Southwest Washington Littoral Drift Restoration Project: Design, Construction, and Monitoring
 Southwest Washington Littoral Drift Restoration Project: Design, Construction, and Monitoring J Jessica i St Stokke kk USACE Portland District October 28, 2010 WEDA Pacific Meeting Monterey, CA US Army
Compiled by Uwe Dornbusch. Edited by Cherith Moses
 REPORT ON WAVE AND TIDE MEASUREMENTS Compiled by Uwe Dornbusch. Edited by Cherith Moses 1 Aims...1 2 Summary...1 3 Introduction...1 4 Site selection...1 5 Wave recorder settings...2 6 Results...2 6.1 Water
Wind Blow-out Hollow Generated in Fukiage Dune Field, Kagoshima Prefecture, Japan
 R. Nishi Wind Blow-out Hollow Generated in Fukiage Dune Field, Kagoshima Prefecture, Japan Ryuichiro Nishi, Li Elikson and Myokhin PREFACE A sand dune is vulnerable to severe waves and wind. Therefore,
Unit 11 Lesson 2 How Does Ocean Water Move? Copyright Houghton Mifflin Harcourt Publishing Company
 Unit 11 Lesson 2 How Does Ocean Water Move? Catch a Wave A wave is the up-and-down movement of surface water. Catch a Wave Catch a Wave (wave effects) Surface waves are caused by wind pushing against
Sea State Analysis. Topics. Module 7 Sea State Analysis 2/22/2016. CE A676 Coastal Engineering Orson P. Smith, PE, Ph.D.
 Sea State Analysis Module 7 Orson P. Smith, PE, Ph.D. Professor Emeritus Module 7 Sea State Analysis Topics Wave height distribution Wave energy spectra Wind wave generation Directional spectra Hindcasting
WOODFIBRE LNG VESSEL WAKE ASSESSMENT
 Woodfibre LNG Limited WOODFIBRE LNG VESSEL WAKE ASSESSMENT Introduction Woodfibre LNG Limited (WLNG) intends to build a new LNG export terminal at Woodfibre, Howe Sound, British Columbia. WLNG has engaged
EROSION MECHANICS OF A CARBONATE- TOMBOLO BEACH IN MIYAKOJIMA ISLAND, OKINAWA PREFECTURE, JAPAN.
 EROSION MECHANICS OF A CARBONATE- TOMBOLO BEACH IN MIYAKOJIMA ISLAND, OKINAWA PREFECTURE, JAPAN. Ryuichiro NISHI 1, Takaaki UDA 2, Akio KIKUCHI 3 and Kou FURUIKE 4 1) Associate Prof. Dept. of Ocean Civil
GROWING SEASON TEMPERATURES
 Ag-Weather Update: Review of Summer Growing Season & Update on the Wet Forecast for Fall & Winter Paul W. Brown Extension Specialist, Biometeorology College of Agriculture & Life Sciences University of
Beach Renourishment in Jacksonville
 Beach Renourishment in Jacksonville Kevin Bodge, PhD, P.E. - Olsen Associates, Inc. 1978 Oct 2004 2000 2016 2011 Oct 2016 Coastal Duval County, FL Nassau Sound Blount Island Ft. George Inlet St. Johns
FEMA Region V. Great Lakes Coastal Flood Study. Pilot Study Webinar. Berrien County, Michigan. February 26, 2014
 FEMA Region V Great Lakes Coastal Flood Study Pilot Study Webinar Berrien County, Michigan February 26, 2014 2 Pilot Study Webinar Agenda Great Lakes Coastal Flood Study Background Demonstration Project
Implications of changes to El Niño Southern Oscillation for coastal vulnerability in NSW
 Implications of changes to El Niño Southern Oscillation for coastal vulnerability in NSW By Thomas Mortlock (Thomas.mortlock@mq.edu.au) El Niño Southern Oscillation (ENSO) has a strong impact on weather
National Renewable Energy Laboratory. Wind Resource Data Summary Guam Naval Ordnance Annex Data Summary and Retrieval for November 2009
 National Renewable Energy Laboratory Wind Resource Data Summary Guam Naval Ordnance Annex Data Summary and Retrieval for November 2009 Prepared for: National Renewable Energy Laboratory 1617 Cole Boulevard
Atlantic Coast of Long Island, Jones Inlet to East Rockaway Inlet, Long Beach Island, NY Construction Update
 Atlantic Coast of Long Island, Jones Inlet to East Rockaway Inlet, Long Beach Island, NY Construction Update June 2016 US Army Corps of Engineers Project Purpose Three specific damage mechanisms of coastal
COMPARISON OF FIXED & VARIABLE RATES (25 YEARS) CHARTERED BANK ADMINISTERED INTEREST RATES - PRIME BUSINESS*
 CHARTERED BANK ADMINISTERED INTEREST RATES - PRIME BUSINESS*") COMPARISON OF FIXED & VARIABLE RATES (25 YEARS) Fixed Rates Variable Rates FIXED RATES OF THE PAST 25 YEARS AVERAGE RESIDENTIAL MORTGAGE LENDING RATE - 5 YEAR* (Per cent) Year Jan Feb Mar Apr May Jun Jul
COMPARISON OF FIXED & VARIABLE RATES (25 YEARS) Fixed Rates Variable Rates FIXED RATES OF THE PAST 25 YEARS AVERAGE RESIDENTIAL MORTGAGE LENDING RATE - 5 YEAR* (Per cent) Year Jan Feb Mar Apr May Jun Jul
CROSS-SHORE SEDIMENT PROCESSES
 The University of the West Indies Organization of American States PROFESSIONAL DEVELOPMENT PROGRAMME: COASTAL INFRASTRUCTURE DESIGN, CONSTRUCTION AND MAINTENANCE A COURSE IN COASTAL DEFENSE SYSTEMS I CHAPTER
Visualising seasonal-diurnal trends in wind observations
 Visualising seasonal-diurnal trends in wind observations Nicholas J. Cook Highcliffe on Sea, Dorset Introduction One of the most amazing inherent attributes of the human brain is its ability to see patterns
Mango Bay_Resort. Fiji nearshore wave hindcast ' ' 19 00'
 Mango Bay_Resort Fiji nearshore wave hindcast 1 00' 1 30' 1 00' 177 00' 177 30' 17 00' 17 30' Figure 1. Location maps of the site. The map on the left shows the region. The map on the right shows the island
Volume and Shoreline Changes along Pinellas County Beaches during Tropical Storm Debby
 Volume and Shoreline Changes along Pinellas County Beaches during Tropical Storm Debby Ping Wang and Tiffany M. Roberts Coastal Research Laboratory University of South Florida July 24, 2012 Introduction
New Jersey Beach Profile Network Atlantic County Profile Site Locations
 215 RICHARD STOCKTON COLLEGE OF NEW JERSEY New Jersey Beach Profile Network Atlantic County Profile Site Locations COASTAL RESEARCH CENTER Figure 128 There are nine NJBPN survey sites on the Atlantic County
Kavala Bay. Fiji nearshore wave hindcast ' ' 19 00'
 Kavala Bay Fiji nearshore wave hindcast 1 00' 19 00' 1 30' 19 00' 1 00' 1 30' 1 00' 1 30' 1 30' Figure 1. Location maps of the site. The map on the left shows the region. The map on the right shows the
WAVE LOAD ACTING ON HORIZONTAL PLATE DUE TO BORE
 Proceedings of the 6 th International Conference on the Application of Physical Modelling in Coastal and Port Engineering and Science (Coastlab16) Ottawa, Canada, May 10-13, 2016 Copyright : Creative Commons
Figure 1, Chart showing the location of the Breach at Old Inlet and sensors deployed in Great South Bay.
 The Impact on Great South Bay of the Breach at Old Inlet Charles N. Flagg and Roger Flood School of Marine and Atmospheric Sciences, Stony Brook University The Great South Bay project (http://po.msrc.sunysb.edu/gsb/)
Crop Weather Outlook 2012 What Follows A Strong La Niña?
 Crop Weather Outlook 2012 What Follows A Strong La Niña? Elwynn Taylor www.twitter.com/elwynntaylor 1/12/2012 US Corn 147.2 BPA (9.24K/ha) soy 41.5BPA (2.79K/ha) http://www1.ncdc.noaa.gov/pub/data/cmb/extremes/summer-2011-days-over-100.png
Bob Battalio, PE Chief Engineer, ESA September 8, 2016
 RELATING FUTURE COASTAL CONDITIONS TO EXISTING FEMA FLOOD HAZARD MAPS Technical Methods Manual Bob Battalio, PE Chief Engineer, ESA September 8, 2016 FMA 2016 Sacramento, California DWR-OST-SIO PILOTING
IMPACTS OF COASTAL PROTECTION STRATEGIES ON THE COASTS OF CRETE: NUMERICAL EXPERIMENTS
 IMPACTS OF COASTAL PROTECTION STRATEGIES ON THE COASTS OF CRETE: NUMERICAL EXPERIMENTS Tsanis, I.K., Saied, U.M., Valavanis V. Department of Environmental Engineering, Technical University of Crete, Chania,
North Half Moon Bay Shoreline Improvement Project, Pillar Point Harbor, CA Coastal Engineering Appendix
 Engineer Research & Development Center / San Francisco District U. S. Army Corps of Engineers North Half Moon Bay Shoreline Improvement Project, Pillar Point Harbor, CA Coastal Engineering Appendix Photograph
Figure79. Location map for the 10 NJBPN profile sites in Atlantic County, NJ 155
 154 Figure79. Location map for the 10 NJBPN profile sites in Atlantic County, NJ 155 ATLANTIC COUNTY SPRING 2009 to FALL 2010 The Atlantic County coastline consists of three barrier islands. Between Little
CHAPTER 281 INFLUENCE OF NEARSHORE HARDBOTTOM ON REGIONAL SEDIMENT TRANSPORT
 CHAPTER 281 INFLUENCE OF NEARSHORE HARDBOTTOM ON REGIONAL SEDIMENT TRANSPORT Paul C.-P. Lin, Ph.D., P.E. 1 and R. Harvey Sasso, P.E. 2 ABSTRACT The influence of nearshore hardbottom on longshore and cross-shore
Bay County, MI Coastal Hazard Analysis Flood Risk Review Meeting. May 14, 2018
 Bay County, MI Coastal Hazard Analysis Flood Risk Review Meeting May 14, 2018 Agenda Introductions Coastal Flood Risk Study and Mapping Program Current Status Technical Overview of Study and Mapping Floodplain
FINDING OF NO SIGNIFICANT IMPACT
 DEPARTMENT OF THE ARMY CHARLESTON DISTRICT, CORPS OF ENGINEERS 69A HAGOOD AVENUE CHARLESTON, SOUTH CAROLINA 29403-5107 FINDING OF NO SIGNIFICANT IMPACT EDISTO BEACH COASTAL STORM DAMAGE REDUCTION GENERAL
Avaavaroa passage. Rarotonga nearshore wave hindcast 21 09' 21 12' 21 15' 21 18' ' ' ' '
 Avaavaroa passage Rarotonga nearshore wave hindcast 21 09' 21 ' Fuel Pipeline Avatiu Passage Black Rock Avarua Passage Pue Tupapa Papua Passage Avaavaroa Passage 21 15' Ngatangiia Passage onga Wave Hotspot
 A Brief Analysis of the Impact of the El Niño Southern Oscillation (ENSO) Cycle In specific areas around East Timor In the Climate Change section of Seeds of Life, we believe it would be beneficial for
Draft Kivalina Wind Resource Report
 Draft Kivalina Wind Resource Report Kivalina aerial photo by Doug Vaught, July 2011 May 31, 2012 Douglas Vaught, P.E. dvaught@v3energy.com V3 Energy, LLC Eagle River, Alaska Draft Kivalina Wind Resource
ST. JOSEPH PENINSULA, GULF COUNTY, FLORIDA Beach Re-Nourishment and Environmental Enhancement Project RECOMMENDATIONS
 ST. JOSEPH PENINSULA, GULF COUNTY, FLORIDA Beach Re-Nourishment and Environmental Enhancement Project RECOMMENDATIONS January 23, 2018 543 Harbor Boulevard, Suite 204 Destin, Florida 32541 850.654.1555
OECS Regional Engineering Workshop September 29 October 3, 2014
 B E A C H E S. M A R I N A S. D E S I G N. C O N S T R U C T I O N. OECS Regional Engineering Workshop September 29 October 3, 2014 Coastal Erosion and Sea Defense: Introduction to Coastal/Marine Structures
Chapter 4 EM THE COASTAL ENGINEERING MANUAL (Part I) 1 August 2008 (Change 2) Table of Contents. Page. I-4-1. Background...
 1 August 2008 (Change 2) Table of Contents. Page. I-4-1. Background...") Chapter 4 EM 1110-2-1100 THE COASTAL ENGINEERING MANUAL (Part I) 1 August 2008 (Change 2) Table of Contents I-4-1. Background... Page I-4-1 a. Shore Protection Planning and Design, TR 4... I-4-1 b. Shore
Chapter 4 EM 1110-2-1100 THE COASTAL ENGINEERING MANUAL (Part I) 1 August 2008 (Change 2) Table of Contents I-4-1. Background... Page I-4-1 a. Shore Protection Planning and Design, TR 4... I-4-1 b. Shore
Wind Resource Assessment for FALSE PASS, ALASKA Site # 2399 Date last modified: 7/20/2005 Prepared by: Mia Devine
 813 W. Northern Lights Blvd. Anchorage, AK 99503 Phone: 907-269-3000 Fax: 907-269-3044 www.aidea.org/wind.htm Wind Resource Assessment for FALSE PASS, ALASKA Site # 2399 Date last modified: 7/20/2005 Prepared
Reading Material. Inshore oceanography, Anikouchine and Sternberg The World Ocean, Prentice-Hall
 Reading Material Inshore oceanography, Anikouchine and Sternberg The World Ocean, Prentice-Hall BEACH PROCESSES AND COASTAL ENVIRONMENTS COASTAL FEATURES Cross section Map view Terminology for Coastal
Modeling Sediment Transport Along the Upper Texas Coast
 Modeling Sediment Transport Along the Upper Texas Coast David B. King Jr. Jeffery P. Waters William R. Curtis Highway 87 roadbed, Jefferson County Galveston District Corps Sabine Pass to San Luis Pass
A Preliminary Review of Beach Profile and Hardbottom Interactions
 A Preliminary Review of Beach Profile and Hardbottom Interactions Douglas W. Mann, P.E., D.CE. CB&I A World of Solutions Presentation Goal Lead to a better understanding of the challenges regarding the
SURFACE CURRENTS AND TIDES
 NAME SURFACE CURRENTS AND TIDES I. Origin of surface currents Surface currents arise due to the interaction of the prevailing wis a the ocean surface. Hence the surface wi pattern (Figure 1) plays a key
St. Louis County, MN Coastal Hazard Analysis Flood Risk Review Meeting. May 2, 2018
 St. Louis County, MN Coastal Hazard Analysis Flood Risk Review Meeting May 2, 2018 Agenda Introductions Coastal Flood Risk Study and Mapping Program Current Status Technical Overview of Study and Mapping
Comparison of Wind Measurements at Nuchek Heights, Hinchinbrook Island, and at Seal Rocks NOAA Data Buoy in Hinchinbrook Entrance, Alaska
 653.43.627.HnchinbrkWx.pdf Comparison of Wind Measurements at Nuchek Heights, Hinchinbrook Island, and at Seal Rocks NOAA Data Buoy in Hinchinbrook Entrance, Alaska Richard M. Brown Micro Specialties,
VENICE LOCAL COASTAL PROGRAM UPDATE: COASTAL HAZARDS WELCOME
 VENICE LOCAL COASTAL PROGRAM UPDATE: COASTAL HAZARDS WELCOME 1 Introducing the Team Hosted by the Department of City Planning and grant funded in part by the California Coastal Commission 2 Workshop Purpose
Adaptation to climate variation in a diversified fishery:
 Adaptation to climate variation in a diversified fishery: The West Coast groundfish trawl fishery Lisa Pfeiffer Northwest Fisheries Science Center, NOAA Fisheries Seattle, Washington USA The West Coast
ABSTRACT. KEY WORDS: Navigation safety; numerical modeling; waves; current; sediment transport; channel infilling; morphology change.
 The 25th (2015) International Polar and Engineering Conference Li, H., L. Lin, Z. Demirbilek, T. M. Beck, and H. R. Moritz (2015). Wave-Current Conditions and Navigation Safety at an Inlet Entrance. The
MONITORING SEDIMENT TRANSPORT PROCESSES AT MANAVGAT RIVER MOUTH, ANTALYA TURKEY
 COPEDEC VI, 2003 in Colombo, Sri Lanka MONITORING SEDIMENT TRANSPORT PROCESSES AT MANAVGAT RIVER MOUTH, ANTALYA TURKEY Isikhan GULER 1, Aysen ERGIN 2, Ahmet Cevdet YALCINER 3 ABSTRACT Manavgat River, where
Bayfield & Ashland Counties, WI Coastal Hazard Analysis Flood Risk Review Meeting. June 05, 2018
 Bayfield & Ashland Counties, WI Coastal Hazard Analysis Flood Risk Review Meeting June 05, 2018 Agenda Introductions Coastal Flood Risk Study and Mapping Program Current Status Technical Overview of Study
CCoWS. Central Coast Watershed Studies. Summary of Precipitation and Streamflow for Potrero and San Clemente Creeks in 2010
 Central Coast Watershed Studies CCoWS Summary of Precipitation and Streamflow for Potrero and San Clemente Creeks in Water-Year 2010 Santa Lucia Preserve Monterey County, California Publication No. WI-2011-01
Long Beach Island Holgate Spit Little Egg Inlet Historical Evolution Introduction Longshore Transport Map, Survey and Photo Historic Sequence
 Appendix B Long Beach Island Holgate Spit Little Egg Inlet Historical Evolution Introduction The undeveloped southern end of Long Beach Island (LBI) is referred to as the Holgate spit as it adjoins the
Future Condi,ons coastal hazard modeling and mapping
 Future Condi,ons coastal hazard modeling and mapping Presented by Bob Ba:alio, PE Environmental Science Associates, Inc. (ESA) On behalf of the physical processes team (USGS, TerraCosta- Scripps, ESA)
Saint Mary s, Alaska Wind Resource Report (for Pitka s Point and Saint Mary s met towers)
") Saint Mary s, Alaska Wind Resource Report (for Pitka s Point and Saint Mary s met towers) Report written by: Douglas Vaught, P.E., V3 Energy, LLC Date of Report: February 9, 2009 Doug Vaught photo Summary
Saint Mary s, Alaska Wind Resource Report (for Pitka s Point and Saint Mary s met towers) Report written by: Douglas Vaught, P.E., V3 Energy, LLC Date of Report: February 9, 2009 Doug Vaught photo Summary
Currents measurements in the coast of Montevideo, Uruguay
 Currents measurements in the coast of Montevideo, Uruguay M. Fossati, D. Bellón, E. Lorenzo & I. Piedra-Cueva Fluid Mechanics and Environmental Engineering Institute (IMFIA), School of Engineering, Research
Little Spokane River Stream Gage Report: Deadman Creek, Dragoon Creek, and the West Branch of the Little Spokane River
 Little Spokane River Stream Gage Report: Deadman Creek, Dragoon Creek, and the West Branch of the Little Spokane River June 2010 Spokane County Conservation District N. 210 Havana St. Spokane, WA 99202
UNDERSTANDING STORM SURGE
 The Education Program at the New Jersey Sea Grant Consortium 22 Magruder Road, Fort Hancock, NJ 07732 (732) 872-1300 www.njseagrant.org UNDERSTANDING STORM SURGE ACTIVITY 6 SURGE OF THE STORM http://secoora.org/classroom/virtual_hurricane/surge_of_the_storm>
Impact of Hurricane Matthew on the Atlantic Coast of Florida
 Impact of Hurricane Matthew on the Atlantic Coast of Florida A coastal engineer was driving across country and his jeep broke down in front of a monastery. It was late in the day and the monks invited
Northwest Hydraulic Consultants (NHC) is pleased to submit this assessment of the wave climate at Lazo Road, Comox.
 is pleased to submit this assessment of the wave climate at Lazo Road, Comox.") 405 495 Dunsmuir Street Nanaimo, B.C. V9R 6B9 250.754.6425 www.nhcweb.com NHC Ref. No. 03000276 21 November 2014 Wedler Engineering LLP #211-2459 Cousins Avenue Courtenay, BC V9N 3N6 Attention: Andrew
405 495 Dunsmuir Street Nanaimo, B.C. V9R 6B9 250.754.6425 www.nhcweb.com NHC Ref. No. 03000276 21 November 2014 Wedler Engineering LLP #211-2459 Cousins Avenue Courtenay, BC V9N 3N6 Attention: Andrew
Comparisons of Physical and Numerical Model Wave Predictions with Prototype Data at Morro Bay Harbor Entrance, California
 Comparisons of Physical and Numerical Model Wave Predictions with Prototype Data at Morro Bay Harbor Entrance, California by Robert R. Bottin, Jr. and Edward F. Thompson PURPOSE: This Coastal and Hydraulics
100-YEARS OF SHOAL EVOLUTION AT THE MOUTH OF THE COLUMBIA RIVER: IMPACTS ON CHANNEL, STRUCTURES, AND SHORELINES
 100-YEARS OF SHOAL EVOLUTION AT THE MOUTH OF THE COLUMBIA RIVER: IMPACTS ON CHANNEL, STRUCTURES, AND SHORELINES Hans R. Moritz, 1 Heidi P. Moritz, 2 Jessica R. Hays, 3 and Heather R. Sumerell 4 Abstract:
Kodiak, Alaska Site 1 Wind Resource Report
 Kodiak, Alaska Site 1 Wind Resource Report Report written by: Douglas Vaught, P.E., V3 Energy LLC, Eagle River, AK Date of report: March 16, 2007 Photo by Doug Vaught, V3 Energy LLC Summary Information
Climate Change Impacts to KSC Launch Complex
 Climate Change Impacts to KSC Launch Complex Presented to: 2010 International Workshop on Environment and Energy By: John Shaffer NASA Environmental Management Branch Kennedy Space Center Hurricane Season
SECTION 2 HYDROLOGY AND FLOW REGIMES
 SECTION 2 HYDROLOGY AND FLOW REGIMES In this section historical streamflow data from permanent USGS gaging stations will be presented and discussed to document long-term flow regime trends within the Cache-Bayou
APPENDIX G WEATHER DATA SELECTED EXTRACTS FROM ENVIRONMENTAL DATA FOR BCFS VESSEL REPLACEMENT PROGRAM DRAFT REPORT
 APPENDIX G WEATHER DATA SELECTED EXTRACTS FROM ENVIRONMENTAL DATA FOR BCFS VESSEL REPLACEMENT PROGRAM DRAFT REPORT Prepared for: B.C. Ferries Services Inc. Prepared by: George Roddan, P.Eng. Roddan Engineering
UPPER BEACH REPLENISHMENT PROJECT RELATED
 ASSESSMENT OF SAND VOLUME LOSS at the TOWNSHIP of UPPER BEACH REPLENISHMENT PROJECT RELATED to the LANDFALL OF HURRICANE SANDY - PURSUANT TO NJ-DR 4086 This assessment is in response to Hurricane Sandy
Rimatara. French Polynesia
 Rimatara French Polynesia 8 22 00' 16 22 30' 20 23 00' 24 23 30' 28 152 8 4 0 136 153 30' 153 00' 152 30' 152 00' Figure 1. Location maps of the site. The map on the left shows the region. The map on the
TITLE: The Importance of Model Validation: Two Case Studies. AUTHOR:Julie Thomas. Scripps Institution of Oceanography, La Jolla, CA.
 TITLE: The Importance of Model Validation: Two Case Studies AUTHOR:Julie Thomas Scripps Institution of Oceanography, La Jolla, CA jothomas@ucsd.edu CO-AUTHOR: Corey Olfe Scripps Institution of Oceanography,
SHORE PROTECTION AND HABITAT CREATION AT SHAMROCK ISLAND, TEXAS ABSTRACT
 SHORE PROTECTION AND HABITAT CREATION AT SHAMROCK ISLAND, TEXAS M. Cameron Perry, P.E., and Daniel J. Heilman, P.E. Coastal Engineer Shiner Moseley & Associates., Inc. 555 N. Carancahua Corpus Christi,
Chapter 10 Lecture Outline. The Restless Oceans
 Chapter 10 Lecture Outline The Restless Oceans Focus Question 10.1 How does the Coriolis effect influence ocean currents? The Ocean s Surface Circulation Ocean currents Masses of water that flow from one
Sea Level Rise and Coastal Flooding Why Waves Matter!
 Sea Level Rise and Coastal Flooding Why Waves Matter! Jason D. Burtner Massachusetts Office of Coastal Zone Management South Shore Regional Coordinator Sea Level Rise and Coastal Storm Damage and Flooding
+)) Lower Churchill Project RIPRAP DESIGN FOR WIND-GENERATED WAVES SNC LAVALIN. SLI Document No HER
) Lower Churchill Project RIPRAP DESIGN FOR WIND-GENERATED WAVES SNC LAVALIN. SLI Document No HER") +)) SNC LAVALIN Lower Churchill Project RIPRAP DESIGN FOR SLI Document No. 505573-3001-4HER-0011-00 Nalcor Reference No. MFA-SN-CD-0000-CV-RP-0006-01 Rev. 81 Date: 07 -Dec-2012 Prepared by: Checked by:
+)) SNC LAVALIN Lower Churchill Project RIPRAP DESIGN FOR SLI Document No. 505573-3001-4HER-0011-00 Nalcor Reference No. MFA-SN-CD-0000-CV-RP-0006-01 Rev. 81 Date: 07 -Dec-2012 Prepared by: Checked by:
Grays Harbor O&M and Deepening Dredging
 Grays Harbor O&M and Deepening Dredging Elizabeth Chien Project Manager Seattle District 28 January 2016 US Army Corps of Engineers Grays Harbor Navigation Channel Inner Harbor O&M Dredging Summer 2015:
Door County, WI Coastal Hazard Analysis Flood Risk Review Meeting. August 21, 2017
 Door County, WI Coastal Hazard Analysis Flood Risk Review Meeting August 21, 2017 Agenda Introductions Coastal Flood Risk Study and Mapping Program Current Status Technical Overview of Study and Mapping
EVALUATION OF BEACH EROSION UP-DRIFT OF TIDAL INLETS IN SOUTHWEST AND CENTRAL FLORIDA, USA. Mohamed A. Dabees 1 and Brett D.
 EVALUATION OF BEACH EROSION UP-DRIFT OF TIDAL INLETS IN SOUTHWEST AND CENTRAL FLORIDA, USA Mohamed A. Dabees 1 and Brett D. Moore 1 The paper discusses the analysis of up-drift beach erosion near selected