Recommendations to Improve Pedestrian & Bicycle Safety for the City of Bakersfield
|
|
|
- Morris Ellis
- 5 years ago
- Views:
Transcription


1 Recommendations to Improve Pedestrian & Bicycle Safety for the City of Bakersfield August
2 Acknowledgements Planning Committee Jack Becker Bike Bakersfield Cindy Parra Bike Bakersfield Christopher Gerry City of Bakersfield City Manager s Office Ed Murphy City of Bakersfield Public Works Department Jason A. Miao Caltrans District 6 Andrew Miles The Bakersfield Homeless Center Carlos Bello Kern Health Systems Tammy Fisher Kern County Public Health Services Department Peter Smith Kern Council of Governments Cindy Uetz Kern County Department of Human Services We would like to thank the planning committee for inviting us into their community and for hosting the Community Pedestrian and Bicycle Safety Training in Bakersfield. We thank the City of Bakersfield and Bike Bakersfield for providing dinner, snacks, and refreshments in support of this training. Thank you to the Kern County Department of Human Services for providing the Community Partnership Conference Room for this training. Additionally, we thank the Bakersfield City Mayor Karen Goh for welcoming participants to the training. We would like to acknowledge the many community members and agencies present at the workshop and their dedication to pedestrian and bicycle safety. Their collective participation meaningfully informed and strengthened the workshop s outcomes. Funding for this program was provided by a grant from the California Office of Traffic Safety, through the National Highway Traffic Safety Administration. 2
3 Table of Contents Acknowledgements... 2 Planning Committee... 2 Introduction... 4 Planning Process... 5 Existing Conditions... 6 Pedestrian & Bicycle Collision History... 6 Equity Concerns... 6 Walkability & Bikeability Assessment Reflections... 7 Key Opportunities to Improve Walking and Biking Safety Community Recommendations Cal Walks/SafeTREC Recommendations Appendix A Appendix B
4 Recommendations to Improve Pedestrian & Bicycle Safety for the City of Bakersfield By Wendy Ortiz, Esther Postiglione, Yesenia Ocampo, California Walks; Jill Cooper, Ana Lopez, UC Berkeley Safe Transportation Research & Education Center Introduction At the invitation of the City of Bakersfield and Bike Bakersfield, California Walks (Cal Walks), the University of California Berkeley s Safe Transportation Research and Education Center (SafeTREC), and the Planning Committee collaboratively planned and facilitated a Community Pedestrian and Bicycle Safety Training (CPBST) in central Bakersfield. The CPBST is a joint project of Cal Walks and SafeTREC that aims to leverage a community s existing strengths to develop a community-driven pedestrian and bicycle safety action plan and to identify pedestrian and bicycle safety priorities and actionable next steps in collaboration with community partners. The City of Bakersfield and Bike Bakersfield requested a workshop to 1) provide City and County staff, community organizations, and residents with a toolkit for promoting pedestrian and bicycle safety to inform future active transportation projects on State Route 204 (SR 204, locally known as Union Avenue); 2) strengthen working relationships between various agencies and organizations and other stakeholders to ensure the best outcomes for the residents of Bakersfield; and 3) develop consensus regarding pedestrian and bicycle safety priorities and actionable next steps for SR 204 and its adjacent streets. Cal Walks and SafeTREC (Project Team) facilitated the workshop on May 10, 2018 from 4:00 PM to 7:30 PM at the Kern County Department of Human Services, Community Partnership Conference Room. Dinner was provided to maximize community participation. Twenty-nine (29) individuals attended the workshop, including residents and representatives from Kern County Public Works Department, Golden Empire Transit (GET), Kern County Department of Human Services, Sierra Club, Standard School District, Leadership Counsel Justice & Accountability, University of California Agriculture and Natural Resources, and the Bakersfield Police Department. The three and a half (3.5) hour training consisted of: 1) walkability assessments along three key routes; 2) an overview of multidisciplinary approaches to improve pedestrian and bicycle safety using the intersectional 6 E s framework including: Equity & Empowerment, Evaluation, Engineering, Education, Encouragement, and Enforcement and; 3) small group action-planning discussions to prioritize recommendations for Bakersfield s active transportation efforts along SR 204. This report summarizes the workshop proceedings, as well as recommendations for projects, policies, and programs for pedestrian and bicycle safety in Bakersfield. 4
5 Planning Process For each training, the CPBST program convenes a local multi-disciplinary planning committee to tailor and refine the training s curriculum and focus to meet the community s needs. The Project Team conducts pre-training site visits to collect on-the-ground observations of existing walking and biking conditions to adapt the CPBST curriculum and to provide context-specific strategies for the community s existing conditions. The Bakersfield CPBST planning process was initiated on January 25, The planning process consisted of: Community Plans and Policies Review: Cal Walks conducted a review of current community planning documents to inform the training with local context and prepare to build off existing efforts. The following documents were reviewed prior to the site visit: Kern Region Active Transportation Plan. Prepared by Alta Planning + Design for Kern Council of Governments City of Bakersfield Bicycle Transportation Plan. Prepared by Alta Planning + Design for City of Bakersfield Analysis and Mapping of Pedestrian and Bicycle Injury Data: SafeTREC used the Statewide Integrated Traffic Records System (SWITRS) and the Transportation Injury Mapping System (tims.berkeley.edu) to analyze injury data in Bakersfield, and along SR 204, between 21st Street and California Avenue, as well as census data to create collision rates based on population. Patterns of injury collisions, victim characteristics, and demographics were analyzed and presented to inform the planning process for the CPBST. Identification of Priority Discussion Topics for Training: SR 204, between 21st Street and California Avenue, was identified as the geographic focus of the Bakersfield CPBST due to the high rates of pedestrian and bicycle collisions in this area. The Planning Committee identified the following goals for the CPBST: To assess existing conditions along SR 204, particularly between 21st Street and California Avenue, which is a high pedestrian and bicycle traffic area; To identify potential joint pedestrian and bicycle infrastructure projects between the City of Bakersfield and Caltrans; To explore future joint Active Transportation Program proposals for SR 204 between the City of Bakersfield and Caltrans; To support Caltrans traffic safety investigations along SR 204, with a focus on 19th Street and 18th Street, due to the high collision concentrations; To further support Caltrans review for funding for infrastructure improvements and; To identify gaps in the sidewalk network to assess SR 204 s accessibility for all users. Site Visit: The Project Team facilitated an in-person site visit on March 14, 2018 with the Planning Committee at the Bakersfield City Hall to 1) review existing pedestrian and bicycle collision data; 2) collect qualitative data based on in-person observations of existing conditions and travel behaviors and; 3) conduct preliminary walking assessments of the focal neighborhood. Site visit findings were used to develop the workshop presentation, including providing local infrastructure examples and developing the walk/bike assessment route maps. During the site visit, the Planning Committee identified local residents, churches, Department of Human Services, United Farmworkers Union, Salvation Army, Bakersfield City Councilmembers, Bakersfield Burrito Project, Kern County Housing Authority, and the Downtown Business Association as key stakeholders to invite to the CPBST. 5
6 Existing Conditions Pedestrian & Bicycle Collision History Between , there were nineteen (19) pedestrian collisions, including four (4) fatalities and fifteen (15) injuries on SR 204, between 21st Street and California Avenue in the City of Bakersfield 1. Collisions were concentrated between 17th and 19th Street on SR 204. Collisions primarily occurred during high-traffic times in the afternoon and evening, between 6:00 pm and 8:59 pm. The top three pedestrian collision factors for collisions involving pedestrians were pedestrians failing to yield the right-of-way to vehicles outside of a crosswalk (42.1%) 2 ; drivers failing to yield to pedestrian right of way in a crosswalk (15.8%); pedestrians failing to stay close to the roadway (10.5%); and pedestrians failure to yield right-of-way to vehicles already in the crosswalk (10.5%). 3 Between , there were fourteen (14) bicycle collisions and zero (0) fatalities on SR 204, between 21st Street and California Avenue in the City of Bakersfield. 4 Nine (9) out of the thirteen (13) victims involved in a bicycle collision were between the ages of 45-64; five (5) were male and four (4) were female. The top three primary collision factors for collisions involving bicycles were bicyclists or drivers failing to drive on the right half of the roadway (28.6%); bicyclists or drivers failing to stop at the limit line or crosswalk (14.3%); and drivers failing to pass bicyclist only under safe conditions (14.3%). 5 A full discussion of the pedestrian and bicyclist collision data prepared by SafeTREC can be found in Appendix A. Equity Concerns Research shows that residents living in low-income areas, predominantly populated by communities of color, experience higher risk of traffic collisions in their neighborhoods due to historical disinvestments into their neighborhood s infrastructure. Many cities in the Central Valley, including Bakersfield, have been affected by urban sprawl whereby middle-income and high-income earners move out of city centers, creating concentrated pockets of low-income neighborhoods in historic parts of cities. SR 204 used to operate as one of Bakersfield s main highways, consequently, the area is saturated with motels and affordable restaurants, and many homeless families and people have settled along SR 204. There are three homeless shelters in close proximity to the neighborhood with over 150 individuals seeking support during operating hours daily, many of whom depend on walking or biking to access services. Due to the greater number of people walking and biking in this area, the homeless population is and 2016 SWITRS data are provisional as of November Within the 0.7-mile stretch of SR 204, between California Avenue and 21st Street, there are no marked crosswalks outside of fully signalized intersections. 3 Pedestrians have the right-of-way in marked and unmarked crossings, and drivers are legally required to yield to pedestrians in these instances. However, when pedestrians cross outside of marked or unmarked crossings, pedestrians must yield the right-of-way to drivers. A pedestrian is legally able to cross outside of a marked or unmarked crossing between two intersections where one or none of the intersections is signalized but only if the pedestrian yields the right-ofway to oncoming drivers. This is not the same as the term jaywalking, which refers to crossing outside of a marked or unmarked crossing between two signalized intersections and 2016 SWITRS data are provisional as of November According to California Vehicle Code 21200, bicycles are considered vehicles, therefore, bicyclists on public streets have the same rights and responsibilities as automobile drivers. This makes it difficult to discern whether a bicyclist or driver is at fault. 6

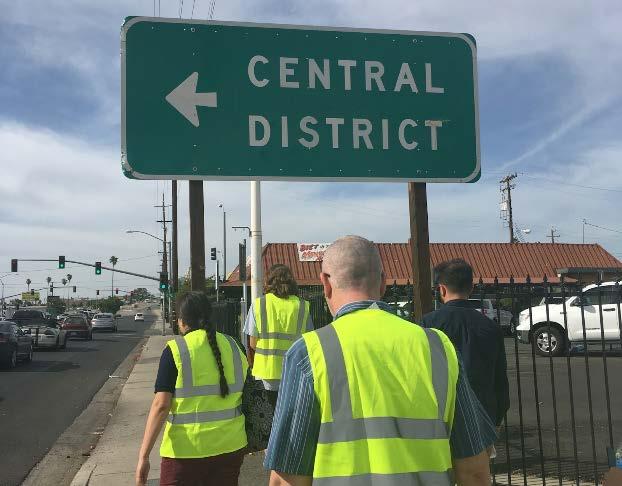
7 disproportionately at risk for pedestrian and bicycle collisions and are less likely to report collisions to the police or seek medical attention. The City of Bakersfield, as well as Planning Committee members, believe there is an extreme underreporting of pedestrian and bycicle collisions in this area due to a resistance to involve local law enforcement, as well as the potential for more severe charges related to other illicit activities when incidents are reported. Walkability & Bikeability Assessment Reflections Workshop participants conducted walkability and bikeability assessments along three key routes: The first walking route focused on the infrastructure and walking experience north on SR 204 from East California Avenue. Starting the walk assessment at the Kern County Department of Human Services, the group of observers walked west on East California Avenue, north on SR 204, south on SR 204 and east on East California Avenue. 7


8 The second walking route focused on the infrastructure and walking experience south on SR 204 from East California Avenue. Starting the walk assessment at Kern County Department of Human Services, the group of observers walked west on East California Avenue, south on SR 204, north on SR 204 and east on East California Avenue. 8

 observe infrastructure conditions and the behavior of all road users; 2) assess the emotional experience of walking or biking along the route; 3) identify positive")
9 The third walking route focused on the infrastructure and walking experience around Dr. Martin Luther King Jr. Park. Starting the walk assessment at Kern County Department of Human Services, the group of observers walked east on East California Avenue, south on S King Street, west on E 10th Street, north on SR 204 and east on East California Avenue. Participants were asked to 1) observe infrastructure conditions and the behavior of all road users; 2) assess the emotional experience of walking or biking along the route; 3) identify positive community assets and strategies which can be built upon; 4) consider how the walking and biking experience might feel different for other vulnerable users. Following the walkability and bikeability assessment, the participants shared the following reflections: Sidewalk Conditions: Sidewalks conditions vary along SR 204. Participants observed obstructions in the sidewalk, including utility poles, advertisements, and debris. Many intersections lacked ADA-compliant ramps, which forces wheelchair users to ride in the street on the right side of the travel lane with cyclists and vehicles. Participants also noted uneven sidewalk pavement throughout, and a gap in sidewalk connectivity for approximately five blocks on SR 204, between 4th Street and 8th Street. Sidewalk conditions along SR 204 are narrow and lack ADA ramps. Signal Timing: The SR 204 and 21st Street intersection is particularly challenging for pedestrians to cross in all directions. There is no direct crossing on SR 204 from east to west. Due to the skewed nature of the intersection, users are forced to cross six separate legs of the intersection if they are attempting to travel east or west on 21st Street. During the site visit, participants crossed and timed the intersection, which revealed it would take users 8 minutes and 55 seconds to get across the intersection. Additionally, the lack of ADA ramps and adequate safety islands at some of the crossings force people to wait for the pedestrian signal in the middle of the roadway with little physical separation from fast moving traffic. Participants witnessed many pedestrians and cyclists choosing to cross the intersection more directly by traveling outside the marked crosswalks, thus placing themselves in danger of collisions with vehicles. 9


10 An aerial view of the skewed intersection at SR 204 and 21st Street. Road Conditions: Along SR 204, grates for drainage are wide, long, and oriented parallel to the direction of travel making it difficult for bicyclists to ride over them. Bicyclists are forced to maneuver closer to the middle of the street with oncoming traffic to avoid getting their tires caught in the drainage gates. Participants also noted uneven and bubbled pavement throughout all of the walking assessment routes. Participants were also concerned that faded crosswalk markings made pedestrian visibility at non-signalized intersections difficult for drivers. Blight: Vacant lots and abandoned buildings on the east side of SR 204 between 10th and 11th Street made walking in the area feel uncomfortable for some training participants. Sewer grates with large slats (left), and a fenced off empty lot on SR 204 (right). 10

11 Road User Behavior: Participants observed people walking outside of marked and unmarked crosswalks while vehicles were travelling towards them. Participants also noted vehicles parked halfway up a driveway and halfway in the road, forcing pedestrians off of the sidewalk and on to the road with vehicular traffic. Bicyclists were also observed riding on the wrong side of the road. A large truck parked on the sidewalk blocks the pedestrian s right-of-way on a sidewalk along on SR 204. Homelessness: The homeless population in Bakersfield, and particularly along SR 204, is increasing and changing in demographics. Andrew Miles from The Bakersfield Homeless Center explained that there are many more homeless young people and families in Bakersfield, partly due to the lack of adequate employment and housing in the area. Many people and families are living in motels along SR 204 as long-term residences. Andrew stressed that the Bakersfield community lacks awareness with homelessness issues and will require the community as a whole to develop deep compassion and understanding to solve these issues. Strong Sense of Community: Particularly along the 3rd route around Dr. Martin Luther King Jr. Park, participants witnessed many residents outside and at the park, which fostered a sense of safety and community through having more eyes on the street. Along the center median on East California Avenue, participants lauded the shade trees and the wide median, which people used as a safety island at both marked and unmarked crosswalks. Key Opportunities to Improve Walking and Biking Safety Following the walkability and bikeability assessment, the Project Team facilitated small-group action planning discussions where participants prioritized and preliminarily planned infrastructure projects and community programs aimed at reducing the number of injuries and fatalities, as well as increasing the number of people and the frequency of walking and biking in Bakersfield. 11

12 Through a voting and self-selecting process during the training, participants chose to focus on a preliminarily plan for Temporary Demonstration Projects, Crossing Enhancements, and Community Bike Rides/Events. Participants self-selected which project they wanted to collaboratively plan for with their fellow participants and discussed: The problem the project is intended to solve; The people, organizations, agencies, and resources needed to implement the project; and Short-term and long-term action steps to implement the project. Training participants sharing their preliminary planned infrastructure and programmatic projects with the entire group. Community Recommendations Workshop participants provided the following recommendations and next steps for overall pedestrian and bicyclist safety improvements: Infrastructure Projects Temporary Demonstration Projects: Participants were interested in implementing temporary demonstration projects as a means to educate all road users on the rules of the road and to cultivate political and community will to address pedestrian and bicycle safety throughout Bakersfield. Participants in this group imagined hosting temporary demonstrations at different locations in the City that highlights specific issues and aligns with a fun community event. For example, participants were interested in creating temporary high-visibility crosswalks in high pedestrian traffic areas as a way to educate the public about pedestrians having the right-ofway in marked and unmarked crosswalks. They wanted to include banners with quick facts and simple phrases about marked and unmarked crosswalks, such as, x number of pedestrians/bicyclists were injured or killed at this unmarked crosswalk or give pedestrians the right-of-way at all crosswalks. As a way to make the demonstration more interactive and increase the visibility of the messaging, participants identified coordination with existing community events, such as carnivals, First Friday events and other community gatherings, as paramount to the temporary demonstrations success. In order to see this project to fruition, the participants identified the City of Bakersfield, Department of Public Works, community groups, K-12 Schools, non-profit organizations, and local businesses as key partners for implementation. 12
13 Crossing Enhancements: Training participants were interested in improving crossing conditions on roads with high pedestrian and bicycle traffic, especially along SR 204. The impetus for focusing on crossing enhancements was to provide pedestrians and cyclists with safer infrastructure to travel throughout the city, with the goal of increasing the number of people walking and biking throughout the City. Participants were interested in installing and/or enabling Leading Pedestrian Intervals (LPI), which gives pedestrians a 3 7 second head start when entering an intersection with a green vehicle signal in the same direction of travel. At signalized intersections with high pedestrian traffic, LPIs enhance the visibility of pedestrians in the intersection and are effective at reinforcing the pedestrian right-of-way over turning vehicles. They were also interested in but did not fully discuss the potential installation of pedestrian safety Islands, especially at E Truxtun Avenue and SR 204/Union Avenue; sidewalks at the SR 204/Union Avenue underpass; bicycle loop detectors; Rapid Rectangular Flashing Beacons (RRFB) at unsignalized, unmarked crosswalks; high-visibility crosswalk markings, especially at SR 204/Union Avenue and 18th Street; street repaving; and traffic warning signs for drivers to watch for pedestrians. Community Programs, Policies, and Campaigns Community Educational Events: Participants were interested in hosting events that are both educational and fun as a way to educate the community on the rules of the road for all modes of transportation. One strategy was to build a greater sense of community while relaying bicycle safety education principles by hosting group bicycle rides. Participants felt that starting the rides at the trails would help build confidence in riders ability to eventually ride on the street. Participants envisioned inviting community residents to the events and partnering with Bike Bakersfield who have League Cycling Instructors (LCIs) and bicycle mechanics on staff to lead the rides and provide maintenance help during the rides. Cal Walks/SafeTREC Recommendations California Walks and SafeTREC also submit the following recommendations for consideration: Create a Local Pedestrian Advocacy Group: In addition to Bakersfield s existing Bicycle/Pedestrian Advisory Committee (BPAC) which advises the City of Bakersfield on pedestrian and bicycle safety plans, the Project Team recommends that workshop participants form a local pedestrian advocacy group to collaborate with Bike Bakersfield on pedestrian and bicycle safety educational and encouragement programs for youth and families. A workshop participant commented that Bakersfield does not have a local pedestrian advocacy group because of its history with urban sprawl development patterns that have made travelling by car the default. While it may be difficult for communities to walk from their homes to commercial areas or other frequented destinations, a local pedestrian advocacy group could schedule regular walking groups and other educational and encouragement activities for youth and their families. Creation of Neighborhood-Specific Transportation Plans to Prioritize and Strategize Needed Investments: The Project Team recommends the City of Bakersfield create neighborhoodspecific transportation plans that would encompass robust community engagement to help the City of Bakersfield gather information on the transportation needs and improvements requested by residents. With a city size of 142 square miles and a population of approximately 365,000 people, Bakersfield neighborhoods are very economically and geographically diverse and consequently, have unique needs. Creating neighborhood-specific transportation plans in coordination with the community can help guide future investments and support grants and 13
14 proposals for funding from state and local agencies. The City could consider submitting applications to the Caltrans Sustainable Communities Transportation Planning Grant Program to fund the development of these neighborhood-specific transportation plans. Increase Collaboration between the City of Bakersfield, Caltrans, and Golden Empire Transit (GET): The Project Team recommends that the City of Bakersfield continue to collaborate with Caltrans and GET to ensure that infrastructure improvements on City property are coupled with improvements on adjacent state routes and bus stops. Focusing on complete infrastructure improvements regardless of jurisdictional boundaries through increased coordination will ensure that the facilities are fully usable for all road users. Collaborating with entities responsible for infrastructure improvements within city limits can also enable crossjurisdictional applications for state and federal funding. In coordination with the City of Bakersfield, the Project Team recommends Caltrans conduct pedestrian and bicycle counts at the 21st Street/SR 204/Union Avenue intersection to decide if it is eligible for an infrastructure improvement. While the implementation of a pedestrian scramble is eligible for intersections with at least 90 pedestrians crossing per hour, special considerations should be made as crossing this intersection is often avoided by pedestrians and cyclists because of the current lengthy and indirect crossing. Pedestrian and bicycle counts should also be conducted at mid-block crossing areas where people tend to cross to avoid the 21st Street/SR 204 intersection. Implement Speed Calming Measures and Other Safety Improvements Along SR 204/Union Avenue: While SR 204/Union Avenue was initially constructed as a highway, it is also a local road with 12-foot vehicle travel lanes. Research has demonstrated that wide streets and wide travel lanes are associated with higher vehicle speeds, 6 which affect the safety of people walking and bicycling. The Project Team recommends that Caltrans consider speed calming and pedestrian and bicycle safety measures along SR 204/Union Avenue, such as reducing vehicle lane widths, installing Leading Pedestrian Intervals (LPI) at high traffic intersections, and vehicle right turn only lanes. 6 See Kay Fitzpatrick, Paul Carlson, Marcus Brewer, and Mark Wooldridge, Design Factors That Affect Driver Speed on Suburban Arterials": Transportation Research Record 1751 (2000):
15 Appendix A Pedestrian and Bicycle Collision Data Analysis 15

16 BAKERSFIELD UNION AVE ANALYSES Community Pedestrian and Bicycle Safety Training Workshop May 10, 2018 The goal of the Community Pedestrian and Bicycle Safety Training (CPBST) is to make communities safer and more pleasant for walking and bicycling. This workshop will train local residents and safety advocates in pedestrian and bicycle safety as well as create opportunitiess for collaboration with local officials and agency staff. This fact sheet highlights pedestrian and bicycle collision data to help your community better prioritize recommendations that emerge from this workshop. 38 people were killed or injured in 37 pedestrian collisions in the last 10 years ( ). The three-year moving average line shows an upward trend in pedestrian collisions.* There were 3 pedestrian collisions in 2015, but an average of 4.3 pedestrian collisions per year for the 3-year rolling average between 2014 and PEDESTRIANS *This line is useful for tracking change over time, especially when the number of collisions changes a lot between years. Data points are at the midpoint of the three years of data specified. 26.3% driver violations VS. 68.4% pedestrian violations Total: 19 collisions *Unclear violations were committed either by the driver, pedestrian or bicyclist. 42.1% of victims were male 10.5% of victims were under age % of victims were ages % of victims (or 7 people) were KILLED or SEVERELY INJURED Data Source: California Statewide Integrated Traffic Records System (SWITRS). Collision data for 2015 and 2016 are provisional at this time. Funding for this program was provided by a grant from the California Office of Traffic Safety through the National Highway Traffic Safety Administration. 16


17 20 people were injured in 20 bicycle collisions in the last 10 years ( ). BICYCLES The three-year moving average line shows an upward trend in bicycle collisions.* There were 3 bicycle collisions in 2015, but an average of 4 bicycle collisions per year for the 3-year rolling average between 2014 and * This line is useful for tracking change over time, especially when the number of collisions changes a lot between years. Data points are at the midpoint of the three years of data specified. Bicycles must follow all the same rules of the road as vehicles. As a result, we cannot break down violations by driver vs. bicyclist pedestrian fatalities & injuries per 100,000 population over the last five years, which is 4.4% more than Kern County and 13.7% less than California 61.5% of victims were male 15.4% of victims were under age % of victims were ages SUMMARY Most bicyclist collisions resulted in minor injuries. Yearly Population Rate of Fatalities & Injuries per 100,000 Population Calculated Over a 5-year Period* Pedestrian Bicyclist Bakersfield bicyclist fatalities & injuries per 100,000 population over the last five years, which is 18.0% more than Kern County and 38.7% less than California Kern California Source: U.S. Census Bureau, Population Division (intercensal population data for 2016). * The rate per population is calculated by adding the number of fatalities and injuries from 2012 to 2016 divided by five times the population in
18 Pedestrian Collisions collisions mapped in Bakersfield, CA on Union Ave, between 21st St and California Ave. Note: 2015 and 2016 SWITRS data are provisional as of November
19 Bicyclist collisions collisions mapped in Bakersfield, CA on Union Ave, between 21st St and California Ave. Note: 2015 and 2016 SWITRS data are provisional as of November
20 Appendix B Pedestrian and Bicycle Collision Data Analysis Site Visit Presentation 20

21 Community Pedestrian and Bicycle Safety Workshop Site Visit Bakersfield, CA 3/14/18 Pedestrian Injury Collision Trend with 3-year moving average Note: 2015 and 2016 SWITRS data are provisional as of November

22 Bicycle Injury Collision Trend with 3-year moving average Note: 2015 and 2016 SWITRS data are provisional as of November
23 Pedestrian Collisions Only 498 of 551 collisions are mapped. Note: 2015 and 2016 SWITRS data are provisional as of November
24 4

25 Pedestrian Collisions by Time of Day and Day of Week ( ) *Color gradient corresponds to collision frequency. Total: 551 collisions 5
26 Top 10 Violations in Pedestrian Collisions (with # and %) Total: 551 collisions 6

27 Pedestrian Victim Injury Severity ( ) Note: 2015 and 2016 SWITRS data are provisional as of November

28 Pedestrian Victims by Age and Gender Note: 2015 and 2016 SWITRS data are provisional as of November

29 Bicycle Collisions of 389 collisions are mapped. Note: 2015 and 2016 SWITRS data are provisional as of November

30 10
31 Bicycle Collisions by Time of Day and Day of Week ( ) *Color gradient corresponds to collision frequency. Total: 389 collisions 11
32 Top 10 Violations in Bicycle Collisions (with # and %) Total: 389 collisions 12
33 Bicycle Victim Injury Severity Note: 2015 and 2016 SWITRS data are provisional as of November

34 Bicycle Victims by Age and Gender Note: 2015 and 2016 SWITRS data are provisional as of November

35 Pedestrian Collision Trend Union Ave (between California & 21st) 3/14/18 Note: 2015 and 2016 SWITRS data are provisional as of November Total: 37 collisions 15

36 Bicycle Collision Trend Union Ave (between California & 21st) Note: 2015 and 2016 SWITRS data are provisional as of November Total: 20 collisions 16
37 Pedestrian Collisions pedestrian collisions are mapped. Note: 2015 and 2016 SWITRS data are provisional as of November

38 18

39 Pedestrian Collisions by Time of Day and Day of Week ( ) *Color gradient corresponds to collision frequency. Total: 19 collisions 19
40 Top 10 Violations in Pedestrian Collisions (with # and %) Total: 19 collisions 20
41 Pedestrian Victim Injury Severity ( ) Note: 2015 and 2016 SWITRS data are provisional as of November
42 Pedestrian Victims by Age and Gender ( ) Note: 2015 and 2016 SWITRS data are provisional as of November

43 Bicycle Collisions collisions are mapped. Note: 2015 and 2016 SWITRS data are provisional as of November

44 24
45 Bicycle Collisions by Time of Day and Day of Week ( ) *Color gradient corresponds to collision frequency. Total: 14 collisions 25
46 Top 10 Violations in Bicycle Collisions (with # and %) Total: 14 collisions 26
47 Bicycle Victim Injury Severity Note: 2015 and 2016 SWITRS data are provisional as of November
48 Bicyclist Victims by Age and Gender Note: 2015 and 2016 SWITRS data are provisional as of November
49 Bakersfield Union Ave Follow-up Data 29
50 Pedestrian Victims by Age and Gender Note: 2015 and 2016 SWITRS data are provisional as of November
51 Bicyclist Victims by Age and Gender Note: 2015 and 2016 SWITRS data are provisional as of November
52 Pedestrian Collisions by Month on Union Ave, Number of Pedestrian Collisions Jan. Feb. Mar. Apr. May June July Aug. Sep. Oct. Nov. Dec. 32
53 Bicyclists Collisions by Month on Union Ave, Number of Bicyclists Collisions Jan. Feb. Mar. Apr. May June July Aug. Sep. Oct. Nov. Dec. 33
 using the Transportation Injury Mapping System (TIMS), a tool that provides")
. Register for a free account to access the tools and resources on TIMS. tims.berkeley.")
54 These collision analyses were prepared by UC Berkeley s Safe Transportation Research and Education Center (SafeTREC) using the Transportation Injury Mapping System (TIMS), a tool that provides quick, easy and free access to the state s crash data, Statewide Integrated Traffic Records System (SWITRS). Register for a free account to access the tools and resources on TIMS. tims.berkeley.edu 34
Recommendations to Improve Pedestrian & Bicycle Safety for the City of Arvin
 Recommendations to Improve Pedestrian & Bicycle Safety for the City of Arvin July 2018 1 Acknowledgements Planning Committee Jack Becker Tammy Fisher Pat Ebel Peter Smith Carlos Bello Christine Viterelli
Recommendations to Improve Pedestrian & Bicycle Safety for the Missouri Flat Area (El Dorado County)
") Recommendations to Improve Pedestrian & Bicycle Safety for the Missouri Flat Area (El Dorado County) October 2017 Recommendations to Improve Pedestrian & Bicycle Safety for the Missouri Flat Area (El Dorado
Recommendations to Improve Pedestrian & Bicycle Safety for the Missouri Flat Area (El Dorado County) October 2017 Recommendations to Improve Pedestrian & Bicycle Safety for the Missouri Flat Area (El Dorado
Recommendations to Improve Pedestrian & Bicycle Safety for the City of Hayward: Tennyson Road Corridor
 Recommendations to Improve Pedestrian & Bicycle Safety for the City of Hayward: Tennyson Road Corridor October 2018 1 Acknowledgments Planning Committee Charmine Solla Steven Chang Patty Garcia Sergio
Recommendations to Improve Pedestrian & Bicycle Safety for the Community of North Shore
 Recommendations to Improve Pedestrian & Bicycle Safety for the Community of North Shore October 2017 Recommendations to Improve Pedestrian & Bicycle Safety for the Community of North Shore By Tony Dang,
Recommendations to Improve Pedestrian & Bicycle Safety for the Arden-Arcade Community
 Recommendations to Improve Pedestrian & Bicycle Safety for the Arden-Arcade Community June 2018 Acknowledgements Planning Committee Joelle Orrock Gail Kelly Molly Patterson Dan Allison Heather Yee Molly
Recommendations to Improve Pedestrian & Bicycle Safety for the Community of Southwest Fresno
 Recommendations to Improve Pedestrian & Bicycle Safety for the Community of Southwest Fresno October 2017 Recommendations to Improve Pedestrian & Bicycle Safety for the Community of Southwest Fresno By
Recommendations to Improve Pedestrian & Bicycle Safety for the Zane Middle School Community
 Recommendations to Improve Pedestrian & Bicycle Safety for the Zane Middle School Community October 2018 1 Acknowledgements Planning Committee Nicole Sager Jesse Willor Jenny Weiss Emily Sinkhorn Scott
Recommendations to Improve Pedestrian & Bicycle Safety in the Azusa Unified School District
 Recommendations to Improve Pedestrian & Bicycle Safety in the Azusa Unified School District October 2017 Recommendations to Improve Pedestrian & Bicycle Safety in the Azusa Unified School District By Mihaela
RECOMMENDATIONS TO IMPROVE PEDESTRIAN & BICYCLE SAFETY IN THE COMMUNITY OF FLORENCE-FIRESTONE
 RECOMMENDATIONS TO IMPROVE PEDESTRIAN & BICYCLE SAFETY IN THE COMMUNITY OF FLORENCE-FIRESTONE September 2017 By Miha Tomuta, Wendy Ortiz, California Walks; Jill Cooper, Katherine Chen, UC Berkeley SafeTREC
Recommendations to Improve Pedestrian & Bicycle Safety for the Community of Palermo
 Recommendations to Improve Pedestrian & Bicycle Safety for the Community of Palermo September 2017 Recommendations to Improve Pedestrian & Bicycle Safety for the Community of Palermo By Wendy Ortiz, Jaime
PEDESTRIAN ACTION PLAN
 ATTACHMENT 2 CITY OF SANTA MONICA PEDESTRIAN ACTION PLAN CITY OF SANTA MONICA PEDESTRIAN ACTION PLAN This page intentionally left blank EXECUTIVE SUMMARY CHAPTER 1 EXECUTIVE SUMMARY Setting the Stage
RECOMMENDATIONS TO IMPROVE PEDESTRIAN & BICYCLIST SAFETY FOR THE MOUNTAIN VIEW SCHOOL DISTRICT (EL MONTE/SOUTH EL MONTE)
") RECOMMENDATIONS TO IMPROVE PEDESTRIAN & BICYCLIST SAFETY FOR THE MOUNTAIN VIEW SCHOOL DISTRICT (EL MONTE/SOUTH EL MONTE) August 2016 By Caro Jauregui, Jaime Fearer, Tony Dang, Wendy Alfsen California Walks;
RECOMMENDATIONS TO IMPROVE PEDESTRIAN & BICYCLIST SAFETY FOR THE MOUNTAIN VIEW SCHOOL DISTRICT (EL MONTE/SOUTH EL MONTE) August 2016 By Caro Jauregui, Jaime Fearer, Tony Dang, Wendy Alfsen California Walks;
Chapter 14 PARLIER RELATIONSHIP TO CITY PLANS AND POLICIES. Recommendations to Improve Pedestrian Safety in the City of Parlier (2014)
") Chapter 14 PARLIER This chapter describes the current status and future plans for biking and walking in the City of Parlier. RELATIONSHIP TO CITY PLANS AND POLICIES The Parlier General Plan is the primary
Chapter 14 PARLIER This chapter describes the current status and future plans for biking and walking in the City of Parlier. RELATIONSHIP TO CITY PLANS AND POLICIES The Parlier General Plan is the primary
RECOMMENDATIONS TO IMPROVE PEDESTRIAN & BICYCLIST SAFETY IN LOS ANGELES CHINATOWN
 RECOMMENDATIONS TO IMPROVE PEDESTRIAN & BICYCLIST SAFETY IN LOS ANGELES CHINATOWN October 2016 By Tony Dang, Caro Jauregui, Jaime Fearer, Wendy Alfsen, California Walks; Jill Cooper, Katherine Chen, UC
Recommendations to Improve Pedestrian & Bicycle Safety for the Clegg Elementary School & Stacey Middle School Community
 Recommendations to Improve Pedestrian & Bicycle Safety for the Clegg Elementary School & Stacey Middle School Community (Westminster School District) October 2018 1 Acknowledgements Planning Committee
Recommendations to Improve Pedestrian & Bicycle Safety for the City of Lemon Grove
 Recommendations to Improve Pedestrian & Bicycle Safety for the City of Lemon Grove October 2018 1 Acknowledgements Planning Committee Anita Lopez Rosa Carney Steve Browne Angeles Nelson Lemon Grove Healthy
City of San Diego Vision Zero Draft Strategic Plan FY 2017
 City of San Diego Vision Zero Draft Strategic Plan FY 2017 Engineering Objective: To develop and implement a strategy that employs best planning, design and engineering practices. Background: Over the
MEMORANDUM. City Constituents. Leilani Schwarcz, Vision Zero Surveillance Epidemiologist, SFDPH
 MEMORANDUM TO: FROM: CC: City Constituents Leilani Schwarcz, Vision Zero Surveillance Epidemiologist, SFDPH Megan Wier, Co-Chair, San Francisco Vision Zero Task Force, SFDPH Commander Ann Mannix, Traffic
Recommendations to Improve Pedestrian & Bicycle Safety for the Valley West Community in Arcata
 Recommendations to Improve Pedestrian & Bicycle Safety for the Valley West Community in Arcata October 2018 1 Acknowledgements Planning Committee Netra Khatri Julie Neander Emily Sinkhorn Jennifer Weiss
Proposed. City of Grand Junction Complete Streets Policy. Exhibit 10
 Proposed City of Grand Junction Complete Streets Policy Exhibit 10 1 City of Grand Junction Complete Streets Policy Vision: The Complete Streets Vision is to develop a safe, efficient, and reliable travel
Chapter 2. Bellingham Bicycle Master Plan Chapter 2: Policies and Actions
 Chapter 2 Bellingham Bicycle Master Plan Chapter 2: Policies and Actions Chapter 2: Policies and Actions The Bicycle Master Plan provides a road map for making bicycling in Bellingham a viable transportation
Agenda. Overview PRINCE GEORGE S PLAZA METRO AREA PEDESTRIAN PLAN
 PRINCE GEORGE S PLAZA METRO AREA PEDESTRIAN PLAN May 28, 2008 Agenda Welcome and introductions Project overview and issue identification Planning context and strengths Design challenges and initial recommendations
5. Pedestrian System. Accomplishments Over the Past Five Years
 5. Pedestrian System Accomplishments Over the Past Five Years The Alamo Area Metropolitan Planning Organization (MPO) and its partner agencies recognize the importance of improving pedestrian mobility.
Hennepin County Pedestrian Plan Public Comment Report
 Hennepin County Pedestrian Plan Public Comment Report On May 31, 2013, the draft Hennepin County Pedestrian Plan was released for a 45-day public comment period ending July 15, 2013. The county received
RECOMMENDATIONS TO IMPROVE PEDESTRIAN SAFETY IN MCKINLEYVILLE
 RECOMMENDATIONS TO IMPROVE PEDESTRIAN SAFETY IN MCKINLEYVILLE May 2015 By Tony Dang, Jaime Fearer, Wendy Alfsen, California Walks; Jill Cooper, UC Berkeley SafeTREC Recommendations to Improve Pedestrian
City of Novi Non-Motorized Master Plan 2011 Executive Summary
 City of Novi Non-Motorized Master Plan 2011 Executive Summary Prepared by: February 28, 2011 Why Plan? Encouraging healthy, active lifestyles through pathway and sidewalk connectivity has been a focus
CONNECTING PEOPLE TO PLACES
 CONNECTING PEOPLE TO PLACES 82 EAST BENCH MASTER PLAN 07 Introduction The East Bench transportation system is a collection of slow moving, treelined residential streets and major arteries that are the
Living Streets Policy
 Living Streets Policy Introduction Living streets balance the needs of motorists, bicyclists, pedestrians and transit riders in ways that promote safety and convenience, enhance community identity, create
RECOMMENDATIONS TO IMPROVE PEDESTRIAN & BICYCLE SAFETY IN ROSEMONT
 RECOMMENDATIONS TO IMPROVE PEDESTRIAN & BICYCLE SAFETY IN ROSEMONT SEPT 2017 By Tony Dang, Jaime Fearer, Miha Tomuta, Wendy Ortiz, California Walks; Jill Cooper, Jessica Rosas, UC Berkeley SafeTREC Recommendations
Citizen Advocacy. VISION ZERO IN HILLSBOROUGH COUNTY TODAY
 Citizen Advocacy http://www.tampabay.com/news/publicsafety/accidents/car-bus-crash-kills-one/441282 VISION ZERO IN HILLSBOROUGH COUNTY TODAY Does Vision Zero Make Sense Here? Traffic Deaths per 100,000
APPENDIX A: Complete Streets Checklist DRAFT NOVEMBER 2016
 APPENDIX A: Complete Streets Checklist DRAFT NOVEMBER 2016 Complete Streets Checklist MetroPlan Orlando s Complete Streets Checklist is an internal planning tool for staff to further implementation of
DRAFT MOVING FORWARD RHODE ISLAND BICYCLE MOBILITY PLAN 2018 PREPARED FOR PREPARED BY IN ASSOCIATION WITH
 RHODE ISLAND MOVING FORWARD BICYCLE MOBILITY PLAN 2018 PREPARED FOR PREPARED BY IN ASSOCIATION WITH T AF CHAPTER 1 D R INTRODUCTION CHAPTER 3 ARTICULATES VISION Bicycling is safe, fun and practical in
SAFE ROUTES TO SCHOOL
 SAFE ROUTES TO SCHOOL Forest Ridge Elementary School Existing Conditions and ACTION PLAN > Oak Creek - Franklin Joint School District Table of Contents CONTEXT Enrollment Boundaries
F L E T C H E R A V E N U E
 Jan. 29, 2014 Introduction F L E T C H E R A V E N U E FDOT Local Agency Program (LAP) Project FPN: 428214-1-58-01 CIP 63090 Hillsborough County, Traffic Engineering, PWD Stake holders and partners are
PRINCE GEORGE S PLAZA METRO AREA PEDESTRIAN PLAN
 PRINCE GEORGE S PLAZA METRO AREA PEDESTRIAN PLAN May 28, 2008 Agenda Welcome and introductions Project overview and issue identification Planning context and strengths Design challenges and initial recommendations
Pedestrian, Bicycle and Traffic Calming Strategic Implementation Plan. January 18, 2011
 Pedestrian, Bicycle and Traffic Calming Strategic Implementation Plan January 18, 2011 Tonight s Agenda Receive update on project Provide feedback on two policy issues Complete Streets Policy Project Prioritization
WELCOME Mission-Geneva Transportation Study
 WELCOME Mission-Geneva Transportation Study Study Process and Schedule 2005 2006 Oct Nov Dec Jan Feb Mar Apr May Jun Jul Aug Sept Oct Task 2 Develop Outreach Plan Task 3 Document Existing Conditions/ Prioritize
POLICY AGENDA For Elder Pedestrian Safety
 POLICY AGENDA For Elder Pedestrian Safety Older adults and people with disabilities often have mobility, cognitive, and sensory limitations that affect their behavior as pedestrians and place them at risk
May 12, 2016 Metro Potential Ballot Measure Issue Brief: Local Return
 Summary: Local return is an important revenue source for cities to maintain their local transportation infrastructure. Most cities use their local return to operate small bus systems and repave streets,
CHAPTER 3: Vision Statement and Goals
 Davidson Walks & Rolls: Active Transportation Master Plan CHAPTER 3 Contents: Overview Vision Statement Measurable Goals Public Outreach CHAPTER 3: Vision Statement and Goals Overview The vision statement
CHAPTER 7.0 IMPLEMENTATION
 CHAPTER 7.0 IMPLEMENTATION Achieving the vision of the Better Streets Plan will rely on the ability to effectively fund, build and maintain improvements, and to sustain improvements over time. CHAPTER
Bikeway action plan. Bicycle Friendly Community Workshop March 5, 2007 Rochester, MN
 Bikeway action plan Summary The was held on March 5, 2007 at the Rochester Mayo Civic Center. The workshop was hosted by Rochester-Olmsted County Planning Department in collaboration with the League of
Perryville TOD and Greenway Plan
 Perryville TOD and Greenway Plan Greenway Glossary Pathway: A bicycle and pedestrian path separated from motorized vehicular traffic by an open space, barrier or curb. Multi-use paths may be within the
Madison Urban Area and Dane County. Bicycle Transportation Plan Summary. September Introduction. Bicycle Plan Scope and Planning Process
 Bicycle Transportation Plan Summary Madison Urban Area and Dane County Introduction September 2000 Bicycling is an important mode of transportation in the Madison urban area and countywide that is available
City of Jacksonville Mobility Fee Update
 City of Jacksonville Mobility Fee Update 2017 Preliminary Analysis May 3, 2017 Carnival Cruise lines photo credit Presentation Overview Public Outreach Process Pedestrian and Bicycle Master Plan Study
NM-POLICY 1: Improve service levels, participation, and options for non-motorized transportation modes throughout the County.
 Transportation PRINCE WILLIAM COUNTY 2008 COMPREHENSIVE PLAN NON-MOTORIZED PLAN CONTENTS Goals, Policies, and Action Strategies Table 4 (Bike Facility Classifications and Descriptions) Table 5 (Bike Facility
CITY OF LOS ANGELES INTER-DEPARTMENTAL MEMORANDUM
 CITY OF LOS ANGELES INTER-DEPARTMENTAL MEMORANDUM Date: December 12,2011 To: Honorable City Council c/o City Clerk, Room 395, City Hall Attention: Honorable Bill Rosendahl, Chair, Transportation Committee
Safer Cycling: How the City of Vancouver is Proactively Improving Cycling Safety
 Safer Cycling: How the City of Vancouver is Proactively Improving Cycling Safety Brian Patterson, MCIP, RPP Urban Systems 2015 Canadian Association of Road Safety Professionals (CARSP) Conference Session
Corpus Christi Metropolitan Transportation Plan Fiscal Year Introduction:
 Introduction: The Safe, Accountable, Flexible, Efficient Transportation Equity Act: A Legacy for Users (SAFETEA-LU) has continued the efforts started through the Intermodal Surface Transportation Efficiency
2. Vision & Goals. Vision. Santa Rosa is a community where walking and bicycling are comfortable and convenient for people of all ages and abilities.
 2. Vision & Goals Overview The goals of the Santa Rosa Bicycle and Pedestrian Master Plan Update reflect the priorities expressed by the community throughout the public outreach phase of this Plan Update.
Chapter 5. Complete Streets and Walkable Communities.
 Chapter 5. Complete Streets and Walkable Communities. 5.1 Description of Complete Streets. Cities throughout the world, and specifically the United States, are coming to embrace a new transportation and
ECONOMY PEOPLE ENVIRONMENT
 Report Back on Local Transit Improvements May 29, 2013 ECONOMY PEOPLE ENVIRONMENT Intro Council Requested Report Back Topics Progress on Planning for Broadway Subway False Creek Bridges Local Transit Improvements
FINAL PLAN APPENDIX D CITY OF BERKELEY BIKE PLAN D-1
 CITY OF BERKELEY BIKE PLAN D-1 . Proposed Programs D.1. EDUCATION This appendix presents the recommended bicycle-related programs for the City of Berkeley. The recommendations are organized in four E s:
Improving intersections for people that walk in Minneapolis
 Matthew Dyrdahl, AICP, LCI Bicycle and Pedestrian Coordinator Minneapolis Public Works CITY OF MINNEAPOLIS Improving intersections for people that walk in Minneapolis Transportation Bonanza February 8,
SR 693 (Pasadena Avenue) Corridor Study from Shore Drive South to 66 th Street
 Corridor Study from Shore Drive South to 66 th Street") Welcome and Introduction Sign-in and comment sheets Restrooms and exits Meeting agenda and timeline Meeting goals / expectations Provide input to guide study recommendations Actively participate throughout
Welcome and Introduction Sign-in and comment sheets Restrooms and exits Meeting agenda and timeline Meeting goals / expectations Provide input to guide study recommendations Actively participate throughout
Item No. 14 Town of Atherton
 Item No. 14 Town of Atherton CITY COUNCIL STAFF REPORT CONSENT AGENDA TO: THROUGH: FROM: HONORABLE MAYOR AND CITY COUNCIL GEORGE RODERICKS, CITY MANAGER MICHAEL KASHIWAGI, COMMUNITY SERVICES DIRECTOR MARTY
Transportation Planning Division
 Transportation Planning Division Presentation Outline Study Tasks Recap of Previous Meetings Data Collected Focus Areas within Study Limits Design Principles Tool Box Recommended Concepts Schedule Moving
Pedestrian Project List and Prioritization
 To: Kyle Wagenschutz, City of Memphis CC: From: Anne Conlon and John Cock, Alta Planning + Design Date: December, 2014 Re: Project List Development (Task 3.1-3.2) and Project List Prioritization (Task
ACTIVE TRANSPORTATION
 ACTIVE TRANSPORTATION Mobility 2040 Supported Goals Improve the availability of transportation options for people and goods. Support travel efficiency measures and system enhancements targeted at congestion
HARRISON STREET/OAKLAND AVENUE COMMUNITY TRANSPORTATION PLAN
 HARRISON STREET/OAKLAND AVENUE Community Workshop #4: Draft Plan Review December 3, 2009 D E S I G N, C O M M U N I T Y & E N V I R O N M E N T INTRODUCTIONS Key Project Staff: Alisa Shen, Project Manager,
ADOT Statewide Bicycle and Pedestrian Program Summary of Phase IV Activities APPENDIX B PEDESTRIAN DEMAND INDEX
 ADOT Statewide Bicycle and Pedestrian Program Summary of Activities APPENDIX B PEDESTRIAN DEMAND INDEX May 24, 2009 Pedestrian Demand Index for State Highway Facilities Revised: May 29, 2007 Introduction
WALKNBIKE DRAFT PLAN NASHVILLE, TENNESSEE EXECUTIVE SUMMARY NASHVILLE, TENNESSEE
 NASHVILLE, TENNESSEE EXECUTIVE SUMMARY Executive Summary A world-class multi-modal transportation system is essential to a vibrant city and better quality of life. -Mayor Barry The WalknBike plan aims
Pedestrian injuries in San Francisco: distribution, causes, and solutions
 Pedestrian injuries in San Francisco: distribution, causes, and solutions Presentation to the San Francisco Health Commission RAJIV BHATIA, MD, MPH DIRECTOR OF OCCUPATIONAL AND ENVIRONMENTAL HEALTH, SAN
8. Collisions INTRODUCTION
 8. Collisions INTRODUCTION While traffic collisions can affect anyone, they have a disproportionate impact on bicyclists, who along with pedestrians are the most vulnerable users of the transportation
Appendix E: Bike Crash Analysis ( )
") Appendix E: Bike Crash Analysis (2009-2012) Davis Bicycle Crashes Analysis 2009-2012 December 2013 Ride Walk Davis Active Transportation Program City of Davis December 2013 Prepared by: Jimmy Fong Active
Appendix E: Bike Crash Analysis (2009-2012) Davis Bicycle Crashes Analysis 2009-2012 December 2013 Ride Walk Davis Active Transportation Program City of Davis December 2013 Prepared by: Jimmy Fong Active
Bicycle Friendly Niagara Falls
 Bicycle Friendly Niagara Falls STAKEHOLDER COMMITTEE MEETING 2 SUPPORTED BY THE OATH COMMUNITY FUND AT THE COMMUNITY FOUNDATION FOR GREATER BUFFALO Develop a Bicycle Master Plan to document the city s
Mayor s Bicycle Advisory Council. Wednesday, December 13 th, 2017
 Mayor s Bicycle Advisory Council Wednesday, December 13 th, 2017 Bicyclist Fatalities, Year to Date (January 1 November 30, 2017) - MBAC Briefing Bicyclist Fatality Statistics Year to date total, 2017
City of Charlottesville Bicycle and Pedestrian Master Plan Update
 City of Charlottesville Bicycle and Pedestrian Master Plan Update September 17, 2014 I. Welcome and meeting overview II. Project status update III. Network overview IV. Break-out groups Pedestrian Network
Bicycle Master Plan Goals, Strategies, and Policies
 Bicycle Master Plan Goals, Strategies, and Policies Mobilizing 5 This chapter outlines the overarching goals, action statements, and action items Long Beach will take in order to achieve its vision of
Pedestrian Road Safety Audit
 Pedestrian Road Safety Audit Middlebrook Road From Father Hurley Boulevard to Waring Station Road December 2017 Montgomery County Department of Transportation Table of Contents 1. Introduction... 1 1.1
POLICY STATEMENT: VISION ZERO
 Overview of APBP Policy Statements POLICY STATEMENT: VISION ZERO The Association of Pedestrian and Bicycle Professionals (APBP) supports the community of professionals working to create more walkable,
o n - m o t o r i z e d transportation is an overlooked element that can greatly enhance the overall quality of life for the community s residents.
 N o n - m o t o r i z e d transportation is an overlooked element that can greatly enhance the overall quality of life for the community s residents. 84 Transportation CHAPTER 11 INTRODUCTION Transportation
CTDOT Pedestrian and Bicycle Safety Initiatives
 CTDOT Pedestrian and Bicycle Safety Initiatives 2017 Northeast Transportation Safety Conference Mark F. Carlino, P.E. Traffic Engineering Division Chief Bureau of Engineering and Construction Connecticut
BETHEL ROAD AND SEDGWICK ROAD CORRIDOR STUDY
 DRAFT PLAN City Council Meeting August 14, 2017 STUDY AREA Sedgwick Corridor State Route 160, principal arterial with Class 3 access management designation, commuter and freight route, connection to SR
PEDESTRIAN SAFETY, MOBILITY & CONTEXT IMPROVEMENT STUDY
 PEDESTRIAN SAFETY, MOBILITY & CONTEXT IMPROVEMENT STUDY STATE ROUTES 70/20 MARYSVILLE, CA JULY 2008 PREPARED BY LOCAL GOVERNMENT COMMISSION COMMUNITY PARTNERS LLC MIG: MOORE IACOFANO GOLTSMAN DESIGNING
Bringing together community and health. Physical Activity and Nutrition Unit Office of Statewide Health Improvement Initiatives
 Bringing together community and health. Physical Activity and Nutrition Unit Office of Statewide Health Improvement Initiatives Physical Activity and Nutrition Unit Office of Statewide Health Improvement
Complete Streets Chicago: Data Driven Design. Luann Hamilton Deputy Commissioner
 Complete Streets Chicago: Data Driven Design Luann Hamilton Deputy Commissioner AGENDA Chicago s goals Complete Streets & Sustainable Infrastructure Guides Data-Driven Planning Setting goals Scoping/research
FHWA Resources for Pedestrian and Bicycle Professionals
 FHWA Resources for Pedestrian and Bicycle Professionals Charlie Zegeer, UNC Highway Safety Research Center/PBIC Libby Thomas, UNC Highway Safety Research Center Dan Nabors, Vanasse Hangen Brustlin (VHB)
Pine Hills Road Pedestrian/Bicycle Safety Study Board of County Commissioners Work Session
 Pine Hills Road Pedestrian/Bicycle Safety Study Board of County Commissioners Work Session February 20, 2018 Meeting Agenda Study Overview Existing Conditions Access Management Potential Gateway Features
CITY OF OAK CREEK SAFE ROUTES TO SCHOOL ACTION PLAN. East Middle School
 CITY OF OAK CREEK SAFE ROUTES TO SCHOOL ACTION PLAN East Middle School CITY OF OAK CREEK SAFE ROUTES TO SCHOOL ACTION PLAN East Middle School Why Safe Routes to School? Safe Routes to School ( SRTS ) is
About the Studio. Edward J. Bloustein School of Planning and Public Policy - Rutgers University
 About the Studio Edward J. Bloustein School of Planning and Public Policy - Rutgers University Purpose of studio: Help City of Bayonne apply for Safe Routes to School (SRTS) funding by producing a School
City of Seattle Edward B. Murray, Mayor
 City of Seattle Edward B. Murray, Mayor Department of Transportation Scott Kubly, Director Eastlake Community Council 117 E Louisa St. #1 Seattle, WA 98102-3278 January 28, 2016 RE: Roosevelt to Downtown
CITY OF COCOA BEACH 2025 COMPREHENSIVE PLAN. Section VIII Mobility Element Goals, Objectives, and Policies
 CITY OF COCOA BEACH 2025 COMPREHENSIVE PLAN Section VIII Mobility Element Goals, Objectives, and Policies Adopted August 6, 2015 by Ordinance No. 1591 VIII MOBILITY ELEMENT Table of Contents Page Number
IMPLEMENTATION CHAPTER Identifying Priorities 7.2 Maintenance 7.3 Funding 7.4 Education and Enforcement IMPLEMENTATION
 CHAPTER 7.0 IMPLEMENTATION 7.1 Identifying Priorities 7.2 Maintenance 7.3 Funding 7.4 Education and Enforcement IMPLEMENTATION Achieving the vision of the Better Streets Plan will rely on the ability to
AMENDING MOTION: Mobility Plan - Pedestrians and Disadvantaged Communities
 I MOVE that the Council: AMENDING MOTION: Mobility Plan - Pedestrians and Disadvantaged Communities 1. INSTRUCT the Department of City Planning to amend the proposed Mobility Plan to include the following;
TOWN OF PORTLAND, CONNECTICUT COMPLETE STREETS POLICY
 TOWN OF PORTLAND, CONNECTICUT COMPLETE STREETS POLICY I. VISION, GOALS & PRINCIPLES VISION To improve the streets of Portland making them safer and more accessible for all users including pedestrians,
MASTER BICYCLE AND PEDESTRIAN PLAN
 VILLAGE OF NORTHBROOK MASTER BICYCLE AND PEDESTRIAN PLAN DRAFT PLAN OPEN HOUSE May 2, 2018 AGENDA 1. Community Engagement 2. Vision and Goals 3. General Structure of Plan 4. Recommendations Overview 5.
For Information Only. Pedestrian Collisions (2011 to 2015) Resolution. Presented: Monday, Apr 18, Report Date Tuesday, Apr 05, 2016
 Resolution. Presented: Monday, Apr 18, Report Date Tuesday, Apr 05, 2016") Presented To: Operations Committee For Information Only Pedestrian Collisions (0 to 0) Presented: Monday, Apr 8, 06 Report Date Tuesday, Apr 0, 06 Type: Correspondence for Information Only Resolution For
Presented To: Operations Committee For Information Only Pedestrian Collisions (0 to 0) Presented: Monday, Apr 8, 06 Report Date Tuesday, Apr 0, 06 Type: Correspondence for Information Only Resolution For
Chapter 13 ORANGE COVE
 Chapter 13 ORANGE COVE This chapter describes the current status and future plans for biking and walking in the City of Orange Cove. RELATIONSHIP TO CITY PLANS AND POLICIES The Orange Cove General Plan
Vision Zero Richmond Action Plan
 Vision Zero Richmond Action Plan COVER Acknowledgements This Vision Zero Action Plan was prepared by the Safe and Healthy Streets Commission and with numerous partners committed to safety in Richmond,
1.0 EXECUTIVE SUMMARY
 1.0 EXECUTIVE SUMMARY The Active Transportation Plan is a guide to accomplish the Town s vision for developing a network of sidewalks, on-road bicycle facilities, and trails that allow for safe and convenient
City of Wilsonville 5 th Street to Kinsman Road Extension Project
 City of Wilsonville 5 th Street to Kinsman Road Walking Tour & Neighborhood Workshop Summary Report Public Outreach Overview On July 18 th, 2017, the City of Wilsonville hosted a neighborhood walking tour
2015 Florida Main Street Annual Conference. Complete Streets Equal Stronger Main Streets
 WHAT ARE COMPLETE STREETS? CASE STUDIES COMPLETING YOUR MAIN STREET 2015 Florida Main Street Annual Conference St. Petersburg, Florida August 19, 2015 WHAT ARE COMPLETE STREETS? CASE STUDIES COMPLETING
Kings County Regional Walk and Bike Plan
 Kings County Regional Walk and Bike Plan Presentation to Corcoran City Council November 13, 2018 Eisen Letunic Transportation, Environmental and Land Use Planning Project objectives Advance local pedestrian/bike
Solana Beach Comprehensive Active Transportation Strategy (CATS)
") Solana Beach Comprehensive Active Transportation Strategy (CATS) 3.0 Goals & Policies The Solana Beach CATS goals and objectives outlined below were largely drawn from the Solana Beach Circulation Element
Solana Beach Comprehensive Active Transportation Strategy (CATS) 3.0 Goals & Policies The Solana Beach CATS goals and objectives outlined below were largely drawn from the Solana Beach Circulation Element
Eastern PA Trail Summit October 1, 2018
 Eastern PA Trail Summit October 1, 2018 WHO WE ARE + WHY + WE RE * HERE * * * * * * Session Goals: Discuss how to coordinate planning and design in small, urbanized towns Consider how to develop alternative
University of Victoria Campus Cycling Plan Terms of Reference. 1.0 Project Description
 University of Victoria Campus Cycling Plan Terms of Reference 1.0 Project Description The Campus Cycling Plan, a first for the University, will provide a comprehensive and coordinated approach to support
Broad Street Bicycle Boulevard Design Guidelines
 Broad Street Bicycle Boulevard Design Guidelines Building from the strategies introduced in the 2013 Bicycle Transportation Plan and community input received thus far, City Transportation Staff have identified
MARTIN LUTHER KING JR. WAY
 OCTOBER 2011 40 Vision and Goals The Martin Luther King, Jr. Way Illustrative Master Plan that follows has been developed through a process of community involvement. It expresses a long term vision for
Mayor s Pedestrian Advisory Council. Wednesday, February 15
 Mayor s Pedestrian Advisory Council Wednesday, February 15 Annual Pedestrian Fatalities 2005-2016 Year-End Pedestrian Fatalities, 2016 (CPD): 44 Year-End Pedestrian Fatalities, 2015 (CPD): 46 Year-End