Recommendations to Improve Pedestrian & Bicycle Safety for the Zane Middle School Community
|
|
|
- Linette Gallagher
- 5 years ago
- Views:
Transcription


1 Recommendations to Improve Pedestrian & Bicycle Safety for the Zane Middle School Community October
2 Acknowledgements Planning Committee Nicole Sager Jesse Willor Jenny Weiss Emily Sinkhorn Scott Ellsmore Miles Slattery Elaine Hogan Mellody Mallick Peggy O Neill Claire Perricelli Randall Simms City of Eureka City of Eureka Redwood Community Action Agency Redwood Community Action Agency City of Eureka City of Eureka Humboldt County Public Health Humboldt County Public Health Yurok Tribe Community Member Principal, Zane Middle School We would like to thank the planning committee for inviting us into their community and for hosting the Community Pedestrian and Bicycle Safety Training in Eureka. We would like to thank the City of Eureka for providing dinner and refreshments in support of this training. We would like to thank the Humboldt County Public Health Department for providing pedestrian and biking safety coloring books and the Redwood Community Action Agency for providing Humboldt Bay Area Bike Maps to participants. Thank you to Catherine L. Zane Middle School for providing the workshop space. We acknowledge the community members and agencies present at the workshop and their dedication to pedestrian and bicycle safety. Their collective participation meaningfully informed and strengthened the workshop s outcomes. Funding for this program was provided by a grant from the California Office of Traffic Safety, through the National Highway Traffic Safety Administration. 2
3 3
4 Table of Contents Acknowledgements... 2 Planning Committee... 2 Introduction... 5 Background... 6 Planning Process... 6 Existing Conditions... 7 Pedestrian & Bicycle Collision History... 7 Equity Concerns... 9 Walkability & Bikeability Assessment Reflections Key Opportunities to Improve Walking and Biking Safety Community Recommendations Cal Walks/SafeTREC Recommendations Appendix A Appendix B
5 Recommendations to Improve Pedestrian & Bicycle Safety for the Zane Middle School Community By Mihaela Tomuta, Wendy Ortiz, Yesenia Ocampo, California Walks; Lisa Peterson, Amanda Reynosa, UC Berkeley Safe Transportation Research & Education Center Introduction At the invitation of the City of Eureka, California Walks (Cal Walks), the University of California at Berkeley s Safe Transportation Research and Education Center (SafeTREC), and the Planning Committee collaboratively planned and facilitated a Community Pedestrian and Bicycle Safety Training (CPBST) in Eureka. The CPBST is a community-driven pedestrian and bicycle safety action-planning workshop aimed to improve walkability and bikeability around Zane Middle School and across the City. The City of Eureka requested a workshop to 1) provide City and County staff, community organizations, and residents with a toolkit for promoting pedestrian and bicycle safety to inform future active transportation projects around Zane Middle School; 2) strengthen working relationships between various agencies and organizations and other stakeholders to ensure the best outcomes for the residents and students of Eureka; and 3) develop consensus regarding pedestrian and bicycle safety priorities and actionable next steps for the area surrounding Zane Middle School. Cal Walks and SafeTREC (Project Team) facilitated the workshop on May 22, 2018 from 3:00 PM to 6:00 PM at the Zane Middle School Library. Twenty-four (24) individuals attended the workshop including residents, students, the City of Eureka Departments of Public Works and Community Services, Redwood Community Action Agency, Humboldt County Department of Public Health, Yurok Tribe, Zane Middle School, the Eureka Police Department, and Humboldt County Supervisor Virginia Bass Office (4th District). The training consisted of: 1) an overview of multidisciplinary approaches to improve pedestrian and bicycle safety using the intersectional 6 E s framework including: Equity & Empowerment, Evaluation, Engineering, Education, Encouragement, and Enforcement; 2) walkability assessments along three key routes and; 3) small group action-planning discussions to prioritize recommendations for Eureka s trail expansion efforts. The Planning Committee s goal was to create safe, convenient, and fun opportunities for children to walk and bike to and from Zane Middle School, including using the City s interconnected trail system. This report summarizes the workshop proceedings, as well as recommendations for projects, policies, and programs for pedestrian and bicycle safety in Eureka. 5

6 Background The CPBST is a joint project of Cal Walks and SafeTREC that aims to leverage a community s existing strengths to develop a community-driven pedestrian and bicycle safety action plan and to identify pedestrian and bicycle safety priorities and concrete next steps in collaboration with community partners. For each training, the program convenes a local multi-disciplinary planning committee to tailor and refine the training s curriculum and focus to meet the community s needs. Cal Walks and SafeTREC conduct pre-training site visits to collect on-the-ground observations of existing walking and biking conditions to adapt the CPBST curriculum and to provide context-specific strategies for the community s existing conditions. Planning Process The Eureka CPBST planning process was initiated in April The planning process consisted of: Community Plans and Policies Review: Cal Walks conducted a review of current community planning documents to inform the training with local context and prepare to build off existing efforts. The following documents were reviewed prior to the site visit: Opportunities to Improve Transportation Equity in Humboldt County, May 2006 Safe Routes to School Programs in Rural California: A Guide for Communities and Partners, September 2015 HCAOG Safe Routes to Schools Regional Prioritization Tool, November 2012 Humboldt Regional Bicycle Plan Update 2012 Analysis and Mapping of Pedestrian and Bicycle Injury Data: UC Berkeley SafeTREC used the Statewide Integrated Traffic Records System (SWITRS) data and the Transportation Injury Mapping System (tims.berkeley.edu) to analyze injury trends in Eureka as well as census data to create rates based on population. Patterns of injury collisions, victim characteristics and demographics were analyzed and presented to the Planning Committee. 6
7 Identification of Priority Discussion Topics for Training: The Planning Committee identified the conversion of a city-owned sewer line into a connected part of the Eureka trail system that runs behind Zane Middle School as the focus of the Eureka CPBST: To assess existing conditions along the proposed trail behind Zane Middle School; To explore potential pedestrian and bicycle infrastructure changes along S Street and adjacent streets; To support and build on existing Safe Routes to School education and encouragement efforts by Redwood Community Action Agency; To address City, School District, and community concerns related to students getting to and from school along S Street, and Buhne Street; To provide an opportunity to gather community input on the City s proposed Bay to Zoo trail, which would connect the coast to the communities surrounding Zane Middle School; and To provide an opportunity for community members to give input on potential future pedestrian and bicycle infrastructure improvements in the City. Site Visit: The Project Team facilitated an in-person site visit on May 1, 2018 with the Planning Committee at Zane Middle School to 1) review existing pedestrian and bicycle collision data; 2) collect qualitative data based on in-person observations of existing conditions and travel behaviors and; 3) conduct preliminary walking assessments of the focal neighborhood. Site visit findings were used to develop the workshop presentation, including providing local infrastructure examples and developing the walk/bike assessment route maps. Existing Conditions Pedestrian & Bicycle Collision History Between , there were 143 pedestrian collisions, including nine (9) fatalities and twenty-two (22) severe injuries with collisions concentrated on or along U.S. Route 101 (US 101), locally known as Broadway Street and Redwood Highway, with smaller concentrations along F Street. 1 Collisions primarily occurred during high-traffic times in the late afternoon, between 3:00 PM and 5:59 PM. The top two primary collision factors for collisions involving pedestrians were drivers failing to yield to a pedestrian with the right-of-way in a crosswalk (44.8%) and pedestrians failing to yield to drivers 2 (28%) and 2016 SWITRS data are provisional as of November Pedestrians have the right-of-way in marked and unmarked crossings, and drivers are legally required to yield to pedestrians in these instances. However, when pedestrians cross outside of marked or unmarked crossings, pedestrians must yield the right-of-way to drivers. A pedestrian is legally able to cross outside of a marked or unmarked crossing between two intersections where one or none of the intersections is signalized but only if the pedestrian yields the right-ofway to oncoming drivers. This is not the same as the term jaywalking, which refers to crossing outside of a marked or unmarked crossing between two signalized intersections. 7

8 Pedestrian Collision Trend with 3-year moving average Between , there were 104 bicycle collisions, including two (2) fatalities and seven (7) severe injuries with collisions concentrated on or along SR 101, with smaller concentrations along California Street 3. Collisions primarily occurred during high-traffic times in the late afternoon, between 3:00 PM and 5:59 PM. The top three primary collision factors for collisions involving bicycles were bicyclists failure to ride on right edge of roadway if riding below the normal speed of traffic (10.6%), bicyclists or driver s failure to stop at a limit line or crosswalk at a stop sign (9.6 %), and bicyclists or drivers failure to stop or yield right-of-way at a stop sign (9.6%) and 2016 SWITRS data are provisional as of November According to California Vehicle Code 21200, bicycles are considered vehicles; therefore, bicyclists on public streets have the same rights and responsibilities as automobile drivers. This makes it difficult to discern whether a bicyclist or driver is at fault. 8
9 Bicycle Collision Trend with 3-year moving average A full discussion of pedestrian and bicyclist collision data prepared by SafeTREC can be found in Appendix A and B. Equity Concerns The City of Eureka has urban and rural active transportation needs, which reflect past decisions and future opportunities. Built on a grid system with a rural scale, streets were originally designed for lowvolume, low-speed traffic. US 101 is a major state highway that parallels Eureka s entire coastal northsouth route, including the Downtown area, yet has insufficient pedestrian and bicycle facilities to accommodate for the current amount of pedestrian and bicycle traffic in the area. The lack of adequate facilities makes it difficult for people to safely walk and bike, and particularly affects those who walk and bike as their main mode of transportation, such as lower income, homeless, and/or housing insecure individuals. The majority of collisions involving pedestrians and bicyclists occur on and around the US 101 corridor and other higher speed one-way streets in Downtown Eureka. Many of these streets were designed and built decades ago and are more characteristic of rural communities than the urban center Eureka continues to become. Changes in development patterns, commuting practices, and population growth have made the need for safe, accessible, and affordable active transportation options more evident. Along with infrastructure needs, education and encouragement programs are needed to encourage 9
10 travel by walking and biking and use of existing facilities, including the Waterfront Trail and Bay to Zoo Trail, as well as to educate drivers of active transportation users needs. Although the CPBST workshop focused on the area around Zane Middle School, the City of Eureka expressed a commitment during the site visit and workshop to address walking and biking safety concerns citywide and support education and encouragement efforts aimed at increasing active transportation use throughout the City. Pedestrian Collisions Bicycle Collisions Walkability & Bikeability Assessment Reflections Workshop participants conducted walkability and bikeability assessments along three routes. Participants were asked to 1) observe infrastructure conditions and the behavior and needs of all road users; and 2) identify positive community assets upon which pedestrian and bicycle safety strategies can be built. 10
11 Route 1: Buhne Street and S Street Intersection The first walking route focused on the infrastructure and walking experience around the front entrance of Zane Middle School, especially at the intersection of Buhne Street and S Street, which is used by many students to get to and from school. S Street experiences high volumes of vehicle traffic during school arrival and dismissal times. Starting the walk assessment at Zane Middle School, participants walked up the school driveway to South Street, south on South Street to Buhne Street and observed the intersection of Buhne Street and South Street then traveled north on South Street back to the School. Route 2: S Street and County Lane The second walking route focused on S Street and County Lane. Participants traveled north on S Street to County Lane, east on County Lane, south on West Avenue to S Street and continued back to Zane Middle School. 11


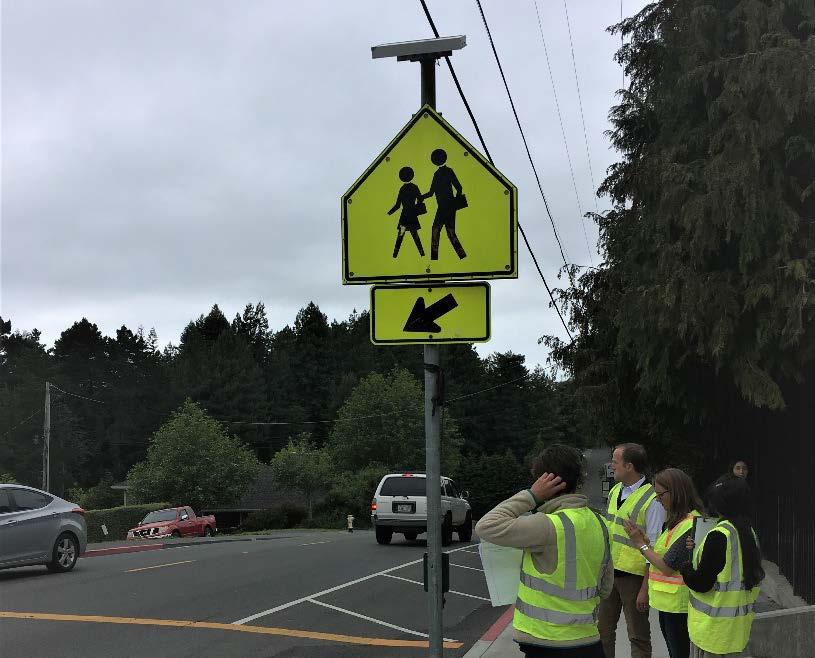
12 Route 3: Proposed Bay to Zoo Trail SRTS Connection The third walking route focused on the Bay to Zoo Trail Safe Routes to School (SRTS) connection at Zane Middle School. Participants walked down to the School s field, continued along a City easement running along the proposed Bay to Zoo Trail connection towards 16 th Street. At 16 th Street, participants continued south down McFarlan Street to Hillside Drive where they walked a pedestrian path between two residential homes leading back to the school field. Following the walkability and bikeability assessment, the participants shared the following reflections: Vehicle Congestion on S Street: The school parking lot experiences high volumes of vehicle traffic during school arrival and dismissal times, resulting in vehicle traffic spilling onto S Street and backing up in both directions on S Street, towards Buhne Street and County Lane. Parents and caregivers are lined-up along S Street up to Huntoon Street during dismissal time. Photo Credit: California Walks 12

13 Parking in No Parking Zone: Parents and other caregivers park in the No Parking Zone north on S Street towards County Lane and south on S Street past Buhne Street, narrowing the vehicle travel lane and blocking the shoulder where bicyclists ride. The School Principal stated that the City has installed bulb-outs in addition to the No Parking or Loading Zones signage on S Street towards County Lane and the Eureka Police enforce the No Parking Zone. However, parents and other caregivers continue to park in the red zone, making it difficult for students to see oncoming traffic while crossing at the marked crosswalk right in front of the school. A workshop participant activates the solar-powered LED crosswalk sign in front of the school. No Parking Zones are marked on either side of the street. Photo Credit: California Walks Vehicle Turning Conflicts with Pedestrians: Participants observed several turning conflict areas between students and drivers along S Street. Drivers turning onto S Street do not always respect or defer the right-of-way to students crossing S Street along at Buhne Street, Huntoon Street, and Trinity Street. During the assessment, participants and staff witnessed a student scream as a vehicle on Trinity Street turned right onto S Street into the crosswalk where students were crossing in the marked crosswalk at Trinity Street. Only in response to the student s scream did the driver stop and allow the students to finish crossing S Street. Student Crossing Behavior: Students walking to and from school often use the unsignalized marked crosswalk at Trinity Street and S Street to cross from west to east on S Street rather than walking to the signalized Buhne Street intersection and crossing with the pedestrian signal. The Principal expressed concern about students crossing at the unsignalized crosswalk on S Street and Trinity and shared that a student was injured in a collision with a motorist last year 13


14 due to a car turning into the student at S Street and Trinity. The Principal noted that he prefers the students walk to and cross at the signalized Buhne Street intersection and expressed concern that many students cross at Trinity Street where drivers have less visibility of the crosswalk, are less likely to yield, and travel at higher speeds. Students crossing in the marked crosswalk at S Street and Trinity Street. The Principal stated and California Walks observed vehicles failing to yield to students crossing. Photo Credit: California Walks Overgrown Landscaping: Overgrown bushes and trees force pedestrians to walk off the sidewalk and onto S Street with vehicular traffic, especially in the area where S Street and West Avenue connect. Overgrown vegetation forces workshop participant to walk in the street along S Street. Photo Credit: California Walks 14


15 Missing and Narrow Sidewalks and Narrow Streets: There is a gap in sidewalk connectivity where S Street converts into County Lane. The road is also narrow, forcing pedestrians, bicyclists, and drivers to maneuver around each other on the roadway. The sidewalk resumes at County Lane and Gates Street but is very narrow. These are frequently walked routes for Zane Middle School students and students from nearby Eureka High School. Missing sidewalks along S Street near County Lane. Photo Credit: California Walks Parking on the Sidewalk: When walking along County Lane, pedestrians encounter a variety of walking conditions, including narrow sidewalks, dirt, gravel, or overgrown vegetation in the road shoulders, and sidewalks and walking zones narrowed or blocked by parked vehicles. A vehicle parked on the sidewalk along County Lane blocks access for pedestrians. In the right foreground the sidewalk is cracked. Photo Credit: California Walks 15

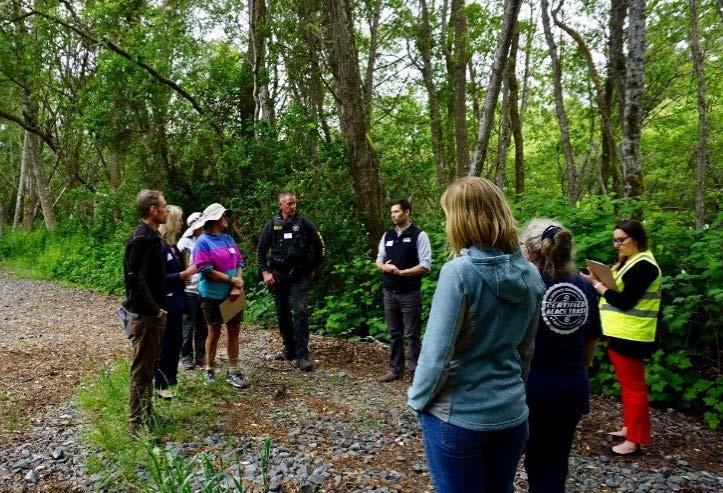
16 Lighting: Participants observed a lack of lighting infrastructure along the path and noted that the path is dark with a lack of clear sightlines, especially during winter months. Lack of lighting was also a concern along the City s pedestrian path beginning at McFarlan Street and Hillside Drive leading to the school field. Overgrown vegetation and lack of street lighting and pedestrian-scale lighting create darken the sidewalks and reduce the visibility of pedestrians who walk along S Street. Photo Credit: California Walks Peaceful, Natural Area for Walking: Participants expressed appreciation for the path as a peaceful and natural resource for community members and if cleaned up, could provide an opportunity for more physical activity for students and residents while the Bay to Zoo Trail SRTS connection is explored. Participants walking this route expressed excitement around the City s proposed Bay to Zoo trail SRTS connection, which would connect the coast to the communities surrounding Zane Middle School. Several participants said they walk the route regularly, while others were unaware of its existence, condition, and use as a potential route to school and the neighboring community. 16

17 Community members walk their dogs along the Zane Middle School path leading along the school s soccer field to City s proposed Bay to Zoo trail SRTS connection. Photo Credit: California Walks Key Opportunities to Improve Walking and Biking Safety Following the walkability and bikeability assessment, the Project Team facilitated small-group action planning discussions where participants discussed and prioritized infrastructure improvements for reducing the number of injuries and fatalities, as well as education and encouragement programs aimed at increasing the number of people and the frequency of walking and biking in Eureka. Participants were asked: 1) What education and encouragement programs are needed to cultivate student and parent leadership in pedestrian and bicycle safety efforts; and 2) What infrastructure projects are needed to encourage students to walk/bike/roll/take transit to school? Participants then voted on their priority recommendations to pursue after the workshop. Community Recommendations Workshop participants provided the following priority recommendations and next steps for overall pedestrian and bicyclist safety improvements in the workshop area and throughout the City of Eureka: Community Programs, Policies, and Campaigns Pedestrian and Bicycle Education during Physical Education Classes: Participants were interested in developing a pedestrian and on-bicycle education program to be incorporated into physical education classes because they believe that students need an opportunity to learn how to walk and bike safely in their community. Pedestrian and on-bike education would not only teach students necessary safety skills but also encourage them to make more trips by walking and biking as they get older and cultivate an awareness of pedestrian and bicyclist behaviors and safety challenges that could improve their driving behavior later on in life. 17
18 In the short-term, participants envisioned in-classroom education materials could be provided to physical education teachers to share with students alongside seasonal education events like Walktober/Walk to School Day and May is Bike Month/Bike to School Day. In the long-term, participants hoped to secure funding to implement and sustain on-bike and crosswalk education curriculum and bike maintenance programs. They also wanted to garner support and get buy-in from Eureka schools to make the bicycle and pedestrian education curriculum mandatory throughout the District. Support for Trails and Trail Connections: Participants would like to build support for existing trails and trail connections and see more trail infrastructure built in the City of Eureka. In the short-term, participants want to build support for existing trails through community education campaigns, trail bicycle education events, distribution of the Bay to Zoo Trail infographic, and information on the physical, financial, and community benefits of trail development to communities. Community Media Campaigns: Participants also wanted to amplify walking and biking safety messages through various media campaigns. Several opportunities were identified including a community wide campaign through Humboldt Access Channel and location specific pop-up demonstrations that would be covered by the media, thereby greatly extending the reach of each event. Infrastructure Concerns & Priorities Pop-up Demonstrations: Participants proposed temporary demonstration projects as a way to educate all road users and build community support for additional walking and biking infrastructure, especially trails. Crosswalk demonstrations were proposed on the middle of S Street at Hill Street and Harrison Street where the County and City have an existing project, as 18


19 well as locations near the City and County boundary. Roundabout 5 demonstrations were also proposed at crossings where roundabout installation could improve safety of all road users. Example of temporary crosswalk demonstration in Fresno, CA. Photo Credit: Ventura / Kings Canyon Corridor Complete Streets Plan Signage and Wayfinding Installation: Participants would like to see additional pedestrian and bicycle signage and wayfinding in the City, including that which connects existing and proposed trails to nearby amenities. Additional signage and wayfinding can help to direct residents to existing pedestrian and bicycle facilities or along safer pedestrian and bicycle routes where conflicts with vehicles are reduced. Signage and wayfinding can also build community knowledge of the existing pedestrian and bicycle network in the City and County. The City currently has a wayfinding project underway that can support these goals. Example of bicycle wayfinding on the Los Angeles River Bicycle at the Egret Park entrance. Photo Credit: LADOT Bike Blog 5 A roundabout is a type of circular intersection that has been recognized by the Federal Highway Administration as a safer and more efficient street design than a standard intersection. Source: 19

20 Workshop participants expressed concern at the speed and behavior of some bicyclists on existing trails and the need for trail use education. Participants discussed installation of safety and etiquette user guides and instructional striping on existing trails to educate trail users on safe and courteous behaviors while using the trail. Potential signage and striping could include specific user guides for pedestrians and bicyclists, including trail use guides for runners, those with mobility challenges, and parents with small children. Trail education should focus on the shared use of the trail and share responsibility to keep it safe. Share the Trail etiquette guidelines for the Roseville, CA trail system. Image Credit: City of Roseville Trail Connections: Participants would like to see more trail infrastructure built in the City of Eureka, in particular, the Bay to Zoo Trail Safe Routes to School connections to Zane Middle School and other schools. These SRTS connections would provide students a safer way to get to and from school and reduce vehicle congestion on local streets during school arrival and dismissal times, while also providing opportunities for commuters to travel to job centers and amenities by walking and biking. Cal Walks/SafeTREC Recommendations California Walks and SafeTREC also submit the following recommendations for consideration by the City of Eureka and its residents: School and School District Safe Routes to School Policies: Schools and school districts are a key partner in providing students with pedestrian and bicycle education and supporting a culture of health and safety. In support of school pedestrian and bicycle education instruction, the Project Team recommends workshop participants collaborate with the Eureka Union School District to 20
21 explore the development of a Safe Routes to School (SRTS) District Policy to educate, support, and encourage safe walking and biking to from school and in the community. A number of resources exist to support SRTS development. The Safe Routes to School National Partnership has programming resources to assist in policy development of Safe Routes to Schools and Change Lab Solutions has developed an interactive Safe Routes to School Policy Workbook which includes a Policy Builder to help communities create and implement policies that support active transportation. CDPH Kid s Plate Grant: The California Department of Public Health s Kid s Plate Grant funds injury prevention efforts to reduce or eliminate unintentional injuries in children and youth up to age 18. The grant includes bicycle safety as a key focus area and is typically released each year, although the December 2017 cycle funded projects from The Project Team recommends the Planning Committee explore potential partnerships with Humboldt County Public Health and other local partners to support pedestrian and bicycle injury prevention activities at Eureka elementary and middle schools, especially around Walk to School Day and Bike to School Day. The CDPH Kids Plate Grant is a potential funding opportunity to provide additional long-term and site-specific Safe Routes to School education and encouragement programs for Eureka schools. Speed Calming: The Project Team recommends the City install additional speed calming measures along S Street/West Avenue, such as edge lines or optical speed bars to reduce the lane width which could reduce vehicular speeds. Edge line pavement markings provide a visual reference to guide drivers and help to reduce drifting onto the shoulder where pedestrians and bicyclists could be walking/biking. Optical speed bars could increase drivers' perception of speed and cause them to reduce their speed. Both countermeasures are relatively low cost according to the United States Department of Transportation Federal Highway Administration's Low-Cost Treatments for Horizontal Curve Safety 2016 guide. 21

22 Optical speed bars on a rural road. Source: Federal Highway Administration; Photo Credit: KLS Engineering, LLC Crossing Enhancements: Workshop participants requested additional crossing improvements throughout the community. The Project Team recommends the development of a crosswalk enhancement policy and design guide, lead by the City and CPBST partners, to help identify and prioritize crossing improvements across the City, particularly along roads with high pedestrian and bicycle traffic and near schools, parks, trail connections, and other neighborhood resources. Lower cost crossing enhancement options include high-visibility crosswalks with rectangular rapid flashing beacons, bulb-outs, and additional crosswalk signage. These and other crossing enhancements will not only provide pedestrians and bicyclists with safer facilities and allow them to commute to job centers and connect to community resources and amenities by walking and biking. The City s Public Works representative in attendance confirmed to workshop participants that there are several improvement plans underway, such as the installation of pedestrian hybrid beacons and bulb- outs. The Project Team recommends that the City and Zane Middle School administrators jointly identify top priority crossings and crossing improvements to improve safety for students walking and biking. Lighting Assessment: The Project Team encourages and recommends CPBST partners organizations and attendees to collaborate and perform a citywide street lighting assessment focused on pedestrian and bicycle lighting needs around schools, parks, businesses, and along key pedestrian and bicycle corridors. The Project Team noted a lack of pedestrian-scale lighting in the area around Zane Middle School, particularly at crosswalks leading up to the schools. Proper street lights provide safety and security and improve the overall well-being of road users. Lighting should be uniform, consistent, and reduce glare and light pollution. 22
23 Appendix A Pedestrian and Bicycle Collision Data Analysis 23

24 EUREKA DATA ANALYSES Community Pedestrian and Bicycle Safety Training Workshop May 22, 2018 The goal of the Community Pedestrian and Bicycle Safety Training (CPBST) is to make communities safer and more pleasant for walking and bicycling. This workshop will train local residents and safety advocates in pedestrian and bicycle safety as well as create opportunities for collaboration with local officials and agency staff. This fact sheet highlights pedestrian and bicycle collision data to help your community better prioritize recommendations that emerge from this workshop. 315 people were killed or injured in 286 pedestrian collisions in the last 10 years ( ). The three-year moving average line shows a downward trend in pedestrian collisions.* There were 23 pedestrian collisions in 2015, but an average of 26 pedestrian collisions per year for the 3-year rolling average between 2014 and PEDESTRIANS *This line is useful for tracking change over time, especially when the number of collisions changes a lot between years. Data points are at the midpoint of the three years of data specified. 55.2% driver violations VS. 32.2% pedestrian violations *Unclear violations were committed either by the driver, pedestrian or bicyclist. 56.5% of victims were male 65.2% of victims ages were female 27.8% of victims were age % of victims (or 31 people) were KILLED or SEVERELY INJURED Data Source: California Statewide Integrated Traffic Records System (SWITRS). Collision data for 2015 and 2016 are provisional at this time. Funding for this program was provided by a grant from the California Office of Traffic Safety through the National Highway Traffic Safety Administration.


25 229 people were killed or injured in 222 bicycle collisions in the last 10 years ( ). BICYCLES The three-year moving average line shows a downward trend in bicycle collisions.* There were 18 bicycle collisions in 2015, but an average of 15.7 bicycle collisions per year for the 3-year rolling average between 2014 and * This line is useful for tracking change over time, especially when the number of collisions changes a lot between years. Data points are at the midpoint of the three years of data specified. Bicycles must follow all the same rules of the road as vehicles. As a result, we cannot break down violations by driver vs. bicyclist. Majority of the victims were male. 9 out of 10 victims ages 0-13 were male 8 out of 11 victims ages were male 6 out of 10 victims ages were female 8.6% of victims (or 9 people) KILLED or SEVERELY INJURED pedestrian fatalities & injuries per 100,000 population over the last five years, which is 2.5 times more than Humboldt County and 3.2 times more than California SUMMARY Yearly Population Rate of Fatalities & Injuries per 100,000 Population Calculated Over a 5-year Period* Pedestrian Bicyclist Eureka bicyclist fatalities & injuries per 100,000 population over the last five years, which is 2.1 times more than Humboldt County and 2.3 times more than California Humboldt California Source: U.S. Census Bureau, Population Division (intercensal population data for 2016). * The rate per population is calculated by adding the number of fatalities and injuries from 2012 to 2016 divided by five times the population in 2016.
26 Pedestrian Collisions of 143 collisions mapped in Eureka, CA. Data Source: California Statewide Initegrated Traffic Records System (SWITRS). Collision data for 2015 and 2016 are provisional as of November 2017.
27 Bicyclist collision locations, of 104 collisions mapped in Eureka, CA. Data Source: California Statewide Initegrated Traffic Records System (SWITRS). Collision data for 2015 and 2016 are provisional as of November 2017.
28 Appendix B Pedestrian and Bicycle Collision Data Analysis Site Visit Presentation 28
 data are provisional as of November")
29 Community Pedestrian and Bicycle Safety Workshop Site Visit Eureka, CA 4/1/18 Pedestrian Injury Collision Trend with 3-year moving average Note: 2015 and 2016 Statewide integrated Traffic Record Systems (SWITRS) data are provisional as of November 2017.

30 Pedestrian Injury Collisions Only 140 of 143 collisions are mapped. Note: 2015 and 2016 SWITRS data are provisional as of November 2017.
31
 Total: 143 collisions CVC No. Description Freq. Percent 21950 Driver failure to yield right-of-way to pedestrians at a crosswalk 64 44.")
32 Pedestrian Injury Collisions by Time of Day and Day of WeekTotal: 143 collisions *The colors in this graph refer to how frequently a collision occurs at that time & day. Top 10 Violations in Pedestrian Collisions (with # and %) Total: 143 collisions CVC No. Description Freq. Percent Driver failure to yield right-of-way to pedestrians at a crosswalk % Pedestrian failure to yield right-of-way to vehicles % 0 Unknown % Pedestrian failure to yield right-of-way at traffic signal 6 4.2% Unsafe starting or backing up of vehicle 4 2.8% Driving under ther influence of alcohol 4 2.8% Failure to stop at a limit line or crosswalk at a red light. Failure to yield right-of-way to pedestrian when turning on a red light 3 2.1% Driver failure to yield right-of-way to pedestrians on sidewalks 2 1.4% Wilfully injure or tamper with a vehicle or its contents without the owner's consent 1 0.7% Failure to drive on right half of the roadway (with some exceptions) 1 0.7% Driver failure to stop at a limit line or crosswalk at a stop sign 1 0.7% Unsafe turning with or without signaling 1 0.7% Unsafe U-turn in residential district 1 0.7% Total %

33 Pedestrian Victim Injury Severity Note: 2015 and 2016 SWITRS data are provisional as of November 2017.
34 Pedestrian Injury Victims by Age and Gender Note: 2015 and 2016 SWITRS data are provisional as of November 2017.
35 Bicycle Injury Collision Trend with 3-year moving average Note: 2015 and 2016 SWITRS data are provisional as of November 2017.
36 Bicycle Injury Collisions of 104 collisions are mapped. Note: 2015 and 2016 SWITRS data are provisional as of November 2017.

37
 Total: 104 collisions CVC No. Description Freq.")
38 Bicycle Injury Collisions by Time of Day and Day of Week Total: 104 collisions *The colors in this graph refer to how frequently a collision occurs at that time & day. Top 10 Violations in Bicycle Collisions (with # and %) Total: 104 collisions CVC No. Description Freq. Percent Bicyclist failure to ride on right edge of roadway if riding below the normal speed of traffic % Driver failure to stop at a limit line or crosswalk at a stop sign % Failure to stop or yield right-of-way at a stop sign % Failure to drive on right half of the roadway (with some exceptions) % 0 Unknown 7 8.9% Driver failure to yield right-of-way when entering/crossing a highway 7 8.9% Driver failure to comply with roadway temporarily designated as one-way 7 8.9% Driver failure to yeild right-of-way when making a left turn or U-turn 7 8.9% Unsafe turning with or without signaling 6 7.6% Failure to stop at a limit line or crosswalk at a red light. Failure to yield right-of-way to pedestrian when turning on a red light 5 6.3% Total %
39 Bicycle Victim Injury Severity Note: 2015 and 2016 SWITRS data are provisional as of November 2017.
40 Bicycle Injury Victims by Age and Gender Note: 2015 and 2016 SWITRS data are provisional as of November 2017.
. To further explore collision data, register for a free account to access the tools and resources on TIMS. https://tims.berkeley.")
41 The Transportation Injury Mapping System (TIMS) is a web-based tool that allows users to analyze and map data from California's Statewide Integrated Traffic Records System (SWITRS). To further explore collision data, register for a free account to access the tools and resources on TIMS. Berkeley SafeTREC
Recommendations to Improve Pedestrian & Bicycle Safety for the City of Arvin
 Recommendations to Improve Pedestrian & Bicycle Safety for the City of Arvin July 2018 1 Acknowledgements Planning Committee Jack Becker Tammy Fisher Pat Ebel Peter Smith Carlos Bello Christine Viterelli
Recommendations to Improve Pedestrian & Bicycle Safety for the Arden-Arcade Community
 Recommendations to Improve Pedestrian & Bicycle Safety for the Arden-Arcade Community June 2018 Acknowledgements Planning Committee Joelle Orrock Gail Kelly Molly Patterson Dan Allison Heather Yee Molly
Recommendations to Improve Pedestrian & Bicycle Safety in the Azusa Unified School District
 Recommendations to Improve Pedestrian & Bicycle Safety in the Azusa Unified School District October 2017 Recommendations to Improve Pedestrian & Bicycle Safety in the Azusa Unified School District By Mihaela
Recommendations to Improve Pedestrian & Bicycle Safety for the City of Bakersfield
 Recommendations to Improve Pedestrian & Bicycle Safety for the City of Bakersfield August 2018 1 Acknowledgements Planning Committee Jack Becker Bike Bakersfield Cindy Parra Bike Bakersfield Christopher
Recommendations to Improve Pedestrian & Bicycle Safety for the Missouri Flat Area (El Dorado County)
") Recommendations to Improve Pedestrian & Bicycle Safety for the Missouri Flat Area (El Dorado County) October 2017 Recommendations to Improve Pedestrian & Bicycle Safety for the Missouri Flat Area (El Dorado
Recommendations to Improve Pedestrian & Bicycle Safety for the Missouri Flat Area (El Dorado County) October 2017 Recommendations to Improve Pedestrian & Bicycle Safety for the Missouri Flat Area (El Dorado
Recommendations to Improve Pedestrian & Bicycle Safety for the Clegg Elementary School & Stacey Middle School Community
 Recommendations to Improve Pedestrian & Bicycle Safety for the Clegg Elementary School & Stacey Middle School Community (Westminster School District) October 2018 1 Acknowledgements Planning Committee
Recommendations to Improve Pedestrian & Bicycle Safety for the Community of Palermo
 Recommendations to Improve Pedestrian & Bicycle Safety for the Community of Palermo September 2017 Recommendations to Improve Pedestrian & Bicycle Safety for the Community of Palermo By Wendy Ortiz, Jaime
RECOMMENDATIONS TO IMPROVE PEDESTRIAN & BICYCLE SAFETY IN THE COMMUNITY OF FLORENCE-FIRESTONE
 RECOMMENDATIONS TO IMPROVE PEDESTRIAN & BICYCLE SAFETY IN THE COMMUNITY OF FLORENCE-FIRESTONE September 2017 By Miha Tomuta, Wendy Ortiz, California Walks; Jill Cooper, Katherine Chen, UC Berkeley SafeTREC
Recommendations to Improve Pedestrian & Bicycle Safety for the City of Lemon Grove
 Recommendations to Improve Pedestrian & Bicycle Safety for the City of Lemon Grove October 2018 1 Acknowledgements Planning Committee Anita Lopez Rosa Carney Steve Browne Angeles Nelson Lemon Grove Healthy
Recommendations to Improve Pedestrian & Bicycle Safety for the City of Hayward: Tennyson Road Corridor
 Recommendations to Improve Pedestrian & Bicycle Safety for the City of Hayward: Tennyson Road Corridor October 2018 1 Acknowledgments Planning Committee Charmine Solla Steven Chang Patty Garcia Sergio
Recommendations to Improve Pedestrian & Bicycle Safety for the Community of North Shore
 Recommendations to Improve Pedestrian & Bicycle Safety for the Community of North Shore October 2017 Recommendations to Improve Pedestrian & Bicycle Safety for the Community of North Shore By Tony Dang,
Recommendations to Improve Pedestrian & Bicycle Safety for the Valley West Community in Arcata
 Recommendations to Improve Pedestrian & Bicycle Safety for the Valley West Community in Arcata October 2018 1 Acknowledgements Planning Committee Netra Khatri Julie Neander Emily Sinkhorn Jennifer Weiss
Recommendations to Improve Pedestrian & Bicycle Safety for the Community of Southwest Fresno
 Recommendations to Improve Pedestrian & Bicycle Safety for the Community of Southwest Fresno October 2017 Recommendations to Improve Pedestrian & Bicycle Safety for the Community of Southwest Fresno By
PEDESTRIAN ACTION PLAN
 ATTACHMENT 2 CITY OF SANTA MONICA PEDESTRIAN ACTION PLAN CITY OF SANTA MONICA PEDESTRIAN ACTION PLAN This page intentionally left blank EXECUTIVE SUMMARY CHAPTER 1 EXECUTIVE SUMMARY Setting the Stage
RECOMMENDATIONS TO IMPROVE PEDESTRIAN SAFETY IN MCKINLEYVILLE
 RECOMMENDATIONS TO IMPROVE PEDESTRIAN SAFETY IN MCKINLEYVILLE May 2015 By Tony Dang, Jaime Fearer, Wendy Alfsen, California Walks; Jill Cooper, UC Berkeley SafeTREC Recommendations to Improve Pedestrian
CONNECTING PEOPLE TO PLACES
 CONNECTING PEOPLE TO PLACES 82 EAST BENCH MASTER PLAN 07 Introduction The East Bench transportation system is a collection of slow moving, treelined residential streets and major arteries that are the
Bikeway action plan. Bicycle Friendly Community Workshop March 5, 2007 Rochester, MN
 Bikeway action plan Summary The was held on March 5, 2007 at the Rochester Mayo Civic Center. The workshop was hosted by Rochester-Olmsted County Planning Department in collaboration with the League of
City of Novi Non-Motorized Master Plan 2011 Executive Summary
 City of Novi Non-Motorized Master Plan 2011 Executive Summary Prepared by: February 28, 2011 Why Plan? Encouraging healthy, active lifestyles through pathway and sidewalk connectivity has been a focus
AGENDA ITEM NO. 5b HCAOG TAC meeting of May 8, 2014
 Humboldt County Association of Governments Eureka, CA, 95501 AGENDA ITEM NO. 5b HCAOG TAC meeting of May 8, 2014 DATE: May 1, 2014 TO: HCAOG Technical Advisory Committee (TAC) FROM:, SUBJECT: Letters of
Chapter 14 PARLIER RELATIONSHIP TO CITY PLANS AND POLICIES. Recommendations to Improve Pedestrian Safety in the City of Parlier (2014)
") Chapter 14 PARLIER This chapter describes the current status and future plans for biking and walking in the City of Parlier. RELATIONSHIP TO CITY PLANS AND POLICIES The Parlier General Plan is the primary
Chapter 14 PARLIER This chapter describes the current status and future plans for biking and walking in the City of Parlier. RELATIONSHIP TO CITY PLANS AND POLICIES The Parlier General Plan is the primary
Chapter 2. Bellingham Bicycle Master Plan Chapter 2: Policies and Actions
 Chapter 2 Bellingham Bicycle Master Plan Chapter 2: Policies and Actions Chapter 2: Policies and Actions The Bicycle Master Plan provides a road map for making bicycling in Bellingham a viable transportation
Agenda. Overview PRINCE GEORGE S PLAZA METRO AREA PEDESTRIAN PLAN
 PRINCE GEORGE S PLAZA METRO AREA PEDESTRIAN PLAN May 28, 2008 Agenda Welcome and introductions Project overview and issue identification Planning context and strengths Design challenges and initial recommendations
City of San Diego Vision Zero Draft Strategic Plan FY 2017
 City of San Diego Vision Zero Draft Strategic Plan FY 2017 Engineering Objective: To develop and implement a strategy that employs best planning, design and engineering practices. Background: Over the
Broad Street Bicycle Boulevard Design Guidelines
 Broad Street Bicycle Boulevard Design Guidelines Building from the strategies introduced in the 2013 Bicycle Transportation Plan and community input received thus far, City Transportation Staff have identified
RECOMMENDATIONS TO IMPROVE PEDESTRIAN & BICYCLIST SAFETY FOR THE MOUNTAIN VIEW SCHOOL DISTRICT (EL MONTE/SOUTH EL MONTE)
") RECOMMENDATIONS TO IMPROVE PEDESTRIAN & BICYCLIST SAFETY FOR THE MOUNTAIN VIEW SCHOOL DISTRICT (EL MONTE/SOUTH EL MONTE) August 2016 By Caro Jauregui, Jaime Fearer, Tony Dang, Wendy Alfsen California Walks;
RECOMMENDATIONS TO IMPROVE PEDESTRIAN & BICYCLIST SAFETY FOR THE MOUNTAIN VIEW SCHOOL DISTRICT (EL MONTE/SOUTH EL MONTE) August 2016 By Caro Jauregui, Jaime Fearer, Tony Dang, Wendy Alfsen California Walks;
TRAFFIC CALMING TOOLBOX. For the residents of the City of Decatur, Georgia
 TRAFFIC CALMING TOOLBOX For the residents of the City of Decatur, Georgia 2 City of Decatur Traffic Calming Toolbox Public Works Department 2635 Talley Street Decatur, GA 30030 404.377.5571 3 Welcome to
RECOMMENDATIONS TO IMPROVE PEDESTRIAN & BICYCLIST SAFETY IN LOS ANGELES CHINATOWN
 RECOMMENDATIONS TO IMPROVE PEDESTRIAN & BICYCLIST SAFETY IN LOS ANGELES CHINATOWN October 2016 By Tony Dang, Caro Jauregui, Jaime Fearer, Wendy Alfsen, California Walks; Jill Cooper, Katherine Chen, UC
DRAFT MOVING FORWARD RHODE ISLAND BICYCLE MOBILITY PLAN 2018 PREPARED FOR PREPARED BY IN ASSOCIATION WITH
 RHODE ISLAND MOVING FORWARD BICYCLE MOBILITY PLAN 2018 PREPARED FOR PREPARED BY IN ASSOCIATION WITH T AF CHAPTER 1 D R INTRODUCTION CHAPTER 3 ARTICULATES VISION Bicycling is safe, fun and practical in
Bringing together community and health. Physical Activity and Nutrition Unit Office of Statewide Health Improvement Initiatives
 Bringing together community and health. Physical Activity and Nutrition Unit Office of Statewide Health Improvement Initiatives Physical Activity and Nutrition Unit Office of Statewide Health Improvement
CITY OF BLOOMINGTON COMPLETE STREETS POLICY
 CITY OF BLOOMINGTON COMPLETE STREETS POLICY POLICY OBJECTIVE: The City of Bloomington will enhance safety, mobility, accessibility and convenience for transportation network users of all ages and abilities,
Corpus Christi Metropolitan Transportation Plan Fiscal Year Introduction:
 Introduction: The Safe, Accountable, Flexible, Efficient Transportation Equity Act: A Legacy for Users (SAFETEA-LU) has continued the efforts started through the Intermodal Surface Transportation Efficiency
Bicycle Master Plan Goals, Strategies, and Policies
 Bicycle Master Plan Goals, Strategies, and Policies Mobilizing 5 This chapter outlines the overarching goals, action statements, and action items Long Beach will take in order to achieve its vision of
Perryville TOD and Greenway Plan
 Perryville TOD and Greenway Plan Greenway Glossary Pathway: A bicycle and pedestrian path separated from motorized vehicular traffic by an open space, barrier or curb. Multi-use paths may be within the
Living Streets Policy
 Living Streets Policy Introduction Living streets balance the needs of motorists, bicyclists, pedestrians and transit riders in ways that promote safety and convenience, enhance community identity, create
CHAPTER 3: Vision Statement and Goals
 Davidson Walks & Rolls: Active Transportation Master Plan CHAPTER 3 Contents: Overview Vision Statement Measurable Goals Public Outreach CHAPTER 3: Vision Statement and Goals Overview The vision statement
Appendix A: Crosswalk Policy
 Appendix A: Crosswalk Policy Appendix A: Crosswalk Policy Introduction This citywide Crosswalk Policy is aimed at improving pedestrian safety and enhancing pedestrian mobility by providing a framework
HARRISON STREET/OAKLAND AVENUE COMMUNITY TRANSPORTATION PLAN
 HARRISON STREET/OAKLAND AVENUE Community Workshop #4: Draft Plan Review December 3, 2009 D E S I G N, C O M M U N I T Y & E N V I R O N M E N T INTRODUCTIONS Key Project Staff: Alisa Shen, Project Manager,
TABLE OF CONTENTS. Executive Summary
 Executive Summary Background... ES-1 Pedestrian Network... ES-2 Bikeway Network... ES-2 Collision History... ES-2 Public Input... ES-4 Conclusions and Recommendations... ES-4 1. Introduction and Setting
RECOMMENDATIONS TO IMPROVE PEDESTRIAN & BICYCLE SAFETY IN ROSEMONT
 RECOMMENDATIONS TO IMPROVE PEDESTRIAN & BICYCLE SAFETY IN ROSEMONT SEPT 2017 By Tony Dang, Jaime Fearer, Miha Tomuta, Wendy Ortiz, California Walks; Jill Cooper, Jessica Rosas, UC Berkeley SafeTREC Recommendations
Madison Urban Area and Dane County. Bicycle Transportation Plan Summary. September Introduction. Bicycle Plan Scope and Planning Process
 Bicycle Transportation Plan Summary Madison Urban Area and Dane County Introduction September 2000 Bicycling is an important mode of transportation in the Madison urban area and countywide that is available
CITY OF OAK CREEK SAFE ROUTES TO SCHOOL ACTION PLAN. East Middle School
 CITY OF OAK CREEK SAFE ROUTES TO SCHOOL ACTION PLAN East Middle School CITY OF OAK CREEK SAFE ROUTES TO SCHOOL ACTION PLAN East Middle School Why Safe Routes to School? Safe Routes to School ( SRTS ) is
Residential Traffic Calming Program Guide. Town of Ashland, Virginia
 Residential Traffic Calming Program Guide Town of Ashland, Virginia August 1, 2006 TABLE OF CONTENTS A. INTRODUCTION... 1 B. GOALS... 1 C. CRITERIA... 1 D. IDENTIFYING NEIGHBORHOOD TRAFFIC CONCERNS...
Active Transportation Facility Glossary
 Active Transportation Facility Glossary This document defines different active transportation facilities and suggests appropriate corridor types. Click on a facility type to jump to its definition. Bike
FHWA Resources for Pedestrian and Bicycle Professionals
 FHWA Resources for Pedestrian and Bicycle Professionals Charlie Zegeer, UNC Highway Safety Research Center/PBIC Libby Thomas, UNC Highway Safety Research Center Dan Nabors, Vanasse Hangen Brustlin (VHB)
SAFE ROUTES TO SCHOOL
 SAFE ROUTES TO SCHOOL Forest Ridge Elementary School Existing Conditions and ACTION PLAN > Oak Creek - Franklin Joint School District Table of Contents CONTEXT Enrollment Boundaries
PRINCE GEORGE S PLAZA METRO AREA PEDESTRIAN PLAN
 PRINCE GEORGE S PLAZA METRO AREA PEDESTRIAN PLAN May 28, 2008 Agenda Welcome and introductions Project overview and issue identification Planning context and strengths Design challenges and initial recommendations
Caltrans Sloat Boulevard Pedestrian Safety Project Response to Community Questions, Comments & Concerns
 Caltrans Sloat Boulevard Pedestrian Safety Project Response to Community Questions, Comments & Concerns Revised: May 10, 2016 The California Department of Transportation (Caltrans) is planning various
Paoli Road Improvement Feasibility Study
 Paoli Road Improvement Feasibility Study & Public Participation Project March 24, 2015 Prepared for: Tredyffrin Township Prepared by: McMahon Associates, Inc. with Town Planning Partnership, LLC Glackin
2015 Florida Main Street Annual Conference. Complete Streets Equal Stronger Main Streets
 WHAT ARE COMPLETE STREETS? CASE STUDIES COMPLETING YOUR MAIN STREET 2015 Florida Main Street Annual Conference St. Petersburg, Florida August 19, 2015 WHAT ARE COMPLETE STREETS? CASE STUDIES COMPLETING
University of Victoria Campus Cycling Plan Terms of Reference. 1.0 Project Description
 University of Victoria Campus Cycling Plan Terms of Reference 1.0 Project Description The Campus Cycling Plan, a first for the University, will provide a comprehensive and coordinated approach to support
NM-POLICY 1: Improve service levels, participation, and options for non-motorized transportation modes throughout the County.
 Transportation PRINCE WILLIAM COUNTY 2008 COMPREHENSIVE PLAN NON-MOTORIZED PLAN CONTENTS Goals, Policies, and Action Strategies Table 4 (Bike Facility Classifications and Descriptions) Table 5 (Bike Facility
CITY OF LOS ANGELES INTER-DEPARTMENTAL MEMORANDUM
 CITY OF LOS ANGELES INTER-DEPARTMENTAL MEMORANDUM Date: December 12,2011 To: Honorable City Council c/o City Clerk, Room 395, City Hall Attention: Honorable Bill Rosendahl, Chair, Transportation Committee
SAFE ROUTES TO SCHOOL (SR2S)
") SAFE ROUTES TO SCHOOL (SR2S) In partnership with Burbank Unified School District (BUSD) & City of Burbank George Washington Elementary School Thomas Jefferson Elementary School John Muir Middle School
SAFE ROUTES TO SCHOOL (SR2S) In partnership with Burbank Unified School District (BUSD) & City of Burbank George Washington Elementary School Thomas Jefferson Elementary School John Muir Middle School
o n - m o t o r i z e d transportation is an overlooked element that can greatly enhance the overall quality of life for the community s residents.
 N o n - m o t o r i z e d transportation is an overlooked element that can greatly enhance the overall quality of life for the community s residents. 84 Transportation CHAPTER 11 INTRODUCTION Transportation
APPENDIX A: Complete Streets Checklist DRAFT NOVEMBER 2016
 APPENDIX A: Complete Streets Checklist DRAFT NOVEMBER 2016 Complete Streets Checklist MetroPlan Orlando s Complete Streets Checklist is an internal planning tool for staff to further implementation of
CITY OF COCOA BEACH 2025 COMPREHENSIVE PLAN. Section VIII Mobility Element Goals, Objectives, and Policies
 CITY OF COCOA BEACH 2025 COMPREHENSIVE PLAN Section VIII Mobility Element Goals, Objectives, and Policies Adopted August 6, 2015 by Ordinance No. 1591 VIII MOBILITY ELEMENT Table of Contents Page Number
Pedestrian Safety Action Plan Bicycle Safety Action Plan
 Pedestrian Safety Action Plan Bicycle Safety Action Plan January 24, 2017 VISION: Safe travel for all MISSION STATEMENT: Partner with the community to plan and fund transportation projects and programs
Existing Pedestrian Conditions. PSAC February 8, 2011
 Existing Pedestrian Conditions PSAC February 8, 2011 Contents 1. Project Background & Goals 2. Pedestrian Activity: Where people walk 3. Pedestrian Safety: The conditions people face Project Background
Pedestrian Crosswalk Audit
 1200, Scotia Place, Tower 1 10060 Jasper Avenue Edmonton, Alberta T5J 3R8 edmonton.ca/auditor Pedestrian Crosswalk Audit June 19, 2017 The conducted this project in accordance with the International Standards
Physical Implications of Complete Streets Policies
 Presentation Overview Physical Implications of Complete Norm Cox, ASLA, LLA Landscape Architect Ann Arbor, Michigan, 10:45 to Noon What Are Complete Streets? What Matters to Bicyclists and Pedestrians
5. Pedestrian System. Accomplishments Over the Past Five Years
 5. Pedestrian System Accomplishments Over the Past Five Years The Alamo Area Metropolitan Planning Organization (MPO) and its partner agencies recognize the importance of improving pedestrian mobility.
Oakland Pedestrian Master Plan Oakland Pedestrian Plan Draft Recommendations Chapter Outline
 EISEN LETUNIC T R A N S P O R T A T I O N, ENVIRO N M E N TA L A N D URBAN PLANNIN G MEMORANDUM To Oakland Pedestrian Plan Technical Advisory Committee & Pedestrian Advisory Group From Victoria Eisen Date
S A F E R O U T E S T O S C H O O L H E R M A N TOW N S C H O O L S A N D P R O C TO R S C H O O L S P L A N A P P R OVA L S
 S A F E R O U T E S T O S C H O O L H E R M A N TOW N S C H O O L S A N D P R O C TO R S C H O O L S P L A N A P P R OVA L S WHAT IS SAFE ROUTES TO SCHOOL? In 1969, nearly 50% of children walked or rode
City of Charlottesville Bicycle and Pedestrian Master Plan Update
 City of Charlottesville Bicycle and Pedestrian Master Plan Update September 17, 2014 I. Welcome and meeting overview II. Project status update III. Network overview IV. Break-out groups Pedestrian Network
5. RUNNINGWAY GUIDELINES
 5. RUNNINGWAY GUIDELINES These guidelines should be considered collectively when making runningway decisions. A runningway is the linear component of the transit system that forms the right-of-way reserved
CHAPTER 7.0 IMPLEMENTATION
 CHAPTER 7.0 IMPLEMENTATION Achieving the vision of the Better Streets Plan will rely on the ability to effectively fund, build and maintain improvements, and to sustain improvements over time. CHAPTER
REGIONAL BICYCLE AND PEDESTRIAN DESIGN GUIDELINES
 REGIONAL BICYCLE AND PEDESTRIAN DESIGN GUIDELINES November 16, 2011 Deb Humphreys North Central Texas Council of Governments Bicycle and Pedestrian Advisory Committee Snapshot of the Guide 1. Introduction
Safe Streets. City of Lake Forest Park. March 21, 2017
 Safe Streets City of Lake Forest Park March 21, 2017 1 01 WELCOME 2 Agenda WELCOME WHAT IS THIS PROJECT? CONTEXT DRAFT CITYWIDE PROJECTS EXERCISE INTRODUCTION 3 02 WHAT IS THIS PROJECT? 4 WHAT IS THIS
C/CAG. Sunnybrae Elementary School Walking and Bicycling Audit. San Mateo-Foster City School District JUNE 2013
 Sunnybrae Elementary School Walking and Bicycling Audit JUNE 2013 San Mateo-Foster City School District C/CAG City/County Association of Governments of San Mateo County SUNNYBRAE ELEMENTARY SCHOOL WALKING
Safe Routes to School Action Plan Aberdeen, Idaho
 Background Aberdeen, Idaho is a largely agricultural community of nearly 2,000 people and is located in the southeast portion of the state on the western edge of American Falls Reservoir. The community
EXECUTIVE SUMMARY. Vision
 Vision Walking and bicycling in Salt Lake City will be safe, convenient, comfortable, and viable transportation options that connect people to places, foster recreational and economic development opportunities,
Public Information Centre
 WELCOME Public Information Centre Father Tobin Road Lougheed Middle School - Library Wednesday November 7, 2012 7:00 p.m.to 9:00 p.m. Please sign in Neighbourhood Traffic Calming Guide Background The City
Exhibit 1 PLANNING COMMISSION AGENDA ITEM
 Exhibit 1 PLANNING COMMISSION AGENDA ITEM Project Name: Grand Junction Circulation Plan Grand Junction Complete Streets Policy Applicant: City of Grand Junction Representative: David Thornton Address:
FEDERAL HIGHWAY ADMINISTRATION APPLICATION
 FEDERAL HIGHWAY ADMINISTRATION APPLICATION REQUEST FOR PERMISSION TO EXPERIMENT WITH A BICYCLE BOX INTERSECTION TREATMENT Submitted by: City of Columbus Department of Public Service Date: June 26, 2009
NEIGHBORHOOD TRAFFIC CALMING POLICY
 NEIGHBORHOOD TRAFFIC CALMING POLICY I. PURPOSE The City of Kent continually strives to strengthen and protect its neighborhoods by improving the quality of life in residential areas. Traffic conditions
July 5, Arthur R. Ware, Jr. Elementary School 2017 Safe Routes to School Walkabout Report
 July 5, 2017 Arthur R. Ware, Jr. Elementary School 2017 Safe Routes to School Walkabout Report 1 Walkabout Report Introduction On April 28, 2017, City, School, and SAWMPO staff met to conduct a Safe Routes
INTRODUCTION THOROUGHFARE SYSTEM CLASSIFICATIONS
 INTRODUCTION The thoroughfare plan will assist public officials in the development of a specialized system for efficient and safe movement of vehicular traffic while minimizing potential conflicts with
Hennepin County Pedestrian Plan Public Comment Report
 Hennepin County Pedestrian Plan Public Comment Report On May 31, 2013, the draft Hennepin County Pedestrian Plan was released for a 45-day public comment period ending July 15, 2013. The county received
UPDATES, SUCCESSES, AND WHAT S AHEAD ON THE ROAD TO ZERO
 Vol. 1, Issue 1 I Spring 2018 www.planhillsborough.org/vision-zero S A F E S T R E E T S N O W H I L L S B O R O U G H UPDATES, SUCCESSES, AND WHAT S AHEAD ON THE ROAD TO ZERO TRACKING PROGRESS This is
Bicycle and Pedestrian Advisory Committee (BPAC) November 21, 2013
 November 21, 2013") Bicycle and Pedestrian Advisory Committee (BPAC) November 21, 2013 OVERALL LAND USE CONCEPT Overall Broadway Valdez District: 95.5 acres (35.1 acres right-of ways + 60.4 acres developable land) Plan Subareas:
Bicycle and Pedestrian Advisory Committee (BPAC) November 21, 2013 OVERALL LAND USE CONCEPT Overall Broadway Valdez District: 95.5 acres (35.1 acres right-of ways + 60.4 acres developable land) Plan Subareas:
Solana Beach Comprehensive Active Transportation Strategy (CATS)
") Solana Beach Comprehensive Active Transportation Strategy (CATS) 3.0 Goals & Policies The Solana Beach CATS goals and objectives outlined below were largely drawn from the Solana Beach Circulation Element
Solana Beach Comprehensive Active Transportation Strategy (CATS) 3.0 Goals & Policies The Solana Beach CATS goals and objectives outlined below were largely drawn from the Solana Beach Circulation Element
Doing it Right: Leveraging Data and Evaluation to Develop Pedestrian Safety Projects
 Doing it Right: Leveraging Data and Evaluation to Develop Pedestrian Safety Projects 1 Safe Kids Overview 2 Our Mission We work to keep all kids safe from preventable injuries 3 Why It Matters 4 Where
8. Collisions INTRODUCTION
 8. Collisions INTRODUCTION While traffic collisions can affect anyone, they have a disproportionate impact on bicyclists, who along with pedestrians are the most vulnerable users of the transportation
BIKE PLAN CONTENTS GATEWAY
 CONTENTS Acknowledgments...vii Great Rivers Greenway District Board of Directors... vii Great Rivers Greenway District Staff... vii Project Consultants... vii Committees... viii Citizens Advisory Committee
COMMUNITY PEDESTRAIN SAFETY TRAINING. Long Beach June 5 th, 2010
 COMMUNITY PEDESTRAIN SAFETY TRAINING Long Beach June 5 th, 2010 Long Beach The City of Long Beach is located in Los Angeles County, Southern California. Long Beach is currently home to 462,604 persons
Chapter 2: Standards for Access, Non-Motorized, and Transit
 Standards for Access, Non-Motorized, and Transit Chapter 2: Standards for Access, Non-Motorized, and Transit The Washtenaw County Access Management Plan was developed based on the analysis of existing
Safer Cycling: How the City of Vancouver is Proactively Improving Cycling Safety
 Safer Cycling: How the City of Vancouver is Proactively Improving Cycling Safety Brian Patterson, MCIP, RPP Urban Systems 2015 Canadian Association of Road Safety Professionals (CARSP) Conference Session
FINAL PLAN APPENDIX D CITY OF BERKELEY BIKE PLAN D-1
 CITY OF BERKELEY BIKE PLAN D-1 . Proposed Programs D.1. EDUCATION This appendix presents the recommended bicycle-related programs for the City of Berkeley. The recommendations are organized in four E s:
CHAIR AND MEMBERS CIVIC WORKS COMMITTEE MEETING ON APRIL 25, 2016
 TO: FROM: SUBJECT: CHAIR AND MEMBERS CIVIC WORKS COMMITTEE MEETING ON APRIL 25, 2016 JOHN BRAAM, P. ENG. MANAGING DIRECTOR, ENVIRONMENTAL & ENGINEERING SERVICES AND CITY ENGINEER SCHOOL ZONE SPEED LIMIT
Introduction.
 2307-1.0. Introduction. Delaware s Safe Routes to School (SRTS) Program was established September 10, 2002 when Governor Ruth Ann Minner signed Senate Bill 353 of the 141st General Assembly of Delaware
G AT E WAY PLAN. Community BRIEFING KIT GATEWAY BIKE
 G AT E WAY PLAN GATEWAY BIKE Community BRIEFING KIT PLAN August 2016 TABLE OF CONTENTS INTRODUCTION... 1 THE BENEFITS OF A BIKEABLE COMMUNITY... 2 ECONOMY...2 SAFETY...3 HEALTH...3 HOUSEHOLD SPENDING...3
SFMTA PROJECT TIMELINE
 SFMTA PROJECT TIMELIE Internal SFMTA Processes Opportunities for Public Input Data Collection and Analysis Car and bike volumes, safety (collision) data Roadway and intersection geometry June 2016 Pop
MASTER BICYCLE AND PEDESTRIAN PLAN
 VILLAGE OF NORTHBROOK MASTER BICYCLE AND PEDESTRIAN PLAN DRAFT PLAN OPEN HOUSE May 2, 2018 AGENDA 1. Community Engagement 2. Vision and Goals 3. General Structure of Plan 4. Recommendations Overview 5.
Goal 3: Foster an environment of partnerships and collaboration to connect our communities and regions to one another.
 Non-Motorized Transportation Plan (NMTP) Draft Vision, Goal and,, Tri-County Regional Planning Commission (TCRPC) Purpose The purpose of the Tri-County Regional Planning Commission (TCRPC) Non-Motorized
Woodward Hill Elementary School School Safety and Operation Review
 Address: 6082-142 nd Street Surrey, BC, V3X 1C1 Site Visit: March 7, 2011 Principal Anne Mackie Report Date: November 25, 2011 Phone: (604) 594-2408 Email: Mackie_A@sd36.bc.ca The following report is one
CRESTON ROAD COMPLETE AND SUSTAINABLE STREETS CORRIDOR PLAN
 CRESTON ROAD COMPLETE AND SUSTAINABLE STREETS CORRIDOR PLAN Preferred Plan Community Presentation September 27, 2017 City of El Paso de Robles in partnership with: Local Government Commission, W-Trans,
RESOLUTION NO ?? A RESOLUTION OF THE CITY OF NEPTUNE BEACH ADOPTING A COMPLETE STREETS POLICY
 RESOLUTION NO. 2018-?? A RESOLUTION OF THE CITY OF NEPTUNE BEACH ADOPTING A COMPLETE STREETS POLICY WHEREAS, safe, convenient, and accessible transportation for all users is a priority of the City of Neptune
USDOT Bicycle and Pedestrian Safety Initiative: Safer People and Safer Streets. Barbara McCann, USDOT Office of Policy
 { USDOT Bicycle and Pedestrian Safety Initiative: Safer People and Safer Streets Barbara McCann, USDOT Office of Policy 4 Steps from policy to practice Creating multi-modal streets means: 1. Change Decision-Making
NYC Pedestrian Safety Study & Action Plan. NYTMC Brown Bag Lunch Presentation December 15, 2010
 NYC Pedestrian Safety Study & Action Plan NYTMC Brown Bag Lunch Presentation December 15, 2010 1 Introduction DOT Safety Goal Strategic Plan: Reduce Fatalities by 50% by 2030 From 274 (2007) to 137 (2030)
TRANSPORTATION NEEDS ASSESSMENT
 TRANSPORTATION NEEDS ASSESSMENT A travel demand analysis was carried out to determine the operational issues and the potential benefit that adding traffic capacity would have on the road network. All the