Planning for Economic and Fiscal Health
|
|
|
- Neal Phelps
- 6 years ago
- Views:
Transcription

1 Planning for Economic and Fiscal Health Christopher Zimmerman Vice President for Economic Development Cheyenne, Wyoming April 22, 2015
2 2
3 Planning for Economic and Fiscal Health The pattern of development how we choose to grow affects a region s ability to compete economically, to be fiscally sustainable, and to provide efficient and effective public services to maintain a high quality of life. 3

4 Premise: The way we design and build our communities has enormous consequences

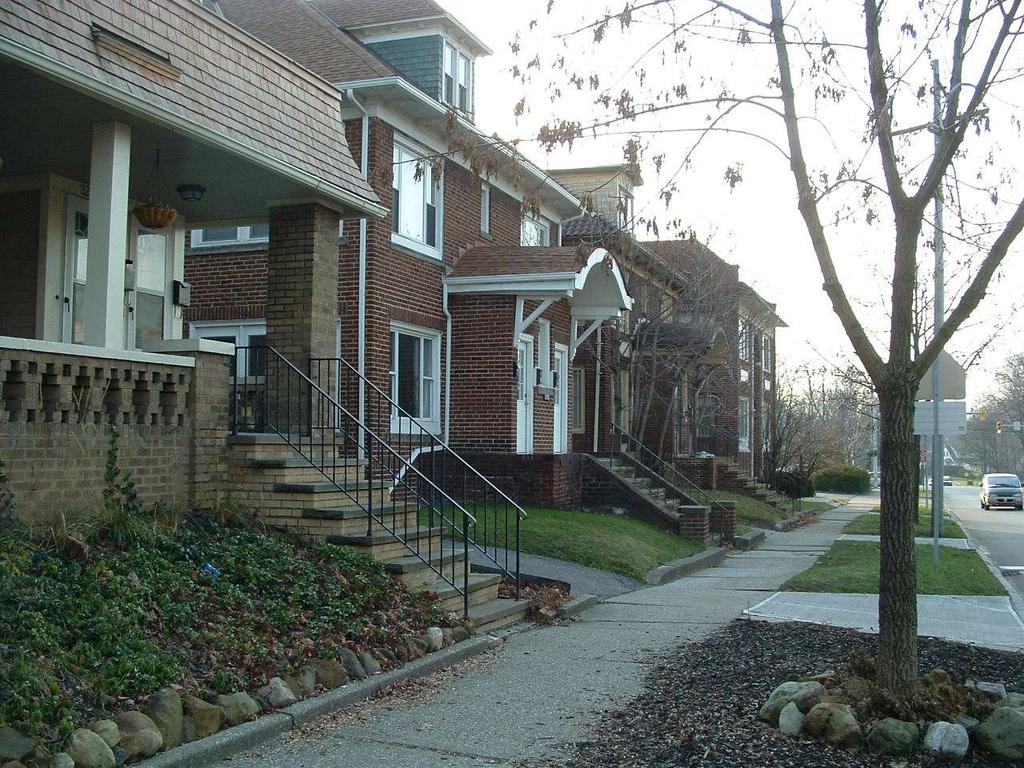
5 Traditional town plan Mixed-use Compact Buildings of several stories Blocks with multiple building types Street grid Courtesy of Alex MacLean, Landslides

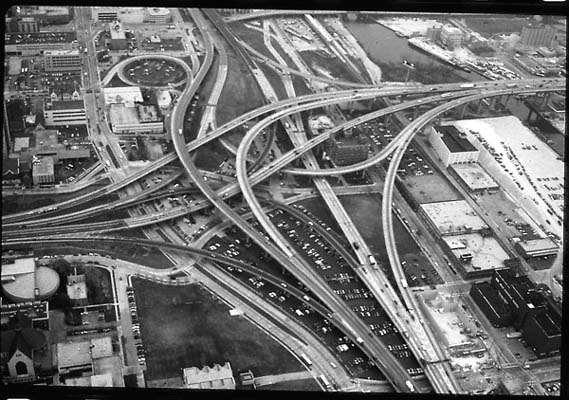
6 ... then came the automobile... (and zoning, and the interstate highway program, and new federal programs for homebuilding, and new rules for capital depreciation... ) 4/24/2015 6
 Courtesy of Walter Kulash, Glatting Jackson Kercher Anglin Lopez Rinehart.")
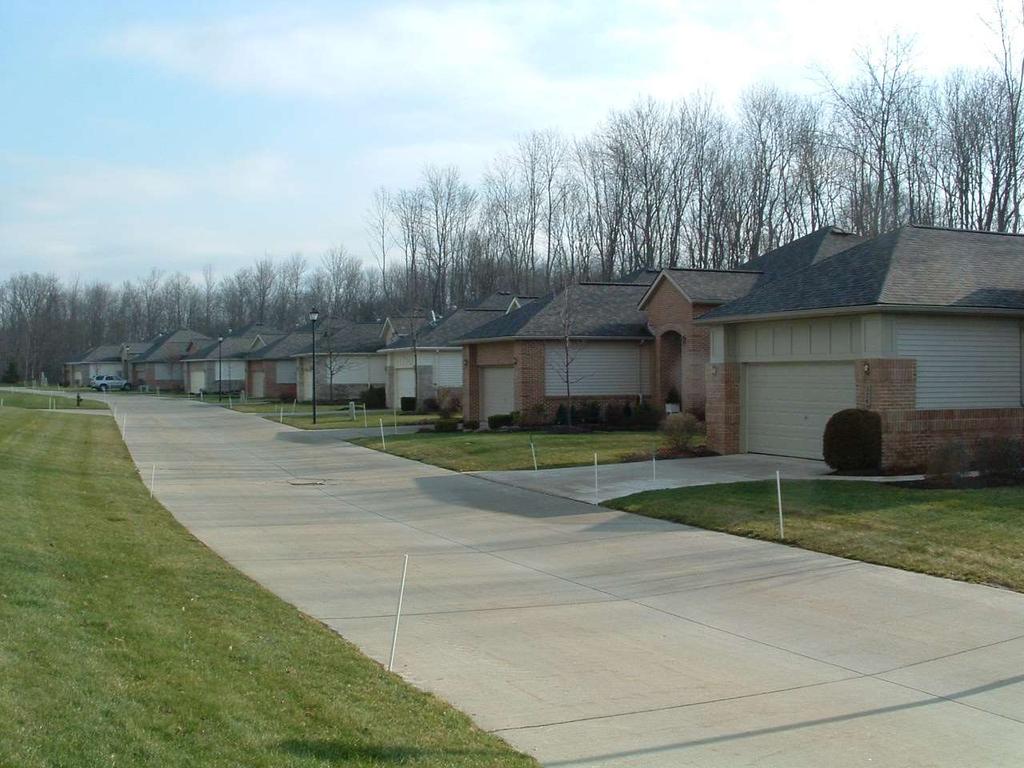
7 Industrial Commercial Residential Sprawl Fragmented land use with minimal connectivity Civic (School) Courtesy of Walter Kulash, Glatting Jackson Kercher Anglin Lopez Rinehart. 7
8 8
9 Sprawl 9
10 Sprawl From: 10

11 Sprawl Photo of rural New Jersey by Alex MacLean
12 Sprawl 12

13 Cleveland: Same Population 1950: 1,389, : 1,393,978 Cuyahoga Co Land Use Maps Cuyahoga Co Planning Commission 13
14 Cleveland: Same Population 1950: 1,389, : 1,393,978 Source: TTI % peak VMT congested % of lane miles w/ congestion Number of rush hours 3 5 Freeway and arterial miles Cuyahoga Co Land Use Maps Cuyahoga Co Planning Commission 14

15 15

16 Courtesy of Local Government Comm

17
18 Land use and transportation policies drive the pattern of development. The pattern of development impacts the economic and fiscal well-being of our communities. 18
19 Land use and transportation policies drive the pattern of development. The pattern of development impacts the economic and fiscal well-being of our communities. The demographic and economic fundamentals have shifted. 19
20 20
21 1. The changing market: The demographic transition
22 THE CHANGING MARKET The community is changing Two major demographic changes are driving the market. The rise of the Millennials. The aging of the Baby Boomers.

23 THE CHANGING MARKET Demographic change and the labor force 90,000,000 80,000,000 70,000,000 60,000,000 50,000,000 40,000,000 POPULATION LABOR FORCE 30,000,000 20,000,000 10,000,000 0 Greatest Generation Baby Boomers Gen X Millenials

24 THE CHANGING MARKET American households are changing Households with and without children, % 72% 70% 67% 60% 52% 50% 40% households with children 30% 20% 10% households without children 0%
25 THE CHANGING MARKET Demographic change means preferences change. And the market follows.

26 THE CHANGING MARKET Millennials They follow lifestyle, not jobs. Millennials choose where to live before finding a job. Of all college-educated 25- to 34-year-olds 64% looked for a job after they chose the city where they wanted to live. (U.S. Census)
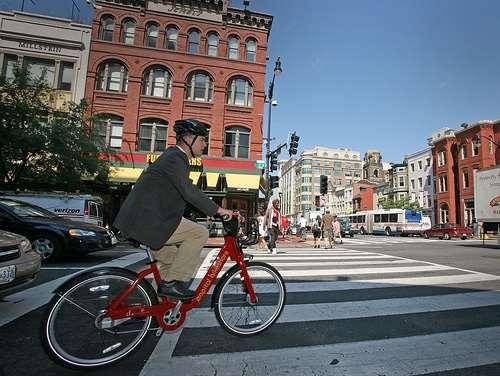
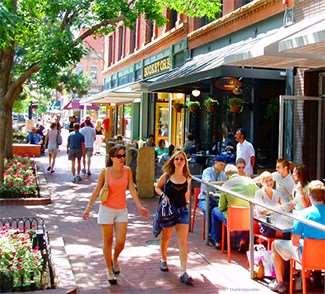
27 They want urban living 27

28 They want experiences more than things. 28

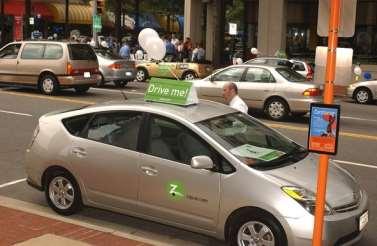
29 THE CHANGING MARKET And they don t seem to want cars
30 THE CHANGING MARKET Preferences: Transportation Millennials are driving less From 2001 to 2009, the average annual number of vehicle-miles traveled by people ages dropped 23 percent. (source: National Household Travel Survey) 26 percent lacked a driver's license in 2010, up 5 percentage points from 2000 (source: Federal Highway Administration)
 Aside: They re not that interested in moving to retirement communities.")
31 THE CHANGING MARKET Preferences: Transportation Baby boomers turning in their keys Using local buses and trains more (source: National Household Travel Survey) Bike trips increased 64 percent between 2001 and (AARP) Aside: They re not that interested in moving to retirement communities. Average age entering senior housing used to be 70 now it s 86.
32 Preferences: Transportation Actually, everyone s driving less... 32


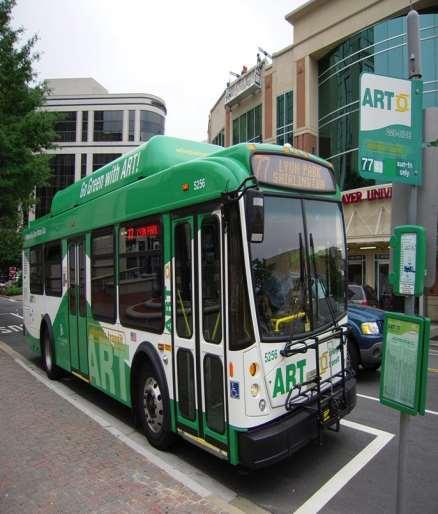
33 THE CHANGING MARKET Preferences: Transportation choices


34 THE CHANGING MARKET Preferences: Housing choices They also want more housing choices.


35 Americans Value Sense of Place, Whether City, Village, or Rural Town
36 THE CHANGING MARKET Americans Prefer to Live in Mixed- Use, Walkable Communities -- National Association of Realtors (October 2013): 78 percent say neighborhood is more important than the size of the house Fifty-seven percent would forego a home with a larger yard if it meant a shorter commute to work Source: Oct Consumer survey conducted for the National Association of Realtors
37 THE CHANGING MARKET Americans Prefer to Live in Mixed- Use, Walkable Communities -- National Association of Realtors (October 2013): 55 percent of respondents willing to forego a home with larger yard if it meant they could live within walking distance of schools, stores and restaurants as opposed to having larger yard and needing to drive to get to schools, stores and restaurants Source: Oct Consumer survey conducted for the National Association of Realtors
38 THE CHANGING MARKET Preferences: Housing Millennials especially are trending away from traditional suburbs 47% would prefer to live in a city or a suburb with a mix of houses, shops, and businesses 40% would prefer a rural or a small town 12% say they would prefer a suburban neighborhood with houses only
39 Marketing to Millennials Real estate selling reflects the new market reality emphasizes high tech, social amenities, and pitches what s outside as much as inside 40

40 41
41 42
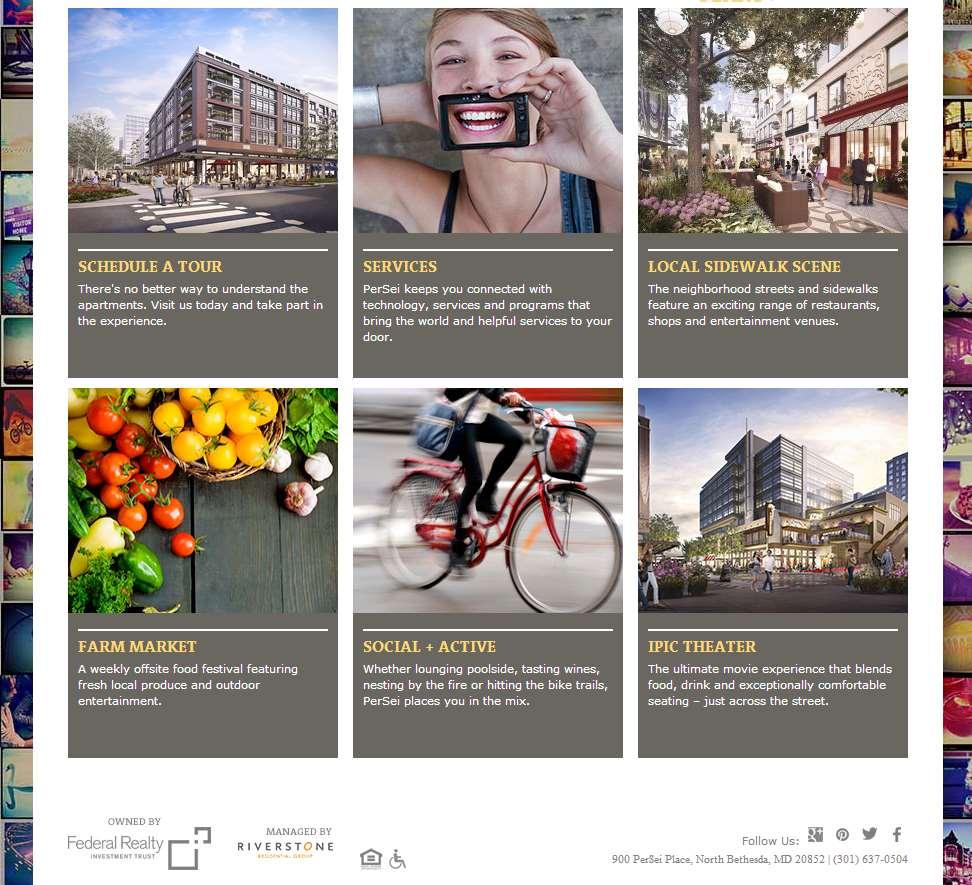

42 43
43 THE CHANGING MARKET Preferences: Housing Boomers are downsizing Increasing numbers, smaller households The number of senior households will grow twice as fast as all others over the next couple decades (A.C. Nelson)
44 Occupied Housing Demand- Supply Mismatch 2011 Source: Adapted from American Housing Survey 2011 by Arthur C. Nelson, University of Arizona.
45 It s not just big metropolitan areas, but small towns too The same demographic and market trends that are driving a return to big cities can also boost the prospects of smaller cities and towns surrounded by suburbs and countryside. -- Robert Steuteville, Small cities and towns are urban places, too - Better! Cities & Towns The Other Walkable Urban Trend 46
46 By John Woodrow Cox October 31, Many of the same forces fueling Washington s renaissance are driving a small-city boom regionally and nationally. The same demographic and market trends that are driving a return to big cities can also boost the prospects of smaller cities and towns surrounded by suburbs and countryside. -- Robert Steuteville, Small cities and towns are urban places, too - Better! Cities & Towns The Other Walkable Urban Trend 47


47 About 10 percent of Americans would like to live in mixed-use small towns, but don't. -- Robert Steuteville The Other Walkable Urban Trend 48
48 49
49 2. The changing market: The new recipe for economic growth


50 Economic growth 20 th century vs. 21 st century Big game hunting vs. Economic gardening Chasing smokestacks vs. Chasing talent
51 The 21 st Century Economy The creative economy ; the knowledge economy ; the innovation economy Importance of networking, interaction Demand for skilled workers
52 Forbes.com* One of the main factors businesses consider when deciding on where to relocate or expand is the available pool of college-educated workers. And that has cities competing for college-educated young adults. And there s one place this desired demographic, college-educated professionals between the ages of 25 and 34, tends to want to live: tight-knit urban neighborhoods that are close to work and have lots of entertainment and shopping options within an easy walk. * Downtowns: What's Behind America's Most Surprising Real Estate Boom March 25,
53 PROSPERITY Businesses respond to changing preferences Across the country corporations are responding to employee preferences and moving to the talent. They are choosing to relocate from suburban office parks to downtown locations.
54 Businesses respond to changing preferences (SGA research: > 100 cases in two dozen metropolitan areas) 57
55 Livable cities draw creative people, and creative people spawn jobs. (Wired, Small Cities Feed the Knowledge Economy, Adam Davidson, May 31, 2011.) 58
56 Richard Florida's Rise of the Creative Class makes a compelling argument that urban development now depends on novel combinations of knowledge and ideas, that certain occupations specialize in this task, that people in these occupations are drawn to areas providing a high quality of life, and that the essential development strategy is to create an environment that attracts and retains these workers. While developed with urban areas in mind, this thesis may be particularly relevant in rural areas, which lose much of their young talent as high school graduates leave for college, the armed forces, or city lights. It s not just big cities United States Department of Agriculture Economic Research Service CREATIVE CLASS COUNTY CODES using data from the pooled American Community Survey, U.S. Census Bureau. From: 59

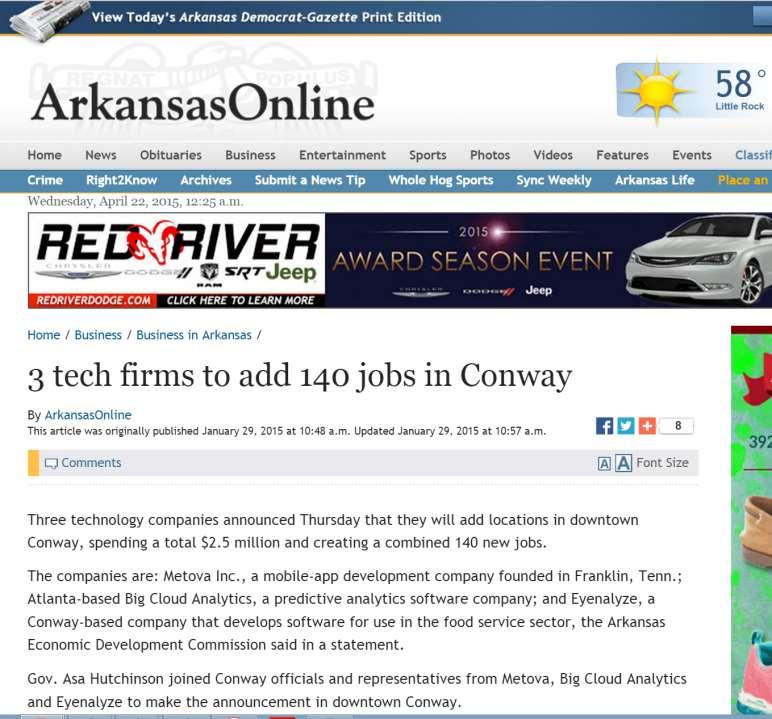
57 Conway, Arkansas 61
58 62
59 63
60 Retail is changing, too 64
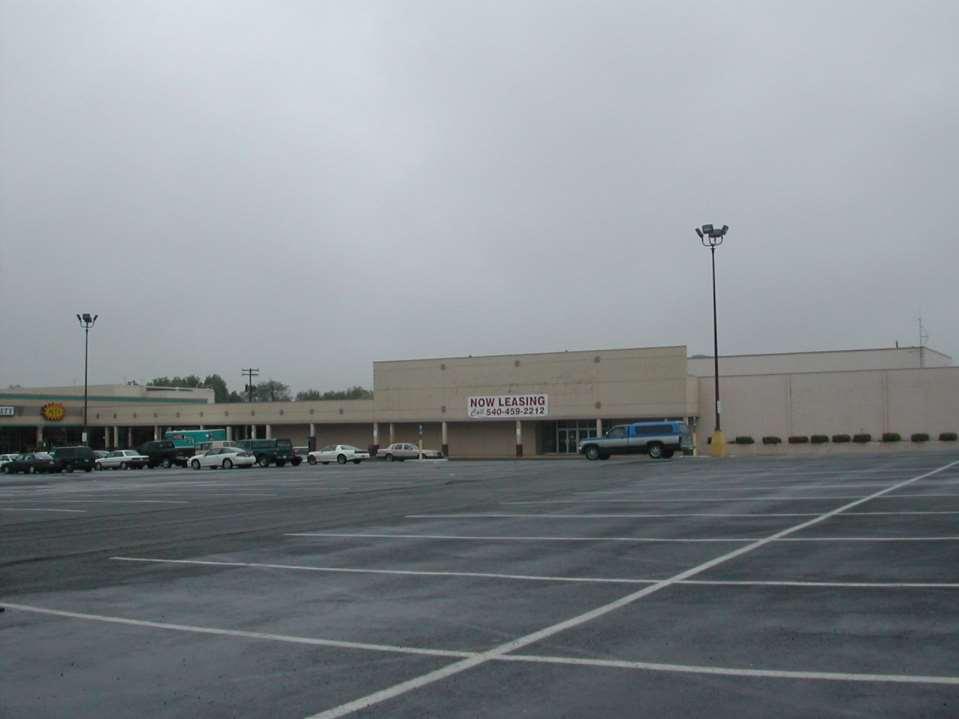
61 65

62 From Seph Lawless, Black Friday, as reviewed in Autopsy of America: Photos of dead shopping malls By Aaron July 1,

63 Within 15 to 20 years, retail consultant Howard Davidowitz expects as many as half of America's shopping malls to fail.... we haven't built a major enclosed mall since " ng-malls-are-going-extinct
64


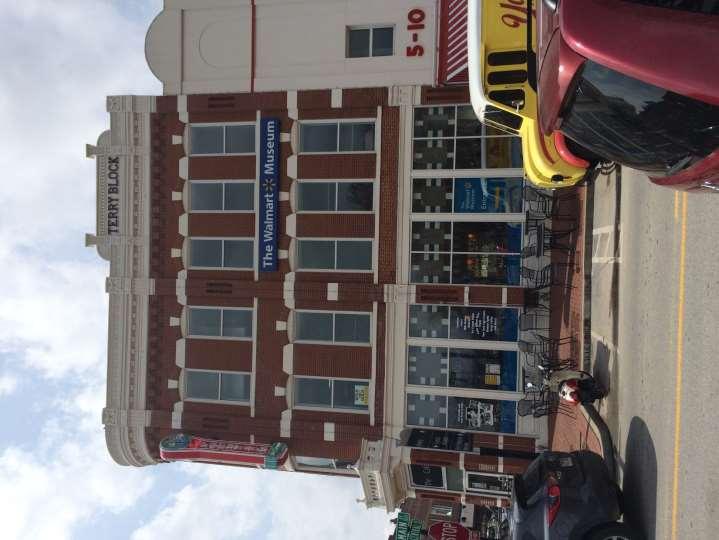
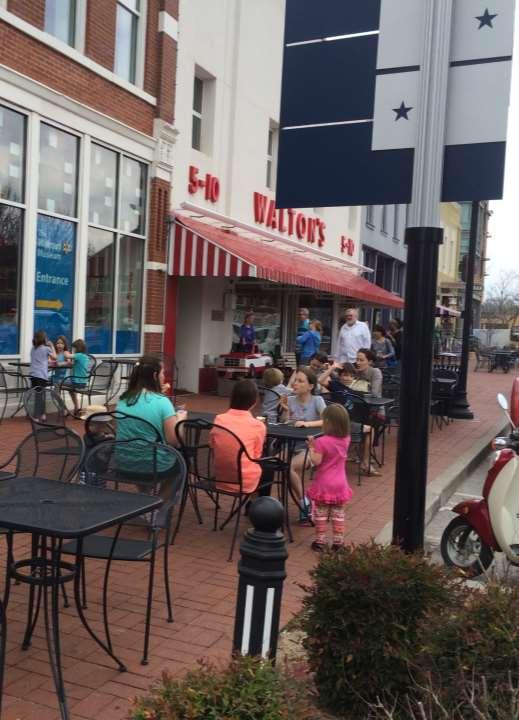
65 Walmart with housing, Washington, DC. Photo: Planner s Web, Edward T. McMahon photo by Eric Allix Rogers, Flickr Creative Commons license. Walmart Neighborhood Market in Chicago s Loop. 70
66 Economic benefits of walkability Mounting evidence from all around the US 71

67 There is a price/value premium for walkable places 72
68 There is a price/value premium for walkable places 73
69 There is a price/value premium for walkable places (residential) Applies to residential real estate - Above-average walkability: $4,000 to $34,000 more in home sales price Sources: Walking the Walk by Joseph Cortwright, CEOs for Cities and The Walkability Premium in Commercial Real Estate Investments by Gary Pivo and Jeffrey Fisher

70 There is a price/value premium for walkable places (commercial) Applies to commercial real estate - Greater walkability: 1% to 9% increase in commercial property value depending on type; also higher incomes and lower capitalization rates Sources: Walking the Walk by Joseph Cortwright, CEOs for Cities and The Walkability Premium in Commercial Real Estate Investments by Gary Pivo and Jeffrey Fisher

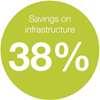
71 There is a price/value premium for walkable places 2014 study ranks the top 30 US metropolitan areas in walkability Major findings: The top ranking metros have an average of 38% higher GDP per capita as compared to the low ranking metros. Office rent in urban WalkUPs rent at a 74% higher premium per square foot over drivable sub-urban areas. 76
72 77

73 From: 78
74 79

75 Fifty-five years ago, the Research Triangle Park transformed the economy of North Carolina. Now we re poised to do it again pointing the state toward a brighter future with a redevelopment we call Park Center.... the first redevelopment in RTP s long and storied history. It will bring to the Park, for the first time ever, an array of eateries, retail, recreation and entertainment. There will be places for people to live, close to where they work, or stay while they are visiting. More importantly, it will be a place where leaders in technology, science, the arts and the humanities can come together, collaborate and create a better future for us all. Creating a place where collaboration can occur between industry and academia, nonprofits and corporate titans, entrepreneurs and government is our goal. We want to create spaces for people to gather, meet, hang out and be inspired.... We imagine an area that is walkable, bikeable, accessible to all and eventually linked to regional transit. See: 80

76 Other research campuses have corporate buildings. Some have academic programs. Few, if any, have residential or student housing. Centennial Campus has both. From: 81
77 To sum up: Cities want to attract dynamic businesses Dynamic businesses want to attract skilled young workers ( millennials ) Skilled young workers want to locate in dynamic, walkable places What are you going to do to create those places? 82

78 Cheyenne s opportunity 83

79 Cheyenne s opportunity 1600 Central Avenue has a Walk Score of 74 out of 100. This location is Very Walkable so most errands can be accomplished on foot. 84
80 85
81 3. Development patterns & budgets: The high cost of sprawl
82 FISCAL HEALTH How communities develop affects government expenditures and revenues.


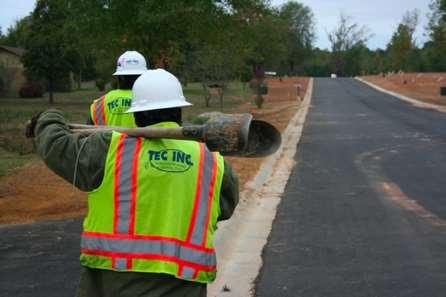

83 FISCAL HEALTH Development affects costs Photo by Alex Maclean
84 FISCAL HEALTH Some development costs more, for taxpayers and consumers. Some costs less. Turns out, sprawl costs more.
85 on the other hand: Compact development patterns and investment in projects to improve urban cores could save taxpayers money and improve overall regional economic performance Mark Muro and Robert Puentes, Investing in a Better Future: A Review of the Fiscal and Competitive Advantages of Smarter Growth Development Patterns. Washington, DC: The Brookings Institution,


86 91
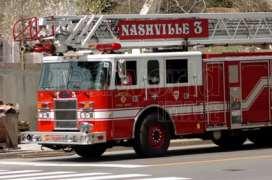
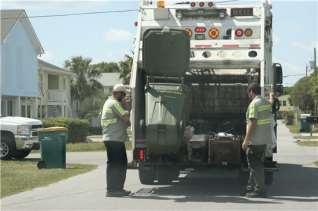
87 FISCAL HEALTH Development affects costs Compact development offers efficiencies in delivering services. Police and fire departments have less area to cover. Fewer miles of road to cover for trash pickup, school buses. Fewer miles of water and sewer pipes to maintain.

88 FISCAL HEALTH Development affects costs Building infrastructure to serve new development on the fringe can cost a city up to three times more per acre than urban infill development.
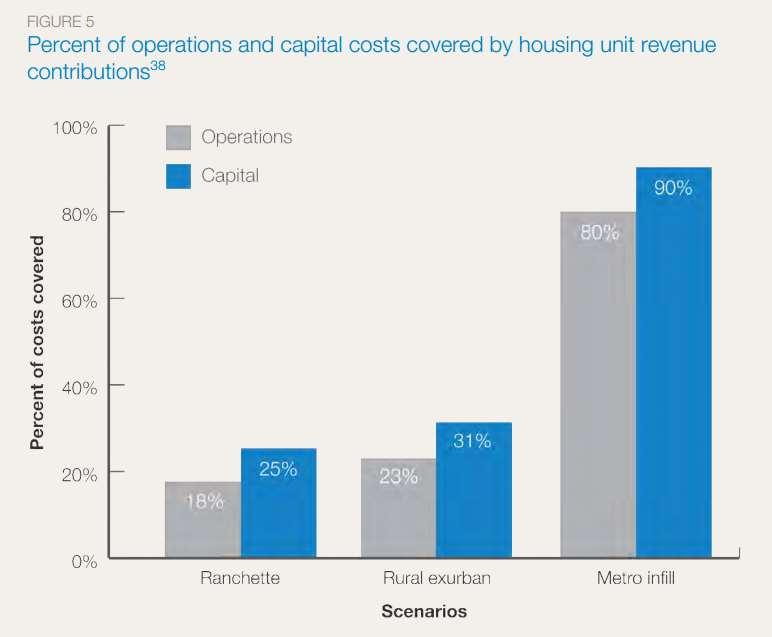
89 FISCAL HEALTH Development affects revenue When it comes to revenue Compact development is the best deal. Low-density suburban development generates much less per acre revenue. Main streets and dense mixed-use areas create synergies that produce substantially higher revenues than commercial sprawl.


90 97 Joe Minicozzi, AICP - Public Interest Projects : Asheville NC
91 98

92 99
93 100
94 101

95 INFRASTRUCTURE COST METHODOLOGY THE 40-ACRE GRID OVERLAY
 per Capita (Residents & Employees) ROAD LENGTH AND AREA PER CAPITA DECREASES AS DENSITY INCREASES 50 45 40 35 30 25 Samples from City of Madison Suburban")

96 Road Length (ft.) per Capita (Residents & Employees) ROAD LENGTH AND AREA PER CAPITA DECREASES AS DENSITY INCREASES Samples from City of Madison Suburban Residential Residents: 178 Employees: 5 Total: 183 Total Res. & Emp Per Acre: 4.6 Total Road Length: 5,435 Road Length per Capita: 30 ft. 20 Downtown Urban y = x R² = Residents and Employees per Acre NOTE: Chart shows road length only. Road area per capita has a similar relationship to density. Residents: 2236 Employees: 633 Total: 2,869 Total Res. & Emp Per Acre: 71 Total Road Length: 8,941 Road Length per Capita: 3.1 ft.
97 LOW DENSITY DEVELOPMENT REQUIRES MORE PIPE MEANING HIGHER MAINTENANCE COSTS $160 $140 $120 Water and Sanitary Costs per Capita (Illustrative Only) Revenue per Capita $100 $80 $60 $40 $20 $0 Low Density Average Density High Density Other Costs per Capita Pipe Maintenance Costs per Capita
98 Transportation Costs per Student Per Pupil Transportation Costs Decline as Pupil Density Increases FY 2013 School Transportation Costs and Pupil Density by School District in Wisconsin $1,000 $900 $800 $700 $600 $500 $400 $300 y = ln(x) R² = $200 $100 $ ,000 1,200 Pupils per Square Mile Est. Units per Acre SOURCE: Wisconsin Dept. of Education NOTE: Points represent average costs for districts within density categories
99 THE COMPACT DEVELOPMENT SCENARIO REDUCES CITY EXPENDITURES $15,000,000 Total Projected Annual City Costs of Pioneer District Development at Build-Out in Today s Dollars $14,000,000 $13,000,000 $12,000,000 $11,000,000 $10,000,000 Low Density Base Compact
100 COMPACT DEVELOPMENT MAXIMIZES REVENUE GENERATION PER ACRE $20,000 Projected Annual Tax Revenue per Acre in the Pioneer District at Build-Out $15,000 $10,000 $5,000 $0 Low Base Compact
101 MADISON MODEL PROJECTS THAT MOVING FROM 2 UNITS PER ACRE (NET) TO 16 REDUCES PER CAPITA CITY COSTS BY 33% $1,200 Estimated Costs per Capita at Various Densities (Hypothetical Residential Program in Madison) $1,000 $800 $600 $400 $200 $0 2 per Acre 4 per Acre 8 per Acre 12 per Acre 16 per Acre Other (Non-Density Related) Roads Fire Water Sewer


102 0.9 units per acre 11.7 units per acre 21.8 units per acre $1,200 $1,000 $800 $600 $400 $200 $0 2 per Acre 4 per Acre 8 per Acre 12 per Acre 16 per Acre Other (Non-Density Related) Roads Fire Water Sewer
103 MORE COMPACT DEVELOPMENT RESULTS IN HIGHER NET FISCAL IMPACTS PER ACRE $9,000 $8,000 $7,000 $6,000 $5,000 $4,000 $3,000 $2,000 $1,000 $0 Estimated Annual Net Fiscal Impact per Acre ASSUMING WALKABLE VALUE PREMIUM OF 20% ON ALL PRODUCT TYPES IN COMPACT SCENARIOS Low Density Base Scenario Compact "Plus 50" Compact "Plus 50" City of Madison Madison Metropolitan School District Numbers represent annual operating costs and certain annualized capital costs associated with the development at full build-out
104 114
105 Communities are now in a ferocious competition over place (whether they know it or not)
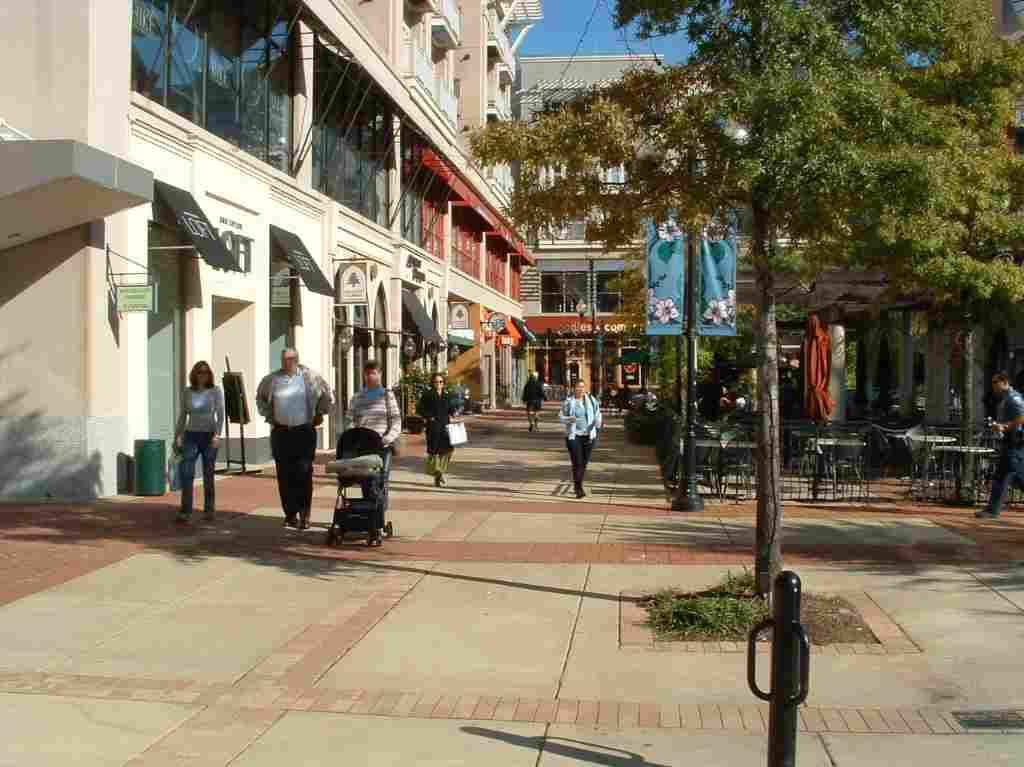
106 Economic development is increasingly a competition over placemaking. Building a great place to live, work, and play IS an economic development strategy.

107 What it means

108 Vacant parcels in Macon Georgia 118

109 119

110 New streetscape in front of old buildings (photo: Chris Zimmerman Oct 2011) 120
")
111 Siting principles This is a big nono Building Surface parking Sidewalk (photo: Chris Zimmerman Oct 2011) 121
112 Westchester PA 2007 (CZ photo) 122
113 123
114
115 125


116 It means place management... Asheville, NC Meridian, MS... including programming events 126


117 A Dickens of a Christmas Franklin, TN Seasonal festivals & markets Book Fair--Baltimore Indian Market Santa Fe, NM

118 Seasonal festivals & markets Washington Square Park, Cincinnati, OH

119 and, ultimately, generating spontaneity Saratoga Springs, NY -- and, fun. 129
120 Smart growth is part of an economic development strategy 130

121 Thank you Christopher Zimmerman
Planning for Economic and Fiscal Health
 Planning for Economic and Fiscal Health Christopher Zimmerman Vice President for Economic Development Cheyenne, Wyoming April 21, 2015 2 Planning for Economic and Fiscal Health The pattern of development
Future of Housing Trends and the Housing Market Demographic Waves in the Region and Future of Housing. Illinois Finance Forum January 25, 2019
 Future of Housing Trends and the Housing Market Demographic Waves in the Region and Future of Housing Illinois Finance Forum January 25, 2019 Millions OUR STATE S POPULATION 2000-2017 13.0 12.4 M 12.9
Ranking Walkable Urbanism in America s Largest Metros
 Ranking Walkable Urbanism in America s Largest Metros The Largest 30 Metros in the United States SHARE OF U.S. POPULATION SHARE OF U.S. GDP 54% 46% 42% 58% LARGEST 30 METROS REST OF U.S. The Old Dichotomy
Community & Transportation Preferences Survey
 Community & Transportation Preferences Survey Webinar: August 5, 2015 Hugh Morris, AICP, LEED Realtor.org Jennifer Dill, Ph.D. trec.pdx.edu 1 Introduction National Association of Realtors Over 1,000,000
Photo credit: AARP COMPLETE STREETS. Why Now? Santa Clara July 13, 2017
 Photo credit: AARP COMPLETE STREETS Why Now? Santa Clara July 13, 2017 Trainers Emiko Atherton National Complete Streets Coalition Mike Rutkowski P.E., AICP Stantec Agenda Welcome Why Complete Streets?
Active Community Design: Why Here? Why Now?
 Active Community Design: Why Here? Why Now? Chris Holm Development Review Coordinator 20 April, 2015 Sacramento, California Our environment has changed North Natomas We ve rapidly urbanize our open space
NC Demographic Trends Through 2035
 NC Demographic Trends Through 2035 House Select Committee on Strategic Transportation Planning and Long Term Funding Solutions February 22, 2016 Rebecca Tippett, University of North Carolina July 1 Population
The Impact of Placemaking Attributes on Home Prices in the Midwest United States
 The Impact of Placemaking Attributes on Home Prices in the Midwest United States 2 0 1 3 C O N S T R U C T E D E N V I R O N M E N T C O N F E R E N C E M A R Y B E T H G R A E B E R T M I C H I G A N
Walkability. The Pathway to Atlanta s Future Growth April 19, 2017
 Walkability The Pathway to Atlanta s Future Growth April 19, 2017 1 Walkability The Pathway to Atlanta s Future Growth This report was prepared by the ULI Atlanta s Livable Communities Council Working
good walking is good business making massachusetts more walkable
 good walking is good business making massachusetts more walkable Nothing draws a crowd like a crowd. P.T. Barnum 15 minutes with WalkBoston who we are / what we do why walkability makes economic sense
Smart Growth, Climate Change and Prosperity Steve Winkelman Chuck Kooshian
 Smart Growth, Climate Change and Prosperity Steve Winkelman Chuck Kooshian Asilomar Transportation & Energy Conference August 31, 2011 CCAP put the third leg of the stool on the policy map. Reducing VMT
Community Improvement Plans: Creating walkable and liveable communities that support local business
 Community Improvement Plans: Creating walkable and liveable communities that support local business Kate Hall Program Manager ~ WALK Friendly Ontario Canada Walks, Green Communities Canada khall@greencommunitiescanada.org
Project Narrative. Albuquerque, NM. July 31, 2015
 Project Narrative Albuquerque, NM July 31, 2015 1 Project Identification As the first bus rapid transit (BRT) project in New Mexico, the Albuquerque Rapid Transit (ART) line will run through the heart
NC Demographic Trends Through 2035
 NC Demographic Trends Through 2035 Joint Appropriation Committee on Transportation February 21, 2017 Rebecca Tippett, PhD Director, Carolina Demography July 1 Population (Millions) North Carolina s Total
The Brookings Institution Metropolitan Policy Program
 The Brookings Institution Metropolitan Policy Program The Structural Shift in Building The Built Environment The Next American Dream for the 21 st Century Economy The Brookings Institution Metropolitan
University of Michigan & Urban Land Institute Real Estate Forum. Mary Beth Graebert Michigan State University
 University of Michigan & Urban Land Institute Real Estate Forum Mary Beth Graebert Michigan State University November 20, 2013 Michigan State University Land Policy Institute Strong focus on research and
BUILDING THE CASE FOR TRAVEL OPTIONS IN WASHING TON COUNTY. Image: Steve Morgan. Image: Steve Morgan
 BUILDING THE CASE FOR TRAVEL OPTIONS IN WASHING TON COUNTY Image: Steve Morgan Image: Steve Morgan Image: TriMet Image: TriMet WHAT ARE TRAVEL OPTIONS PROGRAMS? Travel options programs encourage residents,
WHERE ARE ARIZONA DEMOGRAPHICS TAKING US? HOW GROWING SLOWER, OLDER AND MORE DIVERSE AFFECTS REAL ESTATE
 WHERE ARE ARIZONA DEMOGRAPHICS TAKING US? HOW GROWING SLOWER, OLDER AND MORE DIVERSE AFFECTS REAL ESTATE March 2017 Tom Rex Office of the University Economist and Center for Competitiveness and Prosperity
National Community and Transportation Preferences Survey. September 2017
 National Community and Transportation Preferences Survey September Executive Summary - Overview The Community and Transportation Preferences Survey echoes many of the major findings from the previous surveys.
Balboa Area Transportation Demand Management
 Balboa Area Transportation Demand Management April 2016 Presented by: Jeff Tumlin What Are We Aiming For? Transportation is not an end in itself. It is merely a means by which we support the community.
THE 2010 MSP REGION TRAVEL BEHAVIOR INVENTORY (TBI) REPORT HOME INTERVIEW SURVEY. A Summary of Resident Travel in the Twin Cities Region
 REPORT HOME INTERVIEW SURVEY. A Summary of Resident Travel in the Twin Cities Region") THE 2010 MSP REGION TRAVEL BEHAVIOR INVENTORY (TBI) REPORT HOME INTERVIEW SURVEY A Summary of Resident Travel in the Twin Cities Region October 2013 WHAT IS THE TBI? The Travel Behavior Inventory (TBI)
THE 2010 MSP REGION TRAVEL BEHAVIOR INVENTORY (TBI) REPORT HOME INTERVIEW SURVEY A Summary of Resident Travel in the Twin Cities Region October 2013 WHAT IS THE TBI? The Travel Behavior Inventory (TBI)
Changing Commuting Patterns and Impacts on Planning & Infrastructure. William E. Frawley, AICP Texas A&M Transportation Institute October 3, 2013
 Changing Commuting Patterns and Impacts on Planning & Infrastructure William E. Frawley, AICP Texas A&M Transportation Institute October 3, 2013 Change is Constant... Various studies and data sources 1960
Demographic Change in North Carolina
 Demographic Change in North Carolina 5 Trends to Watch North Carolina Aggregates Association June 29, 2017 Rebecca Tippett, PhD Director, Carolina Demography July 1 Population (Millions) North Carolina
2017 Nebraska Profile
 2017 Nebraska Profile State, 9 NEW Regions, 93 Counties, plus 31 Cities Three Volumes Demographic Change in the State Economic Influences at Work Housing Statistics and Trends Summary of Findings Discuss
Attachment A: Columbus Area Metropolitan Transportation Plan Objectives, Performance Measures, and Targets
 OBJECTIVE: Reduce the percentage of commuters driving alone, and increase the percentage of commuters riding transit, ing Reducing single occupancy auto commutes and increasing commuters using alternative
Location Matters: Where America Is Moving
 Location Matters: Where America Is Moving Nearly half of all American households plan to move at some point in the future. While some will move for a larger or nicer home, or perhaps to purchase a home
Community & Transportation Preferences Survey U.S. Metro Areas, 2015 July 23, 2015
 Community & Transportation Preferences Survey U.S. Metro Areas, 2015 July 23, 2015 Realtor.org trec.pdx.edu 1 Highlights: Generation gaps in everyday travel Only 71% of Millennials like driving (the lowest
Appendix T 1: Additional Supporting Data
 Appendix T 1: Additional Supporting Data Project Delivery Delays with the implementation of the 2000 TIP became apparent early in the decade. In response to direction among policy officials, ARC began
FACTS AND FIGURES: MAKING THE CASE FOR COMPLETE STREETS IN LEE COUNTY
 FACTS AND FIGURES: MAKING THE CASE FOR COMPLETE STREETS IN LEE COUNTY Safety: Close to 5,000 pedestrians and bicyclists die each year on U.S. roads, and more than 70,000 are injured. [Mean Streets, Surface
Detroit Metromode. From Suburban To Urban RELATED IMAGES KIM NORTH SHINE THURSDAY, DECEMBER 01, 2011 CHRISTOPHER B. LEINBERGER
 Detroit Metromode From Suburban To Urban KIM NORTH SHINE THURSDAY, DECEMBER 01, 2011 RELATED IMAGES CHRISTOPHER B. LEINBERGER ENLARGE ENLARGE ENLARGE ENLARGE RELATED TAGS DEVELOPMENT, DOWNTOWN DEVELOPMENT,GOVERNMENT,
Purpose and Need. Chapter Introduction. 2.2 Project Purpose and Need Project Purpose Project Need
 Chapter 2 Purpose and Need 2.1 Introduction The El Camino Real Bus Rapid Transit (BRT) Project (Project) would make transit and other transportation improvements along a 17.6-mile segment of the El Camino
VISION. Introduction WHAT S INSIDE. One Region, Focusing on Our Future
 VISION 2050 One Region, Focusing on Our Future A publication of the Southeastern Wisconsin Regional Planning Commission Fall 2015 THE ALTERNATIVES THE EVALUATION WHAT S INSIDE Land Use pgs. 2-3 Public
Healthy Corridors. Ed McMahon Urban Land Institute Nashville, TN
 Healthy Corridors Ed McMahon Urban Land Institute Nashville, TN What s Wrong with this Corridor? Ugly Unsafe Unhealthy Unwalkable Under performing Un-Connected Why Are Corridors Unhealthy? Safety Lots
National Association of REALTORS National Smart Growth Frequencies
 September 520, 2017 3,000 Weighted Online Respondents National Association of REALTORS National Smart Growth Frequencies Q.2 The first question is about the quality of life in your community. How satisfied
Rochester Area Bike Sharing Program Study
 roc bike share Rochester Area Bike Sharing Program Study Executive Summary ~ January 2015 JANUARY 2015 8484 Georgia Avenue, Suite 800 Silver Spring, MD 20910 3495 Winton Pl., Bldg E, Suite 110 Rochester,
Planning for Economic and Fiscal Health
 Planning for Economic and Fiscal Health Building the Economic Case for Walkable Communities Building Active Communities Initiative Roger Millar, PE, AICP March 17, 2015 Presentation objectives Discuss
TriMet Review of Debunking Portland: The Public Transit Myth September 2007
 TriMet Review of Debunking Portland: The Public Transit Myth September 2007 In his recent paper, Debunking Portland: The Public Transit Myth dated August 28, 2007, posted on the Cato Institute web site,
Transportation Master Plan Advisory Task Force
 Transportation Master Plan Advisory Task Force Network Alternatives & Phasing Strategy February 2016 BACKGROUND Table of Contents BACKGROUND Purpose & Introduction 2 Linking the TMP to Key Council Approved
Cities Connect. Cities Connect! How Urbanity Supports Social Inclusion
 Cities Connect! How Urbanity Supports Social Inclusion Todd Litman Victoria Transport Policy Institute Metropolis Toronto, Canada - 14 June 2006 Cities Connect People with people. People with jobs. People
Walkable Retail: When Old Becomes New Again Part 1
 Walkable Retail: When Old Becomes New Again Part 1 By Erin Talkington, Vice President, and Jacob Ross, Associate You have probably read the following headline thousands of times, perhaps this year alone:
TOD COVER. Header. Lessons Learned. Results of FTA s Listening Sessions With Developers, Bankers, and Transit Agencies on Transit Oriented Development
 Header COVER TOD T R A N S I T O R I E N T E D D E V E L O P M E N T Lessons Learned Results of FTA s Listening Sessions With Developers, Bankers, and Transit Agencies on Transit Oriented Development U.S.
PUBLIC OPINION STRATEGIES
 PUBLIC OPINION STRATEGIES National Association of REALTORS The key findings from a national survey of 1,000 adults conducted October 5, 7, 9-10, 2007. 07574 Methodology Public Opinion Strategies is pleased
The Case for New Trends in Travel
 The Case for New Trends in Travel The Future of Cities and Travel Steven E. Polzin, PhD. Center for urban Transportation Research University of South Florida October 19, 2008 Successful Strategies from
Complete Streets 101: The Basics
 Complete Streets 101: The Basics Michigan Municipal League - Capital Conference March 21, 2017 Chip Smith, AICP - Senior Planner - Wade Trim Inc. and City Council member City of Ann Arbor 2017 MML Capital
City of Davenport CitiBus Public Transportation Study. April 2015
 City of Davenport CitiBus Public Transportation Study April 2015 Overview Project Background Key Findings CitiBus Service Allocation Policy Discussion 2 Project Background 3 About CitiBus Operates 17 routes
North Carolina Competitiveness
 ted@econleadership.com North Carolina Competitiveness NC 200,000 180,000 160,000 140,000 120,000 100,000 80,000 60,000 40,000 20,000 0 The Punch Job Change 1990 to 2012 182,905 The loss of about 8 of our
Heaven or Hell? Designing the impact of autonomous vehicles on cities and suburbs
 Heaven or Hell? Designing the impact of autonomous vehicles on cities and suburbs Ellen Dunham-Jones Professor of Architecture Director, MS in Urban Design Georgia Institute of Technology We don t know
North Carolina Complete Streets Summit. Welcome and Opening Plenary
 North Carolina Complete Streets Summit Welcome and Opening Plenary Schedule Overview 9:00 am 10:15 am 12:00 pm 1:15 pm 3:00 pm Opening Plenary Morning Breakout Sessions Lunch Afternoon Breakout Sessions
Appendix A-1: Purpose and Need Statement
 Appendix A-1: Purpose and Need Statement PURPOSE AND NEED STATEMENT Western & Ashland Corridors Bus Rapid Transit (BRT) Project Prepared for Chicago Transit Authority 567 West Lake Street Chicago, IL 60661
Transportation Trends, Conditions and Issues. Regional Transportation Plan 2030
 Transportation Trends, Conditions and Issues Regional Transportation Plan 2030 23 Regional Transportation Plan 2030 24 Travel Characteristics Why Do People Travel? Over one-half of trips taken in Dane
Typical Rush Hour Commute. PennyforTransportation.com
 Typical Rush Hour Commute In the News Overview of the Plan Collaborative plan with projects in every community Prioritizing connectivity and congestion relief Dedicated transportation-specific funding;
Speed Limits Study and Proposal. Public Input Session: 8/14/13
 Speed Limits Study and Proposal Public Input Session: 8/14/13 Why is Decatur a unique place for this project? First Community Transportation Plan in the nation with a Health Impact Assessment. Strong sense
Online Open House Survey Report. December 2016
 December 216 I. OVERVIEW & OUTREACH SUMMARY Introduction Washington County evaluated long-term transportation investments and strategies as part of the Transportation Futures Study. The purpose of the
Improving Mobility Without Building More Lanes
 Improving Mobility Without Building More Lanes By Mike Salisbury and Will Toor July 2017 Copyright 2017 by Southwest Energy Efficiency Project. All rights reserved. Photo: Courtesy of the Denver Post Anyone
Vision Public Workshop: Findings
 Vision Public Workshop: Findings Long Range Transportation Plan & Bicycle Mobility Plan February 2018 Vision Workshop South Kingstown 1/23/18 Providence 1/24/18 Newport 1/31/18 Long Range Transportation
THE FUTURE OF SALES TAX REVENUE
 THE FUTURE OF SALES TAX REVENUE Presented by Adam Fulton, Senior Economic Associate The Outlook for Sales Taxes State governments rely on state sales taxes for more than a fifth of their revenue Economic
Sustainable Transportation Planning in the Portland Region
 Sustainable Transportation Planning in the Portland Region Jennifer Dill, Ph.D. Associate Professor School of Urban Studies & Planning jdill@pdx.edu http://web.pdx.edu/~jdill/ Outline Elements of a sustainable
Notes to Benefit-Cost Analysis
 Executive Summary Project Matrix Current Status/ Problem to Be Addressed University Avenue not user friendly or safe for cars, pedestrians, bicyclists, or bus riders. Notes to Benefit-Cost Analysis Change
Approaches. Livable Neighborhood Design. Examples. Traditional neighborhood development. CE 594 University of Wisconsin- Milwaukee
 Approaches Livable Neighborhood Design CE 594 University of Wisconsin- Milwaukee Traditional neighborhood design (TND), new urbanism, transit friendly design, transit oriented development and walkable
Measuring Transportation: Traffic, Mobility and Accessibility
 Measuring Transportation: Traffic, Mobility and Accessibility THIS FEATURE COMPARES THREE APPROACHES TO MEASURING TRANSPORTATION SYSTEM PERFORMANCE. TRAFFIC-BASED MEASUREMENTS EVALUATE MOTOR VEHICLE MOVEMENT;
Exceeding expectations: The growth of walking in Vancouver and creating a more walkable city in the future through EcoDensity
 Exceeding expectations: The growth of walking in Vancouver and creating a more walkable city in the future through EcoDensity Melina Scholefield, P. Eng. Manager, Sustainability Group, City of Vancouver
What s Health Got to Do With It? Health and Land Use Planning
 What s Health Got to Do With It? Health and Land Use Planning CANDACE RUTT, PH.D. EXECUTIVE DIRECTOR APRIL 13 TH, 2016 Planning and Public Health Planning + Public Health Healthy Communities Healthier
Transit Best Practices and Strategies for the Short, Mid, and Long Terms
 Transit Best Practices and Strategies for the Short, Mid, and Long Terms Joel Volinski Director, National Center for Transit Research Center for Urban Transportation Research University of South Florida
Planning Regionally With Transit
 Planning Regionally With Transit Nathan Coats Director of Operations CTAA Expo 2015 Tampa Began 1992. Serves eastern Cache County to Preston, ID. Population- 115,000 34 bus fleet, 26 fixed route buses;
Building Community Partnerships for Mobility:
 Building Community Partnerships for Mobility: San Francisco 2008 Presented by: Cynthia Hoyle, AICP Transportation Planning Consultant Champaign-Urbana Mass Transit District Background The Heartland Champaign-Urbana,
THESE DAYS IT S HARD TO MISS the story that Americans spend
 WHICH COMES FIRST: THE NEIGHBORHOOD OR THE WALKING? BY SUSAN HANDY AND PATRICIA MOKHTARIAN THESE DAYS IT S HARD TO MISS the story that Americans spend more time stuck in traffic than ever, that they re
WELCOME. City of Greater Sudbury. Transportation Demand Management Plan
 WELCOME City of Greater Sudbury Transportation Demand Management Plan Public Consultation Session St. Andrew s Place, Activity Hall 111 Larch Street Wednesday September 13, 2017 6:00 to 8:00 pm Welcome
METRO Light Rail: Changing Transit Markets in the Phoenix Metropolitan Area
 METRO Light Rail: Changing Transit Markets in the Phoenix Metropolitan Area Abhishek Dayal, AICP Planner III, METRO Light Rail Phoenix, AZ BACKGROUND Transit in the Phoenix Region Transit services in the
INNER LOOP EAST. AIA Rochester Annual Meeting November 13, 2013 TRANSFORMATION PROJECT. Bret Garwood, NBD Erik Frisch, DES
 INNER LOOP EAST TRANSFORMATION PROJECT AIA Rochester Annual Meeting November 13, 2013 Bret Garwood, NBD Erik Frisch, DES Why? We are building a city that encourages walking, biking and enjoying the outdoor
Regional Transportation Needs Within Southeastern Wisconsin
 Regional Transportation Needs Within Southeastern Wisconsin #118274 May 24, 2006 1 Introduction The Southeastern Wisconsin Regional Planning Commission (SEWRPC) is the official areawide planning agency
tattersall park RBY EBSCO RETAIL PROPERTIES
 tattersall park EBSCO PROPERTIES RBY RETAIL the case for tattersall park... The 75-acre site OWNED by the developer (EBSCO) has a unique history. It is one of the most attractive multi use sites in the
Public Opinion about Transportation Issues in Northern Virginia A Report Prepared for the:
 Public Opinion about Transportation Issues in Northern Virginia A Report Prepared for the: Northern Virginia Transportation Authority By QSA Research & Strategy October 13, 2005 TABLE OF CONTENTS Page
About the Active Transportation Alliance
 About the Active Transportation Alliance Chicagoland s voice for better biking, walking and transit Founded 1985 7,000 members, ~33 full time staff Serve Chicago metro region 1 More Cars, More Driving
Environment and Public Works Committee Presentation
 Mixed Use Centers Complete Streets Guidelines Project Environment and Public Works Committee Presentation December 10, 2008 Project Objectives: Conduct an inter-departmental and agency process to study
Passenger Rail in Virginia
 Passenger Rail in Virginia Executive Summary! In 2011, Washington DC-VA-MD ranked 1st in the U.S. per auto commuter in the following categories:1 o Yearly Delay; 67 hours o Excess Fuel; 32 gallons o Congestion
Chapter 7. Transportation. Transportation Road Network Plan Transit Cyclists Pedestrians Multi-Use and Equestrian Trails
 Chapter 7 Transportation Transportation Road Network Plan Transit Cyclists Pedestrians Multi-Use and Equestrian Trails 7.1 TRANSPORTATION BACKGROUND The District of Maple Ridge faces a number of unique
Capital Bikeshare 2011 Member Survey Executive Summary
 Capital Bikeshare 2011 Member Survey Executive Summary Prepared by: LDA Consulting Washington, DC 20015 (202) 548-0205 June 14, 2012 EXECUTIVE SUMMARY Overview This report presents the results of the 2012
Tourists simply won t go to a city or town that has lost its soul. Arthur Frommer
 Among cities and towns with no particular recreational appeal, those that preserve the past continue to enjoy tourism. Those that haven t receive almost no tourism at all. Tourists simply won t go to a
Uniting Cleveland through the Euclid Corridor Transportation Project
 Zhang 1 Uniting Cleveland through the Euclid Corridor Transportation Project Jinmeng Zhang As a bus passenger takes a ride to downtown Cleveland through Euclid Avenue, constructions can be seen along the
Fixed Guideway Transit Outcomes on Rents, Jobs, and People and Housing
 Fixed Guideway Transit Outcomes on Rents, Jobs, and People and Housing Arthur C. Nelson, Ph.D., ASCE, FAICP Professor of Planning and Real Estate Development University of Arizona 1 Changing Transportation
Briefing Paper #1. An Overview of Regional Demand and Mode Share
 2011 Metro Vancouver Regional Trip Diary Survey Briefing Paper #1 An Overview of Regional Demand and Mode Share Introduction The 2011 Metro Vancouver Regional Trip Diary Survey is the latest survey conducted
ECONOMIC DEVELOPMENT INTRODUCTION WHAT YOU WILL FIND IN THIS CHAPTER
 ECONOMIC DEVELOPMENT INTRODUCTION WHAT YOU WILL FIND IN THIS CHAPTER Information about the local economy including statistics on population, employment, businesses, and employment sectors. Policies and
Congestion Evaluation Best Practices
 Congestion Evaluation Best Practices Todd Litman Victoria Transport Policy Institute Presented International Transportation and Economic Development Conference 10 April 2014 Congestion Indicators Indicator
Exit 13/Golden Triangle Study FREQUENTLY ASKED QUESTIONS
 FREQUENTLY ASKED QUESTIONS How will you improve traffic in the Golden Triangle? One main goal of this study is to examine the current traffic patterns of the area and propose ways to improve the traffic.
THE PHILADELPHIA COMPLETE. an overview
 THE PHILADELPHIA COMPLETE STREETS DESIGN HANDBOOK an overview WHAT ARE COMPLETE STREETS? Complete Streets are streets designed to accommodate all users, from pedestrians to drivers Complete Streets provide
Capital and Strategic Planning Committee. Item III - B. April 12, WMATA s Transit-Oriented Development Objectives
 Capital and Strategic Planning Committee Item III - B April 12, 2018 WMATA s Transit-Oriented Development Objectives Page 24 of 76 Washington Metropolitan Area Transit Authority Board Action/Information
Illustrated Principles of Good Planning
 Illustrated Principles of Good Planning The Miami 21 Zoning Code incorporates time-tested planning principles into the zoning regulations of our City. These are principles that make for better neighborhoods,
ABERDEEN: CITY OF THE FUTURE
 ABERDEEN: CITY OF THE FUTURE A contribution towards discussions on a future transport strategy for Aberdeen and its Region Prepared by the Centre for Transport Research University of Aberdeen June 2010
Webinar: The Association Between Light Rail Transit, Streetcars and Bus Rapid Transit on Jobs, People and Rents
 Portland State University PDXScholar TREC Webinar Series Transportation Research and Education Center (TREC) 11-15-2016 Webinar: The Association Between Light Rail Transit, Streetcars and Bus Rapid Transit
CITY OF ALPHARETTA DOWNTOWN MASTER PLAN TRAFFIC EVALUATION
 CITY OF ALPHARETTA DOWNTOWN MASTER PLAN TRAFFIC EVALUATION June 2015 CITY OF ALPHARETTA DOWNTOWN MASTER PLAN TRAFFIC EVALUATION Introduction The Alpharetta Downtown Master Plan was developed in the fall
Integrating Community Development and Transportation Strategies. November 13, 2014
 R-B CORRIDOR 1970 R-B CORRIDOR TODAY Integrating Community Development and Transportation Strategies November 13, 2014 The Community Development Transportation Question Can communities support increased
Win-Win Transportation Solutions
 Win-Win Transportation Solutions Todd Litman Victoria Transport Policy Institute Presented Lipinski Symposium on Transportation Policy Chicago, Illinois 15 October 2007 What is The Transportation Problem?
Wenlin Liu, Senior Economist. Stateof Wyoming. Economic Analysis Division State of Wyoming 1
 WYOMING DEMOGRAPHIC AND ECONOMIC TREND LCCC LIFE Program April 7, 2012 Cheyenne, Wyoming Wenlin Liu, Senior Economist Economic Analysis Division Stateof Wyoming Economic Analysis Division State of Wyoming
The Wisconsin and Minnesota Economies: What can we learn from each other? Noah Williams
 The Economies: What can we learn from each other? Noah University of Wisconsin - Madison Future Wisconsin Summit 2016 Economies Location, size, demographics, and history make Wisconsin and Minnesota natural
MOUNT CLEMENS, MICHIGAN
 Prepared For: Mount Clemens Downtown Development Authority Downtown District Plan MOUNT CLEMENS, MICHIGAN Prepared By: Michigan State University Practicum Josh Croff Emily Gehle Justin Habalewsky Daniel
Population & Demographics
 Population & Demographics Conditions and Trends When looking at trends in the total number of people living in Windham (population) and at the characteristics of the people who live here by factors such
Mobility and Congestion
 Technical Memorandum Mobility and Congestion Prepared for: Prepared by: September 25, 2013 1 Table of Contents 1. Introduction... 1 2. Congestion Forecasting Process... 1 2.1 Mobility and Congestion Terms...
2045 Long Range Transportation Plan. Summary of Draft
 2045 Long Range Transportation Plan Summary of Draft Fredericksburg Area Metropolitan Planning Organization The George Washington Region includes the City of Fredericksburg and the counties of Caroline,
The best indicator of an individual s and expanding access to parks and open space.
 Health & Wellness Create a Safe and Healthy Built Environment Artist s rendering, 2014 Health is important to Loveland residents, and stakeholders see the many strong connections between quality of life,
7 NE 145TH STREET STATION TOD POTENTIAL
 7 NE 145TH STREET STATION TOD POTENTIAL Key Findings The 145th Street Station area has limited TOD potential, primarily because of its location in an area that is currently zoned predominantly single-family