ESTABLISHING PROCEDURES AND GUIDELINES FOR PEDESTRIAN TREATMENTS AT UNCONTROLLED LOCATIONS
|
|
|
- Hillary Holland
- 5 years ago
- Views:
Transcription

1 CIVIL ENGINEERING STUDIES Illinois Center for Transportation Series No UILU-ENG ISSN: ESTABLISHING PROCEDURES AND GUIDELINES FOR PEDESTRIAN TREATMENTS AT UNCONTROLLED LOCATIONS Prepared By Yan Qi, Ph.D., P.E. Ryan Fries, Ph.D., P.E. Huaguo Zhou, Ph.D., P.E. Abdur Rab Raghunandan Baireddy Southern Illinois University Edwardsville Auburn University Research Report No. FHWA-ICT A report of the findings of ICT PROJECT R Establishing Procedures and Guidelines for Pedestrian Treatments at Uncontrolled Locations
2
3 TECHNICAL REPORT DOCUMENTATION PAGE 1. Report No. FHWA-ICT Government Accession No. N/A 4. Title and Subtitle ESTABLISHING PROCEDURES AND GUIDELINES FOR PEDESTRIAN TREATMENTS AT UNCONTROLLED LOCATIONS 7. Author(s) Yan Qi, Ryan N. Fries, Huaguo Zhou, Abdur Rab, and Raghunandan Baireddy 9. Performing Organization Name and Address Illinois Center for Transportation Department of Civil and Environmental Engineering University of Illinois at Urbana Champaign 205 North Mathews Avenue, MC-250 Urbana, IL Sponsoring Agency Name and Address Illinois Department of Transportation (SPR) Bureau of Material and Physical Research 126 East Ash Street Springfield, IL Recipient s Catalog No. N/A 5. Report Date August Performing Organization Code N/A 8. Performing Organization Report No. ICT UIUL Work Unit No. N/A 11. Contract or Grant No. R Type of Report and Period Covered Final Report: 8/15/2015 8/15/ Sponsoring Agency Code FHWA 15. Supplementary Notes Conducted in cooperation with the U.S. Department of Transportation, Federal Highway Administration. 16. Abstract Pedestrians are the most vulnerable road users. The risks to pedestrians crossing at uncontrolled locations are much higher than at signalized intersections. There has been an increasing trend in pedestrian deaths during the past decade. Specifically, pedestrian fatality as percent of total fatalities indicates an increasing trend in a ten-year period from 2005 to Several research projects funded by both federal and state transportation agencies have attempted to identify effective strategies for improving pedestrian safety within their jurisdictions. However, very little research was conducted on pedestrian safety at uncontrolled locations in Illinois. The objectives of the project were to identify the best practices of approving pedestrian crossings and pedestrian-crossing treatments at uncontrolled locations and to develop procedures and guidelines to be used by the Illinois Department of Transportation (IDOT) and local agencies. To achieve the research goal, the team conducted a comprehensive literature review of related studies and existing guidelines, a survey and interview of Illinois transportation engineers, statistical analysis of Illinois pedestrian-crash data from 2010 to 2014, and a field review of selected high-crash corridors (HCC) in Illinois. This study identified several common issues associated with the high-pedestrian-crash-prone roads, e.g., speeding, poor lighting, noncompliance with posted signage, inadequate or missing signage, or lack of conspicuity. Several geometric features were also proven to be related to pedestrian crashes; for instance, long crossing distances, insufficient sight distance, and inappropriate placement of bus stops and parking were proved to affect pedestrian safety. In addition, pedestrian-crossing treatments were classified into five categories in the study, and their effectiveness and suitable conditions were assessed and identified. Based on the research findings, a guidebook was compiled with a comprehensive discussion of strategies and treatments to enhance pedestrian safety at uncontrolled locations. The target audiences for this guidebook are transportation professionals, highway designers, traffic engineers, law enforcement officers, and safety specialists who may be involved in efforts to reduce pedestrian crashes at uncontrolled locations. 17. Key Words pedestrian safety, crosswalks, unsignalized intersections, pedestrian treatment, midblock location, guidelines 19. Security Classif. (of this report) Unclassified Form DOT F (8-72) 18. Distribution Statement No restrictions. This document is available through the National Technical Information Service, Springfield, VA Security Classif. (of this page) Unclassified 21. No. of Pages 83 pp + appendices 22. Price N/A Reproduction of completed page authorized
4
5 ACKNOWLEDGMENT, DISCLAIMER, MANUFACTURERS NAMES This publication is based on the results of ICT-R ESTABLISHING PROCEDURES AND GUIDELINES FOR PEDESTRIAN TREATMENTS AT UNCONTROLLED LOCATIONS. ICT-R was conducted in cooperation with the Illinois Center for Transportation; the Illinois Department of Transportation (IDOT), Division of Highways; and the U.S. Department of Transportation, Federal Highway Administration (FHWA). Members of the Technical Review panel (TRP) were the following: Kyle Armstrong TRP Chair, IDOT Tim Sheehan Former TRP Chair, IDOT Mike Amsden, City of Chicago Alan Ho, FHWA Cory Jucius, IDOT Randal Laninga, IDOT Jon McCormick, IDOT Marshall Metcalf, IDOT Dan Mlacnik, IDOT Tim Peters, IDOT Gary Sims, IDOT Jim Stoner, IDOT Jonathan Lloyd (IDOT), Nicholas Stoffer (City of Peoria), Bret Wetherill (City of Peoria), Wendy Firsching (SIUE), and Sima Moradi Bajestani (SIUE) helped with the high-crash corridors (HCC) field review of the project. The contents of this report reflect the views of the authors, who are responsible for the facts and the accuracy of the data presented herein. The contents do not necessarily reflect the official views or policies of the Illinois Center for Transportation, the Illinois Department of Transportation, or the Federal Highway Administration. This report does not constitute a standard, specification, or regulation. Trademark or manufacturers names appear in this report only because they are considered essential to the object of this document and do not constitute an endorsement of product by the Federal Highway Administration, the Illinois Department of Transportation, or the Illinois Center for Transportation. i
6 EXECUTIVE SUMMARY This research project was conducted to improve the engineering design practices related to pedestrian crossings at locations where vehicular traffic is not controlled by signals (midblock locations, stop-sign-controlled intersections, or uncontrolled intersections). The objectives of the proposed project were to identify the best practices of approving pedestrian crossings and pedestrian-crossing treatments at uncontrolled locations and to develop procedures and guidelines to be used by Illinois Department of Transportation (IDOT) and local agencies for appropriate deployment of crosswalks and other treatments. A plethora of research has been conducted to identify the effectiveness of treatments aimed at improving pedestrian safety. In particular, many treatments have been studied at crosswalk locations. Although many of these research findings have been included in state and national design guidelines and policies, most of this support focuses on crosswalks where vehicles are controlled by traffic signals. There exists a need to provide transportation engineers with guidance about the best practices for locating and selecting treatments for pedestrian crossings at uncontrolled locations. Approving pedestrian crossings at dangerous locations can cause safety problems for pedestrians and liability issues for the approving agencies. Recommending inappropriate pedestrian-crossing treatments at uncontrolled locations can also cause pedestrian-safety problems and inefficient use of public funds. This research project was conducted by researchers at Southern Illinois University Edwardsville and Auburn University, for the Illinois Department of Transportation and through the Illinois Center for Transportation. The overarching goal was to improve the location and implementation decisions related to pedestrian crossings at uncontrolled locations in Illinois. A key product of this study is a guidebook intended for use by transportation engineers at the state, county, and local level, throughout Illinois. The researchers first reviewed published literature on pedestrian safety and the effectiveness of various practices. Next, they interviewed transportation engineers in various IDOT districts and surveyed engineers who design crosswalks for Illinois counties and/or local municipalities. After that, an analysis of pedestrian-crash data in Illinois was completed; and locations with high crash rates were visited and reviewed. Last, the researchers combined all these findings into a guidelines document. This study was conducted over about two years, between August 2015 and August The primary product of this project are the proposed guidelines, included as Appendix A of this document. Implementing these recommended practices can improve pedestrian safety by guiding transportation engineers to approve crossings only at locations capable of providing adequate pedestrian safety. Additionally, the guidelines will provide those engineers with direction about which treatments are most appropriate for a particular location, facilitating application of the research results in practice. IDOT customers will benefit from improved pedestrian safety and increased design consistency for pedestrian-crossing treatments. Although these guidelines could suggest particular crosswalks be removed because of safety issues, which impacts IDOT as well as local municipalities, the overall goal is to improve pedestrian safety. ii
7 To realize the expected benefits, IDOT and other agencies must adopt the developed guidelines into their design manuals and policies. It is recommended that those updating the IDOT Bureau of Design Manual and the Environment and the Bureau of Local Roads and Streets Manual consider including the recommended guidelines. iii
8 CONTENTS EXECUTIVE SUMMARY... II LIST OF FIGURES... X LIST OF TABLES... XVIII CHAPTER 1: INTRODUCTION... 1 CHAPTER 2: LITERATURE FINDINGS EFFECTIVENESS OF PEDESTRIAN-CROSSING TREATMENTS AND TECHNOLOGIES Marked Crosswalks Zigzag Pavement-Marking Lines Crosswalks with Raised Median and/or Pedestrian Refuge Danish Offset Pedestrian Channelization Advanced Stop Line and Sign In-Street Pedestrian-Crossing Signs Flashing Beacons Pedestrian Hybrid Beacons/High-Intensity Activated Crosswalk Beacons Rectangular Rapid Flashing Beacons In-Roadway Warning Lights Grade-Separated Crossings Pedestrian User-Friendly INtelligent (PUFFIN) Crossings Curb Extensions Pedestrian Crossing Flags PEDESTRIAN-CROSSING WARRANTS, POLICIES, AND GUIDELINES National Warrants and Guidelines State Warrants and Guidelines Local Warrants and Guidelines SUMMARY OF LITERATURE REVIEW CHAPTER 3: SURVEY AND INTERVIEW FINDINGS iv
9 3.1 INTERVIEW RESULTS: Warrants for Marked Pedestrian Crosswalks Factors Considered Factors to be included in the final guidelines Crosswalk Design Treatments Considered Importance of Treatments Input to the Guidelines Summary of Interview Findings SURVEY ANALYSIS CHAPTER 4: CRASH-DATA ANALYSIS IDENTIFICATION OF VARIABLES TO DEFINE PEDESTRIAN CRASHES PRELIMINARY STATISTICAL ANALYSIS OF PEDESTRIAN-CRASH DATA DETERMINE SIGNIFICANT CONTRIBUTING FACTORS USING THE PARTIAL PROPORTIONAL ODDS (PPO) MODEL SPATIAL ANALYSIS OF CRASH DATA TO IDENTIFY HIGH-CRASH LOCATIONS SUMMARY CHAPTER 5: FIELD REVIEW FINDINGS HIGH-CRASH CORRIDORS FIELD REVIEW METHODS CONTRIBUTING FACTORS IDENTIFIED Insufficient Sight Distance Vehicle Speed Turning Vehicles Low Pedestrian Visibility Lack of Sidewalks Land Use Inadequate Pedestrian Treatments Inadequate Maintenance Pedestrian and Driver Behavior v
10 Site location BEST PRACTICES FOR TREATMENTS DEPLOYMENT RECOMMENDATIONS FOR FINAL GUIDELINES CHAPTER 6: BEST PRACTICES WARRANTS/MINIMUM REQUIREMENTS Speed Crossing Distance Crosswalks Spacing Sight Distance Crash Records SELECTION OF PEDESTRIAN TREATMENTS Site-Condition Variables Treatment Categories Selection of Appropriate Treatments OTHER SAFETY CONSIDERATIONS Crosswalk Pattern Bus Stop Location Crosswalk Lighting On-Street Parking Restriction Use of Highlighted Sign Pole Education Program USE OF FENCES AND SEPARATED-GRADE CROSSING Fencing Grade-Separated Crossing CHAPTER 7: SUMMARY AND CONCLUSIONS REFERENCES APPENDIX A: GUIDELINES FOR IMPROVING PEDESTRIAN SAFETY AT UNCONTROLLED LOCATIONS SECTION 1: INTRODUCTION vi
11 SECTION 2: EVALUATION OF CANDIDATE LOCATIONS FOR INSTALLATION OF CROSSING TREATMENTS SECTION 3: SELECTION OF AT-GRADE PEDESTRIAN CROSSING TREATMENTS FOR UNCONTROLLED LOCATIONS Basic Treatments Enhanced Treatments Geometric Elements Warning Beacons Control Beacon SECTION 4: OTHER SAFETY CONSIDERATIONS Crosswalk Pattern Bus Stop Location Crosswalk Lighting Use of Highlighted Pole and Dual Back-to-Back Display Education Program SECTION 5: ADDITIONAL TREATMENTS Usage of Fencing Grade Separated Crossing APPENDIX B: ADDITIONAL LITERATURE FINDINGS B1. PEDESTRIAN CROSSING TREATMENTS AND TECHNOLOGIES B.1.1 Marked Crosswalks B.1.2 Zigzag Pavement marking lines B.1.3 Raised Median and/or Pedestrian Refuge B.1.4 In-street Pedestrian Crossing Signs B.1.5 Advance Stop Lines and Signs B.1.6 Danish Offset B.1.7 Grade-Separated Crossing B.1.8 Curb Extensions B.1.9 Pedestrian Crossing Flags B.1.10 Flashing Beacons B.1.11 In-Pavement Flashing Lights at Crosswalk/In-Roadway Warning lights vii
12 B.1.12 Rectangular Rapid Flashing Beacons B.1.13 Pedestrian Hybrid Beacon/ High Intensity Activated Cross Walk Beacon B.1.14 Pedestrian User-Friendly INtelligent (PUFFIN) Crossings B2. COMMON DRIVER BEHAVIORS B3. PEDESTRIAN BEHAVIOR B4. DISTRACTION B5. PEDESTRIAN CHANNELIZATION APPENDIX C: INTERVIEW AND SURVEY QUESTIONS INTRODUCTION TO INTERVIEWEE SECTION 1: WARRANTS SECTION 2: DESIGN SECTION 3: PROFESSIONAL OPINION QUESTIONS SECTION 4: INTERVIEWEE INFORMATION INTERVIEW DETAILS SURVEY QUESTIONS Survey Section Survey Section 2: Design of Crosswalks at Uncontrolled Locations Survey Section 3: Professional Opinion Questions Survey Section 4: Demographic Information APPENDIX D: ANALYSIS DETAILS APPENDIX E: REVIEW SUMMARY FOR INDIVIDUAL HCC E.1 DISTRICT 4 HCCS E.1.1 NE Monroe Street (Peoria) E.1.2. West Harmon Hwy (Peoria) E.1.3. SW Jefferson Ave. (Peoria) E.1.4. W Wiswall St. (Peoria) E.1.5. West Farmington Rd. (Peoria) E.2 DISTRICT 5 HCCS E.2.1 Gregory Dr. (S. 1 st St. to Undergrad Library on U of I campus, Urbana-Champaign). 143 E.2.2. Business 51, N. Main St. Bloomington-Normal, IL (E. Lafayette St. to Raab Rd.) viii
13 E.2.3. Kirby Ave., Champaign, IL (Scottsdale Dr. to S 1 st St.) E.2.4 Springfield Ave., Champaign, IL (S Mattis Ave. to S State St.) E.2.5 West Springfield Ave. (Corridor 2), Champaign, IL (S. Goodwin Ave. to W. Main St.) 164 E.3 CITY OF CHICAGO HCCS E.3.1 N. Clark St. (W. Irving Park Rd. to N. LaSalle St., Chicago) E.3.2. South Ashland Ave. (59 th St. to 69 th St., Chicago) E.3.3. South Pulaski Rd. (W. Division St. to W. Roosevelt Rd., Chicago) E.3.4. West North Ave. (N. Austin Blvd. to N. Laramie Ave., Chicago) E.3 DISTRICT 1 HCCS E.3.5. Illinois Route 43 (Historic US Route 66) E.3.6. Lawrence Ave., Section One E.3.7. Lawrence Ave., Section Two E.3.8. West 47 th St E.4 DISTRICT 6 HCCS E.4.1. North Grand Ave E.5.2. West Jefferson St E.5.3. South MacArthur Blvd (corridor) E.5.4 Illinois Route E.5.5. Broadway St. between N. 25 th St. to N. 48 th St E.5.6. Broadway St. between N. 25 th St. to N. 48 th St E.6 EXAMPLE FIELD REVIEW SHEETS ix
14 LIST OF FIGURES Figure 1. Resources referred to for crosswalk warrants Figure 2. Factors considered for crosswalk warrants Figure 3. Factors considered in making project-level decisions for installing uncontrolled crossings.. 16 Figure 4. Top factors suggested by interviewees as important to include in the guide Figure 5. Resources referred to for designing uncontrolled crossings Figure 6. Treatments commonly considered to improve pedestrian safety Figure 7. Treatments considered important for safety at uncontrolled crossing locations Figure 8. Resources referred to for crossings guidelines/policies Figure 9. Factors considered as warrants for crosswalk locations Figure 10. Factors considered important to include in the guidebook Figure 11. Resources referred to for design of crosswalks at uncontrolled locations Figure 12. Treatments commonly considered for pedestrian safety at crossings Figure 13. Information suggested as important to include in the guide for uncontrolled crossings design Figure 14. Flowchart for defining pedestrian crashes Figure 15. Crash-severity odds when a DUI driver was involved Figure 16. Crash-severity odds when a young driver was involved Figure 17. Crash-severity odds for various pedestrian age groups Figure 18. Crash-severity odds when pedestrians wore no contrasting clothing Figure 19. Crash-severity odds if crash occurred in a rural area Figure 20. Severity odds for crashes along dark, unlit roads Figure 21. Crash-severity odds when ice was present on the road Figure 22. Crash-severity odds when crash occurred on a crosswalk Figure 23. Severity odds for crashes along divided roads Figure 24. Crash-severity odds for cities with different sizes of population Figure 25. Names and locations of high-pedestrian-crash counties in Illinois Figure 26. A sample map depicting high-crash segments in Champaign County, Illinois Figure 27. Example of pedestrian sight distance (PedSD) restricted by on-street parking (Highway Safety Research Center: University of North Carolina, 1999) x
15 Figure 28. Example of sight-distance issue for a vehicle on the outer lane Figure 29. Example locations where observed speeds were higher than the posted limit Figure 30. (a) Wide crossing distance with no median; (b) parking lane increasing the crossing distance Figure 31. Example of left-turning vehicles causing pedestrian-safety issues Figure 32. Example of inadequate street-lighting location Figure 33. Lack of sidewalk on roads with residential development Figure 34. Example of lack of maintenance for crosswalk markings and signs Figure 35. Example of best practices for multiple treatments Figure 36. Example of the best practice of placing an advanced stop bar and sign Figure 37. Example of advanced stop line and sign supplement with Stop here for pedestrian (HDOT, 2013) Figure 38. Example of marked crosswalk with pedestrian-refuge island, warning signs, and in-street crossing sign Figure 39. Example of a marked crosswalk with a flashing beacon, Edwardsville, Illinois Figure 40. Example of marked crosswalk with in-street crossing sign and painted buffer zone, Edwardsville, Illinois Figure 41. Example of a road diet with in-street crossing sign, Peoria, Illinois Figure 42. Example of pedestrian channelization, Cook County, Illinois Figure 43. Example of bus stop relocation downstream of crosswalk (PEDSAFE, 2017) Figure 44. Recommended design layout for crosswalk lighting (Gibbons et al. 2008) Figure 45. Example of retroreflective signposts, IL Rte. 29, Rochester, Illinois Figure 46. Examples of median with/without waiting zones on refuge islands Figure 47. Pedestrian-injury severity based on vehicle speed (U.K. Department of Transportation, 1987) Figure 48. Pedestrian-crossing and warning signs Figure 49. Uncontrolled pedestrian-crosswalk signs (FHWA, 2009) Figure 50. Advanced stop line and sign (PEDSAFE, 2017) Figure 51. (a) Raised median (Pulugurtha et al. 2012); (b) split pedestrian crossover (VDOT, 2004); and (c) curb extension (Turner and Carlson, 2000) Figure 52. Raised crossing (PEDSAFE, 2017) xi
16 Figure 53. Pole-mounted and overhead flashing beacons (Fitzpatrick et al. 2006) Figure 54. Example of an RRFB system (Pecheux et al. 2009) Figure 55. Example of a PHB treatment in Arizona (Fitzpatrick et al. 2014(a)) Figure 56. Recommended crosswalk patterns at uncontrolled locations Figure 57. Brick-textured crosswalk on N. Clark St., Chicago Figure 58. Placement of bus stop on the far side of the crossing (PEDSAFE, 2017) Figure 59. Recommended midblock crosswalk-lighting layout (Gibbons et al. 2008) Figure 60. Pedestrian-crossing sign (dual back-to-back display) on N. Clark St., Chicago Figure 61. Sequence for a pedestrian hybrid beacon (FHWA, 2009) Figure 62. Pedestrian signs used in conjunction with fencing Figure 63 Typical view of W. Springfield Ave. with parking on one side of the roadway Appendix A Figure A- 1. Pedestrian crossing and warning signs (FHWA, 2009) Figure A- 2. Uncontrolled pedestrian crosswalk signs (FHWA, 2009) Figure A- 3. a) Advanced stop line and sign (PEDSAFE, 2017) and b) Curb extensions (Turner and Carlson, 2000) Figure A- 4. a) Raised median (Pulugurtha et al. 2012); b) Danish Offset at Maryland Parkway, Las Vegas (Pecheux et al. 2009) Figure A- 5. Road Diet (Knapp et al. 2014) Figure A- 6. Raised crossing (PEDSAFE, 2017) Figure A- 7. a) Pole mounted and b) Overhead flashing beacons (Fitzpatrick et al. 2006) Figure A- 8. RRFB system (Pecheux et al. 2009) Figure A- 9. PHB treatment at Arizona (Fitzpatrick et al. 2014) Figure A- 10. Recommended crosswalk patterns at uncontrolled locations (Zegeer et al. 2005) Figure A- 11. Placement of bus stop on the far side of the crossing (PEDSAFE, 2017) Figure A- 12. Midblock crosswalk lighting layout (Gibbons et al. 2008) Figure A-13. Retroreflective signpost along IL 29, Rochester, IL Figure A-14. Pedestrian crossing sign (dual back-to -back display) at North Clark St, Chicago Figure A- 15. Sequence for a pedestrian hybrid beacon (FHWA, 2009) Figure A-16. Pedestrian signs used in conjunction with fencing (FHWA, 2009) xii
17 Appendix B Figure B-1. Example pedestrian crossing with zigzag lines in Trinidad (Mutabazi, 2010) Figure B-2. Pedestrian channelization along the roadside (Pulugurtha et al. 2012) Appendix C Figure C-1. Pedestrian crash history comparison for Du Page County vs. Illinois Average County Figure C-2. Factors suggested as less important to include in the guide Appendix E Figure E-1. Land use and pedestrian attractions along NE Monroe St. (Peoria) Figure E-2. Marked crosswalk with warning sign and pedestrian actuated flashing beacon Figure E-3. Unmarked crosswalk with no warning sign Figure E-4. Bus stop at the point of unmarked crosswalk at intersection with Voris St Figure E-5. Lighting at an intersection Figure E-6. Parking prohibition close to crosswalk Figure E-7. West Harmon Hwy. Typical Roadway view Figure E-8. Pedestrian attractions along West Harmon Hwy Figure E-9. Land use pattern and pedestrian attractions along SW Jefferson Ave Figure E-10. Part of SW Jefferson Ave. that was unsignalized Figure E-11. Newly deployed treatment at the intersection of SW Jefferson St. with Walnut St Figure E-12 Existing treatment at intersection of SW Jefferson St. and Harrison St Figure E-13. Proposed crosswalk location at SW Jefferson St Figure E-14. Land use and pedestrian attractions along W. Wiswalt St Figure E-15. Lack of sidewalk on the both sides of the roadway Figure E-16. Parking restriction close the marked crosswalk Figure E-17. Proposed crosswalk and other improvements at the intersection of Wiswall St. with S. Westmoreland Ave Figure E-18. Proposed crosswalk and other improvements at the intersection of Wiswall St. with Madison Park Terrace xiii
18 Figure E-19. Proposed crosswalk and other improvements at the intersection of W. Wiswall St. with S Western Ave Figure E-20. Land use along W. Farmington Rd Figure E-21. Crash locations along the W. Farmington at the intersection with N. Park Rd Figure E-22. Typical road view of Gregory Dr Figure E-23. Current treatment condition at intersection with Euclid St Figure E-24. Mid-block crossing along Gregory Dr., near David Kinley Hall at the University of Illinois Figure E-25. All- way stop controlled treatment at intersection with S Goodwin Ave Figure E-26. Typical view of US Business 51, Main St Figure E-27. Typical view of roadway at US Business 51, Main St Figure E-28. Land use and pedestrian attractors/generators along the Business Figure E- 29. Marked crosswalk at US Business 51 and McKinley St Figure E-30. Midblock crosswalk on US Business Figure E-31. Pedestrian underpass at the intersection of Business 51 and W. College Ave Figure E-32. Unmarked crosswalk with stop control on minor-street Figure E-33. Faded marking and lack of refuge island at US Business 51 and W. Locust St Figure E-34. Suggested improvement for sections of US Business 51 with raised median Figure E-35. Lighting layout for crosswalks at intersection and mid-block crossings (Gibbons et al. 2008) Figure E-36. Part of US Business 51 between W. Virginia Ave. and E. Emersion St with limited crosswalk locations Figure E-37. Pedestrian sight distance (PedSD) and parking (parallel) restrictions (Highway Safety Research Center: University of North Carolina, 1999) Figure E-38. Kirby Ave. Typical Roadway View Figure E-39. Land use pattern and pedestrian attractions along Kirby Ave Figure E-40. Current treatment at intersection of Kirby Ave. and Park Haven Dr Figure E-41. Existing pedestrian treatment at intersection of Kirby Ave. and Cambridge Dr Figure E-42. Existing pedestrian treatment at intersection of Kirby Ave. and Crescent Dr Figure E-43. Existing pedestrian treatment at intersection of Kirby Ave. and Kenwood Rd Figure E-44. Land use pattern and pedestrian generators/attractions along Springfield Ave xiv
19 Figure E-45. Unmarked crosswalk with school crossing signs at the intersection of Springfield Ave. and S. Prairie St Figure E-46. Current treatments at the intersection of Springfield Ave. and S. New St Figure E- 47. Current treatments at intersection of Springfield Ave. and S. Fair St Figure E-48. Land use pattern and pedestrian attractions along corridor. Springfield Ave Figure E-49. Unmarked crosswalk at intersection of W. Springfield Ave. and S. Gregory St Figure E-50. Intersection of W. Springfield Ave. and W. Main St Figure E-51. Land use and pedestrian attractions along N. Clark St Figure E-52. Crosswalk at the intersection of N. Clark St. with W. Surf St Figure E-53. Marked crosswalk (brick pavers) with pedestrian crossing warning sign Figure E-54. Past and present condition at the intersection of N. Clark St. and W. St. James Pl Figure E-55. Marked crosswalk with 3D illusion at the intersection of N. Clark St. and W. Deming Pl Figure E-56. Breakdown of In-street crossing sign along N. Clark St Figure E-57. Proposed improvement for the un-signalized crosswalks along the corridor Figure E-58. Proposed crosswalk location along N. Clark St Figure E-59. Land use and pedestrian attractions along S. Ashland Ave Figure E-60. Exiting pedestrian treatments at the intersection of S. Ashland Ave and 62 nd St Figure E-61. Exiting pedestrian treatments at the intersection of S. Ashland Ave. and 66 th St Figure E-62. Illustration of suggested improvement alternative 2 (Ulster County Transportation Council, 2016) Figure E-63. Land use and pedestrian attractions along S Pulaski Rd Figure E-64. Existing stop control on minor street-without median at the intersection of S. Pulaski Rd. and W. Adams St Figure E-65. Existing stop control on minor street- with median at the intersection of S. Pulaski Rd. and W. Grenshaw St Figure E-66. Existing all-way stop control at the intersection of S. Pulaski Rd. with W. Wilcox St Figure E-67. Warning sign is needed at crosswalk across S. Pulaski Rd Figure E-68. Bus stop locations along the S. Pulaski Rd Figure E-69. Crosswalk markings at intersection of S. Pulaski Rd. and Folk St Figure E-70. High-visibility crosswalk with warning sign treatment xv
20 Figure E-71. Refuge island with warning sign and advanced stop line (four lane roads) Figure E-72. Land use and pedestrian attractions along W. North Ave Figure E-73. Example marked crosswalk with refuge island at the intersection of W. North Ave. and N. Major Ave Figure E-74. Example of marked crosswalks at the intersection of W. North Ave. and N. Mayfield Ave Figure E-75. Example marked crosswalk without median at the intersection of W. North Ave. and N. Linder Ave Figure E-76. Example of stop controlled marked crosswalk at the intersection of W. North Ave. and N. Latrobe Ave Figure E-77. Example of crosswalk markings at the intersections of W. North Ave. and N. Lotus Ave. and N. Parkside Ave Figure E-78. Protected and unprotected waiting area along W. North Ave Figure E-79. Illustration of refuge island with in-street crossing sign along W. North Ave Figure E-80. Overview of selected section of IL Figure E-81. Crash locations and types along IL Figure E-82. Median refugee island at the intersection of IL 43 and 40 th Pl Figure E-83. Overview of Lawrence Ave. (Section One) Figure E-84. Lawrence Ave. Eastbound at the intersection with Ruby St Figure E-85. The intersection of Lawrence Ave. and Rose St Figure E-86. Pedestrian channelization along Lawrence Ave. under the Metra Rail Bridge Figure E-87. Lawrence Ave. (Section Two) Figure E-88. Brick Pavement Crosswalk at the intersection of Lawrence Ave. and N. Olcott Ave Figure E-89. Un-signalized pedestrian crosswalk sign; advanced stop signs (FHWA 2015) Figure E-90. Examples of recommended crosswalk marking Figure E-91. Overview of W. 47th St. and the intersection with S. Waiola Ave Figure E-92. Example operation at crash location; a pedestrian crossing W. 47th St. going towards Waiola Park Figure E-93. Details and land uses along N. Grand Ave Figure E-94. Sidewalk with curb ramps but no marked crosswalks at the intersection of N. Grand Ave. and N. 4th St xvi
21 Figure E-95. Suggested treatments for un-signalized intersections. (Intersection with N 4 th St.) Figure E-96. Suggested mid-term treatments for un-signalized intersections Figure E- 97. Suggested pedestrian signs to use in front of pedestrian-attractions without crosswalk (FHWA, 2009) Figure E-98. In-street stop for pedestrian sign Figure E-99. Overview of W. Jefferson Ave Figure E-100. Trees cover speed limit sing and crosswalk at W. Jefferson St., residential area Figure E-101. The location of suggested crosswalks on W. Jefferson St Figure E-102. Suggested signs for crosswalks on W. Jefferson St Figure E-103. Existing and recommended cross-section for W. Jefferson St Figure E-104. Details and land uses at the selected section of S. MacArthur Blvd Figure E-105. Recommended mid-term treatment, installing crosswalk along S. MacArthur Blvd Figure E-106. Schematic view of suggested mid-term treatment for installing pedestrian refuge (NACTO, 2017) Figure E-107. Plan view of the intersection of Illinois Rte. 29 and Taft Dr Figure E-108. Street view of the intersection of Illinois Rte. 29 and Taft Dr Figure E-109. Example of vehicle occlusion near the intersection of Illinois Rte. 29 and Taft Dr Figure E-110. Broadway St. between N. 25 th St. and N. 48 th St Figure E-111. Details and land uses along Broadway St. between N. 25th St. and N. 48th St Figure E-112. The type of crosswalk striping across Broadway St. (in 2014 and 2016) Figure E-113. Crash locations and types from 2004 to xvii
22 LIST OF TABLES Table 1. Cross-Tabulation of Explanatory Variables and Severity Levels (Time Information) Table 2. Cross-Tabulation of Explanatory Variables and Severity Levels (Pedestrian Characteristics).. 30 Table 3. Cross-Tabulation of Explanatory Variables and Severity Levels (Driver Characteristics) Table 4. Significant Variables Identified from the PPO Model Analysis for Pedestrian-Crash Severity. 33 Table 5. Traffic-Volume Categories Table 6. At-Grade Pedestrian-Crossing Treatments Appendix A Table A1. Recommended Sight Distance Values Table A2. At-Grade Pedestrian Crossing Treatments Table A3. Summary of Recommended Minimum Treatments at Uncontrolled Pedestrian Crossings.. 93 Appendix D Table D1. Cross-Tabulation of Explanatory Variables and Severity Levels (Environmental Conditions) Table D2. High Crash Segments in Urban Counties With Higher Pedestrian Crash Rates Table D3. High Crash Segments in Rural Counties With Higher Pedestrian Crash Rates Appendix E Table E1. High Crash Corridors Reviewed in Field Table E2. Site Characteristics of NE Monroe St Table E3. Summary of Geometric and Traffic Characteristics of the Visited Intersections Along West Harmon Hwy Table E4. Summary of Geometric and Traffic Characteristics of the Visited Intersections Along SW Jefferson Ave Table E5. Site Characteristics of W. Farmington Rd Table E6. Summary of Geometric and Traffic Characteristics for Gregory Dr Table E7. Summary of Geometric and Traffic Characteristics Along Business Table E8. Summary of Geometric and Traffic Characteristics of the Visited Intersections Along Kirby Ave xviii
23 Table E9. Summary of Geometric and Traffic Characteristics of the Visited Intersections Along Springfield Ave Table E10. Summary of the Geometric and Traffic Characteristics of the Fatal Crash Intersection Along W. Springfield Ave Table E11. Site Characteristics of N. Clark. St Table E12. Site Characteristics of S. Ashland Ave Table E13. Site Characteristics of Pulaski Rd Table E14. Site Characteristics of W. North Ave Table E15. Traffic and Geometric Characteristics of IL Table E16. Site Characteristics of Lawrence Ave. (Part One) Table E17. Geometric and Traffic Characteristic of Lawrence Ave. at the Intersection with N. Olcott Ave Table E18. Geometric and Traffic Characteristic of W 47 th St. at the Intersection with S. Waiola Ave Table E19. Site Characteristics of Selected Section of N. Grand Ave Table E20. Geometric and Traffic Characteristics of Selected Section of W. Jefferson St Table E21. Geometric and Traffic Characteristics of Selected Section of S. MacArthur Blvd Table E22. Traffic and Geometric Characteristics of Broadway St. Between N. 25th St. to N. 48th St Table E 23. Traffic and Geometric Specifications of Broadway St. Between N. 25th St. to N. 48th St.217 xix
24
25 CHAPTER 1: INTRODUCTION Pedestrian safety is a global issue. In the United States, 70% of pedestrian crashes are related to non-intersection locations (midblock crossings) (NHTSA, 2015). In India, statistics show 60% of traffic-fatality victims were pedestrians; and 85% of those pedestrian fatalities occur at midblock crossings (Mohan et al. 2009). In China, a study shows 25% of all traffic-fatality victims were pedestrians (China Road Traffic Accidents Statistics Report, 2011). In Japan in 2007, 2,145 pedestrians were killed in road crashes 32.3% of all roadway-related traffic fatalities (WHO, 2009). Among the road-fatality victims in Switzerland in 2006, 21% were pedestrians (WHO, 2009). Overall, these statistics underscore the importance of improving pedestrian safety. The Illinois Department of Transportation (IDOT) has demonstrated notable interest in improving transportation safety throughout the state. To that end, IDOT and the Illinois Center for Transportation sponsored a study to identify the best practices for approving pedestrian crossings and selecting pedestrian-crossing treatments at locations where vehicular traffic is uncontrolled by traffic-control devices. Herein, midblock locations and intersection approaches without traffic signals or stop/yield signs are termed uncontrolled locations. Although national-level manuals provide guidance about the treatment selection and placement of crosswalks at stop signs and traffic signals, less guidance is available for uncontrolled locations. The product of this study was to be a guidebook to support engineering decisions related to the placement and treatment selection for pedestrian crossings, specifically at uncontrolled locations. In chapter 2, this report includes findings from a review of the published literature. Next, chapter 3 describes the findings of interviews with transportation engineers in various IDOT districts, as well as survey findings from engineers who design crosswalks for Illinois counties and/or local municipalities. Chapter 4 describes results from an analysis of pedestrian-crash data from Illinois. Chapter 5 discusses what the research team learned from a series of site visits to locations with a high number of pedestrian crashes. Combining all of these findings, chapter 6 presents a compilation of best practices that are recommended for future pedestriancrossing placement and deployment at uncontrolled locations. Last, chapter 7 summarizes our concluding remarks. Appendix A includes the recommended guidelines, the key product of this research effort. Other details of the research study can be found in the other appendices. 1
26 CHAPTER 2: LITERATURE FINDINGS The research team conducted a comprehensive literature review of previous research on the topic of pedestrian-crossing treatments at uncontrolled locations in the United States, as well as in other countries. This literature review evaluates existing pedestrian-crossing practices and existing pedestrian-crossing warrants, policies, and guidelines. Additional information about driver and pedestrian behavior can be found in Appendix B. 2.1 EFFECTIVENESS OF PEDESTRIAN-CROSSING TREATMENTS AND TECHNOLOGIES Pedestrians are regarded as the most vulnerable road users, as they are not protected during traffic crashes (ETSC, 1999). In the United States alone, 4,735 pedestrians were killed; and about 66,000 others were severely injured in traffic crashes in 2013 (NHTSA, 2015). Departments of transportation (DOTs) and other transportation agencies have adopted numerous pedestrian-crossing treatments at uncontrolled and midblock locations for pedestrian safety. The research team reviewed previous and contemporary pedestrian-crossing treatments and technologies at uncontrolled locations. They identified pedestrian-crosswalk safety treatments and present contemporary alternatives based on the prevalence of use. In the following subsections, the researchers present the known effectiveness for treatments of pedestrian safety at stop/yield-sign-controlled intersections and midblock locations Marked Crosswalks Studies suggest that marked crosswalks are effective only at low speeds. Knoblauch and coworkers (Knoblauch et al. 2001) recommended that marked crosswalks are a desirable practice at relatively narrow and low-speed uncontrolled locations. The presence of crosswalks at unsignalized intersections is essential to alert motorists passing these dangerous locations (Haleem et al. 2015). A marked crosswalk with a warning sign significantly improves the motorists yielding rate on two-lane roadways with speed limits 30 mph (Yuan and Dulaski, 2016). A crosswalk with pavement marking was found to increase the drivers yielding rate by 11 to 20% (Nicole, 2012). To the contrary, several studies concluded that marked crosswalks involve higher pedestrian crash rates than unmarked (CBTD, 2011), especially for multilane roadways with traffic volumes over 12,000 vehicles/day (Chu et al. 2007; CBTD, 2011). Specifically examining uncontrolled crosswalks, some researchers found no change in the crash frequency when pavement markings were added (Zegeer et al. 2005), especially for narrow roadways with low traffic volumes (Zegeer et al. 2005). The use of a raised median along with a marked crosswalk may provide significantly fewer traffic crashes on multilane roads (Zegeer et al. 2005). FHWA guidance reported that pedestrian-refuge areas or raised medians, when placed at pedestrian crossings at marked crosswalks, could reduce pedestrian crashes with vehicles by 46% (Lindley, 2008). At unmarked pedestrian-crosswalks, this reduction was a little less (39%). Raised medians were considered more suitable on multilane roadways (urban and 2
27 suburban areas) with higher traffic volume (an average daily traffic, ADT, more than 12,000), high or intermediate vehicle speed, and a substantial number of pedestrians (Lindley, 2008) Zigzag Pavement-Marking Lines A brief discussion of zigzag marking lines is available in Appendix B. This treatment is not in compliance with the IL MUTCD and should be considered only for experimental or research purposes. Early research on zigzag lines was done by Wilson (Wilson, 1974), who installed them at 30 places in Great Britain and found a 20% reduction in the proportion of vehicles overtaking and 15% reduction in pedestrians crossing behavior within the zigzag zone. The Road and Traffic authority in Australia approve the use of this treatment as a supplementary advancewarning sign at sites with inadequate sight distance (Department of Main Roads, 1988). Unfortunately, recent research has shown that the meaning of the zigzag pavement lines is not well known and is misunderstood by drivers in Trinidad, Australia (Mutabazi, 2010), and the United States (Dougald, 2010). In response, Queensland, Australia, restricted their use in 2002, as it was an unrecognized standard and was thought to be a potential source of confusion to motorists and a possible cause of crashes between pedestrians and motorists (Queensland Department of Main Roads, 2002). Therefore, there is a requirement for further education and sharing of information with road users on zigzag lines as a crossing feature Crosswalks with Raised Median and/or Pedestrian Refuge The use of a raised median with a marked crosswalk may provide significantly fewer traffic crashes on multilane roads (Zegeer et al. 2005). Federal Highway Administration (FHWA) guidance reported that pedestrian-refuge areas or raised medians, when placed at pedestrian crossings at marked crosswalks, could reduce 46% of pedestrian vehicle crashes (Lindley, 2008). Raised medians were deemed more suitable on multilane roadways (urban and suburban areas) with higher traffic volume (ADT > 12,000), high or intermediate vehicle speed, and a substantial number of pedestrians (HDOT, 2013; WSDOT, 2014; Lindley, 2008) Danish Offset A Danish offset requires pedestrians crossing divided roadways to cross each direction of traffic separately, which is also known as a Z offset. In the median, channelization requires pedestrians to walk upstream of the traffic they will cross next encouraging awareness of oncoming vehicles. A brief discussion of the Danish offset is available in Appendix B. A study conducted by Pulugurtha and coworkers (Pulugurtha et al. 2012) found that the proportion of pedestrians trapped in the middle of the roadway dropped significantly at both sites studied, and a Danish offset improved significantly the proportion (11%) of diverted pedestrians (those who modified/changed their paths to use a safety measure) at one site. In addition, observations reported a significant increase in the percentage (37% to 44%) of drivers yielding to pedestrians, as well as a significant increase in the distance at which drivers yielded to pedestrians, at both treatment locations. Another study found that the use of a Danish offset significantly improved motorist yielding rate (MYR) (P < 0.001) on multilane roadways with very high traffic (ADT > 40,000) and speed > 30 mph (Pecheux et al. 2009). 3
28 2.1.5 Pedestrian Channelization To determine the efficacy of yield-to-pedestrian channelizing devices (YTPCD) in improving pedestrian safety, Strong and Kumar (2006) analyzed pedestrian and motorist behavior. They found the use of these devices improved pedestrian safety. To the contrary, another study on pedestrian channelization concluded it was not enough to bring change in either motorists or pedestrians yielding behavior (Pulugurtha et al. 2012). They inferred this lack of effect could be due to removal of a portion of the channelization fence by a parcel owner during the experiment period Advanced Stop Line and Sign Several studies found that advanced stop lines and signs increase the percentage of motorists yielding to pedestrians. One study showed that these markings and signs encourage drivers to stop upstream of the crosswalk line at uncontrolled approaches, and they could increase the motorists yielding rate to pedestrians (Houten et al. 2002). At uncontrolled crossing locations, Fitzpatrick et al. (2014(a)) reported that the installation of advanced yield lines and signs have the potential to improve the safety of pedestrians. A study in Las Vegas, Nevada, concluded that the use of advanced yield lines, along with YIELD HERE TO PEDESTRIANS signs, increased the number of drivers yielding to pedestrians. The increase in the number of drivers yielding to pedestrians was significant at locations with five lanes to cross, a speed limit of 35 mph, and an ADT of 17,000 vehicles but not at locations with seven lanes, a speed limit of 30 mph, and an ADT of 43,000 ((Pulugurtha et al. 2010). At an uncontrolled T-intersection, Huybers and coworkers (Huybers et al. 2004) found that placing yield lines and signs in advance of crosswalks on a multilane roadway could reduce the number of vehicle pedestrian crashes and increase drivers stopping distance before the crosswalk In-Street Pedestrian-Crossing Signs A TCRP/NCHRP 2006 project reported that in-street signs have relatively high drivers yielding rates at unsignalized and midblock locations (82% to 91%; average, 87%) on two-lane roads with speed limits of mph (Fitzpatrick et al. 2006). The findings of the project also claimed this treatment is a highly cost-effective way to increase drivers yielding rate at uncontrolled locations. A study conducted in Miami, Florida, found that the use of these in-street signs significantly increased drivers yielding behavior at the crosswalks (from 34% to 78% when signs were placed at the crosswalk, 75% at 20 ft upstream, and 70% at 40 ft upstream), as in-street signs were more visible to motorists. In addition, this study concluded that placing signs at all three locations was no more effective than placing a sign at the crosswalk line. A case study in Las Vegas, Nevada; Miami Dade, Florida; and San Francisco, California, revealed that the implementation of in-street pedestrian-crossing signs increased the drivers yielding rates 13% to 46%. Although this treatment increased drivers yielding rates, the pedestrian 4
29 vehicle conflicts percentage remain unchanged at two of the three locations (Pecheux et al. 2009). Another case study (Strong and Bachman, 2008) in Pennsylvania (Manayunk, Haverford Township, Pottstown, and West Chester) found this treatment to be more effective at unsignalized intersections than at midblock crossings. The researcher observed an improvement in drivers yielding rate between 30% and 34% at uncontrolled intersections and 17% and 24% at midblock crossings. Several other studies at different locations evaluated the effectiveness of this treatment for increasing pedestrian safety. All the studies found this treatment effective to improve pedestrian safety, but its level of significance was different due to the different roadway and traffic characteristic of each study location. Findings suggest that this treatment increases the drivers yielding rate at uncontrolled intersections by 3% to 15% (Huang et al. 2000; Kannel et al. 2003; City of Madison DOT, 1999); 30% to 34% (Strong and Bachman, 2008) ; 13% to 46% (Pecheux et al. 2009)72% to 89% (Bennett and Van Houten, 2016); at midblock crossings by 12% (Huang et al. 2000); 17% to 24% (Strong and Bachman, 2008); and 70% (Bennett and Van Houten, 2016). This treatment was also found to increase drivers compliance to posted speed limits by 20% (Kamyab et al. 2002) Flashing Beacons The Highway Safety Manual (HSM) suggests installing flashing beacons at proper locations may result in significant reductions in the pedestrian-crash rate; however, overuse may lessen their effectiveness (AASHTO, 2010). Flashing beacons can be installed in numerous ways. The experience with flashing beacons has been found to be mixed, as would be expected when they have been installed in different ways (Fitzpatrick et al. 2006). Several previous studies have reported that pedestrian-activated beacons, usually activated by an automated sensor or manual pushbutton, produce a more effective response from drivers than do continuously flashing beacons (Fitzpatrick et al. 2014(a); Fitzpatrick et al. 2006; Van Winkle and Neal, 2000) Pedestrian Hybrid Beacons/High-Intensity Activated Crosswalk Beacons Case studies of high-intensity activated crosswalk (HAWK) beacons show statistically significant improvements in several important safety metrics. One study evaluated the reduction in crashes using before and after crash numbers at 21 sites; findings suggest a 69% reduction in all pedestrian-related crashes, a 15% reduction in severe crashes, and a 29% reduction in total crashes (Fitzpatrick and Park, 2010). The average drivers yielding rates after installation of pedestrian hybrid beacons (PHB) at different locations were found to be different due to varied traffic and roadway characteristics. The average drivers compliance rate was found to be 89% in Texas (Fitzpatrick et al. 2014(b); Fitzpatrick et al. 2014(a)); 97% in Tucson, Arizona (Fitzpatrick et al. 2006; Turner et al. 2006); and 96% in Austin, Texas, and Tucson, Arizona (Fitzpatrick and Pratt, 2016). Several other studies have evaluated yielding compliance, suggesting increases of 18% (Lincoln and Tremblay, 2014); 61% at San Antonio (Brewer et al. 2015); and 63%, 73%, and 42% (Houten et al. 2012) at different study sites. Last, one study found an 83% increase in motorists slowing down when approaching the crosswalk with a HAWK system (Lincoln and Tremblay, 2014). More than 90% of the pedestrians were found to press the pushbutton to 5
30 activate a PHB to cross a road with a posted speed limit of 45 mph and traffic volume of 1,500 veh/hr or more (Fitzpatrick and Pratt, 2016). Motorists perceptions are sometimes wrong regarding the function of the different phases of a PHB. A Kansas survey reported that only 42.4%, 66.7%, and 75.8% of motorists well understood the flashing red signal and the steady and flashing yellow signals, respectively (Godavarthy and Russell, 2010). Another study (Hunter- Zaworski and Mueller, 2012) also found a considerable lack in motorists proper understanding of PHB-operation phases Rectangular Rapid Flashing Beacons The FHWA carried out a series of five experiments at twenty-two sites in three U.S. cities (St. Petersburg, Florida; Washington, DC; and Mundelein, Illinois) to examine the effects of rectangular rapid flashing beacons (RRFBs) on drivers yielding behavior. These studies show that the rectangular, light-emitting diode (LED), yellow RRFBs appear to be an effective tool for producing large numbers of drivers yielding right-of-way to pedestrians in crosswalks at sites where drivers rarely yielded to pedestrians (FHWA, 2010(a)). The outcomes of the contemporary study imply that the RRFB used in conjunction with advanced yield marking can increase yielding and may increase safety at uncontrolled crosswalks at high-adt multilane sites (FHWA, 2010(a)). Shurbutt and coworkers (2008) advocate that the RRFB system is more effective at night than during the day. Ross et al. (2011) noted that one study on RRFB at two sites in Portland, Oregon on a four-lane road with a median island and a posted speed of 45 mph showed 62% increase in yielding. Evasive conflicts also were reduced between 5.8% and 8.9%. Another study by Brewer and coworkers (2015) observed an increase in drivers yielding rate by 35% to 80% following the installation of RRFBs at an unsignalized intersection In-Roadway Warning Lights According to Huang (2000), pedestrian-activated, in-roadway warning lights are conceptually thought to be more effective than continuous flashers because pedestrian-activated flashers convey real-time information. The effectiveness of flashing crosswalks depends on parking activity in the area, how long lighting units flash, traffic volume, and pedestrian activity on sidewalks proximate to the crosswalk (Whitlock & Weinberger Transportation, Inc., 1998). A study of flashing crosswalks included six cities across California and two locations in Washington. Results showed that, during nighttime, drivers yielding percentage to pedestrians was significantly higher at crosswalks with lighting units than at conventional crosswalks. Drivers were observed as more likely to apply breaks earlier at flashing crosswalks than at conventional ones (Whitlock & Weinberger Transportation, Inc., 1998). In response to an unusually high incidence of vehicle collisions, the city of Santa Rosa, California, installed in-pavement flashing-light systems at three locations between 1994 and An evaluation at these three locations showed an enhancement in driver awareness and a reduction in vehicle or pedestrian collisions (Godfrey and Mazzella, 1999). A case study (Huang, 2000) at two uncontrolled pedestrian crossings in Florida, after the installation of inpavement flashing lights, produced mixed results. The researcher observed a 6% reduction in 6
31 drivers yielding rate to pedestrians at one place; but at another place, drivers yielding rate increased by 11.5% after the installation of in-pavement flashing lights. Other case studies of inpavement flashing lights (at McAbee Road, San Jose, California) estimated an increase in drivers yielding between 34% and 42% during the daytime and between 67% and 75% during nighttime (Malek, 2001) Grade-Separated Crossings In 1965, a study by Moore and Older (Moore abd Older, 1965) concluded that the use of underpasses and overpasses by pedestrians depended on walking time and walking distances of the facility. They found 95% of pedestrians were very likely to use the facility if a convenience value (ratio of the required time to cross the street using an overpass divided by the required time to cross at street level) is equal to 1. They also found that no pedestrians would use the overpass if the value of the ratio was 1.5 or more. Additionally, the use of underpasses was not as significant as that of overpasses with similar values of convenience. At an intersection, the use of an overpass on one leg and marked crosswalk on another leg of a major road could be more effective than using crosswalks on both legs to reduce vehicle pedestrian crashes (Ma et al. 2010). Campbell et al. (2004) conducted a survey in San Francisco, California, among people with a disability to ascertain the accessibility of an underpass or overpass and found several elements such as lack of adequate railings, level resting areas, sound screening, and sight distance to opposing pedestrian flow that obstruct the use of grade-separated crossings for users with disabilities Pedestrian User-Friendly INtelligent (PUFFIN) Crossings A brief discussion of the PUFFIN crossing is available in appendix B. This treatment does not comply with the IL MUTCD and should be considered only for experimental or research purposes. The Northern Ireland Department for Regional Development (Northern Ireland Department for Regional Development, 2011) stated: PUFFIN crossings offer both enhanced safety and traffic flow features. Maxwell et al. (2010) reported that the use of PUFFIN crossings can reduce delays for both drivers and pedestrians at intersections and improve pedestrian comfort. They studied the crash data at 40 midblock crossing locations and 10 intersections throughout England, finding that the conversion from Pedestrian-Light-CONtrolled (PELICON) crossings and far-side pedestrian signals at junctions to PUFFIN crossings with Automated Pedestrian Detectors (APD) reduced pedestrian-injury collisions by 24%. Researchers have noted that it is difficult to extrapolate these findings to the United States because the U.S. approach to pedestrian safety is very different from that in England (Markowitz and Montufar, 2012) Curb Extensions Curb extensions can be used to improve pedestrian safety at uncontrolled crossing locations (Turner et al. 2006) and have been studied around the world (Campbell et al. 2004). Researchers found curb extensions, such as bulb-outs, reduced vehicle speeds during studies in Canada (Macbeth, 1995) and Oosterhout, Netherlands (Campbell et al. 2004). Macbeth (1995) said installing bulb-outs in seven midblock locations in Canada decreased speeds to 19 mph for 7
32 80% of the vehicles. The Oosterhout study found a significant reduction in the 85th-percentile vehicle speed after installation of curb extensions (Campbell et al. 2004). Similar to curb extensions, a wombat crossing (a raised platform with a marked crosswalk on top and bulbouts) was evaluated and found to reduce the 85th-percentile vehicle speed by 40% (Hawley et al. 1992). By contrast, curb extensions were found to cause no decrease in vehicle speeds in Eltham, Victoria; Keilor, Queensland, Australia (Hawley et al. 1992); De Meern, Netherlands (Campbell et al. 2004); or Cambridge and Washington, USA (Huang and Cynecki, 2001) Pedestrian Crossing Flags A brief discussion of pedestrian-crossing flags is available in Appendix B. A project conducted by the Transit Cooperative Research Program and the National Cooperative Highway Research Program (TCRP/NCHRP) reported that pedestrian-crossing flags in Salt Lake City, Utah, and Kirkland, Washington, were found to be moderately effective on two-lane roadways with lower traffic volume: motorists compliance rates were 79% and 46% on a two-lane roadway with a posted speed of 25 mph and a six-lane roadway with a posted speed of 35 mph, respectively (Fitzpatrick et al. 2006; Turner et al.2006). In 2008, the Seattle Department of Transportation (SDOT, 2016) installed pedestrian-crossing flags at 17 crosswalk locations to evaluate motorists compliance to pedestrians. They found that, although flags increased the visibility of the pedestrians to motorists, they failed to provide a consistent pattern of increased compliance. At some places, the study failed to evaluate the effectiveness of flags in safety improvement due to frequent theft of the flags. 2.2 PEDESTRIAN-CROSSING WARRANTS, POLICIES, AND GUIDELINES Even though a comprehensive guideline for pedestrian-crossing treatments at uncontrolled locations does not exist, there are a few warrants, policies, and criteria treatments. In the following section, the research team provides a short summary of currently available guidelines, warrants, and policies for pedestrian-crossing treatments issued by national, state, and local transportation agencies National Warrants and Guidelines The primary sources guiding the design of pedestrian-crossing treatments include the following documents: Federal Highway Administration, Manual of Uniform Traffic Control Devices (MUTCD), Federal Highway Administration, Pedestrian Facilities Users Guide Providing Safety and Mobility, Washington, DC, Federal Highway Administration, Safety Effects of Marked versus Unmarked Crosswalks at Uncontrolled Locations: Final Report and Recommended Guidelines, Washington, DC,
33 Federal Highway Administration, United States Department of Transportation Policy Statement on Bicycle and Pedestrian Accommodation Regulations and Recommendations, Federal Highway Administration, Design Guidelines: Accommodating Bicycle and Pedestrian Travel A Recommended Approach, A US DOT Policy Statement on Integrating Bicycling and Walking into Transportation Infrastructure, American Association of State Highway and Transportation Officials, Highway Safety Manual, 1st ed., Washington, DC, American Association of State Highway and Transportation Officials, Guides for the Planning, Design, and Operation of Pedestrian Facilities, Washington, DC, TCRP Report 112/NCHRP Report 562, Improving Pedestrian Safety at Unsignalized Crossings, Washington, DC, 2006 Institute for Transportation Engineers (ITE), Designing Walkable Urban Thoroughfares: A Context-Sensitive Approach, Institute for Transportation Engineers (ITE), Traffic Control Devices Handbook, Zegeer and coworkers (2005) recommended some guidelines for safer pedestrian crossing based on multi-criteria territory analysis. They studied five years of pedestrian-related crash data in 1,000 marked crosswalks and 1,000 unmarked crosswalks in 30 U.S. cities. This guidance broadly considered four parameters, i.e., speed range, ADT, number of lanes, and median type. This study suggested that the marked pedestrian crosswalks may be used to define preferred pedestrian paths at locations with stop signs and at uncontrolled locations where engineering judgment justifies that the number of lanes, pedestrian exposure, ADT, posted speed limit, and geometry of the location are suitable for specially chosen crosswalks. Although pedestrianrelated crash data is cited within, the real application of the guideline overlooked this factor. Fitzpatrick et al. (2006) authored recommendations co-sponsored by the NCHRP and TCRP. In a flowchart, their document suggests a step-by-step process to warrant the pedestrian-crossing treatments. In summary, the first step guides practitioners to select the most appropriate worksheet, one for speeds 35 mph or less and the other for higher speeds. Minimum pedestrian volume is checked in the next step. If the minimum pedestrian volume for the peak hour is fewer than 20 pedestrians for both directions, geometric improvements such as median refuge islands and curb extensions can be considered. If the minimum pedestrian volume is exceeded at a location, the authors recommend referring to the IL MUTCD signal warrants to determine whether to consider a signal or beacon. If no signal warrants are met, pedestrian delay should be estimated; and appropriate treatment selected based on the pedestrian delay and expected motorist compliance. ITE s Designing Walkable Urban Thoroughfares (ITE, 2010) provides comprehensive design guidance on raised-median/pedestrian-refuge islands (e.g., minimum width, median nose, trees, and landscaping) for crossings in urban and rural settings. 9
34 2.2.2 State Warrants and Guidelines On the state level, warrants and guidelines for pedestrian-crossing treatments are prepared by corresponding state departments of transportation (DOTs). State DOTs usually follow national guidelines and policies. Additionally, DOTs might conduct research to measure the efficacy of contemporary pedestrian-crossing treatments and to set some new practices. The Arizona Department of Transportation (ADOT, 2015) has established some warrants for the installation of marked crosswalks. This guideline was established based on four factors gap time, pedestrian volumes, vehicle approach speed, and general conditions. Each of these factors has certain points to justify the warrant of a marked crosswalk. The maximum achievable point for the warrant is 33; and a marked crosswalk may be installed when 16 or more points are accrued, with pedestrian volume being one of the factors. A number of special treatments are available to increase pedestrian safety at uncontrolled crossing locations. The Virginia Department of Transportation s (VDOT s) Traffic Engineering Division has classified these special treatments into five levels (VDOT, 2004). Level 1 devices are generally less costly and recommended in locations with potentially lower levels of pedestrian vehicle conflict. Level-2 to -5 devices are relatively costly and recommended at crossing locations with an ascending order of potential pedestrian vehicle conflicts. In addition to classifying pedestrian-safety treatments, VDOT has also commissioned research to develop guidelines for the installation of in-roadway warning lights (IRWL). According to this study, IRWL should be considered in a location where a marked crosswalk has been proven inefficient to address pedestrian-safety problems alone. In such cases, IRWL may be used along with a marked crosswalk. However, IRWL should not be used at pedestrian crossings at controlled locations. Along with the above-mentioned criteria, the 85th-percentile speed of the vehicles approaching the crosswalk from either direction should not be more than 45 mph; the ADT on the cross street should be between 5,000 and 30,000 vehicles per day; and the crossing volume should be at least 100 pedestrians per day to justify the installation of IRWL (Arnold, 2004). Current policy of the New York State Department of Transportation (NYSDOT) policy is harmonic with federal recommendations and design guidance. The NYSDOT s Highway Design Manual (2015) provides some narrative guidelines for pedestrian-facility design in chapter 18. The manual provides some guidelines for installation of midblock crossings, curb extensions, pedestrian-refuge islands or medians, advanced stop line and signs, and marked crosswalks. The Washington State Department of Transportation s Traffic Manual (2015) provides some narrative guidance for pedestrian facilities. The document has recommendations for determining pedestrian-crossing markings based on lane configuration, vehicular traffic volume, and traffic speed. The manual suggests installing marked crosswalks at intersections and at locations with a high pedestrian volume, including midblock locations, but forbids the use of marked crosswalks at remote locations or on roads with a speed limit over 35 mph. The Traffic Manual also provides some guidelines for installing curb extensions but forbids extensions beyond the parking lane or on streets with high-speed traffic (35 mph or more). The Florida state DOT publishes its own Traffic Engineering Manual. The most recent version was issued in 2015 and considers the use of a raised median or refuge island at crossings with 10
35 an ADT more than 12,000 or if road-crossing distances exceed 60 ft, unless the crossing is controlled by a pedestrian hybrid signal or pedestrian signal (FDOT, 2016). The Illinois DOT-published Bureau of Design and Environmental Manual (BDE) provides some guidance for sidewalk-installation warrants and sidewalk design. The BDE does not establish standards for designing pedestrian-crossing treatments Local Warrants and Guidelines Local warrants and guidelines commonly consolidate information already required or recommended by the IL MUTCD and state DOTs, or supported by FHWA research. The following local transportation agencies are known to have some guidelines regarding pedestrian safety: Chicago Department of Transportation (CDOT), Pedestrian Action Plan, 2012 City of Boulder, Colorado, Pedestrian Crossing Treatment Installation Guidelines, 2011 San Diego Association of Governments, Planning and Designing for Pedestrians: Model Guidelines for the San Diego Region, June 2002 City of Oakland, Pedestrian Master Plan, November 2002 City of Sacramento Public Works Department, Pedestrian Safety Guidelines, January 2003 Maricopa County, Pedestrian Policies and Design Guidelines, April 2005 City of Santa Barbara Department of Public Works, Santa Barbara Pedestrian Master Plan, July 2006 County of Sacramento Department of Transportation, Sacramento County Pedestrian Design Guidelines, February 2006 City of San Francisco, Better Streets Plan [DRAFT], June 2008 City of Berkeley, Berkeley Pedestrian Master Plan, 2010 City of Charlotte, Pedestrian Master Plan [DRAFT], February 2009 Chicago Department of Transportation, Complete Streets Chicago: Design Guidelines, 2013 Many of these documents strive toward user-friendliness and provide flowcharts describing the methods. Here, we describe the processes proposed by CDOT and the City of Boulder as examples of local policies/guidelines. Marked crosswalks under the jurisdiction of the city of Chicago should be installed at stopcontrolled intersections and at each leg of signalized intersections. At midblock or uncontrolled locations, crosswalks should be installed with extra pedestrian-safety treatments, such as a raised median or refuge islands, bulb-outs, and signage. Marked crosswalks should be highly visible to the road user. In-roadway State Law, Stop for Pedestrians signs can be installed at midblock locations and unsignalized intersections to ease pedestrian road crossing; and they 11
36 should be installed in the refuge island, median, lane line, or centerline at the crosswalk location. Pedestrian hybrid beacons (PHBs) can be considered for pedestrian-crossing locations with high pedestrian volumes and higher crash rates through an engineering study based on criteria in the IL MUTCD. RRFBs can be installed at midblock crossing and uncontrolled pedestrian-crossing locations that have high pedestrian volumes, high crash rates, or insufficient time for pedestrians to cross the road; or where the width of the roadway makes it hard for pedestrians to cross the road safely. CDOT has adopted a pedestrian-first modal hierarchy. All transportation programs and projects, from planning to maintenance, are to give preference to pedestrians, then transit, bicycle, and auto. CDOT s complete street-design guidelines introduced a three-step process for locating and designing pedestrian-crossing facilities. The process recommended is first to locate the crossing according to the pedestrian network. Selecting a pedestrian-crossing location is based on two simple rules: it should be located where pedestrians want to cross and where drivers can reasonably expect pedestrians to cross. It does not follow specific rules for crossing spacing, such as a 150-ft distance. CDOT locates crossings based on the walking network, not on the driving network. It also locates crosswalk at locations where planners expect pedestrians will want to cross where it is most expedient, convenient, and efficient to the pedestrian s destination. The location of street crossing is greatly influenced by the land-use context. The second step is to determine the crossing-treatment type (signal, refuge islands, marked crosswalk, lighting, etc.). These guidelines provide details for marked-crosswalk installation based on vehicles posted speed limits, ADT, and roadway characteristics. It also suggests that on roads with three or more lanes, high-speed limits, and high-traffic-volume raised crosswalk should not be used alone. Accompanying treatments could include lane-narrowing, medians, overhead signs, and advanced stop lines. The CDOT street guide provides some guidelines regarding the width and length of refuge islands and other features that should be included within them to protect people waiting to cross the road. This guide also suggests lighting unsignalized crosswalks as brightly as signalized intersections. The last step is to design the details of each crossing and its operation after setting the location and type. These details could include the minimum width of the crosswalk and requirements of pedestrian ramps. The Boulder Transportation Division (CBTD, 2011) proposed a set of criteria and guidelines for considering the installation of crossing treatments at uncontrolled locations. These guidelines suggest that the evaluation process of an individual crossing location for potential crossing treatments should include four basic steps. First, the identification and description of the crossing location should be detailed. In the second step, the physical characteristics of the crossing location are determined. The third step involves the collection of traffic data and the observation of operational characteristics of the crossing location. This study developed a flowchart and a corresponding table to justify the installation of a specific crosswalk treatment. In the fourth step, the information (such as ADT, vehicle speed, distance of nearest marked or protected crossing, and pedestrian volume) obtained in the first three steps is utilized in the developed flowchart and table to determine if the crosswalk treatment is necessary for a location and, if necessary, then which type of crosswalk treatment would be most appropriate. 12
37 2.3 SUMMARY OF LITERATURE REVIEW Various factors influence the behavior of drivers and pedestrians. Because pedestrians are vulnerable to more severe injuries during crashes, a great number of studies have attempted to predict the safety benefits of a variety of treatments. Studies generally agree that the following treatments can improve pedestrian safety at crossings: raised medians/pedestrian-refuge islands; Danish offsets; advanced stop lines and signs; in street crossing signs; flashing beacons, including PHBs and RRFBs; and IRWL. Past research has been contradictory about the performance of the following pedestrian-crossing treatments for road crossings: using only paint striping; pedestrian channelization, and curb extensions. Although guidance is available at the national level, limited information exists about pedestrian crossings at uncontrolled locations. Further, many states have already established their own manuals to guide practitioners toward consistent treatment of pedestrian safety. Overall, the findings of this literature review support the need for developing a guide for transportation practitioners throughout Illinois and for informing practice with the latest research on the effectiveness of various safety treatments. 13
38 PERCENTAGE OF INTERVIEWEES AGREEING CHAPTER 3: SURVEY AND INTERVIEW FINDINGS 3.1 INTERVIEW RESULTS: During the winter, the researchers interviewed personnel at the Illinois Department of Transportation (IDOT). The first part of the interview asked the respondents what resources they referred to for crosswalk warrants, what factors they considered for crosswalk installation, and what factors the researchers should include in the guidebook that would be developed as the final outcome of this project. The findings from these interviews were analyzed, and the following section describes the findings. The interview questions are included in Appendix C Warrants for Marked Pedestrian Crosswalks The first question of the interviews asked, What resources does your agency refer to for guidance when determining if a pedestrian crossing is needed at uncontrolled locations? In response to this question, interviewees reported that the Manual on Uniform Traffic Control Devices (MUTCD) was the most used resource for uncontrolled crossing warrants (see Figure 1). Most of the respondents reported referring to IDOT s Bureau of Design and Environmental (BDE) Manual (82%). Other guides included The design of walkable urban thoroughfares (ITE), NACTO, FHWA documents, safety workshops, the Americans with Disability Act (ADA), accessible public right-of-way, proposed accessibility guidelines for pedestrian facilities in the public right-of-way, the IDOT speed-limit policy, and the Chicago pedestrian action plan. Documents internal to the agency, personnel expertise, and suggestions from consultants were less frequently used (30% to 42% of the interviewees). 100% 80% 60% 40% 20% 0% Factors Considered Figure 1. Resources referred to for crosswalk warrants. Next, the researchers asked, What factors are considered when your agency installs a new crosswalk at an uncontrolled location? All the respondents reported considering vehicle speeds, location of alternative nearby crosswalks, ADT, pedestrian volumes, and suggestions of 14
39 Pedestrian volumes Vehicle speeds Nearby crosswalks ADT Suggestions (decision makers) Nearby traffic signals Pedestrian attractions Crossing distance ADA constructability Presence of schools Pedestrian fatalities Vehicle sight distance Suggestions (agency engineers) Pedestrian vehicle crashes Presence of transit stops Suggestions (local citizens) Suggestions (agency planners) Pedestrian complaints Traffic-calming measures Age of pedestrian Pedestrian delay Motorist compliance Study finding Community population Sidewalks Land use context Bike path and visibility PERCENTAGE OF INTERVIEWEES AGREEING decision makers (Figure 2). Of the respondents, 91% reported considering the location of traffic signals relative to the site, pedestrian attractions, number of lanes, and ADA constructability. Many of the interviewees considered the presence of schools (82%), history of pedestrian fatalities due to vehicle crashes (82%), vehicle sight distance (79.5%), suggestions of agency engineers (79.5%), and history of pedestrian vehicle crashes (73%). Most interviewees also considered the presence of transit stops (70.5%), suggestions of local citizens (70.5%) and agency planners (70.5%), history of pedestrian complaints (61%), and presence of trafficcalming measures (i.e., raised medians, curb extensions) (52%). Fewer reported considering the age/experience level of pedestrians, estimated pedestrian delay, and expected compliance. 100% 80% 60% 40% 20% 0% Figure 2. Factors considered for crosswalk warrants. Next, the interviewees were asked, To what extent are those factors (from the previous question) considered to make a project-level decision for installing a crosswalk at an uncontrolled location during the past three years? All the interviewees reported considering the location of alternative nearby crosswalks in making decisions for crosswalk installation (Figure 3). Of the respondents, 90% were found to consider ADT and pedestrian volumes, suggestions from local decision makers (e.g., mayors and administrators), vehicle speeds, and location of alternative nearby traffic signals in making a crosswalks decision. Many of the interviewees reported considering the number of roadway lanes (90%), history of pedestrian fatalities due to vehicle crashes (72%), history of pedestrian vehicle crashes (72%), presence of 15
40 Nearby crosswalks ADT & Pedestrian volumes Suggestions (decision makers) Vehicle speeds Nearby traffic signals Crossing distance Pedestrian attractions Pedestrian fatalities Pedestrian vehicle crashes Presence of schools Vehicle sight distance Presence of transit stops Suggestions (agency engineers) ADA constructability Suggestions (agency planners) Suggestion (local citizens) Pedestrian complaints Traffic-calming measures Motorist compliance Study findings Community population Pedestrian delay Sidewalks Age of pedestrian On-street parking removal Land use context Bike path & visibility PERCENTAGE OF INTERVIEWEES schools (70%), vehicle sight distance (70%), and presence of transit stops (70%). Most of the respondents considered suggestions of agency engineers (61%), ADA constructability (61%), and suggestions of agency planners (52%). Strongly Agree (%) Agree (%) Neither (%) Disagree(%) Strongly Disagree (%) 100% 80% 60% 40% 20% 0% Figure 3. Factors considered in making project-level decisions for installing uncontrolled crossings Factors to be included in the final guidelines The last question of the first section asked the interviewees: What information would you consider important to include in an IDOT guide for selecting uncontrolled pedestrian crossing locations? Vehicle speeds and number of roadway lanes were considered important by a large percentage of the interviewees (Figure 4). Other factors including ADT and pedestrian volumes, alternative nearby crosswalks, suggestions of decision makers, presence of schools, presence of frequent pedestrian attractions, vehicle sight distance, presence of transit stops, and ADA constructability were suggested by 43% to 55% of the respondents as important to include in the guidebook for deciding crossing locations. Details about other factors rated lower by interviewees can be found in Appendix C. 16
41 PERCENTAGE OF INTERVIEWEES 100% 80% 60% 40% 20% 0% Figure 4. Top factors suggested by interviewees as important to include in the guide Crosswalk Design The next part of the interview solicited information about how IDOT engineers consider design decisions when a crosswalk is warranted. The first question in this section asked, What resources does your agency refer to for guidance when designing pedestrian crossings at uncontrolled locations? The MUTCD was reported as the most referenced resource for designing crosswalks at uncontrolled locations (91%), as shown in Figure 5. The Illinois BDE Manual was the second (73%), and other resources were used less frequently. 17
42 PERCENTAGE OF INTERVIEWEES 100% 80% 60% 40% 20% 0% Figure 5. Resources referred to for designing uncontrolled crossings Treatments Considered The second question of this section asked the interviewees, What treatments do you commonly consider for improving pedestrian crossing safety? Signage, standard striping, and flashing beacons were reported to be the most often considered (100%) safety treatments (Figure 6). Most respondents also referred to using supplemental signage (91%), pedestrianrefuge islands (73%), bulb-outs (64%), and restricting on-street parking (55%) to improve pedestrian safety at uncontrolled locations. Lighting of crosswalks and nontraditional striping were also considered for safety improvement by 36% to 43% of the interviewees, respectively. The use of a raised crosswalk and in-street stop signs was rare. Zigzag pavement marking, reflectors and raised pavement markings (RPMs), flashing RPMs, and PUFFIN crossings were not considered by the respondents. Some of the interviewees were unfamiliar with PUFFIN crossing treatments and zigzag pavement marking. Interviews revealed that flashing RPMs were not considered due to maintenance issues. 18
43 PERCENTAGE OF INTERVIEWEES AGREEING 100% 80% 60% 40% 20% 0% Figure 6. Treatments commonly considered to improve pedestrian safety. Among flashing beacons, the pre-timed were most frequently considered to improve pedestrian safety in school zones. Of the respondents, 73% reported using pre-timed flashing beacons. Fewer reported considering pedestrian-activated (36%) or continuous flashing (55%) beacons. The use of PHBs (25%) and RRFBs (27%) was also less frequent. Among the different types of crosswalk striping, the most commonly used were parallel lines (73%) and ladder patterns (64%). Only 36% of the respondents reported considering the continental pattern at uncontrolled locations Importance of Treatments Next, the interviewees responded to the question, For designs, how important were each of the above treatments considered for crosswalks at uncontrolled locations during the past three years? For uncontrolled crosswalk design, all respondents strongly agreed or agreed that signage and standard striping were important safety treatments (Figure 7). Many respondents also considered supplemental signage (91%), flashing beacons (64%), and pedestrian-refuge islands (57%) to be important. Approximately 50% of the interviewees were found to consider restricting on-street parking and bulb-outs. PUFFIN crossings were not frequently considered, possibly due to the interviewees unfamiliarity with them. Around 10% of the interviewees 19
44 PERCENTAGE considered other treatments, including raised crosswalks and in-street stop-for-pedestrian signs as being important for pedestrian safety. 100% Strongly Agree (%) Agree (%) Neither (%) Disagree (%) Strongly Disagree (%) 80% 60% 40% 20% 0% Figure 7. Treatments considered important for safety at uncontrolled crossing locations Input to the Guidelines In response to the question, What information would you consider important to include in a guide for designing pedestrian crossings at uncontrolled locations? many of the respondents reported standard striping (80%), signage (80%), and supplemental signage (71%). Around half of them reported flashing beacons, refuge islands, and bulb-outs as important treatments. Crosswalk lighting and refuge islands were considered to be important by 36% and 34% of the respondents, respectively. A smaller percent of the interviewees reported crosswalk visibility, pedestrian volumes, raised crosswalk, in-street stop-for-pedestrian signs, and road diets (lane reductions) were important crossing design elements to include in the proposed guidebook Summary of Interview Findings The MUTCD and the BDE Manual were the resources most used for crosswalks warrants, as well as for design guidance. Other resources included FHWA documents, the AASHTO guide, pedestrian plans, ITE guides, personnel experience, and a complete street guide. For crosswalk warrants, considerations included vehicle speed, alternative nearby crosswalks, pedestrian volume, and suggestions from decision makers (i.e., mayors). Many of the interviewees also considered the location of traffic signals relative to the site (91%), pedestrian 20
45 attractions (91%), number of lanes/crossing distance (91%), ADA access (91%), presence of schools (82%), history of pedestrian fatalities due to vehicle crashes (82%), and vehicle sight distance (79.5%). The use of many other factors, such as the history of pedestrian vehicle crashes and traffic volume were found to be less important. For an IDOT guidebook on uncontrolled pedestrian crosswalks, many respondents suggested considering the following factors: varied traffic and roadway characteristics such as vehicle speeds (73%), roadway-crossing distance (73%), ADT and pedestrian volume (55%), nearby traffic signals (55%), location of alternative nearby crosswalks (55%), decision makers suggestions (55%), presence of schools (55%), and pedestrian attractions (55%). All IDOT districts and CDOT are currently using signage, standard striping, and flashing beacons to improve pedestrian safety at midblock and uncontrolled crossing locations. Parallel-striped lines and ladder patterns were used more frequently than the continental pattern. Among beacons, pre-timed flashing beacons were most common and usually approved for school zones. Most interviewees considered using supplemental signage (91%), pedestrian-refuge islands (73%), and bulb-outs (64%), and restricting on-street parking (55%) to improve pedestrian safety at uncontrolled locations. For the design guidebook for uncontrolled locations, 71% to 80% of the respondents considered standard striping, signage, and supplemental signage very important to be included. 3.2 SURVEY ANALYSIS The research team also conducted an online survey to gather further information on current practice of pedestrian-treatment deployments in different cities and counties throughout Illinois. The survey was distributed via to engineers at Illinois local agencies, cities/municipalities, and counties. These participants were suggested by IDOT personnel. The survey was launched in November 2015 and remained open until March The survey format was similar to that of the interviews, and the questions are included in Appendix C. Overall, 13 respondents completed the survey. In response to the question, What resources does your agency refer to for guidance when determining if a pedestrian crossing is needed at uncontrolled locations? the MUTCD was reported as the resource most used for pedestrian-crossing decisions. Of the respondents, 86% and 14% reported using it always and sometimes, respectively (Figure 8). Recommendations from consulting engineers were always or sometimes used by 93% of the respondents. Most respondents sometimes or always referred to personnel expertise (86%) and FHWA documents (71%). Many respondents also reported using documents internal to the agency (57%); these are prepared from the MUTCD, FHWA documents, the BDE manual, and pedestrian plans issued by different states. Few reported using other resources. 21
46 PERCENTAGE OF RESPONDENTS 100% 80% 60% 40% 20% 0% Always Sometimes Planned Never Not applicable/unknown Figure 8. Resources referred to for crossings guidelines/policies. The next question asked respondents, What factors are considered when your agency warrants installing crosswalk at an uncontrolled location? Many factors were reported, as shown in Figure 9. Of the respondents, 100% reported considering (always/sometime) the number of roadway lanes, location of traffic signals relative to the prospective site, vehicle sight distance, pedestrian vehicle crashes history, pedestrian volumes, vehicle speeds, history of pedestrian fatalities, crossing distance, presence of frequent pedestrian attractions, presence of transit stops, expected motorist compliance, suggestions from agency planners, suggestions from decision makers, suggestions from agency engineers, and history of pedestrian complaints. Other factors such as alternative nearby crosswalks, the presence of traffic-calming measures, estimated pedestrian delay, and suggestions from local citizens were considered for crossing-locations decisions by 92% of the respondents. 22
47 PERCENTAGE OF SURVEY RESPONDENTS PERCENTAGE OF RESPONDENTS 100% 80% 60% 40% 20% 0% Always Sometimes Planned Never Not applicable/unknown Figure 9. Factors considered as warrants for crosswalk locations. The last question of the first section asked, What information would you consider most important to include in a guide for selecting uncontrolled pedestrian crossing locations? No significant trend was found among the reported factors. Only 29% of the respondents reported a step-by-step process that included factors/parameters for selecting or rejecting a certain treatment as important for selecting uncontrolled crossing locations (Figure 10). A few respondents reported other factors, such as the location of nearby traffic signals (14%). 100% 80% 60% 40% 20% 0% Figure 10. Factors considered important to include in the guidebook. The next part of the interview explored information about how city or county engineers consider design decisions when a crosswalk is warranted. The first question asked the respondents, What resources does your agency refer to for guidance when determining if a pedestrian crossing is needed at uncontrolled locations? The MUTCD and recommendations 23
48 PERCENTAGE OF SURVEY RESPONDENTS from consulting engineers were reported (always/sometimes) by all the respondents (Figure 11). Of the respondents, 92% reported using personnel expertise for crosswalks design; many used FHWA documents (other than the MUTCD) (77%) and unpublished documents from other agencies (54%). Always Sometimes Planned Never Not applicable/unknown 100% 80% 60% 40% 20% 0% Figure 11. Resources referred to for design of crosswalks at uncontrolled locations. The next question asked the respondents, What treatments do you commonly consider for improving pedestrian crossing safety? Signage, supplemental signage, and lighting were always/sometimes considered for pedestrian safety at crossings by all the respondents (Figure 12). Safety treatments such as standard striping, pedestrian-activated flashing beacons, onstreet parking restrictions, pedestrian-refuge islands, continuously flashing beacons, and RRFBs were always or sometimes used or planned for use by 100% of the respondents. Many of the respondents reported considering PHBs (62%), RPMs (54%), and bump-outs (54%) as safety treatments. Around one-third considered nontraditional pavement striping. 24
49 PERCENTAGE OF SURVEYEE PERCENTAGE OF SURVEYEE Always Sometimes Planned Never Unfamiliar/Unknown 100% 80% 60% 40% 20% 0% Figure 12. Treatments commonly considered for pedestrian safety at crossings. The last question of the second section asked, What information would you consider important to include in a guide for designing pedestrian crossings at uncontrolled locations? No significant trends were found among the suggestions (Figure 13). 100% 80% 60% 40% 20% 0% Figure 13. Information suggested as important to include in the guide for uncontrolled crossings design. 25
50 CHAPTER 4: CRASH-DATA ANALYSIS The crash-data analysis work involved two main tasks. First, a statistical analysis of crash data was conducted to identify contributing factors for pedestrian crashes at uncontrolled locations in Illinois. An uncontrolled location is defined as any location where vehicular traffic is uncontrolled by traffic control devices. Herein, midblock locations and intersection approaches without traffic signals or stop/yield signs are termed uncontrolled locations. Here, crashes that occurred at such locations are referred to as pedestrian crashes. Second, a spatial analysis of GIS-based crash data was performed to identify segments of high pedestrian crashes in Illinois. This task was divided into five subtasks. This chapter summarizes the procedures adopted in accomplishing each subtask and presents their results, followed by final recommendations based on the whole data analysis task. The five subtasks involved in data analysis work were 1. Identifying variables in the IDOT crash databases to define pedestrian crashes 2. Conducting a preliminary statistical analysis to reveal the general characteristics of pedestrian crashes in Illinois 3. Conducting further statistical analysis to determine if the identified contributing factors are statistically significant 4. Identifying the high-crash locations for further field review 4.1 IDENTIFICATION OF VARIABLES TO DEFINE PEDESTRIAN CRASHES The objective of this subtask was to create a single database that contains information on crash, pedestrian, driver, and vehicle characteristics pertaining to pedestrian crashes at uncontrolled locations. This database was created from the original crash database provided by IDOT and used for all subsequent statistical analyses. The original crash data obtained from IDOT contained information on all types of crashes that occurred in Illinois between 2010 and For each year, the database was split into three separate datasets: crash data, person data, and vehicle data. Figure 14 illustrates the flowchart for extracting pedestrian crashes from IDOT s original crash data. The first step in defining pedestrian crashes was to merge five annual datasets into a single database. This process was done by joining all annual crash datasets using Microsoft Excel. The resultant database will be referred to as the crash database. A similar procedure was followed for the person and vehicle datasets, resulting in a person database and a vehicle database, respectively. 26

51 Figure 14. Flowchart for defining pedestrian crashes. In the second step, general pedestrian crashes were separated from other types of crashes in the crash database using the variable CollisionTypeCode. This variable describes the type of collision for each entry in the crash dataset. When the value of CollisionTypeCode equals 1, it reflects a general pedestrian crash. All crashes with the value of CollisionTypeCode as 1 were extracted from the crash database to create a database containing, exclusively, general pedestrian crashes. Later, in the third step, pedestrian crashes at uncontrolled locations were separated from general pedestrian crashes. The variables TrafficControlDevice and IntersectionRelated were used to do this. In this project, a location where neither a traffic signal nor a stop sign was 27
52 present was defined as an uncontrolled location. In line with this definition, all pedestrian crashes that did not have TrafficControlDevice coded either as Traffic Signal or Stop were separated from the general pedestrian crashes. From the crashes thus obtained, all entries coded as IntersectionRelated = N, where N means No, were extracted. The resultant crashes were considered pedestrian crashes at uncontrolled locations in Illinois. In the fourth step, pedestrian crashes that occurred at stop/yield-sign-controlled intersections were separated from general pedestrian crashes. In this step, all crashes coded as TrafficControlDevice = Stop, Yield and IntersectionRelated = Y, where Y means Yes, were filtered from general pedestrian crashes. The resultant crashes were joined with the crashes obtained at the end of step 3. The combined product of steps 3 and 4 was referred to as the pedestrian crash database. The objective of the fifth step was to update the pedestrian-crash database to include relevant information on pedestrian and vehicle characteristics. This process was accomplished using a variable, Illinois Crash Number (ICN), common for all three databases. An ICN is a unique identification number assigned to every crash that occurred in Illinois. If an entry in the pedestrian crash database shares its ICN value with another entry in the person or vehicle database, it means that all those entries belong to the same crash. Based on this fact, a query was created in Microsoft Excel to append crash entries in the person and vehicle databases to those in the pedestrian-crash database if they shared the same ICN value. The result was an updated version of the pedestrian-crash database with information on the pedestrian and vehicle characteristics. It should be noted that, in the person database, multiple entries might have same ICN value because a single ICN value would be assigned to entries pertaining to all persons (drivers and pedestrians) involved in a specific crash. Therefore, it was ensured that only entries concerned with pedestrians were extracted from person database before appending them to the pedestrian-crash database. This process was done using the variable PersonTypeCode. If the value of this variable was 2, it reflected a pedestrian and was filtered from the person database before performing the append operation in step 5. Information related to the drivers involved in pedestrian crashes was also required for analysis. The inclusion of this information in the pedestrian database was achieved in step 6 of this subtask. All entries that were coded as PersonTypeCode = 1, where 1 means a driver, were extracted from the person database. These entries were again appended to the updated pedestrian-crash database. The final product had a total of 13,280 entries, which contained information on characteristics of pedestrians, drivers, and vehicles involved in pedestrian crashes at uncontrolled locations in Illinois between 2010 and Finally, the data were ready for further analysis. 4.2 PRELIMINARY STATISTICAL ANALYSIS OF PEDESTRIAN-CRASH DATA The objective of this subtask was to conduct a preliminary data analysis to identify general characteristics of pedestrian crashes in Illinois. To complete this subtask, a modification was done to the crash-severity scale followed by IDOT. The reason for making the modification and how it was done are outlined below. 28
53 IDOT s crash database follows the KABCO scale for describing crash severity. On the scale, K indicates a fatal injury in a crash, whereas A, B, and C indicate incapacitating injury, nonincapacitating injury, and possible injury in crashes, respectively. O describes crashes where no injuries were suffered but only property damage has occurred. Of the 13,280 pedestrian crashes in this analysis, 467 (3.5%) were fatal crashes; 2,621 (19.7%) A-injury crashes; 6,493 (48.9%) B-injury crashes; 3,373 (25.4%) C-injury crashes; and 326 (2.4%) no-injury crashes. It was evident that the fatal-injury and no-injury crashes were rare, as compared to crashes of other severity levels. Conducting analysis with the existing severity levels may give rise to erroneous results due to limitations of the statistical models. Specifically, a low number of observations in some categories may cause computational problems such as very large standard errors for parameter estimates and confidence intervals. To address this issue, the fatal-injury and A-injury severity levels were combined to form a new category of severity called severe injury ; and the no-injury and C-injury severity levels were merged into a no/possible injury category. The B-injury severity level was renamed minor injury. Ultimately, the analysis included three types of severity: severe injury, minor injury, and no/possible injury. A cross-tabulation of different variables included in the analysis against the three severity levels is presented intable 1 to Table 3. From Table 1, it can be observed that the frequency of crashes belonging to all severity levels was somewhat evenly distributed across all four seasons. However, a nominal increase in crash frequencies can be observed in the fall season. When the time of crash occurrence is considered, it was clear that more crashes occurred during the afternoon and evening periods. Table 2 illustrates the trends observed for variables related to pedestrian characteristics. Middle-aged pedestrians (25 64 years old) are overrepresented in all crashes of all severity levels. Similarly, pedestrians who wore no contrasting clothing were found to be overrepresented in crashes of all severity levels. Table 3 illustrates the trends observed for variables related to pedestrian characteristics. Similar to their counterpart pedestrians, middle-aged drivers (25 64 years old) were overrepresented in crashes of all severity levels. Although DUI drivers were involved in less than 5% of all crashes studied, more than half of such crashes resulted in a severe injury. Table 1. Cross-Tabulation of Explanatory Variables and Severity Levels (Time Information) Explanatory variable No/possible injury Minor injury Severe injury Season Spring % % % Summer % % % Fall % % % Winter % % % Total % % % Time of day Night (12:01 a.m. to 6:00 a.m.) % % % Morning (6:01 a.m. to 12:00 p.m.) % % % 29
54 Afternoon (12:01 p.m. to 6:00 p.m.) % % % Evening (6:01 p.m. to 12:00 a.m.) % % % Total % % % Day of week Weekday % % % Weekend % % % Total % % % Table 2. Cross-Tabulation of Explanatory Variables and Severity Levels (Pedestrian Characteristics) Explanatory variable No/possible injury Minor injury Severe injury Pedestrian age Child ( 15 years old) % % % Adult (16 24 years old) % % % Middle (25 64 years old) % % % Old (more than 64 years old) % % % Total % % % Pedestrian gender Female % % % Male % % % Total % % % Pedestrian visibility Contrasting clothing % % % No contrasting clothing % % % Other light source used % % % Reflective material % % % Total % % % Table 3. Cross-Tabulation of Explanatory Variables and Severity Levels (Driver Characteristics) Explanatory variable No/possible injury Minor injury Severe injury Driver age Young (less than 24 years old) % % % Middle-aged (25 64 years old) % % % Old (more than 64 years old) % % % Total % % % Driver gender Male % % % Female % % % Total % % % DUI driver 30
55 Yes % % % No % % % Total % % % The trends observed for variables related to environmental conditions suggested that the majority of crashes occurred in an urban environment. This trend can be attributed to higher volumes of pedestrians in urban areas, as compared to rural areas. When the lighting condition at the time of crash was considered, most of the crashes occurred during daylight; this too can be due to higher pedestrian volumes during that time. Similarly, it was noted that a higher number of crashes occurred when clear skies and dry road-surface conditions were present. Two-lane and multilane highways were the sites of most of the crashes because pedestrian exposure to risk is higher while crossing such roads. The majority of crashes occurred when the driver failed to yield the right-of-way to pedestrians. Most of the crashes happened along the roadway or in the crosswalk because pedestrian exposure is higher at these locations. Finally, it can be observed that cities with larger populations experienced higher pedestrian-crash frequencies. This result was expected because of the higher pedestrian volumes in larger cities. Details of these trends are show in Appendix D. It is understood from the preliminary analysis that pedestrian age, driver age, DUI-driver involvement, the presence of a crosswalk, the type of roadway, the size of the city, and the time of the day have shown considerable trends with respect to pedestrian-crash frequency at uncontrolled locations in Illinois. These factors, along with other identified variables, were investigated more thoroughly in later parts of the data analysis task. In fact, subtasks 2 and 4 were accomplished simultaneously. First, the ten riskiest counties in terms of crash frequency and number of crashes per population of 10,000 were identified. They were Champaign, Cook, Jackson, Kane, Kankakee, Macon, Peoria, Sangamon, Vermillion, and Winnebago. Apart from these counties, the city of Chicago was considered separately, owing to the very high frequency of pedestrian crashes there. Initially, the crash database created as a result of the first subtask contained over 50 variables. By the end of third subtask, members of research team became familiarized with the factors that contribute to pedestrian crashes and were able to select 20 variables of the initial 50 to be included in the preliminary statistical analysis. The preliminary statistical analysis was then performed on those 20 variables. Furthermore, those 20 variables were included in the second phase of the statistical analysis as a part of subtask 5. It should be noted that the preliminary statistical analysis provided only an overview of the crash data, and it was not sufficient to draw any meaningful conclusions. Therefore, further analysis of the crash data was conducted. 4.3 DETERMINE SIGNIFICANT CONTRIBUTING FACTORS USING THE PARTIAL PROPORTIONAL ODDS (PPO) MODEL During subtask 3, a further statistical analysis was conducted to determine if the identified contributing factors were statistically significant at 90%, 95%, and 99% confidence levels. 31
56 In accordance with the objectives of subtask 3 outlined in the approved scope of work, a more detailed statistical approach was used in subtask 5, as compared to the one used during subtask 2. The researchers used 20 variables related to pedestrian crashes to identify significant crashcontributing factors. These were the same variables described in section 4.2. Of the 20 variables studied, only 11 were found to have a significant effect on the severity level of the resulting crash. The partial proportional odds (PPO) model was used to conduct the analysis. The reasons for using the PPO model rather than conventional statistical tools generally used to analyze crash data are discussed below. Crash severity is a variable with an ordinal nature. It follows an ascending order and has different levels. The distance between each severity level may not be equal and is difficult to determine. Conventional statistical tools for calculating the probability of an injury severity for a given crash might ignore this difference or try to compensate for it. Ordinal models or multinomial logit (MNL) models are generally used for predicting the probabilities of injury severities. Ordinal models are based on the parallel-line assumption (PLA). According to the PLA, a given explanatory variable has the same effect on all levels of the dependent variable (here, severity). This relationship means that, an increase (or decrease) in the magnitude of explanatory variable causes a corresponding increase (or decrease) in the odds for property damage only (PDO) vs. (C, B, A, and K crashes) as well as (PDO, C, B, and A) vs. K. For example, according to PLA, as the age of the pedestrian increases, the injury severity should either increase or decrease. However, in reality, severity increases for both younger and older pedestrians. By contrast, to avoid the flaws in PLA, MNL models rely on the maximum likelihood method to estimate different coefficients (βs) for different severity levels. While doing this, the sequential order or the severity is ignored. In other words, the fact that severity levels progress in an ascending order is disregarded, and β values for severity levels are obtained separately. The MNL method by itself cannot estimate the probabilities for severity levels. Probabilities are calculated by establishing one severity level as a base category and comparing other levels with the base by estimating a series of binary logit models. The PPO model is a mix of both ordinal and MNL models. It draws from the best aspects of both models and offers a flexible way to analyze injury severity. First, the PPO model tests whether a given explanatory variable violates the PLA. If it does, then different βs are calculated for different severity levels as far as that variable is concerned. If the PLA is satisfied, then the β remains the same for all severity levels. To achieve this flexibility, the PPO model uses different equations, based on satisfaction or violation of PLA. However, the sign and magnitude of β values alone are insufficient for determining the change in probabilities for different severity levels. The reason is that the marginal effect of one specific variable depends on the β of other variables in the model, too. To compensate for this flaw, the PPO model computes pseudo-elasticities for each independent variable. The concepts of dummy variable and threshold should be discussed before any further discussion on the PPO model. 32
57 Even though the total number of variables included in the PPO model is limited to 20, each one of those variables contains various classes within itself. For instance, the variable season has four classes (spring, summer, fall, and winter). The PPO model cannot analyze such variables, so they must be split into different dummy variables. A dummy variable takes only two values, 0 or 1. In case of the variable season, it was split into four dummy variables, one for each season type. So, the variable Fall would be coded as 1 for all crashes that occurred in that season and as 0 for crashes that occurred in other seasons. In this manner, all variables involved in the PPO model were converted into dummy variables before analysis. As stated earlier, the crash-severity levels were reorganized into three levels: no/possible injury (PDO-C), minor injury (B), and severe injury (A-K). The effects of each explanatory variable on the severity levels are analyzed by binning them into thresholds and subsequently calculating the pseudo-elasticities for each threshold. Threshold 1 in this PPO model analysis calculates the odds for the severity of a crash to change from no/possible injury to the other two higher levels of severity (PDO-C vs. B, and A-K). Similarly, the odds for severity of a crash to change from no/possible injury or minor injury to severe injury are computed in threshold 2 (PDO-C and B vs. A-K). Pseudo-elasticities are calculated as the change in the percentage of crash-severity probability when the dummy variable is switched from 0 to 1 or vice versa. Once the pseudo-elasticities are determined for all thresholds in the model, the average value for each severity level is calculated and interpreted. The equation presented below is used by the PPO model to compute pseudo-elasticities. Pr(Y E i >j) Pr(Y i > j)[given x jnk = 1 ] Pr(Y i > j)[given x jnk = 0 ] xjnk = Pr(Y i > j)[given x jnk = 0 ] where, x jnk is the k-th explanatory variable associated with the injury severity j for the individual crash n. Y i is the observed severity for crash i. Pr(Y i > j) is the value of β computed initially. The results of data analysis performed using the PPO model are summarized in Table 4. Table 4. Significant Variables Identified from the PPO Model Analysis for Pedestrian-Crash Severity Explanatory variable Parameter estimates (β) Average direct pseudo-elasticities Threshold 1 Threshold 2 No/Possible Injury Minor Injury Severe Injury Season Summer 0.148*** 0.148*** -10.4% 1.4% 11.7% Fall a ** -1.7% -3.6% 10.9% Driver age Young 0.161*** 0.161*** -11.2% 1.5% 12.7% DUI driver Yes a ** 3.3% -11.6% 22.1% 33
58 Pedestrian age Child ( 15 years old) a 0.253*** *** -17.6% 22.8% -27.5% Adult (16 24 years old) a *** -4.5% 8.1% -12.3% Old (more than 64 years old) a ** a 8.7% -6.4% 2.4% Pedestrian visibility No contrasting clothing 0.139*** 0.139*** -9.7% 1.3% 11.0% Setting Rural 0.220*** 0.220*** -15.4% 2.0% 17.4% Lighting condition Dark, road not lit a *** -3.0% -5.9% 17.9% Roadway condition Ice a * 11.0% -21.1% 33.1% Location In crosswalk a *** *** 12.2% 7.8% -35.5% Traffic way Divided 0.063* 0.063* -4.4% 0.6% 5.0% City class 25,001 to 50,000 a ** 2.2% -6.5% 11.9% More than 50,000 a *** 1.5% -7.0% 14.0% ***Significant at the 99% confidence interval ** Significant at the 95% confidence interval * Significant at the 90% confidence interval a Parameter violating parallel-line assumption To begin with, it should be noted that statistically insignificant dummy variables were not included in Table 4. For example, no statistically significant relationship was found between crash severity and the season spring or winter, so they are omitted from the table. In other words, the statistics suggested that for crashes occurring during spring and winter, the season of the crash had no influence on severity outcome. It can be observed that compared to all other seasons, the probability of a pedestrian crash at an uncontrolled location being a severe-injury crash increases during summer and fall by 11.7% and 10.9%, respectively. Interestingly, the probabilities of no/possible-injury pedestrian crashes occurring during summer and fall decrease by 10.4% and 1.7%, respectively. Additionally, in the fall, minor-injury crashes also have a 3.6% lower chance of occurrence, as compared to all other seasons. The preliminary data analysis indicated that during summer and fall, the number of crashes across all severity levels was higher than during the other two seasons. Perhaps this trend was due to increased pedestrian activity during those two seasons. Only two variables related to the driver characteristics (i.e., driver age and intoxication) have shown a significant effect on injury-severity levels of pedestrian crashes at uncontrolled locations. Figure 15 shows the odds for different crash severities when a DUI driver was involved in the crash, as compared to when an unimpaired driver was involved. 34


59 3.30% % 22.10% % % -5.00% 0.00% 5.00% 10.00% 15.00% 20.00% 25.00% Figure 15. Crash-severity odds when a DUI driver was involved. Clearly, drivers under the influence tend to increase by 22.1% the probability of a crash causing a severe pedestrian injury. The hazardous aspects of driving under the influence are well known and have been confirmed by multiple studies (e.g., Siddiqui et al. (2006 (a)) and Jang et al. (2013)). Apparently, the same holds true in this case as well. Interestingly, the chance of a minor-injury pedestrian crash occurring at uncontrolled locations decreases by 11.6% when a DUI driver is involved. Preliminary data analysis showed that almost 54% of pedestrian crashes involving DUI drivers were severe-injury crashes. This statistic can be interpreted as the crashes that would have otherwise led to a minor injury or a no/possible injury tend to result in a severe injury when a DUI driver is involved. Similarly, compared to drivers of all other ages, young (less than 24 years old) drivers increase the probability of a severe-injury crash by 12.7% and decrease the chance of a no/possibleinjury crash by 11.2%. This trend is depicted in Figure % 1.50% 12.70% % % -5.00% 0.00% 5.00% 10.00% 15.00% Figure 16. Crash-severity odds when a young driver was involved. 35
 or an adult (aged 16 to 24)pedestrian suffering a severe injury is decreased by 27.5% and 12.3%, respectively.")

60 Coming to pedestrian characteristics, only their age and visibility show a significant effect on crash severity. Compared to pedestrians of all other ages, the chances of a child (<15 years old) or an adult (aged 16 to 24)pedestrian suffering a severe injury is decreased by 27.5% and 12.3%, respectively. In the same scenario, pedestrians belonging to these two age groups have 17.6% and 4.5% less chance, respectively, of suffering a no/possible injury. For older pedestrians, the risk of suffering a severe injury in this scenario is 2.4% more and sustaining a no/possible injury is 8.7% higher, relative to pedestrians of all other age groups. These results are consistent with findings of study conducted by Lee and Abdel-Aty (2005). Figure 17 presents the variation in crash-severity odds for different pedestrian age groups when each is compared to the other age groups. Pedestrian age was found to have an insignificant effect on crash severity when a middle-aged pedestrian was involved in a crash % % % % 0.00% 10.00% 20.00% 30.00% Severe Injury Minor Injury No/Possible Injury Figure 17. Crash-severity odds for various pedestrian age groups. The type of clothing worn by pedestrians was also found to influence the outcome of the crash. The relevant trends are depicted in Figure 18. These data clearly show that at uncontrolled locations, pedestrians wearing no contrasting clothing had an 11.0% higher probability of suffering a severe injury in a crash than those who wore other types of clothing. It can also be observed that the risk of no/possible injury decreased by 9.7% when no contrasting clothing was worn. It can be inferred from this observation that contrasting clothing helps to decrease crash severity. This trend might be caused by enhanced pedestrian visibility caused by the contrasting colors. 36
61 -9.70% 1.30% 11.00% % % -5.00% 0.00% 5.00% 10.00% 15.00% Figure 18. Crash-severity odds when pedestrians wore no contrasting clothing. The setting of the crash location also influenced the severity of the crash. Uncontrolled locations in rural setting had a 17.4% higher probability of severe injuries than their urban counterparts. Uncontrolled locations in rural settings also dampen the probability of no/possible-injury pedestrian crashes by 15.4%, as compared to those at urban locations. The severity of crashes in urban areas tends to be lower than in rural areas, owing to reasons such as better accessibility to emergency medical services and high driver expectation of pedestrians crossing. This finding is consistent with observations made in previous studies (Lee and Abdel-Aty, 2005; Stand and Zegeer, 2006). Figure 19 reflects the severity odds for rural pedestrian crashes % 2.00% 17.40% % % % -5.00% 0.00% 5.00% 10.00% 15.00% 20.00% Figure 19. Crash-severity odds if crash occurred in a rural area. Visibility plays a key role in road safety. When it is dark and no lighting is available, the probability of a severe-injury pedestrian crash occurring at an uncontrolled location increases by 17.9%, as compared to other lighting conditions. This trend is shown infigure 20. The role of lack of good lighting in disrupting pedestrian safety is well-established in previous studies 37
62 ((Siddiqui et al. 2006(b); Zahabi et al. 2011; Das and Sun, 2015). This study confirms the same in the case of uncontrolled locations as well % -5.00% 0.00% 5.00% 10.00% 15.00% 20.00% Figure 20. Severity odds for crashes along dark, unlit roads. The presence of ice on roads is known to decrease the friction between automobile tires and the road surface, leading to dangerous scenarios like skidding while applying brakes. When a driver attempts to avoid a crash, ice on the road surface works against the driver and may result in a severe crash more often than not. This outcome holds true in the case of pedestrian crashes, too. Figure 21 illustrates the changes in severity odds when ice is present on the road surface % % 33.10% % % % 0.00% 10.00% 20.00% 30.00% 40.00% Figure 21. Crash-severity odds when ice was present on the road. This study revealed that the presence of ice on roads increases chances of severe pedestrian crashes by 33.1% over that in dry conditions. Similarly, no/possible-injury crashes also see an 38
63 11.0% increase in the probability of occurrence. However, the minor-injury-crash probability decreases by 21.1% when ice is present on the road surface. Given the prevalence of cold weather in Illinois, these findings may warn authorities to take specific actions to address pedestrian safety during cold weather, especially when roadways are covered by ice. It can be concluded from the results of this analysis that crosswalks play an exceptional role in enhancing pedestrian safety. As shown in Figure 22, the probability of severe-injury pedestrian crashes at uncontrolled locations is decreased by 35.5% where a crosswalk is available, as compared to locations where no crosswalk is available. However, the chances of minor-injury and no/possible-injury pedestrian crashes at crosswalks increase by 7.8% and 12.2%, respectively. Because crosswalks attract more pedestrian traffic, a higher number of pedestrian crashes occur there. Statistics presented in Appendix D (Table D1) confirm this fact. Fortunately, the enhanced safety of crosswalks mitigates the crash severity. In other words, what could have been a severe-injury crash is alleviated to become a minor- or no/possibleinjury crash by the presence of a crosswalk % 7.80% % % % % % 0.00% 10.00% 20.00% Figure 22. Crash-severity odds when crash occurred on a crosswalk. It is observed that divided roadways pose a slightly higher risk (5%) of severe-injury pedestrian crashes at uncontrolled locations than undivided roadways. The probability of no/possible crashes is also decreased by 4.4% along divided roadways, compared to undivided ones. This trend is depicted in Figure


64 5.00% 0.60% -4.40% -6.00% -4.00% -2.00% 0.00% 2.00% 4.00% 6.00% Figure 23. Severity odds for crashes along divided roads. Generally, divided roadways have higher posted speed limits, are much wider, and are often dangerous to pedestrians; and perhaps, for these reasons, divided roadways tend to raise the probability of severe-injury pedestrian crashes at uncontrolled locations. Compared to cities of different population sizes, cities with populations between 25,001 and 50,000 and cities with populations of more than 50,000 have an 11.9% and 14.0% higher risk of severe-injury pedestrian crashes at uncontrolled locations, respectively. The size of the city does not have a statistically significant effect on crash severity when the city s population is less than 25,000. Similarly, the population size of Chicago proved to have no effect on crash severity. Figure 24 illustrates the variations in crash-severity odds based on population of cities. Severe Injury Minor Injury No/Possible Injury % -5.00% 0.00% 5.00% 10.00% 15.00% 20.00% Figure 24. Crash-severity odds for cities with different sizes of population. 40
65 4.4 SPATIAL ANALYSIS OF CRASH DATA TO IDENTIFY HIGH-CRASH LOCATIONS In subtask 4, the high-crash locations were to be identified for further field review. This process was done by using the geographic information systems (GIS) database provided by IDOT. The procedure followed to achieve the objective is outlined in this section. A road network shapefile containing information on all roads in Illinois and a point shapefile with information on all crash locations in Illinois between the years 2010 and 2014 was obtained from IDOT. In the road network shapefile, the segments were severely fragmented, making it redundant for analysis. To facilitate spatial analysis, disjointed segments that shared the same road name and functional classification were merged using the dissolve tool in ArcGIS. The basic function of the dissolve tool is to aggregate features based on a common attribute. In this case, the attributes used to dissolve the features were road name and functional classification. It should be noted that there is a possibility for multiple roads to have same name and functional classification. Therefore, while dissolving the road segments, it was ensured that the dissolve operation was performed only if the fragments shared an end point. In other words, fragments were joined together only if they were adjacent to each other and shared names as well as functional classifications. Severity weights were assigned to each crash severity. Instead of using crash costs, predetermined values suggested by panel members were used as severity weights: 1 for PDO, B, and C injuries; 10 for A injury; and 25 for fatal crashes. The add table and field calculator tools were used to achieve this. The add table feature in ArcGIS allows the analyst to simply add a column in the attribute table. This column can be populated with any value deemed appropriate: in this case, severity weights. The number of crashes that occurred in each county and the sum of the severity weights of all crashes in each county were counted using the spatial join tool. This tool joins attributes in one feature with those in another based on the spatial relationship between the two features. In this case, the number of crashes that occurred in each county was counted and written into a separate field in the output feature class. The counties with the highest values in both aspects of crash frequency and severity from each IDOT district were selected for further analysis. If no county in a district had more than a hundred crashes per year, that district was omitted from analysis. In total, seven counties and the city of Chicago were identified as risky counties; and further analysis was focused on these counties. These seven counties represent seven of nine IDOT districts. The names and location of the counties selected for further spatial analysis are depicted in Figure
66 Figure 25. Names and locations of high-pedestrian-crash counties in Illinois. Next, the high-crash segments for each functional classification were determined. In each county, for a given functional classification, the number of crashes from 2010 to 2014 associated with each road segment and the sum of the severity weights of all crashes along each segment were counted using the spatial join tool. In the resultant shapefile, a new field named crash rate was added. In this field, the ratio of road-segment length to the corresponding sum of severity weights was computed using the filed calculator tool. Here, this ratio will be referred to as crash rate. The road segments were ranked based on crash rate. Segments with higher values were assigned higher ranks. The top ten segments (or fewer where not enough segments were available) from each of the top seven counties were exported to separate layers. The same procedure was repeated for road segments of all functional classifications in all seven counties and Chicago. Maps were created for each county to indicate the locations of highcrash segments. Figure 26 depicts a sample map showing the locations of high-crash segments. Tables D3 and D4 in Appendix D present high-crash segments in urban and rural areas of the seven high-crash counties. 42

67 Figure 26. A sample map depicting high-crash segments in Champaign County, Illinois. Once the lists of high-crash segments in all the risky counties and the corresponding maps were prepared, another set of online maps was created to aid the field review team. Using the layer to KML tool, the shapefiles containing high-crash segments were converted to. kmz files. The kmz files were then exported to Google My Maps, and online maps for navigation were created. Using these maps, the field review team proceeded with its tasks. 4.5 SUMMARY The data analysis task had two main components, statistical analysis and spatial analysis. The statistical analysis of crash data was accomplished using the PPO model. The key findings of statistical analysis are Crosswalks can reduce the probability of severe-injury crashes by 35.5%. Young drivers increase the probability of severe-injury crashes by 12.7%. DUI drivers increase the probability of severe-injury crashes by 22.1%. Dark, unlit roads increase the probability of severe-injury crashes by 17.9%. The presence of ice on the roads tends to increase the probability of severe-injury crashes by 33.1%. Similarly, spatial analysis of pedestrian-crash data was conducted using ArcGIS software, as described earlier. This analysis resulted in identification of high-crash corridors in different IDOT districts, as well as in Chicago. These high-crash corridors were used by the research team to select candidate locations for the field review. The results of statistical analysis were used, 43
68 along with the observations made during field review, to prepare the guidelines for pedestriancrossing treatments at uncontrolled locations. 44
69 CHAPTER 5: FIELD REVIEW FINDINGS The objective of task 5, field review of high-crash corridors (HCCs), was to identify factors contributing to pedestrian crashes at specific sites. This information was intended to complement the crash-data analysis findings and assist researchers in evaluating the pedestrian-crossing treatments typically used in Illinois. The focus of the field review was on fatal- and severe-crash locations, as well as HCCs. From October 14 to December 2, 2016, the research team conducted the HCC field review with project TRP members from local IDOT districts. This chapter presents the activities and results from task 5. First, the list of potential HCCs was created from the crash-data analysis and input from TRP members, as described in section 5.1. Next, the method used for the HCC field review is described in section 5.2, followed by the key findings and recommendations for the final guidelines in section 5.3. For brevity here, the summary of field review results for each HCC is presented in Appendix E. 5.1 HIGH-CRASH CORRIDORS The HCC candidates were identified during the crash-data analysis task (chapter 4), based on the pedestrian-crash rate per mile from 2010 to The identified HCC candidates included corridors in seven of the nine IDOT districts. The TRP guided the research team in narrowing the field reviews to five IDOT districts and helped select the HCCs for field review. In addition to the HCCs on the original list, TRP members from the local districts requested several other locations for field review, based on their local experience. The final list included 24 HCCs from D1, D4, D5, D6, and the City of Chicago, as shown in Appendix E. 5.2 FIELD REVIEW METHODS Following the approved HCC list, the research team conducted the field review with TRP members from local districts. Fatal- and severe-crash sites along each HCC were selected and reviewed thoroughly by the team. Crash-site land-use information, geometric details, traffic data, and pedestrian characteristics were collected and recorded on the field review sheet (Appendix E), along with pictures taken at the site. When possible, the team also talked to local residents, pedestrians, police officers on duty, and business owners or employees for additional information and contributing factors for pedestrian crashes and solutions they identified. 5.3 CONTRIBUTING FACTORS IDENTIFIED The main factors contributing to the severe pedestrian crashes identified from the field review are listed in this subsection. The information is presented by contributing factor, instead of by corridor. Corridor-specific contributing factors are discussed in Appendix E Insufficient Sight Distance Insufficient sight distance was found to be a contributing factor in several crashes: The most common case was that adjacent buildings, trees, mailboxes, etc., blocked the sight of motorists, pedestrians, or both. 45
70 On-street parking (even 20 ft away from the crossing point) could block the view of motorists and pedestrians. Signage for a bus stop and other signs can obstruct the sight of motorists/pedestrians ( Figure 27). Buses stopped behind crosswalks on multilane roadways can block the sight of motorists trying to overtake the buses (using other lanes or a two-way left-turn lane). Vehicles stopped close to a crosswalk on the outside lane for pedestrians crossing multiple lanes can block the sight of motorists from other lanes and pedestrians (Figure 28). Pedestrians crossing near a horizontal/vertical curve segment might not be as visible to approaching drivers. 46


71 Figure 27. Example of pedestrian sight distance (PedSD) restricted by on-street parking (Highway Safety Research Center: University of North Carolina, 1999). Figure 28. Example of sight-distance issue for a vehicle on the outer lane Vehicle Speed Two vehicle speed-related cases involved severe pedestrian crashes. One involved speed limits of 40 mph or higher, and the other involved the layout of corridors with a speed limit of 30 mph or less that encourage motorists to travel above the posted speed limit. For the latter, specific layout characteristics include multiple lanes in each direction, wide lanes, an open surrounding area, and limited pedestrian and bicycle traffic. At a few places, motorists were observed to travel above the speed limit by 10 to 15 mph. For instance, motorists were traveling at a speed of 50 mph along West Harmon Highway, in Peoria, Illinois; but the posted limit was 40 mph (Figure 29). 47

. Figure 30.")

72 W. Harmon Hwy, Peoria Ashland Ave., Chicago Figure 29. Example locations where observed speeds were higher than the posted limit Crossing Length Two major cases of lengthy crossings were observed that may have contributed to unsafe pedestrian conditions. These include locations with multiple-lane crossings (more than three lanes) without a refuge island and locations with on-street parking and bicycle lanes on both sides of the roadway. Both cases increase the exposure time of pedestrians to traffic (Figure 30). Figure 30. (a) Wide crossing distance with no median; (b) parking lane increasing the crossing distance Turning Vehicles At some locations, motorists attention was not on pedestrians. For example, the driver of a turning vehicle watched for a gap in opposite heavy traffic to turn onto a minor road but did not pay attention to pedestrians crossing the minor road. In addition, vehicles waiting at a stop sign (minor road) to merge onto the major road failed to pay attention to pedestrians crossing the major road (see Figure 31). 48

, bad weather conditions, or")

73 N. Clark St., Chicago Ashland Ave., Chicago Figure 31. Example of left-turning vehicles causing pedestrian-safety issues Low Pedestrian Visibility Low pedestrian visibility could have contributed to some of the unsafe conditions and recorded crashes. Pedestrian-visibility problems were frequently caused by insufficient lighting units or inappropriate positioning ( Figure 32), bad weather conditions, or noncontrasting clothing. Safety is further compromised when motorists do not expect pedestrians to be crossing. For example, an unexpected pedestrian crossing could occur at undesignated crossing points, at night, or during severe weather conditions. Gregory Dr., Champaign Lack of Sidewalks Figure 32. Example of inadequate street-lighting location. A lack of sidewalks forces pedestrians to walk along the roadway and is associated with an increased number of crashes. Figure 33 shows some of the roadways reviewed. 49


74 Wiswall St., Manual H.S., Peoria W. Harmon Hwy, Peoria Land Use Figure 33. Lack of sidewalk on roads with residential development. The field review revealed that crash locations were frequently near low-income neighborhoods, bars/restaurants, and senior housing. Pulaski Road (Chicago), Ashland Avenue (Chicago), and Wiswall Street (Peoria) were HCCs near low-income neighborhoods. This relation between land use and pedestrian safety suggests that pedestrian safety is not only an engineering issue; planners and social services could also play a role Inadequate Pedestrian Treatments The use of marked crosswalks alone was the most frequently observed pedestrian treatment along the HCCs. There was a lack of additional treatments to supplement many marked crosswalks. Additional treatments, such as advanced warning signs, in-street crossing signs, advanced yield lines and signs, flashing beacons, and pedestrian-refuge islands should be considered, based on traffic and roadway characteristics. A lack of adequate crossing locations was also observed along some corridors. For instance, Business 51 (Bloomington Normal) had no crosswalks for 1,500 ft, North Clark Street (Chicago) had no crosswalks for 750 ft, and Southwest Jefferson Street (Peoria) had no crosswalks for 750 ft. In some cases, severe crashes occurred at undesignated crossing sites (no marked crosswalks) Inadequate Maintenance In many cases, the crosswalk striping was faded, which could adversely affect the visibility of crosswalks. In addition, crosswalk-warning signs (in-street, roadside, and advanced warning signs) were frequently broken, missing, or blocked from view (Figure 34). Crosswalk striping and traffic signs should be maintained on a regular basis. 50


75 Figure 34. Example of lack of maintenance for crosswalk markings and signs Pedestrian and Driver Behavior The following pedestrian behaviors were closely related to crashes: Running into the street Walking along the roadway Crossing the road between parked vehicles Crossing the road adjacent to the crosswalk Running after a pet along the roadway Crossing the road under the influence The following driver behaviors were closely related to crashes: Failing to yield the right of-way Driving under the influence Driving without a license Driving without headlights on Reversing the car with a door open Site location Severe crashes were observed at locations with low pedestrian volume and in suburban areas. These findings suggest that within urban areas with high numbers of pedestrians crossing, motorists are more likely to expect pedestrians and be ready to yield. Therefore, in determining the level or type of treatments, the site location should be considered more strongly than the pedestrian volume. 5.4 BEST PRACTICES FOR TREATMENTS DEPLOYMENT The best practices observed during the field review include Treatments that included a combination of a marked crosswalk, with an in-street crossing sign, roadside pedestrian-crossing signs, and a road diet (Peoria) (Figure 35). Pedestrian-crossing sign with retroreflective tape (Chicago) (Figure 35) 51
76 Pedestrian dual-display crossing signs (Chicago) Advanced yield line with marked crosswalk (Champaign) (Figure 36) Pedestrian crossing placed at the highest point on a vertical curve (Champaign) Figure 35. Example of best practices for multiple treatments. Figure 36. Example of the best practice of placing an advanced stop bar and sign. 5.5 RECOMMENDATIONS FOR FINAL GUIDELINES No midblock crossings should be deployed when the posted speed limit is above 35 mph unless a high level of treatment (i.e., pedestrian hybrid beacon) is used. Most fatal pedestrian crashes occurred at locations with a speed limit above 35 mph. 52

77 It is not recommended to deploy a crossing at uncontrolled locations when the number of travel lanes (i.e. through lane, turn lane, and two-way turn lane) to be crossed is more than four. Unmarked crosswalks at uncontrolled locations are not safe for pedestrians, especially when there are a parking lane and bike lane on the same side of the road. Parking should be restricted near any crosswalks to provide adequate sight distance. Marking crosswalks by itself is not enough for pedestrian safety at uncontrolled locations. Additional treatments should be deployed based on traffic and roadway characteristics. Standard crosswalk marking can be used for crosswalks where traffic is stop-sign-controlled. The continental pattern is recommended for major roads and midblock locations. Advanced stop bar and sign Stop here for pedestrian can be used for multilane (four or more) roadways. A setback of 30 ft is recommended for visibility (PEDSAFE, 2017), as shown in Figure 37. Figure 37. Example of advanced stop line and sign supplement with Stop here for pedestrian (HDOT, 2013). For roadways of four or more lanes (or a crossing distance 60 ft) with heavy traffic, a pedestrian-refuge island should be provided for two-stage crossings. In-street crossing signs, State law stop for pedestrian, can be installed with pedestrian-refuge islands (Figure 38). 53
.")
78 Figure 38. Example of marked crosswalk with pedestrian-refuge island, warning signs, and instreet crossing sign. For roadways with fewer than four lanes and an ADT up to 20,000, a pedestrianactuated yellow flashing beacon can be used (Figure 39). A pedestrian-actuated flashing beacon is recommended instead of a continuous flashing beacon; during the expert interviews, it was reported that drivers are prone to indifference to the latter. Figure 39. Example of a marked crosswalk with a flashing beacon, Edwardsville, Illinois. A road diet with an in-street crossing sign is effective to reduce pedestrian exposure and warn drivers of the existence of a crosswalk. For placing in-street crossing signs (if no median is present), a buffer zone of 2 ft is recommended to prevent vehicles from hitting the sign (Figure 40 and Figure 41). 54

79 Figure 40. Example of marked crosswalk with in-street crossing sign and painted buffer zone, Edwardsville, Illinois. Figure 41. Example of a road diet with in-street crossing sign, Peoria, Illinois. To prohibit pedestrians from crossing roads with high speed limits or more than four lanes, pedestrian channelization is recommended. In addition, pedestrian channelization can be used to prohibit jaywalking between two adjacent crosswalks. Figure 42 shows an example of pedestrian channelization in Cook County, Illinois, that guides pedestrians to adjacent crosswalks. 55
80 Figure 42. Example of pedestrian channelization, Cook County, Illinois. For sites not suitable for marked crosswalks but with strong pedestrian-crossing needs, consider a traffic signal or grade-separated pedestrian crossing. A 20-ft clear zone is not adequate for removing on-street parking to ensure pedestrian safety. Installing a bulb-out, or curb extension, is a suggested alternative. There is a tradeoff between of the cost of a bulb-out and the parking revenue. Bus stops should be placed on the far side, downstream of crosswalks (Figure 43), which encourages pedestrians to cross the street behind the bus, where sight distance to an oncoming motorist is better, rather than crossing in front of the bus. Figure 43. Example of bus stop relocation downstream of crosswalk (PEDSAFE, 2017). Virginia Tech Transportation Institute recommended placing luminaries at least 10 ft upstream of the crosswalk (PEDSAFE, 2017). Figure 44 shows the recommended crosswalk-lighting layout for a midblock crosswalk. 56
81 Figure 44. Recommended design layout for crosswalk lighting (Gibbons et al. 2008). Avoid deploying crosswalks on curved segments (vertical or horizontal curve) of the road. At a minimum, engineers should ensure sight distances are adequate and place the crosswalk on the highest point along a crest curve. It is recommended to use dual back-to-back display pedestrian-crossing signs with retroreflective sheeting added to sign supports. This practice can help to increase driver attention for pedestrian-crossing activity. Figure 45 shows an example of retroreflective signposts on Illinois Route 29, Rochester, IL. Figure 45. Example of retroreflective signposts, IL Rte. 29, Rochester, Illinois. Using medians as pedestrian-refuge islands is recommended instead of ending islands before crosswalks. A median on both sides of a crosswalk provides a safer waiting zone, as compared to a median on only one side (Figure 46). 57


82 Protected waiting zone W. North Ave., Chicago Business 51, Champaign Figure 46. Examples of median with/without waiting zones on refuge islands. Land use and nearby pedestrian attractions should weigh more than pedestrian volume in determining if a crossing at an uncontrolled location is needed. Site location (rural or urban) should weigh more than pedestrian volume in determining the types of treatments needed. Crosswalk marking and signage should be maintained on a regular basis. Long-term and ongoing programs are needed to educate pedestrians and drivers about traffic rules and regulations. 58
83 CHAPTER 6: BEST PRACTICES The objectives of task 6 of this project were to identify the best practices for implementing various pedestrian-crossing treatments suitable to conditions in Illinois and to make recommendations for the final guidelines. These recommendations should be based on the findings from the literature review, survey and interview of local engineers, field review results, and input from the technical review panel (TRP). It has been well-recognized that besides quantitative measurements, engineering judgment plays a significant role in selecting a specific pedestrian treatment. The research team has worked closely with the TRP members in identifying the best practices of treatment deployment for various road conditions and developing the procedure and criteria to be used in the final guidelines. The best practices identified in this task formed the basis for developing the pedestriantreatment guidelines (Appendix A). Following the approved outline of the final guidelines, this chapter is organized as follows: the warrants/minimal conditions for the installation of crosswalks at uncontrolled locations are presented in section 6.1, followed by the procedures to select appropriate pedestrian-crossing treatments, section 6.2; section 6.3 describes other considerations that affect pedestrian safety; and section 6.4 suggests use of pedestrian channelization and grade-separated crossings. 6.1 WARRANTS/MINIMUM REQUIREMENTS To install pedestrian-crossing treatments at uncontrolled locations, the first question to be asked is, under what conditions an uncontrolled pedestrian crossing is acceptable to ensure safe pedestrian crossing. Very few previous studies and existing guidelines examined or discussed systematically the minimum requirements/warrants of pedestrian crossing at uncontrolled locations. The vast literature mainly discusses variables affecting a treatment s effectiveness and suitable implementation conditions. Given the higher risk exposure of pedestrians at uncontrolled locations, as compared to that at signalized intersections, conservative use of uncontrolled crossings is suggested. Combining the findings from the literature review and field review results, this section discusses the major factors that affect pedestrian safety at uncontrolled locations and then makes recommendations on minimum requirements/warrants of uncontrolled pedestrian crossings Speed Vehicle speed is an important factor that affects pedestrian safety at uncontrolled crossings. The field review shows that speeding is very common, and fatal pedestrian crashes usually happen when vehicle speed is 40 mph or higher. Past studies (e.g., Figure 47) also indicate high probabilities of pedestrian fatality if the impact speed is 40 mph, which is consistent with the field review findings. To promote pedestrian safety, it is not recommended to install a crosswalk at uncontrolled locations where the posted speed limit is above 40 mph. 59
. 6.1.")
84 Vehicle Speed Uninjured Injury Fatal 40 mph 30 mph 20 mph Figure 47. Pedestrian-injury severity based on vehicle speed (U.K. Department of Transportation, 1987) Crossing Distance A long crossing distance at an uncontrolled location increases the risk of pedestrian motorist collisions; therefore, it is reasonable to restrict the width of uncontrolled crossings (number of travel lanes). In this study, expert opinion was gathered; and it was recommended to restrict the number of crossing lanes for uncontrolled crossings. For divided roadways, the maximum number of lanes is six; and for undivided roadways, four Crosswalks Spacing 0% 20% 40% 60% 80% 100% Percent of pedestrian crashes It is recommended that midblock crosswalks should not be located where The spacing between adjacent intersections is less than 660 ft. The distance to the nearest alternative crossing location, midblock or at an intersection, is within 300 ft. The nearest side street or driveway is within 100 ft. Please note, these recommendations are not applicable for school zones, campus areas, and intensive commercial zones (e.g., downtown Chicago). The distance to an alternative crossing under urban conditions may be reduced to 200 ft, subject to engineering study/judgment Sight Distance Adequate sight distance (i.e., stop sight distance (SSD) and pedestrian sight distance (PedSD)) should be provided for motorists and pedestrians at uncontrolled crossings. Road segments with restricted sight distances could include horizontal or vertical curves and/or permanent sight obstructions. Locations with limited sight distance for pedestrians or motorists are not recommended for crosswalks. 60
85 6.1.5 Crash Records It was found from the field review that many severe crashes (including fatalities) occurred at locations without marked crosswalks or designated crosswalks. It is recommended that if there are two B- or A-injury crashes in two years or one fatality in the vicinity, an investigation should be conducted to check if there is a need for a pedestrian crosswalk. The proposed crossing site should meet all of the recommended requirements. 6.2 SELECTION OF PEDESTRIAN TREATMENTS Given the large variety of roadway conditions and pedestrian-crossing treatments considered in the study, a categorized table (instead of a flowchart) was chosen to describe the selection procedure, to reduce unnecessary confusion. Developing the categorized table included three steps: first, determining influential factors to define site-condition categories of different relative-risk levels; second, classifying different pedestrian-treatment levels; and third, recommending suitable treatment level(s) for different site-condition categories. Engineering judgment has been used throughout this process, including selecting influential factors, determining treatments levels, assigning treatments for different conditions, and developing criteria. In making treatment-selection recommendations, we have also considered the maintenance of those treatments, in addition to their effectiveness Site-Condition Variables It is recommended to use vehicle speed, crossing distance, median type, and traffic volume to define the relative risk of crossing sites. The traffic-volume categories recommended in the study are shown in Table 5. The classification of roadway configurations should consider all possible combinations of two to six lanes, with or without raised median. The grouping of speeds is from less or equal to 30 mph up to 40 mph, with 5-mph increments Treatment Categories Table 5. Traffic-Volume Categories Category ADT (vpd) 1 Less than 9, ,000 less than 15, ,000 25,000 4 More than 25,000 All the treatments recommend in the final guidelines are for marked crosswalks combined/supplemented with additional treatments (i.e., signing and marking, flashing beacons, curb extensions, raised medians, speed-reduction treatments). The following treatments that were reported in the literature as effective were not considered in the study due to high maintenance and operation requirements: In-roadway warning lights hard to maintain Flags nonpassive, depending on how the pedestrian holds the flag; theft of flags 61

86 Combining past studies of treatment effectiveness, findings from the field review, and engineering judgement, we recommend the following at-grade treatment categories (Table 6). Table 6. At-Grade Pedestrian-Crossing Treatments At-grade pedestriantreatment categories Basic Enhanced Geometric Warning beacon Control beacon Example Marked crosswalk with warning sign Advanced stop line and sign In-street crossing sign Overhead crossing sign Curb extension Road diet Raised median Raised crosswalk FB RRFB PHB Basic Treatments: Marked crosswalk with warning sign Implementing a marked crosswalk with pedestrian-crossing signs and warning plaques is considered as the lowest level of treatment. It is recommended to install pedestrian-crossing signs (W11-2) with downward diagonal arrow plaques (W16-7P) at uncontrolled crossings. For school crossings, S1-1 signs should be used instead of W11-2. At places where motorists do not expect to encounter pedestrians crossing the road (midblocks and crossings in rural areas) and in school zones, advanced warning signs with AHEAD/distance plaque (W16-9P or W16-2P) should be considered. Figure 48 shows the pedestrian-crossing and warning signs within the basic crosswalk-treatments category. Enhanced Treatments School crossing sign Figure 48. Pedestrian-crossing and warning signs. Supplemental sign (school zone) Enhanced treatments are supplementary to the basic treatment, to improve motorist compliance and pedestrian safety at uncontrolled crossings. Figure 49 shows treatments in this category. 62
 shall be placed on a median island or on the centerline/lane line (FHWA, 2009).")
 should be considered instead of an in-street crossing sign (based on engineering judgment.")
87 In-Street Crossing Sign Figure 49. Uncontrolled pedestrian-crosswalk signs (FHWA, 2009). For multilane crossing locations, a state law Stop for Pedestrian sign (R1-6a) shall be placed on a median island or on the centerline/lane line (FHWA, 2009). The MUTCD (FHWA, 2009) requires that the sign support shall be designed to bend over and then bounce back to its normal position when struck by a vehicle. Overhead Crossing Sign Overhead crossing sign (R1-9a) should be considered instead of an in-street crossing sign (based on engineering judgment. The overhead pedestrian-crossing sign shall be placed over the roadway at the crosswalk location (FHWA, 2009). Advanced Stop Line and Sign If used, the sign (R1-5b or R1-5c) should be used in conjunction with a stop line (Figure 50). It is recommended to offset the stop line 30 to 50 ft before the crossing at multilane uncontrolled locations. Geometric Elements Figure 50. Advanced stop line and sign (PEDSAFE, 2017). Geometric elements include raised medians/pedestrian-refuge islands, split pedestrian crossovers or Danish offsets, road diets, and raised crosswalks (Figure 51). Raised median/pedestrian-refuge islands provide pedestrians a facility for two-stage crossing of multiple lanes. The split pedestrian crossover, or Danish offset, also known as a z crossing, 63

; (b) split pedestrian crossover (VDOT, 2004); and (c) curb extension (Turner and Carlson, 2000).")

88 can ensure that pedestrians face oncoming traffic. A curb extension is effective to reduce the pedestrian s exposure to traffic and reduce the crossing distance. Another safety benefit of a bulb-out is that pedestrian-crossing signs placed there are more visible, as compared to those placed on the roadsides. A road diet is a traffic-calming measure to reduce speed through reducing the number of travel lanes or narrowing the travel lanes. a b c Figure 51. (a) Raised median (Pulugurtha et al. 2012); (b) split pedestrian crossover (VDOT, 2004); and (c) curb extension (Turner and Carlson, 2000). Another treatment in this category is a raised pedestrian crossing (Figure 52), not a treatment that could be implemented under all conditions. A raised crosswalk is essentially a speed table and is effective in commercial business districts, densely developed urban areas, and university campuses. Usually raised pedestrian crossings are used as part of an area-wide traffic-calming plan (Turner and Carlson, 2000) and seldom are considered individually as a pedestrian treatment. Raised crossings are not appropriate on bus routes. Warning Beacons Flashing Beacons Figure 52. Raised crossing (PEDSAFE, 2017). Flashing beacons can be designed to flash when activated by pedestrians or to flash all the time. During the survey and interview, IDOT engineers suggested that they considered a pedestrian-actuated flashing beacon more effective than a continuous flashing beacon because intermittent flashing provides a more effective response from traffic (Van Winkle and Neal, 64
89 2000). Therefore, a pedestrian-activated beacon is recommended in most cases. A continuous flashing beacon can be considered at school crossing for specific times, such as between 7:30 and 9:30 a.m. For improved visibility to motorists on a multilane roadway, an overhead crossing beacon shall be considered preferable to a pole- or side-mounted (roadside) flashing beacon (Figure 53). Figure 53. Pole-mounted and overhead flashing beacons (Fitzpatrick et al. 2006). Rectangular Rapid Flashing Beacon (RRFB) An RRFB device is a pedestrian-activated yellow-light system located at the roadside directly below side-mounted pedestrian crosswalk signs (Figure 54). Another type of installation consists of four RRFBs, with two additional RRFBs installed on the median. Although not yet included in the IL MUTCD, this treatment has been implemented in many states and evaluated in a number of studies with positive results. Signs used in conjunction with the RRFB usually include a pedestrian-crossing sign with an arrow and a supplemental sign. Control Beacon Pedestrian Hybrid Beacon (PHB) Figure 54. Example of an RRFB system (Pecheux et al. 2009). PHBs can be used to warn and control traffic at an unsignalized location to assist pedestrians in crossing a street or highway at a marked crosswalk (FHWA, 2009). This treatment is included in the IL MUTCD (Figure 55). If used, PHB shall be installed at least 100 ft from side streets or driveways and 300 feet away from traffic signal or railroad grade crossings with active warning devices (IL MUTCD, 2014). 65
). 6.2.")
90 Figure 55. Example of a PHB treatment in Arizona (Fitzpatrick et al. 2014(a)) Selection of Appropriate Treatments Based on findings from past studies, combined with the observations from the field review, engineering judgement, and practices of other state agencies and cities, appropriate treatments for different site conditions are recommended (Table A3 of Appendix A). 6.3 OTHER SAFETY CONSIDERATIONS Besides the selection of appropriate pedestrian-crossing treatments, other factors affect pedestrian safety at uncontrolled locations. This section summarizes those factors that should be considered when an uncontrolled pedestrian crossing is established Crosswalk Pattern Continental-pattern crosswalk striping is recommended due to its improved/additional visibility to motorists. Also, the continental pattern can be designed in a way that the vehicle wheel paths are in between the markings, requiring less maintenance. Textured crosswalks are another type of high-visibility crosswalks that can be considered with use of the standard marking pattern (Figure 56 and Figure 57) Figure 56. Recommended crosswalk patterns at uncontrolled locations. 66

91 6.3.2 Bus Stop Location Figure 57. Brick-textured crosswalk on N. Clark St., Chicago. It is recommended to place bus stops on the far side (downstream) of crosswalks. Placing bus stops on the far side of crosswalks forces/encourages pedestrians to cross the road behind the bus, which improves their visibility to the oncoming traffic, and reduces the delay for buses (PEDSAFE, 2017). Crosswalks at transit stops should be placed a minimum of 5 ft (with 10 ft preferred) behind the bus stop (Figure 58). A = Safety buffer behind crosswalk, 10 ft B = Bus zone length, 90 ft Figure 58. Placement of bus stop on the far side of the crossing (PEDSAFE, 2017) Crosswalk Lighting In the study, it was recommended to provide lighting for crosswalks at uncontrolled locations (midblocks and stop-sign-controlled intersections), particularly sites with lower-level treatments (basic, enhanced, and geometric elements). The lighting layout in Figure 59 should be referred to when designing the placement of luminaires upstream of the crosswalk (not above the crosswalk). Overhead lighting units should be used instead of headlamps. The lighting source, mounting height, and target illuminance should be determined following the recommendations from IDOT s policy or FHWA guidelines. 67

92 Figure 59. Recommended midblock crosswalk-lighting layout (Gibbons et al. 2008) On-Street Parking Restriction Currently, a 20-ft no-parking zone is used for on-street parking at pedestrian-crossing locations across Illinois. The field review found that this distance is not adequate to provide enough sight distance for both pedestrians and motorists. Many crashes at field review locations happened due to inadequate sight distance caused by adjacent on-street parking. Because no field study was conducted evaluating various no-parking-zone distances in Illinois, no specific distance recommendation was made. However, it is recommended that Illinois and the City of Chicago perform further studies to reevaluate the appropriateness of the 20-ft no-parking zone. As a result of the future study, recommended no-parking-zone distances should be given for different traffic speeds and intersection/crossing types Use of Highlighted Sign Pole A highlighted retroreflective pole and dual back-to-back display of pedestrian-crossing signs can help increase motorists attention for pedestrian-crossing activities. They were identified as a best practice during the field review; Figure 45 and Figure 60 show examples. Figure 60. Pedestrian-crossing sign (dual back-to-back display) on N. Clark St., Chicago. 68
93 6.3.6 Education Program The newness of PHBs can cause a lower drivers yielding rate (Fitzpatrick et al. 2014(a)); therefore, a program should be created to educate drivers on how to react to different phases of a PHB and any other new pedestrian-crossing treatments (Figure 61). Figure 61. Sequence for a pedestrian hybrid beacon (FHWA, 2009). 6.4 USE OF FENCES AND SEPARATED-GRADE CROSSING During the field review, it was found that many severe crashes occurred at sites without marked pedestrian crossings. Despite these safety problems, some of these locations might not meet the minimum requirements for marking a crosswalk. To address the pedestrian-crossing needs at those sites and ensure pedestrian safety, two solutions are recommended: pedestrian channelization using fences to guide pedestrians to nearby crossings and grade-separated crossings. This section discusses these two solutions and makes recommendations for the final guidelines Fencing Fencing to guide pedestrians to use nearby crossings should be provided at locations that show all of these characteristics: Meet the pedestrian-crossing need requirement, especially with documented B- or severe-injury pedestrian crashes Don t meet minimum crosswalk-spacing requirements Don t meet minimum requirements of speed, crossing distance, or sight distance Corresponding pedestrian signs (Figure 62) should be used in conjunction with fencing to guide pedestrians to nearby crossings. 69

94 Figure 62. Pedestrian signs used in conjunction with fencing Grade-Separated Crossing This study recommends considering grade-separated crossings for the following conditions: Locations with large pedestrian generators/attractions; high pedestrian and traffic conflicts, especially with documented B and more severe pedestrian crashes; but don t meet the minimum requirements for at-grade crossing of speed limit (> 40 mph), crossing distance (more than six lanes), or sight distance. Pedestrian warrants for a traffic signal is met, but the decision is made not to install a traffic signal; and the location doesn t meet the minimum requirements for atgrade crossing of speed limit > 40 mph) and crossing distance of more than six lanes. Sites where grade-separated crossings are recommended should be at least 600 ft from the nearest alternative safe crossing (i.e., signalized crossing or alternative under/overpass). As part of the grade-separated crossing-design plan, a physical barrier is desirable to prohibit atgrade crossing of the roadway. A well-designed grade-separated crossing should meet the following conditions (AASHTO, 2004): The design is accessible to all users. Barriers are added to make the pedestrian feel safe. It has adequate lighting to improve pedestrian security against crime. Width of the crossing structure is adequate to accommodate the pedestrian demand. 70
95 CHAPTER 7: SUMMARY AND CONCLUSIONS Pedestrians are the most vulnerable users of our surface-transportation system. When they cross at uncontrolled midblock locations or unsignalized intersections, the collision and severeinjury risks to them are much higher than at signalized intersections. It is critical to select pedestrian-crossing sites and treatments properly at uncontrolled locations to ensure pedestrians safety. Currently, no systematic guidelines regarding pedestrian-treatment implementation at uncontrolled locations in Illinois are available. To address this need, IDOT initiated this research study to develop procedures and guidelines for pedestrian-crossing treatments at uncontrolled locations. To achieve the project objectives, the research team conducted a comprehensive literature review of related studies and existing guidelines, a survey and interview of Illinois transportation engineers, statistical analysis of Illinois pedestrian crash data from 2010 to 2014, and a field review of selected high-crash corridors (HCCs) in Illinois. The literature review showed a great number of studies have attempted to predict the safety benefits of a variety of treatments. Past studies generally agree that the following treatments can improve pedestrian safety at crossings: raised medians/pedestrian-refuge islands; Danish offsets; advanced stop lines and signs; in-street crossing signs; flashing beacons, including PHB and RRFBs; and in-roadway lights. Contradictory results were obtained on the performance of using paint striping only, pedestrian channelization, and curb extensions. Although guidance is available at the national level for pedestrian crosswalks, limited information exists about pedestrian crossings at uncontrolled locations. Further, many states have already established their own manuals to guide practitioners toward consistent treatment of pedestrian safety; but these publications are mainly suitable for their jurisdictions and cannot be easily generalized or used in other states. The survey and interview results indicated that the MUTCD and the BDE Manual were the most used resources for crosswalks warrants, as well as for design guidance, although no systematic guidance is given in either manual. For crosswalk warrants, considerations included vehicle speeds, alternative nearby crosswalks, pedestrian volumes, and suggestions from decision makers (i.e., mayors). Those were also the factors suggested by respondents for the final guidebook. All IDOT districts and CDOT were using signage, standard striping, and flashing beacons to improve pedestrian safety at midblock and uncontrolled crossing locations. These treatments were also suggested for the final guidebook by survey respondents and interviewees. The crash-data analysis results reveal the risk of higher severity levels of pedestrian crashes increased at uncontrolled locations during summer and fall seasons; with younger drivers; with older pedestrians; when pedestrians wear no contrasting clothing; near rural landforms; on dark, unlit roads; when ice is present on roads; on divided roadways; in cities with a population more than 25,000 and up to 50,000 people; and at unmarked crosswalks. Risk factors related to driver and pedestrian characteristics were also evaluated exclusively for uncontrolled locations. Very interestingly, it was found that uncontrolled locations in rural areas were riskier for pedestrians than those in urban areas; divided highways were slightly 71
96 riskier for severe-injury pedestrian crashes; and cities with populations more than 25,000 and up to 50,000 people had a higher risk of severe-injury pedestrian crashes. Most importantly, the analysis proved that marked crosswalks decreased the risk of severe-injury pedestrian crashes by 35% at uncontrolled locations in Illinois. The HCC field review complemented the crash-data analysis. Contributing factors identified for pedestrian crashes included high traffic speed, wide crossing distance, insufficient sight distance, improper location of bus stops, multiple threats, poor lighting conditions at night, improper pedestrian-crossing treatments, risky pedestrian and motorist behavior, and inadequate maintenance. The findings from the field review confirmed part of the crash-data analysis results. For instance, crashes that occurred at sites without marked crosswalks were more severe than those at marked crosswalks; crashes in rural areas tended to be more severe than those in urban areas. The data suggested a high correlation between crash locations and low-income neighborhoods, areas close to bars/restaurants, and areas close to senior housing. This relation between land use and pedestrian safety suggests that pedestrian safety is not only an engineering issue; planners and social services could also play a role. Several best practices were observed during the field review, including effective road-diet treatments, dual back-to-back display of pedestrian-crossing signs, retroreflective-mounting poles, effective advanced-stop-line treatments, and pedestrian crossings placed at the highest point of a vertical curve. Based on the findings from the research tasks, the best practices to implement various pedestrian-crossing treatments suitable to conditions in Illinois were identified, and recommendations were made for the final guidelines. The recommendations cover aspects of pedestrian-treatment implementation at uncontrolled locations, including crossing-site selection, format of treatment-selection procedure, effective variables to define the relative risk of crossing sites, treatments and treatment categories suitable for Illinois conditions, effectiveness and applicable conditions of various treatments, suggested treatments for various site conditions, crosswalk marking pattern, bus stop location, crosswalk lighting, education program, as well as the use of fencing and grade-separated crossings. A guidebook was then developed based on these best practices and recommendations made in the study. The guidebook has six sections. Section 1 is an introduction, explaining the purpose of and how to use the guidebook; section 2 provides guidance on how to identify a location for treatment; section 3 elaborates on various treatments available for uncontrolled locations; section 4 includes a concise table that guides the user toward selecting an appropriate treatment for a given location, based on various site characteristics; section 5 addresses other safety considerations that are not directly related to crossing (e.g., crosswalk lighting, bus stop locations, and education programs); finally, section 6 discusses additional treatments that do not fall under any of the categories described in section 3, including fences and gradeseparated crossings. The guidebook was developed by reviewing quantitative research results and existing national-, state-, and city-level guidelines; analyzing and reviewing Illinois crash data and HCC sites; gathering opinions and information from Illinois engineers and practitioners; and using engineering judgement. It is intended to serve state and local agencies as an informational 72
97 resource to supplement, not to replace or supersede, existing standards and manuals, with a comprehensive discussion of strategies and treatments to enhance pedestrian safety at uncontrolled locations in their jurisdictions. The target audiences for this guidebook are transportation professionals, highway designers, traffic engineers, law enforcement officers, and safety specialists who may be involved in efforts to reduce pedestrian crashes at uncontrolled locations. The guidebook covers a large variety of treatments that have been proved effective and are suitable for conditions in Illinois. Although the focus of the guidebook is at-grade pedestriancrossing treatments, general rules for using separated-grade crossings are also provided. To facilitate the guidebook s easy use, quantities and thresholds were provided; but flexibility is included to allow for engineering judgement in making decisions, to consider their specific conditions such as driving behavior, safety culture, and traffic operation and control. The guidebook provides information to support consistent and effective engineering practice in Illinois on the implementation of pedestrian-crossing treatments at uncontrolled locations. It can be used to (1) evaluate if candidate sites or existing uncontrolled crossings are suitable for pedestrian crossing; (2) select appropriate pedestrian treatment(s) for new sites; and (3) assess the appropriateness of existing pedestrian treatment(s) at uncontrolled locations and make improvement recommendations. 73
98 REFERENCES AASHTO (American Association of State Highway and Transportation Officials), Guide for the Planning, Design, and Operation of Pedestrian Facilities. Washington, DC: American Association of State Highway and Transportation Officials. AASHTO (American Association of State Highway and Transportation Officials), Highway Safety Manual 1st Edition. Washington, DC: American Association of State Highway and Transportation Officials. ADOT (Arizona Department of Transportation), Traffic Engineering Guidelines and Processes; Section 900: Pedestrians. [Accessed 30 May 2017]. Arnold, E. D., Development of Guidelines for In-Roadway Warning Lights. Charlottesville, Virginia: Virginia Transportation Research Council. VTRC 05-R10. Bennett, M., & Van Houten, R., Variables Influencing Efficacy of Gateway In-Street Sign Configuration on Yielding at Crosswalks. Transportation Research Record: Journal of the Transportation Research Board, 2586: Bernhoft, I. M., & Carstensen, G., Preferences and behaviour of pedestrians and cyclists by age and gender. Transportation Research Part F: Traffic Psychology and Behaviour, 11(2): Brewer, M. A., Fitzpatrick, K., & Avelar, R., Rectangular Rapid Flashing Beacons and Pedestrian Hybrid Beacons: Pedestrian and Driver Behavior before and after Installation. Transportation Research Record: Journal of the Transportation Research Board, 2519:1 9. Bureau of Local Roads & Streets, BLRS Manual: Special Design Elements. Springfield, Illinois: Illinois Department of Transportation. Campbell, B., Zegeer, C., Huang, H., & and Cynecki, M., A Review of Pedestrian Safety Research in the United States and Abroad. McLean, VA: Federal Highway Administration. FHWA-RD Cantillo, V., Arellana, J., & Rolong, M., Modelling pedestrian crossing behaviour in urban roads: A latent variable approach. Transportation Research Part F: Traffic Psychology and Behaviour, 32: CBTD (City of Boulder Transportation Division), Pedestrian Crossing Treatment Installation Guidelines. Boulder, Colorado: City of Boulder Transportation Division. CDOT (Chicago Department of Transportation), Evaluation of School Traffic Safety Program Traffic Control Measure Effectiveness. [Accessed 2017 May 30]. CDOT (Chicago Department of Transportation), Pedestrian Plan. Chicago: Chicago Department of Transportation. 74
99 China Road Traffic Accidents Statistics Report, China Road Accidents Statistics Report in Beijing, China: Traffic Administration Bureau of China. Chu, X., Guttenplan, M., & Kourtellis, A., Considering Usage and Safety Effects in Guidelines for Uncontrolled Midblock Crosswalks. Washington, DC: Transportation Research Board 86th Annual Meeting, January City of Madison DOT, Year 2 Field Evaluation of Experimental In-Street Yield to pedestrian Signs. Madison, Wisconsin: Traffic Engineering Division: City of Madison DOT. Das, S., & Sun, X., Factor Association with Multiple Correspondance Analysis in Vehicle Pedestrian Crashes. Transportation Research Record: Journal of the Transportation Research Board, 2519: Department of Main Roads, Zig-Zag Advance Pavement Markings at Marked Crosswalks. Sydney, Australia. Circular TS 88/3. Dougald, L. E., Best Practices in Traffic Operations and Safety: Phase II: Zig-zag Pavement Markings. Charlottesville, VA : Virginia Transportation Research Council. VTRC 11-R9. Ellis, R., & Houten, R. V., Reduction of Pedestrian Fatalities, Injuries, Conflicts, and Other Surrogate Measures in Miami-Dade, Florida. Transportation Research Record: Journal of the Transportation Research Board, 2140: Engelberg, J., Hill, L., Rybar, J., & Styer, T., Distracted driving behaviors related to cell phone use among middle-aged adults. Journal of Transport & Health, 2(3): ETSC (European Transport Safety Council), Safety of Pedestrians and Cyclists in Urban Areas. Brussels, Belgium: European Transport Safety Council. FDOT (Florida Department of Transportation), Traffic Engineering Manual. Florida Department of Transportation. Topic FHWA (Federal Highway Administration), Manual on Uniform Traffic Control Devices. Federal Highway Administration. FHWA (Federal Highway Administration), 2010(a). Effects of Yellow Rectangular Rapid-Flashing Beacons. McLean, VA: Turner-Fairbank Highway Research Center, Federal Highway Administration. FHWA-HRT FHWA (Federal Highway Administration), 2010(b). Safety Benefits of Raised Medians and Pedestrian Refuge Areas. Washington, DC: Federal Highway Administration. FHWA-SA FHWA (Federal Highway Administration), 2010(c). HSIS Summary Report: Evaluation of Lane Reduction Road Diet Measures on Crashes. McLean, VA: Turner-Fairbank Highway Research Center, Federal Highway Administration. FHWA-HRT Fitzpatrick, K., & Park, E., Safety Effectiveness of the HAWK Pedestrian Crossing Treatment. McLean, VA. FHWA-HRT Fitzpatrick, K., & Pratt, M., Road User Behaviors at Pedestrian Hybrid Beacons. Transportation Research Record: Journal of the Transportation Research Board, 2586:
100 Fitzpatrick, K., Brewer, M. A., & Avelar, R., 2014(b). Driver Yielding at Traffic Control Signals, Pedestrian Hybrid Beacons, and Rectangular Rapid Flashing Beacons in Texas. Transportation Research Record: Journal of the Transportation Research Board, 2463: Fitzpatrick, K., Iragavarapu, V., Brewer, M. A., Lord, D., Hudson, J., Avelar, R., & Robertson, J., 2014(a). Characteristics of Texas Pedestrian Crashes and Evaluation of Driver Yielding at Pedestrian Treatments. Austin, TX. FHWA/TX-13/ Fitzpatrick, K., Turner, S., Brewer, M., Carlson, P., Ullman, B., Trout, N., Park, E. S., Whitacre, J., Lalani, N., & Lord, D., Improving Pedestrian Safety at Unsignalized Crossings. Washington, DC. Transit Cooperative Research Program Report 112/National Cooperative Highway Research Program Report 562. Geruschat, D. R., & Hassan, S. E., Driver Behavior in Yielding to Sighted and Blind Pedestrians at Roundabouts. Journal of Visual Impairment & Blindness, 99(5): Gibbons, R. B., Edwards, C., Williams, B., & Andersen, C. K., Informational Report on Lighting Design for Midblock Crosswalks. McLean, VA: Federal Highway Administration. FHWA-HRT Godavarthy, R., & Russell, E., Effectiveness of a HAWK Beacon Signal at Mid-Block Pedestrian Crossings in Decreasing Unnecessary Delay to the Drivers. Transportation Research Board 89th Annual Meeting, January Godfrey, D., & Mazzella, T., Kirkland s Experience with In-Pavement Flashing Lights at Crosswalks. Lynnwood, WA: ITE/IMSA Annual Meeting, February 8, Griffiths, J. D., Hunt, J. G., & Marlow, M.,1984. Delay at pedestrian crossings. Traffic Engineering and Control, 25(7/8) Haleem, K., Alluri, P., & Gan, A., Analyzing pedestrian crash injury severity at signalized and non-signalized locations. Elsevier: Accident Analysis and Prevention, 81: Hamed, M. M., Analysis of pedestrians behavior at pedestrian crossings. Elsevier: Safety Science, 38(1): Hatfield, J., & Murphy, S., The effects of mobile phone use on pedestrian crossing behaviour at signalised and unsignalised intersections. Elsevier: Accident Analysis & Prevention, 39(1): Havard, C., & Willis, A., Effects of installing a marked crosswalk on road crossing behaviour and perceptions of the environment. Transportation Research Part F: Traffic Psychology and Behaviour, 15(3): Hawley, L., Henson, C., Hulse, A., & Brindle, R., Towards Traffic Calming: A Practitioners Manual of Implemented Local Area Traffic Management and Blackspot Devices. Federal Office of Road Safety, Canberra, Australian Capital Territory, Australia. Publication CR 126, HDOT (Hawaii Department of Transportation), Intersections and Crossings: Toolbox Section 5. Hawaii Department of Transportation. 76
101 Heaslip, K., Collura, J., & Louisell, C., Evaluation of Work Zone Design Strategies Quatifying the impact of Driver Behavior on Traffic Flow and Safety. Washington, DC: Transportation Research Board 86th Annual Meeting, January Highway Safety Research Center: University of North Carolina, Florida Pedestrian Planning and Design Handbook. Florida Department of Transportation. Hill, L., Rybar, J., Styer, T., Fram, E., Merchant, G., & Eastman, A., Prevalence of and Attitudes About Distracted Driving in College Students. Traffic Injury Prevention, 16(4): Houten, R., LaPlante, J., & Gustafson, T., Evalualuating Pedestrian Safety Improvements. Kalamazoo, MI: Michigan Department of Transportation. Houten, V., McCusker, R., Huybers, D., Malenfant, S., & Rice-Smith, D., Advance Yield Markings and Fluorescent Yellow-Green RA 4 Signs at Crosswalks with Uncontrolled Approaches. Transportation Research Record: Journal of the Transportation Research Board 1818: Huang, H., An Evaluation of Flashing Crosswalks in Gainesville and Lakeland. Florida Department of Transportation. R0043. Huang, H. F., & Cynecki, M. J., The Effects of Traffic Calming Measures on Pedestrian and Motorist Behavior. Washington, DC: Federal Highway Administration. FHWA-RD Huang, H., Zegeer, C., Nassi, R., & Fairfax, B., Pedestrian Signs at Unsignalized Locations: A Tale of Three Treatments. Federal Highway Administration. FHWA-RD Hunter, E. E., Salamati, K., Elefteriadou, L., Sisiopiku, V. P., Rouphail, N. M., Phillips, B. N., & Schroeder, B. J., Driver Yielding at Unsignalized Midblock Crossings. Washington, DC, Transportation Research Board 94th Annual Meeting, January Hunter-Zaworski, K., & Mueller, J., Evaluation of Alternative Pedestrian Traffic Control Devices. Washington, DC. FHWA-OR-RD Huybers, S., Van Houten, R., & Malefant, J., Reducing Conflicts Between Motor Vehicles and Pedestrians: The Separate and Combined Effects of Pavement Markings and a Sign Prompt. Journal of Applied Behavior Analysis, 37(4): Hwang, S., & Park, C., Modeling of the Gap Acceptance Behavior at a Merging Section of Urban Freeway. In Proceedings of the Eastern Asia Society for Transportation Studies, Volume 5, Chiyoda-ku, Tokyo, pp Hyman, I. E., Boss, S. M., Wise, B. M., McKenzie, K. E., & Caggiano, J. M., Did you see the unicycling clown? Inattentional blindness while walking and talking on a cell phone. Applied Cognitive Psychology, 24(5): IDOT (llinois Department of Transportation), Roadway Functional Class. [Accessed 30 December 2016]. IDOT (llinois Department of Transportation), Roadway Functional Class. [Accessed 30 December 2016]. 77
102 IDOT (Illinois Department of Transportation), Bureau of Design and Environmental Manual: Pedestrian and Bicycle Accomodation. Illinois Department of Transportation. IDOT (llinois Department of Transportation), Traffic Count Database System. [Accessed 20 December 2016]. IDOT (llinois Department of Transportation), Roadway Functional Class. [Accessed 30 December 2016]. IL MUTCD, Illinois Supplement to the MUTCD. Illinois Department of Transportation. ITE (Institute of Transportation Engineers), Designing Walkable Urban Thoroughfares: A Context Sensitive Approach. Washington, DC: Institute of Transportation Engineers. RP- 036A. Jang, K., Park, S., Kang, Sanghyeok, Song, K., Kang, Seungmo, & Chung, S., Evaluation of pedestrian safety: pedestrian crash hot spots and risk factors for injury severity. Transportation Research Record: Journal of the Transportation Research Board, 2393: Kamyab, A., Andrle, S., & Kroeger, D., Methods to Reduce Traffic Speed in High Pedestrian Areas. St. Paul, MN: Minnesota Department of Transportation. Kannel, E. J., Souleyrette, R., & Tenges, R., In- Street Yield to Pedestrian Sign Application in Cedar Rapids, Iowa. Iowa Department of Transportation. CTRE Project Knoblauch, R., Nitzburg, M. & Seifert, R., Pedestrian Crosswalk Case Studies. McLean, VA. FHWA-RD Kometani, E., & Sasaki, T., Dynamic Behavior of Traffic with a Nonlinear Spacing-Speed Relationship. In Symposium on Theory of Traffic Flow, pp Lalani, N., & the ITE PEdestrian and Bicycle Task Force, Alternative Treatments for At- Grade Pedestrian Crossings: An Informational Report. Washington, DC: Institute of Transportation Engineers. Series LP-629. Lee, C., & Abdel-Aty, M., Comprehensive analysis of vehicle and pedestrian crashes at intersections in Florida. Accident Analysis and Prevention, 37(4): Lincoln, O., & Tremblay, J. P., Pedestrian Hybrid Beacon Crosswalk System (PHB) or High- Intensity Activated Crosswalk (HAWK) Evaluation. Montpelier, VT: Vermont Agency of Transportation Research & Development Section. Report Lindley, J. A., Guidance Memorandum on Consideration and Implementation of Proven Safety Countermeasures. [Accessed 30 May 2017]. Ma, M., Yan, X., Abdel-Aty, M., Huang, H., & Wang, X., Safety Analysis of Urban Arterials under Mixed Traffic in Beijing, China. Transportation Research Record: Journal of the Transportation Research Board, 2193:
103 Macbeth, A., Balliol Street in Traffic Calming. Toronto, Canada, Traffic Engineering Committee Workshop, Ontario Traffic Conference. Malek, M., Crosswalk Enhancement Comparison Study. San Jose, CA: City of San Jose DOT. Markowitz, F., & Montufar, J., Developments in Automated Pedestrian Detection. Institute of Transportation Engineers. Markowitz, F., Jeannette, M., & Maury, S., Automated Pedestrian Detection: State of the Art, Institute of Transportation Engineers. Maxwell, A., Kennedy, J., Routledge, I., Knight, P., & Wood, K., Puffin Pedestrian Crossing Accident Study. Berkshire, U.K: Transportation Research Library. PPR 507. Mohan, D., Tsimhoni, O., Sivak, M., & Flannagan, M. J., Road safety in India: Challenges and opportunities. Transport Research Institute, University of Michigan. UMTRI Moore, R., & Older, S. J., Pedestrians and Motor Vehicles are Compatible in Today s World. Traffic Engineering, 35(12): Mutabazi, M., Sight obstruction at at-grade pedestrian crossings: A review of the understanding of the meaning of zigzag lines. Safety Science, 48: Nabors, D., Schneider, R., Leven, D., Lieberman, K., & Mitchell, C., Pedestrian Safety Guide for Transit Agencies. Washington, DC: Federal Highway Administration. FHWA-SA NACTO (National Association of City Transportation Officials), Pedestrian Safety Islands. [ [Accessed 15 March 2017] Nasara, J. L., & Troyerb, D., Pedestrian injuries due to mobile phone use in public places. Accident Analysis and Prevention, Volume 57: NHTSA (National Highway Traffic Safety Administration), Policy Statement and Compiled FAQs on Distracted Driving. Distracted+Driving [Accessed 20 March 2016]. Nemeth, B., Tillman, R., Melquist, J., & Ashley, H., Uncontrolled Pedestrian Crossing Evaluation Incorporating Highway Capacity Manual Unsignalized Pedestrian Crossing Analysis Methodology. St. Paul, MN: Minnesota Department of Transportation. MN/RC NHTSA (National Highway Traffic Safety Administration), Traffic safety facts. Washington, DC: National Center for Statistics and Analysis. DOT HS NHTSA (National Highway Traffic Safety Administration), Distracted Driving Washington, DC: National Highway Traffic Safety Administration. DOT HS Nicole, M. C., Effects of Symbol Prompts and 3D Pavement Illusions on Motorist Yielding at Crosswalks. Western Michigan University. 79
104 Northern Ireland Department for Regional Development, Kennedy Launches PUFFIN Crossing Rollout. [Accessed 5 October 2015]. NYSDOT (New York State Department of Transportation), Highway Design Manual: Chapter 18 Pedestrian Facility Design. [Accessed 10 May 2017]. Parvathy, M. N., & Ravishankar, K., Evaluation of Pedestrian Risk Factors for Uncontrolled Mid Block and Unsignalised Intersections. Washington, DC: Transportation Research Board 95th Annual Meeting, January Pecheux, K., Bauer, J., & McLeod, P., Pedestrian Safety and ITS-Based Countermeasures Program for Reducing Pedestrian Fatalities, Injury Conflicts, and Other Surrogate Measures Draft Zone/Area-Wide Evaluation Technical Memorandum. Washington, DC: United States Department of Transportation. PEDSAFE, Pedestrian Safety Guide and Countermeasure Selection System. [Accessed 10 January 2017]. Pulugurtha, S., Nambisan, S. S., Dangeti, M. R., & Vasudevan, V., An Evaluation of Effectiveness of Traffic Signs to Enhance Pedestrian Safety. Washington, DC, Transportation Research Board 89th Annual Meeting, January Pulugurtha, S., Vasudevan, V., Nambisan, S., & Dangeti, M., Evaluating the Effectiveness of Infrastructure-based Countermeasures on Pedestrian Safety. Transportation Research Record: Journal of the Transportation Research Board, 2299: Queensland Department of Main Roads, Pavement Markings on Approach to Pedestrian Crossings. Ribbens, H., Pedestrian Facilities in South Africa: Research and Practice.. Transportation Research Record: Journal of the Transportation Research Board, 1538: Rodegerdts, L., Bansen, J., Tiesler, C., Knudsen, J., & Myers, E., Roundabouts in the United States, Washington, DC: National Cooperative Highway Research Program. NCHRP Report 572. Ross, J., Serpico, D. & Lewis, R., Assessment of Driver Yielding Rates Pre- and Post-RRFB Installation, Bend, Oregon. Salem, OR: Oregon Department of Transportation. FHWA-OR-RD Salamati, K., Schroeder, B. J., Geruschat, D. R., & Rouphail, N. M., Event-Based Modeling of Driver Yielding Behavior to Pedestrians at Two-Lane Roundabout Approaches. Transportation Research Record: Journal of the Transportation Research Board, 2389:1 11. Schroeder, B. J., & Rouphail, N. M., Event-Based Modeling of Driver Yielding Behavior at Unsignalized Crosswalks. ASCE Journal of Transportation Engineering, 137(7):
105 Schwebel, D. C., Stavrinos, D., Byington, K. W., Davis, T., O Neal, E. E., & DeJong, D., Distraction and pedestrian safety: how talking on the phone texting, and listening to music impact crossing the street. Accident Analysis & Prevention, 45: SDOT (Seattle Department of Transportation), Seattle Department of Transportation. [Accessed 22 January 2017]. Shurbutt, J., Houten, R. V., & Turner, S., An Analysis of the Effects of Stutter Flash LED Beacons to Increase Yielding to Pedestrians Using Multilane Crosswalks. Washington, DC: Transportation Research Board 87th Annual Meeting, January Siddiqui, N., Chu, X., & Guttenplan, M., 2006(b). Crossing locations, light condutions, and pedestrian injury severity. Transportation Research Record: Journal of the Transportation Research Board, 1982: Siddiqui, N., Chu, X., & Guttenplan, M., 2006(a). Midblock Crosswalk Markings and Pedestrian Injury Severity. Center for Urban Transportation Research, University of South Florida, Tampa. Sisiopiku, V. P., & Akin, D., Pedestrian behaviors at and perceptions towards various pedestrian facilities: An examination based on observation and survey data. Transportation Research Part F: Traffic Psychology and Behaviour, 6(4): Stand, L., & Zegeer, C., Characteristics Related to Midblock Pedestrian Crashes and Potential Treatments. Transportation Research Record: Journal of the Transportation Research Board, 1982: Stavrinos, D., Byington, K., & Schwebel, D. C., Distracted walking: Cell phones increase injury risk for college pedestrians. Journal of Safety Research, 42(2): Strong, C., & Bachman, D., Safety Evaluation of Yield-to-Pedestrian Channelizing Devices. Washington, DC: Transportation Research Board 87th Annual Meeting, January Strong, C., & Kumar, M., Safety Evaluation of Yield-to-Pedestrian Channelizing Devices: Final Report. Pennsylvania Department of Transportation. FHWA-PA Sun, D., Ukkusuri, S., Benekohal, R. F., & Waller, S. T., Modeling of Motorist Pedestrian Interaction at Uncontrolled Mid-Block Crosswalks. Washington, DC: Transportation Research Board 82nd Annual Meeting, January Taubman-Ben-Ari, O., & Shay, E., The association between risky driver and pedestrian behaviors: The case of Ultra-Orthodox Jewish road users. Transportation Research Part F: Traffic Psychology and Behaviour, 15(2): Turner, S., Fitzpatrick, K., Brewer, M., & Park, E., Motorist Yielding to Pedestrians at Unsignalized Intersections: Findings from a National Study on Improving Pedestrian Safety. Transportation Research Record: Journal of the Transportation Research Board, 1982:1 12. Turner, S. M., & Carlson, P. J., Pedestrian Crossing Guidelines for Texas. Austin, Texas: Texas Department of Transportation. FHWA/TX-01/
106 U.K. Department of Transportation, Killing Speed and Saving Lives. London: U.K. Department of Transportation. Ulster County Transportation Council, Safe Routes to School. [Accessed 23 January 2017]. Van Winkle, W. J., & Neal, D. A., Pedestrian-Actuated Crosswalk Flashers. Nashville, TN: ITE 2000 Annual Meeting. VDOT (Virginia Department of Transportation), Guidelines for the Installation of Marked Crosswalks. VDOT, Traffic Engineering Division. VTRC 05-R18. Whitlock & Weinberger Transportation, Inc., An evaluation of a crosswalk warning system utilizing In-pavement flashing lights. Santa Rose, CA: Whitlock & Weinberger Transportation, Inc. WHO (World Health Organization), Global Status Report on Road Safety: Time for Action. [Accessed 24 September 2015]. Wilson, D., Zig-zag Markings at Zebra Crossings: A Before and After Study. Berkshire, U.K.: Transport and Road Research Laboratory. 35RC. WSDOT (Washington State Department of Transportation), Design Manual. Washington State Department of Transportation. M Young, K., Salmon, P., & Cornelissen, M., Distraction-induced driving error: An on-road examination of the errors made by distracted and undistracted drivers. Accident Analysis & Prevention, 58: Yuan, J., & Dulaski, D. M., Drivers Yielding Behavior at Crosswalks with Varying Treatments During the Day and Night. Transportation Research Board 2017 Annual Meeting. Zahabi, S., Strauss, J., Manaugh, K., & Miranda-Moreno, L., Estimating potential effects of speed limits, built environment, and other factors on severity of pedestrian and cyclist injuries in crashes. Transportation Research Record: Journal of the Transportation Research Board, 2247: Zegeer, C. V., Seiderman, C., Lagerwey, P., Cynecki, M., Ronkin, M., & Robert, S., Pedestrian Facilities Users Guide Providing Safety and Mobility. McLean, VA: Federal Highway Administration. FHWA-RD Zegeer, C. V., Huang, H., Lagerwey, P., & Feaganes, J., Safety Effects of Marked versus Unmarked Crosswalks at Uncontrolled Locations: Final Report and Recommended Guidelines. Washington, DC: U.S. Department of Transportation. FHWA HRT Zegeer, C. J., Huang, H., Lagerwey, P. & Feaganes, J., Safety Effects of Marked versus Unmarked Crosswalks at Uncontrolled Locations: Final Report and Recommended Guidelines, Washington, D.C.: U.S. Department of Transportation, FHWA HRT
107 Zhou, R., William, H. J., & Yu, R., The effect of conformity tendency on pedestrians roadcrossing intentions in China: an application of the theory of planned behavior. Accident Analysis & Prevention, 41(3):
108 APPENDIX A: GUIDELINES FOR IMPROVING PEDESTRIAN SAFETY AT UNCONTROLLED LOCATIONS SECTION 1: INTRODUCTION This guidebook is intended to serve state and local agencies as an informational resource to supplement, not to replace or supersede, existing standards and manuals, with a comprehensive discussion of strategies and treatments to enhance pedestrian safety at uncontrolled locations in their jurisdictions. The target audiences for this guidebook are transportation professionals, highway designers, traffic engineers, law enforcement officers, and safety specialists who may be involved in efforts to reduce pedestrian crashes at uncontrolled crossing locations. Herein, midblock locations and intersection approaches without traffic signals or stop/yield signs are considered as uncontrolled locations. The guidebook provides recommendations for the engineering practice in Illinois on the implementation of pedestrian crossing treatments at uncontrolled locations. It can be used to 1) evaluate if candidate sites or existing uncontrolled crossings are suitable for pedestrian crossing; 2) select appropriate pedestrian treatment(s) for new sites; and 3) assess the appropriateness of existing pedestrian treatment(s) at uncontrolled locations and make improvement recommendations. Given the large and diverse number of pedestrian crossing treatments, it would be impractical for the guidebook to include all of them. Instead, the guidebook covers a large variety of treatments that have been proved effective and are suitable for Illinois conditions. Although focus of the guidebook is on at-grade pedestrian crossing treatments, general rules for using separate-grade crossings are also provided. The guidebook was developed based on the best practices identified from extensive literature review of related past studies as well as national, state, and city level guidelines; survey and interview of Illinois local engineers; Illinois crash data analysis; and field review of high crash locations in Illinois. To facilitate easy use, the guidebook gives quantitative thresholds while still allowing practitioners the flexibility in making decisions to consider their specific conditions, such as driving behavior, safety culture, traffic operation and control, etc. This guideline document begins with the description of various warrants/minimum requirements to be considered before approval of a pedestrian crossing facility at an uncontrolled location. The warrants deal with a variety of aspects such as speed, crossing distance, crosswalk spacing, stopping sight distance and pedestrian sight distance. In addition to these warrants, community requests and pedestrian demand levels can also be considered while making the decisions. The salient points of each warrant are highlighted across section 2. A list of suitable treatments for uncontrolled locations is included in this document. The treatments are categorized based their complexity and effectiveness. A description each treatment can be found in section 3 of this document. Guidance on selection of appropriate treatments for a given location is presented in Table A3 of section 3, which forms the crux of this section. Section 4 deals with other safety considerations that are not directly related to crossing. Guidance on crosswalk lighting, bus stop locations and education programs is briefly 84
109 discussed. Finally, Chapter 5 discusses additional treatments that do not fall under any of the categories described in chapter 3. These include fences and grade separated crossings. SECTION 2: EVALUATION OF CANDIDATE LOCATIONS FOR INSTALLATION OF CROSSING TREATMENTS Given the higher risk exposure of pedestrians at uncontrolled locations compared to signalized intersections, uncontrolled crossings should be used conservatively. Uncontrolled pedestrian crossings should only be installed at locations that fit any of the Yes situations but do not fit any of the No situations as shown below: Uncontrolled pedestrian crossings should be considered: ( Yes situations) Crash record consideration Where there has been a minimum of two B- or A-injury crashes in two years, or one fatal crash, in the vicinity of an uncontrolled location without a designated crossing. Crosswalk usage consideration Where there is a specific request from a local government or community. Based on identified pedestrian generator/destinations. Uncontrolled pedestrian crossings should not be considered (except in school zones, campus areas or where there is intensive commercial activity): ( No situations) Posted speed limit consideration Where the posted speed limit is greater than 40 mph. Pedestrian crossing needs along segments with speed limits greater than 40 mph should be addressed at signalized locations or based on pedestrian signal warrants as established in the IL MUTCD. Traffic Volume consideration Along roadway segments where traffic volume is greater than 35,000 vpd. Crossing distance consideration Along undivided highways with more than four travel lanes (if a raised median is not feasible to install). Along divided highways with more than six travel lanes (more than 3 lanes on each direction). Crosswalk spacing consideration Where an alternative crossing location, marked or unmarked, is within 300 feet (recommended) or 200 feet (minimum). 85
110 In midblock situations, less than 100 feet from any adjacent side street or driveway. Traffic volume consideration Where the ADT of the roadway is more than 35,000 vehicles per day. Sight distance consideration Where inadequate vehicle stopping sight distance or pedestrian sight distance is available. Sight Distance Calculations: Stopping Sight Distance (SSD), in ft =1.47V t V 2 /a Pedestrian Sight Distance (PedSD), in ft = 1.47V (L/Sp+ts) Where, V=posted speed limit (mph), t= brake reaction time (s), a= deceleration rate (ft/s 2 ), L= crossing distance (fat), Sp= pedestrians avg. walking speed (ft/s), ts= pedestrian start-up and end clearance time (s) Default values (according to AASHTO, HCM, & MUTCD): a=11.2 ft/s 2 ; t=2.5 s, Sp=3.5 ft/s; ts=3.0 s Sight Distances for different speed limits are provided in Table A1. Table A1. Recommended Sight Distance Values Posted speed limit, mph SSD,ft PedSD, ft 4.52*L 5.65*L 6.78*L 7.91*L *L SECTION 3: SELECTION OF AT-GRADE PEDESTRIAN CROSSING TREATMENTS FOR UNCONTROLLED LOCATIONS Treatment effectiveness is the primary consideration factor in selecting pedestrian crossing treatments in the guidebook. In addition, the easiness of maintenance and operation is also considered. At-grade pedestrian crossing treatments included in the guidebook are categorized into five categories as shown in Table A2. Table A2. At-Grade Pedestrian Crossing Treatments At-grade pedestrian treatment categories Basic Treatments Enhance Treatments Example Marked crosswalk with warning sign Advanced stop line and sign In-street crossing sign Overhead crossing sign 86

111 Geometric Elements Warning Beacon Control Beacon Curb Extension Road diet Raised median Raised crosswalk FB RRFB PHB Basic Treatments Marked crosswalk with warning sign Marked crosswalk with pedestrian crossing sign and warning plaque is considered as the most basic treatment category. Figure A- 1shows the pedestrian crossing and warning signs within the basic crosswalk treatments category. Pedestrian warning signs should always be installed in advance of mid-block crossings. For school crossing W11-2 signs should be replaced with S1-1 sign. At places where motorists do not expect to encounter pedestrian crossing the road (midblocks crossings in rural areas) and in school zones, advanced warning signs with AHEAD/distance plaque (W16-9P or W16-2P) should be considered. Enhanced Treatments Figure A- 1. Pedestrian crossing and warning signs (FHWA, 2009). Enhanced treatments are supplementary to the basic treatment to improve motorist compliance and pedestrian safety at uncontrolled crossings. Figure A- 2 depicts various signs used as enhanced treatments. In-street Crossing Sign For multilane crossing locations, State Law Stop to Pedestrian sign (R1-6a) shall be placed on a median island or on the centerline/lane line (FHWA, 2009). The IL MUTCD (2009) suggests that the sign support shall be designed to bend over and then bounce back to its normal position when struck by a vehicle. 87
 should be considered instead of an in-street crossing sign based on engineering judgment.")
112 Overhead Crossing Sign Figure A- 2. Uncontrolled pedestrian crosswalk signs (FHWA, 2009). Overhead crossing sign (R1-9a) should be considered instead of an in-street crossing sign based on engineering judgment. The overhead pedestrian crossing sign shall be placed over the roadway at the crosswalk location (FHWA, 2009). Advanced Stop Line and Sign If used, the sign (R1-5b or R1-5c) should be used in conjunction with a stop line (Figure A- 3(a)). For uncontrolled multi-lane crossings, advanced stop lines should be installed as much as 30ft prior to the crosswalk with a STOP HERE FOR CROSSWALK sign in both directions to reduce the chance of multiple-threat type collisions. a. b. Figure A- 3. a) Advanced stop line and sign (PEDSAFE, 2017) and b) Curb extensions (Turner and Carlson, 2000). Geometric Elements Unlike Signs, which require good compliance rates to be effective, geometric alterations to roadways will force drivers and pedestrians to behave in such a way that maximizes safety. A variety of geometric treatments for enhancement of pedestrian safety at uncontrolled locations are included in the guidebook. 88

 can ensure that pedestrians are facing oncoming traffic Figure A- 4 (a).")
113 Curb Extensions A curb extension is effective to reduce the pedestrian s exposure to traffic and reduce the crossing distance (Figure A- 3(b)). Another safety benefit of a curb extension is that pedestrian crossing signs placed there are more visible compared to being placed on road sides. Raised median/pedestrian refuge island, Raised median/pedestrian refuge islands provide pedestrians a facility for two-stage crossings when crossing multiple lanes Figure A- 4(a). The z crossing The z crossing (split pedestrian crossover or Danish offset) can ensure that pedestrians are facing oncoming traffic Figure A- 4 (a). When possible, the z crossing should be considered at all raised median crossings. Figure A- 4. a) Raised median (Pulugurtha et al. 2012); b) Danish Offset at Maryland Parkway, Las Vegas (Pecheux et al. 2009). Road diet a. b. A road diet is a traffic calming measure to reduce speed through reducing the number of travel lanes or narrowing the travel lanes. Only the lane reduction type of road diet is considered in the guidebook. The road diet is an effective way to improve pedestrian safety, since the exposure of pedestrians to traffic is reduced as the number of travel lanes drops. Figure A- 5 illustrates the view of a roadway before and after the road diet installation. 89

114 Raised Pedestrian Crossing Figure A- 5. Road Diet (Knapp et al. 2014). A raised pedestrian crossing is essentially a speed table (see Figure A- 6). It is effective in central business districts, densely developed urban areas, and university campuses, but is not used on state routes. Also, raised crossings are not appropriate on a bus route. Warning Beacons Flashing Beacons Figure A- 6. Raised crossing (PEDSAFE, 2017). Flashing Beacons can be designed to flash when activated by pedestrians or to flash all the time. Pedestrian-activated beacon should be used in most cases. Continuous flashing beacon can be considered at school crossing for specific time, e.g.7:30 AM to 9:30 AM and 2:30 PM to 4:30 PM. For multilane roadway, crossing overhead beacon (Figure A- 7b) should be considered over pole/side mounted (roadside) flashing beacon (Figure A- 7a) for improved visibility to motorists. 90
115 a. b. Figure A- 7. a) Pole mounted and b) Overhead flashing beacons (Fitzpatrick et al. 2006). Rectangular Rapid Flashing Beacon (RRFB) RRFB device is a pedestrian-activated yellow light system located at the roadside directly below side-mounted pedestrian crosswalk signs (Figure A- 8). Another type of installation is 4 RRFBs, with additional two RRFB installed at median. Although not yet included in the IL MUTCD, this treatment has been implemented by many states and has been evaluated in a number of studies with positive results. Signs used in conjunction with RRFBs usually include pedestrian crossing signs with arrow and supplemental sign. Control Beacon Pedestrian Hybrid Beacon (PHB) Figure A- 8. RRFB system (Pecheux et al. 2009). PHB can be used to warn and control traffic at an unsignalized location to assist pedestrians in crossing a street or highway at a marked crosswalk (FHWA, 2009). This treatment is included in the IL MUTCD (Figure A- 9). 91
116 Figure A- 9. PHB treatment at Arizona (Fitzpatrick et al. 2014). Table A3 gives the guidance on selection of pedestrian crossing treatments at uncontrolled locations based on the relative site crossing risks defined by traffic volume, posted speed limit, number of lanes, and median type. Considering the specific site conditions (e.g. safety culture, yielding rate, roadway LOS, etc.), additional or alternative treatment could be considered based on engineering judgment or study. 92
117 Table A3. Summary of Recommended Minimum Treatments at Uncontrolled Pedestrian Crossings *Lane Configuration ADT 9,000 9,000<ADT<15,000 15,000<ADT 25,000 25,000< ADT 35,000 ADT>35,000 posted speed, mph to 45 2 lanes or 3 lanes with raised median 3 lanes without raised median 4 lanes with raised median 6 lanes with raised median 4, 5, or 6 lanes without raised median 4 lanes, raised median not feasible BT BT Instreet sign ASLS In-street sign In-street sign ASLS 4RRFB (or overhead FB) + ASLS RRFB (or FB) + ASLS RRFB (or FB) + ASLS 4RRFB (or overhead FB) + ASLS 4RRFB (or overheadf B) + ASLS uncontrolled pedestrian crossing is not recommended BT BT ASL S ASL S FB RRFB (or FB) + ASLS ASLS (consider 4RRFB) 4RRFB (or overhead FB)+ ASLS RRFB (or FB) + ASLS RRFB (or FB) + ASLS 4RRFB (or overhead FB) + ASLS PHB+ ASLS Uncontrolled pedestrian crossing is not recommended Instreet sign FB 4RRFB (or overh ead FB) + ASLS 4RRFB (or overh ead FB)+ ASLS FB RRFB (or FB) + ASLS 4RRFB (or overhead FB) + ASLS 4RRFB (or overhead FB) + ASLS RRFB (or FB) + ASLS RRFB + ASLS **4 RRFB (consider PHB)+ ASLS Uncontrolled pedestrian crossing is not recommended In-street sign RRFB (or FB) + ASLS 4 RRFB (or overhead FB)+ ASLS RRFB (or FB) + ASLS RRFB (or FB) + ASLS ** PHB + CSOR RRFB (or FB) + ASLS Consider pedestrian refuge island or road diet, if feasible. If raised median, or road diet is feasible then follow the recommendatons for the above lane configurations, other wise follow the recommendation below for 4-lane without raised median to decide pedestrian crossing treatments, providing uncontrolled crossings of more than four lanes without a raised median is not recommended ASLS ASLS PHB+ CSOR ASL S RRFB (or overhead FB)+ ASLS PHB +CSOR BT= Basic Treatment (W11-2 with W16-7P) In-street sign= In-street stop for pedestrian sign (R1-6a); Overhead sign= Overhead crossing sign (R1-9a) may be used based on engineering judgment ASLS= Advanced stop line and sign (R1-5b and R1-5c) FB= Pedestrian activated flashing beacon (pole mounted) RRFB= Non-median installation of RRFB; 4 RRFB= Median installation of RRFB PHB=Pedestrian Hybrid Beacon; CSOR=Crosswalk Stop on Red line and sign RRFB (or overh ead FB)+ ASLS PHB +CSOR **PHB+ ASLS ** PHB+ CSOR PHB+ CSOR PHB +CSOR ** PHB + CSOR ** PHB +CSOR **PHB+ CSOR **PHB+ CSOR **PHB+ CSOR **PHB +CSOR Uncontrolled pedestrian crossing is not recommended Uncontrolled pedestrian crossing is not recommended 93
118 *= Lane configuration includes turn lanes, through lane, and bi-directional lanes. **= Check IL MUTCD signal warrants and consider the feasibility of a grade-separated crossings. Pedestrian hybrid beacons, when installed, create a controlled crossing. Check PHB warrants and comply with IL MUTCD. If PHB is not warranted then consider signal or grade separated crossing. Notes: 1. These treatments are recommended for existing uncontrolled crossings where enhancement is sought, and for new uncontrolled crossings where an engineering study indicates a clear warrant for a crossing. 2. Provision of lighting is recommended at midblock crossings. Refer to (Section 6.3.3) for guidance on lighting requirements for pedestrian crossings. 3. Ensure that adequate sight distance is provided for both drivers and pedestrians at uncontrolled crossings. Refer to (Section 6.1.4) for guidance. 4. At densely developed urban areas and on multi-lane roadway (4 or more lanes), curb extension should be considered when street parking is allowed and posted speed limit is 35 mph. 5. Uncontrolled crosswalk is not recommended if the speed limit is above 40 mph. 6. RRFB should not be installed within 300 ft. of a traffic signal. 7. At places where motorists do not expect crossing (mid-blocks and crossings in rural areas) and in school zones, advanced warning signs with AHEAD/distance plaque (W16-9P or W16-2P) should be considered. 94

119 SECTION 4: OTHER SAFETY CONSIDERATIONS Besides selecting appropriate pedestrian crossing treatments, other factors affect pedestrian safety at uncontrolled locations. This section summarizes those factors that should be considered when an uncontrolled pedestrian crossing is established. Crosswalk Pattern High visibility crosswalks should be used at uncontrolled pedestrian crossings. Continental type style crosswalk markings should be used in most cases. Textured crosswalks are another type of high visibility crosswalks, if used, standard style crosswalk should also be striped to increase the visibility at night (see Figure A- 10). For crosswalks on minor road controlled by a stop sign, standard style crosswalk should be used. Figure A- 10. Recommended crosswalk patterns at uncontrolled locations (Zegeer et al. 2005). Bus Stop Location Recommended Crosswalk Patterns Bus stops should be placed on the far side (downstream) of the crossing, which forces/encourages pedestrians to cross the road behind the bus, improves motorist visibility to the oncoming traffic, and reduces delay for buses. Crosswalks at transit stops should be placed a minimum of 5 ft. (10 ft. preferred) behind the bus stop (Figure A- 11), so pedestrians crossing behind the bus can see the approaching traffic and approaching traffic can see them. For properly locating the bus stops, agencies should work collaboratively with transit agencies. 95
, particularly the sites with basic, enhanced and geometric")
120 Figure A- 11. Placement of bus stop on the far side of the crossing (PEDSAFE, 2017). Crosswalk Lighting Lighting should be provided for crosswalks at uncontrolled locations (mid blocks and stop sign controlled intersections), particularly the sites with basic, enhanced and geometric elements treatments. The lights layout in Figure A- 12 should be referred to place the luminaire upstream from the crosswalk (not above the crosswalk). Overhead lighting units should be used instead of headlamps. The lighting source, mounting height and target illuminance should be determined following the recommendations from IDOT s policy or FHWA guidelines. Figure A- 12. Midblock crosswalk lighting layout (Gibbons et al. 2008). 96
121 Use of Highlighted Pole and Dual Back-to-Back Display The highlighted retroreflective pole and dual display pedestrian crossing signs should be used to increase motorists attention for pedestrian crossing activities. Figure A-13 and Figure A-14 show an example of retroreflective signpost at IL 29, Rochester and pedestrian crossing sign (both sided) at North Clark St., Chicago, respectively. Figure A-13. Retroreflective signpost along IL 29, Rochester, IL. Figure A-14. Pedestrian crossing sign (dual back-to -back display) at North Clark St, Chicago. 97
.")

122 Education Program Education programs should be created to educate drivers and pedestrians how to react with different phase of PHB (Figure A- 15) and any other new type of treatment or treatment layouts. Figure A- 15. Sequence for a pedestrian hybrid beacon (FHWA, 2009). SECTION 5: ADDITIONAL TREATMENTS To address the pedestrian crossing needs at those sites that do not meet the warrants and ensure pedestrian safety, two solutions are considered in the guidebook: pedestrian channelization using fences to guide pedestrians to nearby crossings and grade-separated crossings. Usage of Fencing Fencing to guide pedestrian to use nearby crossings should be provided at locations that: Meet the pedestrian crossing need requirement, especially with documented B or more severe pedestrian crashes; and Don t meet minimum crosswalk spacing requirement, and Don t meet minimum requirements of speed, or crossing distance, or sight distance. Corresponding pedestrian signs (Figure A-16) should be used in conjunction with the fencing to guide pedestrians to nearby crossings. Figure A-16. Pedestrian signs used in conjunction with fencing (FHWA, 2009). Grade Separated Crossing Grade separated crossings includes, pedestrian bridge/overpass, skywalk/skyway, pedestrian underpass/tunnel, underground pedestrian network. 98
123 They should be considered for the following conditions: Locations with large pedestrian generators/attractions, high pedestrian and traffic conflicts, especially with documented B and more severe pedestrian crashes, but do not meet the minimum requirements for at-grade crossing of speed limit (speed limit>40 mph) or crossing distance (more than six lanes) or sight distance. Pedestrian warrants for a traffic signal is met, but the decision is made not to have a traffic signal, and the location doesn t meet the minimum requirements for at-grade crossing because of speed limit (speed limit>40 mph) and/or crossing distance (more than six lanes). In addition, the proposed sites should be at least 600 feet from the nearest alternative safe crossing (i.e. signalized crossing or alternative under/overpass). As part of the grade-separated crossing design plan, a physical barrier is desirable to prohibit at-grade crossing of the roadway. A well-designed grade-separated crossing should meet the following conditions (AASHTO, 2004): The design is accessible to all users, Barriers are added to make pedestrian feel safe, Have adequate lighting to improve pedestrian security against crime, Width of the crossing structure is adequate to accommodate the pedestrian demand. 99
124 APPENDIX B: ADDITIONAL LITERATURE FINDINGS B1. PEDESTRIAN CROSSING TREATMENTS AND TECHNOLOGIES Pedestrians are regarded as the most vulnerable road users as they are not protected during traffic crashes (ETSC, 1999). In the United States alone 4,735 pedestrians were killed, and about 66,000 others were severely injured in traffic crashes in the year 2013 (NHTSA, 2015). DOTs and other transportation agencies have adopted numerous pedestrian crossing treatments at uncontrolled and midblock locations for traffic safety. The research team reviewed the previous and contemporary pedestrian crossing treatments and technologies at uncontrolled locations. The effectiveness of these treatments will be presented in a separate section (2.4). Based on the prevalence of use, the researchers have identified pedestrian crosswalk safety treatments and present contemporary alternatives. In the following subsections, the researchers present current practices for pedestrian safety at stop controlled intersections and mid-block locations. B.1.1 Marked Crosswalks A marked crosswalk is the most commonly used pedestrian crossing treatment. A marked crosswalk refers to any portion of a roadway at an intersection or midblock particularly indicated for pedestrian crossing by lines or other approved markings on the roadway surface. A marked crosswalk should be installed at an intersection where an unmarked crosswalk would not be clearly visible due to unusual geometrics or other physical characteristics (ADOT, 2015). The driver of a motor vehicle must stop to yield the right-of-way to a pedestrian who is crossing the roadway within a marked crosswalk or at an intersection with marked or unmarked crosswalk and there are no traffic control signals. Numerous agencies now prefer to use marked crosswalks at uncontrolled locations with the hope of enhancing pedestrian safety and mobility (Zhou et al. 2009). B.1.2 Zigzag Pavement marking lines Zigzag lines are mostly used at midblock pedestrian crossing locations that forbid stopping, parking, and overtaking at pedestrian crossings (See Figure B-1). The intent of these markings is to improve visibility between pedestrians and drivers. This treatment is widely used in Europe, but not in North America. The use and meaning of zigzag lines vary from country to country. In the United Kingdom, Hong Kong, Trinidad, Singapore, South Africa, and New Zealand, zigzag pavement lines are used to forbid parking at midblock crossing locations (Mutabazi, 2010). In Australia, zigzag lines are used along the middle of the roadway on both sides of mid-block crossings to warn drivers that they are approaching a crosswalk. In South Africa, they are used to prohibit driver s lane changing. In the UK, yellow zigzag lines are used to prohibit parking outside a school (Mutabazi, 2010). In the United States, zigzag pavement marking lines are used to prohibit vehicle lane changing as well as to give right-of-way to crossing pedestrians within the zigzag area (Ribbens, 1996). 100

125 Figure B-1. Example pedestrian crossing with zigzag lines in Trinidad (Mutabazi, 2010) B.1.3 Raised Median and/or Pedestrian Refuge Median refuges are protected zones in the middle of a roadway where a pedestrian can stay to complete a two-step roadway crossing. A median refuge helps the pedestrian by reducing the speed of approaching vehicles and allowing pedestrian to cross the roadway in more than one step. Additionally, raised medians usually minimize the exposure time of pedestrians crossing a multi-lane roadway and make them feel safer while crossing. It is also beneficial for the motorists when center turn lanes are replaced with raised median (Pulugurtha et al. 2012). B.1.4 In-street Pedestrian Crossing Signs In-street pedestrian crossing signs are frequently used at uncontrolled locations. This treatment was described in both the 2003, and the 2009 Manual on Uniform Traffic Control Devices (MUTCD). Instreet signs are installed in the center median island or center of the roadway to increase the visibility of crosswalks and to remind motorists of the right-of-way laws at unsignalized crosswalks. Typically, these signs are installed with either a weighted portable base or a fixed base and a reactive spring assembly. Research has shown these signs are easy for drivers to understanding and take the necessary actions, when used in conjunction with advance stop markings (See next section) (Houten et al. 2012). In-street signs are comparatively inexpensive to install, while maintenance and operation cost could be higher as these signs have to be removed during seasons when snowfall is likely (Pulugurtha et al. 2012). B.1.5 Advance Stop Lines and Signs Advance stop lines are pavement markings placed 20 to 50 ft upstream on both sides of the crosswalk; STOP or STOP HERE TO PEDESTRIANS signs often accompany advance stop lines. Advance stop lines address the concern of multiple-threat crashes on multilane roadways. Multiple-threat crashes are those where one vehicle stops for a pedestrian in the crosswalk, which obstructs other motorists from viewing the pedestrian in the crosswalk (Fitzpatrick et al. 2014(a)). This pedestrian crossing treatment is also described in the MUTCD (FHWA, 2009). 101
126 B.1.6 Danish Offset The Danish offset is the installation of an offset at the middle of a multi-lane roadway crossing that provides a protected waiting zone for pedestrians by separating pedestrian from traffic and ensuring that they consider the traffic on the second half of the road, before entering the second crosswalk. A Danish offset also includes the features of a median refuge (Pulugurtha et al. 2012). B.1.7 Grade-Separated Crossing Pedestrian underpasses and overpasses help pedestrians and bicyclists cross the road without conflicts with vehicles. The construction costs of underpasses or overpasses are high; therefore, grade-separated crossings are recommended for locations near residential areas, where crossing demand is high and there are high risks of crashes between vehicles and pedestrians/ bicyclists (Fitzpatrick et al. 2014(a)). B.1.8 Curb Extensions This treatment is also known as curb bulb, bulb-out, choker, nub, flare, pinch point, neck-out or neckdown. This treatment includes extension of the curb line or sidewalk out into the parking lane at intersections or midblock crossings, decreasing the effective road width. Curb extensions appear to improve pedestrian safety by shortening the pedestrian crossing distance, narrowing the street width, reducing vehicle speeds, improving visibility between pedestrians and motorists, and reducing the pedestrians road crossing time (AASHTO, 2010). At intersections, curb extensions discourage motorists from blocking the crosswalk or curb ramp or parking too close to a crosswalk. Curb extensions also encourage pedestrians crossing at designated places. Deployment of this treatment at midblock locations and intersections sends a visual cue for drivers to slow down ((Zegeer et al. 2002). B.1.9 Pedestrian Crossing Flags A project conducted by TCRP/NCHRP reported that the pedestrian crossing flags in Salt Lake City and Kirkland found to be moderately effective at two-lane roadway with lower traffic volume. They found motorists compliance were 79% and 46%, on two-lane roadway with posted speed 25 mph and sixlane roadway with posted speed 35 mph, respectively (Fitzpatrick et al. 2006; Turner et al. 2006). On average 65% of the motorists were yielding to pedestrian at different study locations. Therefore, motorist s compliance rate is lower for roads with high traffic, high speed, and more than two lanes. In 2008, Seattle Department of Transportation (SDOT, 2016) installed pedestrian crossing flags at 17 crosswalk locations to experiment motorist compliance to pedestrian. They found although flags increased the visibility of the pedestrians to motorists but failed to provide a consistent pattern of increased compliance. At some places study failed to evaluate the effectiveness of flags in safety improvement due to frequent theft of the flags. B.1.10 Flashing Beacons Flashing beacons are used as a supplement to appropriate warning signs. The use of flashing beacons as a pedestrian crossing treatment is common throughout the United States. These beacons can be designed to flash when activated by pedestrians or to flash all-the-time. 102
127 B.1.11 In-Pavement Flashing Lights at Crosswalk/In-Roadway Warning lights In-pavement flashing lights at crosswalks include a set of flashing lights embedded in the roadway surface along the both sides of an uncontrolled crosswalk, which have been in use since the 1990s (Fitzpatrick et al. 2014(a)). This technology was first suggested by a pilot who believed that the use of flashing lights at crosswalks might provide greater protection to pedestrians because of their use on the runways to help guide pilots during landing (Godfrey and Mazzella, 1999). To increase pedestrian safety, the City of Santa Rosa, California, introduced an early example of an in-pavement flashing lights for crosswalks at uncontrolled locations in 1993 (Godfrey and Mazzella, 1999). Although their initial use was adopted in California and Washington State, this treatment is now more widespread. In-pavement flashing lights are usually set up on the roadway surface to warn motorists that they are close to a pedestrian crossing location. These warnings suggest that pedestrians are using the crosswalk or about to, and drivers might need to yield (FHWA, 2009). This pedestrian crossing treatment is described in the 2003 as well as 2009 MUTCD. B.1.12 Rectangular Rapid Flashing Beacons The Rectangular Rapid Flashing Beacon (RRFB) device is a pedestrian-actuated yellow light system located at the roadside directly below side-mounted pedestrian crosswalk signs. The RRFB received Interim Approval from the Federal Highway Administration (FHWA) in 2009 and is not yet included in revisions of the MUTCD. These beacons employ a stutter flash pattern similar to flashing lights on emergency vehicles. The left light flashes two times in a volley each time it is energized (124 ms on and 76 ms off per flash). This pattern is followed by the right light, which flashes four times in a rapid volley when energized (25 ms on and 25 ms off per flash) and then has a longer flash for 200 ms (Houten et al. 2012). B.1.13 Pedestrian Hybrid Beacon/ High Intensity Activated Cross Walk Beacon A Pedestrian Hybrid Beacon (PHB), also known as a High Intensity Activated Cross Walk (HAWK) beacon, is used to warn and control traffic at an unsignalized location, and sometimes at roundabouts, to assist pedestrians in crossing a street or highway at a marked crosswalk (FHWA, 2009). This treatment was new to the 2009 version of the MUTCD. The use of PHBs started with pedestrian push buttons consisting of two red lights above a single yellow light. All lights remain dark when no buttons are actuated by pedestrians. When activated, the yellow light flashes, followed by a solid yellow phase, then a solid red phase with both red signal heads activated. At the end of the WALK interval, the HAWK signal begins an alternating flashing red phase until the end of the pedestrian clearance interval (FHWA, 2009). B.1.14 Pedestrian User-Friendly INtelligent (PUFFIN) Crossings An innovative crossing treatment, named PUFFIN, was developed in the United Kingdom as a replacement of PELICON ( PEdestrian Light CONtrolled ) crossings at midblock locations and far side pedestrian signals at intersections. In the United Kingdom, PUFFINS have been used since 1992 (Markowitz and Montufar, 2012). PUFFIN treatments include nearside pedestrian signal indications, pedestrian presence detectors, channelization, and longer all-red periods. The nearside pedestrian signal indications encourage pedestrians to look at approaching traffic. These indications are either a red signal for waiting or a green signal for crossing. Puffin crossings commonly include pedestrian 103
128 presence detectors on top of the traffic signal poles. The Victoria, Australia, Highway Department (VicRoads) suggests that PUFFIN systems include an infrared or microwave detector focused on the crosswalk area (Lalani and The ITE PEdestrian and Bicycle Task Force, 2001; Markowitz et al. 2009) and two microwave walk detectors, one focused on each side of the crossing (Markowitz and Montufar, 2012). Curbside detection revokes the pedestrian call when a pedestrian leaves the waiting area early. On-crossing detection varies pedestrian s clearance time during road crossing. For instance, it extends the crossing period for slower pedestrians, as well as ending the crossing period once pedestrians finish crossing. Last, PUFFIN crossings include channelizing treatments that encourage crossing within the crosswalk, and include a longer all-red period than would typically be used in the U.S (Markowitz and Montufar, 2012). B2. COMMON DRIVER BEHAVIORS It is challenging to predict drivers yielding rate to pedestrians as it varies state-to-state and site to site. Drivers behavior varies considerably due to their varied expected velocity, driving abilities, acceleration/declaration tendency, safety concerns, judgment, perception, and estimation. Fitzpatrick et al. (2006) noted that the combination of the geometry of the roadway, such as the number of through lanes, and allowable speed limit, substantially affects the rate of drivers yielding to pedestrians at uncontrolled mid-block pedestrian crossings. The judgment of motorists whether to yield or not to pedestrians is generally dependent on several factors, including vehicle dynamics (acceleration/ deceleration rate, vehicle speeds, and distance from the crosswalk), driver characteristics, pedestrian characteristics, roadway cross-section, crossing treatment types, and congestion level at the crossing position (Schroeder and Rouphail, 2011). Driver behavior is a crucial factor for pedestrian safety in different roadway and traffic conditions. A field study conducted by Heaslip et al. (2007) reported that driver behaviors are considerably different during off peak and peak hours of a day. Hwang and Park (2005) reported that driver behaviors are considerably different in congested and non-congested traffic conditions. In the congested traffic condition, drivers are more likely to change their behavior and take more risks. The Safe Distance Model hypothesized by Kometani and Sasaki (1959) showed that drivers maintained a safer distance with the large vehicles, to avoid a crash. The driver yield behavior is not common at mid-block crossings unless pedestrians are already using an established crosswalk area. Therefore, road crossings do not guarantee pedestrian s safety, particularly when a pedestrian chooses unprotected crosswalk locations under mixed traffic conditions. Geruschat and Hassan (2005) claim that varied driver s behavior can be explained by operation characteristics such as driver speeds. They estimated that for drivers with speeds below 15 miles per hour have a relatively higher (1.5 times) yielding rate than those with speeds above 20 miles per hour. Drivers yielding rates for pedestrians stepping one foot in the roadway is two times higher than pedestrians stepping one foot in the roadway and another foot on the curb. Salamati et al. (2013) conducted a study to identify contributing factors that influence the drivers yielding behavior to pedestrians for yield to pedestrian signs at two-lane roundabouts. The researchers found that at roundabouts in the near lane, drivers (based on pedestrian position) have a higher rate of yielding than far lane drivers. These researchers also found a driver s yielding rate decreases with the increase of vehicle speed. Pedestrian waiting position (at the curb or in the street) and vehicle platooning rarely affect the drivers behavior. 104
129 NCHRP report 672, by Rodegerdts et al. (2007), states that at unsignalized crosswalks, the driver yielding rate to pedestrians varies across states and land uses. This study also suggested that only 57% of drivers yield to pedestrians at roundabouts with two-lane approaches while this rate is higher (83%) for single-lane roundabouts. Therefore, the number of lanes approaching a roundabout has an effect on driver behavior. Sun et al. (2002), using a set of video cameras, gathered records on pedestrians gap acceptance and drivers yielding at an uncontrolled mid-block crossing. They found that drivers yielding prospect was higher when groups of pedestrians were crossing the road at the same time than as for a single pedestrian. The drivers of heavy vehicles (with a Passenger Car Equivalent greater than 3) were more likely to yield to pedestrians than drivers of passenger cars (Passenger Car Equivalent equal to 1). Younger drivers were less likely to yield for pedestrians at a crossing than older drivers. Additionally, the probability of an individual pedestrian accepting shorter gaps was higher than the probability for a group of four or more pedestrians. This study did not consider the effects of vehicle dynamics, including position of the vehicle and its speed on drivers yielding rate. Hunter et al. (2015) studied the interaction between drivers and pedestrians at uncontrolled crossing locations. Using an observational data set for varying lane configurations, geometric characteristics, and pedestrian crossing treatments, the researchers developed two driver yielding models for uncontrolled mid-block pedestrian crossings. They concluded that the presence of neighboring yields, low speed platoons, groups of pedestrians, and female pedestrians increase the prospect of drivers yielding to pedestrians. B3. PEDESTRIAN BEHAVIOR Motorists are required to travel along certain parts of the road, but pedestrians have more freedom to choose their path. Pedestrian behavior is a crucial factor for traffic safety. One study found that many drivers do not always abide by the traffic laws in developing countries. Instead, pedestrians must wait on the curbside, searching for drivers that will yield or gave right-of-way to them (Hamed, 2001). Several earlier studies, which deal with pedestrians behavior at crossing locations shows differences in crossing behavior among different countries (Hamed, 2001). Age, sex, marital status, crossing frequency, private vehicle access, number of people crossing the road, origin and destination, home location relative to crossing, past experience of traffic accident, and pedestrian crossing frequency are several factors that influence pedestrians decisions while crossing the road (Hamed, 2001; Taubman-Ben-Ari and Shay, 2012). Hamed (2001) studied the pedestrian behavior at 10 mid-block locations in urban setting areas of Amman, Jordan. This study found that pedestrians who had past crash experience were more cautious and/or waited longer before crossing the road. Pedestrians inclination for taking more risks at crossing locations increased with their waiting time. Sisiopiku and Akin (2003) found that the location of the crosswalk, with respect to a pedestrian s origin and destination, was the most important factor for pedestrians to decide whether or not to use a crosswalk at a specific location. Pedestrians crossing a divided roadway who were destined to their job were times more likely to tolerate less waiting time than pedestrians destined for other places (Hamed, 2001). 105
130 Women, women with children, elderly people, and pedestrians who own a car are unlikely to accept higher risks while crossing the road. Male pedestrians in a divided roadway were 3.1 times more likely to have shorter waiting times than female pedestrians (Hamed, 2001). Elderly pedestrians were more cautious than younger adults, and they only stepped into the roadway from the curbside when it was clear to them that drivers have yielded the right of way or when the roadway was clear of approaching vehicles (Griffiths et al. 1984; Havard and Willis, 2012). Bernhoft and Carstensen (2008) conducted a survey in Denmark by age and gender to understand pedestrian s crossing behavior and their preferences. They found that older pedestrians preferred to use safer crossing facilities, such as signalized intersections, and zebra crosswalks than the younger pedestrians. Pedestrians who use crossing very frequently were times more likely to tolerate longer waiting time than other pedestrians at crossing (Hamed, 2001). Pedestrians crossing behavior or waiting time varies from person to person and varies from their location in a crossing. For example, pedestrians are unlikely to wait longer on a refuge island compared to waiting on the roadside curb (Hamed, 2001). Pedestrians distracted behavior such as distracted walking, using the internet, texting/ talking and listening to music while crossing the road can reduce pedestrian s awareness of the roadway situation and threatens their safety (Hyman et al. 2010). Several studies have evaluated the awareness of pedestrians who talk or text on a cell phone or listen to music while during crossing the road. Findings suggest that those distracted pedestrians are not as aware of other people/vehicles (Hyman et al. 2010), less aware of traffic signals (Hatfield and Murphy, 2007), they were found to walk more slowly (Hyman et al. 2010; Hatfield and Murphy, 2007), change their direction frequently (Hyman et al. 2010), compromise their safety (Stavrinos et al. 2011), and were more likely to be hit by a vehicle than undistracted pedestrian or pedestrians talking (Schwebel et al. 2012). Nasara and Troyerb (2013) studied the data on pedestrian injuries from the US Consumer Product Safety Commission for a seven-year period (2004 to 2010). They found that the total number of pedestrian fatalities decreased by 58%, but the number of pedestrian fatalities due to distracted driving increased by 170% between 2004 and For pedestrian distraction, 69% of fatalities were contributed to talking on a mobile phone and 9.1% was contributed to texting. Cantillo et al. (2015) found that the pedestrians will go for a direct road crossing alternative (crossing anywhere) if they have to walk a longer distance to a pedestrian bridge or a signalized crosswalk. Direct crossing alternatives are more attractive for bus users even though they could perceive a higher probability of a crash with vehicles while direct crossings were less attractive for the students. The findings also suggested that the presence of a minor with an adult pedestrian raises the probability of safer road crossings and makes direct crossing less attractive. Parvathy and Ravishankar (2016) observed that pedestrians age and gender significantly affect its gap acceptance behavior or crossing behavior at mid-block and unsignalized crossings. They observed significant difference in pattern of road crossing (rolling or straight) and type of crossing (running or walking) for male and female and for different age group (p=.002) at mid-block locations. At unsignalized crossings, male pedestrians take more risk than female pedestrians, and the road crossing pattern/type was significantly different (p=.01) for male and female and for different age group. 106
.")
131 B4. DISTRACTION Drivers distracted behavior, including texting, speaking over phone, watching videos while driving, increases the risk for traffic crashes, injuries, and death. Distraction occurs when drivers divert their attention from the driving task to focus on some other activity (NHTSA, 2014). The National Highway Traffic Safety Administration (NHTSA) has specified three types of drivers distraction: visual (eyes off the road), manual (hands off the wheel), and cognitive (mind off driving) in their policy statement (National Highway Traffic Safety Administration (NHTSA), 2011). Subsequently, NHTSA reported that in 2012 in the US, 3,328 people were killed (which is at least 12% of all the fatalities), and an estimated 421,000 were injured due to distracted driving (NHTSA, 2014). Young et al. (2013) studied the nature of errors made by distracted and undistracted drivers while driving an instrumented vehicle around an urban test route. The study found that although the nature of the errors made by both distracted and undistracted drivers were the same, distracted drivers were more likely to make a greater number of the same types of error than the undistracted drivers. Hill et al. (2014) studied the distracted driving behaviors due to cell phone use while driving among 4,964 university/college students. The study found distracted behavior to be very prevalent among the university/ college students who have a higher level of confidence about their driving proficiency/skills and ability to multi-task during driving than other students. Engelberg et al. (2015) conducted a survey to characterize the distracted driving behavior among the 715 middle-aged adults at San Diego County. They found that 30% to 75% of middle-aged participants were engaged with distracted driving behaviors. B5. PEDESTRIAN CHANNELIZATION Pedestrian channelization is used at places requiring a separated right-of-way for pedestrians and vehicles (See Figure B-2). In addition, pedestrian channelization is used along the roadsides to guide pedestrians to crosswalk locations. Channelization is also used at construction sites and roadway works (Pulugurtha et al. 2012). Figure B-2. Pedestrian channelization along the roadside (Pulugurtha et al. 2012). 107
132 Apart from channelization, several geometric improvements may be effective in improving the pedestrian safety at crossing locations. Studies over the past years revealed that carefully conducted geometric improvements such as channelization, sidewalk barriers, bus stop relocation, illumination, raised crosswalks, and road diets can add to safety improvements significantly (Nabors et al. 2008; Huang and Cynecki, 2001; FHWA (Federal Highway Administration), 2010(b); FHWA, 2010(c); Campbell et al. 2004). However, multiple treatments, use of traffic control devices along with geometric improvements, are likely to provide most enhanced pedestrian safety at appropriate crossing locations (Ellis and Houten, 2009; CDOT, 2005) 108
133 APPENDIX C: INTERVIEW AND SURVEY QUESTIONS INTRODUCTION TO INTERVIEWEE You were suggested for this interview because you are familiar with pedestrian safety in your agency. The purpose of our study is to 1) gather information on the current practice of pedestrian treatment deployment in your agency and to 2) identify your needs and expectations on the guidelines that will be developed as part of this project. The study focuses on uncontrolled locations (not signalized or stop controlled). We would like to learn about your agency s practices for considering the placement of uncontrolled crosswalks and what treatments are considered during the design process. We have identified some statistics on pedestrian crash history within your jurisdiction. See Figure C-1 for an example of a county with high crash rates Average Crashes in Du Page County Figure C-1. Pedestrian crash history comparison for Du Page County vs. Illinois Average County. SECTION 1: WARRANTS 1. What resources does your agency refer to for guidance when determining if a pedestrian crossing is needed at uncontrolled locations? A. The MUTCD B. The BDE Manual C. Documents, internal to your agency i. Please provide a copy for review D. Unpublished documents from other agencies i. Please provide a copy for review E. Personnel expertise i. Please provide a list of experts with contact information F. Recommendations of consulting engineers i. Please provide a list of consultants with contact information G. Other National Guidelines / Resources i. Design Walkable Urban Thoroughfares (ITE) ii. NACTO iii. FHWA Documents iv. Other? 109
134 2. What factors are considered when your agency installs a new crosswalk at an uncontrolled location? A. History of pedestrian-vehicle crashes (all crash severities) B. History of pedestrian fatalities due to vehicle crashes C. Pedestrian volumes D. Vehicle speeds E. Crossing distance/ Number of roadway lanes F. Vehicle sight distance G. Alternative nearby crosswalks H. Estimated pedestrian delay I. Presence of transit stops J. Presence of frequent pedestrian attractions (stores, parking lots, parks, etc.) K. Presence of traffic calming measures (e.g. raised median, curb extensions, etc.) L. Expected motorist compliance M. Presence of schools N. Experience level/typical age of pedestrian O. Locations of traffic signal relative to prospective site P. History of pedestrian complaints Q. Findings from a pedestrian-vehicle conflict study R. Suggestion from local citizens S. Suggestions from local agency engineers T. Suggestions from local agency planners U. Suggestions from local decision makers (Mayors, Administrators, or County boards)? V. Community population W. ADA Constructability X. Other? 3. To what extent are those factors (from the previous question) considered to make a projectlevel decision for installing a crosswalk at an uncontrolled location during the past three years? 110
135 Factor Importance (Strongly Disagree(1), Disagree(2), Neither Disagree nor Agree(3), Agree(4), Strongly Agree(5)) 4. What information would you consider important to include in an IDOT guide for selecting uncontrolled pedestrian crossing locations? Information Type Importance (Strongly Disagree(1), Disagree(2), Neither Disagree nor Agree(3), Agree(4), Strongly Agree(5)) SECTION 2: DESIGN 1. What resources does your agency refer to for guidance when designing pedestrian crossings at uncontrolled locations? 2. What treatments do you commonly consider for improving pedestrian crossing safety? A. Standard striping v. Parallel striped lines vi. Ladder pattern vii. Continental Pattern viii. Other: B. Zigzag pavement marking lines 111
136 C. Other specialized /non-traditional striping (if so, how?) D. Signage E. Supplemental signage F. Flashing beacon ix. Constantly flashing x. Pedestrian-activated xi. High-intensity xii. Rectangular rapid flashing beacons (RRFBs) G. Pedestrian refuge islands H. Bump-outs (also termed bulb-outs in this report) I. Restrict on-street parking J. Reflectors (RPMs) K. Flashing RPMS L. Lighting M. PUFFIN crossing N. Other? 3. For designs, how important were each of the above considered for crosswalks at uncontrolled locations during the past three years? Factor Importance (Strongly Disagree(1), Disagree(2), Neither Disagree nor Agree(3), Agree(4), Strongly Agree(5)) 4. What experimental treatments have you considered for improving safety at a new or improved uncontrolled pedestrian crossing? 5. Has your agency implemented any experimental treatments for improving pedestrian safety at uncontrolled locations? 6. Are you aware of any case studies or test sites of experimental treatments that we should investigate? 7. What information would you consider important to include in a guide for designing pedestrian crossings at uncontrolled locations? 112
137 Information Type Importance (Strongly Disagree(1), Disagree(2), Neither Disagree nor Agree(3), Agree(4), Strongly Agree(5)) SECTION 3: PROFESSIONAL OPINION QUESTIONS 1. The deliverable of this ongoing study will produce a guidebook. How frequently do you predict you will use such a deliverable per year? A. What other agencies might use this resource? 2. Who else should be interviewed to inform the state-of-the-practice in uncontrolled crosswalk guidance in Illinois or the Midwest? A. Name: B. Agency/Company: C. Contact info: SECTION 4: INTERVIEWEE INFORMATION 1. Name: 2. Agency: 3. Years with agency: 4. Years in current position (safety or pedestrian related): 5. Years of other experience in safety or pedestrian design (at other agency/company): 6. On average, approximately how many crosswalks does your agency consider each year? A. Approximately what percent are considered warranted? 7. On average, approximately how many crosswalks does your agency design/contract each year? 113
138 INTERVIEW DETAILS There were many other factors suggested by lower than half of the interviewees. Of the respondents, 30 to 38% reported history of pedestrian fatalities due to vehicle crashes, history of pedestrian vehicle crashes, and suggestions from agency engineers (See Figure C-2). Only a very few percentage (9 to 27%) of the interviewees also considered factors including flowchart with appropriate factors for a certain treatment, suggestions from agency planner, finding from a pedestrian-vehicle study, history of pedestrian complaints, estimated pedestrian delay etc. important for selection of crossing locations and treatments. 40% Percentage 20% 0% SURVEY QUESTIONS Survey Section 1 Figure C-2. Factors suggested as less important to include in the guide. 1. What resources does your agency refer to for guidance when determining if a pedestrian crossing is needed at uncontrolled locations? 114
139 2. What factors are considered when your agency warrants installing crosswalk at an uncontrolled * location? 115
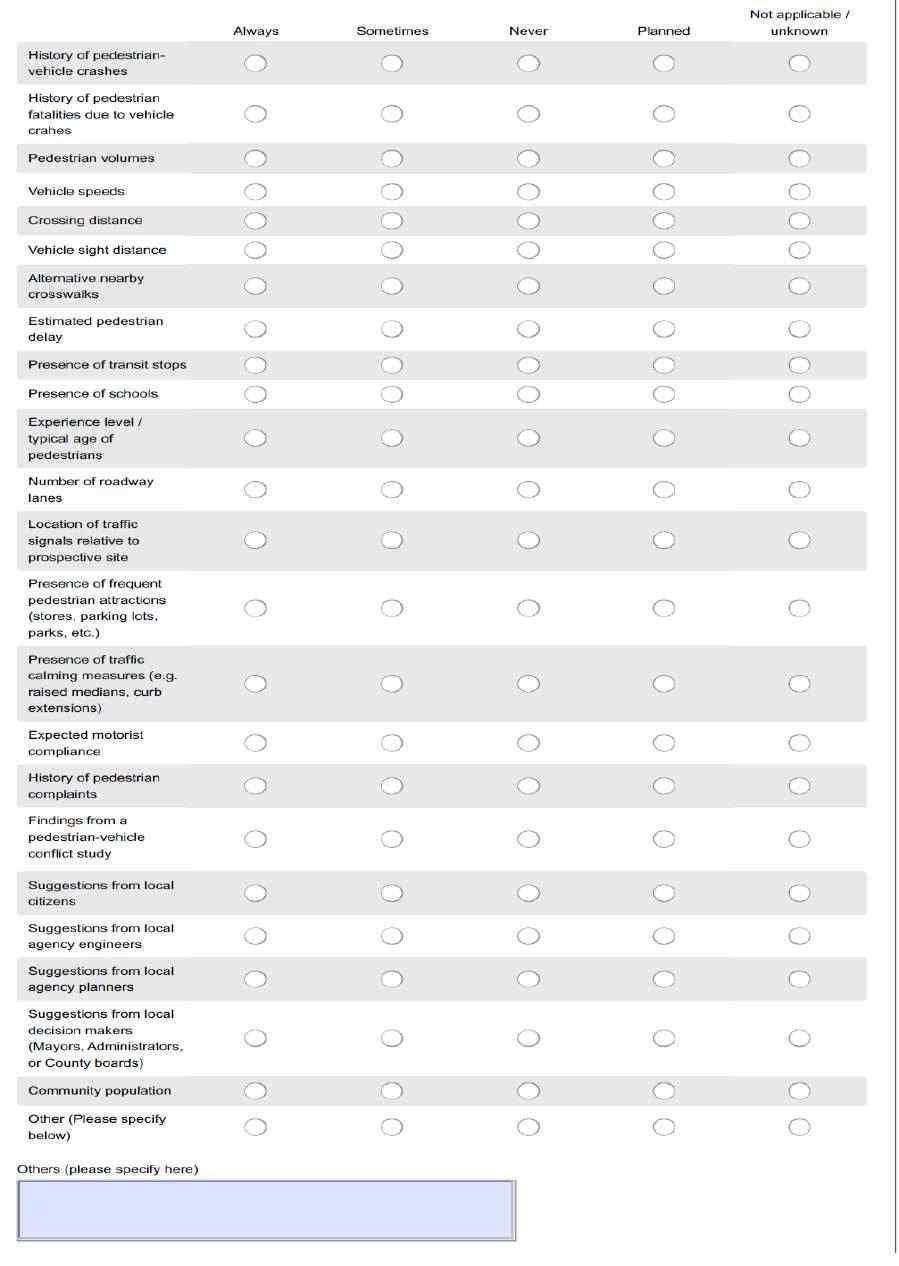
140 116

141 3. What information would you consider most important to include in a guide for selecting uncontrolled pedestrian crossing locations? Survey Section 2: Design of Crosswalks at Uncontrolled Locations 1. What resources does your agency refer to for guidance when designing pedestrian crossings at uncontrolled locations? 2. What treatments do you commonly consider for improving pedestrian crossing safety? 117
? 4. Has your agency implemented any experimental treatments for improving pedestrian safety at uncontrolled crosswalk locations? If yes, please explain.")
142 3. What experimental treatments has your agency considered for improving safety at a new or improved uncontrolled pedestrian crossing (If none, please write "none")? 4. Has your agency implemented any experimental treatments for improving pedestrian safety at uncontrolled crosswalk locations? If yes, please explain. 118
143 5. Are you aware of any case studies or test sites of experimental treatments that we * should investigate? 6. What information would you consider important to include in a guide for designing pedestrian crossingsat uncontrolled locations? Survey Section 3: Professional Opinion Questions 1. The deliverable of this ongoing study will produce a guidebook. How frequently do you predict such a deliverable might be used for designs in your agency each year? 2. Who else should respond to this survey to inform the state-of-the-practice in uncontrolled crosswalk guidance in Illinois or the Midwest? 3. On average, approximately how many crosswalks does your agency consider adding or replacing each year? 4. On average, approximately how many crosswalks does your agency or its contractors design or redesign each year? Survey Section 4: Demographic Information 1. Please tell * us about yourself. 119
144 APPENDIX D: ANALYSIS DETAILS Table D1. Cross-Tabulation of Explanatory Variables and Severity Levels (Environmental Conditions) Explanatory Variable No/possible injury Minor injury Severe Injury Setting Urban % % % Rural % % % Total % % % Lighting Condition Darkness, Lighted Road % % % Darkness, Unlighted Road % % % Dawn % % % Daylight % % % Dusk % % % Total % % % Weather Condition Clear % % % Cloudy/Overcast % % % Fog/Smoke/Haze % % % Rain % % % Snow % % % Total % % % Road Surface Condition Dry % % % Ice % % % Snow or Slush % % % Wet % % % Total % % % Intersection related No % % % Yes % % % Total % % % Number of lanes One % % % Two % % % Multi % % % Total % % % Failed to yield right of way Yes % % % No % % % 120
145 Total % % % Explanatory Variable No/possible injury Minor injury Severe Injury Location Crosswalk Not Available % % % In Crosswalk % % % In Roadway % % % Not in Available Crosswalk % % % Not in Roadway % % % Total % % % Traffic way description Divided % % % Not Divided % % % One-Way % % % Total % % % City class Less than 10, % % % 10,001 to 25, % % % 25,001 to 50, % % % More than 50, % % % Chicago % % % Total % % % 121
146 Table D2. High Crash Segments in Urban Counties With Higher Pedestrian Crash Rates Road Name Crash Frequency Length in Miles Severity Weight/Mile County Classification Kirby Ave Champaign Minor Arterial Washington St Champaign Major Collectors Springfield Ave Champaign Major Collectors Gregory Dr Champaign Major Collectors Goodwin Ave Champaign Major Collectors White St Champaign Local Roads Iowa St Champaign Local Roads Urbana Ave Champaign Local Roads Springfield Ave Champaign Other Principal Arterial Court St Kankakee Other Principal Arterial Western Ave Peoria Minor Arterial Hamilton Blvd Peoria Minor Arterial Jefferson St Peoria Minor Arterial Dries Ln Peoria Major Collectors Monroe Peoria Major Collectors Farmington Rd Peoria Major Collectors Illinois Ave Peoria Local Roads Wiswall Peoria Local Roads Adams Peoria Other Principal Arterial North Grand Av Sangamon Minor Arterial Carpenter St Sangamon Minor Arterial 23rd St Sangamon Major Collectors 6th St Sangamon Local Roads Jefferson St Sangamon Other Principal Arterial Macarthur Blvd Sangamon Other Principal Arterial E Hwy StClair Minor Arterial Old Missouri Rd StClair Minor Arterial 25th St StClair Minor Arterial 15th St StClair Major Collectors Missouri Ave StClair Other Principal Arterial Whitman St Winnebago Minor Arterial State Street Winnebago Major Collectors Halsted Rd Winnebago Local Roads Clifford Ave Winnebago Local Roads Day Ave Winnebago Local Roads State Winnebago Other Principal Arterial 11th St Winnebago Other Principal Arterial Charles St Winnebago Other Principal Arterial 122
147 Table D3. High Crash Segments in Rural Counties With Higher Pedestrian Crash Rates Road Name Crash Frequency Length in Miles Severity Weight/Mile County Classification Sycamore St Kankakee Major Collectors Harmon Hwy Peoria Minor Arterials Knoxville Ave Peoria Other Principal Arterials Farmington Rd Peoria Major Collectors Walnut Rd Sangamon Minor Arterials State Winnebago Other Principal Arterials Kishwaukee St Winnebago Other Principal Arterials Springfield Ave Winnebago Other Principal Arterials Cunningham Rd Winnebago Major Collectors Collinsville Rd StClair Minor Arterials Penn St StClair Local Roads and Streets Bernard Dr StClair Local Roads and Streets South Green Mount Rd StClair Major Collectors 123
148 APPENDIX E: REVIEW SUMMARY FOR INDIVIDUAL HCC Based on the data and information gathered in field, a summary for each HCC was developed. This section presents the field review summaries, following the order that those HCCs were reviewed. Table E1. High Crash Corridors Reviewed in Field District/City District 4 District 5 City of Chicago District 1 (Outside of Chicago) District 6 High Crash Corridors NE Monroe St. (Peoria) West Harmon Hwy. (Peoria) SW Jefferson Ave. (Peoria) West Wiswall Corridor (Peoria) West Farmington Rd. (Peoria) Gregory Dr. (Champaign-Urbana) Business 51 (Lafayette to Raab) (Bloomington-Normal) Kirby Ave. (Champaign-Urbana) Springfield Ave. (Champaign-Urbana) (2 separate corridors) N Clark St. (Irving Park to LaSalle) S. Ashland Ave. (59 th to 69 th ) S. Pulaski Rd. (W Division St. to W Roosevelt Rd.) W. North Ave (N Austin Blvd to N Laramie Ave.) IL 43- Historic U.S 66 Road Lawrence Ave. (Olcott Ave. to IL 43) Lawrence Ave. (Harwood Heights) 47th Street (IL 43 to County Line Rd.) N Grand Ave.(Springfield) W. Jefferson St. (Springfield) MacArthur Blvd (Springfield) IL 29 & Taft St. (Rochester) Broadway St.(Quincy) E.1 DISTRICT 4 HCCS Five HCCs were reviewed by the research team with Randal Laninga (Engineer, IDOT District 4), Bret Wetherill (Traffic Technician, City of Peoria, Illinois), and Nicholas Stoffer (Engineer, City of Peoria), on October 14, E.1.1 NE Monroe Street (Peoria) Northeast Monroe Street is a major collector road in Peoria, Illinois. The length of the visited road corridor was 1.30 miles. The land use along NE Monroe Street was residential development (Mary St. to Spalding Ave.) and commercial (Spalding Ave. to Main St.). There are also a few small neighborhood businesses along the corridor. NE Monroe Street is a two-lane roadway with a bike path and on-street parking on both sides. The visited corridor was also a bus route with stops 124

149 available at the intersections every two to three blocks. Each of the blocks was 400 to 450 ft. in length Figure E-1 shows an example of the land use and pedestrian attractions along the corridor. The pedestrian attractions along the corridor included residential units, a school, churches, a park, a library, and small businesses. Most of the crosswalks along the corridor were marked and appeared ADA-compliant. Table E2 summarizes the land use, geometric, and traffic characteristics of NE Monroe St. (Mary St. to Main St.). Based on the crash report analysis, the following factors were identified as the primary cause of crashes: Failure to yield to the right-of-way Crossing the road in the middle of the block Pedestrians carelessly running into the street Motorist s failure to watch crossing pedestrians Figure E-1. Land use and pedestrian attractions along NE Monroe St. (Peoria). 125
150 Table E2. Site Characteristics of NE Monroe St. Data items collected NE Monroe St. (Mary street to Main Street) Crossing distance, ft 48 Lane number (Major street) Crosswalk Median SSD Pedestrain Sight Distance (PedSD) Bike path and parking lane 2 (Two way) Unmarked and marked crosswalk No Adequate needs improvement Yes (on both side) Posted speed, mph 30 Observed speed, mph 30 (Avg.) 40 (Max) ADT (2012 count) 1900 Street Lighting Lamp or over headhead lighting (Not adequate) Pedestrian attractions Alternative crossing distance, ft Crash record ( ) Land use type Residential units, school, church, park, library, and small business house/shop 400 ft (average) Fatal= 1 B-Injury =2 C-Injury =2 Residential (Large part) Commercial (smaller part) E Existing Pedestrian Treatments and Effectiveness The following treatments are currently deployed along the corridor: Marked crosswalk with warning sign and pedestrian actuated flashing beacon (Figure E-2) o At intersection with Mary St. and Hancock St. Unmarked crosswalk with no warning sign (Figure E-3) o At intersection with Caroline St, Laveille St., Voris St., Morton St. Evans St., Morgan St., Wayne St., and Green St. No crosswalk o At intersection with Bryan St. 126

 are limited.")
151 Figure E-2. Marked crosswalk with warning sign and pedestrian actuated flashing beacon. E Issues Identified for the Corridor Figure E-3. Unmarked crosswalk with no warning sign. The following issues were identified for the visited corridor: Field observations suggested that the unmarked crosswalks pedestrian sight distances (PedSD) are limited. Pedestrian crossing sight distance was the length of roadway that must be seen from the crossing needed for crossing the roadway in the absence of a vehicle yielding. This distance includes both pedestrian start-up and clearance times and 127

152 the time to cross the roadway. The PedSD should be adequate at unmarked and unsigned crossings, so that pedestrians can see a conflicting vehicle and determine if they are able to cross the pedestrian safely at that location, before the vehicle reaches the crossing (Nemeth et al. 2014). This limited PedSD was mainly due to the presence of trees on both sides of the road, which blocks the view of pedestrians. In addition, on-street parking was permissible too close to the intersections, obstructing motorists and pedestrians from viewing each other. Bus stops close to intersections (such as at intersection with Voris St., Wayne St., and Caroline St.) may cause the stopped buses to obstruct motorists from viewing the pedestrian in the crosswalk (Figure E-4. Lighting condition needs to be improved, because overhead lighting was provided only at one approach at intersections (i.e. Mary St.) (Figure E-5). According to Gibbons et al. (2008) overhead lighting at one approach was not adequate for an intersection. In a few places, pedestrian ramps need to be improved (Figure E-5) Vehicle speeding was observed. Figure E-4. Bus stop at the point of unmarked crosswalk at intersection with Voris St. 128

153 E Suggested Improvements Figure E-5. Lighting at an intersection. According to the IL MUTCD, the Advanced stop line can be used 20 to 50 ft. upstream of the crosswalk to prevent the threat of multiple-threat pedestrian crashes. Multiple-threat crashes are those where one vehicle stops for a pedestrian in the crosswalk, which obstructs another motorist s view of the pedestrian in the crosswalk (Fitzpatrick et al. 2014(a)). Because there was a parking lane along the corridor on the both sides of the road, parking should be prohibited 20 to 50 ft. upstream of the crosswalk to prevent blocking view of pedestrian at crossing. Figure E-6 illustrates the suggested improvements for pedestrian safety. Curb extension treatments can also be used at the intersections to reduce the pedestrian exposure time to traffic as well as to reduce the chance of multiple-threat pedestrian crashes. Bus stops on the far side of the crosswalk were recommended to minimize the risk of multiple-threat crashes, which was caused by blocking the view of pedestrians for the motorists of the adjacent lane by the parked/stopped vehicle near to crosswalk. Trimming the trees could improve pedestrian sight distance. In addition, pedestrian warning signs with an arrow can be installed to warn the drivers about the possibility of pedestrian s road crossing activity. Overhead lighting on all the approaches of the intersection should be installed to improve visibility. 129

154 30 ft or more Figure E-6. Parking prohibition close to crosswalk. The use of a marked crosswalk with warning signs is recommended. Past study has found that for two lane roads, the presence of a marked crosswalk alone at an uncontrolled location was associated with no difference in pedestrian crash rate, compared to an unmarked crosswalk (Zegeer et al. 2005). Therefore, the use of a marked crosswalk alone is not recommended. All the pedestrian crosswalk ramps need improvement. E.1.2. West Harmon Hwy (Peoria) West Harmon Hwy was a four-lane highway (with a center two-way left-turn lane) with posted speed limit 40mph. The total width of the roadway was 62 ft. According the Getting around Illinois, (IDOT, 2016) the roadway functional classification of West Harmon Hwy. was (Other) Principal Arterial. This studied corridor was 0.35 mile (around) long, along which there were no designated crosswalks and no sidewalks on either side. Figure E-7 shows the typical view of the West Harmon Hwy. There was a horizontal curve and no bus stops within the corridor. The land use adjacent to this corridor was mixed commercial and residential (Figure E-8). This corridor had one fatal and one A-injury crash from 2010 to The field review suggested this roadway segment lacked adequate lighting. Figure E-8 shows the pedestrian attractions adjacent to the corridor. There are residential units on both sides of the road in some parts and other pedestrian attractions include a Church, Gas station, Grocery stores, Banks, and Restaurants. Although the posted speed limit was 40 mph, some motorists were observed to travel at a speed of 50mph. According to the data from IDOT s Traffic Count Database System (TCDS), the ADT value for the corridor was 10,209 (IDOT, 2015). The landscaping and site design do not accommodate the pedestrians. The lack of sidewalk, street lighting, and designated crosswalks as well as longer crossing distance and higher traffic speed were considered contributing factors for the 130


155 pedestrian crashes. Table E3 summarizes the land use, geometric features, and traffic characteristics of West Harmon Hwy. Figure E-7. West Harmon Hwy. Typical Roadway view. Figure E-8. Pedestrian attractions along West Harmon Hwy. Based on the crash report analysis, the following factors were identified as the primary causes of pedestrian crashes: Lack of sidewalks could cause pedestrians to walk along the roadside Motorist s failure to watch crossing pedestrians Street lighting condition needs improvement 131
156 Table E3. Summary of Geometric and Traffic Characteristics of the Visited Intersections Along West Harmon Hwy. Data items collected West Harmon Hwy (S Laramie St to Barnewolf St) Crossing width, ft 62 Lane number (Major street) Crosswalk Median SSD 4 (Two way) No uncontrolled crosswalks, no sidewalks TWLTL Adequate Posted speed, mph 40 Observed speed, mph ADT (IDOT, 2015) AM peak hour volume PM peak hour volume 45 (Avg.) 55 (Max) 10, Street Lighting Pedestrian attractions Crash record ( ) Land use type (Needs improvement) Residential units, church, grocery store, restaurant Fatal= 1 A-Injury =1 Mixed residential and commercial E Identified Issues and Existing Pedestrian Treatments During the field review, it was found that West Harmon Hwy had minimal pedestrian safety treatments. There was only one signalized crossing at the intersection of West Harmon Hwy with South Laramie St. Besides that crosswalk, there were no alternative crosswalks within 2,000 ft. of the visited corridor. Street lighting condition also needs improvement During the field visit pedestrian s road crossing activities were observed within the road segment. These observations suggested a need for investigating a mid-block crosswalk(s) along the corridor. Further study should identify the pedestrian s desire lines for road crossing. E Suggested Improvements Because some part of the corridor was within a residential area, there will be pedestrian walking activities present along the roadway and; therefore, there was a need for installation of sidewalk on the both sides of the corridor. The curve (horizontal/vertical) was not a good place for placing a crosswalk due to stopping sight distance issues. If there was a need for placing a marked crosswalk (midblock) within the curve area then measures should be taken to address the SSD caused by adjacent buildings and trees. Additional considerations such as reducing the speed limit and advanced warning signs are suggested for 132
 According to Getting around Illinois, (IDOT, 2016) the roadway functional classification of SW Jefferson Ave. was a minor arterial road.")
157 crosswalks within the horizontal curve, because motorist s attention to roadway curvature may distract them from paying attention to pedestrians in the crossing. E.1.3. SW Jefferson Ave. (Peoria) According to Getting around Illinois, (IDOT, 2016) the roadway functional classification of SW Jefferson Ave. was a minor arterial road. The visited corridor was a three-lane roadway with one-way traffic. The length of the corridor was approximately 1.2 miles. Land use along the corridor was mostly commercial, with some residential development. Figure E-9 shows the land use pattern along the corridor. All the crossings along the corridor were at intersections and there were no mid-block crossings. All the intersections with crossings along the corridor were signalized except the intersection of SW Jefferson Ave. and Walnut St. There were bus stops along the roadway and a bus hub close to the corridor (300 ft. away). Adequate lighting was provided along the corridor. The pedestrian attractions along the corridor included a public service office, a college/university, bus stops, residential units, a sports center, and a bank. Figure E-9 illustrates the location of the pedestrian attractions, while Figure E-10 shows the part of the roadway corridor (with commercial development) that had a crash record during Table E4 summarizes the land use, geometric features, and traffic characteristics of SW Jefferson Ave. Figure E-9. Land use pattern and pedestrian attractions along SW Jefferson Ave. 133

158 Figure E-10. Part of SW Jefferson Ave. that was unsignalized. Table E4. Summary of Geometric and Traffic Characteristics of the Visited Intersections Along SW Jefferson Ave. Data items collected Harrison St. SW Jefferson Ave. With: Walnut St. Crossing width, ft Lane number (Major street) Three (one way) One (one way) Crosswalk treatment No crosswalks In-street crossing sign with stop for pedestrian sign Median No No SSD Adequate Adequate Posted speed, mph Observed speed, mph 30 (Avg.) 37 (Max) All below 30 Pedestrian count, 15 minutes 5 (Jay walker) - Traffic count, 15 minutes ADT (2012 count) Street Lighting over head lighting over head lighting Pedestrian attractions Bus hub, bank, Peoria civic center Public service office, homeless shelter, sport s center Alternative crossing distance, ft 300 ft (around) 370 ft Crash record ( ) A- Injury =1 C-Injury =2 B-Injury =1 Land use type Commercial Commercial E Existing Pedestrian Treatments and Effectiveness Treatment had been deployed at the intersection of SW Jefferson St with Walnut St. (Figure E-11) prior to the site visit. The treatments were adequate at this intersection, but the crosswalk markings 134

159 need maintenance. The researchers recommend that further pavement marking/striping, the continental/ladder pattern be used instead of the standard pattern to improve the visibility of the crossing. This location was a good example for pedestrian safety treatment deployment. Figure E-11. Newly deployed treatment at the intersection of SW Jefferson St. with Walnut St. Figure E-12 illustrates the treatments found during the site visit at the intersection of SW Jefferson St. with Harrison St., as well as at the location of neighboring crossings. From the Google Map, the distance between crossing at A and B was 770 ft. and there was no crosswalk in between to cross SW Jefferson St. During the field visit, five pedestrians (in 15 minutes) were observed to walk across SW Jefferson St. although there was no designated crosssing. Pedestrian s desired crossing locations is shown in the Figure E-12. Figure E-12 Existing treatment at intersection of SW Jefferson St. and Harrison St. E Recommendations A marked crosswalk with appropriate sign is proposed at the intersection with Harrison St. across SW Jefferson St. (Figure E-13). The proposed crosswalk is around 300 ft. away from the adjacent signalized intersection crossing. The traffic volume at the intersection with Harrison St. and Walnut 135
 Figure E-13. Proposed crosswalk location at SW Jefferson St. According to Getting around Illinois, (IDOT, 2016) the roadway functional classification of W. Wiswall St. was a local street.")

160 St. were almost same; therefore, treatment similar to Walnut St. can also be considered at the intersection with Harrison St. Check the pedestrian ramps ADA-compliance at all crossing locations. E.1.4. W Wiswall St. (Peoria) Figure E-13. Proposed crosswalk location at SW Jefferson St. According to Getting around Illinois, (IDOT, 2016) the roadway functional classification of W. Wiswall St. was a local street. The width of the street was 25 ft. for two-way traffic with no pavement marking. The length of the reviewed corridor was around 0.65 mile. There was sidewalk on large part of the corridor, but not along some part of the residential neighborhood. The absence of sidewalk there forced some pedestrians to walk in the road and possibly cause dangerous conflicts with vehicles. There were no bus stops within the corridor but there were bus stops on the adjacent roadway (W Lincoln Ave.), which was 300 ft. away. Land use along corridor. Wiswall St. was mainly residential on both sides, but other land uses included a school, and a church close to the corridor. Figure E-14 shows the pedestrian attractions and residential developments along the corridor. Lighting condition needs improvement along the street/corridor. Figure E-14. Land use and pedestrian attractions along W. Wiswalt St. 136
161 The contributing factors for the pedestrian crash were as follows: Failure to yield the right-of-way Sidewalks are needed in some locations (Figure E-15) Lighting condition needs improvement Only one designated crosswalk at the stop-controlled intersection with S Griswold St. The condition of the existing sidewalk does not appear to meet accessibility standards. Figure E-15. Lack of sidewalk on the both sides of the roadway. E Existing Pedestrian Treatments The visited road segment had very minimal safety treatments deployed. There was only one designated stop control crosswalk within the corridor at the intersection with S Griswold St. The existing standard crosswalk marking was faded and the truncated domes do not appear ADAcompliant. The stopping sight distance was adequate to avoid crashes with pedestrians at the crosswalk. However, the SSD needs improvement for northbound traffic approaching from left to avoid collusion with the minor street traffic. This limited SSD was mainly due to the vegetation at the corner of the intersection, which blocks the view of motorists. The crosswalk at S Griswold St. provided access to the Manual high school, a major pedestrian generator for the corridor. The S Griswold St. was a two-lane roadway (one lane each direction) with a parking lane on both sides. There was no pedestrian crossing sign or supplemental sign for school zone. The truncated domes need improvement. For the parking lane, parking was not allowed within 30ft near side of the crosswalk and there was handicapped parking spot close to the far side of crosswalk (Figure E-16). This orientation did not appear to block the sight of pedestrians. Still, the curb extension on the parking lane can be used for reducing pedestrian s exposure time to traffic. 137
.")
162 Figure E-16. Parking restriction close the marked crosswalk. There was no posted speed limit sign for the studied corridor. The statutory speed limit was 30 miles per hour on all streets in Illinois, unless otherwise posted (CDOT, 2012). Studied road segment was a neighborhood street and the street should be evaluated for solutions to improve safety, such as an advisory speed and curb extensions. E Suggested Improvements There was a need for sidewalk installation and/or alteration (if the available sidewalks do not meet the standard and accessibility requirements) on both sides of the whole or part of the corridor, to provide access to Manual High School, a bus stop, and a church. For pedestrian safety, a marked crosswalk can be considered for intersections along the corridor. Marked crosswalks at the intersection of W. Wiswall St. with S. Westmoreland Ave. can be installed for providing pedestrian access to the bus stop (in the W. Lincoln Ave.) which was 400ft away from the intersection. Marked crosswalk on the other approach of Wiswall St is not suggested because there was no sidewalk on the other side of Westmoreland Ave. Also, Stop for pedestrian Sign can be installed for major road traffic. Stop bars are recommended at the intersection with Westmoreland Ave. approaches (controlled by a stop sign) to prohibit the traffic from blocking the unmarked pedestrian crosswalk. Figure E-17 illustrates the suggested improvements at the intersection of W. Wiswall St. with S. Westmoreland Ave. Similar improvements are suggested for the intersection of W. Wiswall St with S. Madison Park Terrace (Figure E-18). In this case, at least there was a need for unmarked crosswalk with an ADA-compliant ramp. If an unmarked crosswalk is provided, it needs ensure the pedestrian sight distance (PedSD) is adequate. 138

.")
163 Figure E-17. Proposed crosswalk and other improvements at the intersection of Wiswall St. with S. Westmoreland Ave. Figure E-18. Proposed crosswalk and other improvements at the intersection of Wiswall St. with Madison Park Terrace. Figure E-19 shows the improvements suggested for the intersection of W. Wiswall St. with S Western Ave. For W. Wiswall St. approach, a marked crosswalk is suggested as it join with a four-lane roadway with ADT value of 10,000 (IDOT, 2015). In addition, a marked crosswalk at the intersection of S. Western Ave. can be investigated (with other treatments such as in-street crossing sign) to identify if the pedestrian volume is adequate. 139
 According the Getting around Illinois (IDOT, 2016), W.")
164 Figure E-19. Proposed crosswalk and other improvements at the intersection of W. Wiswall St. with S Western Ave. Other Considerations - Check the ADA compliance of all crosswalks (marked or unmarked). - Bus stop on the far side of the crosswalk is recommended to minimize the risk of multiple-threat crashes. E.1.5. West Farmington Rd. (Peoria) According the Getting around Illinois (IDOT, 2016), W. Farmington Rd. was a (Other) principle street. W. Farmington Rd. was a two-lane roadway with a center two-way left-turn lane, with a total width of 36 ft. The reviewed corridor was around 0.60 miles and there was no sidewalk on either side. The posted speed limit along the corridor varied from 40 mph to 45 mph. The land use along the corridor was mixed residential and commercial. There was no designated crosswalk within the visited corridor. Part of the corridor included a bus line. The landscaping and site design were not friendly to pedestrians. There were three severe injuries (one A-injury, two B-injury) along the corridor during the last five years (2010 to 2014). Figure E-20 shows the land use pattern along the visited corridor. Table E5 summarizes the land use, geometric features, and traffic characteristics of W. Farmington Rd. 140
 Two (two way) Two (two way) Crosswalk treatment No crosswalk, no sidewalk No crosswalk, no sidewalk Median No No Posted speed, mph 40 40")
165 Figure E-20. Land use along W. Farmington Rd. Table E5. Site Characteristics of W. Farmington Rd. W. Farmington Rd. Data items collected N Pierson Ave. N Park Rd Crossing width, ft Lane number (Major street) Two (two way) Two (two way) Crosswalk treatment No crosswalk, no sidewalk No crosswalk, no sidewalk Median No No Posted speed, mph Observed speed, mph - 42 (Avg.) ADT (IDOT, 2015) AM Peak hour volume PM Peak hour volume 13,400 1,017 1,292 9, Street Lighting over head lighting over head lighting Pedestrian attractions Bus stop, residential units, grocery store Restaurant, grocery store, park Crash record ( ) Land use type No crashes A-Injury =1 B-Injury =2 Mixed residential and Commercial Commercial From the crash report analysis, the following factors were identified as the primary causes of the pedestrian crashes: Road crossing under-the-influence 141

166 No valid driver s license Driving under-the-influence Pedestrian ran into the roadway E Existing Treatment and Suggested Improvements The visited site had no pedestrain treatments deployed. Figure E-21 shows the view of the part of W. Farmington Rd. that had the three severe crashes reported from 2010 to During the field review, the crash location appeared to have minimal road crossing activity. From the crash reports, it was evident that intoxication and driving without a license were primary reasons for the crashes. Additional crossing was suggested at the crash location. To reduce the severity of crashes, a lower speed limit should be implemented. In addition, law enforcement could help reduce the number of those driving without a license, and those crossing the road or driving under influence. Figure E-21. Crash locations along the W. Farmington at the intersection with N. Park Rd. This figure illustrates the pedestrian attractions and proposed improvements. There was no sidewalk along the corridor and there was a need to build the sidewalk in this part of the corridor (residential area) to accommodate the pedestrians. Also, there should be some way to cross the street at every bus stop (CDOT, 2012). There was no designated crossing at the bus stop or adjacent commercial areas. Crosswalk with appropriate sign was recommended near to the bus stops as well as at desire line near to the intersection. E.2 DISTRICT 5 HCCS Five HCCs were reviewed by the team with IDOT Engineer Mr. Gary Sims from District 5 on October 27, The review summary for each corridor is presented below. 142

167 E.2.1 Gregory Dr. (S. 1 st St. to Undergrad Library on U of I campus, Urbana- Champaign). Gregory Drive was a two-lane roadway with bike lanes on both sides of the road. The posted speed limit along the corridor was 25mph. Figure E-22shows the typical view of roadway alignment. The street itself was closed to non-service vehicles during the hours of 7:30am to 5:30pm. The width of the roadway was 36 ft. According the Getting around Illinois, (IDOT, 2011) the roadway functional classification of Gregory Dr. was Major Collector road. This studied corridor was 0.6 miles long and located within the University of Illinois campus. There was considerable pedestrian volume, usually students. The alignment was straight and flat. During the field visit, the measured traffic speeds were found below the posted speed of 25 mph. According to traffic count data (IDOT, 2011), the ADT value along the corridor were between 2,100 and 2,800. The crossing distance across the Gregory Dr. was 36 ft. and there were bus stops along this corridor. From the crash report analysis, driver s failure to yield to pedestrians in the crosswalk were identified as the primary cause of crashes. Table E6 summarizes the traffic and roadway characteristics of the Gregory Dr. Figure E-22. Typical road view of Gregory Dr. 143
168 Table E6. Summary of Geometric and Traffic Characteristics for Gregory Dr. Gregory Dr. Data items collected W. Gregory Dr. Euclid St. Crossing width, ft Lane number (Major street) Two (two way) Two (two way) Crosswalk treatment Mid-block crosswalk with STOP HERE FOR PEDESTRIAN sign Intersection (T) crosswalk with STOP HERE FOR PEDESTRIAN sign Median No No Posted speed, mph Observed speed, mph Less than 25 mph (Avg.) Less than 25 mph (Avg.) SSD Adequate Adequate ADT (IDOT, 2011) Traffic observed, in 15 minutes Cyclist Motorist Pedestrian Street Lighting 2, (excluding cyclist) Over head lighting (Adequate) 2, Over head lighting (Needs improvement) Pedestrian attractions University University Crash record ( ) A-Injury =1 B-Injury =1 Land use type University Campus University Campus E Existing Treatments and Effectiveness Sidewalks were available on both sides of the roadway. There were crosswalks within at most 1000 ft. At the unsignalized crossings, a continental type crosswalk marking was used. There were three midblock crosswalk locations between the intersection with Euclid St. and S. 1 st St. These were also marked with a continental pattern and approximately 15 wide. The street was closed to traffic except University service vehicles and buses between 7:30 am and 5:30 pm. The available treatments along the corridor included: E Marked crosswalk with STOP HERE FOR PEDESTRIAN sign A Stop here for pedestrian sign with stop bar were provided 20-30ft upstream of the crosswalk at intersection with Euclid St. Street lights were available at the intersection, but needed improvement. Bus stop was located downstream of the crosswalk, nearly 80ft away, which was a good practice. All the pedestrian ramps appeared to be ADA-compliant. SSD and PesSD also appeared adequate at the intersection. Figure E-23shows the available treatments at intersection with Euclid St. 144


169 Figure E-23. Current treatment condition at intersection with Euclid St. E Mid-block crosswalk with STOP HERE FOR PEDESTRIAN sign At all the mid-block crosswalks stop for pedestrian sign were installed about 20 ft. upstream on both approaches of the crosswalk. Lighting units were deployed on the nearside of the crosswalk on both sides, which was adequate. Figure E-24 shows the mid-block crosswalk treatment at Gregory Dr. Figure E-24. Mid-block crossing along Gregory Dr., near David Kinley Hall at the University of Illinois. E All-way stop controlled crosswalk All way stop controlled crossings were provided at the intersection with S. Goodwin Ave. Adequate streetlights were available at the intersection, but their placement was not consistent/harmonic with the guidelines provided by the FHWA (Gibbons et al. 2008). All the curb ramps appeared to be ADAcompliant. The bus stops were just upstream of the crosswalk, which does not seem to create problem because there was only one lane in each direction and there was no possibility of blocking 145
170 the view of pedestrian for the current set up. Figure E-25 shows the deployed treatment at intersection with S. Goodwin Ave. Lighting units on the downstream of the crosswalk LEGEND Lighting units Figure E-25. All- way stop controlled treatment at intersection with S Goodwin Ave. E Suggested Improvements Pedestrian crossing treatments deployed along the corridor were adequate for pedestrian safety; only pedestrian lighting at intersection with Euclid St., and S. Goodwin Ave. should be improved. Lights should be offset from the crosswalk and located upstream (Gibbons et al. 2008). Because of the high pedestrian volume at the mid-block crosswalk locations, treatment such as pedestrian overpasses can be considered, though they are expensive. This corridor can be considered a good example of pedestrian safety practices for a college/university area having similar traffic and roadway characteristics. E.2.2. Business 51, N. Main St. Bloomington-Normal, IL (E. Lafayette St. to Raab Rd.) According to the Getting around Illinois, (IDOT, 2016) the roadway functional classification Business 51 was an Other Principal Arterial route. During the field review, Business 51 (N Main St.) was considered in two parts. The first part included a four-lane road with a continuous two-way leftturn lane and a posted speed limit of 30 to 40 mph and a length of approximately 1.45 miles, between W. Raab Rd. and W. College Ave.). Figure E-26 shows the typical view of this section of the roadway. The second section of Business 51 included two one-way streets, with two or three lanes in each direction (W College Ave. to Lafayette St). Figure E-27shows the typical view of one-way road. There was on-street parking allowed through Emerson St. to Locus St., which was just north of Bloomington downtown. Emerson St. was also where Main St. increased from two lanes to three lanes southbound. These locations were where there was more pedestrian traffic, because of service attractions (commercial businesses). The total width of the roadway was 70 ft. for two-way traffic section, while the width was typically 32 to 36 ft. for the one-way sections. This studied corridor was 146
, the ADT value for the north part of the corridor (two-way traffic) was between 19,200 and 21,800, and between 9,200 and 10,600 for")

171 around 4.8 miles long in total. According to the data of Traffic Count Database System (IDOT, 2015), the ADT value for the north part of the corridor (two-way traffic) was between 19,200 and 21,800, and between 9,200 and 10,600 for the one-way sections. Figure E-26. Typical view of US Business 51, Main St. Figure E-27. Typical view of roadway at US Business 51, Main St. The land use adjacent to this corridor was mixed commercial and residential. There were bus stops along the corridor. Illinois State University and Illinois Wesleyan University were located in the middle of this corridor. There was also a high school, a junior high school, and a private school along the corridor. The pedestrian generators and attractors along the corridor includes businesses developments, service locations, schools, parks, grocery stores, a museum, a stadium, a church, a bus stop, and residential units (Figure E-28). Table E7 summarizes the traffic and roadway characteristics along the corridor. 147

172 Figure E-28. Land use and pedestrian attractors/generators along the Business 51. Table E7. Summary of Geometric and Traffic Characteristics Along Business 51 Data items collected US Business 51, Main St. (Raab Rd. to E. Lafayette St.) Crossing width, ft 62 Lane number (Major street) 4 (Two way) 2-3 (One way) Crosswalk Sidewalks on both sides, crosswalk spaced 1,500 to 3,000 ft. apart Median Yes (two-way traffic) SSD Adequate Posted speed, mph 30 to 40 Crosswalk Lighting Pedestrian attractions Crash record ( ) Land use type Bus Stops 148 (Need improvement) Businesses developments, service locations, schools, parks, grocery stores, museum, stadium, church, bus stop, and residential units Fatal= 0 A-Injury =3, B-Injury =8, C-Injury=5 Mixed residential and commercial Yes From the crash report analysis, the following factors were identified as the primary causes of crashes: Driver s failure to yield to a pedestrian at a crosswalk Pedestrian road crossing at places other than crosswalk Pedestrians suddenly ran into the street/crosswalk
, there were crosswalks every 800 to 1,000 ft.")
173 E Existing Pedestrian Treatments and Effectiveness The visited corridor had sidewalks on both sides of the street. Crosswalks were sparse, some being 1,500 to 3,000 ft. apart. For the most part in downtown Bloomington, the crosswalks were at every block. Close to Illinois State University (ISU), there were crosswalks every 800 to 1,000 ft. There were locations with a raised median for short distances where there was two- way traffic. This median provided a refuge area for pedestrians when crossing the roadway. There was an underpass for pedestrians at the intersection with W. College Ave. The following treatments were observed along the corridor: E Marked crosswalk Minor street crosswalks had stop-controlled traffic. The pedestrian ramps along the corridor need improvement (Figure E- 29). Lighting units were only present at two approaches of the intersection with Mc Kinley St., which also needs improvement. Figure E- 29. Marked crosswalk at US Business 51 and McKinley St. E Mid-block crosswalk with median island and pedestrian warning sign Pedestrian warning signs were provided on both approaches of the mid-block crosswalk between Manchester Rd. and Mc Kinley St. Pedestrian ramps did not seem to be ADA-compliant and there was no lighting unit at the crosswalk. The bus stop was located upstream of the crosswalk (Figure E-30), causing a potentially dangerous situation for pedestrians. 149


174 E Pedestrian Underpass Figure E-30. Midblock crosswalk on US Business 51. There was a pedestrian underpass at the intersection of Business 51 with W. College Ave. Figure E-31 shows the plan view of the pedestrian underpass. At this point Business 51 splits into two one-way roads. Figure E-31. Pedestrian underpass at the intersection of Business 51 and W. College Ave. E Unmarked crosswalk Unmarked crosswalks were installed across US Business 51 at the intersection with E. Division St. Lighting condition needs improvement for visibility of pedestrians during nighttime (Figure E-32). 150

 the width of the crossing distance was 66 ft.")
175 Issues identified for treatment: Figure E-32. Unmarked crosswalk with stop control on minor-street. Overhead lighting needs improvement. Pedestrian ramps need improvement Bus stops upstream of crosswalks Pedestrian crossing treatments were not the same along the corridor Faded crosswalk marking and a lack of refuge islands. Figure E-33 illustrates the lack of pedestrian refuge islands as well as faded pavement markings that need replacement. Figure E-33. Faded marking and lack of refuge island at US Business 51 and W. Locust St. E Suggested Improvements E Pedestrian Refuge Islands For the first part of the corridor (with two-way traffic) the width of the crossing distance was 66 ft. and the ADT along the corridor was between 19,200 and 24,000 (IDOT, 2015). The observed median did not provide a safe waiting zone for the pedestrians; therefore, a crosswalk with a refuge island is 151


176 recommended. In addition, pedestrian warning signs are recommended on both approaches to the crosswalk. Figure E-34 illustrates and example of the suggested improvements. Past study findings by Zegeer et al. (2005) suggest that the installation of marked crosswalks alone was insufficient on a roadway with four or more lanes with a raised median and an ADT of 15,000 or greater. Therefore, suggested improvements include an in-street crossing sign as an additional treatment, for instance State Law Stop for Pedestrian can be installed in the median island. Figure E-34. Suggested improvement for sections of US Business 51 with raised median. Also, the crosswalk lighting needs improvement for visibility of pedestrians during nighttime at the intersections. Figure E-35 shows the recommended layout for crosswalk lighting practice at intersections and at a mid-block crossing (Gibbons et al. 2008). A similar type of treatment is suggested for all other un-signalized intersections/mid-block crossings along the first part of the corridor (two-way traffic). Figure E-35. Lighting layout for crosswalks at intersection and mid-block crossings (Gibbons et al. 2008). 152

177 E Potential candidate site for Crosswalk There were segments along the corridor, where there were no marked crosswalks within 1,500 to ft. For instance, there was no marked crosswalk between the two signalized intersections at W. Virginia Ave. and E. Emersion St, approximately 1,600 ft. apart. The land use along this segment was mostly commercial. The businesses located between the dual one-way streets were observed to draw pedestrian traffic. Crosswalk and associated treatments should be considered close to these businesses. Further data on peak hour pedestrian volume should be considered to inform this decision. Figure E-36. Part of US Business 51 between W. Virginia Ave. and E. Emersion St with limited crosswalk locations. The following are other segments with long distances between crosswalk locations: Between the intersection with E Emersion St and E Graham St, 1,550 ft. Between Lafayette St. to E. Wood St., 2,955 ft. Between W. Raab Rd. and Orlando Ave., 1,740 ft. Further study on peak hour pedestrian volume and pedestrian s desire crossing path should be considered in the final decision for additional crosswalk installations. E Other Considerations Check the ADA compliance of all the crosswalks (marked or unmarked). Crosswalk markings and signs should be evaluated and replaced as necessary. Locating bus stops on the far side of the crosswalks is recommended to minimize the risk of multiple-threat crashes. Recall these crashes are caused by one vehicle blocking the view of a pedestrian from a motorist in an adjacent lane. Sometimes parked or stopped vehicles near crosswalks can cause this dangerous threat to pedestrian safety. Figure E-37 illustrates how parking restricts safe pedestrian sight distance. 153
178 A. Pedestrian halfway into the parking lane B. Pedestrian at curb side Figure E-37. Pedestrian sight distance (PedSD) and parking (parallel) restrictions (Highway Safety Research Center: University of North Carolina, 1999). E.2.3. Kirby Ave., Champaign, IL (Scottsdale Dr. to S 1 st St.) Kirby Ave. was a four-lane roadway and there was a four feet painted median and/or raised median. The posted speed limit was 20mph in school zones and 35mph at other places. The total width of the roadway was 48 ft. According the Getting around Illinois (IDOT, 2012), the roadway functional classification of Kirby Ave. was a Minor Arterial. This studied corridor was 2.5 miles long, had sidewalks on both sides of the street, and cross walks at major intersections. Figure E-38 shows the typical view of Kirby Ave. The roadway alignment was fairly straight and bus stops were present along the corridor. Kirby Ave. runs through a primarily residential area with some pockets of commercial business. There were businesses on the east end of this corridor. Although the maximum speed limit was 35 mph, vehicles were observed to travel at an average speed of 37 to 40 mph; the highest measured value of traffic speed was 50 mph. According to traffic count data for the year 2011 by IDOT (2012), the ADT value along the corridor was between 12,300 and 16,200. There was lighting at the crosswalk locations, but the placement of lighting units was not optimum. The pedestrian attractions along the corridor included a postal office, a university, bus stops, residential units, a sports center, a church, a bookstore, a restaurant, a grocery store, and a bank. Figure E-39 illustrates the pedestrian attractions along the corridor. Table E8 summarizes the geometry of the roadway and traffic characteristics. From the crash report analysis, the following factors were identified as the primary cause of crash: Driver s failure to yield to pedestrians in the crosswalk Pedestrians walking along the roadway Driving under-the-influence Pedestrians running across the road after getting off the bus without looking for traffic in the adjacent lane. 154


179 Figure E-38. Kirby Ave. Typical Roadway View. Figure E-39. Land use pattern and pedestrian attractions along Kirby Ave. 155
180 Table E8. Summary of Geometric and Traffic Characteristics of the Visited Intersections Along Kirby Ave. Kirby Ave. Data items collected Cambridge Dr. Park Haven Dr. Kenwood Ave. Crossing width, ft Lane number (Major street) Four (two-way) Four (two-way) Four (two-way) Crosswalk treatment Median with warning Median with warning No crossing sign sign Median present present Posted speed, mph Observed speed, mph 30 (Avg.) 40 (Avg.) 40 (Avg.) - 50 (Max) - ADT (IDOT, 2012) 15,600 14,800 14,100 Counted traffic Not recorded (15 minutes periods) Counted pedestrian Not recorded 0 04 (15 minutes periods) Over head lighting Over head lighting Need improvement Street Lighting provided but not adequate provided but not adequate Pedestrian attractions Bus stop, residential Park, sport ground, Park, residential units, units, postal office, residential units bus stop, playground school, park Crash record ( ) A-Injury =1 Fatal =1 A-Injury =1 Land use type Mostly residential, few commercial development Residential Residential E Existing Pedestrian Treatments and Effectiveness The visited corridor had sidewalks on the both sides of the street. At the un-signalized intersections, crosswalks were installed at about ft. away/in front of the intersection. The crosswalks marking pattern were mostly continental at un-signalized crossings. There were lighting units nearby the crosswalk locations, but they were not located according to current best practices. Pedestrian warning signs were present at crosswalks at intersection with Park Haven Dr. and Cambridge Dr. Treatments present along the corridor included: E Marked crosswalk with pedestrian refuge and warning sign A crosswalk with warning signs and pedestrian refuge were currently available at the intersection with Park Haven Dr. There were pedestrian crossing signs on both sides of the crosswalk, but the pedestrian ramps need improvement. There were over head street lights on the upstream approach to the crosswalk, but for one approach lighting unit was 106 ft upstream of the crosswalk, too far. Therefore, there was a need for changes to lighting to improve pedestrian safety. Figure E-40 illustrates the existing treatment at intersection with Park Haven Dr. Similar treatments were also currently available infront of Int. Prep Academy at the intersection with Cambridge Dr (Figure E-41). From the crash report report, it was found that pedestrians were crossing the road downstream of 156


181 the bus stop after getting off the bus. This findings suggests the location of bus stop should be shifted (i.e. on the downstream side of the crosswalk). Figure E-40. Current treatment at intersection of Kirby Ave. and Park Haven Dr. Figure E-41. Existing pedestrian treatment at intersection of Kirby Ave. and Cambridge Dr. E Crosswalks at an all-way stop controlled intersection with continuously-flashing red beacon A crosswalk was located at an all-way stop controlled intersection with a continuously- flashing red beacon at the intersection of Kirby Ave. and Crescent Dr. The beacon was located on the major road, Kirby Ave. A bus stop (MTD) was present at approximately 20 ft. upstream of the crosswalk, which was considered adequate to reduce the risk of multiple-threat type crashes (Figure E-42). This intersection seems to operate well, only lighting condition needs improvement. The field review suggested a need for additional lighting for pedestrian safety. 157

 Figure E-43.")
182 Figure E-42. Existing pedestrian treatment at intersection of Kirby Ave. and Crescent Dr. E Stop controlled crosswalk on minor road only There were no crosswalks across Kirby Ave. at the intersection with Kenwood Rd. There were pedestrian attractors such as a park, a sports grounds and a bus stop on one side of the roadway. The residential area on the other side of the road was likely to generate pedestrian demand to cross the road at this point, but there was no crosswalk. Therefore, installing a marked crosswalk with appropriate warning signs across Kirby Ave. is recommended to improve pedestrian safety (Figure E- 43) Figure E-43. Existing pedestrian treatment at intersection of Kirby Ave. and Kenwood Rd. E Suggested Improvements This corridor appears to be operating well, for the most part. The following improvements were recommended for the Kirby Ave. corridor: 158
183 Consideration may be given to replace standard crosswalks (solid transverse line) with continental/ladder type marking to improve the crosswalk visibility. Vehicles were routinely traveling 10 mph over the speed limit. Strategies that can address speeding can include: additional signing, narrowing the streets, radar speed feedback signs in areas where pedestrians were crossing the street. Bus stops on the downstream side of the crosswalk are recommended to minimize the risk of multiple-threat crashes. These types of crashes can be caused by a bus, or other parked/stopped vehicles, blocking the view of pedestrians in a crosswalk from motorists in the adjacent lane. Check the ADA compliance of all crosswalks (marked or unmarked). Installing marked crosswalk across the Kirby Ave. at intersection with Kenwood Rd. is recommended to provide access to Credential Park, the sports ground the bus stop and the nearby residential area. The crosswalk lighting condition needs improvement at several intersections. Lights should be offset from the crosswalk and located at least 10ft upstream (Gibbons et al. 2008). E.2.4 Springfield Ave., Champaign, IL (S Mattis Ave. to S State St.) Springfield Ave was a four-lane roadway with a width of 54 ft. from the intersection with Mattis Ave. to the intersection with Russell St. For rest of the corridor, the roadway changes to a two lane, 24 to 36 ft. wide, with and without a continuous two-way left-turn lane. The posted speed limit was 20 mph for school zones and 30 to 35 mph other places. At locations where the posted speed limit was 30 to 35 mph, some traffic was observed to travel 37 to 40mph. According Getting around Illinois (IDOT, 2016), the roadway functional classification of Springfield Ave. was an Other Principal Arterial. According to the Traffic Count Database System (IDOT, 2015), the ADT was between 13,000 and 13,800. This studied corridor was 1.5 miles long. Street lighting was provided at 250 ft. intervals along the corridor on both side of the roadway. This corridor was primarily within a residential area. There were some commercial developments located at the intersection with Mattis Ave., Prospect Ave., and State St. Traffic at these intersections where controlled by traffic signals and crosswalks were provided. There were bus stops throughout the corridor, almost at every intersection. The horizontal alignment through this corridor was relatively straight. Figure E-44 illustrates the pedestrian attractions (i.e. grocery store, restaurant, church, bank, school, and residential units) along the corridor summarizes the traffic and geometric characteristics of the roadway. 159

184 Figure E-44. Land use pattern and pedestrian generators/attractions along Springfield Ave. From the crash report analysis, the following factors were identified as the primary cause of the crash: Pedestrians sudden ran into roadway Pedestrians crossed the road outside of crosswalks Undesignated crossings across Springfield Ave., particularly between residential and commercial land uses 160
185 Table E9. Summary of Geometric and Traffic Characteristics of the Visited Intersections Along Springfield Ave. Data items collected Springfield Ave. S. Prairie St. S. New St. S. Fair St. Crossing width, ft Lane number (Major street) Two (two-way) Two (two-way) Four (two-way) Crosswalk treatment Unmarked crosswalk Unmarked crosswalk No crossing Median No No Posted speed, mph Observed speed, mph 30 (Avg.) 30 (Avg.) 35 (Avg.) 41 (Max) 40 (Max) ADT (IDOT, 2015) AM Peak hour volume PM peak hour volume 13,000 1,038 1,157 13,000 1,038 1,157 13,800 1,038 1,182 Counted traffic Not recorded 246 Not recorded (15 minutes periods) Counted pedestrian Not recorded 0 Not recorded (15 minutes periods) Crosswalk Lighting Street lighting ( needs Street lighting (needs Street lighting (needs improvement) improvement e) improvement) Pedestrian attractions Crash record ( ) Land use type Bus stop, residential units, bank, school E Evaluation of Existing Pedestrian Treatments residential units, bus stop, school Restaurant, grocery stores, bus stop, bank, residential units Fatal =1 B-Injury =1 A-Injury =1 A-Injury =1 B-Injury= 1 Mostly residential, some commercial development Residential Residential and commercial developments There were sidewalks along the entire length of the corridor. There were three crosswalk locations at signalized intersections, allowing pedestrians to cross Springfield Ave. where there were some business developments. These were at the intersections with Mattis Ave., Prospect Ave., and State St., approximately a half-mile apart. There were two additional crosswalks located close to a public middle school. One was unmarked at the intersection with S. Prairie St. and the other one was at the intersection with S. New St, which was marked on the major road but not on the minor road. Supplementary warning signs for school zone were provided in advanced of both the crosswalks. The currently available treatments at un-signalized pedestrian crossings along the corridor are described below: E Unmarked crosswalk at an intersection with a school crossing sign An unmarked crosswalk with a school crossing sign was available at the intersection of Springfield Ave. and S. Prairie St. The minor street traffic was stop-controlled, while there was no control for the major street traffic. For the eastbound (major street) traffic there was a flashing beacon to warn the drivers about the presence of school crossing. There were bus stops upstream of the crosswalk on 161

186 both approaches of Springfield Ave., which might block the view of pedestrians to traffic in the twoway left-turn lane. Overhead street lighting was present, but may need improvement to ensure the visibility of the pedestrians in the crosswalk during nighttime. In addition, the trees on both sides of the roadway block the view of signs; therefore, the branches of the trees should be trimmed. Figure E-45 illustrates the currently available treatment at intersection with S. Prairie St. Figure E-45. Unmarked crosswalk with school crossing signs at the intersection of Springfield Ave. and S. Prairie St. E Marked crosswalk with school crossing sign A marked ladder-type crosswalk with school crossing signs were installed at one approach of the major street at the intersection of Springfield Ave. and S. New St. and the other approach was unmarked. For the Eastbound Springfield Ave. traffic, there was a flashing beacon (190 feet advance) to warn the drivers about the presence of the school crossing. There were unmarked crosswalks across the minor street where the traffic was stop controlled. The ladder style crosswalk was mostly faded and need immediate replacement. There were bus stops upstream of the crosswalk on both approaches of Springfield Ave., which might block the view of pedestrian to traffic in the two-way left-turn lane. There was overhead street lighting, but improvement is needed to ensure the visibility of the pedestrians in the crosswalk during nighttime. Figure E-46 illustrates the existing treatments at the intersection of Springfield Ave. and S. New St. 162


187 Figure E-46. Current treatments at the intersection of Springfield Ave. and S. New St. E Unmarked crosswalk across the minor street There were unmarked crosswalks across the minor street, whose traffic was stop controlled, but there were no crosswalks to cross Springfield Ave. Figure E- 47shows the treatments at the intersection of Springfield Ave. and S. Fair St. During the last five years ( ), one fatal and one A-injury crash were reported at this location. There were commercial developments on one side of the road and a residential area on the other side. Figure E- 47. Current treatments at intersection of Springfield Ave. and S. Fair St. During the field visit, no pedestrians were observed to cross Springfield Ave. within the 15 minuteperiod at this location (Time: 11:15 AM to 11:30 AM, Date ). It was unclear the level of road crossing activity across Springfield Ave. from the residential area to the bus stop, grocery store, bank, and restaurant. Following improvement are suggested at the currently available crosswalk locations. 163
188 E Suggested Improvements The trees should be trimmed to prevent the blocking the view of traffic signs Maintain the crosswalk markings at the intersection of Springfield Ave. and S. New St. as needed. Engineers should consider narrowing the roadway or eliminating the median. These strategies could, reduce vehicle speeds, make pedestrians more visible before they are crossing traffic lanes, and reduce the pedestrian crossing width. Bus stop locations should be moved to the far side of each intersection, to avoid line-of-sight issues for pedestrians. Additionally, the location of the stop encourages pedestrians to cross behind the bus. For these safety and capacity benefits, bus stops downstream of intersections are preferred if traffic signal and geometry conditions are favorable (Bureau of Local Roads & Streets, 2006). The existing streetlights needed to be supplemented with additional pedestrian lighting. Lighting provides safety, security, and comfort for vehicles and pedestrian traffic. Since, according to the BDE Manual (IDOT, 2013) pedestrian accommodations were warranted if the roadway provides primary access to travel generators (e.g., schools, factories, stadiums, parks, transit stops etc.) Installing marked crosswalk across Springfield Ave. at the intersection with S. Fair St. should be considered to provide access to bank, grocery store, restaurant, bus stop and nearby residential area. E.2.5 West Springfield Ave. (Corridor 2), Champaign, IL (S. Goodwin Ave. to W. Main St.) West Springfield Ave. in this location was a two-lane roadway with parking on one or both sides. The posted speed limit along the corridor was 25 to 30 mph. Figure 63 shows the typical view of this section of W. Springfield Ave. The width of the roadway was 28 to 35 ft. According the Getting around Illinois (IDOT, 2016), the roadway functional classification W. Springfield Ave. was a Minor Arterial. This studied corridor was 0.75 miles long. This corridor had sidewalks on both sides of the road. All the crosswalks, except those at signalized intersections, were unmarked with a stop sign controlling traffic from the minor street. There were bus stops along the W. Springfield Ave. The land use along the corridor was mostly residential and commercial. The land use pattern along the corridor is shown in Figure E-48. The pedestrian attractions along the corridor included a school, recreation center, restaurant, grocery store, bank, bus stops, and residential units. Overhead street lighting was provided along the corridor, but needs improvement for visibility of pedestrians in crosswalks during nighttime. In 2011, the ADT value along the visited segment was between 6,600 and 8,600 (IDOT, 2016). Travel speeds along this corridor were observed within 30 and 35 mph. There were minimal crashes along the corridor. There was only one C-injury and one fatal crash during the last five years ( ). 164


189 Table E10 summarizes the traffic and geometric characteristics of the W. Springfield Ave (at the fatal crash intersection). From the crash report analysis, the following factors were identified as the primary causes of the crash: Driver s failure to yield to pedestrians in the crosswalk (unmarked) Pedestrian s behavior to cross the roadway outside of crosswalks and between parked cars Figure 63. Typical view of W. Springfield Ave. with parking on one side of the roadway. Figure E-48. Land use pattern and pedestrian attractions along corridor. Springfield Ave. 165
190 Table E10. Summary of the Geometric and Traffic Characteristics of the Fatal Crash Intersection Along W. Springfield Ave. W. Springfield Ave. Collected Data Items County Rd 1600 N Urbana, IL Crossing distance, ft 56 Lane number (Major street) Two (two-way) Crosswalk treatment No crosswalk Median No median Posted speed, mph 25 Observed speed, mph 30 to 35 mph (Avg.) ADT (IDOT, 2011) 6,600 Counted traffic (15 minutes periods) 97 Counted pedestrian (15 minutes periods) 4 Street Lighting No overhead lighting Pedestrian attractions Bank, grocery store, restaurant Crash record ( ) Fatal =1 Land use type Mostly commercial development E Existing Pedestrian Treatments There were two crosswalks along the signalized intersection on corridor. These were located at intersections of W. Springfield Ave. with Goodwin Ave. and with Lincoln Ave. All other existing crosswalks at intersections were unmarked. Figure E-49 shows the treatment deployed at the intersection of W. Springfield Ave. and S. Gregory St. Minor street traffic was stop controlled, while there was no control for major street traffic. Overhead street lighting condition needs improvement. There were bus stops upstream of crosswalks on both approaches of W. Springfield Ave., which does not seem to create a problem because there was only one lane in each direction and there was no possibility of blocking the view of pedestrians from approaching vehicles. All the pedestrian ramps appeared to be ADA-compliant. SSD and PesSD were also adequate at the intersection. 166
 for two-lane roadways, the installation of marked crosswalks (alone) at an uncontrolled location were associated with no difference in pedestrian crash rates, compared to an unmarked crosswalk.")
191 Figure E-49. Unmarked crosswalk at intersection of W. Springfield Ave. and S. Gregory St. E Evaluation and Suggested Improvements According to Zegeer et al. (2005) for two-lane roadways, the installation of marked crosswalks (alone) at an uncontrolled location were associated with no difference in pedestrian crash rates, compared to an unmarked crosswalk. Therefore, it is not recommended to mark all the unmarked crossings at these intersections. At the unmarked crosswalk locations, additional lighting is recommended, offset from the crosswalk and located upstream (Gibbons et al. 2008). The intersection of W. Springfield Ave. and W. Main St. was the most critical intersection along the corridor. There was one fatal crash at that location during the last five years ( ). Figure E-50 shows the view of the crash location. The pedestrian was trying to cross the road midblock in between parked cars and was struck by a vehicle in the travel lane. There was no designated crosswalk at the intersection, but there was a signalized intersection 180 feet downstream of the crash location. Due to this proximity, installation of an additional crosswalk at this intersection is not recommended. Engineers should consider treatments that would encourage pedestrians to cross the road using the crosswalks at the adjacent signalized intersection. For example, pedestrian channelization can be installed on the side of the roadway with no parking. 167

192 Figure E-50. Intersection of W. Springfield Ave. and W. Main St. E.3 CITY OF CHICAGO HCCS Four HCCs were reviewed by the team with Engineering Mr. Mike Amsden from the Chicago DOT on November 3 and 4, The review summary for each corridor is presented in the following sections. E.3.1 N. Clark St. (W. Irving Park Rd. to N. LaSalle St., Chicago) N. Clark St was a two-lane major collector road with a posted speed limit of 25 mph. The land use along the corridor was mixed between commercial and residential. The visited corridor was 3.25 miles long and served a bus route. The pedestrian attractions along the corridor included a school, a postal office, bus stops, a bank, restaurants, and a grocery store. Figure E-51 shows the pedestrian attractions along the corridor. The field review suggested that the SSD was adequate and overhead lighting was available at the crosswalks. The observed traffic speed along the corridor was close to the posted limit within the range of ± 5mph. Roadway geometric, traffic, and pedestrian characteristics of the visited corridor are summarized in Table E
 Driver s failure to yield")
193 Figure E-51. Land use and pedestrian attractions along N. Clark St. From the crash report analysis, the following factors were identified as the primary causes of pedestrian crashes: Bad weather conditions (thunderstorm, snow on the road) Driver s failure to yield the right-of-way Sudden run of pedestrians from sidewalk into the crosswalk Pedestrian s random road crossing behavior from in between parked cars. Left turning vehicle s (of minor street) failure to yield to pedestrians within crosswalk. 169
194 Data items collected Table E11. Site Characteristics of N. Clark. St. N. Clark St. & W. Buckingham Pl. Visited crosswalks (N. Clark St.) N. Clark St. & W. Schubert Ave. N. Clark St. & W. Roslyn Pl. N. Clark St. & W. St. James Pl. Crossing distance (No Crosswalk) (ft) Crossing distance Lane number (Major street) 2 (Two way) 2 (Two way) 2 (Two way) 2 (Two way) Crosswalk width (ft) Median No No No No SSD Adequate Adequate Adequate Adequate Curb ramp appearance - ADA-compliant ADA-compliant ADA-compliant Posted speed, mph Observed, Avg. (Maximum) Traffic volume (15 minutes) pedestrian volume (15 minutes) 20 mph (Avg.) 25 mph (Max) 25 mph (Avg.) 28 mph (Max) 22 mph (Avg.) 27 mph (Max) < 20mph(Avg.) 27 mph (Max) Street Lighting over head lighting over head lighting over head lighting over headlighting Pedestrian attractions Alternative crossing (ft.) Crash record ( ) Land use type Restaurant, grocery store, residential area Bus stop, grocery store, residential area Bank, USPS/UPS, grocery store, restaurant Bank, USPS/UPS, grocery store, restaurant A-Injury =1 A-Injury =1 B-Injury =1 Mixed commercial and residential Mixed commercial and residential B-Injury =2 Mixed commercial and residential A-Injury =1 B-Injury =1 Mixed commercial and residential E Evaluation of Currently Deployed Pedestrian Treatments Due to the different traffic characteristics, the corridor was divided into two parts. The first part was from Irving Park Rd. to Diversey Pkwy. and the second part was from Diversey Pkwy. to N. LaSalle St. Within the first part of the corridor, all of the crosswalk locations were at signalized intersections except the one at the intersection with W. Surf Street. Figure E-52 illustrates the pedestrian crossing treatments at the intersection with W. Surf St. According to Chicago s Pedestrian Plan (CDOT, 2012), for the existing roadway and traffic characteristics (i.e., ADT = 9600, 2 lanes), the installation of a marked crosswalk was adequate for this location. Pedestrian warning signs on the both approaches of the crosswalk can be installed to improve pedestrian safety. 170
 with or without in-street crossing signs (Figure E-53 and Figure E-54).")
.")
195 Figure E-52. Crosswalk at the intersection of N. Clark St. with W. Surf St. For the second part of the corridor, it has marked crosswalks (brick pavers/colored concrete) with or without in-street crossing signs (Figure E-53 and Figure E-54). At some places, the in-street crossing signs were not presented during the review, but from the crash reports the presence of in-street crossing signs during the crashes was found. For instance, at the intersection with W. St. James Pl., there was formerly an in-street crossing sign, which was not present during the field review (Figure E- 54). Special treatment was observed at the intersection of N. Clark St. and W. Deming Pl., where marked crosswalks were installed with a 3D illusion in the driving lane to slow down or stop for pedestrian. Figure E-55 shows this marked crosswalk treatment. A study by Nicole (2012) found that crosswalks with pavement markings increase the drivers yielding rate by 11% to 20%, but addition of 3D illusions with pavement marking did not produce any significant change (only 3% increase) in driver s yielding rate. Figure E-53. Marked crosswalk (brick pavers) with pedestrian crossing warning sign. 171


196 Figure E-54. Past and present condition at the intersection of N. Clark St. and W. St. James Pl. Figure E-55. Marked crosswalk with 3D illusion at the intersection of N. Clark St. and W. Deming Pl. The in-street crossing signs observed from Google Maps at a few places appeared to be struck by vehicles and knocked down. For example, at the intersection of N. Clark St. and W. Roslyn Pl., and N. Clark St. and W. Arlington Pl. Figure E-56 shows an example of struck in-street crossing signs, specifically a State Law STOP for Pedestrian sign. Figure E-56. Breakdown of In-street crossing sign along N. Clark St. 172
 at a few places are needed.")
197 The following section summarizes the issues identified for the visited corridor: Pedestrian crossing warning signs on one or both sides of Clark St. crosswalks (Figure E-52, Figure E-54, and Figure E-55) at a few places are needed. Bus stops were upstream of crosswalk locations (Figure E-55), which blocks the view of pedestrians and motorists during crossings In-street crossing signs were damaged at W. St. James Pl., W. Roslyn Pl., and W. Arlington Pl. Figure E-54 and Figure E-56 The narrowness of the travel lanes (11 ft. wide) could have contributed to the damage to these in-street crossing signs. E Suggested Improvements A buffer zone of 2 feet (painted area) is recommended for in-street crossing sign placement (Figure E- 57). If there was a lack of adequate space to provide a buffer zone, then an overhead State law stop for pedestrian sign can be installed. In addition, parking should be prohibited within 30ft. of crosswalks, on both approaches. Bus stops should be relocated to the far side of crosswalks to minimize the risk of multiple-threat crashes. Similar treatment is recommended for all the crosswalks at un-signalized intersections along the corridor. Warning signs are recommended on both approaches of all crosswalks. Figure E-57. Proposed improvement for the un-signalized crosswalks along the corridor. E Suggested Crosswalk Site The field review identified a candidate site for an additional marked crosswalk installation. Pedestrian data collected for a 15-minute period (Time: 2.50PM, Date: 11/3/16) showed that seven pedestrians (including three cyclists) crossed the N. Clark St. at the intersection with W. Buckingham Pl., although there was no crosswalk. The traffic count was 201 for the same time period and the ADT was 9,600 in 2014 (IDOT, 2015). Figure E-58 shows the location of a crash identified from the records, the jaywalking observed during the field review, the distance of alternative crossings, and the pedestrian attractions. According to the guidelines provided by Zegeer, et al. (2005), CDOT (2012), and FDOT (2016), this site could meet the requirements for ADT and pedestrian volume to install a marked crosswalk. 173
 minor arterial road with posted speed limit of 20 mph close to school locations and 30 mph at other places.")
198 Figure E-58. Proposed crosswalk location along N. Clark St. E.3.2. South Ashland Ave. (59 th St. to 69 th St., Chicago) South Ashland Ave. was a four-lane (two-way) minor arterial road with posted speed limit of 20 mph close to school locations and 30 mph at other places. The land use along the corridor was mainly commercial and there were also residential units (one block down) along the corridor. The visited corridor was a bus route and bus stops were available at every intersection (marked with a circle in spaced at a distance around 600 ft. The length of the reviewed corridor was 1.25 miles. Figure E-59 shows/marked all the un-signalized intersections along the corridor and pedestrian attractions. The pedestrian attractions along the corridors include school, US postal service, church, bus stops, bicycle stands, parking lots, bank/atm booth, restaurants, and grocery stores. Traffic data collected from Traffic Count Database System (TCDS) shows that the ADT value along the corridor was 18,600 in 2014, with AM and PM peak hour volume of 1,377 and 1,580, respectively. Table E12summarizes the geometric, traffic and pedestrian characteristics of S. Ashland Ave. 174

199 Figure E-59. Land use and pedestrian attractions along S. Ashland Ave. From the crash report analysis, the following factors were identified as the primary causes of the pedestrian crashes: Failure to yield the right-of-way Walking along the curb side of the roadway and jaywalking Road crossing between parked car E Evaluation of Currently Deployed Pedestrian Treatments For the visited corridor, all the un-signalized intersections have marked crosswalks on the major and minor streets. The minor street traffic was stop controlled at the intersections of S. Ashland Ave and 60 th St., 62 nd St., 64 th St., and 68 th St. Figure E-60 illustrates the pedestrian crossing treatments at the intersection of S. Ashland Ave. and 62 nd street and Figure E-61 illustrates the intersection with 66 nd street. The findings from the safety evaluation are presented below: SSD was adequate and overhead lighting was available at the crosswalks along the corridor. Pedestrian crossing warning signs are needed on both sides of the crosswalks along S. Ashland Ave (Figure E-60 and Figure E-61). Bus stops were located upstream of crosswalk location, which block the view of pedestrians as well as motorists during road crossings. The crossing distance (70 ft.) was too long; especially for child, elderly people, and/or handicapped people to cross. Protected waiting zones in the middle of the roadway are needed, where a pedestrian can stay to complete a two-stage roadway crossing. A raised median is needed for two-stage road crossings. 175
200 The observed traffic speed was much higher than the posted limits. The study suggests that where the speed limit exceeds 64.4 km/h (40 mi/h), marked crosswalks alone should not be used at un-signalized locations (Zegeer et al. 2005). The ADT value along the corridor was 18,600 in Past study findings by Zegeer, et al. (2005) suggests that the installation of marked crosswalks alone was insufficient on a roadway with four or more lanes without a raised median or crossing island that has (or will soon have) an ADT of 12,000 or greater. Table E12. Site Characteristics of S. Ashland Ave. Data items collected S. Ashland Ave. & 60th St. Visited Intersections (S. Ashland Ave.) S. Ashland Ave. & 62th St. S. Ashland Ave. & 66th St. Crossing distance (ft.) Lane number (Major street) 4 (Two way) 4 (Two way) 4 (Two way) Crosswalk width (ft.) Median striped median striped median Only on side SSD Adequate Adequate Adequate Curb ramp appearance ADA compliant ADA-compliant ADA-compliant Posted speed, mph Observed speed, mph 30 (Avg.) 48 (Max.) 38 (Avg.) 35 (Avg.) 44 (Max) Traffic volume (15 minutes) pedestrian volume (15 minutes) 3-12 Street Lighting overhead lighting overhead lighting overhead lighting Pedestrian attractions Bus stop, grocery store, church Bus stop, grocery store, restaurant Bus stop, grocery store, post office, church, school, bike parking Alternative crossing 600 ft 600 ft 600 ft A-Injury =1 A-Injury =1 Crash record ( ) B-Injury =2 B-Injury =1 Land use type Mixed commercial and residential Mixed commercial and residential Mixed commercial and residential There is a need for deployment of additional treatments. Decision of additional treatments (i.e. adding signing and marking, flashing beacons, curb extension, raised medians, speed reduction treatments) with marked crosswalk should be considered based on an engineering study. 176

 is also suggested. According to the IL MUTCD, an Advanced stop line can be used 20 to 50 ft.")
201 Pedestrian warning sign recommended Figure E-60. Exiting pedestrian treatments at the intersection of S. Ashland Ave and 62 nd St. Pavement markings need maintenance Figure E-61. Exiting pedestrian treatments at the intersection of S. Ashland Ave. and 66 th St. E Suggested Improvements E Improvement Alternative 1: Signing and Marking One improvement alternative would be introducing a lane reduction on both sides of the roadway with the installation of an in-street crossing sign and pedestrian crossing sign. High visibility crosswalk marking (continental) is also suggested. According to the IL MUTCD, an Advanced stop line can be used 20 to 50 ft. upstream of the crosswalk to prevent the likelihood for multiple-threat pedestrian crashes. Therefore, parking should also be prohibited 20 to 50 ft. upstream of the crosswalk to prevent blocking view of pedestrian at crossing. Relocating all bus stops to the far side of the crosswalks is also recommended to minimize the risk of multiple-threat crashes. Installing a center median with a pedestrian refuge and in-street crossing sign is recommended to reduce pedestrian exposure time and conflicts and to increase usable gaps (two-stage crossing). A pedestrian refugee island on both sides of the intersection is preferred for pedestrian safety. Figure E-62 illustrates the suggested improvement along the corridor at un-signalized intersections. An advanced stop line is recommended 20 ft. to 50 ft. upstream of the crosswalks to address the concern of multiple-threat crashes on multilane roadways (FHWA, 2009). It is recommended to relocate all bus stops to the downstream side of the crosswalks/intersections. 177
 road, with ADT more than 15,000, speed limit of 35 mph, and mixed land use")
202 Past studies evaluated the effectiveness of raised median with marked crosswalk. The installation of raised median with high visibility crosswalk at a multi-lane (three or more) road, with ADT more than 15,000, speed limit of 35 mph, and mixed land use (residential/commercial/recreational) was found to increase drivers yielding rate to pedestrians significantly (p= <.0001) (Pulugurtha et al. 2012) and reduce the pedestrian crash number with vehicles by 46% to 50% (Zegeer et al. 2005; Lindley, 2008). Figure E-62. Illustration of suggested improvement alternative 2 (Ulster County Transportation Council, 2016) E.3.3. South Pulaski Rd. (W. Division St. to W. Roosevelt Rd., Chicago) South Pulaski Rd. was a two- or four-lane minor arterial road with posted speed limit 20 to 30 mph. Parking was allowed on the curb side of the roadway, at locations where there were only two lanes. The length of the reviewed corridor was 2.5 miles and the land use along the corridor was mostly residential, with some commercial. The visited corridor supported a bus route and bus stops were available at distances of around 600 ft. Figure E-63 shows the pedestrian attractions along corridors. Pulaski Rd., which included a school, a church, bus stops, a restaurant, residential units, and a grocery store. SSD was adequate and overhead lighting was available at the crosswalks along the corridor. The traffic data collected from Getting around Illinois showed that the ADT was 17,900 in Overhead lighting was available at crosswalk locations along the corridor. Table E13 summarizes the geometric, traffic and pedestrian characteristics of the visited corridor. 178

203 Figure E-63. Land use and pedestrian attractions along S Pulaski Rd. 179
204 Data Items Crossing distance, ft Lane number (Major street) Crosswalk width, ft Pulaski Rd & W. Monroe St. Table E13. Site Characteristics of Pulaski Rd. Pulaski Rd & Wilcox St. Visited intersections (Pulaski Rd.) Pulaski Rd. & Pulaski Rd & W Van Buren W. Adams St. St. Pulaski Rd. & W. Polk St. Pulaski Rd & W. Grenshaw St (Two way) 2 (Two way) 2 (Two way) 2 (Two way) 4 (Two way) 4 (Two way) Median No No No No No Present SSD Adequate Adequate Adequate Adequate Adequate Adequate Curb ramp appearance Posted speed, mph Observed speed, mph Traffic volume (15 minutes) pedestrian volume (15 minutes) Street Lighting Pedestrian attractions ADA-compliant ADA-compliant ADAcompliant ADAcompliant ADAcompliant ADAcompliant (Avg.) 25 (Max.) 25 (Avg.) 30 (Max.) 25 (Avg.) 30 (Max.) 30 (Avg.) 40 (Max.) overhead lighting Restaurant, grocery, residential units, bus stop overhead lighting Library, church, school, grocery, residential units, bus stop overhead lighting School, grocery, residential units, bus stop overhead lighting Grocery store, residential units, bus stop, church overhead lighting Restaurant, grocery store, residential units, bus stop, church overhead lighting Restaurant, grocery store, residential units, bus stop, church From the crash report analysis, the following factors were identified as the primary causes of pedestrian crashes: Failure to yield the right-of-way Random road crossing (i.e., in between two crosswalks, or at places adjacent to crosswalk) Driver s not compliant with the traffic signs Pedestrian s lack of safety concern (such as, running after kitten in roadway, crossing road under influence) Driver s carelessness 180

205 Reversing vehicle with driver side door open Lack of headlight on the car E Evaluation of Currently Deployed Pedestrian Treatments For the visited corridor, all the crosswalks at un-signalized intersections have stop control on the minor road except the intersection with W. Wilcox St. The crosswalks at the intersection of S. Pulaski Rd. with W. Wilcox St. are all way stop controlled. There was no median along the corridor except one segment at the intersection with W. Grenshaw St. Figure E-64 to Figure E-67 illustrate the currently available pedestrian crossing treatments along the corridor. Figure E-64. Existing stop control on minor street-without median at the intersection of S. Pulaski Rd. and W. Adams St. 181


206 Figure E-65. Existing stop control on minor street- with median at the intersection of S. Pulaski Rd. and W. Grenshaw St. Figure E-66. Existing all-way stop control at the intersection of S. Pulaski Rd. with W. Wilcox St. The following issues were identified for the existing treatments: The measured traffic speed along the corridor was found higher than the posted limit (Table E13). Warning signs are recommended at un-signalized intersections on both sides of the major street crosswalks Figure E-67. Bus stops along the corridor were mostly on the nearside of the crosswalk locations (Figure E- 68), which may block the view of pedestrian to motorists during road crossing. Crosswalk markings need maintenance at some places (Figure E-69). 182


207 Figure E-67. Warning sign is needed at crosswalk across S. Pulaski Rd. Figure E-68. Bus stop locations along the S. Pulaski Rd. Figure E-69. Crosswalk markings at intersection of S. Pulaski Rd. and Folk St. 183
. Therefore, additional treatments were suggested to improve pedestrian safety. E.3.3.2. Suggested Improvements E.3.3.2.1. High visibility marking with warning sign Crossing distance across the major street was between 50 and 54 ft.")
208 Marked crosswalks alone actually involve higher pedestrian crash rates than unmarked crossing locations (CBTD, 2011), especially for multilane roadways (3 to 8) with an ADT of 12,000 or more (Chu et al. 2007; CBTD, 2011; Zegeer et al. 2005). Therefore, additional treatments were suggested to improve pedestrian safety. E Suggested Improvements E High visibility marking with warning sign Crossing distance across the major street was between 50 and 54 ft. along S. Pulaski Rd. From the 15 minutes traffic count at different intersections, it can be estimated that the peak hour traffic and pedestrian volume would be around 1,000 to 1,200 and 24 to 50, respectively (Table E13). Based on the guidelines provided by Fitzpatrick et al. (2006)high visibility markings with warning signs are suggested along the corridor where the crossing distance is 50 ft. Figure E-70 shows the recommended treatment where the crossing width is 50 ft. Figure E-70. High-visibility crosswalk with warning sign treatment. E Refuge Island with warning signs and advanced stop line At places, with a four-lane roadway (width 54 ft. or more), the existing treatment at intersection of S. Pulaski Rd. with W. Grenshaw St. (Figure E-71) can be deployed at other places. Additionally, advance stop lines for can be installed on both sides of the crosswalk approach to prevent vehicle from occluding the view of the pedestrian while they cross the road. Figure E-71 shows the recommended improvements at the four-lane crosswalks along S. Pulaski Rd. Additionally, it is recommended to relocated bus stops to the downstream side of the crosswalks/intersections to minimize the risk of multiple-threat crashes. 184
 West North Ave was a four-lane (two-way) minor arterial road with a posted speed limit of 30 mph.")
209 Figure E-71. Refuge island with warning sign and advanced stop line (four lane roads). E.3.4. West North Ave. (N. Austin Blvd. to N. Laramie Ave., Chicago) West North Ave was a four-lane (two-way) minor arterial road with a posted speed limit of 30 mph. The land use along the corridor was mostly commercial with some nearby residential units (one block down). The visited section of W. North Ave. included a bus route and bus stops were available at intersections around 600 ft. apart. The length of the reviewed corridor was 1 mile and Figure E- 72shows the pedestrian attractions noted. The pedestrian attractions along the corridors included churches, CTA bus stops, a library, a restaurant, and a grocery store. Overhead lighting was available at the crosswalks along the corridor. Traffic data collected from the Traffic Count Database System (TCDS) shows the ADT for N. Central Ave. to N. Laramie Ave. was 28,500 in The ADT for the other sections of the corridor was 24,300. Roadway geometric, traffic, and pedestrian characteristics of corridor North St. are summarized in Table E

210 Figure E-72. Land use and pedestrian attractions along W. North Ave. From the crash report analysis, the following factors were identified as the primary causes of pedestrian crashes: Failure to yield the Right-of-Way Random road crossing (Jay walking) U turning traffic Pedestrian s sudden run into the street 186
211 Data items collected Table E14. Site Characteristics of W. North Ave. Visited Intersections (W. North Ave.) W. North Ave. & N. Major W. North Ave. & N. Luna Ave. Ave. W. North Ave. & N. Linder Ave. Crossing distance, ft Lane number (Major street) 4 (Two way) 4 (Two way) 4 (Two way) Crosswalk width, ft Median striped median Raised median No SSD Adequate Adequate Adequate Curb ramp ADA-compliant ADA-compliant ADA-compliant Posted speed, mph Observed speed, mph 35 (Avg.) 40 ( Max) - - Traffic volume (15 minutes) pedestrian volume (15 minutes) Street Lighting overhead lighting overhead lighting overhead lighting Pedestrian attractions Alternative crossing distance, ft Crash record ( ) Land use type Bus stop, restaurant, church, library Bus stop, grocery store, restaurant CTA bus stop, grocery store, restaurant A-Injury =1 B-Injury =1 Mixed commercial and residential Fatal =1 B-Injury =1 Mixed commercial and residential E Evaluation of Currently Deployed Pedestrian Treatments A-Injury =2 B-Injury =1 Mixed commercial and residential Almost All the intersections along the corridor were staggered. From the field review, the following treatments were identified: Marked crosswalk with refuge island (Figure E-73) Marked crosswalk with striped median on both or one side of the crosswalk (Figure E-74) Marked crosswalk with no median (Figure E-75), and Stop controlled marked crosswalk on the minor streets (Figure E-76). 187


212 Figure E-73. Example marked crosswalk with refuge island at the intersection of W. North Ave. and N. Major Ave. Figure E-74. Example of marked crosswalks at the intersection of W. North Ave. and N. Mayfield Ave. Figure E-75. Example marked crosswalk without median at the intersection of W. North Ave. and N. Linder Ave. 188

213 Figure E-76. Example of stop controlled marked crosswalk at the intersection of W. North Ave. and N. Latrobe Ave. Issues identified for treatment include: SSD was adequate for watching pedestrians at crosswalk, but SSD needs improvement for traffic at some minor streets, such as intersections of W. North Ave. with N. Linder Ave. and N. Latrobe Ave. Treatment was not the same along the corridor. The use of in-street crossing signs was observed at only one place (N. Major Ave.) Pedestrian crossing signs are needed on both sides of the crosswalks Along W. North Ave. Bus stops were at upstream of crosswalk locations, which may block the view of pedestrians as well as motorists during road crossings. The crossing distance along the major street was 70 ft. (if there was no median). This distance is too long, especially for children, elderly, and/or handicapped people to cross in a single stage. In addition, the traffic volume along the corridor was very high and therefore it was very hard to cross the road at one time. Crosswalk markings need maintenance at some places, such as the intersections of W. North Ave with N. Major Ave., N. Mayfield Ave., N. Parkside Ave., N. Lotus Ave. Figure E-77 shows and example of faded crosswalk markings. 189
. There were refuge islands in the middle of the roadway where a pedestrian can stay to complete a two-stage roadway crossing.")

214 Figure E-77. Example of crosswalk markings at the intersections of W. North Ave. and N. Lotus Ave. and N. Parkside Ave. Crosswalk ramps need improvement at the intersection with N. Mayfield Ave. (Figure E-73). There were refuge islands in the middle of the roadway where a pedestrian can stay to complete a two-stage roadway crossing. However, many of those included only pavement markings and were not protected by a curb or median (except at N. Major Ave. Figure E-78 shows examples of both protected and unprotected pedestrian refuge islands observed. Because the ADT value was between 24,300 and 28,500, Zegeer, et al. (2005) suggests that the installation of marked crosswalks alone is insufficient on a roadway with four or more lanes. Figure E-78. Protected and unprotected waiting area along W. North Ave. There is a need for deployment of additional treatments. Decision of additional treatments (i.e. adding signing and marking, flashing beacons, curb extension, raised medians, speed reduction treatments) with the existing marked crosswalks should be considered based on an engineering study. 190

215 E Suggested Improvements Installing a raised median with pedestrian refuge islands is recommended for the corridor. As an additional treatment, an in-street crossing sign STATE LAW STOP FOR PEDESTRIAN should be installed on the median and pedestrian crossing signs on the curbside. Figure E-79 illustrates this existing treatment in part of the corridor. Advanced stop lines can be installed 20 to 50 ft. upstream of the crosswalk to address the concern of multiple-threat crashes on multilane roadways (FHWA, 2009). Similar treatments are suggested for the all other crosswalks along the corridor. In addition, a bus stop on the downstream side of the crosswalk is recommended. Figure E-79. Illustration of refuge island with in-street crossing sign along W. North Ave. E.3 DISTRICT 1 HCCS Four HCCs were reviewed by the team with IDOT Engineering Mr. Jonathan Lloyd, on November 3 rd and 4 th, The review summary for each corridor is presented below. E.3.5. Illinois Route 43 (Historic US Route 66) This section of IL 43 was part of Historic U.S. Route 66 and was classified as an arterial corridor with four traffic lanes and speed limit of 30 mph. As it shown in Figure E-80, this section of IL43 was located between two signalized intersections. Most of the land uses along the main corridor were commercial and retail stores. They were common pedestrian attractions. In addition, a gas station with a convenience store was located on the east side of the corridor and several bus stops. The field review suggested that the lighting condition along this corridor was adequate. Figure E- 80and Figure E-81 shows the details of crashes on this corridor, while Table E15 presents the details of the visited section of IL


216 Figure E-80. Overview of selected section of IL 43. Figure E-81. Crash locations and types along IL
 55-65 Number of Lanes 4 Median In some part there was for a two-way left-turn lane ADT 35,600 12% Heavy Vehicle Rate (Based on 15-minutes traffic data collection) Speed Limit (mph) 30")
217 Table E15. Traffic and Geometric Characteristics of IL 43 Length (mi) 0.18 Width (feet) Number of Lanes 4 Median In some part there was for a two-way left-turn lane ADT 35,600 12% Heavy Vehicle Rate (Based on 15-minutes traffic data collection) Speed Limit (mph) 30 Observed Speed Average: 38 mph, Highest: 46.5 mph Crash type 2 Fatal, 2 A-Injury, 2 B-Injury Crash frequency 28 EPDO ( ) 394 Land Uses Commercial: Marshalls, ALDI, Restaurants, Bus Stop, Gas Station, Lighting Equipped Sidewalk Both Sides were Equipped On-Street Parking No Allowed E Existing Treatments for Pedestrian Crossings The existing treatments for pedestrians at uncontrolled locations along this corridor were marked crosswalks and marked crosswalks with median refuge island. For example, the intersection of IL 43 and 40 th Pl. had a median refuge island (Figure E-82). E Observed Issues Figure E-82. Median refugee island at the intersection of IL 43 and 40 th Pl. Based on observations of the field review team, the main issues with this corridor that effect pedestrian safety were as follows: 193

218 The distance between the two signalized intersections was 0.2 miles, approximately 5 minutes of walking. The walking distance for pedestrian to access the land uses in different sides of IL 43 was too long and facilities for pedestrian to access bus stops on both sides are needed. IL 43 was an important corridor for connecting north and south traffic and the volume was high during day time. Also, the rate of heavy vehicles was significant. The 15-minute field visit observation during a weekday from 10:30 to 10:45 a.m. showed that the average speed was 20% to 25% above the speed limit, which was 30 mph. Also, as mentioned in Table E15, the highest observed speed was more than 50% above speed limit. E Suggested Improvement A crosswalk with a raised median and/or pedestrian refuge close to the middle bus stop location was suggested. Use Advance stop lines and roadside/inroad pedestrian crossing signs are also recommended. Moreover, pedestrian Channelization along the roadside can prevent the unexpected pedestrian crossing. E.3.6. Lawrence Ave., Section One Lawrence Ave is an east-west corridor that connects to U.S. Route 45 in the west. Two segments of Lawrence Ave. were reviewed in the field. The first section of Lawrence Ave. was from Rose St. to 25 th Ave. This section of Lawrence Ave. had four lanes and a width around 45 ft. The speed limit in this section of Lawrence Ave. was 35 mph, except for the school zone, with a speed limit of 20 mph. Based on the crash data, two high pedestrian-crash locations have been identified in this corridor, at the intersections of Lawrence Ave. and Ruby St. and Lawrence Ave. and Rose St. Figure E-85 shows details about Lawrence Ave. between Rose St. and Ruby St. Figure E-83. Overview of Lawrence Ave. (Section One). As shown in Figure E-83, the intersection with Ruby St. is on the west side and directly after the Metra Rail Bridge. The majority of land uses around this intersection were residential; however, there were some retail stores along the north side. In addition, the Metro Rail Station was on Ruby St., 194

219 along the south side of Lawrence Ave. and there was a sign showing the station s location above Lawrence Ave (Figure E-84). Figure E-84. Lawrence Ave. Eastbound at the intersection with Ruby St. Also, at Lawrence Ave. near the intersection with Ruby St., the lighting condition was poor and crash reports show that most of the crashes occurred during the nighttime. Next, the field review team visited the intersection of Lawrence Ave. with Rose St., which serves a residential area. This road had a width of 26 ft. and two lanes. There was a signalized intersection close to this street in 250 feet. Also, two pedestrian attractions were located very close to Rose St. in the north side of Lawrence Ave. A bus stop was in 50 feet away from Rose St. Figure E-85 shows that the speed limit along Lawrence Ave. close to the intersection of Rose St. was 20 mph due to nearby school zone. It should be noted that the distance between Rose St. and Ruby St. was about 1,400 ft. Based on the crash data collected from , this intersection had one B-injury crash and one A-injury crash. Table E16 summarizes the traffic, geometric characteristics, pedestrian crashes and land use of Lawrence Ave (part one). 195
 45 Number of Lanes 4 Median There is no median ADT 17,300-21,500 Heavy Vehicle Rate 14% (Based on 15-minutes traffic data collection) Speed Limit (mph) 35, School Zone: 20mph Observed")
220 Figure E-85. The intersection of Lawrence Ave. and Rose St. Table E16. Site Characteristics of Lawrence Ave. (Part One) Length (mi) 0.38 Width (feet) 45 Number of Lanes 4 Median There is no median ADT 17,300-21,500 Heavy Vehicle Rate 14% (Based on 15-minutes traffic data collection) Speed Limit (mph) 35, School Zone: 20mph Observed Speed Average: 41 mph, Highest: 52 mph Crash type 1 Fatal, 2 A-Injury, 3 B-Injury Crash frequency EPDO ( ) Land Uses Commercial: Restaurants, retail store, bus stops, residential area, school and park. Lighting Equipped, needs improvement near the intersection with Ruby St. Sidewalk Both Sides are Equipped On-Street Parking No Allowed E Existing Effective Treatments for Pedestrian Crossings The existing treatments for pedestrians in this corridor were as follows: Standard crosswalks (solid transverse line) across minor roads were available and curb ramps were appeared to be ADA compliant. Pedestrian channelization exists underneath the Metra Rail Bridge (Figure E-86) 196

221 Figure E-86. Pedestrian channelization along Lawrence Ave. under the Metra Rail Bridge. E Issues Identified Based on team observation, the main problems with this corridor that effect pedestrian safety were as follows: The speed observations during the field review show that because Lawrence Ave. was a 4-lane corridor with low traffic volume, speeding was very common along this corridor. Along Lawrence Ave., between the Metra Rail Bridge and the Tri-State Tollway, there were no north-south crosswalks, even at signalized intersections. If pedestrians wanted to cross the road, they would need to walk along Lawrence Ave. under the Metra Rail Bridge where lighting conditions were not good. In addition, there were no pedestrian crossings under the Tri-State Tollway bridge. Ruby St. was located exactly after Metra Rail Bridge; thus, for vehicles traveling westbound along Lawrence Ave, the sight distance needs improvement when they finished passing under the bridge. Sight distance also needs to be improved for pedestrians who wanted to cross Lawrence Ave. at the street level. There was a sign for Metra rail on the south side of corridor, showing the direction for the station near S. Ruby St. Crosswalks are needed for pedestrians crossing Lawrence Ave. to access the Metra station E Recommendations Use some guidance signs close to Rose St. for directing the pedestrian to use the crosswalk at the signalized intersection. Putting a crosswalk with Pavement Markings between Ruby St. and Tri-State Tollway Bridge. Due to some geometrical problems in this section, finding the best location for crosswalk needs a study on sight distances. 197

222 Road Diet can be very effective in making Lawrence Ave safer. By decreasing the traffic lanes and assigning to lanes for bicyclists, Lawrence Ave will be more friendly and livable. Using advanced technology for detecting pedestrian automatically in the location of crosswalk. Also, using flashing bacons on both sides of the crosswalk for informing the drivers about the existence of the crosswalk. Due to low pedestrian crossing frequency across the western section of Lawrence Ave., close to the intersection with Ruby St., it is expected that drivers do not pay much attention to the warning signs about crosswalk. This technology is able to inform drivers of the existence of the crosswalk. E.3.7. Lawrence Ave., Section Two The second section of Lawrence Ave. was 55ft. wide with 4 travel lanes and one two-way left-turn lane. The ADT was 17,600 and the speed limit was 35 mph. On-street parking was allowed in some sections. Land use types along this section of Lawrence Ave. included a combination of residential and commercial. The other special feature of this section was a pedestrian crosswalk that was marked by brick pavement. The intersection between Lawrence Ave. and N. Olcott Ave. had two pedestrian crashes from 2010 to 2014, one with an A-injury and one with a B-injury. Figure E-87 shows a plan view of this intersection. Figure E-87. Lawrence Ave. (Section Two). The intersection between Lawrence Ave. and N. Olcott Ave. had crosswalks on all four approaches and, as shown in Figure E-87, bus stops were located just upstream of the intersection. Three sides of the intersection had residential areas, but in the southeast corner there was an auto care business and a fire department. The next nearest signalized intersection was 500 ft. away in the east at N. Oketo Ave. 198
 Main Street: 55 and Minor Street: 35 Median Left -Turning Lane ADT (main corridor) 17,600 Heavy Vehicle Rate 3-6% Speed Limit (mph) 35 Observed")
223 Table E17 presents the site characteristics of this intersection. Table E17. Geometric and Traffic Characteristic of Lawrence Ave. at the Intersection with N. Olcott Ave. Items Reviewed Corridor and Intersection Width (feet) Main Street: 55 and Minor Street: 35 Median Left -Turning Lane ADT (main corridor) 17,600 Heavy Vehicle Rate 3-6% Speed Limit (mph) 35 Observed Speed Average 35 mph, Highest: 41 mph Sidewalk Both Sides Crash Type 1 A-Injury, 1 B-Injury Land Use Residential Area Lighting Appeared adequate Sidewalk Both Sides are Equipped On-Street Parking E Existing Treatment and Problems Identified Allowed Based on the field visit, it was observed that drivers near the crosswalk did not reduce their speeds. It was likely that the crosswalk was not noticeable enough for attracting drivers attention. The brick pavement denoting the crosswalk needs maintenance in some parts and was not clearly visible. Figure E-88 shows the crosswalk in Lawrence Ave. and N. Olcott Ave. Figure E-88. Brick Pavement Crosswalk at the intersection of Lawrence Ave. and N. Olcott Ave. 199
.")
224 E Recommendations The first recommendation is installing Advanced Stop Signs on both sides of the crosswalk with proper distance (50 ft.) ahead. This sign can be mixed with Stop sign. Figure E-89 displays different types of recommended signs to use. Figure E-89. Un-signalized pedestrian crosswalk sign; advanced stop signs (FHWA 2015). Using a different color or texture for crosswalks can attract drivers to notice the crosswalk. However, in the case of Lawrence Ave., the commonly used format for crosswalks was far less visible to drivers than reflective white paint, especially at night or in rainy weather. The recommended improvements were as following: Marking the edges of brick crosswalks with reflecting white paint to make them more separated from the travel lanes pavement. Combining reflective white paint with bricks to make them more visible and noticeable for drivers (Figure E-90). Replacing the brick crosswalks with a regular marked crosswalk might improve driver visibility throughout the lifecycle of the crosswalk. 200


225 a) Marking Lines in the edge of crosswalk b) Combining the Bricks with White Paint E.3.8. West 47 th St. Figure E-90. Examples of recommended crosswalk marking. West 47 th St. was an east-west corridor in the City of La Grange. This corridor had a width of 45 ft., 4 lanes, and a speed limit of 30 mph. The land use along this corridor was mainly residential. Based on the crash data, the intersection between W 47 th St. and S. Waiola Ave. was a high crash location. The north side of this intersection was residential area, and there was a park southwest of the intersection and a school 650 ft. to the west, as shown in Figure E-91. Table E18 shows the site details about this intersection. Figure E-91. Overview of W. 47th St. and the intersection with S. Waiola Ave. 201
 Main Street: 45 and Minor Street: 30 Median No Median ADT (main corridor) 14,900 Speed Limit (mph) 30 Observed Speed Average: 34 mph, Highest: 41 mph Sidewalk Both Side Crash Type 1")
226 Table E18. Geometric and Traffic Characteristic of W 47 th St. at the Intersection with S. Waiola Ave. Width (feet) Main Street: 45 and Minor Street: 30 Median No Median ADT (main corridor) 14,900 Speed Limit (mph) 30 Observed Speed Average: 34 mph, Highest: 41 mph Sidewalk Both Side Crash Type 1 A-Injury Land Uses Residential area, park, school Lighting Available but needs improvement Sidewalk Both Sides were Equipped On-Street Parking E Existing Treatments and Problems Observed None Allowed S. Waiola Ave. was controlled by stop sign at the intersection with W. 47 th St. There was a crosswalk (standard pattern) across S. Waiola Ave. beside Waiola Park. Based on the team s field observation, the main pedestrian safety problems with this corridor were as displayed in Figure E-92. Waiola Park is located in the south-west corner of the intersection, which was the main pedestrian attraction. But, the only north-south crosswalk for accessing the park was at signalized intersection two blocks away. It was risky for pedestrians to cross W. 47 th St. at locations without marked crosswalks (Figure E-92). Figure E-92. Example operation at crash location; a pedestrian crossing W. 47th St. going towards Waiola Park. Sidewalks along Lawrence Ave. at the intersections have curb ramps on both sides, even at the intersections with no crosswalks (Figure E-92). The existing curb ramps may encourage pedestrians (including those who use wheelchairs) to cross the main street at unsafe locations. 202

227 E Recommendations Given the most important pedestrian-attraction along this section of W. 47 th St. was Waiola Park, it is recommended to install two north-south crosswalks, improving accessing to the park at two different corners. Because this area was residential, a road diet should be considered for making the street more livable. This design could include adding bike lanes on both sides of the street. At a minimum, a road diet should remove one or two traffic lanes, so traffic along W. 47 th St. will travel slower, any crossing would be less wide, and overall it would be safer for pedestrian crossings. E.4 DISTRICT 6 HCCS Five HCCs were reviewed by the team with IDOT Engineering Mr. Marshall Metcalf on November 18 th and December 2 nd, The review summary for each corridor is presented next. E.4.1. North Grand Ave North Grand Ave was a 4 lane arterial road with a continuous two-way left-turn lane. The visited section of N. Grand Ave was a 0.6-mile corridor between N. 5th St. in the east and N. Franklin Ave. in the west. The speed limit was 30mph and the ADT was between 12,000 to 15,000 vehicles per day. Figure E-93 displays this section of N. Grand Ave. Figure E-93. Details and land uses along N. Grand Ave. As shown in Figure E-95, most of the land use along this corridor was commercial, including restaurants, multipurpose stores, pharmacies, and other types of retail businesses. To the west of the intersection of N. Grand Ave. and N. Rutledge St., most of the land uses were residential. Several bus stops were located along this corridor. It was noted that the lighting condition in most of the commercial areas along this section of N. Grand Ave. was adequate; however, was needs improvement in the residential areas. Based on collected crash data from 2010 to 2014, three pedestrian crashes happened in this section of N. Grand Ave; one fatal at the intersection with N. Franklin Ave., one A-injury at the intersection with N. 4 th St. and one B-injury in front of a gas station, midblock between 4 th St. and 5 th St. Table E19 summarizes the geometric and traffic characteristics of selected section of N. Grand Ave. 203
 51-58 Number of Lanes 4 Median Two-Way Left-Turn Lane Average Daily Traffic 12,000-15,000 Highest Observed Speed (mph) 36 Crash Type (2010-2014) 1 Fatal, 1 A-Injury, and 1 B-Injury Land Uses")
228 Table E19. Site Characteristics of Selected Section of N. Grand Ave. Length (mi) 0.6 Width (ft.) Number of Lanes 4 Median Two-Way Left-Turn Lane Average Daily Traffic 12,000-15,000 Highest Observed Speed (mph) 36 Crash Type ( ) 1 Fatal, 1 A-Injury, and 1 B-Injury Land Uses Commercial and Residential Pedestrian attractions Restaurant, Pharmacy, Multipurpose Store, Church, Bus Stops, Retail Business. Lighting On-Street Parking Sidewalk E Existing Treatments and Problems Observed Equipped, needs improvement None Allowed Both Sides are Equipped There were three un-signalized intersections in this corridor; the intersections of N. Grand Ave. and N. Franklin Ave., N. 4 th St., and N 3 rd St. There were no marked crosswalks at these intersections; however, the sidewalks had curb ramps on both sides of the intersection to facilitate wheelchair traffic (Figure E-94). The intersection of N. Grand Ave. and N. 4 th St. was surrounded by pedestrian attractions like retail stores and a bus stop. The probability that pedestrian cross N. Grand Ave. at this intersection was very high; although, there was a crosswalk at a neighboring intersection within 350 ft. Warning signs are needed to inform drivers about pedestrian crossings and lighting conditions at some un-signalized intersections in this section of N. Grand Ave need improvement. Figure E-94. Sidewalk with curb ramps but no marked crosswalks at the intersection of N. Grand Ave. and N. 4th St. E Recommended Solutions Marking crosswalks across minor streets at un-signalized intersections (Figure E-95). 204
. The use of advance stop line and sign shall also be considered.")
. Figure E-95.")
229 Consider installing a marked crosswalk and pedestrian crossing signs at the intersections of N. Grand Ave. with N. 4th St. and N. Franklin Ave (Figure E-96). The use of advance stop line and sign shall also be considered. Use pedestrian signs for encouraging pedestrians to use only the crosswalks for crossing (Figure E- 97). Use in-street crossing signs to inform drivers about unexpected pedestrian crossing (Figure E-98). Figure E-95. Suggested treatments for un-signalized intersections. (Intersection with N 4 th St.). Figure E-96. Suggested mid-term treatments for un-signalized intersections. 205
230 Where crosswalks are clearly defined. This sign may be used to prohibit pedestrians from crossing at locations away from crosswalks. To prohibit pedestrians from crossing a roadway at an undesirable location or in front of a school or other public building where a crossing is not designated. This supplemental plaque, along with an arrow, may be installed below either sign to designate the direction of the crossing. Figure E- 97. Suggested pedestrian signs to use in front of pedestrian-attractions without crosswalk (FHWA, 2009). E.5.2. West Jefferson St. Figure E-98. In-street stop for pedestrian sign. West Jefferson St. is a one-way arterial corridor, a part of IL 97, from east to west. The 2,800 ft.-long selected corridor was 42 ft. wide with three travel lanes. The speed limit was 30 mph and the ADT was 14,300 vehicles per day with 6.5% of heavy vehicles in Figure E-99 illustrates the reviewed 206

231 section of W. Jefferson St., which was between two signalized intersections with N. Walnut St. from east and with N. Lincoln Ave. from the west. The land uses along the corridor were mixed from N. Walnut St. to N. MacArthur Blvd. On the south side of the corridor, it was mainly residential, while from N. MacArthur Blvd. to N. Lincoln Ave., the land uses were commercial. The lighting conditions in residential areas need improvement. Figure E-99. Overview of W. Jefferson Ave. Based on collected crash data from 2010 to 2014, three crashes occurred in this corridor, two of them were fatal and the other caused a B-injury. As shown in Figure E-101, all of the crashes occurred at intersections without crosswalks. Table E20 summarizes the geometric and traffic characteristics of selected section of W. Jefferson St. Table E20. Geometric and Traffic Characteristics of Selected Section of W. Jefferson St. Length (ft.) 2,800 Width (ft.) Number of Lanes 3 Median One way- No median Average Daily Traffic (2015) 14, % heavy vehicles Speed Limit (mph) 30 Observed Speed Average: 40 mph Highest:49 mph Crash Type ( ) 2 Fatal, 1 B-Injury Land Uses Residential and Commercial Pedestrian attractions Restaurant, Health Care, Multipurpose stores, Bus Stop. Lighting On-Street Parking Sidewalk 207 Equipped, Not enough in some part No Allowed Both Sides are Equipped E Existing Pedestrian Treatments and Problems Observed The only pedestrian crossing treatments along this corridor were unmarked crosswalks at minor roads, controlled by stop signs. It was not safe for pedestrians, especially with the problems identified below:

232 Three wide travel lanes with no interrupt have resulted in higher traffic than posted speed limit along this corridor. Based on the field visit observation, traffic speed was at least 33% higher than the posted limits, especially near residential areas. Lighting conditions along the street in the residential areas need improvement. In the residential section, there were many trees along the roads that make the area more pleasant to the neighborhood, drivers, and pedestrians. But near intersections, the trees block drivers view, who can only see pedestrian after they enter the travel lane. In addition, some sections have trees that cover traffic signs, e.g. speed limit sign (Figure E-100) Figure E-100. Trees cover speed limit sing and crosswalk at W. Jefferson St., residential area. E Recommendations Installing marked crosswalks and a stop line at stop-controlled intersections of minor streets. Installing two midblock crosswalks across W. Jefferson St.: one between Walnut St. and MacArthur Blvd. and the other between MacArthur Blvd. and N. Lincoln Ave. These crosswalks should be clearly marked with continental pattern marking. Figure E-101 displays the suggested locations of these crosswalks. Install advance warning signs for crosswalks on W. Jefferson St., in addition to those required by the IL MUTCD Using pedestrian signage to encourage pedestrians to use only the crosswalks and in-street warning signs for drivers (Figure E-102) Relocating traffic signs blocked by trees and other objects, to make them more noticeable for drivers. Improving lighting condition in the residential area along W. Jefferson St. In the long-term, it is suggested to remove one travel lane and replace it with bike lanes. As shown in Figure E-103, after removing one traffic lane and restriping, W. Jefferson St. can 208
 two bike lanes (5 to 6 feet), and a marked divider")


233 accommodate two standard travel lanes (11 to 12 ft. Width) two bike lanes (5 to 6 feet), and a marked divider between these lane uses (2 ft.). This change can make the corridor safer and more desirable for bicyclists and pedestrians. Figure E-101. The location of suggested crosswalks on W. Jefferson St. Figure E-102. Suggested signs for crosswalks on W. Jefferson St. 209

234 Figure E-103. Existing and recommended cross-section for W. Jefferson St. E.5.3. South MacArthur Blvd (corridor) The reviewed section of S. MacArthur Blvd. in Springfield, Illinois, was 50 ft. wide, a north-south arterial corridor with two travel lanes per direction, and one two-way left-turn lane. The selected section was between two signalized intersections with 350 ft. between. The speed limit was 30mph and the ADT in 2015 was 20,600 vehicles per day. All the land uses along the corridor were commercial including school, restaurants, bank, and retail stores. In addition, there were several bus stops along the corridor. Figure E-104 illustrates land uses and other details for the selected section of S. MacArthur Blvd. Table E21 summarizes the geometric and traffic characteristics of S. MacArthur Blvd. 210
 1,350 Width (ft.")
235 Figure E-104. Details and land uses at the selected section of S. MacArthur Blvd. Table E21. Geometric and Traffic Characteristics of Selected Section of S. MacArthur Blvd. Length (ft.) 1,350 Width (ft.) Number of Lanes 4 Median Two-Way Turn Lane Average Daily Traffic 20,600 Speed Limit (mph) 30 Observed Speed Average: 34 mph, Highest: 39 mph Crash Type ( ) 2 A-Injury Land Uses Commercial Pedestrian attractions School, Restaurant, Bank, Retail Store, Bus Stop. Lighting On-Street Parking Sidewalk Equipped None Allowed Both Sides are Equipped E Issues Identified There was no designated midblock crosswalk along the reviewed corridor. Given the business around the area, there were needs for pedestrians to cross in between the two signalized intersections. The 211

236 distance between the two signalized intersections is 350 ft., no crosswalks in between to address the pedestrian crossing need. E Suggestions Install a midblock crosswalk with a pedestrian refuge island in front of the fast food restaurant shown in Figure E-105. There were many parking lots along the main corridor close to the suggested crosswalk s location. Left turn and right turn maneuvers of vehicles entering and exiting to/from the parking lots make the section unsafe for pedestrian crossing. Access management might be necessary to reduce some turning maneuvers (Figure E-106). In the long term, it is suggested to remove one travel lane per direction and replace it with one bike lane per direction. This change would help to reduce traffic speeds, limit the width that a pedestrian has to cross, and give more room between the sidewalk and the traveling roadway McDonald s Figure E-105. Recommended mid-term treatment, installing crosswalk along S. MacArthur Blvd. 212

, the roadway functional classification of Illinois Rte. 29 was an Other Principal Arterial.")
237 Figure E-106. Schematic view of suggested mid-term treatment for installing pedestrian refuge (NACTO, 2017). E.5.4 Illinois Route 29 Illinois Route 29 in Springfield, Illinois, was a five-lane divided highway connecting Rochester to Springfield, with a posted speed of 45 mph. The total width was between 50 ft. and 32 ft. to the north and 32 ft. and 44 ft. to the south (Figure E-107and Figure E-108). According the website Getting around Illinois (IDOT, 2016), the roadway functional classification of Illinois Rte. 29 was an Other Principal Arterial. Sidewalks lead up to this location from a residential area to the east and to the west, the Lost Bridge Multiuse Trail runs parallel to Illinois Rte. 29 and an elementary school is present. The observed traffic speeds were close to the speed limit, between mph. According to the data of Traffic Count Database System (TCDS) the ADT for the corridor was 13,000 ADT in Figure E-107. Plan view of the intersection of Illinois Rte. 29 and Taft Dr. 213

238 Figure E-108. Street view of the intersection of Illinois Rte. 29 and Taft Dr. E Existing Treatments and Problems Identifies The intersection of Illinois Rte. 29 and Taft Dr. has a marked crosswalk, which was installed after a fatal pedestrian crash occurred. It was clear that much effort was placed at this location to make the crosswalk visible. The crosswalk marking was 6 ft. wide with continental style. The crosswalk was signed on both sides of the street and in the median. The pedestrian cross sign is mounted on a pole with retroreflective tape to increase its visibility (Figure E-108). The crosswalk was placed at the intersection of the nearest subdivision and across from the elementary school. The lighting condition was also improved after the fatal crash. This crosswalk location connects a bike path, a residential area, and an elementary school. The field review suggested that there was a sight distance problem for pedestrians (Figure E-109). Vehicles traveling Northbound on IL Rte. 29 can be occluded by the crest of the downstream vertical curve. This location was approximately 220 ft. from the crosswalk. Otherwise, sight distance was adequate, the crosswalk was marked clearly, and there was a grass median providing a refuge island for pedestrians. 214

239 Figure E-109. Example of vehicle occlusion near the intersection of Illinois Rte. 29 and Taft Dr. E Suggestions Because the speed limit was 45 mph and there were 5 lanes to cross, this location is not suitable for uncontrolled pedestrian crossing. In particular, sight distance for pedestrians might be a problem at the crest curve segment. Based on these factors, it is suggested removing the crosswalk or signalizing this intersection. E.5.5. Broadway St. between N. 25 th St. to N. 48 th St. Broadway St., also known as Illinois Route 104, is an east-west major arterial in Quincy, Illinois, with 2 lanes per direction and a two-way left-turn lane. The ADT on this corridor was between 18,000 to 24,000 vehicles per day with 7 10% heavy vehicles. Land uses along this corridor were mixed, with mostly commercial, including restaurants. The speed limit was between 30 and 40 mph. Two segments of Broadway St. were reviewed. The first section was between N. 25th St. to N. 48th St. This 1,500-ft. long segment was between two signalized intersections. The width of this section of Broadway St. was 60 to 70 ft. and the speed limit was 40 mph with 4 lanes and a two-way left-turn lane. Figure E-110 displays the details about this first section of Broadway St. 215

240 Figure E-110. Broadway St. between N. 25 th St. and N. 48 th St. Collected traffic data in 2014 showed that the ADT on this section of corridor was 23,800 vehicles per day with 7.5% heavy vehicles. Based on reported crash data from 2010 to 2014, one fatal crash happened on this section of Broadway St. in Lighting condition needs improvement on the south side of the corridor, but because of the existence of restaurants, the north side of the corridor was equipped with appropriate lighting. Table E22 summarizes some of these details about this section of Broadway St. Table E22. Traffic and Geometric Characteristics of Broadway St. Between N. 25th St. to N. 48th St. E Issues identified Length (feet) 1,500 Width (ft.) Number of Lanes 4 Median Two-Way Left-Turn Lane Average Daily Traffic 23,800 Heavy Vehicle Rate 7.5% Speed Limit (mph) 40 Observed Speed Average: 40 mph, Highest: 59 mph Crash Type ( ) 1 Fatal Land Uses Restaurants, Commercial Lighting Equipped, needs improvement on the south side of the corridor On-Street Parking None Allowed There were no designated midblock crosswalks along this corridor. But the attractions along the corridor could encourage pedestrians to cross Broadway St. at locations without crosswalks. Broadway St. was too wide with too high of a speed limit and heavy traffic volume during the day time. 216

241 E Suggestions Engineers should consider a pedestrian crossing facility connecting parking lot entrances across Broadway St. For pedestrians to cross this section of Broadway St., a grade-separated pedestrian crossing is recommended. E.5.6. Broadway St. between N. 25 th St. to N. 48 th St. The second section of Broadway St. was a half-mile corridor between two signalized intersections, between N. 18 th St. and N. 12 th St. This corridor has 56 ft. width with 4 lanes and a two-way left-turn lane. The speed limit was 30 mph and the ADT was 22,400 vehicles per day with 7% heavy vehicles. Most of the land uses were commercial including restaurants, banks, and retail businesses. Figure E- 111 displays details about this section of Broadway St. As shown in Figure E-111, there were five unsignalized intersections with crosswalks. Also, there were two pedestrian-crash locations, one of them at the three-leg intersection with N. 13 th St. and the other one at the intersection with N. 16 th St. Both sides of the street were equipped with sidewalks and street lighting. Table E 23 summarizes details about this section of Broadway St. Figure E-111. Details and land uses along Broadway St. between N. 25th St. and N. 48th St. Table E 23. Traffic and Geometric Specifications of Broadway St. Between N. 25th St. to N. 48th St. Length (mi) 0.5 Width (ft.) 56 Number of Lanes 4 Median Two-Way Left-Turn Lane Average Daily Traffic 22,400 Heavy Vehicle Rate 7% Speed Limit (mph) 30 Observed Speed Average: 30 mph, Highest: 36 mph Crash Type ( ) 2 B-Injury Land Uses Restaurants, Hospital, Retail Business, Residential Lighting Equipped, needs improvement on the whole corridor On-Street Parking No Allowed 217
. Figure E-112.")
242 E Existing Treatments Marked crosswalks with pedestrians crossing signs were the treatments observed along this corridor. At un-signalized intersections, major street crosswalks were ladder type. It should be noted that until 2014 the crosswalks were standard type at these locations (Figure E-112). Figure E-112. The type of crosswalk striping across Broadway St. (in 2014 and 2016). E Issues Identified Given the land uses along the corridor, there was a need for pedestrians to cross the main corridor. Blessing Hospital, in the south-west side of the corridor, was a significant pedestrian attraction. Comparing the crash data before and after 2014, there was not much difference (Figure E-113). This finding suggests that marked crosswalks with pedestrian crossing signs were not effective in improving pedestrian safety along Broadway St. 218

243 E Suggestions Figure E-113. Crash locations and types from 2004 to Additional treatments are suggested to improve pedestrian safety as described below: Install a raised median with a pedestrian refuge island at midblock crosswalk locations; Implement a road diet to reduce one traffic lane in each direction, reducing the pedestrian crossing distance. 219
244 E.6 EXAMPLE FIELD REVIEW SHEETS Reviewer(s): Site Location: City, State: Roadway Geometrics Pedestrian & Traffic Data Existing Safety Treatments Un-signalized Crossings 220 Agency: Time: Date: Design speed (mph): Number of lanes: Effective crosswalk width (ft.): Refuge island/median: Check if Present? Yes No Is median ADA compliant (landing min. 4 4 )? Yes No Crossing distance (curb to curb): If there is median then fill both Crosswalk 1, ft. 48 crosswalk 1 and crosswalk 2, otherwise only crosswalk 1. Crosswalk 2, ft. Crosswalk ramp: Check if Present? Yes No Is ramp (width, grades, and truncated domes) ADA compliant? Yes No Sidewalk on both sides of crosswalk: Check if Present? Yes No Horizontal/vertical curve at crossing: Check if Present? Yes No Stopping Sight Distance (SSD) and Pedestrian Sight Distance (PedSD)- Equations on the next page Direction 1 SSD, (in ft.) Provided Adequate? Yes No Direction 2 SSD, (in ft.) Provided Adequate? Yes No Direction 1 PedSD, (in ft.) Provided Adequate? Yes No Direction 2 PedSD, (in ft.) Provided Adequate? Yes No Ped. avg. walking speed (ft./sec): Pedestrian age group (%): Young Middle age Older Count traffic and pedestrian volume in 15 minute intervals on the crosswalk location Pedestrians: (Attach counts) Daily Motorists: AM peak pk 15 min Hourly pk 15 min Hourly PM peak pk 15 min Hourly pk 15 min Hourly Raised crosswalk: Check if Present? Yes No Crosswalk lighting: Check if Present? Yes No Signage: Check if Present? Yes No Do they need replacement? Yes No Need Installation? Yes No Supplemental signage: Check if Present? Yes No Distances in each direction? Direction 1 Direction 2 Need installation/replacement? Yes No Pavement marking/striping: Check if Present? Yes No Is the crosswalk visible enough? Yes No Does marking replacement needed? Yes No What is the type of striping? Standard pattern Pedestrian crossing flags: Check if Present? Yes No Advanced stop lines and signs: Check if Present? Yes No Bump-outs: Check if Present? Yes No Flashing Beacons: Check if Present? Yes No What is the type of flashing beacon? Others: Specify (if any) Alternative nearby crosswalk: Check if Present? Yes No Distance, in ft.?
245 Un-signalized Crossings Field Review Worksheet Additional Field Data Un-signalized crossing type: Nearby controlled intersection: Check if Present? Yes No Adjacent land use type: Nearby pedestrian attractions: Transit stops: School: Distance, in ft.? Check if Present? Yes No Check if Present? Yes No Mark the Following: SSD, Ped SD, potential conflicts, striping, signing, lighting unit locations, curb ramps, truncated domes, intersection width, shoulder widths, nearby signal locations, nearby crosswalk locations, pedestrian attractions, transit stops, parking, turn lanes, and lane width. Drag or draw map of the visited site Notes: Sight Distance Calculations: Stopping Sight Distance (SSD), in ft. =1.47V t V 2 /a Pedestrian Sight Distance (PedSD), in ft. = 1.47V (L/Sp+ts) Where, V=posted speed limit (mph), t= brake reaction time (s), a= deceleration rate (ft./s 2 ), L= crossing distance (ft.), Sp= pedestrians avg. walking speed (ft./s), ts= pedestrian start-up and end clearance time (s) Default values (according to AASHTO, HCM, & MUTCD): a=11.2 ft./s 2 ; t=2.5 s, S p=3.5 ft./s; t s=3.0s 221
246 SAMPLE Un-signalized Crossings Field Review Worksheet Reviewer(s): Yan Qi, Rab, Sima & Wendy Agency: Site Location: 509 SW Jefferson Ave (Walnut) Time: City, State: Peoria, IL Date: 10/14/2016 Roadway Geometrics Pedestrian & Traffic Data Existing Safety Treatments Design speed (mph): Number of lanes: Effective crosswalk width (ft.): Refuge island/median: 30 mph 1 10 Check if Present? Yes No Is median ADA compliant (landing min. 4 4 )? Yes No Crossing distance (curb to curb): If there is median then fill both Crosswalk 1, ft. 48 crosswalk 1 and crosswalk 2, otherwise only crosswalk 1. Crosswalk 2, ft. Crosswalk ramp: Check if Present? Yes No Is ramp (width, grades, and truncated domes) ADA compliant? Yes No Sidewalk on both sides of crosswalk: Check if Present? Yes No Horizontal/vertical curve at crossing: Check if Present? Yes No Stopping Sight Distance (SSD) and Pedestrian Sight Distance (PedSD)- Calculate using equations on the next page Direction 1 SSD, (in ft.) Provided Adequate? Yes No Direction 2 SSD, (in ft.) 196 Provided Adequate? Yes No Direction 1 PedSD, (in ft.) 737 Provided Adequate? Yes No Direction 2 PedSD, (in ft.) Provided Adequate? Yes No Ped. avg. walking speed (ft./sec): Pedestrian age group (%): Young Middle age Older Count traffic and pedestrian volume in 15 minute intervals on the crosswalk location Pedestrians: (Attach counts) Daily Motorists: ADT (2015) 7271 AM peak pk 15 min Hourly pk 15 min Hourly 438 PM peak pk 15 min Hourly pk 15 min Hourly 679 Raised crosswalk: Check if Present? Yes No Crosswalk lighting: Check if Present? Yes No Signage: Check if Present? Yes No Do they need replacement? Yes No Need Installation? Yes No Supplemental signage: Check if Present? Yes No Distances in each direction? Direction 1 Direction 2 Need installation/replacement? Yes No Pavement marking/striping: Check if Present? Yes No Is the crosswalk visible enough? Yes No Does marking replacement needed? Yes No What is the type of striping? Pedestrian crossing flags: Standard pattern Check if Present? Yes No Advanced stop lines and signs: Check if Present? Yes No Bump-outs: Check if Present? Yes No Flashing Beacons: Check if Present? Yes No What is the type of flashing beacon? Others: Specify (if any) STOP HERE FOR PEDESTRIAN Alternative nearby crosswalk: Check if Present? Yes No Distance, in ft.?


247 Un-signalized Crossings Field Review Worksheet Additional Field Data Un-signalized crossing type: Nearby controlled intersection: Check if Present? Yes No Adjacent land use type: Nearby pedestrian attractions: Transit stops: School: Crosswalk with in-street crossing sign Distance, in ft.? 370 Commercial Homeless shelter, Dozer Park Check if Present? Yes No Check if Present? Yes No Mark the Following: SSD, Ped SD, potential conflicts, striping, signing, lighting unit locations, curb ramps, truncated domes, intersection width, shoulder widths, nearby signal locations, nearby crosswalk locations, pedestrian attractions, transit stops, parking, turn lanes, and lane width. Drag or draw map of the visited site Pavement Marking Faded Truncated Domes Notes: lane reduction three to one (recently); Pavement marking is faded; good example to reduce the pedestrian s exposure time to traffic. Sight Distance Calculations: Stopping Sight Distance (SSD), in ft =1.47V t V 2 /a Pedestrian Sight Distance (PedSD), in ft = 1.47V (L/Sp+ts) Where, V=posted speed limit (mph), t= brake reaction time (s), a= deceleration rate (ft/s 2 ), L= crossing distance (ft), Sp= pedestrians avg. walking speed (ft/s), ts= pedestrian start-up and end clearance time (s) Default values (according to AASHTO, HCM, & MUTCD): a=11.2 ft/s 2 ; t=2.5 s, S p=3.5 ft/s; t s=3.0s 223

248
Establishing Procedures and Guidelines for Pedestrian Treatments at Uncontrolled Locations
 1 Establishing Procedures and Guidelines for Pedestrian Treatments at Uncontrolled Locations Yan Qi Southern Illinois University Edwardsville 66th Illinois Traffic Engineering and Safety Conference Champaign,
Guidelines for Pedestrian Treatments at Uncontrolled Locations
 1 Guidelines for Pedestrian Treatments at Uncontrolled Locations Yan Qi Southern Illinois University Edwardsville 104 th Annual THE Conference Illini Union Building, University of Illinois at Urbana-Champaign
Guidelines for Pedestrian Treatments at Uncontrolled Locations January 18, 2018
 Est. Dec. 2014 Guidelines for Pedestrian Treatments at Uncontrolled Locations January 18, 2018 Presented by: Kyle Armstrong, Illinois DOT Yan Qi, Southern Illinois University Webinar Logistics Duration
PEDESTRIAN SAFETY IMPROVEMENT EVALUATION GUIDELINE FOR UNCONTROLLED CROSSINGS
 PEDESTRIAN SAFETY IMPROVEMENT EVALUATION GUIDELINE FOR UNCONTROLLED CROSSINGS Traffic Safety Engineering Division Updated: April 2018 EXECUTIVE SUMMARY NDOT Traffic Safety Engineering Division developed
Designing for Pedestrian Safety in Washington, DC
 Designing for Pedestrian Safety in Washington, DC February 25, 2014 George Branyan Pedestrian Program Coordinator District Department of Transportation DC Journey to work mode split: 2012 Means of Transportation
Designing for Pedestrian Safety
 Designing for Pedestrian Safety Treatments at Unsignalized Pedestrian Crossings Presented by: Charlie Zegeer PBIC Director August 17, 2010 Crossing Crashes Part 1: General Principles 3 2 Why do people
UNCONTROLLED PEDESTRIAN CROSSING GUIDELINES
 City and County of Denver UNCONTROLLED PEDESTRIAN CROSSING GUIDELINES Prepared for: Prepared by: Adopted September 2016 This page is intentionally left blank. Contents for Denver Uncontrolled Pedestrian
Designing for Pedestrian Safety. Alabama Department of Transportation Pre-Construction Conference May 2016
 Designing for Pedestrian Safety Alabama Department of Transportation Pre-Construction Conference May 2016 1 Designing for Pedestrians Marking Crosswalks at Signalized intersections High Visibility Markings
IMPROVING PEDESTRIAN SAFETY AT UNCONTROLLED CROSSINGS. Guidelines for Marked Crosswalks
 IMPROVING PEDESTRIAN SAFETY AT UNCONTROLLED CROSSINGS Presented by Nazir Lalani P.E. Traffex Engineers Inc. N_lalani@hotmail.com Guidelines for Marked Crosswalks Source: FHWA, Safety Effects of Marked
MEMORANDUM. Date: 9/13/2016. Citywide Crosswalk Policy
 MEMORANDUM Date: 9/13/2016 Re: Citywide Crosswalk Policy Foreword Through the s Circulation Element and Complete Streets Policy, it is the City s goal to promote walking trips and provide safe facilities
Alternative Treatments for At-Grade Pedestrian Crossings
 Alternative Treatments for At-Grade Pedestrian Crossings IN RESPONSE TO A GROWING NEED FOR BETTER INFORMATION ON PEDESTRIAN CROSSING TREATMENTS TO BE COMPILED INTO A SINGLE COMPREHENSIVE DOCUMENT, THE
POTENTIAL PEDESTRIAN SAFETY IMPROVEMENT EVALUATION GUIDELINE
 POTENTIAL PEDESTRIAN SAFETY IMPROVEMENT EVALUATION GUIDELINE Traffic Safety Engineering Division Updated: August 2016 EXECUTIVE SUMMARY During the February 2015 Transportation Board meeting, Governor Brian
CHAPTER 5 LITERATURE REVIEW
 CHAPTER 5 LITERATURE REVIEW This task includes identification of suitable pedestrian safety countermeasures for research at high pedestrian crash sites in high risk zones. Pedestrian Safety Countermeasures
City of Albert Lea Policy and Procedure Manual 4.10 ALBERT LEA CROSSWALK POLICY
 4.10 ALBERT LEA CROSSWALK POLICY PURPOSE: Pedestrian crosswalks are an integral part of our transportation infrastructure. To be effective and promote safety, marked crosswalks must be installed after
Development of Arlington County s Marked Crosswalk Guidelines. Jon Lawler, P.E. Design Engineer Arlington County, VA
 Development of Arlington County s Marked Crosswalk Guidelines Jon Lawler, P.E. Design Engineer Arlington County, VA April 13, 2015 Transportation System Users Residents Estimated 215,000 in 2014 Lowest
TODAY S WEBINAR AGENDA
 TODAY S WEBINAR AGENDA 3:00 pm: Introduction 3:05 pm: Presentation 3:45 pm: Questions 4:00 pm: Webinar Ends For technical assistance during the webinar: 1-800-263-6317 Choose these prompts: 1, 1, 1 CONTINUING
The DC Pedestrian Master Plan
 The DC Pedestrian Master Plan September 28, 2010 George Branyan Pedestrian Program Coordinator District Department of Transportation Presentation Agenda Scope of the Plan Methodology Recommendations Implementation
Pedestrian & Bicycle Safety Innovations & Applications
 Pedestrian & Bicycle Safety Innovations & Applications County Engineers Association of Maryland Spring, 2017 Conference May 25, 2017 George Branyan Pedestrian Program Coordinator District Department of
GLOSSARY CROSSWALK. CROSSING TYPES
 CROSSWALK The part of a roadway at an intersection included within the connections of the lateral lines of the sidewalks on opposite sides of the street measured from the curbs, or in the absence of curbs
Marshall Metcalf, P.E. Dan Mlacnik, P.E. Division of Highways/District 6 February 24, 2015
 IDOT District 6 Uncontrolled Crosswalk Pedestrian Safety Project Marshall Metcalf, P.E. Dan Mlacnik, P.E. Division of Highways/District 6 February 24, 2015 Statewide Vulnerable User Fatalities 2007-2011
Acknowledgements. Mr. David Nicol 3/23/2012. Daniel Camacho, P.E. Highway Engineer Federal Highway Administration Puerto Rico Division
 Daniel Camacho, P.E. Highway Engineer Federal Highway Administration Puerto Rico Division Acknowledgements Mr. David Nicol Director, FHWA Office of Safety FHWA Office of Safety http://safety.fhwa.dot.gov/provencountermeasures/
Access Management in the Vicinity of Intersections
 Access Management in the Vicinity of Intersections FHWA-SA-10-002 Technical Summary Photo: Ralph Bentley (used with permission) 0 Access Management is: The design, implementation and management of entry
Document 2 - City of Ottawa Pedestrian Crossover (PXO) Program
 Program") 40 Document 2 - City of Ottawa Pedestrian Crossover (PXO) Program OVERVIEW The City of Ottawa Pedestrian Crossover (PXO) Program provides the basis for PXO implementation in Ottawa. The program s processes
40 Document 2 - City of Ottawa Pedestrian Crossover (PXO) Program OVERVIEW The City of Ottawa Pedestrian Crossover (PXO) Program provides the basis for PXO implementation in Ottawa. The program s processes
HAWK Signal. Pedestrian Safety. Illinois Traffic Engineering & Safety Conference Thursday, October 21, 2010
 HAWK Signal Pedestrian Safety Illinois Traffic Engineering & Safety Conference Thursday, October 21, 2010 Background Information High-intensity Activated crosswalk Developed by the City of Tuscon, AZ First
Improving Pedestrian Safety at Unsignalized Crossings. Shawn Turner, P.E. Texas A&M Transportation Institute
 Improving Pedestrian Safety at Unsignalized Crossings Shawn Turner, P.E. Texas A&M Transportation Institute Overview of Presentation What are the issues/problems? Framework for crossing treatments Marked
PEDESTRIAN CROSSING STATISTICS
 PEDESTRIAN SAFETY UTILIZATION OF RRFB AND HYBRID BEACONS WILLIAM (BILL) MARSHALL PEDESTRIAN CROSSING STATISTICS STUDIES INDICATE CROSSWALK COMPLIANCE IS FROM 4% 30% HAWAII REPORTED 50 NON YIELDS TO PEDESTRIANS
Appendix A: Crosswalk Policy
 Appendix A: Crosswalk Policy Appendix A: Crosswalk Policy Introduction This citywide Crosswalk Policy is aimed at improving pedestrian safety and enhancing pedestrian mobility by providing a framework
Fundamentals of Traffic Control Devices
 Fundamentals of Traffic Control Devices Traffic Engineering & Operations October 8, 2014 Raj Ponnaluri, Angela Wilhelm, and Christopher Lewis Agenda Agenda Signs Pavement Markings Signals Traffic Operations
Guidance for Installation of Pedestrian Crosswalks on Michigan State Trunkline Highways
 Guidance for Installation of Pedestrian Crosswalks on Michigan State Trunkline Highways Michigan Department of Transportation July 7, 2014 Engineering Manual Preamble This manual provides guidance to administrative,
Pedestrian Treatments by
 Pedestrian Treatments by Kay Fitzpatrick Texas A&M Transportation Institute TxDOT Short Course October 15-16, 2013 Recent Research Efforts FHWA Studies Crosswalk markings Driver yielding (DY) at rectangular
Chapter 5: Crossing the Street
 Chapter 5: Crossing the Street Whether walking or bicycling, a student s journey to school will more than likely require crossing one or more streets. Per the Safe Routes to School Guide, maintained by
California Manual on Uniform Traffic Control Devices
 California Manual on Uniform Traffic Control Devices FHWA s MUTCD 2009 Edition as amended for use in California 2012 Edition State of California Business, Transportation and Housing Agency Department of
Chapter 2: Standards for Access, Non-Motorized, and Transit
 Standards for Access, Non-Motorized, and Transit Chapter 2: Standards for Access, Non-Motorized, and Transit The Washtenaw County Access Management Plan was developed based on the analysis of existing
In response to your request for information on mid-block pedestrian crossing policies and guidelines, the following information is enclosed:
 August 18, 2016 City of Brentwood, Tennessee Mr. Kirk Bednar City Manager 5211 Maryland Way P. O. Box 788 Brentwood, Tennessee 37024 VIA ELECTRONIC MAIL Dear Mr. Bednar: In response to your request for
Crash Analysis of I-64 Closure in St. Louis County
 Report # MATC-MST: 341 Final Report 25-1121-0001-341 Crash Analysis of I-64 Closure in St. Louis County Ghulam H. Bham, Ph.D. Professor Department of Civil, Architectural, and Environmental Engineering
Today s presentation
 Today s presentation Introduction and housekeeping PBIC Trainings http://www.walkinginfo.org/training Next PBIC Webinar Community Approaches to Pedestrian Safety Education Gillian Hotz and David Parisi
Broadway Street Pedestrian Safety Study Cass Street to 700 Feet North of Randall Avenue
 Broadway Street Pedestrian Safety Study Cass Street to 700 Feet North of Randall Avenue Prepared for: City of De Pere, Wisconsin Prepared by: June, 2017 Broadway Street Pedestrian Safety Study Cass Street
EVALUATION OF HAWK SIGNAL AT GEORGIA AVENUE AND HEMLOCK STREET, NW IN THE DISTRICT OF COLUMBIA FINAL REPORT. August 30, 2010
 EVALUATION OF HAWK SIGNAL AT GEORGIA AVENUE AND HEMLOCK STREET, NW IN THE DISTRICT OF COLUMBIA FINAL REPORT August 30, 2010 Submitted to: Mr. George Branyan Pedestrian Program Manager Policy, Planning
Pedestrian Hybrid Beacon Guide Recommendations and Case Study. FHWA Safety Program.
 Pedestrian Hybrid Beacon Guide ecommendations and Case Study FHWA Safety Program http://safety.fhwa.dot.gov A pedestrian hybrid beacon (PHB) is a traffic control device similar to a European pedestrian
STEP. Rectangular Rapid Flashing Beacons. Safe Transportation for Every Pedestrian
 STEP Safe Transportation for Every Pedestrian Rectangular Rapid Flashing Beacons Duane Thomas, Federal Highway Administration Megan McCarty Graham, Toole Design October 30, 2018 Housekeeping Problems with
Appendix A. Knoxville TPO Greenway Signage Guidelines. Appendix A: Knoxville TPO Greenway Signage Guidelines Knox to Oak Ridge Greenway Master Plan
 Appendix A Knoxville TPO Greenway Signage Guidelines 75 Overview: Adequate signing and marking are essential on shared-use paths, especially to alert bicyclists to potential conflicts and to convey regulatory
PEDESTRIAN ACCOMMODATIONS DPS 201 AT ROUNDABOUTS
 PEDESTRIAN ACCOMMODATIONS DPS 201 AT ROUNDABOUTS WHY THEY WORK FOR PEDESTRIANS IF DESIGNED CORRECTLY Separated sidewalks direct peds to crosswalks Splitter island Slow speed exit Truck apron Crosswalk
Addendum to SDDCTEA Pamphlet 55 17: Better Military Traffic Engineering Revision 1 Effective: 24 Aug Crosswalk Guidelines
 Addendum to SDDCTEA Pamphlet 55 17: Better Military Traffic Engineering Revision 1 Effective: 24 Aug 2017 Crosswalk Guidelines Warrants for Uncontrolled Crosswalk Locations Crosswalks at Midblock Locations
Parisi TRANSPORTATION CONSUtllHG
 Attachment 1 To: Jonathan Goldman, P.E., QSD, CFM From: Cc: David Parisi, P.E., Curt Harrington, E.l.T. Andrew Davidson, P.E. Date: June 6, 2016 Subject: Bridgeway - Uncontrolled Crosswalk Tool and Location
Town of Windsor Pedestrian Crossing Guidelines
 Town of Windsor Pedestrian Crossing Guidelines Prepared for: Town of Windsor Engineering Department 301 Walnut Street Windsor, Colorado 80550 For More Information, please contact: Engineering Department
Appendix T CCMP TRAIL TRAFFIC & TRANSPORTATION DESIGN STANDARD
 Appendix T CCMP 3.3.4 TRAIL TRAFFIC & TRANSPORTATION DESIGN STANDARD 3.3.4 Trail Traffic and Transportation Design Multi-use trails have certain design standards, which vary depending on the agency that
DPS 201 RECTANGULAR RAPID FLASHING BEACON (RRFB)
") DPS 201 RECTANGULAR RAPID FLASHING BEACON (RRFB) WHY? PEDESTRIANS NEED TO CROSS CASE STUDY: RRFB (ST. PETERSBURG, FL) St. Petersburg, FL Problem/Background Multi-lane, high-speed roadways Conflicts at
DPS 201 RECTANGULAR RAPID FLASHING BEACON (RRFB) WHY? PEDESTRIANS NEED TO CROSS CASE STUDY: RRFB (ST. PETERSBURG, FL) St. Petersburg, FL Problem/Background Multi-lane, high-speed roadways Conflicts at
Texas Transportation Institute The Texas A&M University System College Station, Texas
 1. Report No. FHWA/TX-05/0-4084-P1 4. Title and Subtitle GUIDELINES FOR THE USE OF COUNTERMEASURES TO REDUCE CRASHES ON APPROACHES TO SIGNALIZED INTERSECTIONS NEAR VERTICAL CURVES 2. Government Accession
APPENDIX A: Complete Streets Checklist DRAFT NOVEMBER 2016
 APPENDIX A: Complete Streets Checklist DRAFT NOVEMBER 2016 Complete Streets Checklist MetroPlan Orlando s Complete Streets Checklist is an internal planning tool for staff to further implementation of
Overview. Illinois Bike Summit IDOT Complete Streets Policy Presentation. What is a Complete Street? And why build them? And why build them?
 Overview Illinois Bike Summit IDOT Complete Streets Policy Presentation Aren Kriks, P.E. District One Bicycle Coordinator and Bureau of Programming Project Engineer History of Complete Streets IDOT Policy
FDOT Bicycle/Pedestrian Focused Initiative & Complete Streets
 Florida Department of TRANSPORTATION FDOT Bicycle/Pedestrian Focused Initiative & Complete Streets Billy L. Hattaway, PE District One Secretary Secretary s Pedestrian Safety Initiative Dangerous by Design
STREET CROSSINGS. Module 4. Part 2: Countermeasures
 STREET CROSSINGS Module 4 Part 2: Countermeasures Learning Outcomes 2 At the end of this module, you will be able to: Identify which crossing technique is appropriate Ensure oft-requested solutions (crosswalks,
Chapter 5 DATA COLLECTION FOR TRANSPORTATION SAFETY STUDIES
 Chapter 5 DATA COLLECTION FOR TRANSPORTATION SAFETY STUDIES 5.1 PURPOSE (1) The purpose of the Traffic Safety Studies chapter is to provide guidance on the data collection requirements for conducting a
CITY OF SARATOGA SPRINGS PEDESTRIAN CROSSING TOOLBOX
 CITY OF SARATOGA SPRINGS PEDESTRIAN CROSSING TOOLBOX This toolbox is to be used to guide pedestrian crossing improvements within the City of Saratoga Springs. Details for each crossing type are provided.
Military Road Safety Improvements
 Military Road Safety Improvements 26 th Road North to 31 st Street North SUMMARY OF DATA REVIEW AND PRELIMINARY RECOMMENDATIONS Prepared for: Department of Environmental Services Traffic Engineering and
Engineering Countermeasures for Transportation Safety. Adam Larsen Safety Engineer Federal Highway Administration
 Engineering Countermeasures for Transportation Safety Adam Larsen Safety Engineer Federal Highway Administration 360-619-7751 Adam.Larsen@DOT.GOV Countermeasure Selection Resources Manual for Selecting
2009 Manual on Uniform Traffic Control Devices
 2009 Manual on Uniform Traffic Control Devices Tori Brinkly, PE Highway Safety Engineer WFL-FHWA April 20, 2010 Paragraphs are numbered. Standard Statements are bolded. Guidance statements are italicized.
DEFINITIONS Activity Area - Advance Warning Area Advance Warning Sign Spacing Advisory Speed Approach Sight Distance Attended Work Space
 DEFINITIONS Activity Area - that part of a TTC zone activity area where the work actually takes place. It consists of the work space, traffic space and one or more buffer spaces. Advance Warning Area -
What Engineering Can Do for You! Low Cost Countermeasures for Transportation Safety
 What Engineering Can Do for You! Low Cost Countermeasures for Transportation Safety Adam Larsen Safety Engineer Federal Highway Administration 360-619-7751 Adam.Larsen@DOT.GOV Adam Larsen TTP Safety Engineer
2014 FHWA Aging Road User Handbook. Recommendations to Accommodate Aging Pedestrians. Lifesaver National Conference. What is the Handbook?
 2014 FHWA Aging Road User Handbook Recommendations to Accommodate Aging Pedestrians Lifesaver National Conference March 17, 2015 Revised June 2014 1 What is the Handbook? 1998 1st Edition 2001 2nd Edition
Active Transportation Facility Glossary
 Active Transportation Facility Glossary This document defines different active transportation facilities and suggests appropriate corridor types. Click on a facility type to jump to its definition. Bike
Bureau of Planning and Research. Project No.: (C14) Phase II Final Report March 2, 2007 CMA
 Phase II Final Report March 2, 2007 CMA") Bureau of Planning and Research Safer Driver Actions at Stop Signs Project No.: 04-01 (C14) Phase II Final Report March 2, 2007 CMA Technical Report Documentation Page 1. Report No. 2. Government Accession
Bureau of Planning and Research Safer Driver Actions at Stop Signs Project No.: 04-01 (C14) Phase II Final Report March 2, 2007 CMA Technical Report Documentation Page 1. Report No. 2. Government Accession
DEPARTMENT OF ENVIRONMENTAL SERVICES. North Harrison Street (Lee Highway to Little Falls Road) Comparative Analysis. Prepared for:
 Comparative Analysis. Prepared for:") DEPARTMENT OF ENVIRONMENTAL SERVICES North Harrison Street (Lee Highway to Little Falls Road) Comparative Analysis Prepared for: Arlington County Department of Environmental Services 2100 Clarendon Boulevard,
DEPARTMENT OF ENVIRONMENTAL SERVICES North Harrison Street (Lee Highway to Little Falls Road) Comparative Analysis Prepared for: Arlington County Department of Environmental Services 2100 Clarendon Boulevard,
The 2009 Manual on Uniform Traffic Control Devices (MUTCD) (Brief) Highlights for Arizona Practitioners. Arizona Department of Transportation
 (Brief) Highlights for Arizona Practitioners. Arizona Department of Transportation") The 2009 Manual on Uniform Traffic Control Devices (MUTCD) (Brief) Highlights for Arizona Practitioners Arizona Department of Transportation New 2009 MUTCD 9 Parts (down from 10 in 2003) 816 pages (up
The 2009 Manual on Uniform Traffic Control Devices (MUTCD) (Brief) Highlights for Arizona Practitioners Arizona Department of Transportation New 2009 MUTCD 9 Parts (down from 10 in 2003) 816 pages (up
MEMORANDUM. Charlotte Fleetwood, Transportation Planner
 MEMORANDUM Date: Updated August 22, 2017 To: Organization: Charlotte Fleetwood, Transportation Planner Boston Transportation Department From: Jason DeGray, P.E., PTOE, Regional Director of Engineering
C. Best Practice Pedestrian Treatment Toolbox
 C. Best Practice Pedestrian Toolbox The Best Practice Pedestrian Toolbox presents the recommended tools in striping, signalization, signage, geometry and other categories for improving both uncontrolled
Multimodal Design Guidance. October 23, 2018 ITE Fall Meeting
 Multimodal Design Guidance October 23, 2018 ITE Fall Meeting Introductions Jessica Wilson TDOT Multimodal Division Office of Multimodal Planning Program Supervisor Jessica.L.Wilson@tn.gov Ali Hangul TDOT
FDOT Bicycle/Pedestrian Focused Initiative & Complete Streets
 Florida Department of TRANSPORTATION FDOT Bicycle/Pedestrian Focused Initiative & Complete Streets DeWayne Carver, AICP State Bicycle/Pedestrian Coordinator Secretary s Pedestrian Safety Initiative Dangerous
FLORIDA DEPARTMENT OF TRANSPORTATION DISTRICT 7 DISTRICT WIDE BICYCLE/PEDESTRIAN ACCESS TO TRANSIT SAFETY ASSESSMENT AND IMPROVEMENT PLAN
 FLORIDA DEPARTMENT OF TRANSPORTATION DISTRICT 7 DISTRICT WIDE BICYCLE/PEDESTRIAN ACCESS TO TRANSIT SAFETY ASSESSMENT AND IMPROVEMENT PLAN TRANSIT SAFETY ASSESSMENT SR 55/US 19 AT 80 TH AVE N DRAFT JUNE
Pedestrian Safety at Roundabouts
 Countermeasure Strategies for Pedestrian Safety Pedestrian Safety at Roundabouts Hillary Isebrands Federal Highway Administration January 6, 2016 Today s Presentation Introduction and housekeeping Audio
Mid-block Crosswalks Law, Planning, Design & Liability
 Mid-block Crosswalks Law, Planning, Design & Liability Prepared by Norman Cox, PLA, ASLA and Carolyn Prudhomme, ASLA The Greenway Collaborative, Inc. Ann Arbor, Michigan The Greenway Collaborative, Inc.
GUIDELINES FOR USING DECISION SIGHT DISTANCE AT IGNALIZED INTERSECTIONS NEAR VERTICAL CURVES
 1. Report No. FHWA/TX-05/0-4084-P2 4. Title and Subtitle 2. Government Accession No. 3. Recipient's Catalog No. GUIDELINES FOR USING DECISION SIGHT DISTANCE AT IGNALIZED INTERSECTIONS NEAR VERTICAL CURVES
REDUCING COLLISIONS AT HIGH CRASH LOCATIONS
 REDUCING COLLISIONS AT HIGH CRASH LOCATIONS Presented by Nazir Lalani P.E. Traffex Engineers Inc. N_lalani@hotmail.com ACCIDENTS AND SAFETY Why is safety important? Safety components Who is responsible?
Rectangular Rapid Flashing Beacons
 Countermeasure Strategies for Pedestrian Safety Rectangular Rapid Flashing Beacons Mike Cynecki Lee Engineering November 5, 2015 Today s Presentation Introduction and housekeeping Audio issues? Dial into
Traffic Engineering Update on Bike/Ped Topics. Marc Lipschultz, P.E. PTOE Central Office Traffic Engineering Division
 Traffic Engineering Update on Bike/Ped Topics Marc Lipschultz, P.E. PTOE Central Office Traffic Engineering Division Bicycle/Pedestrian Advisory Committee August 3, 2016 Agenda Share the Road / Bikes May
PEDESTRIAN ACCOMMODATIONS DPS 201 AT INTERCHANGES
 PEDESTRIAN ACCOMMODATIONS DPS 201 AT INTERCHANGES UNDERSTANDING THE ISSUES Intersections of freeway ramp terminals at crossroads are the most critical components of an interchange Challenge: balance mobility
Comparison of the Green Arrow and the Circular Green for Turn Prohibition to Reduce Wrong-Way Movements at Interchange Terminals
 Comparison of the Green Arrow and the Circular Green for Turn Prohibition to Reduce Wrong-Way Movements at Interchange Terminals Jin Wang Department of Civil Engineering Auburn University March 27, 2017
CITY OF BEVERLY HILLS TRAFFIC AND PARKING COMMISSION
 CITY OF BEVERLY HILLS TRAFFIC AND PARKING COMMISSION TO: FROM: SUBJECT: ATTACHMENT: Traffic and Parking Commission Martha Eros, Transportation Planner Christian Vasquez, Transportation Planning Analyst
PEDESTRIAN CROSSING SOLUTIONS ANDREA HARTH, PE, PTOE TEC ENGINEERING, INC.
 PEDESTRIAN CROSSING SOLUTIONS ANDREA HARTH, PE, PTOE TEC ENGINEERING, INC. Pedestrian Safety 2017 Pedestrian Crashes in Ohio Crash Severity Number % Fatal Crash 141 4.9% Injury Crash 2546 89.1% Property
Safety Benefits of Raised Medians and Pedestrian Refuge Areas. FHWA Safety Program.
 Safety Benefits of Raised Medians and Pedestrian Refuge Areas FHWA Safety Program http://safety.fhwa.dot.gov There s a signal up the block, but looking left there s a gap in traffi c. Looking right there
Project Team. Refined Pedestrian Crossing Toolbox. Problem Statement. Aerial of Study Corridor. Crossing Accommodations and Pedestrian Fatalities
 Project Team Refined Pedestrian Crossing Toolbox Treatments on Wide, High Speed Urban Roadways Developed as Part of the Springfield Main Street (OR 126) Safety Study Consultants Scott Mansur, P.E., P.T.O.E.
RAMP CROSSWALK TREATMENT FOR SAN DIEGO AIRPORT, TERMINAL ONE
 RAMP CROSSWALK TREATMENT FOR SAN DIEGO AIRPORT, TERMINAL ONE AUTHORS Faisal Hamood, P.Eng, M.Eng. Scott O. Kuznicki, P.E. Leonard Perry, Ph.D. SUBMITTAL DATE Friday, May 12 th, 2017 SUBMITTED FOR THE Annual
F L E T C H E R A V E N U E
 Jan. 29, 2014 Introduction F L E T C H E R A V E N U E FDOT Local Agency Program (LAP) Project FPN: 428214-1-58-01 CIP 63090 Hillsborough County, Traffic Engineering, PWD Stake holders and partners are
Memorandum MAR or in part.
 Interim U.& Department of Transportation federal Highway Administration Memorandum Correction issued 3/21/2018 Subject: - INFORMATION: MUTCD Approval for Optional Use of Pedestrian-Actuated Rectangular
Toolbox of Countermeasures and Their Potential Effectiveness to Make Intersections Safer
 8 Toolbox of Countermeasures and Their to Make Intersections Safer Introduction Studies included in the NCHRP 17-18 (3), Guidance for Implementation of the AASHTO Strategic Highway Safety Plan, as well
November 2012: The following Traffic and Safety Notes were revised:
 CHANGE LIST for MDOT Traffic and Safety, TRAFFIC AND SAFETY NOTES Located at http://mdotcf.state.mi.us/public/tands/plans.cfm JANUARY 2014: The following Traffic and Safety Note was added: Note 705A Angled
2018 AASHTO BIKE GUIDE
 2018 AASHTO BIKE GUIDE Your presenters Jessica Fields, PE Denver Office Director Sagar Onta, PE, PTOE Denver Engineering Director 35 years of combined experience street design, transportation planning,
Town of Mooresville, North Carolina Neighborhood Traffic Calming and Control Device Policy
 Town of Mooresville, North Carolina Neighborhood Traffic Calming and Control Device Policy Adopted January 6, 2014 Town of Mooresville Development Services Department TOWN OF MOORESVILLE NEIGHBORHOOD TRAFFIC
Attachment No. 4 Approved by National Committee Council
 Attachment No. 4 Approved by National Committee Council The Signals Technical Committee distributed a technical committee recommendation to sponsors concerning pedestrian hybrid beacons following the January
AGENDA ITEM F-5 Public Works
 AGENDA ITEM F-5 Public Works Recommendation STAFF REPORT City Council Meeting Date: 9/13/2016 Staff Report Number: 16-163-CC Consent Calendar: Adopt a resolution to establish a citywide crosswalk policy
By: Bill Baranowski, PE TRAFFIC CALMING EXAMPLES IN SUGARHOUSE, DAYBREAK, AND WEST JORDAN CITY
 By: Bill Baranowski, PE TRAFFIC CALMING EXAMPLES IN SUGARHOUSE, DAYBREAK, AND WEST JORDAN CITY 1977 HIGHLAND RUGBY TOUR 1945 WHERE??? What is more contentious than traffic calming? 1951 LOOKING SOUTHEAST
FEDERAL HIGHWAY ADMINISTRATION APPLICATION
 FEDERAL HIGHWAY ADMINISTRATION APPLICATION REQUEST FOR PERMISSION TO EXPERIMENT WITH A BICYCLE BOX INTERSECTION TREATMENT Submitted by: City of Columbus Department of Public Service Date: June 26, 2009
DOT HS September Crash Factors in Intersection-Related Crashes: An On-Scene Perspective
 DOT HS 811 366 September 2010 Crash Factors in Intersection-Related Crashes: An On-Scene Perspective DISCLAIMER This publication is distributed by the U.S. Department of Transportation, National Highway
Pedestrian Safety at Interchanges
 Countermeasure Strategies for Pedestrian Safety Pedestrian Safety at Interchanges Meghan Mitman Fehr and Peers December 10, 2015 Today s Presentation Introduction and housekeeping Audio issues? Dial into
Bicycle Boulevards and Neighborhood Greenways
 Bicycle Boulevards and Neighborhood Greenways Traffic Safety is Improving for Everyone 90 80 70 60 50 40 30 20 10 0 PORTLAND: TOTAL TRAFFIC FATALITIES 1986-2008 1986 1987 1988 1989 1990 1991 1992 1993
RANJIT PRASAD GODAVARTHY. B.Tech., NAGARJUNA UNIVERSITY, 2007 A THESIS. submitted in partial fulfillment of the requirements for the degree
 EFFECTIVENESS OF A PEDESTRIAN HYBRID BEACON AT MID-BLOCK PEDESTRIAN CROSSINGS IN DECREASING UNNECESSARY DELAY TO DRIVERS AND A COMPARISON TO OTHER SYSTEMS by RANJIT PRASAD GODAVARTHY B.Tech., NAGARJUNA
RURAL HIGHWAY SHOULDERS THAT ACCOMMODATE BICYCLE AND PEDESTRIAN USE (TxDOT Project ) June 7, Presented by: Karen Dixon, Ph.D., P.E.
 June 7, Presented by: Karen Dixon, Ph.D., P.E.") RURAL HIGHWAY SHOULDERS THAT ACCOMMODATE BICYCLE AND PEDESTRIAN USE (TxDOT Project 0-6840) June 7, 2016 Presented by: Karen Dixon, Ph.D., P.E., TTI Team: Kay Fitzpatrick, Raul Avelar, & Subasish Das Project
RURAL HIGHWAY SHOULDERS THAT ACCOMMODATE BICYCLE AND PEDESTRIAN USE (TxDOT Project 0-6840) June 7, 2016 Presented by: Karen Dixon, Ph.D., P.E., TTI Team: Kay Fitzpatrick, Raul Avelar, & Subasish Das Project
Project Goal and Description. Why Broadway? Broadway SFMTA.COM/BROADWAY. The goal of the Broadway Safety Improvement
 PROJECT OVERVIEW Project Goal and Description The goal of the Broadway Safety Improvement d St Van Ness Ave Project is to improve safety and comfort for all who Franklin St Hyde St Octavia St Gough St
Complete Street Analysis of a Road Diet: Orange Grove Boulevard, Pasadena, CA
 Complete Street Analysis of a Road Diet: Orange Grove Boulevard, Pasadena, CA Aaron Elias, Bill Cisco Abstract As part of evaluating the feasibility of a road diet on Orange Grove Boulevard in Pasadena,
CHAPTER 1 STANDARD PRACTICES
 CHAPTER 1 STANDARD PRACTICES OBJECTIVES 1) Functions and Limitations 2) Standardization of Application 3) Materials 4) Colors 5) Widths and Patterns of Longitudinal Pavement Marking Lines 6) General Principles