PATTERNS OF DENTAL SEXUAL DIMORPHISM IN EARLY HOMININS: A COMPARATIVE ACCOUNT
|
|
|
- Ariel Nelson
- 5 years ago
- Views:
Transcription


1 Muséum national d Histoire naturelle Master Erasmus Mundus en Quaternaire et Préhistoire PATTERNS OF DENTAL SEXUAL DIMORPHISM IN EARLY HOMININS: A COMPARATIVE ACCOUNT ALIK HUSEYNOV Tuteur : PROF. DR. ROBERTO MACCHIARELLI Année académique 2009/2010
2 2 TABLE OF CONTENTS ABSTRACT... 3 RÉSUMÉ INTRODUCTION SEXUAL DIMORPHISM IN HOMINID EVOLUTION ESTIMATION OF SEXUAL DIMORPHISM IN FOSSIL PRIMATE TAXA MATERIALS METHODS OF ANALYSIS RESULTS AND DISCUSSION CONCLUSIVE REMARKS AND RESEARCH PERSPECTIVES ACKNOWLEDGMENTS REFERENCES SUPPLEMENTARY INFORMATION (ADDITIONAL). 1-64
3 3 ABSTRACT This study represents the first comprehensive comparative analytical approach to tentatively estimate the degree of sexual dimorphism of dental crown dimensions (mesiodistal and buccolingual diameters of the permanent maxillary and mandibular dentition) in a large number of Mio-Pleistocene hominin taxa. The results show that, even if represented by a modest dental sample, Australopithecus anamensis is the most dimorphic taxon, while the early Pliocene Ardipithecus ramidus almost systematically behaves as the least dimorphic one. Depending on the tooth-class and variable considered, A. afarensis and Paranthropus robustus tend to approach the A. anamensis figures or to assume an intermediate position. Based on these results, the hypothesis of a single lineage relating Ar. kadabba to A. afarensis through Ar. ramidus and A. anamensis seems unlikely. As a whole, the pattern of dental sexual dimorphism highly fluctuates within and among most investigated taxa and does not evidence a predictable polarity. This suggests that the currently available hominin dental record may not be fully representative of the real paleobiological variation. While the development of new advanced statistical methods is certainly crucial in order to better assess the degree of sexual dimorphism in fossil primate taxa, much larger dental samples from new/ongoing field projects are necessary to provide more reliable and coherent interpretative models on the taxonomic status, phylogenic relationships, dimorphic patterns, and evolutionary trends of early hominins.
4 4 RÉSUMÉ Cette étude représente la première approche globale d'analyse comparative pour essayer d'estimer le degré de dimorphisme sexuel de la couronne dimensions dentaire (diamètre mésiodistal et buccolinguale de la permanente maxillaires et mandibulaires. dentition) dans un grand nombre de taxons homininés Mio-Pléistocène. Les résultats montrent que, même si elle est représentée par un échantillon modeste dentaire, anamensis est le taxon le plus dimorphe, tandis que le début du Pliocène Ardipithecus ramidus presque systématiquement se comporte comme le moins dimorphe. En fonction de la dent de classe et des variables considérées, A. afarensis et Paranthropus robustus tendent à se rapprocher les chiffres A. anamensis ou d'assumer une position intermédiaire. Sur la base de ces résultats, l'hypothèse d'une lignée unique relatif Ar. kadabba à A. afarensis par Ar. ramidus et A. anamensis semble peu probable. Dans l'ensemble, le modèle de dimorphisme sexuel dentaire varie fortement au sein et parmi les plus étudiés taxons et n'apporte pas de preuves de polarité prévisible. Ceci suggère que les hominidés actuellement disponibles les dossiers dentaires ne peuvent pas être entièrement représentatif de la variation réelle paléobiologiques. Pendant que le développement de nouvelles méthodes statistiques avancées est certainement crucial afin de mieux évaluer le degré de dimorphisme sexuel chez les taxons de primates fossiles, beaucoup de plus grands échantillons dentaires de projets nouveaux ou en cours sur le terrain sont nécessaires pour fournir plus fiable et plus cohérente des modèles d'interprétation sur le statut taxonomique, les relations phylogénétiques, les modèles dimorphique, et les tendances de l'évolution des premiers homininés.
5 5 1. INTRODUCTION Besides the historically well-established taxa Homo (H.), Paranthropus (P.), and Australopithecus (A.), since mid '90 well four new genera have been added to the hominin sub-family: Ardipithecus (Ar.), Kenyanthropus (K.), Orrorin (O.), and Sahelanthropus (S.). According to some recent reviews (for example, Wood, 2010), this has extended to ca. 22 the number of potential hominin species discovered so far. As a whole, despite the current lack of agreement among the researchers about most taxonomic and phylogenetic related aspects, this still growing primate group tentatively includes the following evolutionary grades: "possible hominins", such as Ar. ramidus, O. tugeniensis, S. tchadensis, Ar. kadabba; "archaic hominins", such as Au. africanus, Au. afarensis, Au. bahrelgazali, Au. anamensis, Au. garhi, K. platyops, Au. sediba; "megadont archaic hominins", such as P. robustus, P. boisei, P. aethiopicus; "transitional hominins", such as H. habilis and H. rudolfensis; "premodern" humans, such as H. erectus, H. ergaster, H. heidelbergensis, H. antecessor, H. floresiensis; and "anatomically modern" humans, that is H. sapiens (Wood, 2010: table 1). While, in general paleontology, descriptive and comparative anatomy and morphology represent the classical bases for assessing the taxonomic status of the fossil record, a special role in primate (and mammal) paleobiology and evolution is played by the comparative assessment of the patterns of morphological and dimensional sexual dimorphism (Plavcan, 1994; Fleagle, 1999). This because, besides obvious taxonomic implications, sexual dimorphism indirectly informs about a number of taxon-specific critical parameters, including growth length, life-style, mating systems, and other biologically-related behaviours (see below the section 1.1 of the present chapter). As the extent of body size sexual dimorphism is commonly investigated and discussed in hominin evolution (for example, McHenry, 1994), as dental morphological and dimensional traits, including crown tooth size, almost invariably occur in the lists of diagnostic features used to identify and characterize new taxa (in Henke and Tattersall, 2007), their independent use in the assessment of the degree of sexual dimorphism variation trends in hominin evolution is limited (Suwa et al., 2009; Kimbel and Delezene, 2009). Following a synthetic review of the current knowledge available on this matter and on the various methodological approaches elaborated to estimate sexual dimorphism in extinct primate taxa, by using a simple analytical approach based on few
6 6 assumptions, here we provide a first, tentative comparative quantitative assessment of its expression and variation in a large number of Mio-Pleistocene hominins. 1.1 SEXUAL DIMORPHISM IN HOMINID EVOLUTION Sexual dimorphism is a common and significant component of variation in extant and fossil primates. The degree of sexual dimorphism in primate evolution is a key factor for understanding the complex social behaviour and related adaptations. Most of the sexual dimorphism research is concentrated on adult characters. In the fossil record, sexual dimorphism is closely linked with the interintraspecific variation and it helps to understand the intrasexual competition with respect to the mating systems (Plavcan and van Schaik 1992, 1994, 1997a, b; Plavcan van Schaik and Kappeler, 1995; Plavcan, 2001; Plavcan, 2003). There are two basic types of dimorphic characters: primary sex differences and secondary sex differences. Primary sex differences are those directly related to mating and reproduction, including obstetrically related differences in the pelvis. Secondary sex differences are any other differences not directly related to mating (Plavcan, 2001). The latter are highly variable in expression among primates. Among the most concrete ones are body mass and canine tooth size dimorphism. Skeletal dimorphism is often pronounced in primates, and is primarily a product of body mass dimorphism (Plavcan, 2001). The extreme body mass dimorphism is observed in hominoids and papionines, while the New World monkeys are characterized by lesser degrees of body mass dimorphism, though there are a few species (howler monkeys) that are comparable to Cercopithecoidae (Ford, 1994; Plavcan and van Schaik, 1997b). Notably, the most dimorphic primates in many dimensions are Gorilla, Pongo, mandrills, baboons and proboscis monkeys, where males are sometimes twice larger (Plavcan and van Schaik, 1997b; Smith and Jungers, 1997). Plavcan (2001) noted that skeletal dimorphism is closely linked with size dimorphism while it has no unequivocal relation to the selection for different male and female adaptations. Many studies show that dimorphism is a function of changes in male and female characters. According to some studies (Leigh and Shea, 1995; Plavcan, van Schaik and Kappeler, 1995), also female competition is associated with changes in dimorphism.
7 7 In the fossil record, where the sex of individual specimens cannot be reliably indentified, sexual dimorphism can reflect both inter and intraspecific variation in a given species (Gingerich and Schoeninger, 1979; Cope, 1993; Plavcan,1993; Plavcan and Cope, 2001). Monogamy and/or polygyny are long term subjects in human evolution with reference to sexual dimorphism (Lovejoy, 1981; Foley and Lee, 1989; McHenry, 1994a,b; Plavcan and van Schaik, 1997a). The problem of using dimorphism to infer behavior in early hominids is a combination of weak canine size dimorphism and intense body mass dimorphism (Plavcan and van Schaik, 1997a). While, in general, sexual size dimorphism is a highlt debated topic, there is a general agreement that many factors, as social behavior, for instance, have a major impact on its quantitative and qualitative expression. Research on living primates has also clearly demonstrated that there might be a correlation between sexual selection and life history indicators, such as duration of lactation period (Lindenfors, 2002a,b). Among the hominins, the amount of variation assessed for Ar. ramidus, for example, appears to be lower than that observed in Australopithecus, which might be due to a low degree of sexual dimorphism in the former. More precisely, relying on canines (Suwa et al., 2009) and postcranially based estimates of body size (Lovejoy et al., 2009c), the ARA-VP-6/500 Ar. ramidus skeleton ( Ardi ) provides an assessment to understand sex attribution of conspecific fossils. With this respect, it is possible to assume that there is an overlap in body size variation between males and females members of this taxon and it likely that they show minimal skeletal body size dimorphism, which is similar to Pan and consistent with a male-bonded social system (Lovejoy, 2009; White et al., 2009a). Concerning A. anamensis, Leakey and co-workers (1998) have suggested that the fossil record from ~4.5 to 3 Ma is represented by a single evolving species with a body size sexual dimorphism lower but similar to that of Gorilla. Some studies suggest that A. africanus might have possessed quite marked craniofacial and body size dimorphism, which is contrary to the relatively modest degree of size dimorphism that could be observed from postcranial remains (Plavcan, 2003). Another analysis had arisen questions if, similarly to A. afarensis, A. africanus degree of dimorphism is similar to that of Gorilla for some femoral variables, of Homo for some humeral variables, and of Pan for canine size. With this respect, it has been
8 8 suggested that sexual dimorphism in the Hadar sample does not fully follow any of the patterns seen in extant African apes, not modern humans. Therefore, for both species of Australopithecus, the assessment of a pattern of sexual dimorphism closer to the Gorilla's or to the human ones seems to be highly dependent on the investigated skeletal elements (Lee, 2005). As noted above, it is widely accepted that sexual dimorphism is a function of selective pressures on both male and female traits, and that a fully satisfying model of its evolution must describe the mechanisms affecting both sexes. Accordingly, the assessment of sexual selection, mating systems, and estimates of the frequency and intensity of intrasexual competition do not infer the same observation. This, because sexual dimorphism is not a simple function of differential male reproductive success, but also of pressures on males for display of the interaction between the utility of different traits as weapons and different fighting strategies at different sizes and in different environments, and of female counterstrategies against male domination of mating patterns. Thus, the living primate models should be used as a proxy to understand all the complexity and implications of sexual dimorphism degree in the hominid fossil record (Plavcan, 2001). Teeth are the mineralized elements of the body and therefore are the most abundant specimens in the vertebrate fossil record, including that of the hominins. Aspects of molar size dimorphism in fossil primate species have its significance in the relationship to body size sexual dimorphism (Plavcan, 2001). In general, the canines are the most dimorphic teeth, being the upper canines more dimorphic than lower ones. Among Cercopithecoidae, male canine teeth tend to be very long and dagger-like, and the crown component can be around four times taller than the root (Crook, 1972; Fleagle, 1999). This gives the tooth a heart-shaped occlusal outline which can be spotted directly (Plavcan, 2001). The mandibular first premolars (P 2 in Platyrrhines and P 3 in Catarrhines) and the lower canine can also be highly dimorphic (Zingeser, 1969; Crook, 1972; Greenfield, 1992a, b, 1996; Greenfield and Washburn, 1992). In most species, the male tooth is elongated to form a hone for sharpening the back edge of the maxillary canine. The lower first premolar is often considered with the canine as part of the C/P 3 functional complex, which is also called honing complex. With this respect, also females can have elongated premolars, and there is evidence that hone of the female mandibular
9 9 premolar is overdeveloped by comparison to the size of the maxillary canine. This suggests that female canine is closely correlated with honing premolar, pointing to the fact that the C/P 3 complex is functional in females to a similar extent as observed in males (Greenfield, 1996; Plavcan, 2001). The field effect in dental sexual dimorphism has been proposed by Garn, Kerewsky and Swindler (1966), where they indicate that teeth which are closer to the canines tend to be more dimorphic than those more distant away. Others have suggested that different taxa share different patterns of dental sexual dimorphism (e.g., Lieberman, et al., 1985; Oxnard, 1987) and, of course, it is possible that non-canine tooth size dimorphism mirror body mass dimorphism (Cochard, 1985; Wood et al., 1991). The molar and premolar teeth dimorphism is less expected on the basis of body mass dimorphism. In the case of males from dimorphic primate taxa having relatively small teeth compared to their body size, this should result from the fact that body size dimorphism is achieved mostly through an extension of male growth, well after tooth size has been determined (Cochard, 1985). In the hominid fossil record, some Miocene apes are characterized by middle to low degree of sexual dimorphism compared to their extant counterparts. For example, Dendropithecus is characterized by large canine teeth in both males and females, suggesting a Hylobatinae-like mating system or relatively high intrasexual competition in both males and females (Fleagle, 1999). Also, canine dimorphism in Afropithecus appears to be reduced through specialization in both sexes likely for opening hard fruits, in a manner which is analogous to modern pithecines (Leakey and Walker, 1997). Another example of modest degree of sexual dimorphism in tooth size among the Miocene apes is that of Oreopithecus, where canine reduction suggests the evolution in this taxon of a Pan-like mating systems associated to reduction in levels of male-male competition. (Alba et al., 2001). For Ouranopithecus, while significantly more dimorphic that Oreopithecus, it has been noted a certain degree of canine reduction shared with later African hominins (Bonis and Koufos, 2001). About this Late Miocene ape, Kelley (2001) shown that male canines in Ouranopithecus are very close to the average of most Miocene apes (Plavcan, 2001). Nonetheless, according to most studies, Ouranopithecus molars are highly sexually dimorphic compared to the extant great ape condition; notably, the lower
10 10 second and third molars are more dimorphic than observed in Pongo and Gorilla, respectively. Also, Ouranopithecus mesiodistal and buccolingual diameters of the lower first molars are more dimorphic than those of any of great apes, likely associated to marked differences in body size between males and females (Schrein, 2006). The high level of variation recorded for Ouranopithecus has suggested the possibility of multiple species subsumed within this taxon, but the high level of mandibular molar variation that also characterize other Miocene apes and even some Plio-Pleistocene hominins is compatible with the interpretation of a single species (Schrein, 2006). Absence of a C/P 3 functional ("honing") complex is, at least theoretically, a defining characters for hominins (White et al., 1994; Fleagle, 1999; Brunet et al., 2002, 2005; Suwa et al., 2009). In this respect, A. afarensis, A. africanus, P. robustus, and P. boisei show small canines by comparison to living hominids (Plavcan and van Schaik, 1997a) and slim canine dimorphism. Compared to Homo, Pan has large canines and relatively marked canine dimorphism; nonetheless, compared to the evidence from most other primates, its canines are proportionally small in both males and females, and canine dimorphism is weak. When compared to the living primate evidence, most hominins had small canines and relatively poorly developed canine dimorphism. However, earlier hominins had relatively large canines and stronger dimorphism compared to Homo. With this respect, Ar. ramidus and A. anamensis are of major interest, because they probably had bigger canines than later hominins (White et al., 1994; Leakey et al., 1995; Suwa et al., 2009). The oldest putative hominin S. tchadensis might have already possessed canine reduction determining a slim degree of sexual dimorphism for this tooth (Brunet et al., 2002). Although the cranium of S. tchadensis is considerably smaller than that of a modern male Gorilla, its supraorbital torus is relatively and absolutely thicker, as well as its mandibular corpus, which more likely indicate male status. If its holotype really represents a male, then the combination of a massive brow ridge with small canines suggests that canine size was probably not very sexually dimorphic, may be as result of relaxed sexual selection (Brunet et al., 2002). Accordingly, S. tchadensis may represent an early stage in the evolution of the non-honing C/P 3 complex characteristic of later hominins. The morphology of new dental specimens from this Late Miocene taxon confirmed that S. tchadensis is distinct

11 11 from extant African apes because of the absence of a C/P 3 functional complex, and is closer with this respect to the hominin clade (Brunet et al., 2005). The chronologically younger slightly dental sample of Ar. kadabba currently includes three permanent canines, two lower and one upper, sharing derived dental features with both hominins and extant apes. In particular, the mesial crest of the upper canine bears a long vertical facet resulting from occlusal contact with the lower canine, extending from the apex and approximating the mesial crown shoulder. However, the crown tip shows no apical wear, except minimal surface polishing. This is often seen in Pan, at least at an early stage of wear (Fig 1.0) In later hominins, such as A. afarensis, this mesial occlusal facet is not as steep, and may be associated with relatively extensive apical wear (Haile-Selassie et al., 2004). FIGURE 1.0 Lateral views of a female common chimpanzee and Ar. kadabba upper and lower canines and premolars (upper canine ASK-VP-3/400, lower canine STD-VP-2/61, upper premolar ASK-VP-3/160 reversed, lower premolar ASK-VP-3/403 reversed), (after Haile-Selassie, Suwa and White, 2004). Functional honing is the phenomenon by which all extant and Miocene apes sharpen the distal edge of the upper canine against the mesiobucally extensive buccal crown surface of the P 3. Among all the African and Eurasian Miocene apes, only O. macedoniensis has been recognized as having a C/P 3 complex that approximates the later hominin condition, as shown by the wear patterns of the upper and lower canines of S. tchadensis and of the lower canine of Ar. kadabba, both demonstrating the lack of a consistently expressed functional honing (Haile-Selassie et al., 2004).
12 12 Canine crown height relative to basal dimensions does not discriminate between hominins and apes, but several aspects are relevant to the interpretation of the Ar. kadabba material. In fact, a relatively tall crown seems to be a condition characteristic of even female upper canines of chimpanzees and bonobos. With this respect, it can be seen that the Ar. kadabba condition corresponds to the lower range characterizing the modern apes as well as some Miocene ape female canines (Haile-Selassie et al., 2009). The distinctly primitive characters in the Ar. kadabba dentition - such as the projecting, interlocking upper and lower canines, and the asymmetric P 3 with buccal wear facet - imply that the last common ancestor with chimpanzees and bonobos retained a functioning C/P 3 complex (Haile-Selassie, Suwa and White, 2004). Compared to Ar. kadabba, a different situation is seen in Ar. ramidus canines that are described as smaller and diamond-shaped than those typical of Pan (White et al., 1994; Suwa et al., 2009). A. anamensis canines are as large as those of A. afarensis, and are also characterized by quite robust roots. In A. anamensis, the ratio between the largest and the smallest tooth specimens is comparable to that of Gorilla, showing that canine reduction is not a feature shared to the same extent by all hominins (Leakey et al., 1995; Plavcan, 2001). With this regard, A. anamensis dental remains are providing an interesting possibility to study a great range of variability in canine size and dimorphism among early hominins than has previously thought (Plavcan and van Schaik, 1997a). Since its first description, Ar. ramidus has been claimed to lie at the base of the hominin radiation (White et al., 1994). If the common ancestor of Pan and Homo predates Ardipithecus by a relatively short time, this suggests either that canine reduction happened rapidly and spread among the earliest hominins, or that large canine size evolved separately or re-evolved in Pan. As noted above, Ar. ramidus lacks homing C/P 3 complex (Suwa et al., 2009), while its canine dimensions overlap those of female Pan and male bonobos. The dental record currently available for this taxon is large enough (21 individuals) to assume that individual from both sexes are represented. This means that male and female canines, were not only similar in size, but that the male canine had been dramatically feminized in shape. Metrically, the canine is the most dimorphic tooth in modern humans. Mean basal crown diameter of human male canines is about 4% to 9% larger than that in females. Evidence from Ar. ramidus for the same tooth indicates that it was probably
13 13 only marginally more dimorphic than seen in modern humans, with a probable range of dimorphism in canine mean crown diameter of 10% to 15% (Suwa et al., 2009). The analysis by Suwa and co-workers (2009) shows that upper canines of Ar. ramidus were relatively small in both sexes. Particularly, male upper canine height of Ar. ramidus is estimated to be close to that of female P. paniscus and Brachyteles and to be much lower than that of male P. paniscus (which has the least projecting male canine among extant Catarrhines). This evidence leads to the hypothesis that the last common ancestor of African apes and hominins was characterized by a relatively low level of canine, postcanine, and body size dimorphism and that an evolutionary process of male canine reduction was already started at least 6 Ma, and that it continued into the Pliocene (Suwa et al., 2009). As mentioned before about the results scattered from the analysis run by Lee (2005), the A. afarensis Hadar sample shows a degree of sexual dimorphism in mandibular canines similar to Pan, significantly lower than Gorilla, and significantly higher than Homo. Reduced canine size dimorphism in A. afarensis suggests that malemale competition in these species was reduced; conversely, the high degree of skeletal size dimorphism implies that it was not (Plavcan and van Schaik, 1997; Plavcan, 2001). In fact, high levels of skeletal size dimorphism in A. afarensis contrast strikingly with the relatively modest amount of canine sexual dimorphism which was inferred from the coefficient of variation (Kimbel et al., 1985; Leutenegger and Shell, 1987; Kimbel and White, 1988; Kimbel and Delezene, 2009). The coefficient of variation of extant anthropoid canine diameters is strongly correlated with the sexual dimorphism index assessed as the "mean male / mean female" ratio (Fleagle et al., 1980; Kay, 1982; Smith, 1999). Accordingly, the level of dimorphism recorded for the A. afarensis canines is lower than those of Gorilla, Pongo, and P. troglodytes, but similar to that of P. paniscus (Leutenegger and Shell, 1987). However, since the analysis run by Leutenegger and Shell (1987), the fossil record of A. afarensis has been increased, in particular for the canine tooth, and, with the only exception of the mesiodistal diameter of the lower canine, the coefficient of variation estimated for the currently available sample is lower than those reported for P. paniscus (Kimbel and Delezene, 2009). According to McHenry (1992, 1994a, b), contrary to the evidence from the canine teeth, sexual dimorphism in hominin body mass was quite marked, comparable at least to that of Pan in P. robustus, and even close to the Gorilla's range in P. boisei
14 14 (Plavcan and van Schaik, 1997a). So, while small canines and a slim canine dimorphism point to a weak male-male competition, marked body mass dimorphism apparently suggests intensive intrasexual competition (Plavcan and van Schaik, 1997a). However, it might also be that a large male size among some hominin taxa has been maintained for some other purposes then sexual selection by competition. 1.2 ESTIMATION OF SEXUAL DIMORPHISM IN FOSSIL PRIMATE TAXA A number of methods have been elaborated in order to assess the degree of sexual dimorphism (SD) in extinct taxa on which, by definition, sex attribution is not always reliable, or even possible, notably in the case of poorly preserved specimens and small samples. In principle, as SD increases in combined sex samples, variability also increases as a function of the separation between male and female means (Plavcan, 1994). The division of a sample into two hypothetical male and female subsamples by using either the mean or the median of the whole sample is not often used, but it represents the simplest way of estimating the SD degree in a fossil sample (Godfrey et al., 1993). In the literature, the following methodological approaches have been used to estimate the SD in fossil samples: 1. extrapolation of SD from coefficients of variation (C.V.) (Fleagle et al., 1980; Kay, 1982); 2. method of moments (Josephson et al., 1996); 3. median method (Godfrey et al., 1993; Plavcan, 1994), 4. means method (Godfrey et al., 1993; Plavcan, 1994), 5. Finite Mixture Analysis (FMA) (Godfrey et al., 1993; Plavcan, 1994), 6. binomial dimorphism index method (Lovejoy et al., 1989; Reno et al., 2003), 7. assigned resampling method (Lee, 2001, 2005), 8. bootstraping method (Efron, 1979; Efron and Tibshirani, 1993). COEFFICIENT OF VARIATION METHOD This method has been applied to fossil anthropoids (Fleagle et al., 1980) and hominoids (Kay, 1982). These studies report that C.Vs from pooled-sex samples are very highly correlated with SD as measured by a ratio of male to female means.
15 15 However, this approach has been criticized based on the ground that, for several extant anthropoid taxa, C.Vs of dental dimensions in combined sex samples are not necessarily higher than those of single sex samples (Plavcan, 1994). The variation in sex ratio and intrasexual variability produced differences in the relation between the C.V. and dimorphism. Extrapolation of SD from C.Vs obviously depends on the degree of intrasexual variability and the exact sex ratio of the sample. With increased intrasexual variability, the C.V. method also consistently overestimates SD at all levels, as result of its sensitivity to departures from a balanced sex ratio and increasing intrasexual variability (Plavcan, 1994). Nonetheless, this method is the only one that needs extant species as analogs to estimate SD in extinct taxa (Kościński and Pietraszewski, 2004). The equation used is as follows: Y = * X; where Y is SD and X is the combined-sex C.V. (Plavcan, 1994). Accordingly, SexDim = Exp( CV 0.047), which is expressed as percentage (Kościński and Pietraszewski, 2004). Since most fossil primate remains are represented by teeth, this analysis has used the average variability of the postcanine teeth, which corresponds to a C.V. or roughly 5.5. Using. (Plavcan, 1994). Details about this method are provided by Fleagle et al. (1980), Kay (1982), and Kościński and Pietraszewski (2004). METHOD OF MOMENTS Another method, called of moments, was introduced by Josephson and coworkers (1996). This approach is quite straightforward and the technique is that of finite mixture analysis (Rehg and Leigh, 1999). It estimates the theoretical underlying male and female distributions from a combined - (pooled) sample based on observations in that sample. The theoretical moments are estimated from these data, and the level of SD is calculated based on the means of the theoretical - distributions. (Josephson et al., 1996; Rehg and Leigh, 1999). The method of moments provides conservative estimates of SD, improving on estimation capabilities of other methods and, as a whole, it does not really provide advantages in assessing dimorphism. In addition, the means method seems to be at least slightly more accurate and consistent than other methods (Rehg and Leigh, 1999). The
16 16 procedures of this method are fully described by Josephson et al. (1996) and Kościński and Pietraszewski (2004). MEDIAN METHOD The simplest way to infer the SD from mixed sex samples is the median method. The median is calculated for the combined sex then the sample is splitted at this value into a set of values greater and a set lower than the median, respectively (Godfrey et al., 1993; Plavcan, 1994; Josephson et al., 1996; Rehg and Leigh, 1999). For primates and most mammals, the greater than set presumably represents males, while the lesserthan set represents females (Rehg and Leigh, 1999). Then, the ratio of the two newlycreated subsamples is used to assess the SD. However, as pointed out, some studies show that this method is less reliable than the means method (Plavcan, 1994; see also Godfrey et al., 1993; Kościński and Pietraszewski, 2004). MEANS METHOD The procedure of the means method is similar to the previously described median method, except that here a total sample is divided into two groups with respect to the mean value, and the ratio of the higher to lower new means is assumed to represent the [Mean ] [Mean ] ratio (Smith, 1999; Ruff, 2010). Both means and median methods assume that male and female distributions do not overlap a situation that occurs very rarely, only when SD is extreme. So, fundamental criticism may be addressed to these techniques for arbitrarily creating male and female means, thereby creating the impression of sexual dimorphism even when an only modest one may occur. These methods are comparatively reliable but, like other methods, are influenced by sex ratio and intrasexual variation (Plavcan, 1994; Rehg and Leigh, 1999). At low levels of real SD, the means method tends to overestimate dimorphism slightly more than the other methods mentioned above, and it could be used as a reasonable tool for estimating the upper limits of SD of the investigated population sample. While not free from problems, it has been found to provide reasonable estimates of sexual dimorphism in some modern primate samples of known sex, especially where dimorphism is from moderate to high ([Mean ] [Mean ] ratio of about ) (Plavcan, 1994; Rehg and Leigh, 1999; Smith, 1999; Ruff, 2010). In similar cases, the
17 17 means method has the potential to produce more accurate results than other statistical approaches (Godfrey et al., 1993; Plavcan, 1994; Rehg and Leigh, 1999; Ruff, 2010). FINITE MIXTURE ANALYSIS The biological question underlying the finite mixture analysis method is: how much size dimorphism can be hidden within a single univariate distribution? Unlike other techniques, this method is designed to demonstrate either the lack of dimorphism in a sample, or its opposite condition (highest SD). When intrasexual variability is high, the FMA method overestimates low levels of dimorphism at a lesser extent than other approaches (Godfrey et al., 1993; Plavcan, 1994). An analysis run by Plavcan (1994) showed that FMA is of only modest value for estimating SD in fossil samples. This method is potentially useful under the circumstances for which it was originally designed for, i.e.: estimating the maximum dimorphism that could be present in a unimodally distributed population. Among the primate taxa, the teeth typically show relatively low variability and it must be kept in mind that the FMA method can potentially underestimate, rather than overestimate, dimorphism. Since intrasexual variability cannot be known where the sex of individuals cannot be reliably determined, this technique should not be used alone (Plavcan, 1994). BINOMIAL DIMORPHISM INDEX METHOD The binomial dimorphism method was originally proposed by Lovejoy et al. (1989) as a general approach to the study of SD and later used to specifically assess its extent in A. afarensis body size (Reno et al., 2003). This method requires a number of assumptions: a) both and are included in the investigated sample; b) any specimen has an equal a priori probability of being or ; c) when two specimens have different sex indicators, then the larger is male (cf. Kościński and Pietraszewski, 2004). The results of the study run on A. afarensis (Reno et al., 2003) show that this method is reliable when compared to other approaches and suggest that A. afarensis body size SD was closer to that of Homo sapiens then previously assumed. ASSIGNED RESAMPLING METHOD The assigned resampling method is another technique for estimating the SD degree in a fossil sample (individuals of unknown sex), notably in the case of hominin taxa. It was first proposed by Lee (2001) and designed according to the numerous
18 18 repeated drawings and placements of element pairs of a given sample and using mean of their ratios as an estimate of sexual dimorphism. This method is the only one that possesses no a priori assumptions on a distribution type, sample sex ratio, or intra-sex variation. The assigned resampling method has been firstly was used to analyze extant human and African ape samples composed of individuals of known sex (Lee, 2001), then tested on the A. afarensis sample from Hadar, Ethiopia (Lee, 2005). In the first case, SD was estimated according to a methodological blind test and the results compared to the observed SD directly measured on the sex-related sub-samples. Its application to the Hadar fossil sample suggests that A. afarensis SD pattern differed from the conditions reported for both extant humans and African apes. BOOTSTRAPING METHOD The other resampling method which calculates standards errors is called bootstrapping (or bootstrap) method (Efron, 1979; Efron and Tibshirani, 1993). This method has been mainly run on random simulations of extant taxa samples, but also tested on fossil hominin samples of comparative size (Lockwood et al., 1996; Lorenzo, 1998; Bermǔdez de Castro et al., 2001; Suwa et al., 2009). CONCLUSIVE REMARKS Taking into account the intrinsic advantages and disadvantages related to the use of each among the methods summarized above, it is clear that the nature itself of the investigated samples and the peculiar structure of each datasets under analysis play a major role in the choice of any analytical approach, and that there is no one-way solution in assessing SD in fossil taxa. Of course, some statistical methods apparently provide more reliable (or less weak, at least) results when small samples are concerned, while others are more prone to overestimate or underestimate the degree of dimorphism as represented within pooled samples indistinct for sex composition. In principle, the means method likely represents one of the most reliable techniques to assess SD from pooled-sex datasets, but it should be also noted that none among the above described analytical approaches really provides reliable estimates when the degree of dimorphism characterizing the investigated sample is low (Plavcan, 1994).
19 19 2. MATERIALS For the purposes of the present study, in order to tentatively assess the degree of dental sexual dimorphism in a number of fossil hominins (see below) starting from the basic descriptive statistics (mean and standard deviation) published for the mesiodistal (MD) and the buccolingual (BL) crown diameters of the permanent upper and lower teeth, as reference models we used the patterns known for the extant humans and the African apes (Pan and Gorilla), as well as the estimates assessed for the Miocene hominid taxon Ouranopithecus macedoniensis, well-known because of its degree of dimorphism (see Table 2. Suppl. Info.). The teeth considered in the present analysis include all permanent maxillary and mandibular crowns from the central incisor to the second molar, with the only exclusion of the third molar (too much variable). The reference dataset used to characterize the human condition (modern African sample) is from Kieser (1990); those for the African apes G. gorilla, P. troglodytes and P. paniscus are from Swindler (2002). In all cases, we used the descriptive statistics distinctly reported for each sex, and had no access to individual raw data. With special reference to the metric data derived from Swindler (2002), as two BL crown diameters (anterior and posterior) are systematically provided for the molars, we systematically used the greatest value (which is usually the posterior one). The male and female MD and BL mean diameters estimated for O. macedoniensis have been derived from the original descriptions provided by Koufos (1993, 1995) and Koufos and de Bonis (2006). The fossil hominin taxa considered in our comparative analysis include: Sahelanthropus tchadensis (data from Brunet et al., 2002, 2005); Orrorin tugenensis (data from Senut et al., 2001); Ardipithecus kadabba (data from Haile-Selassie et al., 2009); Ardipithecus ramidus (data from Suwa et al., 2009); Australopithecus anamensis (data from Ward et al., 2001; White et al., 2006); Australopithecus afarensis (data from Kimbel et al., 2004; Kimbel and Delezene, 2009); Australopithecus africanus (Moggi- Cecchi et al., 2005; Kimbel and Delezene, 2009); Australopithecus sediba (data from Berger et al., 2010); Paranthropus robustus (data from Kimbel and Delezene, 2009). The values of the upper and lower canines and third premolar of Ar. ramidus and Ar. kadabba have not been integrated in the comparative analysis as Suwa et al. (2009) and Haile-Selassie et al. (2009) used different and hardly comparable measurement techniques (see Table 1. Suppl. Info.). Also, even if available in the original paper, we

20 20 did not use the estimates of the coefficient of variation (C.V.) provided by Suwa et al. (2009) for some Ar. ramidus teeth, as they were based on two individuals only. Here below we present a short general account describing the fossil taxa concerned by our study. Ouranopithecus macedoniensis The Late Miocene hominid Ouranopithecus macedoniensis was first discovered in 1973 in the valley of the Axios River, in Macedonia, Greece (de Bonis et al., 1974). The three localities where O. macedoniensis fossils were unearthed (the valley of the Axios River, Xirochori, and Ravin de la Pluie), have provided an age of ~ Ma (de Bonis and Koufos, 1999) by palaeomagnetic reversal stratigraphy (Sen et al., 2000) and a slightly younger age of ~ Ma according to the faunal assemblage from Nikiti (Koufos, 2000). The collected fauna, pointing to an open environment, mostly consists of equids, rhinos, suids, bovids and giraffids, with a particular small presence of carnivores (de Bonis and Koufos, 1999; Koufos, 2000). FIGURE 1.1. Ouranopzthecus rnacedoniensis, Ravin de la Pluie, RP1, Macedonia, Greece. Mandible RP1-54, holotype. x 1. O. macedoniensis remains are exclusively known from cranio-dental remains, in particular from specimens representing the lower jaw, and, mostly, from a large sample of isolated permanent teeth (de Bonis et al., 1975, 1990, 1998; de Bonis & Koufos, 1993; Koufos, 1993, 1995; Koufos & de Bonis, 2006). The mandibular remains of a young individual from the ca. 9.3 Ma site of Ravin de la Pluie, bearing a partial mixed dentition, have been discovered for the first time in 2001 and reported in 2004 (Koufos & de Bonis, 2004; Macchiarelli et al., 2009). The type specimen of O. macedoniensis is
21 21 a mandible RP1-54 (Fig. 1.1) found at Ravin de la Pluie and described in 1993 (Koufos, 1993). As a whole, the O. macedoniensis sample is quite rich and extensively reported for both sex-related size and morphological dental variation (rev. in Koufos and de Bonis, 2005) and, for the purposes of the present comparative analysis, it can be used as an outgroup representative of the fossil hominid clade and compared to the evidence from the extant hominids Gorilla, Pan, and Homo. Sahelanthropus tchadensis Sahelanthropus tchadensis is reported in the primate fossil record as likely being the earliest hominin discovered so far. The taxonomic name comes from Sahel, the region of Africa bordering the southern Sahara, in which the fossils were found. Remains of S. tchadensis were discovered in Nothern Chad in 2001 by the French team M.P.F.T. (Mission PaléoAnthropologique Franco Tchadienne). The holotype, the nearly complete cranium TM , was found in the Toros-Menalla locality (TM 266) together with the paratypes, mostly represented by uncomplete cranio-dental remains and some isolated teeth (Fig. 1.2 Suppl. Info.). The specimen TM was nick-named Toumaï, which means in the local Goran language hope of life (Brunet et al., 2002). Geological and palaeontological (biochronological correlations) studies run at Toros-Menalla locality (TM 266) have given and age between 6 and 7 Mya (Upper Miocene). The rich fauna from TM 266 includes significant aquatic components, like fishes, crocodiles, and amphibious mammals, but also primates, rodents, elephants, equids, and bovids. Vertebrate faunal assemblage suggests that S. tchadensis lived in a mosaic of environments, ranging from gallery forest at the edge of a lake shore to savannahh and grassland (Vignaud et al., 2002). Further on, the absolute dating approach to the hominin bearing sites in Chad by cosmogenic nuclide 10 Be/ 9 Be dating method has confirmed the previous biochronologial date of ~7, as the two overlying and underlying levels bracketing the S. tchadensis cranium have been constrained within the interval Ma (Lebatard et al., 2008). Currently, the fossil remains of S. tchadensis belong to a minimun of six (a maximun of nine) individuals from three fossil bearing sites: TM 247, TM 266 and TM 292 (Anthracotheriid Unit) likely of similar age (Brunet et al., 2005; Vignaud et al., 2002).
22 22 The preservation quality of the fossils is relatively good, even if almost the entire cranium has been flattened and shows a depressed right side. It also exhibits broken but undistorted bone units and matrix-filled cracks (Brunet et. al., 2002). The cranium had a brain size between cm 3. Its three-dimensional reconstruction supports the hominin status of S. tchadensis and the possibility that it was a biped, an important feature of Pliocene hominins and, possibly, several Late Miocene hominids (Zollikofer et al., 2005). A comparative analysis of the reconstructed cranium of S. tchadensis was made by Guy F. et al. (2005) with crania of African apes, modern humans and several Pliocene hominins. The results support the hypothesis that S. tchadensis cranium TM belongs to a hominin, and also proves that this fossil shows a unique mosaic of characters. In fact, S. tchadensis shares many primitive features with chimpanzee, but also some derived character with Australopithecus, particularly in the basicranium. Nevertheless, only additional investigation will permit to determine with greater accuracy the evolutionary relationships between S. tchadensis and the Miocene and Pliocene hominins discovered so far (Guy et al., 2005). However, there is a discussion in the literature about whether S. tchadensis was a real bipedal hominin (Brunet et al., 2002, 2005; Wood, 2002; Guy et al., 2005; Zollikofer et al., 2005; White, 2006), or rather possessed non-hominin features more closely related to the evolutionary lineage of the great apes (Senut et al., 2001; Pickford et al., 2002; Wolpoff et al., 2002, 2006). With respect to the dentition, this taxon is characterized by: relatively small incisors; small (presumed male) upper canines longer mesiodistally than buccolingually; upper and lower canines with apical wear; absence of lower C/P 3 diastema; relatively small posterior teeth; enamel thickness of cheek teeth intermediate between Pan and Australopithecus (Brunet et al., 2002). Orrorin tugenensis In 1975 issue of the journal Nature, at the time the earliest possible African hominin, represented by an isolated molar found in Kenya, was reported (Pickford, 1975). Years later, this discovery was followed by additional fossil material from comparable levels at Lukeino, in the Tugen Hills region (Senut et al., 2001). All the old a new hominin fossil material has been referred to the new taxon Orrorin tugenensis, the genus having been named from the local Tugen language, which means original
23 23 man, and the specific name from that of the Tugen Hills, where the materials have been collected (Senut et al., 2001). The late Miocene Lukeino Formation is a mostly fluviolacustrine sedimentary sequence overlying a weathered volcanic surface dated to 6.2 Ma (Pickford and Senut, 2001). More precisely, absolute dating methods, such as K/Ar dating (Sawada et al., 2002), in association with 40 Ar/ 39 Ar (Deino et al., 2002) show that the Lukeino volcanic layers that bared O. tugenensis remains are of ~6 Ma. The associated fauna is also consistent with an age close to, or slightly younger of 6 Ma (in Schwartz and Tattersall, 2005). Geological studies suggest an open woodland environment with abundance of trees near a lake margin. These data are supported by the analysis of the faunal assemblage from Lukeino, rich in ruminants and proboscideans, but also including few specimens of colobine monkeys (Pickford and Senut, 2001). The fossil collection of O. tugenensis, including cranial, dental, and postcranial material, currently represents at least five individual, the holotype referring to three partial mandibles: BAR 1000_00, BAR 1000a_00, and BAR 1000b_00 (Fig. 1.3 Suppl. Info.) (Senut et al., 2001). According to the discoverers (Senut et al., 2001; Pickford et al., 2002), the partial femoral shafts show unequivocal bipedal features, whereas the elements from the upper limbs and the manual phalanx morphology suggest an arboreal adaptation. Because of its unique characters combination, O. tugeniensis is sometimes interpreted as ancestral to the Homo lineage, with relatively thicker enamel and ape-like premolars, putting aside Ardipithecus and Australopithecus from the human phylogenetic branch (in Schwartz and Tattersall, 2005). Ardipithecus kadabba Ardipithecus kadabba is a Late Miocene hominin discovered in 1997 in the Middle Awash area, Ethiopia, within the framework of the Middle Awash Research Project, and firstly described four years later (Haile-Selassie, 2001). The name comes from the local Afar language, which means "basal family ancestor". Absolute dating of the Ar. kadabba bearing locality (Alayla Vertebrate Paleontology Locality 2) have given an age of ~ The geological study points to a relatively wet and wooded environment, modulated by tectonic, volcanic, climatic and geomorphic processes (Haile-Selassie, 2001; WoldeGabriel, 2001). The fossil assemblages consist of large land mammals and some representatives of aquatic
24 24 vertebrates. Artiodactyls are the most abundant large mammals (Haile-Selassie and WoldeGabriel, 2009). The fossil collection of Ar. kadabba mostly consists of cranio-dental and some postcranial fragments (Fig. 1.4 Suppl. Info.). Holotype of Ar. kadabba is a right mandible, ALA-VP-2/10, with associated teeth (Fig. 1.4a Suppl. Info.). Because of the influence of various taphonomic factors, preservation of the fossils is relatively scanty. However, isolated teeth, a partial mandible, hand and foot phalanges (quite well preserved), a humerus, an ulna and some clavicle fragments have been collected. Even if fragmentary, the presence of various postcranial remains of Ar. kadabba allows the tentative reconstruction of its locomotion pattern. According to the morphology of the left fourth proximal foot phalanx (Latimer and Lovejoy, 1990), Ar. kadabba is interpreted as a bipedal hominin (Haile-Selassie, Suwa and White, 2009). Dental characters of this late Miocene hominin show a mosaic of primitive and derived morphological traits exclusively shared with later hominins. To some extent, this seems also the case for some features of the postcranial skeleton, notably the proximal foot phalanx, which would indicate an early form of terrestrial bipedality. As a whole, the combination of the dental and postcranial features suggest that Ar. kadabba represents a primitive hominin taxon that postdated the divergence of lineages leading to modern chimpanzees and humans (Haile-Selassie, 2001). Ardipithecus ramidus Field work in the Afar Depression of Ethiopia, particularly within the Middle Awash study area, has yield a number of hominin taxa chronologically spanning from the Late Miocene to Pleistocene (~ Ma). One of them is a Pliocene hominin named Ardipithecus ramidus (from Ardi, i.e. "ground/floor" and ramid, i.e. "root"). It was discovered in 1993 at Aramis locality and reported in 1994 (White et al., 1994). Holotype of Ar. ramidus is the specimen ARA-VP-6/1 (Fig. 1.5), an associated set of teeth from one individual that includes: upper left I 1, C -, P 3, P 4, right I 1, C - (broken), P 4, M 2 ; and lower right P 3 and P 4.

25 25 FIGURE 1.5a + b, Holotype specimen, AKA-VP-6/1 upper and lower dentition from a single individual (after White, Suwa and Asfaw, 1994) and b, Discovery channel The exposed outcrops bearing remains of Ar. ramidus, north and west of the Awash area, are from a complex of riverine and lacustrine sediments deposited between ~5.5 and 3.8 Ma (WoldeGabriel et al., 2009). More precisely, the layers sandwiching Ar. ramidus were dated to ~4.4 Ma. Fossilized wood, seeds, phytoliths indicate that Ar. ramidus did not live in the open savannah, i.e., in the environment predicted to be the predominant habitat of earliest hominins, but rather in a mosaic environment, more humid and cooler than it is today, ranging from woodland to forest patches (WoldeGabriel et al., 2009). Faunal assemblage of Aramis locality at 4.4 Ma reveals a significant presence of colobine monkeys (nowadays living in arboreal habitats), making up almost a third of the entire large mammal collection. Spiral-horned antelope, Tragelaphus (the leaf-eater kudu) is another large mammal widely represented within the faunal assemblage associated to Ar. ramidus. Conversely, grazing antelopes, usually exploiting more opened, grassy environments, are rare in the Aramis fossil collection. This evidence is consistent with the geological and palaeobotanical record pointing to a rather wooded local environment during the early Pliocene (White et al., As it bears the smallest canines of the entire Ar. ramidus dental collection, the partial skeleton of ARA-VP-6/500, nicknamed "Ardi" (Fig. 1.6 Suppl. Info.) represents a female (White et al., 2009a). Reconstruction of Ardi pelvis, as well as its hand and foot morphology, show a unique form of bipedal-like locomotion, with grasping lower limbs just like in chimpanzees, but with no evidence of knuckle-walking anatomy (Lovejoy, 2009; Lovejoy et al., 2009a, b, c; White et al. 2009a).

26 26 Australopithecus anamensis The taxon Australopithecus anamensis, created by Leakey et al. (1995), currently represents the earliest member of the australopithecines. As indicated by its specific name anam, which in Turkana language means lake, A. anamensis remains come from the lacustrine sediments of the ancient lake Lonyumun, in northern Kenya, near the present Lake Turkana (ex Rudolf). So far, 47 specimens of this hominin taxon have been collected from the locality of Kanapoi and 31 from Allia-Bay (Ward et al., 2001) Most of them consist of isolated teeth or mandibular and maxillary fragments. The type specimen is a complete mandible KNM-KP (Fig. 1.7). However, A. anamensis is also known from two localities in the Afar Depression of Ethiopia: Asa Issie (~4.1 Ma) (White et al., 2006), and Woranso-Mille (~3,7 Ma) (Haile-Selassie et al., 2010). FIGURE 1.7 Australopithecus anamensis holotype mandible KNM-KP in occlusal (upper left), right lateral (upper right), medial (middle right), temporal (lower left) and lateral (lower right) views. Note that midline cross-section of the symphysis has been superimposed on the medial view. Scale bars are in cm (after Leakey et al., 1995). Both Allia-Bay (~3.9 Ma) and Kanapoi (~ 4.1 Ma) localities have been dated by 40 Ar/ 39 Ar (Leakey et al., 1995, 1998). Palaeoenvironmental data (Ward et al., 2001) indicate a woodland environment with open bushland and grassland, rich in water
27 27 sources, an habitat similar to that of Hadar, in Ethiopia, and Laetoli, in Tanzania (Reed, 1997) but different from the closed woodland habitats associated to Ar. ramidus (Wolde-Gabriel et al., 1994). Faunal associations at Asa Issie were closely and regularly related to a narrow range of habitats varying from closed to grassy woodlands. At Woranso-Mille, as shown by the presence of several species of cercopithecids, the environment was mostly that of a riverine gallery forest extending to closed/open woodland and grassland. However, additional studies are in progress in order to explain the nature of the differences among the faunal assemblages associated to A. anamensis characterizing the sites of Woranso-Mille, Laetoli, Kanapoi, and Allia Bay (Ward et al., 2001; White et al., 2006; Haile-Selassie et al., 2010). Based on its cranio-dental morphology, A. anamensis is more primitive than A. afarensis and probably ancestral to the latter (Leakey et al., 1995, 1998; Ward et al., 2001; Schwartz and Tattersall, 2005). The Asa Issie fossil remains, from Ethiopia, are among the oldest attributed to A. anamensis (~4.1 Ma) and, with respect to the record from Kanapoi, extend the known range of this taxon by 1,000 km to the North-East (White et al., 2006). Slightly younger deposits of Woranso-Mille locality (~3,5-3,8 Ma), again in Ethiopia, yielded fossils that are morphologically intermediate between A. anamensis and A. afarensis. Based on recent analyses, A. anamensis from Kanapoi, Allia Bay, and Asa Issie are primitive to the A. afarensis from Hadar, while the samples from Laetoli and Woranso-Mille show a mosaic of morphological traits from both ends (Haile-Selassie et al., 2010). Australopithecus afarensis Australopithecus afarensis is know from fossil remains originally discovered in Laetoli, Tanzania, and Hadar, Ethiopia. The holotype, the LH 4 mandible (Fig. 1.8), comes from Laetoli, while the etymology of the taxon refers to the Afar region where the famous partial skeleton A.L , "Lucy" was later discovered. Currently this taxon has been spotted at many localities, including Belohdelie (~3.85 Ma; Clark et al., 1984; Asfaw, 1987; Renne et al., 1999), Maka (~3.4 Ma; White et al., 1993; Renne et al., 1999; White et al., 2000), Garusi (~3.5 Ma; White, 1977; Johanson and White, 1979; Drake and Curtis, 1987; Hay, 1987), Dikika (~3.3 Ma; Alemseged et al., 2005, 2006), Hadar (~3.2 Ma; Johanson and White, 1979; Johanson et al., 1982; Walter and Aronson, 1982, 1993; Walter, 1993; Kimbel et al., 1994, 2004; Kimbel and Delezene, 2009).
.")

28 28 Most fossil bearing localities having provided remains attributed to A. afarensis consist of fluviolacustrine deposits. Palaeoecology for this taxon primarily corresponds to a mosaic of wooded wet habitat surrounded by a more opened, watered savannah-like landscape (Reed 1997, 2008; Kimbel and Delezene, 2009). FIGURE 1.8 LH4 Mandible occlusal & left lateral views. Scale = 1 cm (after Schwartz and Tattersall, 2005). So far, around 400 odontoskeletal specimens have been attributed to A. afarensis, which makes this taxon the most abundant in the nonhuman hominin fossil record. About 40 years after its first discovery, many aspects concerning the locomotion pattern, the degree of sexual dimorphism, the social structure and behavior, and the diet/food strategies of this taxon are still debated (a detailed review has been recently provided by Kimbel and Delezene, 2009). Also, because of its wide variation range, another matter of discussion concerns the possibility that more than one species is represented in the currently available record (Schwartz and Tattersall, 2005). Australopithecus africanus Australopithecus africanus is the firstly discovered representative of the genus Australopithecus, originally named by Dart in 1925 following the recovery of fossil material in Taung locality, South Africa. This species is known from a number of additional localities, including Sterkfontein, Makapansgat, Gladysvale, which are mostly cave sites. According to faunal correlations, the age of the Taung spot was estimated to ~ Ma (McKee et al., 1995), where the Sterkfontein materials from Member 2 are older, around ~ 3,5 Ma (Partridge et al., 2003).
. The holotype of A.")

29 29 FIGURE 1.9 Taung 1 (after Dart, 1925) & right lateral view. Scale = 1 cm (after Schwartz and Tattersall, 2005). A. africanus is epresented by a quite rich collection of cranial, dental, and postcranial remains (Moggi-Cecchi et al., 1998, 2005). The holotype of A. africanus is the skull with endocast of the famous 3-4 years old child from Taung (in Bromage, 1985) (Fig. 1.9), with cranial capacity of 440 cm 3 (Holloway, 2000). Postcranial evidence clearly shows that the locomotion pattern of A. africanus included bipedality. Also, the dental record point to a relatively wide range of size and morphological variation for this taxon (Wolpoff, 2002; Schwartz and Tattersall, 2005). Accordingly, similarly to A. afarensis, a specific debate concerns the possibility that A. africanus subsumes two or more taxa, as well as the extent of its dimorphic pattern (McHenry, 1994, 1998; Wolpoff, 2002). Finally, it should be stated that A. africanus is listed among the possible candidates as direct ancestor of the human linage (Schwartz and Tattersall, 2005). Australopithecus sediba This taxon, represented by a collection of well-preserved fossil remains from the Malapa site, in South Africa, is the lastly announced member of the australopithecines (Berger et. al., 2010). Its etymology, which means wellspring, derives from the local Sotho language. The chronological age of Australopithecus sediba is constrained between 1.95 to 1.78 million years (Dirks et. al., 2010). The currently available record consists of two partial skeletons, MH1 and MH2, respectively assigned to the male and female sex, and
.")

30 30 associated craniodental remains. The holotype is MH1 (Fig. 2.0 Suppl. Info.), a juvenile individual including a partial cranium, a fragmented mandible, and a variety of postcranial elements. A preliminary comparative analysis suggests that A. sediba more likely derived from A. africanus and that it possesses a relevant number of features shared with Homo (Berger et. al., 2010). Paranthropus robustus The taxon Paranthropus robustus was first discovered and named by R Broom in 1938, following his research work at Kromdraai, South Africa. Additional odontoskeletal material, allocated to P. robustus, including cranial, dental, and also some postcranial remains pointing to an upright posture and bipedal walking, comes from the sites of Swartkrans, Drimolen, Gondolin, Coopers. The chronological age of this species ranges between ~2.0 (or even earlier) and >1.0 Ma (Vrba, 1982; Brain, 1993; McKee et al., 1995; Grine, 2000). The type specimen of P. robustus is represented by the partial cranium with mandibular corpus TNI1517a and b, from Kromdraai (Fig. 2.1). Among the features characterizing this taxon, a sagittal crest and an endocranial volume varying from 410 to 530 cm 3 (Holloway, 1988). FIGURE 2.1 TM 1517a, partial cranium and TM 1517b, partial right mandibular corpus. Scale = 1 cm (after Schwartz and Tattersall, 2005). As suggested by the record from the Cooper s cave, the dietary adaptation of P. robustus seems to reflect a grassland habitat, with nearby woodlands and permanent water sources (Ruiter et al., 2009). With this respect, it has been suggested that P.
31 31 robustus was a rather dietary generalists (Sillen, 1992; Lee-Thorpe van der Merwe and Brain, 1994; Wood and Strait, 2004). Nonetheless, some studies suggest a diet primarily characterized by hard items, such as nuts, root and seed (Scott et al., 2005). In a palaeobiogeographic perspective, an additional matter of discussion concerns the possible phylogenetic and evolutionary relationships between P. robustus and A. boisei (Schwartz and Tattersall, 2005). In the text, tables, and figures, taxa abbreviations are as follows: H. sapiens: Hs, HsM (males), HsF (females); G. gorilla: Gg, GgM (males), GgF (females); P. troglodytes: Pt, PtM (males), PtF (females); P. paniscus: Pp, PpM (males), PpF (females); O. macedoniensis: Om, OmM (males), OmF (females); S. tchadensis: St (no sex-related estimates available); O. tugenensis: Ot (no sex-related estimates available); Ar. kadabba: Ak no sex-related estimates available); Ar. ramidus: Ar, ArM (males), ArF (females); A. anamensis: An, AnM (males), AnF (females); A. afarensis: Afa, AfaM (males), AfaF (females); A. africanus: Afr, AfrM (males), AfrF (females); A. sediba: As, AsM (males), AsF (females); P. robustus: Pr, PrM (males), PrF (females). 3. METHODS OF ANALYSIS As discussed in the section concerning the assessment of the degree of dimensional sexual dimorphism in extant and extinct primates taxa, a number of methodological approaches have been developed, notably in the case of small samples (Efron, 1979; Johanson and White, 1979; Fleagle et al., 1980; Kay, 1982; Kimbel and White, 1988; Lovejoy et al., 1989; Efron and Tibshirani, 1993; Plavcan, 1994; Josephson et al., 1996; Lockwood et al., 1996; Arsuaga et al., 1997; Lorenzo, 1998; Bermǔdez de Castro et al., 2001; Lee, 2001; 2005; Reno et al., 2003; Suwa et al., 2009; Ruff, 2010).
32 32 Based on the fact that, as sexual dimorphism increases, combined sex sample variability increases as a function of the separation between male and female means (Plavcan, 1994), the division of a sample into two hypothetical male and female representative subsamples with respect to either the mean or median of the original whole sample (e.g., Godfrey et al., 1993) is not often used, but likely represents the simplest way of estimating dimorphism in a fossil sample. However, the problem of over- and underestimation of the male and female estimates, respectively, exists. As detailed within the section "Materials", in order to estimate the degree of dental sexual dimorphism in fossil hominins (MD and BL crown diameters of the permanent upper and lower teeth from I1 to M2), as reference models we used the variation patterns reported for the extant humans (data from and Kieser, 1990), the African apes Pan and Gorilla (data from Swindler, 2002), and the estimates available for the Miocene Ouranopithecus macedoniensis (data from Koufos, 1993, 1995; Koufos and de Bonis, 2006). Together with the figures available for the same variables for the fossil hominin taxa under investigation, the data representing Homo, Pan, Gorilla, and O. macedoniensis (pooled sexes) have been comparatively summarized into a number of BiVariate plots (see FIGURES Suppl. Info.). Starting from the known distributions by sex ("observed" for Homo, Pan, and Gorilla and "estimated" for O. macedoniensis), for each taxon and distinctly for each tooth crown and diameter, we obtained the respective descriptive statistics (including the mean X and the standard deviation S.D.) of the pooled sample. In such a way, we had a clear appreciation - here arbitrarily termed "best fit" - of the relationships between the average of the pooled (p) sample and its variation (px 1 psd) and that representing each sex-related subsample (m, f), which is defined as follows (see Table 3. Suppl. Info.): mx = px + xs.d. ; fx = px - xs.d. By assuming that, within each taxon, the dimorphic pattern is not necessarily homogeneous between the arcades, nor along each arcade along the mesio-distal axis, in order to render as simpler as possible our estimates, and as general and reliable as possible our model, we operated a tooth-class specific choice. Accordingly, distinctly for each sex, we assessed the respective tooth-class variation pattern by means of a
33 33 unique, cumulative average estimate calculated for: all the incisors (including both I1 and I2, upper and lower), the canines (upper and lower), the premolars (both P3 and P4, upper and lower), and the molars (both M1 and M2, upper and lower). Thus, for each sex, we obtained 8 "best fit" average coefficients, 4 for the MD and 4 for the BL diameters, summarizing the whole variation range expressed by the four incisors, the two canines, the four premolars, and the four molars. In our reference sample of extant hominids, Gorilla is tangentially the most dentally dimorphic taxon, while Homo is poorly dimorphic but highly variable. For example, the "best fit" estimates in Gorilla for the MD of the male canines are as follows: mx = px + 0,8-1,2; in the females, the same values correspond to: fx = px - 0,2-0,3. For the BL of the canines, in the same taxon the values punctually correspond to 1,1 for males and to 0,8, in females, where in Homo they range between 0,3 and 0,6, in males, and between 0,4 and 0,7, in females (see "best fit" Tables 6 and 7 in 4. RESULTS AND DISCUSSION). When all the "best fit" estimates are comparatively considered in our reference sample of extant (Homo, Pan, and Gorilla) and extinct (O. macedoniensis) hominids, it appears that Gorilla is closer to the Miocene ape than to Homo, or P. paniscus, or to P. troglodytes (in the latter case, with the exception of the MD and BL of the canines). Notably, almost no difference exists for the MD of the molars between Gorilla and O. macedoniensis. Conversely, Homo is closer to P. paniscus, the latter showing in most cases an intermediate position between P. troglodytes and Homo. The only relatively marked differences between P. paniscus and Homo concern the BL diameter of the incisors and canines (see "best fit" Tables 6 and 7 in 4. RESULTS AND DISCUSSION). Following a consensual general interpretation of the primate fossil record, even if some taxonomic-related specific problems certainly exist for dental size variation, for the purposes of the present study we a priori assumed that early hominins better fit a sexual dimorphic pattern for dental crown size lower than observed in extinct (e.g., O. macedoniensis) and extant large-bodied hominids (e.g., Gorilla), but higher than that characterizing extant humans. Accordingly, based on the available evidence, as proxy for all the fossil hominins considered in the present analysis, for each tooth class and distinctly for each sex, we arbitrarily used the intermediate values between Gorilla and Homo. Distinctly for each hominin taxon, tooth-class, and crown diameter, these values, which are shown in Table 8 Proxy in 4. RESULTS AND DISCUSSION, have thus been
34 34 generated and used to tentatively predict the unknown male and female hominin means starting from the known pooled average values derived from the literature (See Table 1 Suppl. Info.). As noted above, in Table 8 Proxy only the averages between the minimum and maximum S.D. values derived from the reference samples have been used to estimate the male and female means, respectively. For example, in order to calculate the sex-related mean of the MD diameter of the canine tooth-class of any hominin taxon, the average "best fit" value of 0,7 has been added to the pooled mean to obtain the male mean, while the average "best fit" value of 0,6 has been subtracted by the same pooled mean to obtain the female mean. Similarly, for the canine BL, the same "best fit" values correspond to 0,8 for the males and to 0,7 for the females, respectively (see Table 4 for calculation process Suppl. Info.). Once estimated the male and female mean values of both crown diameters for each tooth-class in each fossil hominin taxon considered in the present study (see Tables 9 and 10 in 4. RESULTS AND DISCUSSION), the sexual dimorphism estimated ratio (S.D.E.R) has been calculated as [Mean ] [Mean ] (Plavcan, 1994; Rehg and Leigh, 1999; Smith, 1999; Ruff, 2010), and the results shown in the same Tables 9 and 10. Thus, all results have been summarized and described as BiVariate taxon-specific comparative plots for each tooth-class (See FIGURES in 4. RESULTS AND DISCUSSION). It should be noted that, in the case of the lower first and second molars (M 1 and M 2 ), the figures estimated for the recently described taxon A. sediba (Berger et al., 2010) have been calculated directly starting from the individual dental metric data which have been presented in the original publication distinctly for each sex. In this case, we have arbitrarily assumed that the record from the single A. sediba male and female individuals currently forming the sample fully represent the average reference population (see Table 1 Suppl. Info. and Tables 9 and 10 in 4. RESULTS AND DISCUSSION).
35 35 4. RESULTS AND DISCUSSION For the specific purposes of the present analysis, based on the sexual dimorphism patterns reported for the selected reference samples (Homo, Gorilla, Pan, and Ouranopithecus), for the investigated fossil hominin taxa we have firstly obtained a taxon-specific BEST FIT estimate for each tooth-class, a useful parameter to tentatively assess the sex-related mean values of the mesiodistal (MD) and buccolingual (BL) crown diameters (see Tables 6 and 7). In order to allow the interpretation of the results, we have preliminary summarized the estimates in a number of comparative plots. The comparison consists of two groups of plots, illustrating the pooled samples and distinguished by sex, respectively (see FIGURES Suppl. Info.). The estimates of the coefficients calculated as intermediate values between the degree of sexual dimorphism of Gorilla and Homo used here as PROXY for fossil hominins is shown in Table 8. Tables 9 and 10 show the male and female means obtained from the originally pooled averages for each hominin taxon and, for each tooth-class and diameter, the relative sexual dimorphism estimated ratios (S.D.E.R.; for details, see the section Methods of Analysis). Besides the tables, these results have been rendered by a number of comparative graphs (see FIGURES ). The tables summarizing the taxonspecific sex-related estimates of the BEST FIT distinctly consider each tooth-class (pooled permanent elements from both arcades) and crown diameter (MD and BL). With respect to the extant and fossil reference hominid taxa considered in the present study, the range for the incisor MD widely fluctuates in Gorilla from 0,1 to 1,0 for males, and from 0,1 to 0,4 for females, where the same estimates for P. troglodytes range from 0,3 to 0,6 for males, and from 0,1 to 0,2 in females. For P. paniscus, male values slightly range from 0,1 to 0,2, while females show a single value of 0,1, which corresponds to the male minimum. For the same tooth-class, H. sapiens, clearly showing a low degree of sexual dimorphism associated to a higher degree of morphometric variation, the estimates fluctuate between 0,1 and 0,4 in males and between 0,1 to 0,5 in females. O. macedoniensis, the rather highly dimorphic fossil hominid used here as a sort of reference "outlier", shows the following values: 0,5 to 0,7 for males and 0,3 to 0,8 for females. For the BL diameter of the incisors, the estimates obtained for Gorilla again widely range from 0,6 to 1,5 in males, and from 0,2 to 0,8 in females. Both minimal
36 36 estimates in P. troglodytes males and females correspond to 0,1, while the maximum values correspond to 0,6 and 0,4, respectively. For the same variable, P. paniscus shows in males a minimum value of 0,2 and a maximum of 0,4, while both values coincide in the females of this taxon (0,2). H. sapiens estimates are from 0,1 to 0,3 in males, and from 0,2 to 0,4 in females. Males of O. macedoniensis apparently range from 0,3 to 0,6, while females from 0,3 to 0,5. In G. gorilla, the range of estimates for the canine MD corresponds to the intervals 0,8-1,2 and 0,7-0,8, in males and females, respectively. P. troglodytes males fluctuates between 0,9 and 1,0, while females display a single value of 0,4. Similarly, P. paniscus males modestly range from 0,8 to 0,9, while in this case the female interval is 0,6-0,8. H. sapiens male values correspond to the interval 0,2-0,3 where females only provide the single datum of 0,3 which fits the male maximum. While O. macedoniensis males show a single value of 0,7, female estimates for this Miocene taxon apparently widely fluctuate between 0,1 and 0,7. TABLE 6. The BEST FIT of MD estimates. See Table 2, Table 3, Table 5 in Suppl. Info. for the reference database and related information. Late Miocene taxon 1. For the canine BL, G. gorilla male estimated values correspond to the single datum 1,1, while the female ones to 0,8. P. troglodytes males slightly vary from 0,9 to 1,0 and females from 0,4 to 0,5. Males of P. paniscus range from 0,8 to 0,9, being 0,8 a
37 37 maximum for females and, similarly to the MD diameter, 0,6 their minimum value. H. sapiens estimates fluctuates from 0,3 to 0,6 in males, and from 0,4 to 0,7 in females, which is a higher range. O. macedoniensis shows a single value for males (0,9), while females widely range from 0,2 to 0,9. TABLE 7. The BEST FIT of BL estimates. See Table 2, Table 3, Table 5 in Suppl. Info. for the reference database and related information. Late Miocene taxon 1. Within the reference hominid sample used in the present analysis, the estimates for the MD diameter of the premolar tooth-class range in G. gorilla from 0,4 to 1,1 and from 0,2 to 0,6, in males and females, respectively. In P. troglodytes, the same values correspond in males to the interval 0,1-0,3, while the single value of 0,1 characterize the females of this taxon. Both males and females of P. paniscus display an equal variation range, from 0,1 to 0,2. The same range also characterize H. sapiens males, while females vary from 0,1 to 0,3. O. macedoniensis male estimates slightly range from 1,0 to 1,1, apparently being the females of this Miocene ape much more variable with this respect, as their estimates fluctuate from 0,2 to 0,8. For the BL diameter of the same tooth-class, estimates for G. gorilla males range within the wide interval 0,4-1,2, while females from 0,3 to 0,5. P. troglodytes males vary from 0,4 to 0,7 and females from 0,2 and 0,3. In P. paniscus, both male and
38 38 female values equally correspond to the narrow interval 0,1-0,2, which also replicates the condition already observed for the MD diameter. A similar situation can be observed also in H. sapiens, where both male and female estimates fluctuate from 0,3 to 0,5. A minimum value of 0,1 is found for both O. macedoniensis males and females, while the maximum correspond to 1,2 and 0,8, respectively. Molar MD estimates for G. gorilla vary from 0,6 to 1,1 in males, and between 0,2 and 0,5 in females. The same variables for males of P. troglodytes correspond to the intervals 0,2-0,4 and 0,1-0,2, respectively. Here again, both sexes of P. paniscus share the same 0,1-0,2 range, which equals to that observed for the MD and BL diameters of the premolars and to the BL of molars (see below). Also, both H. sapiens males and females have a single value of 0,2. O. macedoniensis male estimates fluctuate between 0,8 and 1,0, while females show a wider 0,3-0,8 interval. Finally, for the estimates of the BL diameter of the molar tooth-class, G. gorilla males widely fluctuate from 0,3 to 1,1 and females from 0,1 to 0,5. Values for P. troglodytes range from 0,5 to 0,6 in males and from 0,2 to 0,3 in females. As pointed out for the MD diameter, estimates for both sex-related P. paniscus samples equal those recorded for the MD diameter, and also fit the interval 0,1-0,2 recorded for the H. sapiens males. Among humans, the female range is slightly wider (0,1-0,3). In the Miocene ape O. macedoniensis, males apparently fluctuate from 0,8 to 0,9, while females within the wider range 0,3-0,8, which is equivalent to the figures already recorded for the MD diameter of their incisors and molars. Similarly to what previously shown for the reference taxa, Table 8 PROXY presents the taxon-specific values calculated for the fossil hominin taxa investigated for the assessment of the degree of dental crown size sexual dimorphism. Also, distinctly for each tooth-class and crown diameter, the results are here illustrated in a number of comparative graphs (see FIGURES ).
39 39 TABLE 8. The PROXY estimates for MD and BL. See 3. METHODS OF ANALYSIS for related information. For the incisor morphological tooth-class, the total range obtained for the entire set of hominin taxa here considered fluctuates in males from 0,1 to 0,7 for the MD diameter, and from 0,4 to 0,9 for the BL. For the females, the same estimates correspond to the intervals 0,1-0,5 and 0,2-0,6, respectively. Regarding the canine MD, 0,5 represents the minimum value for both sexes, while 0,8 and 0,6 the maximum one for males and females, respectively. For the same tooth, the BL values range from 0,7 to 0,9 in males and from 0,6 to 0,8 in females. In both males and females, the MD values for the premolars systematically range from 0,3 to 0,7 and from 0,4 to 0,9 for the BL diameter. The fossil hominin molar male estimates fall into the range 0,4-0,7 for MD and 0,2-0,7 for BL. The same values for the female molars are 0,2-0,4 and 0,1-0,4, for the MD and the BL diameter, respectively. Based on the results summarized above, the average values of these intervals have been used to calculate, case by case for each fossil hominin taxon, the respective male and female means starting from the original pooled samples. For each fossil hominin taxon and distinctly for the upper and lower jaws, Table 9 and Table 10 show the sex-specific means values of the MD and BL diameters, as well as the relative sexual dimorphism estimated ratios (S.D.E.R). The MD values of the maxillary central incisors, of the second incisors, of the canines, and the third premolars of Ar. ramidus are absent, as are missing those of the maxillary central and lateral incisors of A. anamensis. Also, for the upper BLs, no estimate is available for the Ar. ramidus upper canine, nor for the A. anamensis second incisor and fourth premolar.
40 40 TABLE 9. Maxillary mean male and female estimates and S.D.E.R. See 3. METHODS OF ANALYSIS, Table 1 and Table 4 for related information and calculation process in Suppl. Info. MD MEAN Ar. ramidus A. anamensis A. afarensis A. africanus P. robustus 10,9 10,6 9,0 I 1 10,4 9,7 8,3 S.D.E.R. 1,05 1,09 1,09 7,7 7,0 6,8 I 2 7,3 6,6 6,3 S.D.E.R. 1,06 1,06 1,08 11,7 10,3 10,3 9,1 C - 9,8 9,4 9,5 8,2 S.D.E.R. 1,19 1,10 1,08 1,11 10,6 9,1 9,3 10,5 P 3 9,4 8,6 9,0 9,7 S.D.E.R. 1,12 1,06 1,03 1,07 7,9 10,1 9,6 9,7 11,0 P 4 7,5 7,9 8,9 9,1 10,4 S.D.E.R. 1,05 1,27 1,08 1,06 1,06 10,7 12,5 12,6 13,2 13,8 M 1 10,4 11,4 11,7 12,6 13,1 S.D.E.R. 1,04 1,09 1,08 1,05 1,05 12,3 13,4 13,4 14,9 15,2 M 2 11,8 12,5 12,8 14,0 14,1 S.D.E.R. 1,04 1,07 1,04 1,06 1,08
41 41 BL MEAN Ar. ramidus A. anamensis A. afarensis A. africanus P. robustus 8,0 9,1 8,9 8,6 7,6 I 1 7,5 8,6 8,0 8,1 7,3 S.D.E.R. 1,07 1,06 1,11 1,05 1,05 7,9 7,7 7,2 7,1 I 2 7,3 7,1 6,5 6,3 S.D.E.R. 1,08 1,09 1,11 1,12 11,1 11,5 11,2 10,1 C - 9,8 10,2 9,7 8,6 S.D.E.R. 1,14 1,13 1,15 1,17 12,2 13,8 12,8 13,2 14,4 P 3 11,2 12,6 12,0 12,2 13,4 S.D.E.R. 1,10 1,10 1,07 1,08 1,08 11,8 13,2 14,2 15,8 P 4 11,4 12,0 12,6 13,8 S.D.E.R. 1,04 1,11 1,12 1,14 12,1 14,0 14,0 14,3 15,0 M 1 11,6 12,9 13,2 13,7 14,3 S.D.E.R. 1,04 1,09 1,05 1,05 1,05 14,5 15,2 15,1 16,5 16,2 M 2 14,0 14,3 14,6 15,5 15,3 S.D.E.R. 1,04 1,07 1,03 1,06 1,06 According to Table 10, some missing estimates for both diameters of the lower teeth concern Ar. ramidus, A. anamensis, and A. sediba. Notably, the MD and BL of the lower canine and P 3 of Ar. ramidus are absent and have not been integrated in this study (see 2. MATERIALS for comments). The estimates of both diameters for I 1 and that of the BL of I 2 are not available in A. anamensis. Finally, A. sediba is only represented by the MD and BL estimates of the M 1 and M 2.
42 42 TABLE 10. Mandibular male and female estimated means and S.D.E.R., ( 1 : data from Berger et al., 2010). See 3. METHODS OF ANALYSIS, Table 1 and Table 4 for related information and calculation process in Suppl. Info. MD MEAN Ar. ramidus A. anamensis A. afarensis A. africanus P. robustus A. sediba 1 5,7 6,9 6,4 5,4 I 1 5,5 6,2 5,9 5,2 S.D.E.R. 1,04 1,10 1,08 1,03 8,2 6,9 7,5 6,5 I 2 7,5 6,2 7,0 6,2 S.D.E.R. 1,09 1,10 1,08 1,05 9,8 9,8 9,9 8,2 C - 7,9 8,3 9,1 7,4 S.D.E.R. 1,24 1,17 1,09 1,10 10,2 10,0 10,1 10,5 P 3 9,6 9,0 9,3 9,9 S.D.E.R. 1,06 1,11 1,08 1,06 8,2 9,5 10,3 10,8 11,8 P 4 7,6 8,5 9,3 10,0 11,2 S.D.E.R. 1,08 1,11 1,11 1,08 1,06 11,7 13,1 13,6 14,5 15,2 12,5 M 1 11,2 12,3 12,8 13,6 14,5 11,8 S.D.E.R. 1,04 1,06 1,06 1,07 1,05 1,06 13,6 14,9 15,0 16,3 16,8 14,4 M 2 13,0 14,0 13,9 15,4 16,0 14,1 S.D.E.R. 1,05 1,06 1,08 1,06 1,05 1,02 MD MEAN Ar. ramidus A. anamensis A. afarensis A. africanus P. robustus A. sediba 1 6,3 7,6 7,2 6,3 I 1 6,0 7,3 6,4 5,8 S.D.E.R. 1,05 1,05 1,11 1,09 7,5 8,5 8,5 7,6 I 2 7,0 7,7 7,9 7,0 S.D.E.R. 1,07 1,10 1,08 1,08
43 43 MD MEAN Ar. ramidus A. anamensis A. afarensis A. africanus P. robustus A. sediba 1 11,2 11,4 10,8 9,3 C - 9,7 9,7 9,5 7,8 S.D.E.R. 1,15 1,17 1,13 1,18 11,6 11,5 12,2 12,4 P 3 10,2 9,9 10,6 10,8 S.D.E.R. 1,14 1,16 1,15 1,15 9,8 11,2 11,6 12,2 13,9 P 4 9,2 10,0 10,4 11,0 12,3 S.D.E.R. 1,07 1,12 1,11 1,11 1,13 10,8 12,3 13,0 13,7 14,1 11,6 M 1 10,5 11,4 12,4 12,9 13,4 11,1 S.D.E.R. 1,04 1,08 1,05 1,06 1,05 1,05 12,2 13,9 14,0 14,9 15,1 12,9 M 2 12,0 13,2 13,2 14,1 14,4 12,2 S.D.E.R. 1,02 1,05 1,06 1,06 1,05 1,06 FIGURE 5.0 Taxon-specific comparative plot of the MD and BL crown diameters (in mm) for the upper central incisor (I 1 ) in some selected fossil hominins (sexes separated). See 2. MATERIALS for the meaning of the abbreviations.
.")
44 44 As shown in Figure 5.0, the taxon-related male and female averages of the upper central incisor are relatively spread. The S.D.E.R estimates shown Figure 5.1 for the MD indicate that A. afarensis is less dimorphic then A. africanus and P. robustus, the latters sharing a ratio of 1,09. Conversely, for the BL, A. afarensis is the most dimorphic taxon (S.D.E.R = 1,11). The other fossil taxa provided the following quantitative values of secual dimorphism: Ar. ramidus = 1,07; A. anamensis = 1,06; A. afarensis and P. robustus = 1,05. Figure 5.0 shows the male and female means of the lower central incisor, which are distributed almost linearly. FIGURE 5.1 Taxon-specific comparative graph of sexual dimorphism estimated ratio (S.D.E.R) of the MD and BL crown diameters (in mm) for the upper central incisor (I 1 ) in some selected fossil hominins. See 3. METHODS OF ANALYSIS for related information. FIGURE 5.2 Taxon-specific comparative plot of the MD and BL crown diameters (in mm) for the lower central incisor (I 1 ) in some selected fossil hominins (sexes separated). See 2. MATERIALS for the meaning of the abbreviations.
45 45 Figure 5.3 shows that, for the S.D.E.R. ratios of the MD diameters, P. robustus (1,03) is less dimorphic than Ar. ramidus (1,04), A. africanus (1,08), and notably A. afarensis (1,10), the latter being the most dimorphic taxon; in this case, Ar. ramidus and A. africanus have an intermediate position. For the BL, the S.D.E.R. ration of A. africanus is 1,11 making it the most dimorphic hominin of our series compared to P. robustus (1,09) and to both Ar. ramidus and A. afarensis (1,05). FIGURE 5.3 Taxon-specific comparative graph of sexual dimorphism estimated ratio (S.D.E.R) of the MD and BL crown diameters (in mm) for the lower central incisor (I 1 ) in some selected fossil hominins. See 3. METHODS OF ANALYSIS for related information. FIGURE 5.4 Taxon-specific comparative plot of the MD and BL crown diameters (in mm) for the upper second incisor (I 2 ) in some selected fossil hominins (sexes separated). See 2. MATERIALS for the meaning of the abbreviations.
 greatly differ from both A. africanus (AfrM) and A. sediba (AsM) male, but more closer fit the condition shown by P. robustus (PrM). FIGURE 5.")
46 46 Male and female estimated mean values for the upper second incisor shown in Figure 5.4 are distributed non-linearly and indicate distinct separation between the sexes and, frequently, among taxa. For example, A. afarensis males (AfaM) greatly differ from both A. africanus (AfrM) and A. sediba (AsM) male, but more closer fit the condition shown by P. robustus (PrM). FIGURE 5.5 Taxon-specific comparative graph of sexual dimorphism estimated ratio (S.D.E.R) of the MD and BL crown diameters (in mm) for the upper second incisor (I 2 ) in some selected fossil hominins. See 3. METHODS OF ANALYSIS for related information. Figure 5.5 shows a distinct increase in sexual dimorphism for both crown diameters from Ar. ramidus to P. robustus through A. afarensis and A. africanus. Figure 5.6, which illustrates the lower second incisor, shows a distribution in males and female for both diameters similar to that described by Figure 5.4. According to Figure 5.7, the sexual dimorphism ratio of A. afarensis for both MD and BL is 1,11, making it the most dimorphic taxon. Mesiodistally, the less dimorphic taxon is P. robustus (S.D.E.R. = 1,05). With a S.D.E.R. value for both diameters of 1,08 and 1,09, respectively, A. africanus, A. anamensis show an intermediate position. Figure 5.8 represents the condition of the upper canine. The samples are not well distinct but inter-taxic overlap if found. Notably, the females of A. anamensis (AnF), A. afarensis (AfaF), and A. africanus (AfrF) are close together, and the males of A. afarensis (AfaM) and A. africanus (AfrM) share almost equal MD and BL mean values.
47 47 FIGURE 5.6 Taxon-specific comparative plot of the MD and BL crown diameters (in mm) for the lower second incisor (I 2 ) in some selected fossil hominins (sexes separated). See 2. MATERIALS for the meaning of the abbreviations. FIGURE 5.7 Taxon-specific comparative graph of sexual dimorphism estimated ratio (S.D.E.R) of the MD and BL crown diameters (in mm) for the lower second incisor (I 2 ) in some selected fossil hominins. See 3. METHODS OF ANALYSIS for related information. The A. anamensis (AnM) male group is set apart from both A. afarensis and A. africanus, but, at any rate, the latter represent its closest fit.
 of the MD and BL crown diameters (in mm) for the upper canine (C') in some selected fossil hominins.")
48 48 FIGURE 5.8 Taxon-specific comparative plot of the MD and BL crown diameters (in mm) for the upper canine (C') in some selected fossil hominins (sexes separated). See 2. MATERIALS for the meaning of the abbreviations. FIGURE 5.9 Taxon-specific comparative graph of sexual dimorphism estimated ratio (S.D.E.R) of the MD and BL crown diameters (in mm) for the upper canine (C') in some selected fossil hominins. See 3. METHODS OF ANALYSIS for related information. For the MD diameter of the upper canine (Figure 5.9), A. anamensis is the most dimorphic taxon (S.D.E.R. = 1,19), being A. africanus the least dimorphic one (S.D.E.R. = 1,08); with this respect, A. afarensis and P. robustus show and intermediate
 for the lower canine (C) in some selected fossil hominins (sexes separated).")
49 49 position. Conversely, for the BL, the most dimorphic taxon is P. robustus (S.D.E.R. = 1,17), while A. afarensis is the least dimorphic one (S.D.E.R. = 1,13). In this case, A. anamensis and A. africanus show intermediate values. FIGURE 6.0 Taxon-specific comparative plot of the MD and BL crown diameters (in mm) for the lower canine (C) in some selected fossil hominins (sexes separated). See 2. MATERIALS for the meaning of the abbreviations. Lower canine mean estimates for males and females are shown in Figure 6.0. A. anamensis (AnM), A. afarensis (AfaM), and A. africanus (AfrM) males form a relatively distinct male group, where for females only A. anamensis (AnF) and A. afarensis (AfaF) are close. Males of A. sediba (AsM) and P. robustus (PrM) are similar to each other as do females of A. anamensis and A. afarensis. Figure 6.1 shows that, fort the MD diameter, A. anamensis has an extremely high S.D.E.R. (1,24) when compared to the estimates of A. afarensis (1,17 for both MD and BL), P. robustus (1,10), and A. africanus (1,09). For the BL, the S.D.E.R. value of 1,18 makes P. robustus more dimorphic than the other taxa considered here, but close anyhow to A. anamensis (1,15) and, notably, to A. afarensis (1,17). FIGURE 6.1 Taxon-specific comparative graph of sexual dimorphism estimated ratio (S.D.E.R) of the MD and BL crown diameters (in mm) for the lower canine (C) in some selected fossil hominins. See 3. METHODS OF ANALYSIS for related information.
 and P. robustus (PrM) males are close, as do A.")
50 50 FIGURE 6.2 Taxon-specific comparative plot of the MD and BL crown diameters (in mm) for the upper third premolar (P 3 ) in some selected fossil hominins (sexes separated). See 2. MATERIALS for the meaning of the abbreviations. The distribution pattern shown by Figure 6.2 is also quite spread. A. anamensis (AnM) and P. robustus (PrM) males are close, as do A. afarensis (AfaM) and A. africanus (AfrM) males. However, a clear sex-related distinction is not evident here. With its S.D.E.R. of 1,12, A. anamensis is again the most dimorphic taxon for the MD (Figure 6.3), while the least dimorphic is A. africanus (1,03).
 and P. robustus (1,07) show and intermediate position. For the BL, the most dimorphic taxa are Ar.")
51 51 FIGURE 6.3 Taxon-specific comparative graph of sexual dimorphism estimated ratio (S.D.E.R) of the MD and BL crown diameters (in mm) for the upper third premolar (P 3 ) in some selected fossil hominins. See 3. METHODS OF ANALYSIS for related information. With this respect, A. afarensis (S.D.E.R. = 1,06) and P. robustus (1,07) show and intermediate position. For the BL, the most dimorphic taxa are Ar. ramidus and A. anamensis, with equal S.D.E.R. (1,10). For this variable the least dimorphic taxon is A. afarensis (1,07), while A. africanus and P. robustus (1,08 in both cases) are intermediate. Figure 6.4, which refers to the third premolar, shows again not linear distributions of the different hominin taxa. Nonetheless, male and female samples can be relatively easily separated among A. anamensis, A. afarensis, A. africanus, and P. robustus. As shown by Figure 6.5, A. afarensis is the most dimorphic taxon for both mesiodistal and buccolingual diameters (S.D.E.R. = 1,11 and 1,16, respectively). For the same variables, the least dimorphic taxa are A. anamensis (1,06 and 1,14) and P. robustus (1,06 and 1,15), A. africanus showing an intermediate position (1,08 and 1,15 for the MD and BL diameters, respectively). The figures for the upper and lower fourth premolar are shown in Figure 6.6 and Figure 6.7, respectively. For the upper fourth premolar, Figure 6.8 indicates that A. anamensis is a highly dimorphic taxon for the BL diameter (S.D.E.R. = 1,27), where Ar. ramidus is less dimorphic for the MD one (1,05). For the MD diameter, A. afarensis, A. africanus, and P. robustus are between of Ar. ramidus and A. anamensis.
 of the MD and BL crown diameters (in mm) for the lower third premolar (P 3 ) in some selected fossil hominins.")
52 52 FIGURE 6.4 Taxon-specific comparative plot of the MD and BL crown diameters (in mm) for the lower third premolar (P 3 ) in some selected fossil hominins (sexes separated). See 2. MATERIALS for the meaning of the abbreviations. FIGURE 6.5 Taxon-specific comparative graph of sexual dimorphism estimated ratio (S.D.E.R) of the MD and BL crown diameters (in mm) for the lower third premolar (P 3 ) in some selected fossil hominins. See 3. METHODS OF ANALYSIS for related information.
53 53 FIGURE 6.6 Taxon-specific comparative plot of the MD and BL crown diameters (in mm) for the upper fourth premolar (P 4 ) in some selected fossil hominins (sexes separated). See 2. MATERIALS for the meaning of the abbreviations. FIGURE 6.7 Taxon-specific comparative plot of the MD and BL crown diameters (in mm) for the lower fourth premolar (P 4 ) in some selected fossil hominins (sexes separated). See 2. MATERIALS for the meaning of the abbreviations. Lower P4 estimates for sexual dimorphism are represented in Figure 6.9, where the most dimorphic taxa are A. anamensis and A. afarensis (for both, MD S.D.E.R. =
, while the most dimorphic one is P. robustus (1,13). FIGURE 6.8 Taxon-specific comparative graph of sexual dimorphism estimated ratio (S.D.E.R) of the MD and BL crown diameters (in mm) for the upper fourth premolar (P 4 ) in some selected fossil hominins.")

54 54 1,11), the least dimorphic hominin being P. robustus (1,06). With this respect, Ar. ramidus and A. africanus assume an intermediate position. For the BL, the least dimorphic taxon is Ar. ramidus (S.D.E.R. = 1,07), while the most dimorphic one is P. robustus (1,13). FIGURE 6.8 Taxon-specific comparative graph of sexual dimorphism estimated ratio (S.D.E.R) of the MD and BL crown diameters (in mm) for the upper fourth premolar (P 4 ) in some selected fossil hominins. See 3. METHODS OF ANALYSIS for related information. FIGURE 6.9 Taxon-specific comparative graph of sexual dimorphism estimated ratio (S.D.E.R) of the MD and BL crown diameters (in mm) for the lower fourth premolar (P 4 ) in some selected fossil hominins. See 3. METHODS OF ANALYSIS for related information.
55 55 FIGURE 7.0 Taxon-specific comparative plot of the MD and BL crown diameters (in mm) for the upper first molar (M 1 ) in some selected fossil hominins (sexes separated). See 2. MATERIALS for the meaning of the abbreviations. For the upper first molar, Figure 7.0 shows a relatively linear distribution of the male and female mean estimates. Here, together with the A. africanus females, males and females of A. anamensis and A. afarensis lie near each other, while P. robustus females are close to the A. africanus males. With this respect, A. sediba males, which are only represented by a single individual, clearly deviate from the general pattern. Figure 7.1 for the lower first molar also shows a relatively linear distribution of the sex-related estimates. In this case, Ar. ramidus males are close to the A. sediba females (again, one single individual); A. anamensis females are close to the A. sediba male(s); A. africanus females are close to the A. afarensis males; and P. robustus females are close to the A. africanus males. In Figure 7.2 (upper first molar), the most dimorphic taxon for both the mesiodistal and buccolingual diameters is A. anamensis (S.D.E.R. = 1,09). The least dimorphic taxon is represented by Ar. ramidus, with an S.D.E.R. value of 1,04 for both MD and BL. In this case the intermediate position is shared by A. afarensis (with MD = 1,08, BL = 1,05), A. africanus and P. robustus (in both taxa, MD = BL = 1,05).
56 56 FIGURE 7.1 Taxon-specific comparative plot of the MD and BL crown diameters (in mm) for the lower first molar (M 1 ) in some selected fossil hominins (sexes separated). See 2. MATERIALS for the meaning of the abbreviations. FIGURE 7.2 Taxon-specific comparative graph of sexual dimorphism estimated ratio (S.D.E.R) of the MD and BL crown diameters (in mm) for the upper first molar (M 1 ) in some selected fossil hominins. See 3. METHODS OF ANALYSIS for related information.
, the most dimorphic taxon is A. africanus (S.D.E.R. = 1,07). With an S.D.E.R. value of 1,04 for both MD and BL diameters, Ar.")
57 57 FIGURE 7.3 Taxon-specific comparative graph of sexual dimorphism estimated ratio (S.D.E.R) of the MD and BL crown diameters (in mm) for the lower first molar (M 1 ) in some selected fossil hominins. See 3. METHODS OF ANALYSIS for related information. For the lower first molar MD (Figure 7.3), the most dimorphic taxon is A. africanus (S.D.E.R. = 1,07). With an S.D.E.R. value of 1,04 for both MD and BL diameters, Ar. ramidus is again the least dimorphic taxon, while A. anamensis, A. afarensis, and A. sediba share a value of 1,06. Both MD and BL estimates for P. robustus correspond to 1,05. Buccolingually, the most dimorphic taxon is A. anamensis (1,08) and the least one is again Ar. ramidus, while A. africanus, A. afarensis, P. robustus, and A. sediba share an intermediate condition. The estimates for the MD and BL diameters of the upper second molar are shown in Figure 7.4. Here, males and females of A. africanus and P. robustus are quite close to each other, and the same situation is observed for the males of A. anamensis and A. afarensis. Also, Ar. ramidus males are close to the females of A. anamensis and A. afarensis. A similar situation is revealed in Figure 7.5 for the lower second molar.

58 58 FIGURE 7.4 Taxon-specific comparative plot of the MD and BL crown diameters (in mm) for the upper second molar (M 2 ) in some selected fossil hominins (sexes separated). See 2. MATERIALS for the meaning of the abbreviations. FIGURE 7.5 Taxon-specific comparative plot of the MD and BL crown diameters (in mm) for the lower second molar (M 2 ) in some selected fossil hominins (sexes separated). See 2. MATERIALS for the meaning of the abbreviations.
59 59 FIGURE 7.6 Taxon-specific comparative graph of sexual dimorphism estimated ratio (S.D.E.R) of the MD and BL crown diameters (in mm) for the upper second molar (M 2 ) in some selected fossil hominins. See 3. METHODS OF ANALYSIS for related information. For the MD estimates of the upper second molar (Figure 7.6), P. robustus is the most dimorphic taxon, with an S.D.E.R. ratio of 1,08, while A. afarensis and Ar. ramidus (both 1,04) are the much least dimorphic ones. For the buccolingual diameter, the less dimorphic taxon is again A. afarensis (1,03), A. africanus, P. robustus, and Ar. ramidus are in an intermediate position, while A. anamensis is the most dimorphic taxon. As shown in Figure 7.7, the most dimorphic taxon for the MD is A. afarensis (1,08), whilme A. sediba is the least dimorphic one (1,02). The remaining taxa are as follows: Ar. ramidus = 1,05; A. anamensis = 1,06; A. africanus = 1,06; and P. robustus = 1,05. For the BL diameter, the most dimorphic taxa are A. afarensis, A. sediba (in both taxa, S.D.E.R. = 1,06), and A. africanus, being Ar. ramidus the least dimorphic sample (1,02).

60 60 FIGURE 7.7 Taxon-specific comparative graph of sexual dimorphism estimated ratio (S.D.E.R) of the MD and BL crown diameters (in mm) for the lower second molar (M 2 ) in some selected fossil hominins. See 3. METHODS OF ANALYSIS for related information. As a whole, the results scattered by our analytical approach show that, for most teeth - notably both upper and lower canines, the third premolars, the upper fourth premolar, and both first molars - A. anamensis behaves as the most dimorphic hominin taxon. In fact, in some cases at least, our measure of the degree of dental sexual dimorphism - the S.D.E.R. ratio - shows for this Pliocene taxon quite high values (on methodological ground, see Ruff, 2010). Nonetheless, also A. afarensis evidences a rather marked level of sexual dimorphism, particularly in the lower third premolar and lower second molar, but its condition is more fluctuating. In most cases, or even almost systematically, Ar. ramidus is absolutely the least dimorphic taxon, less dimorphic than A. africanus. In this respect, P. robustus frequently occupies an intermediate position, even if it tends to approximate the higher figures.
61 61 5. CONCLUSIVE REMARKS AND RESEARCH PERSPECTIVES At the best of our knowledge, the present one is the first attempt to quantify and to directly compare the degree of sexual dimorphism expressed by the crown size of the permanent teeth (from the upper I1 to the lower M2) in a large number of Miocene and Plio-Pleistocene hominins (see Suwa et al., 2009). By definition, the estimates resulting from the present analysis and their related models are tentative only, and should be thus considered as suggested figures to be tested by independent indicators. In fact, by definition, our analysis is incapable of distinguishing between extent of size dimorphism and normal variation. As clearly shown by the results summarized in the previous chapter (4. RESULTS AND DISCUSSION), in our comparative study Australopithecus anamensis tangentially behaves as the most dentally dimorphic taxon, a characteristic also originally suggested by Ward and co-workers (2001), but not agreed by other researchers (White et al., 2006). In our view, even if the estimates resulting from our analytical approach may be biased or even punctually inaccurate because of the influence of a number of known and unknown factors (for example, the very modest size of some dental samples and/or their originally asymmetrical distribution per sex), this is a recurrent signal emerging from our results, which unlikely reflects a fortuitous evidence. In any case, A. anamensis was very likely much more dentally dimorphic than A. afarensis. At the same time, Ardipithecus ramidus, which in some cases is represented by a relatively representative number of dental elements compared to the early Pliocene fossil record (Suwa et al., 2009; White et al., 2009a), frequently results as the least dimorphic hominin taxon. A number of studies briefly mentioned within chapter 2. (MATERIALS) suggest possible (or even very likely) chronologically-related ancestor-descendant relationships linking Late Miocene Ar. kadabba to Ar. ramidus, to A. anamensis, and to A. afarensis (for example, see White et al., 2009a). Nonetheless, even if only partial and biased, our analysis shows anyhow that, for most teeth, the sexual dimorphism pattern is highly fluctuating within this presumed linear lineage, with conflicting evidence of directional selection for strong, middle, and low dental sexual dimorphism. Accordingly, if our results approximate even slightly the original figures, the hypothesis of a single lineage relating Ar. kadabba to A. afarensis seems unlikely.
62 62 Similarly but not so clearly, the results from Ar. ramidus to A. sediba indicate significant fluctuations in the degree of dental sexual dimorphism, with no clear polarity (trend of increase or decrease). As it is the case for S. tchadensis and O. tugenensis, Ar. kadabba descriptive statistics have not been integrated in our study, as the currently available dental sample for this putative hominins is very limited and does not provide reliable information. Accordingly, here we compared only Ar. ramidus to a number of representatives of the Australopithecine genus. However, the degree of sexual dimorphism in Ar. kadabba is considered higher than that of its putative descendant (Haile-Selassie, 2001; Haile- Selassie et al., 2004; Suwa et al., 2009). Based on the present analysis, as in most cases it does not provide systematically coherent signals about taxon-specific sexual dimorphic patterns, but rather quite fluctuating figures, it appears that the dental metric record currently available for the Mio-Pleistocene hominins is extremely limited yet and not prone to represent the reference taxa to a reliable extent. This is certainly true for A. anamensis, where, for example, the sexual dimorphic estimates assessed in the present study (S.D.E.R. ratio) widely fluctuate for the mesiodistal diameter of the maxillary permanent dentition between 1,06 and 1,27. In conclusion, besides the obvious need for some methodological advances in the statistical assessment of the degree of sexual dimorphism in fossil primate taxa, it seems clear that much larger dental samples for the early hominin taxa scattering from new field work will be necessary in order to set the point on this still open matter and to provide more reliable and coherent taxonomic, phylogenetic, and evolutionary scenarios. In this framework, it should also be noted that significant advances are still needed in the assessment of the sexual dimorphism evolutionary patterns and trends characterizing early Homo and in the understanding of the degree of co-variation of the dentition with respect to the cranial and postcranial skeleton.
63 63 ACKNOWLEDGMENTS This work would not have been possible without scientific advice and assistance of Prof. Dr. Roberto Macchiarelli. I would like to sincerely thank Him for supervising this work and providing vast amount of information, ideas and suggestions to this interesting topic. I also thank Prof. Dr. Dominique Grimaud-Hervé, Dr. Carlos Lorenzo, Dr. Florent Detroit, Prof. Dr. François Sémah, Dr. Marta Arzarello and all the organizers, collaborators and mentors in France, Spain, Italy and Portugal of Erasmus Mundus International Master program in Quaternary and Prehistory. REFERENCES Alba D. M., Moya-Sola S., Kohler M., Canine reduction in the Miocene hominoid Oreopithecus bambolii: behavioural and evolutionary implications. J. Hum. Evol. 40: Alemseged Z., Spoor F., Kimbel W. H., Bobe R., Geraads D., Reed D., Wynn J. G., A juvenile early hominin skeleton from Dikika, Ethiopia. Nature 443: Alemseged Z., Wynn J. G., Kimbel W. H., Reed D., Geraads D., Bobe R., A new hominin from the Basal Member of the Hadar Formation, Dikika, Ethiopia, and its geological context. J. Hum. Evol. 49: Arsuaga J. L., Carretero J. M., Lorenzo C., Gracia A., Martinez I., Bermudez de Castro J. M., Carbonell E., Size variation in middle pleistocene humans. Science 277: Asfaw, B., The Belohdclic frontal: new evidence of early hominid cranial morphology from the Afar of Ethiopia. J. Hum. Evol. 16: Berger, L. R., Clarke R. J., Eagle involvement in accumulation of the Taung child fauna. J. Hum. Evol. 29: Berger L. R., de Ruiter D. J., Churchill S. E., Schmid P., Carlson K. J., Dirks P. H., Kibii J. M., Australopithecus sediba: A New Species of Homo-Like Australopith from South Africa. Science 328: Bermǔdez de Castro J. M., Sarmiento S., Cunha E., Rosas A., Bastir M., Dental size variation in the Atapuerca-SH Middle Pleistocene hominids. J. Hum. Evol. 41:
64 64 Bonis de L., Bouvrain G., Geraards D., Melentis J., Premiere decouverte d un primate hominoide dans le Miocene superieur de Macedoine (Grece). C. R. Acad. Sci. Paris 278: Bonis de L., Bouvrain G., Melentis J., Nouveaux restes de primates hominoïdes dans le Vallésien de Macédoine (Grèce). C. R. Acad. Sci. Paris 281: Bonis de L., Bouvrain G., Geraads D., Koufos G.D New hominis skull material from the late Miocene of Macedonia in Northern Greece. Nature 345: Bonis de L., Koufos G. D., The face and the mandible of Ouranopithecus macedoniensis: description of new specimens and comparisons. J. Hum. Evol. 24: Bonis de L., Koufos G. D., Guy F., Peigné S., Sylvestrou I., Nouveaux restes du primate hominoïde Ouranopithecus dans les depots du Miocène supérieur de Macédoine (Grèce). C. R. Acad. Sci. Paris 327: Bonis de L., Koufos, G. D., The Miocene large mammal succession in Greece. In: Agustí, J., Rook, L., Andrews, P. (Eds.), Hominoid Evolution and Climatic Change in Europe.Volume 1: The Evolution of Neogene Terrestrial Ecosystems in Europe. Cambridge University Press, London, pp Bonis de L, Koufos GD Phylogenetic relationships of Ouranopithecus macedoniensis (Mammalia, Primates, Hominoidea, Hominidae) of the late Miocene deposits of Central Macedonia (Greece). In: Bonis de L., Koufos G. D., Andrews P., eds. Phylogeny of the neogene hominoid primates of Eurasia. Cambridge, Cambridge University Press. p Brain, C. K., Structure and stratigraphy of the Swartkrans Cave in the light of the new excavations. Transvaal Mus. Monogr. 8: Bromage, T., Taung facial remodeling: a growth and development study. In: P. V. Tobias (cd.), Hominid Evolution: Past, Present and Future. New York: A. R. Liss p Broom, R., The Pleistocene anthropoid apes of South Africa. Nature 142: Broom, R. A., Another new type of fossil ape-man. Nature 163: 57. Broom, R., The genera and species of the South African fossil ape-men. Am. J. Phys. Anthropol. 8: 1-14.
65 65 Brunet M., Guy F., Pilbeam D., Mackaye H. T., Likius A., Ahounta D., Beauvilain A., Blondel C., Bocherens H., Boisserie J.-R., DeBonis L., Coppens Y., Dejax J., Denys C., Duringer P., Eisenmann V., Fanone G., Fronty P., Geraads D., Lehmann T., Lihoreau F., Louchart A., Mahamat A., Merceron G., Mouchelin G., Otero O., Campomanes P.P., DeLeon M.P., Rage J.-C., Sapanet M., Schuster M., Sudre J., Tassy P., Valentin X., Vignaud P., Viriot L., Zazzo A., Zollikofer C., A new hominid from the upper Miocene of Chad, central Africa. Nature 418: Clark J. D., Asfaw B., Assefa G., Harris J. W. K., Kurashina H., Walter R. C., White T. D., and Williams M. A. J., Paleoanthropological discoveries in the Middle Awash Valley, Ethiopia. Nature 307: Cope D. A., Measures of variation as indicators of multiple taxa in samples of sympatric Cercopithecus species. In: Kimbel W. H., Martin L. B., eds. Species, species concepts, and primate evolution. New York: Plenum Press p Cochard L. R., Ontogenetic allometry of the skull and dentition of the rhesus monkey (Macaca mulatta). In: Jungers WL, ed.. Size and scaling in primate biology. New York: Plenum Press p Crook JH Sexual selection, dimorphism, and social organization in the primates. In: Campbell B, editor. Sexual selection and the descent of man Chicago: Aldine. p Dart, R., Australopithecus africanus. The man-ape of South Africa. Nature 115: Dart, R. A., Taungs and its significance. Nat. Hist. 26: Deino A. L., Tauxe L., Monaghan M., Hill A., Ar/ 39 Ar geochronology and paleomagnetic stratigraphy of the Lukeino and lower Chemeron Formations at Tabarin and Kapcheberek, Tugen Hills, Kenya. J. Hum. Evol. 42: Dirks P. H., Kibii J. M., Kuhn B. F., Steininger C., Churchill S. E., Kramers J. D., Pickering R., Farber D. L., Mériaux A. S., Herries A. I., King G. C., Berger L. R., Geological setting and age of Australopithecus sediba from southern Africa. Science 328: Drake R., Curtis G. H., K-Ar geochronology of the Laetoli fossil localities. In: Leakey MD, Harris JM, editors. Laetoli: a Pliocene site in Northern Tanzania. Oxford: Clarendon Press. p Efron B., Bootstrap methods: another look at the jackknife. Ann. Statist. 7: 1-26.
66 66 Efron B. and Tibshirani R. J., An Introduction to the Bootstrap. New York: Chapman & Hall. Fleagle J.G., Kay R.F., and Simons E.L., Sexual dimorphism in early anthropoids. Nature 287: Fleagle J. G., Primate adaptation and evolution, 2nd ed. New York: Academic Press. Foley R. A., Lee P. C., Finite social space, evolutionary pathways, and reconstructing hominid behavior. Science 243: Ford S. M., Evolution of sexual dimorphism in body weight in platyrrhines. Am. J. Primatol. 34: Garn S. M., Kerewsky R. S., Swindler D. R Canine field in sexual dimorphism of tooth size. Nature 212: Gingerich P. D., Schoeninger M. J., Patterns of tooth size variability in the dentition of primates. Am. J. Phys. Anthropol. 51: Godfrey L. R., Lyon S. K., and Sutherland M. R., Sexual dimorphism in largebodied primates: The case of the subfossil lemurs. Am. J. Phys. Anthropol. 90: Greenfield L. O., Washburn A., Polymorphic aspects of male anthropoid honing premolars. Am. J. Phys. Anthropol. 87: Greenfield L. O., 1992a. Origin of the human canine: a new solution to an old enigma. Yearb. Am. J. Phys. Anthropol. 35: Greenfield L. O., 1992b. Relative canine size, behavior, and diet in male ceboids. J. Hum. Evol. 23: Greenfield L. O., Correlated response of homologous characteristics in the anthropoid anterior dentition. J. Hum. Evol. 31: Grine, F. E., Swartkrans. In: E. Delson et al., (eds.), Encyclopedia of Human Evolution and Prehistory, 2nd cd. New York: Garland Press, p Guy F., Lieberman D. E., Pilbeam D., Ponce de León M. S., Likius A., Mackaye H. T., Vignaud P., Zollikofer C. P. E., Brunet M., Morphological affinities of the Sahelanthropus tchadensis (Late Miocene hominid from Chad) cranium Proc. Natl. Acad. Sci. USA 102: Haile-Selassie, Y., Late Miocene hominids from the Middle Awash, Ethiopia. Nature 412:
67 67 Haile-Selassie Y., Suwa G., White T. D., Late Miocene Teeth from Middle Awash, Ethiopia, and Early Hominid Dental Evolution. Science 303: Haile-Selassie Y., Suwa G., White T. D., Hominidae. In: Ardipithecus kadabba: evidence from the late Miocene of Africa. Haile-Selassie Y., WoldeGabriel G., eds., Chapter 7, p , Berkeley, University of California Press. Haile-Selassie Y., WoldeGabriel G., Conclusions. In: Ardipithecus kadabba: evidence from the late Miocene of Africa. Haile-Selassie Y., WoldeGabriel G., eds., Chapter 20, p , Berkeley, University of California Press. Haile-Selassie Y., Saylor B. Z., Deino A., Alene M., Latimer B. M., New hominid fossils from Woranso-Mille (Central Afar, Ethiopia) and taxonomy of early Australopithecus. Am. J. Phys. Anthropol. 141: Hay R.L., Geology of the Laetoli area. In: Leakey MD, Harris JM, editors. Laetoli: a Pliocene site in Northern Tanzania. Oxford: Clarendon Press. p Henke W., Tattersall I., eds Handbook of Paleoanthropology. Springer-Verlag, Berlin. Holloway, R.L 'Robust' australopithecine brain endocasts: Some preliminary observations. In Evolutionary History of the "Robust" Australopithecine, ed. F.E. Grine, New York: Aldine de Gruyter. p Holloway, R Brain. In: E. Delson et al., (eds.): Encyclopedia of Human Evolution and Prehistory, 2nd ed. New York, Garland Publishing, p Johanson D. C., Taieb M., Plio-Pleistocene hominid discoveries in Hadar, Ethiopia. Nature 260: Johanson, D. C., White, T.D., A systematic assessment of early African hominids. Science 203: Johanson, D. C., Taieb M., Coppens Y., Pliocene hominids from the Hadar Formation, Ethiopia ( ): stratigraphic, chronologic and palaeoenvironmental contexts, with notes on hominid morphology and systcmatics. Am. J. Phys. Anthropol. 57: Josephson S. C., Juell K. E., Rogers A. R., Estimating sexual dimorphism by method of moments. Am. J. Phys. Anthropol. 100: Kay R. F., Sexual dimorphism in the Ramapithecinae. Proc. Natl. Acad. Sci. USA 79:
68 68 Kelley J., Phylogeny and sexually dimorphic characters: canine reduction in Ouranopithecus. In: Bonis de L., Koufos G. D., Andrews P., eds. Phylogeny of the neogene hominoid primates of Eurasia. Cambridge: Cambridge University Press. p Kieser J. A., Human Adult Odontometrics. The study of variation in adult tooth size. Cambridge, Cambridge University Press Kimbel W. H., White T. D., Johanson D. C., Craniodental morphology of the hominids from Hadar and Laetoli: evidence of Paranthropus and Homo in the Mid-Pliocene of eastern Africa. In: Delson E, editor. Ancestors: the hard evidence. New York: Liss. p Kimbel W. H., White T. D., Variation, sexual dimophism, and the taxonomy of Australopithecus. In: Grine, F.E. (Ed.), Evolutionary History of the Robust Australopithecines. Aldine de Gruyter, New York, pp Kimbel, W. H., Johanson D. C., Rak Y., The first skull and other new discoveries of Australopithecus afarensis at Hadar, Ethiopia. Nature 368: Kimbel W.H., Rak Y., Johanson D.C., The skull of Australopithecus afarensis. New York: Oxford University Press. Kimbel W. H., Delezene L. K., Lucy redux: A review of research on Australopithecus afarensis. Yearb. Am. J. Phys. Anthropol. 52: Kościński K., Pietraszewski S., Methods to estimate sexual dimorphism from unsexed samples: A test with computer-generated samples. Przegląd Antropologiczny Anthropol. Review 67: Koufos G. D., A mandible of Ouranopithecus macedoniensis from a new late Miocene locality of Macedonia (Greece). Am. J. Phys. Anthropol. 91: Koufos G. D., The first female maxilla of the hominoid Ouranopithecus macedoniensis from the late Miocene of Macedonia (Greece). Am. J. Phys. Anthropol. 91: Koufos G. D., New material of Vallesian late Miocene hipparions (Mammalia, Perissodactyla) from the lower Axios Valley, Macedonia, Greece. Senckenbergiana Lethaea 80: Koufos G. D., Bonis de L., The late Miocene hominoids Ouranopithecus and Graecopithecus. Impli cations about their relationships and taxonomy. Annales de Paléontologie 91:
69 69 Koufos G. D., Bonis de L., New material of Ouranopithecus macedoniensis from late Miocene of Macedonia (Greece) and study of its dental attrition. Geobios 39: Latimer, B. M., and Lovejoy O. C., Hallucal tarsometatarsal joint in Australopithecus afarensis. Am. J. Phys. Anthropol. 82: Leakey M. G., Feibel C. S., McDougall I., Walker A., New four-million-year-old hominid species from Kanapoi and Allia Bay, Kenya. Nature 376: Leakey M., Walker A., Afropithecus function and phylogeny. In: Begun D. R, Ward C. V., Rose M. D., ed. Function, phylogeny, and fossils: Miocene hominoid evolution and adaptations. New York: Plenum Press p Leakey M. G., Feibel C. S., McDougall I., Ward C. & Walker A., New specimens and confirmation of an early age for Australopithecus anamensis. Nature 393: Lebatard A. E., Bourlès D. L., Duringer P., Jolivet M., Braucher R., Carcaillet J., Schuster M., Arnaud N., Monié P., Lihoreau F., Likius A., Mackaye H. T., Vignaud P., Brunet M., Cosmogenic nuclide dating of Sahelanthropus tchadensis and Australopithecus bahrelghazali: Mio-Pliocene hominids from Chad. Proc. Natl. Acad. Sci. USA 105: Lee S.-H., Assigned Resampling Method: A new method to estimate size sexual dimorphism in samples of unknown sex. Przegląd Antropologiczny Anthropol. Review 64: Lee S.-H., Patterns of size sexual dimorphism in Australopithecus afarensis: Another look. HOMO J. Comp. Hum. Bio. 56: Lee-Thorpe, J. A., van der Merwe N. J., Brain C. K., Diet of Australopithecus robustus at Swartkrans from stable carbon isotope analysis. J. Hum. Evol. 27: Leigh S. R., Shea B. T., Ontogeny and the evolution of adult body size dimorphism in apes. Am. J. Primatol. 36: Leutenegger W., Shell B., Variability and sexual dimorphism in canine size in Australopithecus and extant hominoids. J. Hum. Evol. 16: Lieberman S. S., Gelvin B. R., Oxnard C. E., Dental sexual dimorphisms in some extant hominoids and ramapithecines from China: a quantitative approach. Am. J. Primatol. 9:
70 70 Lindenfors P., 2002a. Phylogenetic analyses of sexual size dimorphism. Ph.D. Dissertation, Stockholm University. Lindenfors P., 2002b. Sexually antagonistic selection on primate size. J. Evol. Biol. 15: Lockwood C.A., Richmond B.G., Jungers W.L., Kimbel W.H., Randomization procedures and sexual dimorphism in Australopithecus afarensis. J. Hum. Evol. 31: Lorenzo C., Carretero J. M., Arsuaga J. L., Gracia A. and Martinez I., Intrapopulational body size variation and cranial capacity in Middle Pleistocene humans: The Sima de los Huesos sample (Sierra de Atapuerca, Spain). Am. J. Phys. Anthropol. 106: Lovejoy C. O., The origin of man. Science 211: Lovejoy C. O., Kern K. F., Simpson S. W. and Meindl R. S., A new method for estimation of skeletal dimorphism in fossil samples with an application to Australopithecus afarensis. In (G. Giacobini, Ed.) Hominidae. Proceedings of the Second International Congress of Human Paleontology: Milan: Jaca Book. Lovejoy C. O., Reexamining human origins in light of Ardipithecus ramidus. Science 326: 74e1-8. Lovejoy C. O., Suwa G., Spurlock L., Asfaw B., White T. D., 2009a. The Pelvis and Femur of Ardipithecus ramidus: The Emergence of Upright Walking. Science 326: 71e1-6. Lovejoy C. O., Latimer B., Suwa G., Asfaw B., White T. D., 2009b. Combining prehension and propulsion: the foot of Ardipithecus ramidus. Science 326: 72e1-8. Lovejoy C. O., Suwa G., Simpson S. W., Matternes J. H., White T. D., 2009c. The great divides: Ardipithecus ramidus reveals the postcrania of our last common ancestors with African apes. Science 326: Macchiarelli R., Mazurier A., Illerhaus B. Zanolli C., Ouranopithecus macedoniensis (Mammalia, Primates, Hominoidea): virtual reconstruction and 3D analysis of a juvenile mandibular dentition (RPl-82 and RPl-83). Geodiversitas 31 (4): McHenry H. M., Body size and proportions in early hominids. Am. J. Phys. Anthropol. 87:
71 71 McHenry H. M., 1994a. Behavioral ecological implications of early hominid body size. J. Hum. Evol. 27: McHenry HM. 1994b. Sexual dimorphism in fossil hominids and its sociological implications. In: Shennan S, Steele J, eds. Power, sex and tradiation: the archeology of human ancestry. London: Routledge and Kegan Paul. p McHenry H., Body proportions in Australopithecus afarensis and Australopithecus africanus and the origin of the genus Homo. J. Hum. Evol. 35: McKee J. K., Thackeray J. F., Berger L. R., Faunal assemblage seriation of South African Pliocene and Pleistocene fossil deposits. Am. J. Phys. Anthropol. 96: Moggi-Cecchi J., Tobias P. V., Beynon A. D., The mixed dentition and associated skull fragments of a juvenile fossil hominid from Sterkfontein, South Africa. Am. J. Phys. Anthropol. 106: Moggi-Cecchi J., Grine F. E., Tobias P. V., Early hominid dental remains from Members 4 and 5 of the Sterkfontein Formation ( excavations): catalogue, individual associations, morphological descriptions and initial metrical analysis. J. Hum. Evol. 50: Oxnard C. E., Fossils, teeth and sex: new perspectives on human evolution. Seattle: University of Washington Press. Partridge T.C., Granger D.E., Caffee M.W., Clarke R. J., Lower Pliocene hominid remains from Sterkfontein. Science 300: Pickford, M Late Miocene sediments and fossils from the Northern Kenya Rift Valley. Nature 256: Pickford M., Senut B., The geological and faunal context of Late Miocene hominid remains from Lukeino, Kenya, C. R. Acad. Sci. Paris 332: Pickford M., Senut B., Gommery D., Treil J., Bipedalism in Orrorin tugenensis revealed by its femora, C. R. Palevol. 1: Plavcan J. M., van Schaik C. P., Intrasexual competition and canine dimorphism in anthropoid primates. Am. J. Phys. Anthropol.87: Plavcan J. M., Catarrhine dental variability and species recognition in fossils. In: Kimbel WH, Martin LB, editors. Species, species concepts, and primate evolution. New York: Plenum Press p
72 72 Plavcan J.M., Comparison of four simple methods for estimating sexual dimorphism in fossils. Am. J. Phys. Anthropol. 94: Plavcan J. M., van Schaik C. P., Canine Dimorphism. Evol. Anthropol. 2: Plavcan J. M., van Schaik C. P., Kappeler P. M., Competition, coalitions and canine size in primates. J. Hum. Evol. 28: Plavcan J. M., van Schaik CP. 1997a. Interpreting hominid behavior on the basis of sexual dimorphism. J. Hum. Evol. 32: Plavcan J. M., van Schaik C. P., 1997b. Intrasexual competition and body weight dimorphism in anthropoid primates. Am. J. Phys. Anthropol.103: Plavcan, J. M., Sexual dimorphism in primate evolution. Yearb. Am. J. Phys. Anthropol. 44: Plavcan, J.M., Cope, D.A., Metric variation and species recognition in the fossil record. Evol. Anthropol. 10: Plavcan J. M., Scaling Relationships Between Craniofacial Sexual Dimorphism and Body Mass Dimorphism in Primates: Implications for the Fossil Record. Am. J. Phys. Anthropol. 120: Reed, K., Early hominid evolution and ecological change through the African Plio-Pleistocene. J. Hum. Evol. 32: Reed K. E., Paleoecological patterns at the Hadar hominin site, Afar regional state, Ethiopia. J. Hum. Evol. 54: Rehg J.A., Leigh S.R., Estimating sexual dimorphism and size differences in the fossil record: a test of methods. Am. J. Phys. Anthropol. 110: Renne, P. R., WoldeGabriel, G., Hart W. K., Heiken G., White T. D., Chronostratigraphy of the Miocene-Pliocene Sagantole Formation, Middle Awash Valley, Afar rift, Ethiopia. Geol.. Soc. Am. Bull. 111: Reno P. L., Meindl R. S., McCollum M. A., Lovejoy C. O., Sexual dimorphism in Australopithecus afarensis was similar to that of modern human. Proc. Natl. Acad. Sci. USA 100: Ruff C. B., Body size and body shape in early hominins implications of the Gona Pelvis. J. Hum. Evol. 58: Ruiter de D. J., Pickering R., Steininger C. M., Kramers J. D., Hancox P. J., Churchill S. E., Berger L. R., Backwell L., New Australopithecus robustus fossils and
73 73 associated U-Pb dates from Cooper's Cave (Gauteng, South Africa). J. Hum. Evol. 56: Sawada, Y., Pickford, M., Senut, B., Itaya, T., Hyodo, M., Miura, T., Kashine, C., Chujo, T. Fujii, H., The age of Orrorin tugenensis, an early hominid from the Tugen Hills, Kenya. C. R. Palevol. 1: Schrein C. M., Metric variation and sexual dimorphism in the dentition of Ouranopithecus macedoniensis J. Hum. Evol. 50: Schwartz J. H., Tattersall I., The Human Fossil Record, Vol. 4: Craniodental Morphology of Early Hominids (Genera Australopithecus, Paranthropus, Orrorin), and Overview (Wiley-Liss, New York). Scott R. S., Ungar P. S., Bergstrom T. S., Brown C. A., Grine F. E., Teaford M. F., Walker A., Dental microwear texture analysis shows within-species dietary variability in fossil hominins. Nature 436: Sen S., Koufos G. D., Kondopoulou D., Bonis de L., Magnetostratigraphy of the late Miocene continental deposits of the lower Axios valley, Macedonia, Greece. Bull. Geo. Soc. Greece 9: Senut B., Pickford M., Gommery D., Mein P., Cheboi K., Coppens, Y. First hominid from the Miocene (Lukeino Formation, Kenya), C. R. Acad. Sci. Paris 332: Sillen, A Strontium-calcium ratios (Sr/Ca) of Australopithecus robustus and associated fauna from Swartkrans. J. Hum. Evol. 23: Smith R. J., Jungers W. L., Body mass in comparative primatology. J. Hum. Evol. 32: Smith, R.J., Statistics of sexual size dimorphism. J. Hum. Evol. 36: Suwa G., Kono Reiko T., Simpson S. W., Asfaw B., Lovejoy C. O., White T. D., Paleobiological implications of the Ardipithecus ramidus dentition. Science, 326: 69, Swindler D. R Primate Dentition. An Introduction to the Teeth of Non-human Primates. Cambridge, Cambridge University Press. Vignaud P., Duringer P., Mackaye H. T., Likius A., Blondel C., Boisserie J.-R., De Bonis L., Eisenmann V., Etienne M. E., Geraads D, Guy F., Lehmann T., Lihoreau F., Lopez-Martinez N., Mourer-Chauviré C., Otero O., Rage J. C., Schuster M., Viriot L., Zazzo A., Brunet M., Geology and paleontology of the Upper Miocene Toros-Menalla hominid locality. Nature 418:
74 74 Vrba, E. S., Biostratigraphy and chronology, based particularly on Bovidae, of southern African hominid-associated assemblages. Proc. Cong. Pal. Hum., Congres. Nice, CNRS, p Walter, R. C., Aronson J. L., Revisions of K/Ar ages for the Hadar hominid site, Ethiopia. Nature 296: Walter, R. C., Age of Lucy and the First Family: single-crystal Ar/Ar dating of the Dcncn Dora and lower Kada Hadar members of the Hadar Formation, Ethiopia. Geology 22: Walter R. C., J. L. Aronson Age and source of the Sidi Hakoma Tuff, Hadar Formation, Ethiopia. J. Hum. Evol. 25: Ward C. V., Leakey M.G., Walker A., Morphology of Australopithecus anamensis from Kanapoi and Allia Bay, Kenya. J. Hum. Evol. 41: White T. D., New fossil hominids from Laetolil, Tanzania. Am. J. Phys. Anthropol. 46: White T. D., Suwa G., Hart W. K., Walter R. C., WoldeGabriel G., de Heinzelin J., Clark J. D., Asfaw B., Vrba E., New discoveries of Australopithecus at Maka in Ethiopia. Science 366: White T. D., Suwa G., Asfaw B., Australopithecus ramidus, a new species of hominid from Aramis, Ethiopia. Nature 371: White T. D., Suwa G., Simpson S., Asfaw B., Jaws and teeth of Australopithecus afarensis from Maka, Middle Awash, Ethiopia. Am. J. Phys. Anthropol. 111: White. T. D., Early hominid femora: The inside story. C. R. Palevol. 5, White, T.D., WoldeGabriel G., Asfaw B., Ambrose S., Beyene Y., Bernor R. L., Boisserie J.-R., Currie B., Gilbert W. H., Haile-Selassie Y., Hart W. K., Hlusko L. J., Howell F. C., Kono R. T., Lehmann T., Louchart A., Lovejoy O. C., Renne P. R., Saegusa H., Vrba E. S., Wesselman H., Suwa G., Asa Issie, Aramis and the origin of Australopithecus. Nature 440: White T. D., Asfaw B., Beyene Y., Haile-Selassie Y., Lovejoy C. O., Suwa G., WoldeGabriel G., 2009a. Ardipithecus ramidus and the paleobiology of early hominids. Science 326: White T. D., Ambrose S. H., Suwa G., Su D. F., DeGusta D., Bernor R. L., Boisserie J.- R., Brunet M., Delson E., Frost S., Garcia N., Giaourtsakis I. X., Haile-Selassie Y., Howell F. C., Lehmann T., Likius A., Pehlevan C., Saegusa H., Semprebon
75 75 G., Teaford M., Vrba E., 2009b. Macrovertebrate paleontology and the Pliocene habitat of Ardipithecus ramidus. Science 326: WoldeGabriel, G., White T. D., Suwa G., Renne P., de Heinzelin J., Ecological and temporal placement of early Pliocene hominids at Aramis, Ethiopia. Nature 371: WoldeGabriel G., Haile-Selassie Y., Renne P. R., Hart W. K., Ambrose S., Asfaw B., Heiken G., White, T.D., Geology and palaeontology of the Late Miocene Middle Awash valley, Afar rift, Ethiopia. Nature 412: WoldeGabriel G., Ambrose S. H., Barboni D., Bonnefille R., Bremond L., Currie B., DeGusta D., Hart W. K., Murray A. M., Renne P. R., Jolly-Saad M. C., Stewart K. M., White T. D., The Geological, Isotopic, Botanical, Invertebrate, and Lower Vertebrate Surroundings of Ardipithecus ramidus. Science 326: 65, 65e1- e5. Wolpoff M. H., (eds.) Human Evolution. College Custom Series, McGraw- Hill, New York. Wolpoff M. H., Senut B., Pickford M., Hawks, J., Sahelanthropus or Sahelpithecus? Nature 419: Wolpoff M. H., Hawks J., Senut B., Pickford M., Ahern J., An ape or the ape: is the Toumai cranium TM266 a hominid? PaleoAnthropol. Society: Wood B. A., Li Y., Willoughby C., Intraspecific variation and sexual dimorphism in cranial and dental variables among higher primates and their bearing on the hominid fossil record. J. Anat. 174: Wood, B., Hominid Revelations from Chad. News and Views. Nature, 418: Wood, B., Strait, D., Patterns of resource use in early Homo and Paranthropus. J. Hum. Evol. 46: Wood B., Reconstructing human evolution: achievements, challanges, and opportunities. Proc. Natl. Acad. Sci. USA 107: Zingeser M. R., Cercopithecoid canine tooth honing mechanisms. Am. J. Phys. Anthropol. 31: Zollikofer C. P., Ponce de León M. S., Lieberman D. E., Guy F., Pilbeam D., Likius A., Mackaye H. T., Vignaud P., Brunet M., Virtual cranial reconstruction of Sahelanthropus tchadensis. Nature 434:
76 SUPPLEMENTARY INFORMATION TABLE OF CONTENTS TABLE Comparative Maxillary and Mandibular Dental Metrics of Fossil Hominins TABLE Comparative Maxillary and Mandibular Dental Metrics of Extant and Fossil Hominids Hominin Holotypes and Fossil Remains Figures , 1.6, TABLE Calculation Process of Best Fit for Extant and Fossil Hominids (Maxillary and Mandibular) TABLE Estimation of Male & Female Means for Fossil Hominins (Maxillary and Mandibular) TABLE Comparative Statistics of O. macedoniensis FIGURES Taxon-specific Figures of Extant and Extinct Hominids and Hominins
77 2 Table 1. Fossil Hominins. Comparative Maxillary Dental Metrics of Fossil Hominins MD Taxon n Mean S.D. C.V. Range n Mean S.D. C.V. Range BL I 1 S. tchadensis 1 13,3 1 8,9 O. tugenensis 1 10,0 1 8,7 Ar. ramidus 2 10,0 0,07 0,70 9,9-10,0 5 7,7 0,45 5,80 7,1-8,2 A. anamensis 3 11,3 10,5-12,4 4 8,8 0,46 5,21 8,2-9,3 A. afarensis 7 10,6 0,80 7,30 9,0-11,8 9 8,3 0,80 9,90 7,0-9,7 A. africanus 10 10,1 1,20 11,53 7,4-11,8 10 8,3 0,40 5,00 7,6-8,9 A. sediba ,1 1 6,9 P. robustus 11 8,6 1,08 12,58 7,1-10,8 7 7,4 0,31 4,17 6,8-7,7 I 2 Ar. ramidus 3 6,9 0,55 8,00 6,3-7,4 4 7,5 0,53 7,00 6,8-8,0 A. anamensis 1 5,8 2 6,5 A. afarensis 8 7,5 0,60 7,50 6,6-8,2 10 7,3 0,60 7,70 6,2 8,1 A. africanus 10 6,8 0,60 8,70 5,9-7,7 8 6,8 0,63 9,12 5,6 7,7 A. sediba 1 1 7,7 1 5,1 P. robustus 7 6,5 0,69 10,51 5,8-7,9 7 6,6 0,68 10,41 5,6 7,8
78 3 Comparative Maxillary Dental Metrics of Fossil Hominins (continued) C - UCMAX MD Taxon n Mean S.D. C.V. Range n Mean S.D. C.V. Range S. tchadensis 1 10,2 BL O. tugenensis 1 11,0 1 9,3 Ar. ramidus 9 11,3 0,65 5,7 9,9-12,2 A. anamensis 7 10,7 1,47 13,70 7,8-12,3 8 10,4 0,89 8,57 9,0-11,8 A. afarensis 15 9,8 0,70 7,40 8,8-11, ,8 0,90 8,60 9,3-12,5 A. africanus 11 9,9 0,60 5,71 8,8-10, ,4 1,00 9,24 8,7-12,0 A. sediba 1 1 9,0 1 8,8 P. robustus 14 8,6 0,70 8,15 7,6-10,6 16 9,3 0,98 10,51 7,9-11,2 Individual data for Ar. kadabba (Haile-Selassie, 2001; Haile-Selassie, Suwa and White, 2004) and Ar. ramidus (White, Suwa and Asfaw, 1994) for UC & LC and UP3 & LP3 combined. MD BL Taxon n Mean n Mean C - Ar. kadabba 1 10,1 Ar. ramidus 1 11,2 3 11,5
79 4 Comparative Maxillary Dental Metrics of Fossil Hominins (continued) P 3 MXMD MD MXOB BL Taxon n Mean S.D. C.V. Range n Mean S.D. C.V. Range S. tchadensis 1 7,3 1 13,0 Ar. kadabba 1 7,9 1 11,5 Ar. ramidus 6 7,7 0,57 7,4 6,7-8,4 6 11,7 0,78 6,7 10,4-12,5 A. anamensis 5 10,0 1,17 11,72 8,7-11,8 4 13,2 0,90 6,87 12,1-14,3 A. afarensis 10 8,8 0,50 5,90 7,5-9, ,4 0,60 4,60 11,3-13,4 A. africanus 18 9,1 0,30 3,08 8,7-9, ,7 0,70 5,79 11,7-14,1 A. sediba 1 1 9,0 1 11,2 P. robustus 28 10,1 0,72 7,31 9,2-12, ,9 0,72 5,23 12,3-15,1 Individual data for Ar. kadabba (Haile-Selassie, 2001; Haile-Selassie, Suwa and White, 2004) and Ar. ramidus (White, Suwa and Asfaw, 1994) for UC & LC and UP3 & LP3 combined. MD BL Taxon n Mean n Mean P 3 Ar. kadabba 1 7,6 1 11,3 Ar. ramidus 1 7,7 1 12,5
80 5 Comparative Maxillary Dental Metrics of Fossil Hominins (continued) MD Taxon n Mean S.D. C.V. Range n Mean S.D. C.V. Range BL P 4 Ar. kadabba 1 7,6 Ar. ramidus 7 7,7 0,42 5,40 7,2-8,4 7 11,6 0,29 2,50 11,3-12,0 A. anamensis 4 9,0 2,17 24,09 7,2-12,1 2 14,1 13,9-14,2 A. afarensis 20 9,2 0,70 7,90 7,6-10, ,6 0,90 6,90 11,1-14,5 A. africanus 25 9,4 0,57 6,55 8,0-10, ,4 1,10 8,10 10,7-15,2 A. sediba 1 1 9,2 1 12,1 P. robustus 26 10,7 0,64 5,87 9,5-11, ,8 1,36 9,17 10,3-16,3 M 1 S. tchadensis 2 11,2 10,9-11,5 Ar. kadabba 3 10,4 3 11,8 Ar. ramidus 9 10,5 0,41 3,90 9,8-11,1 8 11,8 0,55 4,70 11,2-13,0 A. anamensis 11 11,8 1,17 9,95 10,0-12,9 9 13,3 1,49 11,18 11,7-14,1 A. afarensis 17 12,0 1,00 8,30 10,5-13, ,5 0,90 6,60 12,0-15,0 A. africanus 30 12,8 0,74 5,11 11,5-13, ,9 0,80 5,80 12,7-15,3 A. sediba ,9 1 12,0 P. robustus 26 13,3 0,75 5,64 11,4-15, ,6 0,88 6,04 13,0-16,8
81 6 Comparative Maxillary Dental Metrics of Fossil Hominins (concluded) MD Taxon n Mean S.D. C.V. Range n Mean S.D. C.V. Range BL M 2 S. tchadensis 1 13,0 1 12,8 Ar. ramidus 8 12,0 0,54 4,50 11,0-12,8 9 14,2 0,63 4,40 13,3-15,3 A. anamensis 8 12,8 0,93 7,26 11,4-14,2 9 14,6 1,16 7,90 12,9-16,3 A. afarensis 12 13,0 0,60 4,30 12,1-14, ,8 0,60 4,00 13,4-15,8 A. africanus 27 14,3 1,00 7,27 12,8-16, ,9 1,20 7,81 13,7-18,3 A. sediba ,9 1 13,7 P. robustus 28 14,5 1,20 7,30 12,8-18, ,6 1,10 6,76 13,1-16,9
82 7 Comparative Mandibular Dental Metrics of Fossil Hominins MD Taxon n Mean S.D. C.V. Range n Mean S.D. C.V. Range BL I 1 Ar. ramidus 4 5,6 0,35 6,30 5,2-6,0 4 6,1 0,25 4,00 5,8-6,4 A. anamensis 3 7,0 0,30 4,38 6,8-7,3 2 8,0 7,4-8,5 A. afarensis 6 6,5 0,90 14,30 5,6-8,0 6 7,4 0,30 4,00 6,9-7,7 A. africanus 11 6,1 0,65 10,73 4,7-6,9 11 6,7 0,65 9,80 5,8-7,9 P. robustus 7 5,3 0,26 4,87 4,9-5,6 6 6,0 0,46 7,79 5,2-6,5 I 2 Ar. kadabba 1 6,3 1 8,3 Ar. ramidus 2 6,8 0,57 8,30 6,4-7,2 4 7,2 0,47 6,50 6,6-7,6 A. anamensis 4 7,8 0,94 11,84 6,6-8,7 3 8,3 0,38 4,54 7,9-8,6 A. afarensis 8 6,5 0,90 13,20 5,0-7,4 8 8,0 0,70 8,40 6,7-8,8 A. africanus 9 7,2 0,79 10,94 5,3-8,1 10 8,1 0,59 7,32 7,0-9,2 P. robustus 4 6,3 0,48 7,67 5,7-6,7 4 7,2 0,50 6,90 6,7-7,8
83 8 Comparative Mandibular Dental Metrics of Fossil Hominins (continued) C - MXOB MD Taxon n Mean S.D. C.V. Range n Mean S.D. C.V. Range S. tchadensis 2 10,5 10,0-11,0 2 8,5 8,5-8,5 BL Ar. kadabba 2 11,0 10,8-11,2 2 7,8 7,8-7,8 Ar. ramidus 5 11,2 0,77 6,9 10,3-12,1 A. anamensis 5 8,8 1,46 16,63 6,6-10,4 5 10,4 0,99 9,55 9,2-11,4 A. afarensis 13 9,0 1,10 12,20 7,5-11, ,5 1,10 10,20 8,8-12,4 A. africanus 26 9,5 0,61 6,41 8,5-11, ,1 0,85 8,47 8,7-12,0 A. sediba 1 1 8,0 1 8,5 P. robustus 11 7,8 0,59 7,59 7,0-8,7 9 8,5 0,96 11,26 7,5-10,5 Individual data for Ar. kadabba (Haile-Selassie, 2001; Haile-Selassie, Suwa and White, 2004) and Ar. ramidus (White, Suwa and Asfaw, 1994) for UC & LC and UP3 & LP3 combined. MD BL Taxon n Mean n Mean C - Ar. kadabba ,8 Ar. ramidus 1 11,0
84 9 Comparative Mandibular Dental Metrics of Fossil Hominins (continued) MXOB MD Taxon n Mean S.D. C.V. Range n Mean S.D. C.V. Range P 3 Ar. ramidus 7 10,1 0,84 8,3 9,2-11,5 7 7,5 0,47 6,3 7,0-8,2 PP BL A. anamensis 6 9,9 0,60 6,06 9,3-10,9 5 10,9 1,00 9,17 9,5-12,0 A. afarensis 29 9,5 1,00 10,90 7,9-12, ,7 1,10 9,90 8,9-13,6 A. africanus 18 9,7 0,74 7,66 8,4-11, ,4 1,17 10,28 9,2-13,9 P. robustus 20 10,2 0,61 6,01 9,0-11, ,6 1,14 9,88 9,0-13,7 P 4 S. tchadensis 1 8,0 1 9,0 O. tugenensis 1 11,0 1 9,3 Ar. ramidus 6 7,9 0,60 7,50 7,3-8,9 6 9,5 0,44 4,60 9,0-10,2 A. anamensis 6 9,0 0,95 10,52 7,4-9,8 7 10,6 0,84 7,94 9,6-11,9 A. afarensis 26 9,8 1,00 10,30 7,7-11, ,0 0,80 7,10 9,8-11,8 A. africanus 24 10,4 0,76 7,33 9,3-12, ,6 0,90 7,81 10,3-13,4 P. robustus 17 11,5 0,62 5,38 10,6-12, ,1 1,11 8,45 11,5-14,8 Individual data for Ar. kadabba (Haile-Selassie, 2001; Haile-Selassie, Suwa and White, 2004) and Ar. ramidus (White, Suwa and Asfaw, 1994) for UC & LC and UP3 & LP3 combined. MD BL Taxon n Mean n Mean P 3 Ar. kadabba Ar. ramidus 1 8,2 1 11,5
85 10 Comparative Mandibular Dental Metrics of Fossil Hominins (continued) MD Taxon n Mean S.D. C.V. Range n Mean S.D. C.V. Range M 1 S. tchadensis 1 11,0 1 11,9 BL Ar. ramidus 7 11,4 0,54 4,70 11,0-12,5 6 10,6 0,46 4,40 10,3-11,5 A. anamensis 8 12,6 0,87 6,90 11,6-13,7 8 11,7 1,10 9,37 10,2-13,3 A. afarensis 31 13,1 0,90 7,10 10,1-14, ,6 0,80 6,00 11,0-13,9 A. africanus 32 13,9 1,07 7,72 12,4-15, ,2 0,90 6,81 10,8-15,1 1 12,5 1 11,6 A. sediba ,2 2 11,4 1 11,8 1 11,1 P. robustus 24 14,7 0,77 5,22 13,2-16, ,7 0,85 6,24 11,8-15,0 M 2 S. tchadensis 1 12,5 O. tugenensis 1 11,5 1 11,8 Ar. kadabba 1 12,7 1 11,8 Ar. ramidus 5 13,2 0,70 5,30 12,5-14,1 5 12,1 0,29 2,40 11,8-12,5 A. anamensis 7 14,3 0,92 6,48 13,0-15,9 7 13,5 0,88 6,55 12,3-14,9 A. afarensis 33 14,3 1,20 8,60 12,1-16, ,5 1,00 7,20 11,1-15,2 A. africanus 37 15,7 0,98 6,22 14,0-17, ,4 0,99 6,90 12,7-16,8 1 14,4 1 12,9 A. sediba ,3 2 12,6 1 14,1 1 12,2 P. robustus 20 16,3 0,90 5,49 14,8-17, ,7 0,84 5,71 12,8-16,3
86 11 MD mesiodistal diameter; BL buccolingual diameter; S.D. standard deviation; C.V. coefficient of variation; S.D.E.R. sexual dimorphism estimated ratio. UCMAX maximum diameter (basal or mesiodistal); MXMD maximum mesiodistal diameter of P 3 taken at buccal crown; MXOB maximum oblique diameter of crown; PP maximum diameter perpendicular to MXOB (Ar. ramidus). UCMAX is larger of UCMD and UCMXOB when both are available (after Suwa et al., 2009). Sources of dental measurements: S. tchadensis Brunet et al., 2002, 2005; O. tugenensis Senut et al., 2001; Ar. kadabba Haile-Selassie, Suwa and White, 2009; Ar. ramidus Suwa et al., 2009; A. anamensis Ward, Leakey and Walker 2001; White et al., 2006; A. afarensis Kimbel, Rak and Johanson, 2004; Kimbel and Delezene, 2009; A. africanus Moggi-Cecchi et al., Kimbel and Delezene, 2009; A. sediba Berger 1 et al., 2010; P. robustus Kimbel and Delezene, 2009.
87 12 Table 2. Extant and Fossil Hominids. Comparative Maxillary Dental Metrics of Extant and Fossil Hominids MD Taxon n Mean S.D. C.V. Range S.D.E.R. n Mean S.D. C.V. Range S.D.E.R. I ,7 0,25 1,70 14,5 15,0 2 11,6 11,6 11,6 G. gorilla 11 14,2 0,48 3,38 13,4 15,0 1, ,6 0,68 6,60 9,6 11,6 1, ,0 0,39 2,79 13,4 14,6 8 10,3 0,46 4,47 9,6 10, ,6 0,82 6,51 10,5 13, ,1 0,76 7,52 9,0 11,3 P. troglodytes 65 12,1 0,91 7,52 10,0 13,5 1, ,9 0,82 8,28 8,3 11,7 1, ,9 0,88 7,39 10,0 13,4 50 9,6 0,82 8,54 8,3 11, ,3 0,9 8,74 8,9 11,9 15 7,9 0,6 7,59 7,2 9,2 P. paniscus 35 10,4 0,8 7,69 8,9 11,9 9,9 36 7,7 0,5 6,62 6,8 9,2 1, ,4 0,7 6,73 9,0 11,5 21 7,6 0,4 5,26 6,8 8,5 55 9,31 0,55 5, ,56 0,54 7,14 H. sapiens 105 9,02 0,60 6,67 1, ,5 0,50 6,67 1, ,70 0,48 5, ,39 0,43 5,82 BL I ,8 0,42 3,89 10,5 11,1 4 10,1 0,75 7,43 9,4 11,0 G. gorilla 10 10,1 0,99 9,80 8,7 11,7 1, ,6 0,84 8,75 8,1 11,0 1,07 8 9,9 1,03 10,40 8,7 11,7 8 9,4 0,83 8,83 8,1 10,4 15 9,3 0,61 6,56 7,9 10,3 14 9,2 0,58 6,30 8,4 10,8 P. troglodytes 58 8,9 0,84 9,44 6,9 10,9 1, ,0 0,76 8,44 7,6 11,0 1, ,8 0,87 9,89 6,9 10,9 45 8,9 0,80 8,99 7,6 11,0 13 7,9 0,7 8,86 6,9 9,2 13 7,3 0,6 8,22 6,7 8,5 P. paniscus 33 7,9 0,7 8,86 6,9 10,1 1, ,2 0,49 6,81 6,4 8,5 1, ,9 0,7 8,86 7,1 10,1 20 7,1 0,4 5,63 6,4 7,7 56 7,59 0,64 8, ,10 0,57 8,03 H. sapiens 102 7,29 0,77 10,56 1, ,88 0,64 9,30 1, ,92 0,77 11, ,62 0,63 9,52 C ,4 1,66 7,76 19, ,0 0,78 4,88 14,9 16,6 G. gorilla 11 17,3 3,38 19,54 14,3 23,3 1, ,2 2,49 19,15 10,5 16,6 1, ,0 0,56 3,73 14,3 15,6 6 11,3 0,47 4,16 10,5 11, ,0 1,57 10,47 13,0 18, ,0 0,93 7,75 10,5 13,8 P. troglodytes 46 12,7 2,24 17,64 6,5 18,0 1, ,3 1,80 17,48 7,4 13,9 1, ,7 1,68 14,36 6,5 15,0 30 9,5 1,53 16,11 7,4 13, ,1 0,9 8,11 9,7 13,3 15 8,8 0,8 9,09 7,6 10,7 P. paniscus 33 10,0 1,27 12,70 8,2 13,3 1, ,8 1,13 14,49 6,3 10, ,0 0,5 5,56 8,2 9,9 18 6,9 0,4 5,80 6,3 7,6 56 8,12 0,38 4, ,87 0,61 6,88 H. sapiens 105 8,03 0,40 4,98 1, ,68 0,60 6,91 1, ,92 0,41 5, ,44 0,49 5, ,8 1,12 8, ,4 1,40 11,36 O. macedoniensis 7 12,8 8, ,4 11,36
88 13 Comparative Maxillary Dental Metrics of Extant and Fossil Hominids (continued) MD Taxon n Mean S.D. C.V. Range S.D.E.R. n Mean S.D. C.V. Range S.D.E.R. P ,4 0,71 5,73 12,7 13,3 3 15,8 0,61 3,86 15,1 16,2 G. gorilla 13 11,8 0,86 7,29 10,6 13,3 1, ,1 0,61 4,04 13,8 16,2 1, ,6 0,83 7,16 10,6 13,3 9 14,8 0,38 2,57 13,8 15,1 17 8,2 0,84 10,24 6,3 9, ,5 0,75 7,14 9,4 12,0 P. troglodytes 63 8,1 0,91 11,23 6,3 12,3 1, ,1 0,96 9,50 7,1 12,0 1, ,1 0,94 11,60 6,5 12,3 45 9,9 0,98 9,90 7,1 11,8 17 7,4 0,6 8,11 6,6 8,4 17 9,3 0,6 6,45 8,4 10,3 P. paniscus 43 7,3 0,49 6,71 6,2 8,4 1, ,2 0,48 5,22 8,3 10,3 1, ,2 0,4 5,56 6,2 7,8 27 9,2 0,4 4,35 8,3 10,2 56 7,66 0,51 6, ,83 0,52 5,29 H. sapiens 105 7,62 0,49 6,43 1, ,66 0,59 6,11 1, ,57 0,46 6, ,46 0,61 6,55 1 9,5 1 12,2 O. macedoniensis 7 8,7 0,74 8,55 1, ,5 0,83 6,59 0,97 6 8,5 0,71 8, ,6 0,88 6,98 BL P ,2 0,30 2,46 10,9 11,5 3 15,2 0,69 4,54 14,8 16,0 G. gorilla 10 11,4 0,75 6,58 10,3 11,8 1, ,6 0,62 4,25 13,4 16,0 1, ,0 0,55 5,00 10,3 11,8 8 14,4 0,47 3,36 13,4-14,9 16 7,2 0,55 7,64 6,2 7, ,5 0,76 7,24 9,3 12,2 P. troglodytes 62 7,2 0,88 12,22 5,8 11,4 1, ,0 0,87 8,70 6,4 12,2 1, ,2 0,98 13,61 5,8 11,4 46 9,8 0,84 8,57 6,4 11,4 16 6,3 0,5 7,94 5,7 7,6 16 9,0 0,6 6,67 8,0 10,3 P. paniscus 39 6,2 0,5 8,06 5,0 7,6 1, ,9 0,49 5,51 7,7 10,3 1, ,1 0,5 8,20 5,0 6,6 24 8,8 0,4 4,55 7,7 9,8 56 7,43 0,49 6, ,82 0,67 6,82 H. sapiens 105 7,36 0,46 6,25 1, ,6 0,73 7,60 1, ,28 0,41 5, ,26 0,68 7,34 2 9,4 2 13,2 O. macedoniensis 10 8,6 0,84 9,83 1, ,4 0,70 5,28 0,99 8 8,4 0,75 8, ,4 0,74 5,49 M ,5 0,79 5,10 14,5 16,4 G. gorilla 16 15,0 0,90 6,00 13,4 16,4 1, ,8 0,89 6,01 13,4 16, ,3 0,56 5,44 9,3 11,2 P. troglodytes 70 10,2 0,68 6,67 9,0 11,6 1, ,1 0,72 7,13 9,0 11,9 7 8,5 0,6 7,06 7,9 9,4 P. paniscus 13 8,4 0,5 5,95 7,6 9,4 1,02 6 8,3 0,4 4,82 7,6 8, ,24 0,56 4, ,80 0,64 5,42 H. sapiens ,15 0,59 5,29 1, ,69 0,61 5,22 1, ,04 0,61 5, ,56 0,54 4, ,7 0,53 3, ,8 0,29 1,99 O. macedoniensis 11 12,8 0,96 7,52 1, ,4 0,57 3,94 1, ,4 0,76 6, ,2 0,51 3,60
89 14 Comparative Maxillary Dental Metrics of Extant and Fossil Hominids (concluded) Ant B Post B Taxon n Mean S.D. C.V. Range S.D.E.R. n Mean S.D. C.V. Range S.D.E.R. M ,4 1,19 7,73 14,2 17,0 4 15,0 1,25 8,33 13,2 16,0 G. gorilla 14 15,1 1,10 7,28 13,8 17,4 1, ,3 0,9 6,29 13,0 16,0 1, ,0 1,10 7,33 13,8 17, ,0 0,68 4,86 13,0 15, ,7 0,73 6,24 10,7 13, ,0 0,63 5,73 10,0 12,3 P. troglodytes 69 11,1 1,00 9,01 7,0 13,2 1, ,6 0,96 9,06 6,1 12,3 1, ,9 1,01 9,27 7,0 12, ,5 1,02 9,71 6,1 12,2 6 9,5 0,5 5,26 9,2 10,4 P. paniscus 12 9,6 0,4 4,17 9,2 10,4 0,98 6 9,7 0,4 4,12 9,3 10,4 MD Taxon n Mean S.D. C.V. Range S.D.E.R. n Mean S.D. C.V. Range S.D.E.R. M ,5 0,22 1,26 17,3 17,8 G. gorilla 14 16,4 1,03 6,28 14,0 17,8 1, ,0 0,89 5,56 14,0 17, ,4 0,56 5,38 9,3 17,3 P. troglodytes 69 10,2 0,70 6,86 9,3 12,1 1, ,1 0,74 7,33 9,0 11,9 7 8,4 0,7 8,33 7,6 9,6 P. paniscus 14 8,4 0,7 8,33 7,6 9,6 1,00 7 8,4 0,7 8,33 7,6 9, ,95 0,54 4, ,90 0,45 3,78 H. sapiens ,83 0,54 4,99 1, ,79 0,50 1,00 1, ,70 0,52 4, ,66 0,54 4, ,6 0,08 0, ,5 0,24 1,48 O. macedoniensis 11 14,6 1,25 8,56 1, ,8 0,89 5,66 1, ,2 1,19 8, ,5 0,84 5,40 BL Ant B Post B Taxon N Mean S.D. C.V. Range S.D.E.R. n Mean S.D. C.V. Range S.D.E.R. M ,9 0,46 2,72 16,4 17,3 4 16,0 1,20 7,50 14,4 17,2 G. gorilla 12 16,1 0,83 5,16 14,3 17,3 1, ,2 1,07 7,04 13,3 17,2 1, ,8 0,75 4,75 14,3 16,7 7 14,8 0,77 5,20 13,3 15, ,0 0,70 5,83 10,6 13, ,0 0,59 5,36 9,5-11,9 P. troglodytes 63 11,4 0,95 8,33 7,2 13,3 1, ,5 1,00 9,52 5,5 12,2 1, ,1 0,92 8,29 7,2 13, ,3 1,05 10,19 5,5 12,2 7 10,2 0,4 3,92 9,6 10,6 P. paniscus 14 10,2 0,4 3,92 9,6 10,6 1, ,2 0,4 3,92 9,6 10,6
90 15 Comparative Mandibular Dental Metrics of Extant and Fossil Hominids MD Taxon n Mean S.D. C.V. Range S.D.E.R. n Mean S.D. C.V. Range S.D.E.R. I1 4 7,9 0,30 3,80 7,6 8,3 4 9,7 0,89 9,18 8,5 10,4 G. gorilla 13 8,0 0,28 3,50 7,5 8,3 0, ,1 0,63 6,92 8,4 10,4 1,10 9 8,0 0,28 3,50 7,5 8,2 10 8,8 0,21 2,39 8,4 9,0 11 8,3 0,75 9,04 6,8 9,0 13 9,7 0,57 5,88 8,8 11,0 P. troglodytes 53 8,1 0,78 9,63 5,5 9,6 1, ,2 0,86 9,35 7,2 11,0 1, ,0 0,78 9,75 5,5 9,6 45 9,1 0,89 9,78 7,2 11,0 16 7,4 0,7 9,46 6,1 8,7 15 7,0 0,5 7,14 6,3 8,1 P. paniscus 38 7,3 0,7 9,59 5,6 8,7 1, ,9 0,40 5,80 6,2 7,5 1, ,2 0,7 9,72 5,6 8,5 22 6,8 0,3 4,41 6,2 7,5 56 5,43 0,45 8, ,20 0,32 5,16 H. sapiens 105 5,45 0,50 9,17 0, ,09 0,42 6,90 1, , , ,96 0,49 8,22 5 7,6 1,20 15,86 5 7,6 0,85 11,06 O. macedoniensis 9 6,5 1,56 23,97 1,46 9 7,4 0,68 9,20 1,06 4 5,2 0,68 13,13 4 7,2 0,15 2,10 I2 3 10,2 0,10 0,98 10,1 10,3 3 10,9 0,50 4,59 10,4 11,4 G. gorilla 11 10,2 0,81 7,94 9,0 11,9 1, ,4 0,60 5,77 9,6 11,5 1, ,2 0,97 9,51 9,0 11, ,3 0,58 5,63 9,6 11,5 13 8,9 0,80 8,99 7,6 10, ,0 0,75 7,50 8,6 12,0 P. troglodytes 54 8,5 0,70 8,24 7,0 10,2 1, ,6 0,89 9,27 7,9 12,0 1, ,4 0,63 7,50 7,0 9,6 41 9,5 0,91 9,58 7,9 11,5 17 7,5 0,6 8,00 6,3 8,3 17 7,1 0,4 5,63 6,7 8,4 P. paniscus 41 7,4 0,72 9,73 5,2 9,0 1, ,0 0,4 5,71 6,4 8,4 1, ,3 0,8 10,96 5,2 9,0 24 6,9 0,3 4,35 6,4 7,5 52 6,43 0,51 7, ,56 0,28 4,27 H. sapiens 100 6,28 0,55 8,55 1, ,51 0,37 5,68 1, ,11 0,55 9, ,45 0,46 7,13 6 8,5 1,45 17,18 6 8,9 1,63 18,30 O. macedoniensis 14 7,8 1,55 19,45 1, ,9 1,63 20,54 1,24 8 7,3 1,41 19,45 8 7,2 1,17 16,24 BL C- 4 16,9 2,19 12,96 14,8 20,0 5 18,1 1,08 5,97 16,2 19,0 G. gorilla 8 14,5 3,05 21,03 11, , ,1 2,77 18,34 11,6 19,0 1, ,0 0,97 8,08 11,0 13,3 7 13,0 0,78 6,00 11,6 13, ,7 1,58 12,44 10,9 15, ,0 1,19 9,15 10,4 14,7 P. troglodytes 43 11,1 1,83 16,49 8,2 15,9 1, ,1 1,89 17,03 8,0 14,7 1, ,4 1,47 14,13 8,2 14, ,2 1,44 14,12 8,0 14, ,0 0,7 7,00 8,7 11,4 16 7,6 0,4 5,26 6,8 8,5 P. paniscus 36 9,3 0,9 9,68 7,5 11,4 1, ,0 0,8 11,43 5,8 8,9 1, ,8 0,7 7,95 7,5 10,9 20 6,5 0,7 10,77 5,8 8,9 56 7,57 0,47 6, ,17 0,41 5,02 H. sapiens 104 7,45 0,45 6,04 1, ,86 0,55 7,00 1, ,31 0,38 5, ,48 0,45 6, ,4 0,90 8, ,4 0,74 5,16 O. macedoniensis 15 9,2 1,72 18,71 1, ,1 2,62 21,67 1,48 8 8,1 1,58 19,41 8 9,7 1,40 14,46
91 Comparative Mandibular Dental Metrics of Extant and Fossil Hominids (continued) 16 MD Taxon n Mean S.D. C.V. Range S.D.E.R. n Mean S.D. C.V. Range S.D.E.R. P3 4 16,9 0,77 4,56 15,9 17,6 5 11,9 0,31 2,61 11,6 12,4 G. gorilla 10 15,6 1,29 8,38 14,0 17,6 1, ,5 1,05 9,13 9,5 13,3 1, ,8 0,72 4,86 14,0 16,1 7 11,2 1,31 11,70 9,5 13, ,2 1,17 11,47 8,1 12,4 18 9,1 0,99 10,88 7,5 11,0 P. troglodytes 64 10,0 1,03 10,30 8,2 12,4 1, ,4 1,08 12,86 6,6 11,0 1, ,9 0,96 9,70 8,4 12,4 45 8,1 0,99 12,22 6,6 10,8 17 8,1 0,5 6,17 7,2 8,9 17 7,4 1,2 16,22 5,8 9,7 P. paniscus 41 8,2 0,4 4,88 7,2 9,1 0, ,2 1,0 13,89 5,2 9,7 1, ,2 0,4 4,88 7,5 9,1 24 7,0 0,9 12,86 5,2 8,4 56 7,88 0,46 5, ,37 0,53 6,33 H. sapiens 105 7,77 0,49 6,31 1, ,1 0,55 6,79 1, ,64 0,50 6, ,82 0,40 5, ,4 0,35 3, ,8 0,41 3,47 O. macedoniensis 16 10,4 0,94 9,06 1, ,9 0,86 7,89 1,16 9 9,6 0,29 3, ,2 0,27 2,68 BL P4 5 11,8 0,82 6,95 11,1 13,0 4 14,6 0,26 1,78 14,3 14,9 G. gorilla 12 11,5 0,73 6,35 10,3 13,0 1, ,7 1,07 7,81 11,5 14,9 1, ,3 0,63 5,58 10,3 12,1 8 13,3 1,06 7,97 11,5 14,7 17 7,8 0,72 9,23 6,6 9,2 16 9,1 0,87 9,56 7,4 10,5 P. troglodytes 60 7,6 0,69 9,08 6,0 9,2 1, ,7 0,83 9,54 7,2 10,5 1, ,5 0,67 8,93 6,0 9,1 43 8,5 0,76 8,94 7,2 10,0 18 7,1 0,4 5,63 6,1 7,7 18 7,8 0,7 8,97 6,5 9,2 P. paniscus 42 7,0 0,7 10,00 5,4 9,1 1, ,7 0,6 7,79 5,6 9,2 1, ,0 0,8 11,43 5,4 9,1 24 7,6 0,6 7,89 5,6 8,5 55 7,92 0,51 6, ,69 0,59 6,79 H. sapiens 99 7,87 0,53 6,73 1, ,51 0,63 7,40 1, ,80 0,54 6, ,30 0,61 7, ,5 0,50 4, ,1 0,30 2,48 O. macedoniensis 16 9,5 1,02 10,78 1, ,1 0,80 7,19 1,15 9 8,7 0,50 5, ,5 0,30 2,87 M1 6 16,2 0,79 4,88 14,7 17,0 G. gorilla 17 15,7 0,88 5,61 14,0 17,0 1, ,4 0,83 5,39 14,0 16, ,0 0,59 5,36 10,0 11,9 P. troglodytes 63 10,9 0,62 5,69 9,8 12,7 1, ,8 0,63 5,83 9,8 12,7 5 9,1 0,7 7,69 8,2 9,9 P. paniscus 10 9,3 0,6 6,45 8,2 10,1 0,96 5 9,5 0,4 4,21 9,0 10, ,81 0,47 3, ,05 0,42 3,80 H. sapiens ,71 0,54 4,61 1, ,38 0,61 5,36 0, ,60 0,59 5, ,77 0,56 4, ,1 0,49 3, ,3 0,69 4,83 O. macedoniensis 15 13,6 1,48 10,84 1, ,2 1,17 8,83 0, ,4 0,62 5, ,3 0,47 3,84
92 17 Comparative Mandibular Dental Metrics of Extant and Fossil Hominids (concluded) Tri B Taxon n Mean S.D. C.V. Range S.D.E.R. n Mean S.D. C.V. Range S.D.E.R. M1 3 13,7 1,00 7,30 12,6 14,5 3 13,3 1,46 10,98 11,8 14,7 G. gorilla 12 13,3 0,72 5,41 12,3 14,5 1, ,2 0,78 5,91 12,1 14,2 1, ,2 0,63 4,77 12,3 14,4 8 13,1 0,50 3,79 12,3 13, ,0 0,68 6,80 9,0 11, ,2 0,60 5,88 8,7 11,0 P. troglodytes 57 9,6 0,80 8,33 7,4 11,2 1, ,8 0,77 7,86 8,4 11,2 1, ,4 0,79 8,40 7,4 11,0 45 9,6 0,77 8,02 8,1 11,4 5 8,8 0,5 5,68 8,1 9,4 5 9,0 0,7 7,78 7,9 9,8 P. paniscus 9 8,8 0,38 4,32 8,1 9,4 0,99 8 8,9 0,60 6,74 8,2 9,6 1,02 4 8,9 0,2 2,25 8,7 9,2 3 8,8 0,5 5,68 8,4 9,3 Tal B M2 5 18,3 0,65 3,55 17,2 18,9 G. gorilla 13 17,5 1,01 5,77 15,7 18,6 1, ,0 0,88 5,18 15,7 18, ,4 0,89 7,81 9,5 12,9 P. troglodytes 66 11,1 0,74 6,67 9,5 12,9 1, ,0 0,65 5,91 9,5 11,2 7 9,9 0,4 4,04 9,4 10,6 P. paniscus 12 9,8 0,4 4,08 9,3 10,6 1,02 5 9,7 0,3 3,09 9,3 10, ,55 0,60 5, ,05 0,55 4,98 H. sapiens ,43 0,59 5,16 1, ,90 0,60 5,50 1, ,28 0,54 4, ,71 0,62 5, ,4 0,65 3, ,7 0,78 4,98 O. macedoniensis 16 15,0 1,34 8,91 1, ,6 1,16 7,95 1, ,0 0,43 3, ,7 0,30 2,19 Tri B Taxon n Mean S.D. C.V. Range S.D.E.R. n Mean S.D. C.V. Range S.D.E.R. M2 4 16,6 0,17 1,02 16,4 16,8 4 16,2 0,83 5,12 15,0 16,8 G. gorilla 12 15,6 0,97 6,22 13,6 16,8 1, ,3 1,09 7,12 13,1 16,8 1, ,1 0,79 5,23 13,6 16,3 8 14,8 0,90 6,08 13,1 15, ,9 0,75 6,88 9,9 12, ,7 0,66 6,17 8,9 15,7 P. troglodytes 63 10,4 0,88 8,46 8,3 12,5 1, ,3 0,83 8,06 8,9 12,5 1, ,2 0,86 8,43 8,3 12, ,2 0,86 8,43 8,5 13,1 7 9,1 0,6 6,59 8,4 10,0 7 8,8 0,3 3,41 8,3 9,2 P. paniscus 12 9,1 0,5 5,49 8,4 10,0 0, ,8 0,3 3,41 8,3 9,3 0,99 5 9,2 0,4 4,35 8,8 9,7 5 8,9 0,3 3,37 8,7 9,3 Tal B MD mesiodistal diameter; BL buccolingual diameter; S.D. standart deviation; C.V. coefficient of variation; S.D.E.R. sexual dimorphism estimated ratio; Ant B anterior (trigon) breadth; Post B posterior (talon) breadth; Tri B trigonid breadth; Tal B talonid breadth.
 and the talon (talonid) were taken in this manner (after Swindler, 2002).")
93 18 NOTE: Maximum buccolingual diameter measured at a right angle to the mesiodistal dimension. The breadths of both the trigon (trigonid) and the talon (talonid) were taken in this manner (after Swindler, 2002). Sources of dental measurements: Gorilla gorilla, Pan troglodytes & Pan paniscus Swindler, 2002; Homo sapiens (Negro, S. Africa, contemporary) Kieser, 1990; O. macedoniensis Koufos, 1993; Koufos, 1995; Koufos & de Bonis Sexual dimorphism ratio (S.D.E.R.) was estimated by formula M F: [Mean ] [Mean ]. The ratio scales linearly when >, but when > all sexual dimorphism is condensed into the range 1.00 to 0 and therefore is non-linear (Smith, 1999; Ruff, 2010). Figure 1.2 Cranium TM , a, Facial view; b, Lateral view; c, Superior view; d, Inferior view. e, RI 1 (TM ) lingual view; f, mandible (right) (TM ) occlusal view; g, R C (TM ) distal view & buccal view (after Brunet et al., 2002).

94 Figure 1.3 Orrorin tugenensis nov. gen. nov. sp. A: BAR 1002_00, left femur, posterior view; B: BAR 1002_00, left femur, anterior view; C: BAR 1000_00, right mandibular fragment with M3, buccal view; D: BAR 1000_00, left mandibular fragment with M2 3, lingual view; E: BAR 1000_00, left mandibular fragment with M2 3, occlusal view; F: BAR 1900_00, right M3, occlusal view; G: BAR 1390_00, right P4, distal view; H: BAR 1001_00, upper I1, labial view; I: BAR 1425_00, right C, lingual view; J: BAR 1004_00, right distal humerus, posterior view; K: BAR 1003_00, proximal left femur, anterior view; L: BAR 349_00, manual proximal phalanx, superior view; M: BAR 1426_00, left M3, distal view; N: BAR 1215_00, fragmentary right proximal femur, posterior view. Scale bars = 1 cm. (after Senut et al., 2001).

95 Figure 1.4 Ardipithecus kadabba fossil remains from the Late Miocene Middle Awash deposits. a, ALAVP-2/10, mandible and all associated teeth; ALA-VP-2/120, ulna and humerus shaft; ALA-VP-2/11, hand phalanx. b, AME-VP-1/71, lateral, plantar and dorsal views of foot phalanx. c, STD-VP-2, teeth and partial clavicle. d, DID-VP-1/80, hand phalanx. e, ASKVP-3/160, occlusal, mesial and buccal views; ASK-VP-3/78, posterior view. All images are at the same scale. Scale bar, 1 cm, (after Haile-Selassie, 2001). 20


96 Figure 2.0 (after Berger et. al., 2010) Figure 1.6 The ARA-VP-6/500 partial skeleton. This is a approximate position of the fossils recovered. Some pieces found separately in the excavation are rejoined here. Intermediate and terminal phalanges are only provisionally allocated to position and side (after White et al., 2009a)
97 22 Table 3. Calculation process of Best Fit for for Extant and Fossil Hominids Maxillary I 1 G. gorilla P. troglodytes P. paniscus H. sapiens 2,0 of s.d. 0,96 1,82 1,60 1,20 1,9 of s.d 0,91 1,73 1,52 1,14 1,8 of s.d. 0,86 1,64 1,44 1,08 1,7 of s.d. 0,82 1,55 1,36 1,02 1,6 of s.d. 0,77 1,46 1,28 0,96 1,5 of s.d. 0,72 1,37 1,20 0,90 1,4 of s.d. 0,67 1,27 1,12 0,84 1,3 of s.d. 0,62 1,18 1,04 0,78 1,2 of s.d. 0,58 1,09 0,96 0,72 1,1 of s.d. 0,53 1,00 0,88 0,66 1 s.d. 0,48 0,91 0,80 0,60 0,9 of s.d 0,43 0,82 0,72 0,54 0,8 of s.d 0,38 0,73 0,64 0,48 0,7 of s.d. 0,34 0,64 0,56 0,42 0,6 of s.d 0,29 0,55 0,48 0,36 0,5 of s.d. 0,24 0,46 0,40 0,30 0,4 of s.d 0,19 0,36 0,32 0,24 0,3 of s.d. 0,14 0,27 0,24 0,18 0,2 of s.d 0,10 0,18 0,16 0,12 0,1 of s.d. 0,05 0,09 0,08 0,06 MD MEAN 14,70 12,60 10,30 9,31 MEAN (pooled) 14,20 12,10 10,40 9,02 MEAN 14,00 11,90 10,40 8,70 Estm. MEAN 14,68 12,56 10,48 9,26 Estm. MEAN 14,01 11,92 10,32 8,72 I 2 G. gorilla P. troglodytes P. paniscus H. sapiens 2,0 of s.d. 1,98 1,68 1,4 1,54 1,9 of s.d 1,88 1,60 1,33 1,46 1,8 of s.d. 1,78 1,51 1,26 1,39 1,7 of s.d. 1,68 1,43 1,19 1,31 1,6 of s.d. 1,58 1,34 1,12 1,23 1,5 of s.d. 1,49 1,26 1,05 1,16 1,4 of s.d. 1,39 1,18 0,98 1,08 1,3 of s.d. 1,29 1,09 0,91 1,00 1,2 of s.d. 1,19 1,01 0,84 0,92 1,1 of s.d. 1,09 0,92 0,77 0,85 1 s.d. 0,99 0,84 0,70 0,77 0,9 of s.d 0,89 0,76 0,63 0,69 0,8 of s.d 0,79 0,67 0,56 0,62 0,7 of s.d. 0,69 0,59 0,49 0,54
98 23 0,6 of s.d 0,59 0,50 0,42 0,46 0,5 of s.d. 0,50 0,42 0,35 0,39 0,4 of s.d 0,40 0,34 0,28 0,31 0,3 of s.d. 0,30 0,25 0,21 0,23 0,2 of s.d 0,20 0,17 0,14 0,15 0,1 of s.d. 0,10 0,08 0,07 0,08 MEAN 10,8 9,3 7,9 7,6 MEAN (pooled) 10,1 8,9 7,9 7,3 MEAN 9,9 8,8 7,9 6,9 Estm. MEAN 10,79 9,32 7,97 7,60 Estm. MEAN 9,90 8,82 7,83 7,21 C - G. gorilla P. troglodytes P. paniscus H. sapiens O. macedoniensis 2,0 of s.d. 6,76 4,48 2,54 0,8 2,24 1,9 of s.d 6,42 4,26 2,41 0,76 2,13 1,8 of s.d. 6,08 4,03 2,29 0,72 2,02 1,7 of s.d. 5,75 3,81 2,16 0,68 1,90 1,6 of s.d. 5,41 3,58 2,03 0,64 1,79 1,5 of s.d. 5,07 3,36 1,91 0,60 1,68 1,4 of s.d. 4,73 3,14 1,78 0,56 1,57 1,3 of s.d. 4,39 2,91 1,65 0,52 1,46 1,2 of s.d. 4,06 2,69 1,52 0,48 1,34 1,1 of s.d. 3,72 2,46 1,40 0,44 1,23 1 s.d. 3,38 2,24 1,27 0,40 1,12 0,9 of s.d 3,04 2,02 1,14 0,36 1,01 0,8 of s.d 2,70 1,79 1,02 0,32 0,90 0,7 of s.d. 2,37 1,57 0,89 0,28 0,78 0,6 of s.d 2,03 1,34 0,76 0,24 0,67 0,5 of s.d. 1,69 1,12 0,64 0,20 0,56 0,4 of s.d 1,35 0,90 0,51 0,16 0,45 0,3 of s.d. 1,01 0,67 0,38 0,12 0,34 0,2 of s.d 0,68 0,45 0,25 0,08 0,22 0,1 of s.d. 0,34 0,22 0,13 0,04 0,11 MEAN 21,40 15,00 11,10 8,12 MEAN (pooled) 17,30 12,70 10,00 8,03 12,8 MEAN 15,00 11,70 9,00 7,92 12,8 Estm. MEAN 21,36 14,94 11,14 8,11 Estm. MEAN 14,93 11,80 8,98 7,91 12,65 P 3 G. gorilla P. troglodytes P. paniscus H. sapiens O. macedoniensis 2,0 of s.d. 1,72 1,82 0,98 0,98 1,48 1,9 of s.d 1,63 1,73 0,93 0,93 1,41 1,8 of s.d. 1,55 1,64 0,88 0,88 1,33 1,7 of s.d. 1,46 1,55 0,83 0,83 1,26 1,6 of s.d. 1,38 1,46 0,78 0,78 1,18
99 24 1,5 of s.d. 1,29 1,37 0,74 0,74 1,11 1,4 of s.d. 1,20 1,27 0,69 0,69 1,04 1,3 of s.d. 1,12 1,18 0,64 0,64 0,96 1,2 of s.d. 1,03 1,09 0,59 0,59 0,89 1,1 of s.d. 0,95 1,00 0,54 0,54 0,81 1 s.d. 0,86 0,91 0,49 0,49 0,74 0,9 of s.d 0,77 0,82 0,44 0,44 0,67 0,8 of s.d 0,69 0,73 0,39 0,39 0,59 0,7 of s.d. 0,60 0,64 0,34 0,34 0,52 0,6 of s.d 0,52 0,55 0,29 0,29 0,44 0,5 of s.d. 0,43 0,46 0,25 0,25 0,37 0,4 of s.d 0,34 0,36 0,20 0,20 0,30 0,3 of s.d. 0,26 0,27 0,15 0,15 0,22 0,2 of s.d 0,17 0,18 0,10 0,10 0,15 0,1 of s.d. 0,09 0,09 0,05 0,05 0,07 MEAN 12,40 8,20 7,40 7,66 9,5 MEAN (pooled) 11,80 8,10 7,30 7,62 8,7 MEAN 11,60 8,10 7,20 7,57 8,5 Estm. MEAN 12,40 8,19 7,40 7,67 9,47 Estm. MEAN 11,63 8,01 7,20 7,57 8,51 P 4 G. gorilla P. troglodytes P. paniscus H. sapiens O. macedoniensis 2,0 of s.d. 1,5 1,76 1 0,92 1,68 1,9 of s.d 1,43 1,67 0,95 0,87 1,60 1,8 of s.d. 1,35 1,58 0,90 0,83 1,51 1,7 of s.d. 1,28 1,50 0,85 0,78 1,43 1,6 of s.d. 1,20 1,41 0,80 0,74 1,34 1,5 of s.d. 1,13 1,32 0,75 0,69 1,26 1,4 of s.d. 1,05 1,23 0,70 0,64 1,18 1,3 of s.d. 0,98 1,14 0,65 0,60 1,09 1,2 of s.d. 0,90 1,06 0,60 0,55 1,01 1,1 of s.d. 0,83 0,97 0,55 0,51 0,92 1 s.d. 0,75 0,88 0,50 0,46 0,84 0,9 of s.d 0,68 0,79 0,45 0,41 0,76 0,8 of s.d 0,60 0,70 0,40 0,37 0,67 0,7 of s.d. 0,53 0,62 0,35 0,32 0,59 0,6 of s.d 0,45 0,53 0,30 0,28 0,50 0,5 of s.d. 0,38 0,44 0,25 0,23 0,42 0,4 of s.d 0,30 0,35 0,20 0,18 0,34 0,3 of s.d. 0,23 0,26 0,15 0,14 0,25 0,2 of s.d 0,15 0,18 0,10 0,09 0,17 0,1 of s.d. 0,08 0,09 0,05 0,05 0,08 MEAN 12,20 7,20 6,30 7,43 9,4 MEAN (pooled) 11,40 7,20 6,20 7,36 8,6 MEAN 11,00 7,20 6,10 7,28 8,4 Estm. MEAN 12,23 7,29 6,30 7,45 9,42 Estm. MEAN 11,03 7,11 6,10 7,27 8,41
100 25 M 1 G. gorilla P. troglodytes P. paniscus H. sapiens O. macedoniensis 2,0 of s.d. 1,8 1,36 1 1,18 1,92 1,9 of s.d 1,71 1,29 0,95 1,12 1,82 1,8 of s.d. 1,62 1,22 0,90 1,06 1,73 1,7 of s.d. 1,53 1,16 0,85 1,00 1,63 1,6 of s.d. 1,44 1,09 0,80 0,94 1,54 1,5 of s.d. 1,35 1,02 0,75 0,89 1,44 1,4 of s.d. 1,26 0,95 0,70 0,83 1,34 1,3 of s.d. 1,17 0,88 0,65 0,77 1,25 1,2 of s.d. 1,08 0,82 0,60 0,71 1,15 1,1 of s.d. 0,99 0,75 0,55 0,65 1,06 1 s.d. 0,90 0,68 0,50 0,59 0,96 0,9 of s.d 0,81 0,61 0,45 0,53 0,86 0,8 of s.d 0,72 0,54 0,40 0,47 0,77 0,7 of s.d. 0,63 0,48 0,35 0,41 0,67 0,6 of s.d 0,54 0,41 0,30 0,35 0,58 0,5 of s.d. 0,45 0,34 0,25 0,30 0,48 0,4 of s.d 0,36 0,27 0,20 0,24 0,38 0,3 of s.d. 0,27 0,20 0,15 0,18 0,29 0,2 of s.d 0,18 0,14 0,10 0,12 0,19 0,1 of s.d. 0,09 0,07 0,05 0,06 0,10 MEAN 15,50 10,30 8,50 11,24 13,7 MEAN (pooled) 15,00 10,20 8,40 11,15 12,8 MEAN 14,80 10,10 8,30 11,04 12,4 Estm. MEAN 15,54 10,34 8,50 11,27 13,73 Estm. MEAN 14,82 10,13 8,30 11,03 12,39 M 2 G. gorilla P. troglodytes P. paniscus H. sapiens O. macedoniensis 2,0 of s.d. 2,06 1,4 1,4 1,08 2,50 1,9 of s.d 1,96 1,33 1,33 1,03 2,38 1,8 of s.d. 1,85 1,26 1,26 0,97 2,25 1,7 of s.d. 1,75 1,19 1,19 0,92 2,13 1,6 of s.d. 1,65 1,12 1,12 0,86 2,00 1,5 of s.d. 1,55 1,05 1,05 0,81 1,88 1,4 of s.d. 1,44 0,98 0,98 0,76 1,75 1,3 of s.d. 1,34 0,91 0,91 0,70 1,63 1,2 of s.d. 1,24 0,84 0,84 0,65 1,50 1,1 of s.d. 1,13 0,77 0,77 0,59 1,38 1 s.d. 1,03 0,70 0,70 0,54 1,25 0,9 of s.d 0,93 0,63 0,63 0,49 1,13 0,8 of s.d 0,82 0,56 0,56 0,43 1,00 0,7 of s.d. 0,72 0,49 0,49 0,38 0,88 0,6 of s.d 0,62 0,42 0,42 0,32 0,75 0,5 of s.d. 0,52 0,35 0,35 0,27 0,63 0,4 of s.d 0,41 0,28 0,28 0,22 0,50 0,3 of s.d. 0,31 0,21 0,21 0,16 0,38 0,2 of s.d 0,21 0,14 0,14 0,11 0,25 0,1 of s.d. 0,10 0,07 0,07 0,05 0,13
101 26 MEAN 17,5 10,4 8,4 10,95 15,6 MEAN (pooled) 16,4 10,2 8,4 10,83 14,6 MEAN 16 10,1 8,4 10,7 14,2 Estm. MEAN 17,53 10,41 8,47 10,94 15,58 Estm. MEAN 15,99 10,13 8,33 10,72 14,21 I 1 G. gorilla P. troglodytes P. paniscus H. sapiens 2,0 of s.d. 1,36 1, ,9 of s.d 1,29 1,56 0,95 0,95 1,8 of s.d. 1,22 1,48 0,90 0,90 1,7 of s.d. 1,16 1,39 0,85 0,85 1,6 of s.d. 1,09 1,31 0,80 0,80 1,5 of s.d. 1,02 1,23 0,75 0,75 1,4 of s.d. 0,95 1,15 0,70 0,70 1,3 of s.d. 0,88 1,07 0,65 0,65 1,2 of s.d. 0,82 0,98 0,60 0,60 1,1 of s.d. 0,75 0,90 0,55 0,55 1 s.d. 0,68 0,82 0,50 0,50 0,9 of s.d 0,61 0,74 0,45 0,45 0,8 of s.d 0,54 0,66 0,40 0,40 0,7 of s.d. 0,48 0,57 0,35 0,35 0,6 of s.d 0,41 0,49 0,30 0,30 0,5 of s.d. 0,34 0,41 0,25 0,25 0,4 of s.d 0,27 0,33 0,20 0,20 0,3 of s.d. 0,20 0,25 0,15 0,15 0,2 of s.d 0,14 0,16 0,10 0,10 0,1 of s.d. 0,07 0,08 0,05 0,05 BL MEAN 11,6 10,1 7,9 7,56 MEAN (pooled) 10,6 9,9 7,7 7,5 MEAN 10,3 9,6 7,6 7,39 Estm. MEAN 11,62 9,98 7,90 7,55 Estm. MEAN 10,33 9,57 7,60 7,40 I 2 G. gorilla P. troglodytes P. paniscus H. sapiens 2,0 of s.d. 1,68 1,52 0,98 1,28 1,9 of s.d 1,60 1,44 0,93 1,22 1,8 of s.d. 1,51 1,37 0,88 1,15 1,7 of s.d. 1,43 1,29 0,83 1,09 1,6 of s.d. 1,34 1,22 0,78 1,02 1,5 of s.d. 1,26 1,14 0,74 0,96 1,4 of s.d. 1,18 1,06 0,69 0,90 1,3 of s.d. 1,09 0,99 0,64 0,83 1,2 of s.d. 1,01 0,91 0,59 0,77 1,1 of s.d. 0,92 0,84 0,54 0,70 1 s.d. 0,84 0,76 0,49 0,64
102 27 0,9 of s.d 0,76 0,68 0,44 0,58 0,8 of s.d 0,67 0,61 0,39 0,51 0,7 of s.d. 0,59 0,53 0,34 0,45 0,6 of s.d 0,50 0,46 0,29 0,38 0,5 of s.d. 0,42 0,38 0,25 0,32 0,4 of s.d 0,34 0,30 0,20 0,26 0,3 of s.d. 0,25 0,23 0,15 0,19 0,2 of s.d 0,17 0,15 0,10 0,13 0,1 of s.d. 0,08 0,08 0,05 0,06 MEAN 10,10 9,20 7,30 7,10 MEAN (pooled) 9,60 9,00 7,20 6,88 MEAN 9,40 8,90 7,10 6,62 Estm. MEAN 10,10 9,23 7,30 7,07 Estm. MEAN 9,43 8,92 7,10 6,62 C - G. gorilla P. troglodytes P. paniscus H. sapiens O. macedoniensis 2,0 of s.d. 4,98 3,6 2,26 1,2 2,80 1,9 of s.d 4,73 3,42 2,15 1,14 2,66 1,8 of s.d. 4,48 3,24 2,03 1,08 2,52 1,7 of s.d. 4,23 3,06 1,92 1,02 2,38 1,6 of s.d. 3,98 2,88 1,81 0,96 2,24 1,5 of s.d. 3,74 2,70 1,70 0,90 2,10 1,4 of s.d. 3,49 2,52 1,58 0,84 1,96 1,3 of s.d. 3,24 2,34 1,47 0,78 1,82 1,2 of s.d. 2,99 2,16 1,36 0,72 1,68 1,1 of s.d. 2,74 1,98 1,24 0,66 1,54 1 s.d. 2,49 1,80 1,13 0,60 1,40 0,9 of s.d 2,24 1,62 1,02 0,54 1,26 0,8 of s.d 1,99 1,44 0,90 0,48 1,12 0,7 of s.d. 1,74 1,26 0,79 0,42 0,98 0,6 of s.d 1,49 1,08 0,68 0,36 0,84 0,5 of s.d. 1,25 0,90 0,57 0,30 0,70 0,4 of s.d 1,00 0,72 0,45 0,24 0,56 0,3 of s.d. 0,75 0,54 0,34 0,18 0,42 0,2 of s.d 0,50 0,36 0,23 0,12 0,28 0,1 of s.d. 0,25 0,18 0,11 0,06 0,14 MEAN 16,00 12,00 8,80 8,87 MEAN (pooled) 13,20 10,30 7,80 8,68 12,4 MEAN 11,30 9,50 6,90 8,44 12,4 Estm. MEAN 15,94 11,92 8,82 8,86 Estm. MEAN 11,21 9,58 6,90 8,44 12,08 P 3 G. gorilla P. troglodytes P. paniscus H. sapiens O. macedoniensis 2,0 of s.d. 1,22 1,92 0,96 1,18 1,66 1,9 of s.d 1,16 1,82 0,91 1,12 1,58
103 28 1,8 of s.d. 1,10 1,73 0,86 1,06 1,49 1,7 of s.d. 1,04 1,63 0,82 1,00 1,41 1,6 of s.d. 0,98 1,54 0,77 0,94 1,33 1,5 of s.d. 0,92 1,44 0,72 0,89 1,25 1,4 of s.d. 0,85 1,34 0,67 0,83 1,16 1,3 of s.d. 0,79 1,25 0,62 0,77 1,08 1,2 of s.d. 0,73 1,15 0,58 0,71 1,00 1,1 of s.d. 0,67 1,06 0,53 0,65 0,91 1 s.d. 0,61 0,96 0,48 0,59 0,83 0,9 of s.d 0,55 0,86 0,43 0,53 0,75 0,8 of s.d 0,49 0,77 0,38 0,47 0,66 0,7 of s.d. 0,43 0,67 0,34 0,41 0,58 0,6 of s.d 0,37 0,58 0,29 0,35 0,50 0,5 of s.d. 0,31 0,48 0,24 0,30 0,42 0,4 of s.d 0,24 0,38 0,19 0,24 0,33 0,3 of s.d. 0,18 0,29 0,14 0,18 0,25 0,2 of s.d 0,12 0,19 0,10 0,12 0,17 0,1 of s.d. 0,06 0,10 0,05 0,06 0,08 MEAN 15,80 10,50 9,30 9,83 12,2 MEAN (pooled) 15,10 10,10 9,20 9,66 12,5 MEAN 14,80 9,90 9,20 9,46 12,6 Estm. MEAN 15,83 10,48 9,30 9,84 12,63 Estm. MEAN 14,80 9,91 9,15 9,48 12,21 P 4 G. gorilla P. troglodytes P. paniscus H. sapiens O. macedoniensis 2,0 of s.d. 1,24 1,74 0,98 1,46 1,40 1,9 of s.d 1,18 1,65 0,93 1,39 1,33 1,8 of s.d. 1,12 1,57 0,88 1,31 1,26 1,7 of s.d. 1,05 1,48 0,83 1,24 1,19 1,6 of s.d. 0,99 1,39 0,78 1,17 1,12 1,5 of s.d. 0,93 1,31 0,74 1,10 1,05 1,4 of s.d. 0,87 1,22 0,69 1,02 0,98 1,3 of s.d. 0,81 1,13 0,64 0,95 0,91 1,2 of s.d. 0,74 1,04 0,59 0,88 0,84 1,1 of s.d. 0,68 0,96 0,54 0,80 0,77 1 s.d. 0,62 0,87 0,49 0,73 0,70 0,9 of s.d 0,56 0,78 0,44 0,66 0,63 0,8 of s.d 0,50 0,70 0,39 0,58 0,56 0,7 of s.d. 0,43 0,61 0,34 0,51 0,49 0,6 of s.d 0,37 0,52 0,29 0,44 0,42 0,5 of s.d. 0,31 0,44 0,25 0,37 0,35 0,4 of s.d 0,25 0,35 0,20 0,29 0,28 0,3 of s.d. 0,19 0,26 0,15 0,22 0,21 0,2 of s.d 0,12 0,17 0,10 0,15 0,14 0,1 of s.d. 0,06 0,09 0,05 0,07 0,07 MEAN 15,20 10,50 9,00 9,82 13,2 MEAN (pooled) 14,60 10,00 8,90 9,60 13,4 MEAN 14,40 9,80 8,80 9,26 13,4
104 29 Estm. MEAN 15,22 10,52 9,00 9,82 13,42 Estm. MEAN 14,41 9,83 8,80 9,24 13,28 M 1 G. gorilla P. troglodytes P. paniscus H. sapiens O. macedoniensis 2,0 of s.d. 2,2 2 0,8 1,22 1,14 1,9 of s.d 2,09 1,90 0,76 1,16 1,08 1,8 of s.d. 1,98 1,80 0,72 1,10 1,03 1,7 of s.d. 1,87 1,70 0,68 1,04 0,97 1,6 of s.d. 1,76 1,60 0,64 0,98 0,91 1,5 of s.d. 1,65 1,50 0,60 0,92 0,86 1,4 of s.d. 1,54 1,40 0,56 0,85 0,80 1,3 of s.d. 1,43 1,30 0,52 0,79 0,74 1,2 of s.d. 1,32 1,20 0,48 0,73 0,68 1,1 of s.d. 1,21 1,10 0,44 0,67 0,63 1 s.d. 1,10 1,00 0,40 0,61 0,57 0,9 of s.d 0,99 0,90 0,36 0,55 0,51 0,8 of s.d 0,88 0,80 0,32 0,49 0,46 0,7 of s.d. 0,77 0,70 0,28 0,43 0,40 0,6 of s.d 0,66 0,60 0,24 0,37 0,34 0,5 of s.d. 0,55 0,50 0,20 0,31 0,29 0,4 of s.d 0,44 0,40 0,16 0,24 0,23 0,3 of s.d. 0,33 0,30 0,12 0,18 0,17 0,2 of s.d 0,22 0,20 0,08 0,12 0,11 0,1 of s.d. 0,11 0,10 0,04 0,06 0,06 MEAN 15,40 11,70 9,50 11,80 14,8 MEAN (pooled) 15,10 11,10 9,60 11,69 14,4 MEAN 15,00 10,90 9,70 11,56 14,2 Estm. MEAN 15,43 11,70 9,64 11,81 14,83 Estm. MEAN 14,99 10,90 9,56 11,57 14,20 M 2 G. gorilla P. troglodytes P. paniscus H. sapiens O. macedoniensis 2,0 of s.d. 1,66 1,9 0,8 1 1,78 1,9 of s.d 1,58 1,81 0,76 0,95 1,69 1,8 of s.d. 1,49 1,71 0,72 0,90 1,60 1,7 of s.d. 1,41 1,62 0,68 0,85 1,51 1,6 of s.d. 1,33 1,52 0,64 0,80 1,42 1,5 of s.d. 1,25 1,43 0,60 0,75 1,34 1,4 of s.d. 1,16 1,33 0,56 0,70 1,25 1,3 of s.d. 1,08 1,24 0,52 0,65 1,16 1,2 of s.d. 1,00 1,14 0,48 0,60 1,07 1,1 of s.d. 0,91 1,05 0,44 0,55 0,98 1 s.d. 0,83 0,95 0,40 0,50 0,89 0,9 of s.d 0,75 0,86 0,36 0,45 0,80 0,8 of s.d 0,66 0,76 0,32 0,40 0,71 0,7 of s.d. 0,58 0,67 0,28 0,35 0,62 0,6 of s.d 0,50 0,57 0,24 0,30 0,53 0,5 of s.d. 0,42 0,48 0,20 0,25 0,45 0,4 of s.d 0,33 0,38 0,16 0,20 0,36
105 30 0,3 of s.d. 0,25 0,29 0,12 0,15 0,27 0,2 of s.d 0,17 0,19 0,08 0,10 0,18 0,1 of s.d. 0,08 0,10 0,04 0,05 0,09 MEAN 16, ,2 11,9 16,5 MEAN (pooled) 16,1 11,4 10,2 11,79 15,8 MEAN 15,8 11,1 10,2 11,66 15,5 Estm. MEAN 16,93 11,97 10,24 11,89 16,48 Estm. MEAN 15,77 11,12 10,16 11,69 15,51 Mandibular MD I1 G. gorilla P. troglodytes P. paniscus H. sapiens O. macedoniensis 2,0 of s.d. 0,56 1,56 1,4 1 3,12 1,9 of s.d 0,53 1,48 1,33 0,95 2,96 1,8 of s.d. 0,50 1,40 1,26 0,90 2,81 1,7 of s.d. 0,48 1,33 1,19 0,85 2,65 1,6 of s.d. 0,45 1,25 1,12 0,80 2,50 1,5 of s.d. 0,42 1,17 1,05 0,75 2,34 1,4 of s.d. 0,39 1,09 0,98 0,70 2,18 1,3 of s.d. 0,36 1,01 0,91 0,65 2,03 1,2 of s.d. 0,34 0,94 0,84 0,60 1,87 1,1 of s.d. 0,31 0,86 0,77 0,55 1,72 1 s.d. 0,28 0,78 0,70 0,50 1,56 0,9 of s.d 0,25 0,70 0,63 0,45 1,40 0,8 of s.d 0,22 0,62 0,56 0,40 1,25 0,7 of s.d. 0,20 0,55 0,49 0,35 1,09 0,6 of s.d 0,17 0,47 0,42 0,30 0,94 0,5 of s.d. 0,14 0,39 0,35 0,25 0,78 0,4 of s.d 0,11 0,31 0,28 0,20 0,62 0,3 of s.d. 0,08 0,23 0,21 0,15 0,47 0,2 of s.d 0,06 0,16 0,14 0,10 0,31 0,1 of s.d. 0,03 0,08 0,07 0,05 0,16 MEAN 7,9 8,3 7,4 5,43 7,6 MEAN (pooled) 8 8,1 7,3 5,45 6,5 MEAN 8 8 7,2 5,48 5,2 Estm. MEAN 8,03 8,33 7,44 5,50 7,60 Estm. MEAN 7,97 8,02 7,23 5,40 5,26 I2 G. gorilla P. troglodytes P. paniscus H. sapiens O. macedoniensis 2,0 of s.d. 1,62 1,4 1,44 1,1 3,10 1,9 of s.d 1,54 1,33 1,37 1,05 2,95 1,8 of s.d. 1,46 1,26 1,30 0,99 2,79 1,7 of s.d. 1,38 1,19 1,22 0,94 2,64 1,6 of s.d. 1,30 1,12 1,15 0,88 2,48
106 31 1,5 of s.d. 1,22 1,05 1,08 0,83 2,33 1,4 of s.d. 1,13 0,98 1,01 0,77 2,17 1,3 of s.d. 1,05 0,91 0,94 0,72 2,02 1,2 of s.d. 0,97 0,84 0,86 0,66 1,86 1,1 of s.d. 0,89 0,77 0,79 0,61 1,71 1 s.d. 0,81 0,70 0,72 0,55 1,55 0,9 of s.d 0,73 0,63 0,65 0,50 1,40 0,8 of s.d 0,65 0,56 0,58 0,44 1,24 0,7 of s.d. 0,57 0,49 0,50 0,39 1,09 0,6 of s.d 0,49 0,42 0,43 0,33 0,93 0,5 of s.d. 0,41 0,35 0,36 0,28 0,78 0,4 of s.d 0,32 0,28 0,29 0,22 0,62 0,3 of s.d. 0,24 0,21 0,22 0,17 0,47 0,2 of s.d 0,16 0,14 0,14 0,11 0,31 0,1 of s.d. 0,08 0,07 0,07 0,06 0,16 MEAN 10,2 8,9 7,5 6,43 8,5 MEAN (pooled) 10,2 8,5 7,4 6,28 7,8 MEAN 10,2 8,4 7,3 6,11 7,3 Estm. MEAN 10,28 8,92 7,54 6,45 8,55 Estm. MEAN 10,04 8,43 7,33 6,12 7,31 C- G. gorilla P. troglodytes P. paniscus H. sapiens O. macedoniensis 2,0 of s.d. 6,1 3,66 1,8 0,9 3,44 1,9 of s.d 5,80 3,48 1,71 0,86 3,27 1,8 of s.d. 5,49 3,29 1,62 0,81 3,10 1,7 of s.d. 5,19 3,11 1,53 0,77 2,92 1,6 of s.d. 4,88 2,93 1,44 0,72 2,75 1,5 of s.d. 4,58 2,75 1,35 0,68 2,58 1,4 of s.d. 4,27 2,56 1,26 0,63 2,41 1,3 of s.d. 3,97 2,38 1,17 0,59 2,24 1,2 of s.d. 3,66 2,20 1,08 0,54 2,06 1,1 of s.d. 3,36 2,01 0,99 0,50 1,89 1 s.d. 3,05 1,83 0,90 0,45 1,72 0,9 of s.d 2,75 1,65 0,81 0,41 1,55 0,8 of s.d 2,44 1,46 0,72 0,36 1,38 0,7 of s.d. 2,14 1,28 0,63 0,32 1,20 0,6 of s.d 1,83 1,10 0,54 0,27 1,03 0,5 of s.d. 1,53 0,92 0,45 0,23 0,86 0,4 of s.d 1,22 0,73 0,36 0,18 0,69 0,3 of s.d. 0,92 0,55 0,27 0,14 0,52 0,2 of s.d 0,61 0,37 0,18 0,09 0,34 0,1 of s.d. 0,31 0,18 0,09 0,05 0,17 MEAN 16,9 12,7 10 7,57 10,4 MEAN (pooled) 14,5 11,1 9,3 7,45 9,2 MEAN 12 10,4 8,8 7,31 8,1 Estm. MEAN 16,94 12,75 10,02 7,59 10,38 Estm. MEAN 12,06 10,37 8,76 7,32 7,98
107 32 P3 G. gorilla P. troglodytes P. paniscus H. sapiens O. macedoniensis 2,0 of s.d. 2,58 2,06 0,8 0,98 1,88 1,9 of s.d 2,45 1,96 0,76 0,93 1,79 1,8 of s.d. 2,32 1,85 0,72 0,88 1,69 1,7 of s.d. 2,19 1,75 0,68 0,83 1,60 1,6 of s.d. 2,06 1,65 0,64 0,78 1,50 1,5 of s.d. 1,94 1,55 0,60 0,74 1,41 1,4 of s.d. 1,81 1,44 0,56 0,69 1,32 1,3 of s.d. 1,68 1,34 0,52 0,64 1,22 1,2 of s.d. 1,55 1,24 0,48 0,59 1,13 1,1 of s.d. 1,42 1,13 0,44 0,54 1,03 1 s.d. 1,29 1,03 0,40 0,49 0,94 0,9 of s.d 1,16 0,93 0,36 0,44 0,85 0,8 of s.d 1,03 0,82 0,32 0,39 0,75 0,7 of s.d. 0,90 0,72 0,28 0,34 0,66 0,6 of s.d 0,77 0,62 0,24 0,29 0,56 0,5 of s.d. 0,65 0,52 0,20 0,25 0,47 0,4 of s.d 0,52 0,41 0,16 0,20 0,38 0,3 of s.d. 0,39 0,31 0,12 0,15 0,28 0,2 of s.d 0,26 0,21 0,08 0,10 0,19 0,1 of s.d. 0,13 0,10 0,04 0,05 0,09 MEAN 16,9 10,2 8,1 7,88 11,4 MEAN (pooled) 15,6 10 8,2 7,77 10,4 MEAN 14,8 9,9 8,2 7,64 9,6 Estm. MEAN 16,89 10,21 8,24 7,87 11,43 Estm. MEAN 14,83 9,90 8,16 7,62 9,64 P4 G. gorilla P. troglodytes P. paniscus H. sapiens O. macedoniensis 2,0 of s.d. 1,46 1,38 1,4 1,06 2,04 1,9 of s.d 1,39 1,31 1,33 1,01 1,94 1,8 of s.d. 1,31 1,24 1,26 0,95 1,84 1,7 of s.d. 1,24 1,17 1,19 0,90 1,73 1,6 of s.d. 1,17 1,10 1,12 0,85 1,63 1,5 of s.d. 1,10 1,04 1,05 0,80 1,53 1,4 of s.d. 1,02 0,97 0,98 0,74 1,43 1,3 of s.d. 0,95 0,90 0,91 0,69 1,33 1,2 of s.d. 0,88 0,83 0,84 0,64 1,22 1,1 of s.d. 0,80 0,76 0,77 0,58 1,12 1 s.d. 0,73 0,69 0,70 0,53 1,02 0,9 of s.d 0,66 0,62 0,63 0,48 0,92 0,8 of s.d 0,58 0,55 0,56 0,42 0,82 0,7 of s.d. 0,51 0,48 0,49 0,37 0,71 0,6 of s.d 0,44 0,41 0,42 0,32 0,61 0,5 of s.d. 0,37 0,35 0,35 0,27 0,51 0,4 of s.d 0,29 0,28 0,28 0,21 0,41
108 33 0,3 of s.d. 0,22 0,21 0,21 0,16 0,31 0,2 of s.d 0,15 0,14 0,14 0,11 0,20 0,1 of s.d. 0,07 0,07 0,07 0,05 0,10 MEAN 11,8 7,8 7,1 7,92 10,5 MEAN (pooled) 11,5 7,6 7 7,87 9,5 MEAN 11,3 7,5 7 7,8 8,7 Estm. MEAN 11,79 7,81 7,07 7,92 10,51 Estm. MEAN 11,35 7,53 6,93 7,82 8,67 M1 G. gorilla P. troglodytes P. paniscus H. sapiens O. macedoniensis 2,0 of s.d. 1,76 1,24 1,2 1,08 2,96 1,9 of s.d 1,67 1,18 1,14 1,03 2,81 1,8 of s.d. 1,58 1,12 1,08 0,97 2,66 1,7 of s.d. 1,50 1,05 1,02 0,92 2,52 1,6 of s.d. 1,41 0,99 0,96 0,86 2,37 1,5 of s.d. 1,32 0,93 0,90 0,81 2,22 1,4 of s.d. 1,23 0,87 0,84 0,76 2,07 1,3 of s.d. 1,14 0,81 0,78 0,70 1,92 1,2 of s.d. 1,06 0,74 0,72 0,65 1,78 1,1 of s.d. 0,97 0,68 0,66 0,59 1,63 1 s.d. 0,88 0,62 0,60 0,54 1,48 0,9 of s.d 0,79 0,56 0,54 0,49 1,33 0,8 of s.d 0,70 0,50 0,48 0,43 1,18 0,7 of s.d. 0,62 0,43 0,42 0,38 1,04 0,6 of s.d 0,53 0,37 0,36 0,32 0,89 0,5 of s.d. 0,44 0,31 0,30 0,27 0,74 0,4 of s.d 0,35 0,25 0,24 0,22 0,59 0,3 of s.d. 0,26 0,19 0,18 0,16 0,44 0,2 of s.d 0,18 0,12 0,12 0,11 0,30 0,1 of s.d. 0,09 0,06 0,06 0,05 0,15 MEAN 16,2 11 9,1 11,81 15,1 MEAN (pooled) 15,7 10,9 9,3 11,71 13,6 MEAN 15,4 10,8 9,5 11,6 12,4 Estm. MEAN 16,23 11,02 9,36 11,82 15,11 Estm. MEAN 15,44 10,78 9,24 11,60 12,44 M2 G. gorilla P. troglodytes P. paniscus H. sapiens O. macedoniensis 2,0 of s.d. 2,02 1,48 0,8 1,18 2,68 1,9 of s.d 1,92 1,41 0,76 1,12 2,55 1,8 of s.d. 1,82 1,33 0,72 1,06 2,41 1,7 of s.d. 1,72 1,26 0,68 1,00 2,28 1,6 of s.d. 1,62 1,18 0,64 0,94 2,14 1,5 of s.d. 1,52 1,11 0,60 0,89 2,01 1,4 of s.d. 1,41 1,04 0,56 0,83 1,88 1,3 of s.d. 1,31 0,96 0,52 0,77 1,74 1,2 of s.d. 1,21 0,89 0,48 0,71 1,61
109 34 1,1 of s.d. 1,11 0,81 0,44 0,65 1,47 1 s.d. 1,01 0,74 0,40 0,59 1,34 0,9 of s.d 0,91 0,67 0,36 0,53 1,21 0,8 of s.d 0,81 0,59 0,32 0,47 1,07 0,7 of s.d. 0,71 0,52 0,28 0,41 0,94 0,6 of s.d 0,61 0,44 0,24 0,35 0,80 0,5 of s.d. 0,51 0,37 0,20 0,30 0,67 0,4 of s.d 0,40 0,30 0,16 0,24 0,54 0,3 of s.d. 0,30 0,22 0,12 0,18 0,40 0,2 of s.d 0,20 0,15 0,08 0,12 0,27 0,1 of s.d. 0,10 0,07 0,04 0,06 0,13 MEAN 18,3 11,4 9,9 11,55 16,4 MEAN (pooled) 17,5 11,1 9,8 11,43 15,0 MEAN ,7 11,28 14,0 Estm. MEAN 18,31 11,40 9,88 11,55 16,38 Estm. MEAN 17,00 11,03 9,72 11,31 13,97 BL I1 G. gorilla P. troglodytes P. paniscus H. sapiens O. macedoniensis 2,0 of s.d. 1,26 1,72 0,8 0,84 1,36 1,9 of s.d 1,20 1,63 0,76 0,80 1,29 1,8 of s.d. 1,13 1,55 0,72 0,76 1,22 1,7 of s.d. 1,07 1,46 0,68 0,71 1,16 1,6 of s.d. 1,01 1,38 0,64 0,67 1,09 1,5 of s.d. 0,95 1,29 0,60 0,63 1,02 1,4 of s.d. 0,88 1,20 0,56 0,59 0,95 1,3 of s.d. 0,82 1,12 0,52 0,55 0,88 1,2 of s.d. 0,76 1,03 0,48 0,50 0,82 1,1 of s.d. 0,69 0,95 0,44 0,46 0,75 1 s.d. 0,63 0,86 0,40 0,42 0,68 0,9 of s.d 0,57 0,77 0,36 0,38 0,61 0,8 of s.d 0,50 0,69 0,32 0,34 0,54 0,7 of s.d. 0,44 0,60 0,28 0,29 0,48 0,6 of s.d 0,38 0,52 0,24 0,25 0,41 0,5 of s.d. 0,32 0,43 0,20 0,21 0,34 0,4 of s.d 0,25 0,34 0,16 0,17 0,27 0,3 of s.d. 0,19 0,26 0,12 0,13 0,20 0,2 of s.d 0,13 0,17 0,08 0,08 0,14 0,1 of s.d. 0,06 0,09 0,04 0,04 0,07 MEAN 9,7 9,7 7 6,2 7,6 MEAN (pooled) 9,1 9,2 6,9 6,09 7,4 MEAN 8,8 9,1 6,8 5,96 7,2 Estm. MEAN 9,73 9,72 7,02 6,22 7,63 Estm. MEAN 8,79 9,11 6,82 5,96 7,22
110 35 I2 G. gorilla P. troglodytes P. paniscus H. sapiens O. macedoniensis 2,0 of s.d. 1,2 1,78 0,8 0,74 3,26 1,9 of s.d 1,14 1,69 0,76 0,70 3,10 1,8 of s.d. 1,08 1,60 0,72 0,67 2,93 1,7 of s.d. 1,02 1,51 0,68 0,63 2,77 1,6 of s.d. 0,96 1,42 0,64 0,59 2,61 1,5 of s.d. 0,90 1,34 0,60 0,56 2,45 1,4 of s.d. 0,84 1,25 0,56 0,52 2,28 1,3 of s.d. 0,78 1,16 0,52 0,48 2,12 1,2 of s.d. 0,72 1,07 0,48 0,44 1,96 1,1 of s.d. 0,66 0,98 0,44 0,41 1,79 1 s.d. 0,60 0,89 0,40 0,37 1,63 0,9 of s.d 0,54 0,80 0,36 0,33 1,47 0,8 of s.d 0,48 0,71 0,32 0,30 1,30 0,7 of s.d. 0,42 0,62 0,28 0,26 1,14 0,6 of s.d 0,36 0,53 0,24 0,22 0,98 0,5 of s.d. 0,30 0,45 0,20 0,19 0,82 0,4 of s.d 0,24 0,36 0,16 0,15 0,65 0,3 of s.d. 0,18 0,27 0,12 0,11 0,49 0,2 of s.d 0,12 0,18 0,08 0,07 0,33 0,1 of s.d. 0,06 0,09 0,04 0,04 0,16 MEAN 10,9 10 7,1 6,56 8,9 MEAN (pooled) 10,4 9,6 7 6,51 7,9 MEAN 10,3 9,5 6,9 6,45 7,2 Estm. MEAN 10,88 10,05 7,12 6,55 8,92 Estm. MEAN 10,28 9,51 6,92 6,44 7,13 C- G. gorilla P. troglodytes P. paniscus H. sapiens O. macedoniensis 2,0 of s.d. 5,54 3,78 1,6 1,1 5,24 1,9 of s.d 5,26 3,59 1,52 1,05 4,98 1,8 of s.d. 4,99 3,40 1,44 0,99 4,72 1,7 of s.d. 4,71 3,21 1,36 0,94 4,45 1,6 of s.d. 4,43 3,02 1,28 0,88 4,19 1,5 of s.d. 4,16 2,84 1,20 0,83 3,93 1,4 of s.d. 3,88 2,65 1,12 0,77 3,67 1,3 of s.d. 3,60 2,46 1,04 0,72 3,41 1,2 of s.d. 3,32 2,27 0,96 0,66 3,14 1,1 of s.d. 3,05 2,08 0,88 0,61 2,88 1 s.d. 2,77 1,89 0,80 0,55 2,62 0,9 of s.d 2,49 1,70 0,72 0,50 2,36 0,8 of s.d 2,22 1,51 0,64 0,44 2,10 0,7 of s.d. 1,94 1,32 0,56 0,39 1,83 0,6 of s.d 1,66 1,13 0,48 0,33 1,57 0,5 of s.d. 1,39 0,95 0,40 0,28 1,31 0,4 of s.d 1,11 0,76 0,32 0,22 1,05 0,3 of s.d. 0,83 0,57 0,24 0,17 0,79 0,2 of s.d 0,55 0,38 0,16 0,11 0,52
111 36 0,1 of s.d. 0,28 0,19 0,08 0,06 0,26 MEAN 18,1 13 7,6 8,17 14,4 MEAN (pooled) 15,1 11,1 7 7,86 12,1 MEAN 13 10,2 6,5 7,48 9,7 Estm. MEAN 18,15 12,99 7,64 8,19 14,43 Estm. MEAN 12,88 10,16 6,52 7,48 9,72 P3 G. gorilla P. troglodytes P. paniscus H. sapiens O. macedoniensis 2,0 of s.d. 2,1 2,16 2 1,1 1,72 1,9 of s.d 2,00 2,05 1,90 1,05 1,63 1,8 of s.d. 1,89 1,94 1,80 0,99 1,55 1,7 of s.d. 1,79 1,84 1,70 0,94 1,46 1,6 of s.d. 1,68 1,73 1,60 0,88 1,38 1,5 of s.d. 1,58 1,62 1,50 0,83 1,29 1,4 of s.d. 1,47 1,51 1,40 0,77 1,20 1,3 of s.d. 1,37 1,40 1,30 0,72 1,12 1,2 of s.d. 1,26 1,30 1,20 0,66 1,03 1,1 of s.d. 1,16 1,19 1,10 0,61 0,95 1 s.d. 1,05 1,08 1,00 0,55 0,86 0,9 of s.d 0,95 0,97 0,90 0,50 0,77 0,8 of s.d 0,84 0,86 0,80 0,44 0,69 0,7 of s.d. 0,74 0,76 0,70 0,39 0,60 0,6 of s.d 0,63 0,65 0,60 0,33 0,52 0,5 of s.d. 0,53 0,54 0,50 0,28 0,43 0,4 of s.d 0,42 0,43 0,40 0,22 0,34 0,3 of s.d. 0,32 0,32 0,30 0,17 0,26 0,2 of s.d 0,21 0,22 0,20 0,11 0,17 0,1 of s.d. 0,11 0,11 0,10 0,06 0,09 MEAN 11,9 9,1 7,4 8,37 11,8 MEAN (pooled) 11,5 8,4 7,2 8,1 10,9 MEAN 11,2 8,1 7 7,82 10,2 Estm. MEAN 11,92 9,16 7,40 8,38 11,80 Estm. MEAN 11,19 8,08 7,00 7,83 10,25 P4 G. gorilla P. troglodytes P. paniscus H. sapiens O. macedoniensis 2,0 of s.d. 2,14 1,66 1,2 1,26 1,60 1,9 of s.d 2,03 1,58 1,14 1,20 1,52 1,8 of s.d. 1,93 1,49 1,08 1,13 1,44 1,7 of s.d. 1,82 1,41 1,02 1,07 1,36 1,6 of s.d. 1,71 1,33 0,96 1,01 1,28 1,5 of s.d. 1,61 1,25 0,90 0,95 1,20 1,4 of s.d. 1,50 1,16 0,84 0,88 1,12 1,3 of s.d. 1,39 1,08 0,78 0,82 1,04 1,2 of s.d. 1,28 1,00 0,72 0,76 0,96 1,1 of s.d. 1,18 0,91 0,66 0,69 0,88
112 37 1 s.d. 1,07 0,83 0,60 0,63 0,80 0,9 of s.d 0,96 0,75 0,54 0,57 0,72 0,8 of s.d 0,86 0,66 0,48 0,50 0,64 0,7 of s.d. 0,75 0,58 0,42 0,44 0,56 0,6 of s.d 0,64 0,50 0,36 0,38 0,48 0,5 of s.d. 0,54 0,42 0,30 0,32 0,40 0,4 of s.d 0,43 0,33 0,24 0,25 0,32 0,3 of s.d. 0,32 0,25 0,18 0,19 0,24 0,2 of s.d 0,21 0,17 0,12 0,13 0,16 0,1 of s.d. 0,11 0,08 0,06 0,06 0,08 MEAN 14,6 9,1 7,8 8,69 12,1 MEAN (pooled) 13,7 8,7 7,7 8,51 11,1 MEAN 13,3 8,5 7,6 8,3 10,5 Estm. MEAN 14,56 9,12 7,76 8,70 12,10 Estm. MEAN 13,27 8,53 7,64 8,32 10,50 M1 G. gorilla P. troglodytes P. paniscus H. sapiens O. macedoniensis 2,0 of s.d. 1,44 1,54 1,2 1,22 2,34 1,9 of s.d 1,37 1,46 1,14 1,16 2,22 1,8 of s.d. 1,30 1,39 1,08 1,10 2,11 1,7 of s.d. 1,22 1,31 1,02 1,04 1,99 1,6 of s.d. 1,15 1,23 0,96 0,98 1,87 1,5 of s.d. 1,08 1,16 0,90 0,92 1,76 1,4 of s.d. 1,01 1,08 0,84 0,85 1,64 1,3 of s.d. 0,94 1,00 0,78 0,79 1,52 1,2 of s.d. 0,86 0,92 0,72 0,73 1,40 1,1 of s.d. 0,79 0,85 0,66 0,67 1,29 1 s.d. 0,72 0,77 0,60 0,61 1,17 0,9 of s.d 0,65 0,69 0,54 0,55 1,05 0,8 of s.d 0,58 0,62 0,48 0,49 0,94 0,7 of s.d. 0,50 0,54 0,42 0,43 0,82 0,6 of s.d 0,43 0,46 0,36 0,37 0,70 0,5 of s.d. 0,36 0,39 0,30 0,31 0,59 0,4 of s.d 0,29 0,31 0,24 0,24 0,47 0,3 of s.d. 0,22 0,23 0,18 0,18 0,35 0,2 of s.d 0,14 0,15 0,12 0,12 0,23 0,1 of s.d. 0,07 0,08 0,06 0,06 0,12 MEAN 13,7 10,2 9 11,05 14,3 MEAN (pooled) 13,3 9,8 8,9 11,38 13,2 MEAN 13,2 9,6 8,8 11,77 12,3 Estm. MEAN 13,73 10,19 9,02 11,44 14,27 Estm. MEAN 13,23 9,57 8,78 11,32 12,28
113 38 M2 G. gorilla P. troglodytes P. paniscus H. sapiens O. macedoniensis 2,0 of s.d. 1,94 1,76 1 1,2 2,32 1,9 of s.d 1,84 1,67 0,95 1,14 2,20 1,8 of s.d. 1,75 1,58 0,90 1,08 2,09 1,7 of s.d. 1,65 1,50 0,85 1,02 1,97 1,6 of s.d. 1,55 1,41 0,80 0,96 1,86 1,5 of s.d. 1,46 1,32 0,75 0,90 1,74 1,4 of s.d. 1,36 1,23 0,70 0,84 1,62 1,3 of s.d. 1,26 1,14 0,65 0,78 1,51 1,2 of s.d. 1,16 1,06 0,60 0,72 1,39 1,1 of s.d. 1,07 0,97 0,55 0,66 1,28 1 s.d. 0,97 0,88 0,50 0,60 1,16 0,9 of s.d 0,87 0,79 0,45 0,54 1,04 0,8 of s.d 0,78 0,70 0,40 0,48 0,93 0,7 of s.d. 0,68 0,62 0,35 0,42 0,81 0,6 of s.d 0,58 0,53 0,30 0,36 0,70 0,5 of s.d. 0,49 0,44 0,25 0,30 0,58 0,4 of s.d 0,39 0,35 0,20 0,24 0,46 0,3 of s.d. 0,29 0,26 0,15 0,18 0,35 0,2 of s.d 0,19 0,18 0,10 0,12 0,23 0,1 of s.d. 0,10 0,09 0,05 0,06 0,12 MEAN 16,6 10,9 9,1 11,05 15,7 MEAN (pooled) 15,6 10,4 9,1 10,9 14,6 MEAN 15,1 10,2 9,2 10,71 13,7 Estm. MEAN 16,57 10,93 9,15 11,02 15,69 Estm. MEAN 15,12 10,22 9,05 10,72 13,71 Maxillary Table 4. Estimation of Male & Female Means for Fossil Hominins I 1 Ar. ramidus A. anamensis A. afarensis A. africanus P. robustus 1 s.d. 0,80 1,20 1,08 0,9 of s.d 0,00 0,00 0,72 1,08 0,97 0,8 of s.d 0,00 0,00 0,64 0,96 0,86 0,7 of s.d. 0,00 0,00 0,56 0,84 0,76 0,6 of s.d 0,00 0,00 0,48 0,72 0,65 0,5 of s.d. 0,00 0,00 0,40 0,60 0,54 0,4 of s.d 0,00 0,00 0,32 0,48 0,43 0,3 of s.d. 0,00 0,00 0,24 0,36 0,32 0,2 of s.d 0,00 0,00 0,16 0,24 0,22 0,1 of s.d. 0,00 0,00 0,08 0,12 0,11 MD MEAN 10,9 10,6 9,0 MEAN(pooled) 10,6 10,1 8,6 MEAN 10,4 9,7 8,3
114 39 I 2 Ar. ramidus A. anamensis A. afarensis A. africanus P. robustus 1 s.d. 0,60 0,60 0,69 0,9 of s.d 0,00 0,00 0,54 0,54 0,62 0,8 of s.d 0,00 0,00 0,48 0,48 0,55 0,7 of s.d. 0,00 0,00 0,42 0,42 0,48 0,6 of s.d 0,00 0,00 0,36 0,36 0,41 0,5 of s.d. 0,00 0,00 0,30 0,30 0,35 0,4 of s.d 0,00 0,00 0,24 0,24 0,28 0,3 of s.d. 0,00 0,00 0,18 0,18 0,21 0,2 of s.d 0,00 0,00 0,12 0,12 0,14 0,1 of s.d. 0,00 0,00 0,06 0,06 0,07 MEAN 0,0 7,7 7,0 6,8 MEAN (pooled) 7,5 6,8 6,5 MEAN 0,0 7,3 6,6 6,3 C - Ar. ramidus A. anamensis A. afarensis A. africanus P. robustus 1 s.d. 1,47 0,70 0,60 0,70 0,9 of s.d 0,00 1,32 0,63 0,54 0,63 0,8 of s.d 0,00 1,18 0,56 0,48 0,56 0,7 of s.d. 0,00 1,03 0,49 0,42 0,49 0,6 of s.d 0,00 0,88 0,42 0,36 0,42 0,5 of s.d. 0,00 0,74 0,35 0,30 0,35 0,4 of s.d 0,00 0,59 0,28 0,24 0,28 0,3 of s.d. 0,00 0,44 0,21 0,18 0,21 0,2 of s.d 0,00 0,29 0,14 0,12 0,14 0,1 of s.d. 0,00 0,15 0,07 0,06 0,07 MEAN 11,73 10,29 10,32 9,09 MEAN (pooled) 10,7 9,8 9,9 8,6 MEAN 9,82 9,38 9,54 8,18 P 3 Ar. ramidus A. anamensis A. afarensis A. africanus P. robustus 1 s.d. 1,17 0,50 0,30 0,72 0,9 of s.d 0,00 1,05 0,45 0,27 0,65 0,8 of s.d 0,00 0,94 0,40 0,24 0,58 0,7 of s.d. 0,00 0,82 0,35 0,21 0,50 0,6 of s.d 0,00 0,70 0,30 0,18 0,43 0,5 of s.d. 0,00 0,59 0,25 0,15 0,36 0,4 of s.d 0,00 0,47 0,20 0,12 0,29 0,3 of s.d. 0,00 0,35 0,15 0,09 0,22 0,2 of s.d 0,00 0,23 0,10 0,06 0,14 0,1 of s.d. 0,00 0,12 0,05 0,03 0,07 MEAN 10,59 9,05 9,25 10,46 MEAN(pooled) 10,0 8,8 9,1 10,1 MEAN 9,42 8,55 8,95 9,74
115 40 P 4 Ar. ramidus A. anamensis A. afarensis A. africanus P. robustus 1 s.d. 0,41 2,17 0,70 0,57 0,64 0,9 of s.d 0,37 1,95 0,63 0,51 0,58 0,8 of s.d 0,33 1,74 0,56 0,46 0,51 0,7 of s.d. 0,29 1,52 0,49 0,40 0,45 0,6 of s.d 0,25 1,30 0,42 0,34 0,38 0,5 of s.d. 0,21 1,09 0,35 0,29 0,32 0,4 of s.d 0,16 0,87 0,28 0,23 0,26 0,3 of s.d. 0,12 0,65 0,21 0,17 0,19 0,2 of s.d 0,08 0,43 0,14 0,11 0,13 0,1 of s.d. 0,04 0,22 0,07 0,06 0,06 MEAN 7,91 10,09 9,55 9,69 11,02 MEAN (pooled) 7,7 9 9,2 9,4 10,7 MEAN 7,50 7,92 8,85 9,12 10,38 M 1 Ar. ramidus A. anamensis A. afarensis A. africanus P. robustus 1 s.d. 0,41 1,17 1,00 0,74 0,75 0,9 of s.d 0,37 1,05 0,90 0,67 0,68 0,8 of s.d 0,33 0,94 0,80 0,59 0,60 0,7 of s.d. 0,29 0,82 0,70 0,52 0,53 0,6 of s.d 0,25 0,70 0,60 0,44 0,45 0,5 of s.d. 0,21 0,59 0,50 0,37 0,38 0,4 of s.d 0,16 0,47 0,40 0,30 0,30 0,3 of s.d. 0,12 0,35 0,30 0,22 0,23 0,2 of s.d 0,08 0,23 0,20 0,15 0,15 0,1 of s.d. 0,04 0,12 0,10 0,07 0,08 MEAN 10,75 12,50 12,60 13,24 13,75 MEAN (pooled) 10,5 11, ,8 13,3 MEAN 10,38 11,45 11,70 12,58 13,08 M 2 Ar. ramidus A. anamensis A. afarensis A. africanus P. robustus 1 s.d. 0,54 0,93 0,60 1,00 1,20 0,9 of s.d 0,49 0,84 0,54 0,90 1,08 0,8 of s.d 0,43 0,74 0,48 0,80 0,96 0,7 of s.d. 0,38 0,65 0,42 0,70 0,84 0,6 of s.d 0,32 0,56 0,36 0,60 0,72 0,5 of s.d. 0,27 0,47 0,30 0,50 0,60 0,4 of s.d 0,22 0,37 0,24 0,40 0,48 0,3 of s.d. 0,16 0,28 0,18 0,30 0,36 0,2 of s.d 0,11 0,19 0,12 0,20 0,24 0,1 of s.d. 0,05 0,09 0,06 0,10 0,12 MEAN 12,32 13,36 13,36 14,90 15,22 MEAN (pooled) 12,0 12, ,3 14,5 MEAN 11,84 12,52 12,82 14,00 14,14
116 41 I 1 Ar. ramidus A. anamensis A. afarensis A. africanus P. robustus 1 s.d. 0,45 0,46 0,80 0,40 0,31 0,9 of s.d 0,41 0,41 0,72 0,36 0,28 0,8 of s.d 0,36 0,37 0,64 0,32 0,25 0,7 of s.d. 0,32 0,32 0,56 0,28 0,22 0,6 of s.d 0,27 0,28 0,48 0,24 0,19 0,5 of s.d. 0,23 0,23 0,40 0,20 0,16 0,4 of s.d 0,18 0,18 0,32 0,16 0,12 0,3 of s.d. 0,14 0,14 0,24 0,12 0,09 0,2 of s.d 0,09 0,09 0,16 0,08 0,06 0,1 of s.d. 0,05 0,05 0,08 0,04 0,03 BL MEAN 8,02 9,12 8,86 8,58 7,62 MEAN(pooled) 7,7 8,8 8,3 8,3 7,4 MEAN 7,52 8,62 7,98 8,14 7,28 I 2 Ar. ramidus A. anamensis A. afarensis A. africanus P. robustus 1 s.d. 0,53 0,60 0,63 0,68 0,9 of s.d 0,48 0,00 0,54 0,57 0,61 0,8 of s.d 0,42 0,00 0,48 0,50 0,54 0,7 of s.d. 0,37 0,00 0,42 0,44 0,48 0,6 of s.d 0,32 0,00 0,36 0,38 0,41 0,5 of s.d. 0,27 0,00 0,30 0,32 0,34 0,4 of s.d 0,21 0,00 0,24 0,25 0,27 0,3 of s.d. 0,16 0,00 0,18 0,19 0,20 0,2 of s.d 0,11 0,00 0,12 0,13 0,14 0,1 of s.d. 0,05 0,00 0,06 0,06 0,07 MEAN 7,87 7,72 7,24 7,08 MEAN(pooled) 7,5 6,5 7,3 6,8 6,6 MEAN 7,29 7,06 6,55 6,33 C - Ar. ramidus A. anamensis A. afarensis A. africanus P. robustus 1 s.d. 0,89 0,90 1,00 0,98 0,9 of s.d 0,00 0,80 0,81 0,90 0,88 0,8 of s.d 0,00 0,71 0,72 0,80 0,78 0,7 of s.d. 0,00 0,62 0,63 0,70 0,69 0,6 of s.d 0,00 0,53 0,54 0,60 0,59 0,5 of s.d. 0,00 0,45 0,45 0,50 0,49 0,4 of s.d 0,00 0,36 0,36 0,40 0,39 0,3 of s.d. 0,00 0,27 0,27 0,30 0,29 0,2 of s.d 0,00 0,18 0,18 0,20 0,20 0,1 of s.d. 0,00 0,09 0,09 0,10 0,10 MEAN 11,11 11,52 11,20 10,08 MEAN(pooled) 10,4 10,8 10,4 9,3 MEAN 9,78 10,17 9,70 8,61
117 42 P 3 Ar. ramidus A. anamensis A. afarensis A. africanus P. robustus 1 s.d. 0,78 0,90 0,60 0,70 0,72 0,9 of s.d 0,70 0,81 0,54 0,63 0,65 0,8 of s.d 0,62 0,72 0,48 0,56 0,58 0,7 of s.d. 0,55 0,63 0,42 0,49 0,50 0,6 of s.d 0,47 0,54 0,36 0,42 0,43 0,5 of s.d. 0,39 0,45 0,30 0,35 0,36 0,4 of s.d 0,31 0,36 0,24 0,28 0,29 0,3 of s.d. 0,23 0,27 0,18 0,21 0,22 0,2 of s.d 0,16 0,18 0,12 0,14 0,14 0,1 of s.d. 0,08 0,09 0,06 0,07 0,07 MEAN 12,25 13,83 12,82 13,19 14,40 MEAN (pooled) 11,70 13,20 12,40 12,70 13,90 MEAN 11,15 12,57 11,98 12,21 13,40 P 4 Ar. ramidus A. anamensis A. afarensis A. africanus P. robustus 1 s.d. 0,29 0,90 1,10 1,36 0,9 of s.d 0,26 0,00 0,81 0,99 1,22 0,8 of s.d 0,23 0,00 0,72 0,88 1,09 0,7 of s.d. 0,20 0,00 0,63 0,77 0,95 0,6 of s.d 0,17 0,00 0,54 0,66 0,82 0,5 of s.d. 0,15 0,00 0,45 0,55 0,68 0,4 of s.d 0,12 0,00 0,36 0,44 0,54 0,3 of s.d. 0,09 0,00 0,27 0,33 0,41 0,2 of s.d 0,06 0,00 0,18 0,22 0,27 0,1 of s.d. 0,03 0,00 0,09 0,11 0,14 MEAN 11,80 0,00 13,23 14,17 15,75 MEAN(pooled) 11,6 12,6 13,4 14,8 MEAN 11,40 0,00 11,97 12,63 13,85 M 1 Ar. ramidus A. anamensis A. afarensis A. africanus P. robustus 1 s.d. 0,55 1,49 0,90 0,80 0,88 0,9 of s.d 0,50 1,34 0,81 0,72 0,79 0,8 of s.d 0,44 1,19 0,72 0,64 0,70 0,7 of s.d. 0,39 1,04 0,63 0,56 0,62 0,6 of s.d 0,33 0,89 0,54 0,48 0,53 0,5 of s.d. 0,28 0,75 0,45 0,40 0,44 0,4 of s.d 0,22 0,60 0,36 0,32 0,35 0,3 of s.d. 0,17 0,45 0,27 0,24 0,26 0,2 of s.d 0,11 0,30 0,18 0,16 0,18 0,1 of s.d. 0,06 0,15 0,09 0,08 0,09 MEAN 12,08 14,05 13,95 14,30 15,04 MEAN(pooled) 11,8 13,3 13,5 13,9 14,6 MEAN 11,64 12,85 13,23 13,66 14,34
118 43 M 2 Ar. ramidus A. anamensis A. afarensis A. africanus P. robustus 1 s.d. 0,63 1,16 0,60 1,20 1,10 0,9 of s.d 0,57 1,04 0,54 1,08 0,99 0,8 of s.d 0,50 0,93 0,48 0,96 0,88 0,7 of s.d. 0,44 0,81 0,42 0,84 0,77 0,6 of s.d 0,38 0,70 0,36 0,72 0,66 0,5 of s.d. 0,32 0,58 0,30 0,60 0,55 0,4 of s.d 0,25 0,46 0,24 0,48 0,44 0,3 of s.d. 0,19 0,35 0,18 0,36 0,33 0,2 of s.d 0,13 0,23 0,12 0,24 0,22 0,1 of s.d. 0,06 0,12 0,06 0,12 0,11 MEAN 14,52 15,18 15,10 16,50 16,15 MEAN(pooled) 14,2 14,6 14,8 15,9 15,6 MEAN 14,01 14,25 14,62 15,54 15,27 Mandibular MD I1 Ar. ramidus A. anamensis A. afarensis A. africanus P. robustus 1 s.d. 0,35 0,90 0,64 0,26 0,9 of s.d 0,32 0,00 0,81 0,58 0,23 0,8 of s.d 0,28 0,00 0,72 0,51 0,21 0,7 of s.d. 0,25 0,00 0,63 0,45 0,18 0,6 of s.d 0,21 0,00 0,54 0,38 0,16 0,5 of s.d. 0,18 0,00 0,45 0,32 0,13 0,4 of s.d 0,14 0,00 0,36 0,26 0,10 0,3 of s.d. 0,11 0,00 0,27 0,19 0,08 0,2 of s.d 0,07 0,00 0,18 0,13 0,05 0,1 of s.d. 0,04 0,00 0,09 0,06 0,03 MEAN 5,74 6,86 6,36 5,40 MEAN(pooled) 5,6 6,5 6,1 5,3 MEAN 5,50 6,23 5,91 5,22 I2 Ar. ramidus A. anamensis A. afarensis A. africanus P. robustus 1 s.d. 0,94 0,90 0,79 0,48 0,9 of s.d 0,00 0,85 0,81 0,71 0,43 0,8 of s.d 0,00 0,75 0,72 0,63 0,38 0,7 of s.d. 0,00 0,66 0,63 0,55 0,34 0,6 of s.d 0,00 0,56 0,54 0,47 0,29 0,5 of s.d. 0,00 0,47 0,45 0,40 0,24 0,4 of s.d 0,00 0,38 0,36 0,32 0,19
119 44 0,3 of s.d. 0,00 0,28 0,27 0,24 0,14 0,2 of s.d 0,00 0,19 0,18 0,16 0,10 0,1 of s.d. 0,00 0,09 0,09 0,08 0,05 MEAN 8,18 6,86 7,52 6,49 MEAN(pooled) 7,8 6,5 7,2 6,3 MEAN 7,52 6,23 6,96 6,16 C - Ar. ramidus A. anamensis A. afarensis A. africanus P. robustus 1 s.d. 1,46 1,10 0,61 0,59 0,9 of s.d 0,00 1,31 0,99 0,55 0,53 0,8 of s.d 0,00 1,17 0,88 0,49 0,47 0,7 of s.d. 0,00 1,02 0,77 0,43 0,41 0,6 of s.d 0,00 0,88 0,66 0,37 0,35 0,5 of s.d. 0,00 0,73 0,55 0,31 0,30 0,4 of s.d 0,00 0,58 0,44 0,24 0,24 0,3 of s.d. 0,00 0,44 0,33 0,18 0,18 0,2 of s.d 0,00 0,29 0,22 0,12 0,12 0,1 of s.d. 0,00 0,15 0,11 0,06 0,06 MEAN 9,82 9,77 9,93 8,21 MEAN(pooled) 8,8 9 9,5 7,8 MEAN 7,92 8,34 9,13 7,45 P 3 Ar. ramidus A. anamensis A. afarensis A. africanus P. robustus 1 s.d. 0,60 1,00 0,74 0,61 0,9 of s.d 0,00 0,54 0,90 0,67 0,55 0,8 of s.d 0,00 0,48 0,80 0,59 0,49 0,7 of s.d. 0,00 0,42 0,70 0,52 0,43 0,6 of s.d 0,00 0,36 0,60 0,44 0,37 0,5 of s.d. 0,00 0,30 0,50 0,37 0,31 0,4 of s.d 0,00 0,24 0,40 0,30 0,24 0,3 of s.d. 0,00 0,18 0,30 0,22 0,18 0,2 of s.d 0,00 0,12 0,20 0,15 0,12 0,1 of s.d. 0,00 0,06 0,10 0,07 0,06 MEAN 10,20 10,00 10,07 10,51 MEAN(pooled) 9,9 9,5 9,7 10,2 MEAN 9,60 9,00 9,33 9,90 P 4 Ar. ramidus A. anamensis A. afarensis A. africanus P. robustus 1 s.d. 0,60 0,95 1,00 0,76 0,62 0,9 of s.d 0,54 0,86 0,90 0,68 0,56
120 45 0,8 of s.d 0,48 0,76 0,80 0,61 0,50 0,7 of s.d. 0,42 0,67 0,70 0,53 0,43 0,6 of s.d 0,36 0,57 0,60 0,46 0,37 0,5 of s.d. 0,30 0,48 0,50 0,38 0,31 0,4 of s.d 0,24 0,38 0,40 0,30 0,25 0,3 of s.d. 0,18 0,29 0,30 0,23 0,19 0,2 of s.d 0,12 0,19 0,20 0,15 0,12 0,1 of s.d. 0,06 0,10 0,10 0,08 0,06 MEAN 8,20 9,48 10,30 10,78 11,81 MEAN(pooled) 7,9 9 9,8 10,4 11,5 MEAN 7,60 8,53 9,30 10,02 11,19 M 1 Ar. ramidus A. anamensis A. afarensis A. africanus P. robustus 1 s.d. 0,54 0,87 0,90 1,07 0,77 0,9 of s.d 0,49 0,78 0,81 0,96 0,69 0,8 of s.d 0,43 0,70 0,72 0,86 0,62 0,7 of s.d. 0,38 0,61 0,63 0,75 0,54 0,6 of s.d 0,32 0,52 0,54 0,64 0,46 0,5 of s.d. 0,27 0,44 0,45 0,54 0,39 0,4 of s.d 0,22 0,35 0,36 0,43 0,31 0,3 of s.d. 0,16 0,26 0,27 0,32 0,23 0,2 of s.d 0,11 0,17 0,18 0,21 0,15 0,1 of s.d. 0,05 0,09 0,09 0,11 0,08 MEAN 11,72 13,12 13,64 14,54 15,16 MEAN(pooled) 11,4 12,6 13,1 13,9 14,7 MEAN 11,24 12,34 12,83 13,58 14,47 M 2 Ar. ramidus A. anamensis A. afarensis A. africanus P. robustus 1 s.d. 0,70 0,92 1,20 0,98 0,90 0,9 of s.d 0,63 0,83 1,08 0,88 0,81 0,8 of s.d 0,56 0,74 0,96 0,78 0,72 0,7 of s.d. 0,49 0,64 0,84 0,69 0,63 0,6 of s.d 0,42 0,55 0,72 0,59 0,54 0,5 of s.d. 0,35 0,46 0,60 0,49 0,45 0,4 of s.d 0,28 0,37 0,48 0,39 0,36 0,3 of s.d. 0,21 0,28 0,36 0,29 0,27 0,2 of s.d 0,14 0,18 0,24 0,20 0,18 0,1 of s.d. 0,07 0,09 0,12 0,10 0,09 MEAN 13,62 14,85 15,02 16,29 16,84 MEAN(pooled) 13,2 14,3 14,3 15,7 16,3 MEAN 12,99 14,02 13,94 15,41 16,03
121 46 I1 Ar. ramidus A. anamensis A. afarensis A. africanus P. robustus BL 1 s.d. 0,3 0,3 0,65 0,46 0,9 of s.d 0,2 0,0 0,3 0,59 0,41 0,8 of s.d 0,2 0,0 0,2 0,52 0,37 0,7 of s.d. 0,2 0,0 0,2 0,46 0,32 0,6 of s.d 0,2 0,0 0,2 0,39 0,28 0,5 of s.d. 0,1 0,0 0,2 0,33 0,23 0,4 of s.d 0,1 0,0 0,1 0,26 0,18 0,3 of s.d. 0,1 0,0 0,1 0,20 0,14 0,2 of s.d 0,1 0,0 0,1 0,13 0,09 0,1 of s.d. 0,0 0,0 0,0 0,07 0,05 MEAN 6,3 0,0 7,6 7,16 6,32 MEAN (pooled) 6,1 7,4 6,7 6 MEAN 6,0 0,0 7,3 6,44 5,82 I2 Ar. ramidus A. anamensis A. afarensis A. africanus P. robustus 1 s.d. 0,47 0,70 0,59 0,50 0,9 of s.d 0,42 0,00 0,63 0,53 0,45 0,8 of s.d 0,38 0,00 0,56 0,47 0,40 0,7 of s.d. 0,33 0,00 0,49 0,41 0,35 0,6 of s.d 0,28 0,00 0,42 0,35 0,30 0,5 of s.d. 0,24 0,00 0,35 0,30 0,25 0,4 of s.d 0,19 0,00 0,28 0,24 0,20 0,3 of s.d. 0,14 0,00 0,21 0,18 0,15 0,2 of s.d 0,09 0,00 0,14 0,12 0,10 0,1 of s.d. 0,05 0,00 0,07 0,06 0,05 MEAN 7,53 8,49 8,51 7,55 MEAN (pooled) 7,2 8 8,1 7,2 MEAN 7,01 7,72 7,86 7,00 C - Ar. ramidus A. anamensis A. afarensis A. africanus P. robustus 1 s.d. 0,99 1,10 0,85 0,96 0,9 of s.d 0,00 0,89 0,99 0,77 0,86 0,8 of s.d 0,00 0,79 0,88 0,68 0,77 0,7 of s.d. 0,00 0,69 0,77 0,60 0,67 0,6 of s.d 0,00 0,59 0,66 0,51 0,58 0,5 of s.d. 0,00 0,50 0,55 0,43 0,48 0,4 of s.d 0,00 0,40 0,44 0,34 0,38
122 47 0,3 of s.d. 0,00 0,30 0,33 0,26 0,29 0,2 of s.d 0,00 0,20 0,22 0,17 0,19 0,1 of s.d. 0,00 0,10 0,11 0,09 0,10 MEAN 11,19 11,38 10,78 9,27 MEAN (pooled) 10,4 10,5 10,1 8,5 MEAN 9,71 9,73 9,51 7,83 P 3 Ar. ramidus A. anamensis A. afarensis A. africanus P. robustus 1 s.d. 1,00 1,10 1,17 1,14 0,9 of s.d 0,00 0,90 0,99 1,05 1,03 0,8 of s.d 0,00 0,80 0,88 0,94 0,91 0,7 of s.d. 0,00 0,70 0,77 0,82 0,80 0,6 of s.d 0,00 0,60 0,66 0,70 0,68 0,5 of s.d. 0,00 0,50 0,55 0,59 0,57 0,4 of s.d 0,00 0,40 0,44 0,47 0,46 0,3 of s.d. 0,00 0,30 0,33 0,35 0,34 0,2 of s.d 0,00 0,20 0,22 0,23 0,23 0,1 of s.d. 0,00 0,10 0,11 0,12 0,11 MEAN 11,60 11,47 12,22 12,40 MEAN (pooled) 10,9 10,7 11,4 11,6 MEAN 10,20 9,93 10,58 10,80 P 4 Ar. ramidus A. anamensis A. afarensis A. africanus P. robustus 1 s.d. 0,44 0,84 0,80 0,90 1,11 0,9 of s.d 0,40 0,76 0,72 0,81 1,00 0,8 of s.d 0,35 0,67 0,64 0,72 0,89 0,7 of s.d. 0,31 0,59 0,56 0,63 0,78 0,6 of s.d 0,26 0,50 0,48 0,54 0,67 0,5 of s.d. 0,22 0,42 0,40 0,45 0,56 0,4 of s.d 0,18 0,34 0,32 0,36 0,44 0,3 of s.d. 0,13 0,25 0,24 0,27 0,33 0,2 of s.d 0,09 0,17 0,16 0,18 0,22 0,1 of s.d. 0,04 0,08 0,08 0,09 0,11 MEAN 9,81 11,19 11,56 12,23 13,88 MEAN (pooled) 9,5 10, ,6 13,1 MEAN 9,19 10,01 10,44 10,97 12,32
123 48 M 1 Ar. ramidus A. anamensis A. afarensis A. africanus P. robustus 1 s.d. 0,46 1,10 0,80 0,90 0,85 0,9 of s.d 0,41 0,99 0,72 0,81 0,77 0,8 of s.d 0,37 0,88 0,64 0,72 0,68 0,7 of s.d. 0,32 0,77 0,56 0,63 0,60 0,6 of s.d 0,28 0,66 0,48 0,54 0,51 0,5 of s.d. 0,23 0,55 0,40 0,45 0,43 0,4 of s.d 0,18 0,44 0,32 0,36 0,34 0,3 of s.d. 0,14 0,33 0,24 0,27 0,26 0,2 of s.d 0,09 0,22 0,16 0,18 0,17 0,1 of s.d. 0,05 0,11 0,08 0,09 0,09 MEAN 10,83 12,25 13,00 13,65 14,13 MEAN (pooled) 10,6 11,7 12,6 13,2 13,7 MEAN 10,46 11,37 12,36 12,93 13,45 M 2 Ar. ramidus A. anamensis A. afarensis A. africanus P. robustus 1 s.d. 0,29 0,88 1,00 0,99 0,84 0,9 of s.d 0,26 0,79 0,90 0,89 0,76 0,8 of s.d 0,23 0,70 0,80 0,79 0,67 0,7 of s.d. 0,20 0,62 0,70 0,69 0,59 0,6 of s.d 0,17 0,53 0,60 0,59 0,50 0,5 of s.d. 0,15 0,44 0,50 0,50 0,42 0,4 of s.d 0,12 0,35 0,40 0,40 0,34 0,3 of s.d. 0,09 0,26 0,30 0,30 0,25 0,2 of s.d 0,06 0,18 0,20 0,20 0,17 0,1 of s.d. 0,03 0,09 0,10 0,10 0,08 MEAN 12,25 13,94 14,00 14,90 15,12 MEAN (pooled) 12,1 13,5 13,5 14,4 14,7 MEAN 12,01 13,24 13,20 14,10 14,45
124 49 Table 5. Comparative Statistics of O. macedoniensis. DATA from Koufos, 1993; Koufos, 1995; Koufos & de Bonis 2006
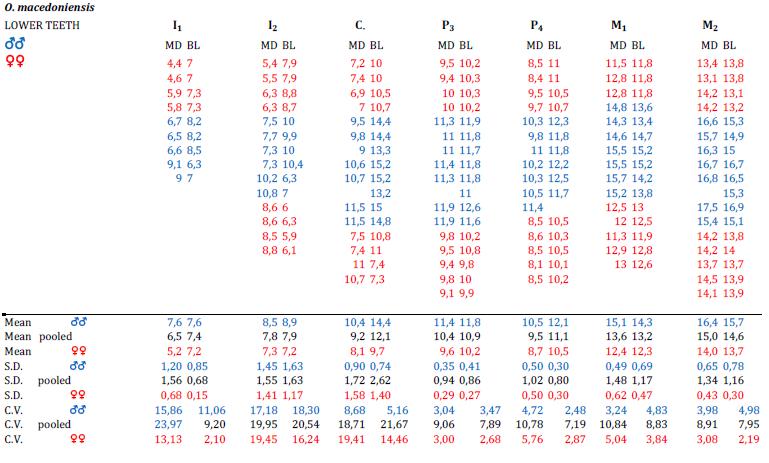
125 50
Mammals Grew 1,000 Times Larger After the Demise of the Dinosaurs
 Mammals Grew 1,000 Times Larger After the Demise of the Dinosaurs The largest land mammals that ever lived, Indricotherium and Deinotherium, would have towered over the living African Elephant. Indricotherium
Lecture 10-1 Early Fossil Hominids: Bipedal Anatomy & Pre- Australopithecines and Australopithecines
 Lecture 10-1 Early Fossil Hominids: Bipedal Anatomy & Pre- Australopithecines and Australopithecines Big Questions 1. What is a hominid? 2. Why did hominids evolve from an apelike primate? 3. Who were
Internet Assignment: Early Hominids
 ANTHRO 1-L: Biological Anthropology Lab R. Mitchell, Instructor Name: Internet Assignment: Early Hominids From the late Miocene (10-5.5 mya) to the early Pliocene (5.5-4 mya), a major adaptive shift was
4/20/2008. Overview. Early Human Evolution. Chronology of Hominid Evolution. Overview of Species. Epochs of the Cenozoic Era
 Early Human Evolution Overview and Chronology What makes us human? Ardipithecus and early Australopithecus Robust and gracile australopithecines Oldowan tools Overview First hominins appeared late in the
Human evolution. Fascinating subject - where did we come from? History of Primates:
 Human evolution. Fascinating subject - where did we come from? History of Primates: - evolved from shrews during Cretaceous (so an older order) about 65 mya. - Some characteristics of primates: - clavicle
Outline. Evolution: Human Evolution. Primates reflect a treedwelling. Key Concepts:
 Evolution: Human Evolution Primates reflect a treedwelling heritage Outline 1. Key concepts 2. Characteristics of primates 3. Prosimians and anthropoids 4. The first hominids: Ardipithecus 5. The first
Hominid! Evolution: On The Origin of Humans
 What is a Hominid? Hominid! Evolution: On The Origin of Humans The term hominid is also used in the more restricted sense as hominins Humans and relatives of humans closer than chimpanzees Bipedal Modern
NOTES: Ch 34 - Mammals & Primate / Human Evolution ( )
") NOTES: Ch 34 - Mammals & Primate / Human Evolution (34.7-34.8) Class: MAMMALIA Mammals possess unique derived characteristics: 1) Provide young with milk (mammary glands) 2) Internal fertilization; some
NOTES: Ch 34 - Mammals & Primate / Human Evolution (34.7-34.8) Class: MAMMALIA Mammals possess unique derived characteristics: 1) Provide young with milk (mammary glands) 2) Internal fertilization; some
Study Guide Primates and Human Evolution. Where do you fit into the natural world? Characteristics of Primates
 Study Guide Primates and Human Evolution Describe the traits of primates.! Classify yourself taxonomically.! What traits make you human?! Describe the evolutionary trends in hominin species over the past
The Human Animal. The Human Timescale. Geological Timescale. Millions of Years. Periods Jurassic. Major events
 The Human Animal The Human Timescale Geological Timescale Millions of Years Periods Permian Triassic Jurassic Cretaceous Tertiary Quat. Major events Dinosaurs Evolve and Expand Start of Age of Reptiles
The Human Animal. The Human Timescale. Geological Timescale. Millions of Years. Periods Permian Triassic Jurassic Cretaceous Tertiary Quat.
 The Human Animal 1 The Human Timescale 2 Geological Timescale Millions of Years Periods Permian Triassic Jurassic Cretaceous Tertiary Quat. Major events Start of Age of Reptiles Dinosaurs Evolve and Expand
The Human Animal. Species. The Human Timescale. Geological Timescale. Primate Evolution Primate Ancestor
 The Human Animal The Human Timescale 1 2 Geological Timescale Species Millions of Years Periods Permian Triassic Jurassic Cretaceous Tertiary Quat. Major events Dinosaurs Evolve and Expand Start of Age
Clavicle well developed (allows increase flexibility, supports arms). Five digits, front and rear. Often thumb (and big toe) opposable.
. Five digits, front and rear. Often thumb (and big toe) opposable.") Human evolution. It d be nice to spend some time with some other groups (e.g. dinosaurs), but this just isn t possible in a survey course like this. BUT, we will spend a little time on human evolution!
Human evolution. It d be nice to spend some time with some other groups (e.g. dinosaurs), but this just isn t possible in a survey course like this. BUT, we will spend a little time on human evolution!
Development Team. Physical/Biological Anthropology. Anthropology. Principal Investigator. Paper Coordinator. Content Writer.
 Paper No. : 01 Physical/ Biological Module : 15 Development Team Principal Investigator Prof. Anup Kumar Kapoor Department of, University of Delhi Paper Coordinator Prof. Subho Roy Department of,university
CHAPTER 9: HOMININ ORIGINS (PGS.
 Learning Objectives Explain the general time depth for the earliest primates and explain how they may (or not) be related to living primates Define what a hominin is and explain what sort of evidence is
Hominins ultimately distinguished by brain size, bipedal locomotion and toolmaking behavior
 Early Hominins Hominins ultimately distinguished by brain size, bipedal locomotion and toolmaking behavior But these did not develop simultaneously: mosaic evolution The only reliable indicator of earliest
A n t h r o p o l o g y
 A n t h r o p o l o g y Appreciating Human Diversity Fifteenth Edition Conrad Phillip Kottak University of Michigan McGraw-Hill 2013 McGraw-Hill Companies. All Rights Reserved. C H A P T E R EARLY HOMININS
Primate Evolution. Section 1. Primates
 Section 1 Primates Characteristics of Primates! Manual dexterity! Five digits on each hand and foot! Flat nails and sensitive areas on the ends of their digits! The first digits are opposable. Section
Introduction to Biological Anthropology: Notes 21 Apes and early hominins Copyright Bruce Owen 2011 the first known hominoids (apes) appeared in the
 appeared in the") Introduction to Biological Anthropology: Notes 21 Apes and early hominins Copyright Bruce Owen 2011 the first known hominoids (apes) appeared in the late Oligocene, 27 mya example Oligocene ape: genus
Introduction to Biological Anthropology: Notes 21 Apes and early hominins Copyright Bruce Owen 2011 the first known hominoids (apes) appeared in the late Oligocene, 27 mya example Oligocene ape: genus
Introduction to Biological Anthropology: Notes 17 The first hominins Copyright Bruce Owen 2008 Last time we saw how apes radiated (diversified) in
 in") Introduction to Biological Anthropology: Notes 17 The first hominins Copyright Bruce Owen 2008 Last time we saw how apes radiated (diversified) in the middle Miocene some shifted from quadrupedal to more
Introduction to Biological Anthropology: Notes 17 The first hominins Copyright Bruce Owen 2008 Last time we saw how apes radiated (diversified) in the middle Miocene some shifted from quadrupedal to more
Overview of Hominin Evolution
 Overview of Hominin Evolution Lead Editor: Jessica Rothman, Katy Gonder, Holly Dunsworth, Kieran McNulty BIOLOGICAL ANTHROPOLOGY By: Herman Pontzer (Dept. of Anthropology, Hunter College; New York Consortium
Chapter 14: PRIMATE EVOLUTION
 Chapter 14: PRIMATE EVOLUTION PRIMATES What is a primate? Features that are unique to primates: -Present in primates -Absent in closely related groups Outgroup Ingroup Character A present Character A absent
Human Evolution - Skull Analysis
 Name: Date: Human Evolution - Skull Analysis Prior Knowledge Questions (Do these BEFORE using the Gizmo.) 1. Label one of the skulls below as human and the other as a chimpanzee skull. 2. What features
12/1/14. Speciation and Human Evolution. The Time Course of Speciation. Speciation Rates
 Speciation and Human Evolution References: chapters 24 (first few slides) 34 (last few pages of chapter) Speciation can occur rapidly or slowly, and can result from changes in few or many genes Many questions
Student Exploration: Human Evolution - Skull Analysis
 Name: Date: Student Exploration: Human Evolution - Skull Analysis Prior Knowledge Questions 1. Label one of the skulls below as human and the other as a chimpanzee skull. 2. What features did you use to
Human Evolution Chris Stringer The Natural History Museum London. Are we nearly there yet?
 Human Evolution Chris Stringer The Natural History Museum London Are we nearly there yet? Phases of human evolution Human phase 2 0 Ma: >>Global spread Human anatomy >>Encephalised >>Dietary range >>Behavioural
Anthro 101: Human Biological Evolution. Lecture 13: Early Hominins. Prof. Kenneth Feldmeier
 Anthro 101: Human Biological Evolution Lecture 13: Early Hominins Prof. Kenneth Feldmeier Biological Anthropology Hominoid = Apes Humans, Gorillas, Chimpanzees, Orangutans, Gibbons and Siamangs Hominin
Evolution-Human Evolution. Biology: Fezza Miami Arts Charter
 EvolutionHuman Evolution Biology: Fezza Miami Arts Charter Biogeography the study of the distribution of species and ecosystems in geographic space and through (geological) time Evolution is modification
Anthro 101: Human Biological Evolution. Lecture 13: Early Hominins. Prof. Kenneth Feldmeier
 Anthro 101: Human Biological Evolution Lecture 13: Early Hominins Prof. Kenneth Feldmeier Biological Anthropology Hominoid = Apes Orangutan Humans, Gorillas, Chimpanzees, Orangutans, Gibbons and Siamangs
1. Primate evolution provides a context for understanding human origins
 1. Primate evolution provides a context for understanding human origins Primates are monkeys, lemurs, tarsiers and apes (including us!). Compared to other mammals Most primates have hands and feet adapted
8 Studying Hominids In ac t i v i t y 5, Using Fossil Evidence to Investigate Whale Evolution, you
 8 Studying Hominids In ac t i v i t y 5, Using Fossil Evidence to Investigate Whale Evolution, you were working with evidence for the evolution of the whale lineage. A lineage is a series of populations
What do the Bones tell us?
 What do the Bones tell us? The scientific study of bones. Comes from the Greek word Osteon, meaning bone Sub-discipline of archaeology and physical anthropology, anatomy, forensics etc. Age at death Height/stature
Introduction to Biological Anthropology: Notes 20 Apes and early hominins Copyright Bruce Owen 2010 the first known hominoids (apes) appeared in the
 appeared in the") Introduction to Biological Anthropology: Notes 20 Apes and early hominins Copyright Bruce Owen 2010 the first known hominoids (apes) appeared in the late Oligocene, 27 mya example Oligocene ape: genus
Introduction to Biological Anthropology: Notes 20 Apes and early hominins Copyright Bruce Owen 2010 the first known hominoids (apes) appeared in the late Oligocene, 27 mya example Oligocene ape: genus
Hominid Skull Comparisons
 Hominid Skull Comparisons Visit the following website: www.humanorigins.si.edu/evidence/human-family-tree Explore the interactive Human Family Tree. What can you conclude about the evolution of humans
Anthro 101: Human Biological Evolution. Lecture 13: Early Hominins. Prof. Kenneth Feldmeier
 Anthro 101: Human Biological Evolution Lecture 13: Early Hominins Prof. Kenneth Feldmeier Biological Anthropology Hominoid = Apes Humans, Gorillas, Chimpanzees, Orangutans, Gibbons Orangutan and Siamangs
Cenozoic Climates. Human Evolution and Adaptation
 Cenozoic Climates Human Evolution and Adaptation Life Styles of the Merely Hominid Miocene Climates Miocene Habitats The increase in climate variability would have been evident in many regions as increased
Homework. Guided Reading Hominids Through Time (#12-21)
") Homework Guided Reading Hominids Through Time (#12-21) Learning Target I can explain how hominids evolved and what caused them to evolve. What characteristics do they have in common? What characteristics
Homework Guided Reading Hominids Through Time (#12-21) Learning Target I can explain how hominids evolved and what caused them to evolve. What characteristics do they have in common? What characteristics
A New Kind of Ancestor: Ardipithecus Unveiled
 A New Kind of Ancestor: Ardipithecus Unveiled The oldest known hominin skeleton reveals the body plan of our very early ancestors and the upright origins of humankind Every day, scientists add new pages
As we review the fossil evidence for early hominins, keep in mind the importance of identifying derived traits Ancestral traits are traits that have
 As we review the fossil evidence for early hominins, keep in mind the importance of identifying derived traits Ancestral traits are traits that have not changed from the earlier ancestral form Derived
Human Ancestry (Learning Objectives)
") Human Ancestry (Learning Objectives) 1. Identify the characters shared by all primates and relate them to the function they served in their common ancestor. 2. Learn the fields study of Human evolution
Human Ancestry (Learning Objectives) 1. Identify the characters shared by all primates and relate them to the function they served in their common ancestor. 2. Learn the fields study of Human evolution
History matters: - personal basis - group basis
 Human Evolution History matters: - personal basis - group basis HISTORY GEOGRAPHY/CONTEXT humanity The recognition of the power of context and history motivates creationists Their concern: If we accept
Chapter 17: Human Evolution
 Chapter 17: Human Evolution Classification Hierarchy Kingdom Phylum Class Order Family Genus Species Animal Chordate Mammal Primates Hominids Homo Sapiens Important Vocabulary Scientist who studies fossil
Student Wrap-up. Topic: Investigating Hominoid Fossils: Evidence of Evolution
 Student Wrap-up Topic: Investigating Hominoid Fossils: Evidence of Evolution Benchmark: SC.912.L.15.10 Identify basic trends in hominid evolution from early ancestors six million years ago to modern humans,
Uncovering Ardipithecus Ramidus
 Uncovering Ardipithecus Ramidus Kristopher Jordan Krohn Mesa Community College/ Arizona State University 8 million years ago a tremendous even occurred; a new branch of primates split off from the chimpanzee
Sahelanthropus tchadensis the ambiguous ape
 Papers Sahelanthropus tchadensis the ambiguous ape Matthew Murdock Sahelanthropus tchadensis has been the centre of much controversy since its announcement in July 2002. Some claim this genus is a common
early hominid fossils from AFRICA
 ORIGINS MATT MAHURIN (illustration); ROBERT CAMPBELL (left); ALAN WALKER; NATIONAL MUSEUMS OF KENYA (center and right) early hominid fossils from AFRICA The year was 1965. Bryan Patterson, a paleoanthropologist
Journal of Human Evolution
 Journal of Human Evolution 60 (2011) 711e730 Contents lists available at ScienceDirect Journal of Human Evolution journal homepage: www.elsevier.com/locate/jhevol Evolution of the mandibular third premolar
 2010-2014 www.d.umn.edu/cla/faculty/troufs/anthfood/aftexts.html#title 2010-2014 www.d.umn.edu/cla/faculty/troufs/anthfood/aftexts.html#title 2010-2014 www.d.umn.edu/cla/faculty/troufs/anthfood/aftexts.html#title
New fossil discoveries complicate the already devilish task of identifying HUMAN EVOLUTION Scientific American
 HUMAN EVOLUTION SHATTERED New fossil discoveries complicate the already devilish task of identifying 42 Scientific American, February 2013 ANCESTRY our most ancient progenitors By Katherine Harmon liest
Cenozoic Climates. Hominid Origins
 Cenozoic Climates First Prosimians Hominid Origins Ecology, Changing Social Patterns, and Bipedalism Anthropoids Hominids Miocene Climates Miocene Habitats The increase in climate variability would have
Build Vocabulary Students will have a more successful lab experience if they understand these terms.
 Guided Inquiry Forensics Lab hapter 26 Lab Investigating Hominoid Fossils Problem What can a comparison of skulls and hands reveal about the evolution of humans? Introduction paleontologist takes photographs
Investigating Hominoid Fossils Laboratory
 Biology I Unit V: Zoology Chapter 25-28 & DOL: Vertebrates Investigating Hominoid Fossils Laboratory Name: Date: Hour: Investigating Hominoid Fossils Laboratory Pre-Lab Discussion Because hominoid fossils
The Hominid Status of Sahelanthropus tchadensis and Orrorin tugenensis
 Darshana Shapiro Biological Anthropology Senior Honors Thesis May 2009 The Hominid Status of Sahelanthropus tchadensis and Orrorin tugenensis Introduction Since the time when Charles Darwin first proposed
Session 16: Episode 5(1) Introducing Episode 5, our ancient ancestors and their relatives
 Introducing Episode 5, our ancient ancestors and their relatives") Session 16: Episode 5(1) Introducing Episode 5, our ancient ancestors and their relatives William P. Hall President Kororoit Institute Proponents and Supporters Assoc., Inc. - http://kororoit.org william-hall@bigpond.com
Session 16: Episode 5(1) Introducing Episode 5, our ancient ancestors and their relatives William P. Hall President Kororoit Institute Proponents and Supporters Assoc., Inc. - http://kororoit.org william-hall@bigpond.com
Chapter 2 Human Origins: 7 Million to 1.9 Million Years Ago
 Chapter Overview Chapter 2 Human Origins: 7 Million to 1.9 Million Years Ago The chapter begins with a description of the Pleistocene epoch, which is also known as the Great Ice Age or the Ice Age. The
(01) Ardipithecus kadabba The Smithsonian Institution's Human Origins Program
 Ardipithecus kadabba The Smithsonian Institution's Human Origins Program") (01) Ardipithecus kadabba The Smithsonian Institution's Human Origins Program Ardipithecus kadabba Where Lived: Eastern Africa (Middle Awash Valley, Ethiopia) When Lived: Between about 5.8 and 5.2 million
(01) Ardipithecus kadabba The Smithsonian Institution's Human Origins Program Ardipithecus kadabba Where Lived: Eastern Africa (Middle Awash Valley, Ethiopia) When Lived: Between about 5.8 and 5.2 million
Lecture Human Evolution
 Lecture Human Evolution I. Although modern human behavior is almost totally learned and cultural, it rests on a biological basis A. The processes of human evolution shaped humans brain and body 1. Accurate
EARLY HUMANS COMPARE AND CONTRAST CHART
 Name: KEY Period: Date: World History Mrs. Schenck Early Human/ Nickname Ardipithecus ramidus Ardi Where they lived/ When Where: Eastern Africa (Ethiopia) When: 4.4 million years ago Very apelike, hairy
THE EARLIEST HUMANS. Student Handouts, Inc.
 THE EARLIEST HUMANS Student Handouts, Inc. HOMINID EVOLUTION Hominids = great apes Chimpanzees, gorillas, humans, and orangutans Numerous intermediary fossils have been found But scientists disagree on
Sahelanthropus tchadensis: An Examination of its Hominin Affinities and Possible Phylogenetic Placement
 Totem: The University of Western Ontario Journal of Anthropology Volume 16 Issue 1 Article 5 6-21-2011 Sahelanthropus tchadensis: An Examination of its Hominin Affinities and Possible Phylogenetic Placement
BIOL 1010 Introduction to Biology: The Evolution and Diversity of Life. Spring 2011 Sections A & B
 BIOL 1010 Introduction to Biology: The Evolution and Diversity of Life. Spring 2011 Sections A & B Steve Thompson: stthompson@valdosta.edu http://www.bioinfo4u.net 1 Human evolution where we came from
 2010-2014 www.d.umn.edu/cla/faculty/troufs/anthfood/aftexts.html#title 2010-2014 www.d.umn.edu/cla/faculty/troufs/anthfood/aftexts.html#title 2010-2014 www.d.umn.edu/cla/faculty/troufs/anthfood/aftexts.html#title
Science Tear Sheet #4. Human Evolution: The Story, the Legend, and the Myth
 Science Tear Sheet #4. Human Evolution: The Story, the Legend, and the Myth The man who pleads his case first seems to be in the right; then his opponent comes and puts him to the test. Proverbs 18:17
Looking a fossil horse in the mouth! Using teeth to examine fossil horses!
 Looking a fossil horse in the mouth Using teeth to examine fossil horses Virginia Museum of Natural History Paleontology Department Fossil Teaching Kit 1 Teacher s Guide In this activity students will
1. Use the diagrams below to investigate the pelvis and scapula models and identify anatomical structures. Articulated Pelvis
 LSO Pelvis/Scapula Activity Activity 1: Pelvis and Scapula Anatomy 1. Use the diagrams below to investigate the pelvis and scapula models and identify anatomical structures. Articulated Pelvis (anterior
ORIENTATION OF THE FORAMEN MAGNUM IN LATE MIOCENE TO EXTANT AFRICAN APES AND HOMINIDS
 Orientation of the Foramen Magnum in Late Miocene to Extant African Apes and Hominids XLIII/2 3 pp. 103 110 2005 MARTIN PICKFORD ORIENTATION OF THE FORAMEN MAGNUM IN LATE MIOCENE TO EXTANT AFRICAN APES
COMMON PRIMATE TRAITS
 WHAT DO YOU MEAN THAT LOOKING AT ME MAKES YOU UNDERSTAND HOW APES, MONKEYS, AND HUMANS MUST HAVE SHARED A COMMON ANCESTOR AT SOME POINT IN TIME? COMMON PRIMATE TRAITS PHYSICAL FEATURES ARBOREAL (TREE-LIVING)
SUPPLEMENTARY INFORMATION
 doi:10.1038/nature17654 Contents Supplementary Text S1. Calculating Locomotor Costs Supplementary Table 1. Estimated ranging costs for humans and other hominoids Supplementary Text S2. Estimating the Costs
The Evolutionary History of the Australopiths
 Evo Edu Outreach (2010) 3:341 352 DOI 10.1007/s12052-010-0249-6 ORIGINAL SCIENTIFIC ARTICLE The Evolutionary History of the Australopiths David S. Strait Published online: 27 July 2010 # Springer Science+Business
Morphometric Analysis of Hominoid Lower Molars from Yuanmou of Yunnan Province, China
 PRIMATES, 42(2): 123-134, April 21 123 Morphometric Analysis of Hominoid Lower Molars from Yuanmou of Yunnan Province, China W. LIw The Chinese Academy of Sciences L. J. HLUSKO The Pennsylvania State University
The search for Adam's ancestors
 341 by Elaine Kennedy : 12 E volutionary biologists are convinced that humans are descendants of ape-like creatures. n spite of a number of disputes over theories of apehuman lineages, paleoanthropologists
The Pliocene hominin diversity conundrum: Do more fossils mean less clarity?
 SPECIAL FEATURE: PERSPECTIVE SPECIAL FEATURE: PERSPECTIVE The Pliocene hominin diversity conundrum: Do more fossils mean less clarity? Yohannes Haile-Selassie a,b,1, Stephanie M. Melillo c, and Denise
Case Study: Climate, Biomes, and Equidae
 Case Study: Climate, Biomes, and Equidae In this activity, you will explore how environmental changes can shape life on Earth, using Equidae as a case study. By the end of the activity, you should be able
ARTICLE. New species from Ethiopia further expands Middle Pliocene hominin diversity
 ARTICLE doi:10.1038/nature14448 New species from Ethiopia further expands Middle Pliocene hominin diversity Yohannes Haile-Selassie 1,2, Luis Gibert 3, Stephanie M. Melillo 4, Timothy M. Ryan 5, Mulugeta
REMEMBER YOU WILL NOT BE ABLE TO ANSWER THE QUESTIONS ABOUT ISLAND BIOGEOGRAPHY UNTIL AFTER THE 12/1 LECTURE
 REMEMBER YOU WILL NOT BE ABLE TO ANSWER THE QUESTIONS ABOUT ISLAND BIOGEOGRAPHY UNTIL AFTER THE 12/1 LECTURE Answers to Practice questions week 14 and 15 (Answers are in BOLD): 1) The above is the generally
b44 Australopithecenes < southern ape, root hominin, forest >
 149 b44 Australopithecenes < southern ape, root hominin, forest > We think back with repugnance to that ancient biological pre-human scene whence we came; there no life was a sacred thing. There, millions
Origin and Evolution of Human Postcranial Anatomy
 CHAPTER 10 Origin and Evolution of Human Postcranial Anatomy Brian G. Richmond and Kevin G. Hatala INTRODUCTION One of the oldest questions in paleoanthropology concerns what stages, or body shapes and
Special Issue: Australopithecus sediba. Body Size and Proportions of Australopithecus sediba
 Special Issue: Australopithecus sediba Body Size and Proportions of Australopithecus sediba TRENTON W. HOLLIDAY Department of Anthropology, Tulane University, New Orleans, LA 70118, USA; and, Evolutionary
Evidence of a chimpanzee-sized ancestor of humans but a gibbon-sized ancestor of apes
 DOI: 0.08/s67-07-00997- OPEN Evidence of a chimpanzee-sized ancestor of humans but a gibbon-sized ancestor of apes Mark Grabowski,,, & William L. Jungers 5,6 Body mass directly affects how an animal relates
Project Description Form
 COTLOW FIELD RESEARCH FUND Department of Anthropology The George Washington University Washington, DC 20052 Project Description Form Applicant: Nicole L. Griffin Title of Project: Hominid Forefoot Kinematics,
Case Study: Climate, Biomes, and Equidae
 Case Study: Climate, Biomes, and Equidae In this activity, you will explore how environmental changes can shape life on Earth, using Equidae as a case study. By the end of the activity, you should be able
ABSTRACT A COMPARATIVE ANALYSIS OF PRIMATE FIRST METATARSALS: IMPLICATIONS FOR ARDIPITHECUS RAMIDUS
 ABSTRACT A COMPARATIVE ANALYSIS OF PRIMATE FIRST METATARSALS: IMPLICATIONS FOR ARDIPITHECUS RAMIDUS Kristine Mitchell, M.A. Department of Anthropology Northern Illinois University, 2014 Daniel Gebo, Director
Where Do We Come From? An Introduction to Primate Biology GK-12 Inquiry Science Lesson Kristin De Lucia Fall 2002
 Where Do We Come From? An Introduction to Primate Biology GK-12 Inquiry Science Lesson Kristin De Lucia Fall 2002 Background: This lesson is designed to correspond with units on human anatomy, especially
Our own species, Homo sapiens, belongs to the order that also
 32 3 Primates and Human Origins Section 32 3 Our own species, Homo sapiens, belongs to the order that also includes lemurs, monkeys, and apes. Carolus Linnaeus named our order Primates, which means first
The Mystery of the Skulls What Old Bones Can Tell Us About Hominins
 Cornell Institute for Biology Teachers Copyright CIBT This work may be copied by the original recipient from CIBT to provide copies for users working under the direction of the original recipient. All
Human Hunting Evolved as an Adaptated Result of Arboreal Locomotion Model of Two-arm Brachiation (Π) C.Fang 1, T.Jiang 2
 C.Fang 1, T.Jiang 2") Human Hunting Evolved as an Adaptated Result of Arboreal Locomotion Model of Two-arm Brachiation (Π) C.Fang 1, T.Jiang 2 1 Department of Engineering Mechanics, Chongqing University, Chongqing, 400044,
Human Hunting Evolved as an Adaptated Result of Arboreal Locomotion Model of Two-arm Brachiation (Π) C.Fang 1, T.Jiang 2 1 Department of Engineering Mechanics, Chongqing University, Chongqing, 400044,
VERTEBRATE EVOLUTION & DIVERSITY
 VERTEBRATE EVOLUTION & DIVERSITY 1 ANIMAL DIVERSITY No true tissues Ancestral protist True tissues Radial symmetry True Animals Bilateral symmetry Bilateral Animals Deuterostomes Lophotrochophores Ecdysozoans
Page 1 of 9. Website: Mobile:
 Question 1: Explain antibiotic resistance observed in bacteria in light of Darwinian selection theory. Darwinian selection theory states that individuals with favourable variations are better adapted than
The Deuterostomes and the rise of the Vertebrates: from Echinoderms to Man
 The Deuterostomes and the rise of the Vertebrates: from Echinoderms to Man 1 The Deuterostomes Calcarea and Silicea Cnidaria Lophotrochozoa Ecdysozoa Deuterostomia 2 The Ancestral Deuterostome Bilateral
Journal of Human Evolution
 Journal of Human Evolution 64 (2013) 556e568 Contents lists available at SciVerse ScienceDirect Journal of Human Evolution journal homepage: www.elsevier.com/locate/jhevol Hominin stature, body mass, and
Walking Upright The cost of human evolution
 LENScience Senior Biology Seminar Series 2010 Walking Upright The cost of human evolution Peter Gluckman, Alan Beedle, Tatjana Buklijas, Jacquie Bay 14 th October 2010 Human Evolution ????? Walking Upright
Class XII Chapter 7 Evolution Biology
 Question 1: Explain antibiotic resistance observed in bacteria in light of Darwinian selection theory. Darwinian selection theory states that individuals with favourable variations are better adapted than
Molar Development and Crown Areas in Early Australopithecus
 AMERICAN JOURNAL OF PHYSICAL ANTHROPOLOGY 000:000 000 (2012) Molar Development and Crown Areas in Early Australopithecus Rodrigo S. Lacruz, 1 * Fernando V. Ramirez Rozzi, 2 Bernard A. Wood, 3,4 and Timothy
ROBUST AUSTRALOPITHECINES, OUR FAMILY TREE,
 Research TOC ROBUST AUSTRALOPITHECINES, OUR FAMILY TREE, AND HOMOPLASY Henry M. McHenry Darwin never predicted the existence of the robust australopithecines. 1 In his 1872 book The Descent of Man he foretold
The life history of Ardipithecus ramidus: a heterochronic model of sexual and social maturation
 Early origins of human sexual and social maturation Gary Clark, Maciej Henneberg Anthropological Review Vol. 78 (2), 109 132 (2015) The life history of Ardipithecus ramidus: a heterochronic model of sexual
Introduction to Biological Anthropology: Notes 19 Lifestyles of the toolmaking Oldowan hominins Copyright Bruce Owen 2008 The earliest stone tools
 Introduction to Biological Anthropology: Notes 19 Lifestyles of the toolmaking Oldowan hominins Copyright Bruce Owen 2008 The earliest stone tools appear in East Africa around 2.5 mya the Oldowan tool
Level 3 Biology, 2017
 91606 916060 3SUPERVISOR S Level 3 Biology, 2017 91606 Demonstrate understanding of trends in human evolution 9.30 a.m. Thursday 16 November 2017 Credits: Four Achievement Achievement with Merit Achievement
Short Film Great Transitions: The Origin of Humans IN-DEPTH FILM GUIDE
 DESCRIPTION IN-DEPTH FILM GUIDE Paleontologists have studied the fossil record of human evolution just as they have done for that of other major transitions including the transition from fish to tetrapods
BIO 182 LAB SIGN OFF PAGE LESSON 10
 BIO 182 LAB SIGN OFF PAGE LESSON 10 Name Please staple all of your lab pages for this Lesson together with this page as the top. You will use this page to get your Labs for Lesson 10 signed off by the
Introduction to Biological Anthropology: Notes 10 An introduction to our relatives Copyright Bruce Owen 2008
 Order: Primates Introduction to Biological Anthropology: Notes 10 An introduction to our relatives Copyright Bruce Owen 2008 Suborders of primates: prosimians vs. anthropoids Suborder: prosimians our most