2015 Urban Mobility Scorecard. Scott Weber, Transportation Planner & Analyst James Winters, Regional Planner & Policy Analyst
|
|
|
- Tyrone Waters
- 5 years ago
- Views:
Transcription
1 2015 Urban Mobility Scorecard Scott Weber, Transportation Planner & Analyst James Winters, Regional Planner & Policy Analyst

2 Introduction 1. Congestion Trends 2. Compounding Problems 3. Possible Solutions

3 Introduction Chicago Metropolitan Region Ranked 8 th worst in Yearly Delay per Auto Commuter Ranked 14 th worst in Travel Time Index Ranked 5 th worst in Excess Fuel per Auto Commuter Ranked 7 th worst in Congestion Cost per Auto Commuter
 is a")

4 Who Wrote the Urban Mobility Scorecard? The Texas A&M Transportation Institute (TTI) is a Transportation Research Agency hosted at Texas A&M University Over 200 professionals from both public and private sector contribute Endowed with $65 million
5 Who Wrote the Urban Mobility Scorecard? Our Mission is to identify and solve transportation problems through research; to transfer technology and knowledge; and to develop diverse human resources to meet the transportation challenges of tomorrow. -TTI Mission Statement


6 What Data were used in the Report? INRIX traffic data from vehicle probes and in-road sensors Data gathered at 15-minute intervals for all major roads (113 million miles of centerline across the U.S.)
7 Causes and Impacts of Congestion

8 Causes and Impacts of Congestion - Economy The recovery of the Great Recession (2008) has lead to the following: More vehicles traveling because of lower gas prices and higher average wages More freight traffic Decreased investment in public infrastructure
9
10 Vehicle-Distance Traveled (Billion Miles) Moving 12-Month Total on ALL Roads 3,500 3,450 3,400 3,350 3,300 3,250 3,200 3,150 3,100 3,050 3,000 2,950 2,900 2,850 2,800 2,750 2,700 2,650 2,600 2,550 2,500 2,450 2,400 2,350 2,300 2,250 2,200 2,150 2,100 2,050 2,000 Source: US Department of Transportation
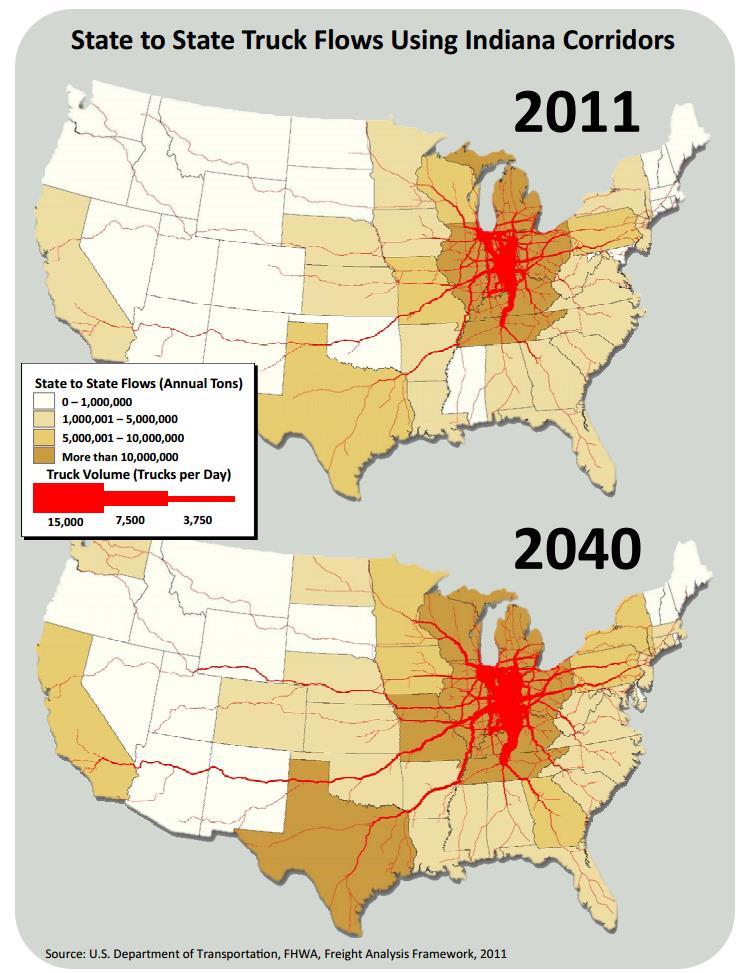
11 Causes and Impacts of Congestion - Freight Tons of Domestic Highway Freight Shipments, (Millions) 18,130 14,930 10,


12 Causes and Impacts of Congestion - Freight Average Daily Truck Traffic: 1998 Average Daily Truck Traffic: 2020
13
14
15


16 Causes and Impacts of Congestion Freight traffic accounts only represents 7% percent of urban travel, however freight accounts for 18% of the cost per vehicle Total Traffic 7% Total Cost of Congestion 18%
17 Delay Per Commuter 90 Hours of Delay per Driver in the U.S. and NW Indiana NW Indiana U.S
18 Total Delay in the U.S. 8,000 Hours of Delay (millions) in the U.S. from ,000 6,000 5,000 4,000 3,000 2,000 1,000 0
19 Total Delay in NW Indiana 25 Hours of Delay (millions) in Northwest Indiana from
20 Total Delay in the U.S. and NW Indiana 8,000 Hours of Delay (millions) in the U.S. and NW Indiana from , % increase ,000 5,000 4,000 NW Indiana U.S. 3,000 2,000 1, % increase % increase
21 Cost of Congestion in the U.S. 180,000 Cost of Congestion in the U.S. (millions 2014 $) 160, , , ,000 80,000 60,000 40,000 20,000 0
22 Cost of Congestion in NW Indiana 600 Cost of Congestion in NW Indiana (millions 2014 $)


23 Percent Delay for Each Day of the Week Percent of Delay Hours of Day

24 Solutions Add Capacity in Critical Corridors Provide Choices Change the Use Pattern Diversify the Development Pattern Realistic Expectations


25 Add Capacity in Critical Corridors National Efforts Intercounty Connector, Maryland/DC


26 Add Capacity in Critical Corridors National Efforts Intercounty Connector, Maryland/DC Shoulder Lane Use on I-495, Tysons Corner, VA


27 Add Capacity in Critical Corridors NIRPC Efforts New Expressway Projects: Illiana Expressway


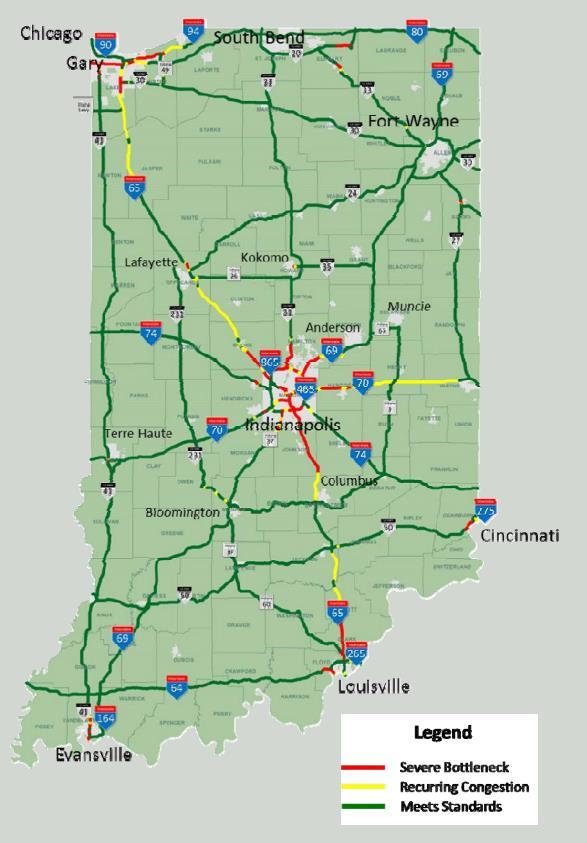
28 Add Capacity in Critical Corridors NIRPC Efforts New Expressway Projects: Illiana Expressway Bottleneck improvement projects: NWI At-Grade Crossing Study

29 Add Capacity in Critical Corridors NIRPC Efforts New Expressway Projects: Illiana Expressway Bottleneck improvement projects: NWI At-Grade Crossing Study Regional Improvements: Regional Corridors Study


30 Provide Choices National Efforts San Francisco Highway vs Transit


31 Provide Choices National Efforts San Francisco Highway vs Transit Smartphone Applications

32 Provide Choices NIRPC Efforts Intelligent Transportation Systems


33 Change The Use Pattern National Efforts Flexible work-time options


34 Change The Use Pattern National Efforts Flexible work-time options Telecommunication options

35 Change The Use Pattern NIRPC Efforts Flexible work-time options Telecommunication options

36 Change The Use Pattern NIRPC Efforts Flexible work-time options Telecommunication options Could do more to influence the use pattern


37 Diversify the Development Patterns National Efforts Mixed-Use Development

38 Diversify the Development Patterns NIRPC Efforts Creating Livable Communities
39 Realistic Expectations National Efforts Educational Awareness: 2015 Urban Mobility Scorecard

40 Realistic Expectations National Efforts Educational Awareness: 2015 Urban Mobility Scorecard Performance Measures that set realistic goals
41 Conclusions Traffic congestion is a growing problem Better data help pinpoint the symptoms of the congestion problem No silver bullet solution to the problem, only a menu of options Traffic congestion goes hand in hand with economic growth
Performance Measure Summary - Chicago IL-IN. Performance Measures and Definition of Terms
 Performance Measure Summary - Chicago IL-IN There are several inventory and performance measures listed in the pages of this Urban Area Report for the years from 1982 to 2014. There is no single performance
Performance Measure Summary - San Jose CA. Performance Measures and Definition of Terms
 Performance Measure Summary - San Jose CA There are several inventory and performance measures listed in the pages of this Urban Area Report for the years from 1982 to 2014. There is no single performance
Performance Measure Summary - Denver-Aurora CO. Performance Measures and Definition of Terms
 Performance Measure Summary - Denver-Aurora CO There are several inventory and performance measures listed in the pages of this Urban Area Report for the years from 1982 to 2014. There is no single performance
Measuring the Distribution and Costs of Congestion. Tim Lomax Texas Transportation Institute
 Measuring the Distribution and Costs of Congestion Tim Lomax Texas Transportation Institute http://mobility.tamu.edu The Congestion Measurement Story Travel time, variations, compare to goals WHAT? WHY?
Maryland State Highway Mobility Report. Morteza Tadayon
 Maryland State Highway Mobility Report Morteza Tadayon Background Mobility is a Key Performance Area (KPA) in the SHA Business Plan SHA adopts a performance based approach Monitors Highway System to identify
Using GPS Data for Arterial Mobility Performance Measures
 Using GPS Data for Arterial Mobility Performance Measures Paul Czech, MnDOT Shawn Turner, TTI CTS Research Conference May 22, 2014 ~ St. Paul, MN Methodology & Results INRIX GPS Data + = Road Inventory
Clouds, Crowds, and Traffic: What 10 Emerging Megatrends Mean for the Future of Transportation
 Portland State University PDXScholar TREC Friday Seminar Series Transportation Research and Education Center (TREC) 11-1-2013 Clouds, Crowds, and Traffic: What 10 Emerging Megatrends Mean for the Future
Presented by: Keith Nichols, PE Principal Transportation Engineer, TTAC Agenda Item #14 October 7, 2015
 TTI URBAN MOBILITY SCORECARD 2015 Report Presented by: Keith Nichols, PE Principal Transportation Engineer, TTAC Agenda Item #14 October 7, 2015 INTRODUCTION The TTI Urban Mobility Scorecard report evaluates
DECEMBER 2012 URBANMOBILITY REPORT POWERED BY REGION UNIVERSITY TRANSPORTATION CENTER
 URBANMOBILITY REPORT DECEMBER 2012 2012 POWERED BY REGION UNIVERSITY TRANSPORTATION CENTER TTI s 2012 URBAN MOBILITY REPORT Powered by INRIX Traffic Data David Schrank Associate Research Scientist Bill
Traffic Congestion in Houston. Presented by Bill King
 Traffic Congestion in Houston Presented by Bill King www.billkinghouston.com The Travel Time Index Defined 1.36 30 Minute Trip = 41 Minute Trip (+ 36%) The History of Congestion in Houston Growing Congestion
MOBILITY RESULTS AREA. Budgeting For Outcomes Council Presentation January 12, 2007
 MOBILITY RESULTS AREA Budgeting For Outcomes Council Presentation January 12, 2007 Mobility Results Team Members 2 Hammond Perot, OED, Co-Team Leader Bonnie Meeder, DEV (returning), Co-Team Leader Peer
Final Report. Real-Timing the 2010 Urban Mobility Report. Tim Lomax, David Schrank, Shawn Turner, Lauren Geng, Yingfeng Li, and Nick Koncz
 Improving the Quality of Life by Enhancing Mobility University Transportation Center for Mobility DOT Grant No. DTRT06-G-0044 Real-Timing the 2010 Urban Mobility Report Final Report Tim Lomax, David Schrank,
MONTGOMERY COUNTY PLANNING DEPARTMENT THE MARYLAND-NATIONAL CAPITAL PARK AND PLANNING COMMISSION
 MONTGOMERY COUNTY PLANNING DEPARTMENT THE MARYLAND-NATIONAL CAPITAL PARK AND PLANNING COMMISSION MCPB Item No. 4 Date: 04-17-14 2014 Mobility Assessment Report José Dory, Senior Planner, Functional Planning
13,351. Overall Statewide Results. How was the survey taken? Do you own or lease a personal vehicle? What is your primary means of transportation?
 Overall Statewide Results 3 1 Houston 2 Dallas 3 Fort Worth 4 San Antonio 2 11 12 Austin 6 Laredo / Pharr 7 Corpus Christi / Yoakum 8 Bryan / Waco 9 Atlanta / Beaumont / Lufkin / Paris / Tyler Amarillo
Cities Connect. Cities Connect! How Urbanity Supports Social Inclusion
 Cities Connect! How Urbanity Supports Social Inclusion Todd Litman Victoria Transport Policy Institute Metropolis Toronto, Canada - 14 June 2006 Cities Connect People with people. People with jobs. People
Passenger Rail in Virginia
 Passenger Rail in Virginia Executive Summary! In 2011, Washington DC-VA-MD ranked 1st in the U.S. per auto commuter in the following categories:1 o Yearly Delay; 67 hours o Excess Fuel; 32 gallons o Congestion
CONGESTED LOS ANGELES
 CONGESTED LOS ANGELES Prepared For: Mayor Antonio Villaraigosa and City Council City of Los Angeles Prepared By: Jacki Murdock Transportation Analyst LADOT December 11 th, 2011 Outline What causes congestion?
Managed Lanes: A National Perspective Managed Lane Strategies
 Managed Lanes: A National Perspective Managed Lane Strategies Use the following control strategies to manage a lane(s) to provide a reliable transportation option: Eligibility/occupancy Access control
3 ROADWAYS 3.1 CMS ROADWAY NETWORK 3.2 TRAVEL-TIME-BASED PERFORMANCE MEASURES Roadway Travel Time Measures
 ROADWAYS Approximately 6 million trips are made in the Boston metropolitan region every day. The vast majority of these trips (80 to percent, depending on trip type) involve the use of the roadway network
Planning Daily Work Trip under Congested Abuja Keffi Road Corridor
 ISBN 978-93-84468-19-4 Proceedings of International Conference on Transportation and Civil Engineering (ICTCE'15) London, March 21-22, 2015, pp. 43-47 Planning Daily Work Trip under Congested Abuja Keffi
Transportation Day at the Capitol. Charlie Zelle Commissioner, MnDOT Feb. 16, 2017
 Transportation Day at the Capitol Charlie Zelle Commissioner, MnDOT Feb. 16, 2017 State Transportation System Highways 59.1 billion annual vehicle miles traveled 33.1 billion on trunk highways Bridges
Preview. Tables in your paper Mass Transit as alternative to auto California s problems in urban transportation
 Preview Tables in your paper Mass Transit as alternative to auto California s problems in urban transportation Integrating tables in your writing Commuting in Urban Areas Last time auto and congestion
December 2010 URBAN MOBILITY REPORT2010
 December 2010 URBAN MOBILITY REPORT2010 POWERED BY TTI s 2010 URBAN MOBILITY REPORT Powered by INRIX Traffic Data David Schrank Associate Research Scientist Tim Lomax Research Engineer and Shawn Turner
Purpose and Need. Chapter Introduction. 2.2 Project Purpose and Need Project Purpose Project Need
 Chapter 2 Purpose and Need 2.1 Introduction The El Camino Real Bus Rapid Transit (BRT) Project (Project) would make transit and other transportation improvements along a 17.6-mile segment of the El Camino
MULTIMODAL NEEDS ASSESSMENT
 5. PORTS OF ENTRY INTRODUCTION The El Paso MPO region is one of the most significant border crossing regions in the United States. Known as the world s largest international border metroplex, traffic and
FUTURE MOBILITY IN TEXAS: The Cost of Meeting the State s Need for Safe and Efficient Mobility
 FUTURE MOBILITY IN TEXAS: The Cost of Meeting the State s Need for Safe and Efficient Mobility OCTOBER 2012 202-466-6706 www.tripnet.org Founded in 1971, TRIP, of Washington, DC is a nonprofit organization
Bob Costello Chief Economist & Vice President American Trucking Associations. Economic & Motor Carrier Industry Update.
 Bob Costello Chief Economist & Vice President American Trucking Associations Economic & Motor Carrier Industry Update February 26, 2013 The Worst Recession Since the Great Depression 0% Loss from Peak
The Region s Most Expensive Commutes:
 The Region s Most Expensive Commutes: Congested Corridors in the Lehigh Valley-Reading Area and Steps Needed to Relieve Traffic Congestion June 2013 Washington, DC Phone: (202) 466-6706 www.tripnet.org
Tulsa Metropolitan Area LONG RANGE TRANSPORTATION PLAN
 Tulsa Metropolitan Area LONG RANGE TRANSPORTATION PLAN Indian Nations Council of Governments August 2005 CONTACTING INCOG In developing the Destination 2030 Long Range Transportation Plan, INCOG s Transportation
Congestion Management Report
 Congestion Management Report F.E. EVERETT TURNPIKE (NORTH), MERRIMACK Segment Length: 7.0 miles Daily Traffic Volumes: 60,000-69,000 Analysis Period: May 2015 Number of Traffic Signals: 0 Number of travel
Transportation in Washoe County. Lee Gibson, Executive Director February 15, 2011
 Transportation in Washoe County Lee Gibson, Executive Director February 15, 2011 RTC OF WASHOE COUNTY Metropolitan Planning Organization Meet long term needs Deliver federal funding Program projects in
Traffic Hotspots. Measuring the impact of congestion in the United States. Measuring September 2017 the impact of congestion in the United States
 The US Traffic United Hotspots States Measuring the impact of congestion in the United States Traffic Hotspots INRIX Research Bob Pishue 1 Measuring September 2017 the impact of congestion in the United
US 69 RELIEF ROUTE STUDY
 US 69 RELIEF ROUTE STUDY Jacksonville, Texas PUBLIC MEETING #2 May 29 th, 2018 Welcome to the public meeting for the US 69 Relief Route Study in Jacksonville. This is the second public meeting for this
Fast Affordable Sustainable Transportation
 Fast Affordable Sustainable Transportation Bay Area October 2017 PC: Dllu Waking up from our traffic nightmare Transportation in the Bay Area has reached a crisis point. There is grinding congestion on
MULTIMODAL NEEDS ASSESSMENT
 1. ROADWAY INTRODUCTION The roadway network is the backbone of the region s transportation system. While Destino 2045 strives to establish a multi-modal transportation system, the roadway network is still
Mobility and Congestion
 Technical Memorandum Mobility and Congestion Prepared for: Prepared by: September 25, 2013 1 Table of Contents 1. Introduction... 1 2. Congestion Forecasting Process... 1 2.1 Mobility and Congestion Terms...
Governor s Transportation Vision Panel
 Office of Governor Kate Brown Governor s Transportation Vision Panel JLA Public Involvement Project Overview The is a yearlong effort to develop a series of recommendations for the Governor that address
Multimodal Transportation Plan
 Multimodal Transportation Plan The Multimodal Transportation Plan will accommodate MILLENIALS ARE DRIVING LESS. WE CANNOT BUILD OUR WAY all modes of transportation by keeping pedestrians, OUT OF CONGESTION.
Preview. Second midterm Tables in your paper Mass Transit as alternative to auto California s problems in urban transportation
 Preview Second midterm Tables in your paper Mass Transit as alternative to auto California s problems in urban transportation Score Distribution 1 st Midterm 2 nd Midterm 3.5-4.0 8% 21% 3.0-3.5 23% 34%
Improving Mobility Without Building More Lanes
 Improving Mobility Without Building More Lanes By Mike Salisbury and Will Toor July 2017 Copyright 2017 by Southwest Energy Efficiency Project. All rights reserved. Photo: Courtesy of the Denver Post Anyone
Performance Criteria for 2035 Long Range Transportation Plan
 Minimizing Impacts on Natural, Historic, Cultural or Archeological Resources 2035 LRTP Weighting Factor: 7% Objective 1.1: Use appropriate planning and design criteria to protect and enhance the built
July 10, :00-11:30 a.m.
 July 10, 2012 10:00-11:30 a.m. 1. Welcome and Self Introductions 2. Briefing on 10 & 110 Metro ExpressLanes Stephanie Wiggins, Executive Officer, ExpressLanes Demo Project, Metro Metro ExpressLanes is
National Capital Region Congestion Report
 NATIONAL CAPITAL REGION TRANSPORTATION PLANNING BOARD National Capital Region Congestion Report 4th Quarter 2015 Metropolitan Washington Council of Governments 777 North Capitol Street, N.E., Suite 300,
THE 2007 URBAN MOBILITY REPORT
 THE 2007 URBAN MOBILITY REPORT David Schrank Associate Research Scientist and Tim Lomax Research Engineer Texas Transportation Institute The Texas A&M University System http://mobility.tamu.edu September
TAMPA BAY EXPRESS (TBX)
") TAMPA BAY EXPRESS (TBX) Hank Schneider, P.E. FDOT- District 7 Consultant Project Manager Florida Department of TRANSPORTATION TAMPA BAY EXPRESS AGENDA What is TBX? What does TBX do? Why is TBX Important?
TAMPA BAY EXPRESS (TBX) Hank Schneider, P.E. FDOT- District 7 Consultant Project Manager Florida Department of TRANSPORTATION TAMPA BAY EXPRESS AGENDA What is TBX? What does TBX do? Why is TBX Important?
92% COMMUTING IN THE METRO. Congested Roadways Mode Share. Roadway Congestion & Mode Share
 COMMUTING IN THE METRO Roadway Congestion & Mode Share The majority of major roadways in Greater Des Moines are without congestion and have underutilized capacity. This surplus capacity could be used for
Los Angeles Congested Corridor Study and Comparisons with Texas Transportation Institute Congestion Estimates
 Proceedings of the 2013 Industrial and Systems Engineering Research Conference A. Krishnamurthy and W.K.V. Chan, eds. Los Angeles Congested Corridor Study and Comparisons with Texas Transportation Institute
Project Description Form 6V
 Project Description Form 6V Basic Project Information Submitting Jurisdiction/Agency: Prince William County Project Title: Route 15 Widening: Route 55 to south of RR tracks & Construct RR Overpass Project
CONGESTION REPORT 4 th Quarter 2016
 CONGESTION REPORT 4 th Quarter 2016 A quarterly update of the National Capital Region s traffic congestion, travel time reliability, top-10 bottlenecks and featured spotlight January 16, 2018 ABOUT TPB
SUPERSTREETS IN TEXAS. ITS Texas Annual Meeting San Marcos, Texas Session 6A - Operations November 11, 2011
 SUPERSTREETS IN TEXAS ITS Texas Annual Meeting San Marcos, Texas Session 6A - Operations November 11, 2011 1 Superstreet Corridor Location 2 3 US Highway 281 2007 Looking south above Evans Road, pm peak
Corporate. Report COUNCIL DATE: June 26, 2006 NO: C012 COUNCIL-IN-COMMITTEE. TO: Mayor & Council DATE: June 22, 2006
 Corporate NO: C012 Report COUNCIL DATE: June 26, 2006 COUNCIL-IN-COMMITTEE TO: Mayor & Council DATE: June 22, 2006 FROM: General Manager, Engineering FILE: 0410-20(MoT/Gate) SUBJECT: Surrey Response on
Sustainable Transportation Planning in the Portland Region
 Sustainable Transportation Planning in the Portland Region Jennifer Dill, Ph.D. Associate Professor School of Urban Studies & Planning jdill@pdx.edu http://web.pdx.edu/~jdill/ Outline Elements of a sustainable
Congestion Reducing Activities. Toby Carr GDOT Director of Planning April 10, 2014
 Congestion Reducing Activities Toby Carr GDOT Director of Planning April 10, 2014 GDOT Performance Dashboard Congestion Congestion Relief Strategies 511 HEROS RTOP Highway Emergency Response Operators
100 Most Congested Roadways in Texas
 100 Most Congested Roadways in Texas 2018 Report EXECUTIVE SUMMARY In response to increased roadway congestion throughout the state, in 2009 the Texas Legislature mandated that the Texas Department of
February 2018 HIGHWAY 316 IMPROVEMENTS PROJECT
 February 2018 HIGHWAY 316 IMPROVEMENTS PROJECT Agenda 1 2 3 4 5 A Message from the City Project Area Traffic Conditions Pedestrian/Bicycle Comfort & Safety Next Steps Q&A City of Hastings Supports a study
National Capital Region Congestion Report
 NATIONAL CAPITAL REGION TRANSPORTATION PLANNING BOARD National Capital Region Congestion Report 2nd Quarter 2015 Metropolitan Washington Council of Governments 777 North Capitol Street, N.E., Suite 300,
Corridor Advisory Group and Task Force Meeting #10. July 27, 2011
 Corridor Advisory Group and Task Force Meeting #10 July 27, 2011 1 Agenda Recap CAG/TF #9 Public Meeting #2 Summary Single Mode Alternatives Evaluation Results Next Steps 2 3 CAG/TF #9 Recap CAG /TF #9
FACTS AND FIGURES: MAKING THE CASE FOR COMPLETE STREETS IN LEE COUNTY
 FACTS AND FIGURES: MAKING THE CASE FOR COMPLETE STREETS IN LEE COUNTY Safety: Close to 5,000 pedestrians and bicyclists die each year on U.S. roads, and more than 70,000 are injured. [Mean Streets, Surface
June 2015 REGIONAL TRANSPORTATION SNAPSHOT
 June 2015 REGIONAL TRANSPORTATION SNAPSHOT THE REGION Who are we? The Greater Toronto and Hamilton Area (GTHA), consisting of Durham Region, Halton Region, the City of Hamilton, Peel Region, the City of
October 29, Modern traffic mitigation for development in cities: Moving beyond LOS
 Modern traffic mitigation for development in cities: Moving beyond LOS October 29, 2018 Modern traffic mitigation for development in cities: Moving beyond LOS State Smart Transportation Initiative Practical
Shenango Valley MPO. State Transportation Commission 2015 Twelve Year Program Development
 State Transportation Commission 2015 Twelve Year Program Development Regional results of the survey and public feedback from August thru November 2013 Shenango Valley MPO Version 01-2014 Mobility Concerns
Appendix SEA Seattle, Washington 2003 Annual Report on Freeway Mobility and Reliability
 (http://mobility.tamu.edu/mmp) Office of Operations, Federal Highway Administration Appendix SEA Seattle, Washington 2003 Annual Report on Freeway Mobility and Reliability This report is a supplement to:
POTENTIAL SANTA CLARA COUNTY TRANSPORTATION MEASURE
 POTENTIAL SANTA CLARA COUNTY TRANSPORTATION MEASURE OVERALL DRAFT EXPENDITURE PLAN TRANSIT/Mode Shift Millions % BART to Downtown San Jose/Santa Clara* 1,400 23% Caltrain Capacity & Safety 1,014 17% Mass
Congestion Evaluation Best Practices
 Congestion Evaluation Best Practices Todd Litman Victoria Transport Policy Institute Presented International Transportation and Economic Development Conference 10 April 2014 Congestion Indicators Indicator
Travel Patterns and Characteristics
 DRAFT 2006 Transportation Fact Book SECTION 4 Travel Patterns and Characteristics 43 2006 Transportation Fact Book DRAFT 44 DRAFT 2006 Transportation Fact Book Why do we conduct travel surveys? The main
Bob Costello Chief Economist & Vice President American Trucking Associations. Economic & Motor Carrier Industry Trends. September 10, 2013
 Bob Costello Chief Economist & Vice President American Trucking Associations Economic & Motor Carrier Industry Trends September 10, 2013 The Freight Economy Washington continues to be a headwind on economic
Highway 217 Corridor Study. Phase I Overview Report
 Highway 217 Corridor Study Phase I Overview Report November 3, 24 BACKGROUND AND OVERVIEW Study purpose The Highway 217 Corridor Study is developing multi-modal transportation solutions for traffic problems
INTERSECTIONS. Metro Denver 2016 Economic Forecast January 2016
 INTERSECTIONS Metro Denver 2016 Economic Forecast January 2016 Employment Intersections Employment growth and Great Recession recovery Industry clusters Average annual salary Photo Credit: istockphoto
Automatisch rijden, het gedrag van bestuurders en verkeersstromen
 Automatisch rijden, het gedrag van bestuurders en verkeersstromen Bart van Arem EVU Symposium, 9 september 2016, Postillion Hotel Amersfoort Veluwemeer Rivium Buses (Rotterdam) 2013: DAVI on the road 2016:
What is the Congestion Management Process? What is Congestion? Growth in the Treasure Valley Development and Congestion
 Treasure Valley Annual Congestion Management System Report, 2017 07-2019 February 2019 Table of Contents Background and Introduction... 2 What is the Congestion Management Process?... 2 What is Congestion?...
PLANNING FOR SUSTAINABLE PEDESTRIAN INFRASTRUCTURE NALIN SINHA INITIATIVE FOR TRANSPORTATION & DEVELOPMENT PROG. (ITD), DELHI
, DELHI") PLANNING FOR SUSTAINABLE PEDESTRIAN INFRASTRUCTURE NALIN SINHA INITIATIVE FOR TRANSPORTATION & DEVELOPMENT PROG. (ITD), DELHI India s Road Network 5 million kms: Total road length 2.6 mn kms: Surfaced
PLANNING FOR SUSTAINABLE PEDESTRIAN INFRASTRUCTURE NALIN SINHA INITIATIVE FOR TRANSPORTATION & DEVELOPMENT PROG. (ITD), DELHI India s Road Network 5 million kms: Total road length 2.6 mn kms: Surfaced
North Coast Corridor:
 North Coast Corridor: Connecting People, Transportation & Environment Legislative Hearing: 11.8.10 1 North Coast Corridor Region s Lifeline A Regional Strategy Mobility, Economy & Environment North Coast
FROM HIGHWAYS TO BOULEVARDS: STREET TRANSFORMATIONS FOR PUBLIC LIFE BONAVENTURE PROJECT
 FROM HIGHWAYS TO BOULEVARDS: STREET TRANSFORMATIONS FOR PUBLIC LIFE BONAVENTURE PROJECT By Simon Pouliot, Urban designer - City of Montreal Designing Cities 2018: Los Angeles / NACTO October 3 rd, 2018
Reversible Elevated Express Lanes. A Solution for Urban Traffic Congestion
 Lee Roy Selmon Crosstown Expressway Reversible Elevated Express Lanes A Solution for Urban Traffic Congestion Martin Stone, Ph.D., AICP Director of Planning Tampa-Hillsborough Expressway Authority Pensacola
Appendix LOU Louisville, Kentucky 2003 Annual Report on Freeway Mobility and Reliability
 (http://mobility.tamu.edu/mmp) Office of Operations, Federal Highway Administration Appendix LOU Louisville, Kentucky 2003 Annual Report on Freeway Mobility and Reliability This report is a supplement
The Changing Global Economy Impacts on Seaports and Trade Dr. Walter Kemmsies
 The Changing Global Economy Impacts on Seaports and Trade Dr. Walter Kemmsies Chief Economist, PAGI Group, JLL (Port, Airport & Global Infrastructure) Agenda Where are we in the cycle? What are the barriers
PERFORMANCE ANALYSIS of The Draft 2015 CLRP
 Item 9 PERFORMANCE ANALYSIS of The Draft CLRP Presentation to the Transportation Planning Board September 16, CLRP Performance Analysis 1 What is the Long-Range Transportation Plan (CLRP)? The CLRP identifies
World exports as a share of GDP
 World exports as a share of GDP 35% 30% 25% 20% 15% 1991 1993 1995 1997 1999 2001 2003 2005 2007 2009 Source: WTO, World Bank. World goods and service exports US$ trillions Commercial services (L) Total
2014 Mobility Assessment Report Functional Planning & Policy Montgomery County Planning Department
 2014 Mobility Assessment Report Functional Planning & Policy Montgomery County Planning Department Travel Trends National & Local Travel Trends Multi-Modal Monitoring Pedestrian Bikes Bus Rail Future Efforts
Transportation Master Plan Advisory Task Force
 Transportation Master Plan Advisory Task Force Network Alternatives & Phasing Strategy February 2016 BACKGROUND Table of Contents BACKGROUND Purpose & Introduction 2 Linking the TMP to Key Council Approved
DES MOINES AREA MPO. Presentation to Iowa Commercial Real Estate Association. April 6, 2017
 DES MOINES AREA MPO Presentation to Iowa Commercial Real Estate Association April 6, 2017 Presentation Outline MPO Overview Trends We re Watching Plans, Projects, Initiatives, Regional Transportation Priorities
For Immediate Release September 14, 2015 Contact: Sue Chrzan Tampa Hillsborough Expressway Authority ext.
 For Immediate Release September 14, 2015 Contact: Sue Chrzan Tampa Hillsborough Expressway Authority sue@tampa-xway.com 813-272-6740 ext.130 (office) U.S. Transportation Under-Secretary Peter Rogoff and
2. Context. Existing framework. The context. The challenge. Transport Strategy
 Transport Strategy Providing quality connections Contents 1. Introduction 2. Context 3. Long-term direction 4. Three-year priorities 5. Strategy tree Wellington City Council July 2006 1. Introduction Wellington
# Southeastern Wisconsin Regional Freeway System Reconstruction Study and Preliminary Recommended Plan
 #70421 Southeastern Wisconsin Regional Freeway System Reconstruction Study and Preliminary Recommended Plan Public Information Meetings and Hearings May June 2002 1 Reason for Freeway System Study 270-mile
I-25 PEL: CO Springs Denver South Connection. Presentation to Castle Rock Town Council
 I-25 PEL: CO Springs Denver South Connection Presentation to Castle Rock Town Council June 20, 2017 An Important Corridor to Colorado Links the state s two major metropolitan areas and communities between
STUDY ADVISORY COMMITTEE. October 8, 2015
 STUDY ADVISORY COMMITTEE October 8, 2015 Study Purpose evaluate the long-term transportation strategies and investments needed to sustain the county s economic health and quality of life in the coming
Trade Growth - Fundamental Driver of Port Operations and Development Strategies
 Trade Growth - Fundamental Driver of Port Operations and Development Strategies Marine Terminal Management Training Program October 15, 2007 Long Beach, CA Paul Bingham Global Insight, Inc. 1 Agenda Economic
Wide-area area, User Friendly Performance Monitoring. Michael L. Pack, University of Maryland CATT Laboratory 1
 Visualizing Performance Wide-area area, User Friendly Performance Monitoring Michael L. Pack, University of Maryland CATT Laboratory 1 2 Lots of Data. Now what? Transportation agency emphasis on data collection,
Appendix PDX Portland, Oregon 2003 Annual Report on Freeway Mobility and Reliability
 (http://mobility.tamu.edu/mmp) Office of Operations, Federal Highway Administration Appendix PDX Portland, Oregon 2003 Annual Report on Freeway Mobility and Reliability This report is a supplement to:
Appendix PIT Pittsburgh, Pennsylvania 2003 Annual Report on Freeway Mobility and Reliability
 (http://mobility.tamu.edu/mmp) Office of Operations, Federal Highway Administration Appendix PIT Pittsburgh, Pennsylvania 2003 Annual Report on Freeway Mobility and Reliability This report is a supplement
North Carolina Complete Streets Summit. Welcome and Opening Plenary
 North Carolina Complete Streets Summit Welcome and Opening Plenary Schedule Overview 9:00 am 10:15 am 12:00 pm 1:15 pm 3:00 pm Opening Plenary Morning Breakout Sessions Lunch Afternoon Breakout Sessions
Better Market Street Project Update. Urban Forestry Council September 17, 2014
 Better Market Street Project Update Urban Forestry Council September 17, 2014 Project Area Limits Better Market Street Schedule Market Street City s busiest transit corridor Over 85 buses per hour 14 surface
Findings. TSTC went line-by-line through the STIP and categorized projects into 15 categories:
 Tracking the Dollars 2012-2015: A Review of Planned Transportation Investments in Connecticut and what it says about Connecticut s transportation priorities The Connecticut Department of Transportation
Attachment A: Columbus Area Metropolitan Transportation Plan Objectives, Performance Measures, and Targets
 OBJECTIVE: Reduce the percentage of commuters driving alone, and increase the percentage of commuters riding transit, ing Reducing single occupancy auto commutes and increasing commuters using alternative
Cairo Traffic Congestion Study Phase 1
 Cairo Traffic Congestion Study Phase 1 Final Report November 2010 This report was prepared by ECORYS Nederland BV and SETS Lebanon for the World Bank and the Government of Egypt, with funding provided
INTRODUCTION. The focus of this study is to reduce congestion and improve mobility for all modes of transportation. Figure ES-1 Study Corridor Map
 INTRODUCTION The I-280 Corridor Study is a highway planning study led by Santa Clara VTA, in partnership with the City of Cupertino and in coordination with other stakeholders in the study area. The study
THE NEXUS OF LIVABILITY, TRANSIT, AND PERFORMANCE MEASUREMENT
 THE NEXUS OF LIVABILITY, TRANSIT, AND PERFORMANCE MEASUREMENT CALACT SPRING CONFERENCE 2013 MAY 17, 2013 FRIDAY MORNING SESSION JONATHAN BROOKS ASSOCIATE TRANSPORTATION RESEARCHER TRANSIT MOBILITY PROGRAM
100 Most Congested Roadways in Texas
 100 Most Congested Roadways in Texas 2017 EXECUTIVE SUMMARY In response to increased roadway congestion throughout the state, in 2009 the Texas Legislature mandated that the Texas Department of Transportation
BUILDING THE CASE FOR TRAVEL OPTIONS IN WASHING TON COUNTY. Image: Steve Morgan. Image: Steve Morgan
 BUILDING THE CASE FOR TRAVEL OPTIONS IN WASHING TON COUNTY Image: Steve Morgan Image: Steve Morgan Image: TriMet Image: TriMet WHAT ARE TRAVEL OPTIONS PROGRAMS? Travel options programs encourage residents,
FUTURE MOBILITY IN RHODE ISLAND:
 FUTURE MOBILITY IN RHODE ISLAND: Meeting the State s Need for Safe and Efficient Mobility October 2010 Prepared by: TRIP 1726 M Street, NW, Suite 401 Washington, D.C. 20036 202-466-6706 (voice) 202-785-4722