Measuring Batting Performance
|
|
|
- Maximilian McBride
- 5 years ago
- Views:
Transcription
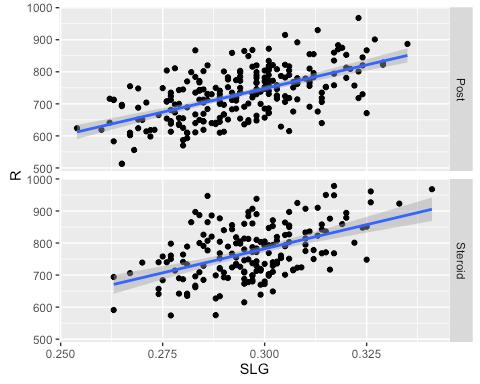
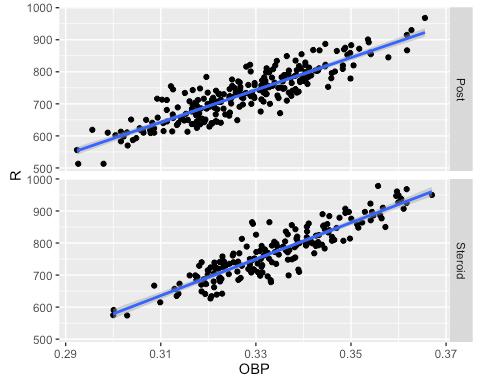
1 Measuring Batting Performance Authors: Samantha Attar, Hannah Dineen, Andy Fullerton, Nora Hanson, Cam Kelso, Katie McLaughlin, and Caitlyn Nolan Introduction: The following analysis compares slugging percentage, on-base percentage, and batting average to runs scored from the Steroid Era and the post-steroid Era. Due to the effects of steroids, our group hypothesized that all three batting performance statistics would result in a greater number of runs scored during the Steroid Era compared to the post-steroid Era. Methods: We relied on the Lahman data frame to make the comparisons between slugging percentage, on-base percentage, and batting average and runs scored. To determine if there was a difference between the Steroid Era and the post-steroid Era, we investigated years and We used dplyr to manipulate the data and we used ggplot to make figures to compare the data. We then tested the significance of the null hypothesis to see if there were relationships between the batting performance statistics and runs scored using covariance. We then performed a linear regression to compare the slopes of the lines. Findings: The slugging percentage covariance indicated that there is no significance in the relationship between eras. The p-value was In contrast, the on-base percentage covariance and batting average covariance indicated that there is significance in the relationship between era. The p-value for on-base percentage was and the p-value for batting average was , which are both less than There is significance between the eras for these two batting performance statistics. Therefore, we can reject the null hypothesis - that the two slopes for the two eras are the same - for on-base percentage and batting average, but not slugging percentage. During the Steroid Era, the slope of onbase percentage vs. runs was while the slope was during the post-steroid Era. During the Steroid Era, the slope of batting average vs. runs was while the slope was during the post-steroid Era. Discussion/overview/implications The steeper slopes of the regression lines for on-base percentage and batting average in the Steroid Era indicate that players taking steroids yielded more runs than those not taking
2 steroids. Players taking steroids were likely stronger than those not taking steroids in the post-steroid Era, so they may have been getting more hits due to the ability to hit the ball farther and harder. As a result of greater batting average, on-base percentages would also increase. Perhaps we cannot reject the null hypothesis for slugging percentage because players who would normally hit a high number of homeruns simply would hit them farther with the help of steroids. head(teams) yearid lgid teamid franchid divid Rank G Ghome W L DivWin WCWin LgWin NA BS1 BNA <NA> 3 31 NA <NA> <NA> N NA CH1 CNA <NA> 2 28 NA 19 9 <NA> <NA> N NA CL1 CFC <NA> 8 29 NA <NA> <NA> N NA FW1 KEK <NA> 7 19 NA 7 12 <NA> <NA> N NA NY2 NNA <NA> 5 33 NA <NA> <NA> N NA PH1 PNA <NA> 1 28 NA 21 7 <NA> <NA> Y WSWin R AB H X2B X3B HR BB SO SB CS HBP SF RA ER ERA CG SHO SV 1 <NA> NA NA NA <NA> NA NA NA <NA> NA NA NA <NA> NA NA NA <NA> NA NA NA <NA> NA NA NA IPouts HA HRA BBA SOA E DP FP name NA 0.83 Boston Red Stockings NA 0.82 Chicago White Stockings NA 0.81 Cleveland Forest Citys NA 0.80 Fort Wayne Kekiongas NA 0.83 New York Mutuals NA 0.84 Philadelphia Athletics park attendance BPF PPF teamidbr teamidlahman45 1 South End Grounds I NA BOS BS1 2 Union Base-Ball Grounds NA CHI CH1 3 National Association Grounds NA CLE CL1 4 Hamilton Field NA KEK FW1 5 Union Grounds (Brooklyn) NA NYU NY2 6 Jefferson Street Grounds NA ATH PH1 teamidretro 1 BS1 2 CH1 3 CL1 4 FW1 5 NY2 6 PH1 tm.batting <- Teams %>% select(-(rank:wswin),-(ra:teamidretro)) %>% filter(yearid>1980,yearid<2014) %>% filter(!is.na(hbp),!is.na(sf),!is.na(cs)) %>% group_by(yearid,teamid) %>% summarize(ba=round(h/ab,3),
3 head(tm.batting) PA=AB+BB+HBP+SF, OBP=(H+BB+HBP)/PA, X1B = H-X2B-X3B-HR, TB= X1B+2*X2B+3*X3B+4*HR/AB, SLG= round(tb/ab,3), OPS=OBP+SLG, ISO=SLG-BA, TAv=(TB+HBP+BB+SB)-CS/(AB-H)+CS, RC=(H+BB-CS)*(TB+0.55*SB)/(AB+BB), BRA=OBP*SLG, SoR=SO/PA, WR=BB/PA, R) Source: local data frame [6 x 16] Groups: yearid [1] yearid teamid BA PA OBP X1B TB SLG OPS ISO (int) (fctr) (dbl) (int) (dbl) (int) (dbl) (dbl) (dbl) (dbl) ANA ARI ATL BAL BOS CHA Variables not shown: TAv (dbl), RC (dbl), BRA (dbl), SoR (dbl), WR (dbl), R (int) tm.batting$era <- ifelse(tm.batting$yearid<2006,"steroid","post") ggplot(tm.batting,aes(slg,r))+geom_point()+stat_smooth(method="lm") + facet_g rid(era~.)
4 ggplot(tm.batting,aes(obp,r))+geom_point()+stat_smooth(method="lm") + facet_g rid(era~.)
5 ggplot(tm.batting,aes(ba,r))+geom_point()+stat_smooth(method="lm") + facet_gr id(era~.)
 0.280, 0.265, 0.271, 0.272, 0.267, 0.286, 0.256, 0.274,... $ PA (int) 6326, 6179, 6188, 6210, 6331, 6351, 6308, 6316, 6471, 6... $ OBP (dbl) 0.3523554, 0.3333873, 0.3464771, 0.")
6 glimpse(tm.batting) Observations: 420 Variables: 17 $ yearid (int) 2000, 2000, 2000, 2000, 2000, 2000, 2000, 2000, 2000, 2... $ teamid (fctr) ANA, ARI, ATL, BAL, BOS, CHA, CHN, CIN, CLE, COL, DET,... $ BA (dbl) 0.280, 0.265, 0.271, 0.272, 0.267, 0.286, 0.256, 0.274,... $ PA (int) 6326, 6179, 6188, 6210, 6331, 6351, 6308, 6316, 6471, 6... $ OBP (dbl) , , , , ,... $ X1B (int) 995, 961, 1011, 992, 988, 1041, 948, 1007, 1078, 1130,... $ TB (dbl) , , , , , $ SLG (dbl) 0.305, 0.300, 0.298, 0.302, 0.305, 0.317, 0.280, 0.305,... $ OPS (dbl) , , , , ,... $ ISO (dbl) 0.025, 0.035, 0.027, 0.030, 0.038, 0.031, 0.024, 0.031,... $ TAv (dbl) , , , , , $ RC (dbl) , , , , , $ BRA (dbl) , , , , $ SoR (dbl) , , , , ,... $ WR (dbl) , , , , $ R (int) 864, 792, 810, 794, 792, 978, 764, 825, 950, 968, 823,... $ era (chr) "Steroid", "Steroid", "Steroid", "Steroid", "Steroid",...
7 model.slg <- lm(tm.batting$r~tm.batting$slg+tm.batting$era+tm.batting$slg*tm. batting$era) summary(model.slg) Call: lm(formula = tm.batting$r ~ tm.batting$slg + tm.batting$era + tm.batting$slg * tm.batting$era) Residuals: Min 1Q Median 3Q Max Coefficients: Estimate Std. Error t value Pr(> t ) (Intercept) tm.batting$slg <2e-16 tm.batting$erasteroid tm.batting$slg:tm.batting$erasteroid (Intercept). tm.batting$slg *** tm.batting$erasteroid tm.batting$slg:tm.batting$erasteroid --- Signif. codes: 0 '***' '**' 0.01 '*' 0.05 '.' 0.1 ' ' 1 Residual standard error: on 416 degrees of freedom Multiple R-squared: , Adjusted R-squared: F-statistic: on 3 and 416 DF, p-value: < 2.2e-16 model.obp <- lm(tm.batting$r~tm.batting$obp+tm.batting$era+tm.batting$obp*tm. batting$era) summary(model.obp) Call: lm(formula = tm.batting$r ~ tm.batting$obp + tm.batting$era + tm.batting$obp * tm.batting$era) Residuals: Min 1Q Median 3Q Max Coefficients: Estimate Std. Error t value Pr(> t ) (Intercept) <2e-16 tm.batting$obp <2e-16 tm.batting$erasteroid tm.batting$obp:tm.batting$erasteroid
8 (Intercept) *** tm.batting$obp *** tm.batting$erasteroid * tm.batting$obp:tm.batting$erasteroid * --- Signif. codes: 0 '***' '**' 0.01 '*' 0.05 '.' 0.1 ' ' 1 Residual standard error: on 416 degrees of freedom Multiple R-squared: , Adjusted R-squared: 0.81 F-statistic: on 3 and 416 DF, p-value: < 2.2e-16 model.ba <- lm(tm.batting$r~tm.batting$ba+tm.batting$era+tm.batting$ba*tm.bat ting$era) summary(model.ba) Call: lm(formula = tm.batting$r ~ tm.batting$ba + tm.batting$era + tm.batting$ba * tm.batting$era) Residuals: Min 1Q Median 3Q Max Coefficients: Estimate Std. Error t value Pr(> t ) (Intercept) < 2e-16 tm.batting$ba < 2e-16 tm.batting$erasteroid tm.batting$ba:tm.batting$erasteroid (Intercept) *** tm.batting$ba *** tm.batting$erasteroid ** tm.batting$ba:tm.batting$erasteroid *** --- Signif. codes: 0 '***' '**' 0.01 '*' 0.05 '.' 0.1 ' ' 1 Residual standard error: on 416 degrees of freedom Multiple R-squared: , Adjusted R-squared: F-statistic: on 3 and 416 DF, p-value: < 2.2e-16 steroid <- tm.batting %>% filter(era == "Steroid") post <- tm.batting %>% filter(era == "Post") slg.steroid <- lm(steroid$r~steroid$slg) summary(slg.steroid) Call:
9 lm(formula = steroid$r ~ steroid$slg) Residuals: Min 1Q Median 3Q Max Coefficients: Estimate Std. Error t value Pr(> t ) (Intercept) steroid$slg e-12 *** --- Signif. codes: 0 '***' '**' 0.01 '*' 0.05 '.' 0.1 ' ' 1 Residual standard error: on 178 degrees of freedom Multiple R-squared: , Adjusted R-squared: F-statistic: on 1 and 178 DF, p-value: 4.981e-12 slg.post <- lm(post$r~post$slg) summary(slg.post) Call: lm(formula = post$r ~ post$slg) Residuals: Min 1Q Median 3Q Max Coefficients: Estimate Std. Error t value Pr(> t ) (Intercept) post$slg <2e-16 *** --- Signif. codes: 0 '***' '**' 0.01 '*' 0.05 '.' 0.1 ' ' 1 Residual standard error: on 238 degrees of freedom Multiple R-squared: , Adjusted R-squared: F-statistic: on 1 and 238 DF, p-value: < 2.2e-16 obp.steroid <- lm(steroid$r~steroid$obp) summary(obp.steroid) Call: lm(formula = steroid$r ~ steroid$obp) Residuals: Min 1Q Median 3Q Max Coefficients:
10 Estimate Std. Error t value Pr(> t ) (Intercept) <2e-16 *** steroid$obp <2e-16 *** --- Signif. codes: 0 '***' '**' 0.01 '*' 0.05 '.' 0.1 ' ' 1 Residual standard error: on 178 degrees of freedom Multiple R-squared: , Adjusted R-squared: F-statistic: on 1 and 178 DF, p-value: < 2.2e-16 obp.post <- lm(post$r~post$obp) summary(obp.post) Call: lm(formula = post$r ~ post$obp) Residuals: Min 1Q Median 3Q Max Coefficients: Estimate Std. Error t value Pr(> t ) (Intercept) <2e-16 *** post$obp <2e-16 *** --- Signif. codes: 0 '***' '**' 0.01 '*' 0.05 '.' 0.1 ' ' 1 Residual standard error: on 238 degrees of freedom Multiple R-squared: , Adjusted R-squared: F-statistic: on 1 and 238 DF, p-value: < 2.2e-16 ba.steroid <- lm(steroid$r~steroid$ba) summary(ba.steroid) Call: lm(formula = steroid$r ~ steroid$ba) Residuals: Min 1Q Median 3Q Max Coefficients: Estimate Std. Error t value Pr(> t ) (Intercept) <2e-16 *** steroid$ba <2e-16 *** --- Signif. codes: 0 '***' '**' 0.01 '*' 0.05 '.' 0.1 ' ' 1 Residual standard error: on 178 degrees of freedom
11 Multiple R-squared: , Adjusted R-squared: F-statistic: on 1 and 178 DF, p-value: < 2.2e-16 ba.post <- lm(post$r~post$ba) summary(ba.post) Call: lm(formula = post$r ~ post$ba) Residuals: Min 1Q Median 3Q Max Coefficients: Estimate Std. Error t value Pr(> t ) (Intercept) <2e-16 *** post$ba <2e-16 *** --- Signif. codes: 0 '***' '**' 0.01 '*' 0.05 '.' 0.1 ' ' 1 Residual standard error: on 238 degrees of freedom Multiple R-squared: , Adjusted R-squared: F-statistic: on 1 and 238 DF, p-value: < 2.2e-16
Correlation and regression using the Lahman database for baseball Michael Lopez, Skidmore College
 Correlation and regression using the Lahman database for baseball Michael Lopez, Skidmore College Overview The Lahman package is a gold mine for statisticians interested in studying baseball. In today
Pitching Performance and Age
 Pitching Performance and Age By: Jaime Craig, Avery Heilbron, Kasey Kirschner, Luke Rector, Will Kunin Introduction April 13, 2016 Many of the oldest players and players with the most longevity of the
Lesson 3 Pre-Visit Teams & Players by the Numbers
 Lesson 3 Pre-Visit Teams & Players by the Numbers Objective: Students will be able to: Review how to find the mean, median and mode of a data set. Calculate the standard deviation of a data set. Evaluate
Pitching Performance and Age
 Pitching Performance and Age Jaime Craig, Avery Heilbron, Kasey Kirschner, Luke Rector and Will Kunin Introduction April 13, 2016 Many of the oldest and most long- term players of the game are pitchers.
1988 Graphics Section Poster Session. Displaying Analysis of Baseball Salaries
 1988 Graphics Section Poster Session Displaying Analysis of Baseball Salaries The Statistical Graphics Section of the American Statistical Association is sponsoring a special poster session titled "Why
Running head: DATA ANALYSIS AND INTERPRETATION 1
 Running head: DATA ANALYSIS AND INTERPRETATION 1 Data Analysis and Interpretation Final Project Vernon Tilly Jr. University of Central Oklahoma DATA ANALYSIS AND INTERPRETATION 2 Owners of the various
Announcements. Lecture 19: Inference for SLR & Transformations. Online quiz 7 - commonly missed questions
 Announcements Announcements Lecture 19: Inference for SLR & Statistics 101 Mine Çetinkaya-Rundel April 3, 2012 HW 7 due Thursday. Correlation guessing game - ends on April 12 at noon. Winner will be announced
George F. Will, Men at Work
 Part of baseball s charm is the illusion it offers that all aspects of it can be completely reduced to numerical expressions and printed in agate type in the sport section. George F. Will, Men at Work
1. Answer this student s question: Is a random sample of 5% of the students at my school large enough, or should I use 10%?
 Econ 57 Gary Smith Fall 2011 Final Examination (150 minutes) No calculators allowed. Just set up your answers, for example, P = 49/52. BE SURE TO EXPLAIN YOUR REASONING. If you want extra time, you can
Minimal influence of wind and tidal height on underwater noise in Haro Strait
 Minimal influence of wind and tidal height on underwater noise in Haro Strait Introduction Scott Veirs, Beam Reach Val Veirs, Colorado College December 2, 2007 Assessing the effect of wind and currents
ASTERISK OR EXCLAMATION POINT?: Power Hitting in Major League Baseball from 1950 Through the Steroid Era. Gary Evans Stat 201B Winter, 2010
 ASTERISK OR EXCLAMATION POINT?: Power Hitting in Major League Baseball from 1950 Through the Steroid Era by Gary Evans Stat 201B Winter, 2010 Introduction: After a playerʼs strike in 1994 which resulted
Major League Baseball Offensive Production in the Designated Hitter Era (1973 Present)
") Major League Baseball Offensive Production in the Designated Hitter Era (1973 Present) Jonathan Tung University of California, Riverside tung.jonathanee@gmail.com Abstract In Major League Baseball, there
Major League Baseball Offensive Production in the Designated Hitter Era (1973 Present) Jonathan Tung University of California, Riverside tung.jonathanee@gmail.com Abstract In Major League Baseball, there
Navigate to the golf data folder and make it your working directory. Load the data by typing
 Golf Analysis 1.1 Introduction In a round, golfers have a number of choices to make. For a particular shot, is it better to use the longest club available to try to reach the green, or would it be better
Additional On-base Worth 3x Additional Slugging?
 Additional On-base Worth 3x Additional Slugging? Mark Pankin SABR 36 July 1, 2006 Seattle, Washington Notes provide additional information and were reminders during the presentation. They are not supposed
Package mlbstats. March 16, 2018
 Type Package Package mlbstats Marc 16, 2018 Title Major League Baseball Player Statistics Calculator Version 0.1.0 Autor Pilip D. Waggoner Maintainer Pilip D. Waggoner
Case Studies Homework 3
 Case Studies Homework 3 Breanne Chryst September 11, 2013 1 In this assignment I did some exploratory analysis on a data set containing diving information from the 2000 Olympics. My code and output is
2018 Big 12 Conference Softball Big 12 Statistics FINAL (All games)
") Big 12 Statistics FINAL Team Batting g avg ob% slg% ab r h 2b 3b hr rbi bb so sb cs sh sf 1. Baylor 56.322.392.449 1492 293 480 59 13 35 264 161 148 57 21 41 18 2. Oklahoma 62.321.424.532 1592 413 511
Big 12 Statistics FINAL Team Batting g avg ob% slg% ab r h 2b 3b hr rbi bb so sb cs sh sf 1. Baylor 56.322.392.449 1492 293 480 59 13 35 264 161 148 57 21 41 18 2. Oklahoma 62.321.424.532 1592 413 511
Largest Comeback vs. Eagles vs. Minnesota Vikings at Veterans Stadium, December 1, 1985 (came back from 23-0 deficit in 4th qtr.
 BLANK SINGLE-SEASON TEMPLATE TEAM RECORDS SCORING Most Points Scored 474 (2014, 16 games) 457 (2017, 15 games( 442 (2013, 16 games) 439 (2010, 16 games) 429 (2009, 16 games) Fewest Scored 51 (1936, 12
SAP Predictive Analysis and the MLB Post Season
 SAP Predictive Analysis and the MLB Post Season Since September is drawing to a close and October is rapidly approaching, I decided to hunt down some baseball data and see if we can draw any insights on
B. AA228/CS238 Component
 Abstract Two supervised learning methods, one employing logistic classification and another employing an artificial neural network, are used to predict the outcome of baseball postseason series, given
Math SL Internal Assessment What is the relationship between free throw shooting percentage and 3 point shooting percentages?
 Math SL Internal Assessment What is the relationship between free throw shooting percentage and 3 point shooting percentages? fts6 Introduction : Basketball is a sport where the players have to be adept
Regression Analysis of Success in Major League Baseball
 University of South Carolina Scholar Commons Senior Theses Honors College Spring 5-5-2016 Regression Analysis of Success in Major League Baseball Johnathon Tyler Clark University of South Carolina - Columbia
2016 Kennesaw State Softball Overall Statistics for Kennesaw State (as of May 13, 2016) (All games Sorted by Batting avg)
 (All games Sorted by Batting avg)") Kennesaw State Softball Overall Statistics for Kennesaw State (as of May, ) (All games Sorted by Batting avg) Record: - DENTON, Taylor CHAMBERS, Kara SUTTER, Courtney PERKOWSKI, Missy VERINGA, Megan -------------------
Kennesaw State Softball Overall Statistics for Kennesaw State (as of May, ) (All games Sorted by Batting avg) Record: - DENTON, Taylor CHAMBERS, Kara SUTTER, Courtney PERKOWSKI, Missy VERINGA, Megan -------------------
Finite AMDM Name Unit 1 Review Date
 Finite AMDM Name Unit1Review Date Giventhefollowingscoresforastudentinmathclasscalculatetheirgradebasedonthefollowingcriteria. Showworkorexplainwhatyoudidtogetyouranswer. totalscoreas% Tests 65/100 60/80
A Brief Shutdown Innings Study. Bob Mecca
 A Brief Study Bob Mecca We heard a lot about shutdown innings last year. During a game, fans would exhale in relief when their team s pitcher delivered one, and sigh in frustration when they didn t. According
Salary correlations with batting performance
 Salary correlations with batting performance By: Jaime Craig, Avery Heilbron, Kasey Kirschner, Luke Rector, Will Kunin Introduction Many teams pay very high prices to acquire the players needed to make
2010 Boston College Baseball Game Results for Boston College (as of Feb 19, 2010) (All games)
 (All games)") Game Results for Boston College (as of Feb 19, 2010) Date Opponent Score Inns Overall ACC Pitcher of record Attend Time Feb 19, 2010 at Tulane W 8-5 9 1-0-0 0-0-0 Dean, P (W 1-0) 3003 3:01 () extra inning
Game Results for Boston College (as of Feb 19, 2010) Date Opponent Score Inns Overall ACC Pitcher of record Attend Time Feb 19, 2010 at Tulane W 8-5 9 1-0-0 0-0-0 Dean, P (W 1-0) 3003 3:01 () extra inning
6-8th GRADE WORKBOOK CLAYTON KERSHAW HEIGHT: 6 3 WEIGHT: 220 BATS: LEFT THROWS: LEFT BORN: 3/19/1988 MLB DEBUT: 5/25/2008
 2 016 LOS A N G E L E S D O D G E R S MATHLETICS 6-8th GRADE WORKBOOK CLAYTON KERSHAW 2 2 P I T C H E R HEIGHT: 6 3 WEIGHT: 220 BATS: LEFT THROWS: LEFT BORN: 3/19/1988 MLB DEBUT: 5/25/2008 The Los Angeles
Correction to Is OBP really worth three times as much as SLG?
 Correction to Is OBP really worth three times as much as SLG? In the May, 2005 issue of By the Numbers, (available at www.philbirnbaum.com/btn2005-05.pdf), I published an article called Is OBP Really Worth
El Cerrito Sporting Goods Ira Sharenow January 7, 2019
 El Cerrito Sporting Goods Ira Sharenow January 7, 2019 R Markdown The goal of the analysis is to determine if any of the salespersons are performing exceptionally well or exceptionally poorly. In particular,
Rating Player Performance - The Old Argument of Who is Bes
 Rating Player Performance - The Old Argument of Who is Best Ron Gould Emory University October 28-29, 2011 Who is the best quarterback in the NFL? Who is the best quarterback in the NFL? Tom Brady, Who
Model Selection Erwan Le Pennec Fall 2015
 Model Selection Erwan Le Pennec Fall 2015 library("dplyr") library("ggplot2") library("ggfortify") library("reshape2") Model Selection We will now use another classical dataset birthwt which corresponds
t-n Sp-15 Ar-31 WP2 - BK0 MF+1 G 04 Michael Clifton "Cowboy" LORENZEN
 t-n Sp-15 Ar-31 WP2 - BK0 MF+1 G 04 Michael Clifton "Cowboy" LORENZEN (F) Grade B Pitcher (2)(19) (OF-1) Year G GS IP W L SY ERA BB SO HR 2018 45 3 81 4 2 1 3.11 34 54 6 Height: 6-3 Weight: 205 Born: 1-4-92
One-factor ANOVA by example
 ANOVA One-factor ANOVA by example 2 One-factor ANOVA by visual inspection 3 4 One-factor ANOVA H 0 H 0 : µ 1 = µ 2 = µ 3 = H A : not all means are equal 5 One-factor ANOVA but why not t-tests t-tests?
An Analysis of the Effects of Long-Term Contracts on Performance in Major League Baseball
 An Analysis of the Effects of Long-Term Contracts on Performance in Major League Baseball Zachary Taylor 1 Haverford College Department of Economics Advisor: Dave Owens Spring 2016 Abstract: This study
Week 7 One-way ANOVA
 Week 7 One-way ANOVA Objectives By the end of this lecture, you should be able to: Understand the shortcomings of comparing multiple means as pairs of hypotheses. Understand the steps of the ANOVA method
2017 BALTIMORE ORIOLES SUPPLEMENTAL BIOS
 2017 BALTIMORE ORIOLES SUPPLEMENTAL BIOS PLAYERS INCLUDED: NO. 51 ALEC ASHER NO. 48 RICHARD BLEIER NO. 34 PAUL JANISH PAUL JANISH 34 INF BATS RIGHT FULL NAME: Paul Ryan Janish THROWS RIGHT HEIGHT 6
Chapter. 1 Who s the Best Hitter? Averages
 Chapter 1 Who s the Best Hitter? Averages The box score, being modestly arcane, is a matter of intense indifference, if not irritation, to the non-fan. To the baseball-bitten, it is not only informative,
Midterm Exam 1, section 2. Thursday, September hour, 15 minutes
 San Francisco State University Michael Bar ECON 312 Fall 2018 Midterm Exam 1, section 2 Thursday, September 27 1 hour, 15 minutes Name: Instructions 1. This is closed book, closed notes exam. 2. You can
y ) s x x )(y i (x i r = 1 n 1 s y Statistics Lecture 7 Exploring Data , y 2 ,y n (x 1 ),,(x n ),(x 2 ,y 1 How two variables vary together
 s x x )(y i (x i r = 1 n 1 s y Statistics Lecture 7 Exploring Data , y 2 ,y n (x 1 ),,(x n ),(x 2 ,y 1 How two variables vary together") Statistics 111 - Lecture 7 Exploring Data Numerical Summaries for Relationships between Variables Administrative Notes Homework 1 due in recitation: Friday, Feb. 5 Homework 2 now posted on course website:
Statistics 111 - Lecture 7 Exploring Data Numerical Summaries for Relationships between Variables Administrative Notes Homework 1 due in recitation: Friday, Feb. 5 Homework 2 now posted on course website:
Southern U. Baseball 2017 Overall Statistics for Southern U. (as of Apr 01, 2017) (All games Sorted by Batting avg)
 (All games Sorted by Batting avg)") Overall Statistics for Southern U. (as of Apr 01, 2017) (All games Sorted by Batting avg) Record: 6-17 Home: 3-4 Away: 2-9 Neutral: 1-4 SWAC: 4-7 Player avg gp-gs ab r h 2b 3b hr rbi tb slg% bb hp so gdp
Overall Statistics for Southern U. (as of Apr 01, 2017) (All games Sorted by Batting avg) Record: 6-17 Home: 3-4 Away: 2-9 Neutral: 1-4 SWAC: 4-7 Player avg gp-gs ab r h 2b 3b hr rbi tb slg% bb hp so gdp
2018 Samford Softball Statistics Summary for Samford (as of May 11, 2018) (All games)
 (All games)") Samford Softball Statistics Summary for Samford (as of May, ) Record: - Home: - Away: - Neutral: - SoCon: - Date Opponent Score #/ at # ouisiana - #/ vs Illinois-Chicago - #/ vs Evansville - #/ vs Eastern
Samford Softball Statistics Summary for Samford (as of May, ) Record: - Home: - Away: - Neutral: - SoCon: - Date Opponent Score #/ at # ouisiana - #/ vs Illinois-Chicago - #/ vs Evansville - #/ vs Eastern
Sample Final Exam MAT 128/SOC 251, Spring 2018
 Sample Final Exam MAT 128/SOC 251, Spring 2018 Name: Each question is worth 10 points. You are allowed one 8 1/2 x 11 sheet of paper with hand-written notes on both sides. 1. The CSV file citieshistpop.csv
Sports Predictive Analytics: NFL Prediction Model
 Sports Predictive Analytics: NFL Prediction Model By Dr. Ash Pahwa IEEE Computer Society San Diego Chapter January 17, 2017 Copyright 2017 Dr. Ash Pahwa 1 Outline Case Studies of Sports Analytics Sports
#35 CODY BELLINGER #58 EDWARD PAREDES
 #35 CODY BELLINGER #58 EDWARD PAREDES CODY BELLINGER // Infielder/Outfielder NON-ROSTER INVITEE 35 BATS: Left THROWS: Left HEIGHT: 6-4 WEIGHT: 213 OPENING DAY AGE: 21 ML SERVICE: 0.000 BORN: July 13, 1995
a) List and define all assumptions for multiple OLS regression. These are all listed in section 6.5
 List and define all assumptions for multiple OLS regression. These are all listed in section 6.5") Prof. C. M. Dalton ECN 209A Spring 2015 Practice Problems (After HW1, HW2, before HW3) CORRECTED VERSION Question 1. Draw and describe a relationship with heteroskedastic errors. Support your claim with
Prof. C. M. Dalton ECN 209A Spring 2015 Practice Problems (After HW1, HW2, before HW3) CORRECTED VERSION Question 1. Draw and describe a relationship with heteroskedastic errors. Support your claim with
1 Hypothesis Testing for Comparing Population Parameters
 Hypothesis Testing for Comparing Population Parameters Hypothesis testing can address many di erent types of questions. We are not restricted to looking at the estimated value of a single population parameter.
2017 Big 12 Conference Softball Big 12 Statistics as of Jun 05, 2017 (All games)
") Big 12 Statistics as of Jun 05, 2017 Team Batting g avg ob% slg% ab r h 2b 3b hr rbi bb so sb cs sh sf 1. Baylor 63.321.380.438 1703 287 546 64 11 38 246 146 213 108 33 47 12 2. Oklahoma 67.315.398.476
Big 12 Statistics as of Jun 05, 2017 Team Batting g avg ob% slg% ab r h 2b 3b hr rbi bb so sb cs sh sf 1. Baylor 63.321.380.438 1703 287 546 64 11 38 246 146 213 108 33 47 12 2. Oklahoma 67.315.398.476
Announcements. % College graduate vs. % Hispanic in LA. % College educated vs. % Hispanic in LA. Problem Set 10 Due Wednesday.
 Announcements Announcements UNIT 7: MULTIPLE LINEAR REGRESSION LECTURE 1: INTRODUCTION TO MLR STATISTICS 101 Problem Set 10 Due Wednesday Nicole Dalzell June 15, 2015 Statistics 101 (Nicole Dalzell) U7
Department of Economics Working Paper Series
 Department of Economics Working Paper Series Efficient Production of Wins in Major League Baseball Brian Volz University of Connecticut Working Paper 2008-50 December 2008 341 Mansfield Road, Unit 1063
Lab 11: Introduction to Linear Regression
 Lab 11: Introduction to Linear Regression Batter up The movie Moneyball focuses on the quest for the secret of success in baseball. It follows a low-budget team, the Oakland Athletics, who believed that
PHILLIES RECORD WHEN THEY (2016)
") PHILADELPHIA PHILLIES (0-0) vs. CINCINNATI REDS (0-0) Monday, April 3, 2017 Great American Ball Park 4:10 p.m. EDT Game 1; Road 1 RHP Jeremy Hellickson (NR) vs. RHP Scott Feldman (NR) SEASON PREMIERE:
PHILADELPHIA PHILLIES (0-0) vs. CINCINNATI REDS (0-0) Monday, April 3, 2017 Great American Ball Park 4:10 p.m. EDT Game 1; Road 1 RHP Jeremy Hellickson (NR) vs. RHP Scott Feldman (NR) SEASON PREMIERE:
2017 PFF RUSHING REPORT
 WELCOME TO PRO FOOTBALL FOCUS 2017 RUSHING REPORT. Here, we break down each team s respective successes in each of the six core run-blocking concepts and give an overall scope of each NFL team s ability
Structural Breaks in the Game: The Case of Major League Baseball
 Structural Breaks in the Game: The Case of Major League Baseball Peter A. Groothuis Walker College of Business Appalachian State University Boone, NC 28608 Kurt W. Rotthoff Stillman School of Business
2019 LSU BASEBALL Overall Statistics for LSU (as of Feb 24, 2019) (All games Sorted by Batting avg) (All games Sorted by Earned run avg)
 (All games Sorted by Batting avg) (All games Sorted by Earned run avg)") Overall Statistics for LSU (as of Feb 24, 2019) (All games Sorted by Batting avg) Record: 7-0 Home: 7-0 Away: 0-0 SEC: 0-0 Player avg gp-gs ab r h 2b 3b hr rbi tb slg% bb hp so gdp ob% sf sh sb-att po
Overall Statistics for LSU (as of Feb 24, 2019) (All games Sorted by Batting avg) Record: 7-0 Home: 7-0 Away: 0-0 SEC: 0-0 Player avg gp-gs ab r h 2b 3b hr rbi tb slg% bb hp so gdp ob% sf sh sb-att po
MINNESOTA TWINS (70-64) VS. KANSAS CITY ROYALS (66-67) FRIDAY, SEPTEMBER 1, 2017 TARGET FIELD MINNEAPOLIS, MN
 VS. KANSAS CITY ROYALS (66-67) FRIDAY, SEPTEMBER 1, 2017 TARGET FIELD MINNEAPOLIS, MN") MINNESOTA TWINS (70-64) VS. KANSAS CITY ROYALS (66-67) FRIDAY, SEPTEMBER 1, 2017 TARGET FIELD MINNEAPOLIS, MN FINAL 1 2 3 4 5 6 7 8 9 R H E LOB Kansas City 0 0 5 0 0 2 0 0 0 7 12 0 6 Minnesota 2 0 1 0
MINNESOTA TWINS (70-64) VS. KANSAS CITY ROYALS (66-67) FRIDAY, SEPTEMBER 1, 2017 TARGET FIELD MINNEAPOLIS, MN FINAL 1 2 3 4 5 6 7 8 9 R H E LOB Kansas City 0 0 5 0 0 2 0 0 0 7 12 0 6 Minnesota 2 0 1 0
Chapter 12 Practice Test
 Chapter 12 Practice Test 1. Which of the following is not one of the conditions that must be satisfied in order to perform inference about the slope of a least-squares regression line? (a) For each value
Do Clutch Hitters Exist?
 Do Clutch Hitters Exist? David Grabiner SABRBoston Presents Sabermetrics May 20, 2006 http://remarque.org/~grabiner/bosclutch.pdf (Includes some slides skipped in the original presentation) 1 Two possible
PHILLIES RECORD WHEN THEY
 PHILADELPHIA PHILLIES (0-1) vs ATLANTA BRAVES (1-0) Friday, March 30, 2018 SunTrust Park 7:35 EDT Game 2; Road 2 RHP Nick Pivetta (NR) vs RHP Mike Foltynewicz (NR) YESTERDAY S ACTION: The Phillies fell
2015 Louisville Cardinals Baseball Overall Statistics for Louisville (as of Jun 09, 2015) (All games Sorted by Batting avg)
 (All games Sorted by Batting avg)") Overall Statistics for Louisville (as of Jun 09, 2015) (All games Sorted by Batting avg) Record: 47-18 Home: 29-8 Away: 14-5 Neutral: 4-5 ACC: 25-5 Player avg gp-gs ab r h 2b 3b hr rbi tb slg% bb hp so
Overall Statistics for Louisville (as of Jun 09, 2015) (All games Sorted by Batting avg) Record: 47-18 Home: 29-8 Away: 14-5 Neutral: 4-5 ACC: 25-5 Player avg gp-gs ab r h 2b 3b hr rbi tb slg% bb hp so
Setting up group models Part 1 NITP, 2011
 Setting up group models Part 1 NITP, 2011 What is coming up Crash course in setting up models 1-sample and 2-sample t-tests Paired t-tests ANOVA! Mean centering covariates Identifying rank deficient matrices
Seattle Mariners (39-45) 7, Detroit Tigers (42-41) 6 July 7, 2015
 7, Detroit Tigers (42-41) 6 July 7, 2015") Seattle Mariners (39-45) 7, Detroit Tigers (42-41) 6 1 2 3 4 5 6 7 8 9 10 11 R H E Detroit 0 3 0 2 0 0 0 1 0 0 0 6 9 0 Seattle 0 0 5 0 1 0 0 0 0 0 1 7 15 1 One out when winning run scored. Detroit AVG
Seattle Mariners (39-45) 7, Detroit Tigers (42-41) 6 1 2 3 4 5 6 7 8 9 10 11 R H E Detroit 0 3 0 2 0 0 0 1 0 0 0 6 9 0 Seattle 0 0 5 0 1 0 0 0 0 0 1 7 15 1 One out when winning run scored. Detroit AVG
Los Angeles Angels (47-39) 7, Seattle Mariners (40-47) 3 July 10, 2015
 7, Seattle Mariners (40-47) 3 July 10, 2015") Los Angeles Angels (47-39) 7, Seattle Mariners (40-47) 3 1 2 3 4 5 6 7 8 9 R H E LA Angels 0 0 3 1 0 2 1 0 0 7 14 0 Seattle 1 0 0 0 0 0 0 0 2 3 9 1 LA Angels AVG AB R H 2B 3B HR RBI BB SO PO A Giavotella,
Los Angeles Angels (47-39) 7, Seattle Mariners (40-47) 3 1 2 3 4 5 6 7 8 9 R H E LA Angels 0 0 3 1 0 2 1 0 0 7 14 0 Seattle 1 0 0 0 0 0 0 0 2 3 9 1 LA Angels AVG AB R H 2B 3B HR RBI BB SO PO A Giavotella,
PHILLIES RECORD WHEN THEY (2017)
") PHILADELPHIA PHILLIES (0-0) vs ATLANTA BRAVES (0-0) Thursday, March 29, 2018 SunTrust Park 4:10 EDT Game 1; Road 1 RHP Aaron Nola (NR) vs RHP Julio Teheran (NR) HOPE SPRINGS ETERNAL: The Phillies will
PHILADELPHIA PHILLIES (0-0) vs ATLANTA BRAVES (0-0) Thursday, March 29, 2018 SunTrust Park 4:10 EDT Game 1; Road 1 RHP Aaron Nola (NR) vs RHP Julio Teheran (NR) HOPE SPRINGS ETERNAL: The Phillies will
Sp-12 WP2 - BKO MF+3 L 04. Thomas Ross "Ross" STRIPLING. Grade B Pitcher (2) (X)(Z) (20)
 (X)(Z) (20)") Sp-12 WP2 - BKO MF+3 L 04 Thomas Ross "Ross" STRIPLING Grade B Pitcher (2) (X)(Z) (20) Year G GS IP w L sv ERA BB so HR 2018 33 21 122 8 6 0 3.02 22 136 18 Height: 6-3 Weight: 210 Born: 11-23-89 Blue Bell,
Sp-12 WP2 - BKO MF+3 L 04 Thomas Ross "Ross" STRIPLING Grade B Pitcher (2) (X)(Z) (20) Year G GS IP w L sv ERA BB so HR 2018 33 21 122 8 6 0 3.02 22 136 18 Height: 6-3 Weight: 210 Born: 11-23-89 Blue Bell,
2014 Tulane Baseball Arbitration Competition Eric Hosmer v. Kansas City Royals (MLB)
") 2014 Tulane Baseball Arbitration Competition Eric Hosmer v. Kansas City Royals (MLB) Submission on behalf of Kansas City Royals Team 15 TABLE OF CONTENTS I. INTRODUCTION AND REQUEST FOR HEARING DECISION...
2014 Tulane Baseball Arbitration Competition Eric Hosmer v. Kansas City Royals (MLB) Submission on behalf of Kansas City Royals Team 15 TABLE OF CONTENTS I. INTRODUCTION AND REQUEST FOR HEARING DECISION...
Relative Value of On-Base Pct. and Slugging Avg.
 Relative Value of On-Base Pct. and Slugging Avg. Mark Pankin SABR 34 July 16, 2004 Cincinnati, OH Notes provide additional information and were reminders during the presentation. They are not supposed
KRISTOPHER NEGRÓN (45) POSITION: AGE: BORN: BATS: THROWS: HEIGHT:
 POSITION: AGE: BORN: BATS: THROWS: HEIGHT:") 2017: The Totals Batted.160 with 1 double, 1 RBI and 4 walks in 14 games with the Diamondbacks after being selected from Triple-A Reno on Sept. 1...was his first Major League appearance since 2015 (with
2017: The Totals Batted.160 with 1 double, 1 RBI and 4 walks in 14 games with the Diamondbacks after being selected from Triple-A Reno on Sept. 1...was his first Major League appearance since 2015 (with
UPCOMING SCHEDULE & PROBABLES Thurs., 5/6 -- vs. Buffalo -- 7:00 p.m. LHP Pat Misch vs. RHP Brad Lincoln (IND) MEDIA RELATIONS
 MEDIA RELATIONS") INDIANAPOLIS INDIANS GAME NOTES GAME #27 / Home Game #9 Buffalo Bisons (16-10) at Indianapolis Indians (13-13) Thursday, May 6, 2010 -- First Pitch @ 7:00 p.m. EDT Victory Field -- Indianapolis, Indiana
INDIANAPOLIS INDIANS GAME NOTES GAME #27 / Home Game #9 Buffalo Bisons (16-10) at Indianapolis Indians (13-13) Thursday, May 6, 2010 -- First Pitch @ 7:00 p.m. EDT Victory Field -- Indianapolis, Indiana
2010 Boston College Baseball Game Results for Boston College (as of May 28, 2010) (All games)
 (All games)") Game Results for Boston College (as of May 28, 2010) Date Opponent Score Inns Overall ACC Pitcher of record Attend Time Feb 19, 2010 at Tulane W 8-5 9 1-0-0 0-0-0 Dean, P (W 1-0) 3003 3:01 Feb 20, 2010
Game Results for Boston College (as of May 28, 2010) Date Opponent Score Inns Overall ACC Pitcher of record Attend Time Feb 19, 2010 at Tulane W 8-5 9 1-0-0 0-0-0 Dean, P (W 1-0) 3003 3:01 Feb 20, 2010
Seattle Mariners (43-51) 11, Detroit Tigers (46-47) 9 July 21, 2015
 11, Detroit Tigers (46-47) 9 July 21, 2015") Seattle Mariners (43-51) 11, Detroit Tigers (46-47) 9 July 21, 2015 1 2 3 4 5 6 7 8 9 R H E Seattle 4 0 1 0 0 1 0 5 0 11 14 2 Detroit 0 1 2 0 4 0 1 1 0 9 12 0 Seattle AVG AB R H 2B 3B HR RBI BB SO PO A
Seattle Mariners (43-51) 11, Detroit Tigers (46-47) 9 July 21, 2015 1 2 3 4 5 6 7 8 9 R H E Seattle 4 0 1 0 0 1 0 5 0 11 14 2 Detroit 0 1 2 0 4 0 1 1 0 9 12 0 Seattle AVG AB R H 2B 3B HR RBI BB SO PO A
Is lung capacity affected by smoking, sport, height or gender. Table of contents
 Sample project This Maths Studies project has been graded by a moderator. As you read through it, you will see comments from the moderator in boxes like this: At the end of the sample project is a summary
Player AVG GP-GS AB R H 2B 3B HR RBI TB SLG% BB HBP SO GDP OB% SF SH SB-ATT PO A E FLD%
 Overall Statistics for Florida State (as of Feb 24, 2006) (All games Sorted by Batting avg) Record: 8-5 Home: 6-2 Away: 2-1 Neutral: 0-2 ACC: 0-0 Player AVG GP-GS AB R H 2B 3B HR RBI TB SLG% BB HBP SO
Fastball Baseball Manager 2.5 for Joomla 2.5x
 Fastball Baseball Manager 2.5 for Joomla 2.5x Contents Requirements... 1 IMPORTANT NOTES ON UPGRADING... 1 Important Notes on Upgrading from Fastball 1.7... 1 Important Notes on Migrating from Joomla 1.5x
Unit4: Inferencefornumericaldata 4. ANOVA. Sta Spring Duke University, Department of Statistical Science
 Unit4: Inferencefornumericaldata 4. ANOVA Sta 101 - Spring 2016 Duke University, Department of Statistical Science Dr. Çetinkaya-Rundel Slides posted at http://bit.ly/sta101_s16 Outline 1. Housekeeping
LOS ANGELES DODGERS (82-63) at Arizona Diamondbacks (61-84) ONTO ARIZONA: MATCHUP vs. DIAMONDBACKS Dodgers: Diamondbacks: All-Time: 2016:
 at Arizona Diamondbacks (61-84) ONTO ARIZONA: MATCHUP vs. DIAMONDBACKS Dodgers: Diamondbacks: All-Time: 2016:") LOS ANGELES DODGERS (82-63) at Arizona Diamondbacks (61-84) LHP Rich Hill (12-3, 1.80) vs. RHP Archie Bradley (6-9, 5.10) Thursday, Sept. 15, 2016 6:40 p.m. PT Chase Field Phoenix, AZ Game 146 Road Game
LOS ANGELES DODGERS (82-63) at Arizona Diamondbacks (61-84) LHP Rich Hill (12-3, 1.80) vs. RHP Archie Bradley (6-9, 5.10) Thursday, Sept. 15, 2016 6:40 p.m. PT Chase Field Phoenix, AZ Game 146 Road Game
Analysis of Variance. Copyright 2014 Pearson Education, Inc.
 Analysis of Variance 12-1 Learning Outcomes Outcome 1. Understand the basic logic of analysis of variance. Outcome 2. Perform a hypothesis test for a single-factor design using analysis of variance manually
Seattle Mariners (52-45) 3, Los Angeles Angels (58-38) 2 July 19, 2014
 3, Los Angeles Angels (58-38) 2 July 19, 2014") Seattle Mariners (52-45) 3, Los Angeles Angels (58-38) 2 1 2 3 4 5 6 7 8 9 10 11 12 R H E Seattle 0 0 0 0 0 1 0 0 0 0 0 2 3 9 1 LA Angels 0 0 0 0 0 0 1 0 0 0 0 1 2 5 0 Seattle AVG AB R H 2B 3B HR RBI BB
Seattle Mariners (52-45) 3, Los Angeles Angels (58-38) 2 1 2 3 4 5 6 7 8 9 10 11 12 R H E Seattle 0 0 0 0 0 1 0 0 0 0 0 2 3 9 1 LA Angels 0 0 0 0 0 0 1 0 0 0 0 1 2 5 0 Seattle AVG AB R H 2B 3B HR RBI BB
Los Angeles Dodgers (17-13) vs. Miami Marlins (15-14) Friday, May 02, 2014 Marlins Park, Miami, FL
 vs. Miami Marlins (15-14) Friday, May 02, 2014 Marlins Park, Miami, FL") Los Angeles Dodgers (17-13) vs. Miami Marlins (15-14) Friday, May 02, 2014 Marlins Park, Miami, FL Club 1 2 3 4 5 6 7 8 9 R H E LOB Los Angeles 0 0 0 0 0 0 0 2 1 3 7 0 7 Miami 0 1 0 1 0 0 4 0 x 6 11 1
Los Angeles Dodgers (17-13) vs. Miami Marlins (15-14) Friday, May 02, 2014 Marlins Park, Miami, FL Club 1 2 3 4 5 6 7 8 9 R H E LOB Los Angeles 0 0 0 0 0 0 0 2 1 3 7 0 7 Miami 0 1 0 1 0 0 4 0 x 6 11 1
May the best (statistically chosen) team win! Danielle Pope
 team win! Danielle Pope") May the best (statistically chosen) team win! Danielle Pope The Burning Question: What does the Pythagorean Expectation tell us, and how can the Pythagorean Expectation be improved? Pythagorean Expectation
May the best (statistically chosen) team win! Danielle Pope The Burning Question: What does the Pythagorean Expectation tell us, and how can the Pythagorean Expectation be improved? Pythagorean Expectation
PHILLIES RECORD WHEN THEY
 PHILADELPHIA PHILLIES (1-1) vs. CINCINNATI REDS (1-1) Thursday, April 6, 2017 Great American Ball Park 12:35 p.m. EDT Game 3; Road 3 RHP Clay Buchholz (NR) vs. RHP Rookie Davis (NR) LAST NIGHT S ACTION:
ISDS 4141 Sample Data Mining Work. Tool Used: SAS Enterprise Guide
 ISDS 4141 Sample Data Mining Work Taylor C. Veillon Tool Used: SAS Enterprise Guide You may have seen the movie, Moneyball, about the Oakland A s baseball team and general manager, Billy Beane, who focused
Seattle Mariners (16-19) 2, Boston Red Sox (17-19) 1 May 15, 2015
 2, Boston Red Sox (17-19) 1 May 15, 2015") Seattle Mariners (16-19) 2, Boston Red Sox (17-19) 1 1 2 3 4 5 6 7 8 9 R H E Boston 0 1 0 0 0 0 0 0 0 1 7 0 Seattle 0 0 0 0 0 1 0 0 1 2 5 0 Two out when winning run scored. Boston AVG AB R H 2B 3B HR RBI
Seattle Mariners (16-19) 2, Boston Red Sox (17-19) 1 1 2 3 4 5 6 7 8 9 R H E Boston 0 1 0 0 0 0 0 0 0 1 7 0 Seattle 0 0 0 0 0 1 0 0 1 2 5 0 Two out when winning run scored. Boston AVG AB R H 2B 3B HR RBI
GAME #133 / Home Game #67. Wednesday, August 24, First 7:05 p.m. EDT Victory Field -- Indianapolis, Indiana
 INDIANAPOLIS INDIANS GAME NOTES GAME #133 / Home Game #67 Columbus Clippers (81-51) at Indianapolis Indians (68-64) Wednesday, August 24, 2011 -- First Pitch @ 7:05 p.m. EDT Victory Field -- Indianapolis,
(79-71) LOS ANGELES DODGERS
 LOS ANGELES DODGERS") San Francisco Giants (79-71) LOS ANGELES DODGERS (85-65) RHP Johnny Cueto (16-5, 2.86) vs. LHP Rich Hill (12-4, 2.06) Tuesday, Sept. 20, 2016 7:10 p.m. PT Dodger Stadium Los Angeles, CA Game 151 Home Game
San Francisco Giants (79-71) LOS ANGELES DODGERS (85-65) RHP Johnny Cueto (16-5, 2.86) vs. LHP Rich Hill (12-4, 2.06) Tuesday, Sept. 20, 2016 7:10 p.m. PT Dodger Stadium Los Angeles, CA Game 151 Home Game
Draft - 4/17/2004. A Batting Average: Does It Represent Ability or Luck?
 A Batting Average: Does It Represent Ability or Luck? Jim Albert Department of Mathematics and Statistics Bowling Green State University albert@bgnet.bgsu.edu ABSTRACT Recently Bickel and Stotz (2003)
Lorenzo Cain v. Kansas City Royals. Submission on Behalf of the Kansas City Royals. Team 14
 Lorenzo Cain v. Kansas City Royals Submission on Behalf of the Kansas City Royals Team 14 Table of Contents I. Introduction and Request for Hearing Decision... 1 II. Quality of the Player s Contributions
Data wrangling. Chapter A grammar for data wrangling select() and filter()
 and filter()") Chapter 4 Data wrangling This chapter introduces basics of how to wrangle data in R. Wrangling skills will provide an intellectual and practical foundation for working with modern data. 4.1 A grammar for
Chapter 4 Data wrangling This chapter introduces basics of how to wrangle data in R. Wrangling skills will provide an intellectual and practical foundation for working with modern data. 4.1 A grammar for
Section I: Multiple Choice Select the best answer for each problem.
 Inference for Linear Regression Review Section I: Multiple Choice Select the best answer for each problem. 1. Which of the following is NOT one of the conditions that must be satisfied in order to perform
OAKLAND ATHLETICS MATHLETICS MATH EDUCATIONAL PROGRAM. Presented by ROSS Dress for Less and Comcast SportsNet California
 OAKLAND ATHLETICS MATHLETICS MATH EDUCATIONAL PROGRAM EARN 2 VOUCHERS TO A 2015 REGULAR SEASON A s GAME! Good for select Monday Thursday home games (expires 9/9/2015) ELIGIBILITY Students from 1 st through
Chapter 9: Hypothesis Testing for Comparing Population Parameters
 Chapter 9: Hypothesis Testing for Comparing Population Parameters Hypothesis testing can address many di erent types of questions. We are not restricted to looking at the estimated value of a single population
BASEBALL Weekly Report - May 4, 2018
 Colonial Athletic Association BASEBALL Weekly Report - May 4, 2018 College of Charleston Delaware Elon Hofstra James Madison UNCW Northeastern Towson William & Mary For Immediate Release Contact: Rob Washburn
Hellgate 100k Race Analysis February 12, 2015
 Hellgate 100k Race Analysis brockwebb45@gmail.com February 12, 2015 Synopsis The Hellgate 100k is a tough, but rewarding race directed by Dr. David Horton. Taking place around the second week of December
(Under the Direction of Cheolwoo Park) ABSTRACT. Major League Baseball is a sport complete with a multitude of statistics to evaluate a player s
 ABSTRACT. Major League Baseball is a sport complete with a multitude of statistics to evaluate a player s") PENALIZED REGRESSION MODELS FOR MAJOR LEAGUE BASEBALL METRICS by MUSHIMIE LONA PANDA (Under the Direction of Cheolwoo Park) ABSTRACT Major League Baseball is a sport complete with a multitude of statistics
PENALIZED REGRESSION MODELS FOR MAJOR LEAGUE BASEBALL METRICS by MUSHIMIE LONA PANDA (Under the Direction of Cheolwoo Park) ABSTRACT Major League Baseball is a sport complete with a multitude of statistics
Seattle Mariners (42-49) 4, New York Yankees (49-41) 3 July 18, 2015
 4, New York Yankees (49-41) 3 July 18, 2015") Seattle Mariners (42-49) 4, New York Yankees (49-41) 3 1 2 3 4 5 6 7 8 9 R H E Seattle 2 0 0 0 0 2 0 0 0 4 7 0 NY Yankees 0 0 0 2 0 0 0 0 1 3 7 0 Seattle AVG AB R H 2B 3B HR RBI BB SO PO A Miller, B, SS.243
Seattle Mariners (42-49) 4, New York Yankees (49-41) 3 1 2 3 4 5 6 7 8 9 R H E Seattle 2 0 0 0 0 2 0 0 0 4 7 0 NY Yankees 0 0 0 2 0 0 0 0 1 3 7 0 Seattle AVG AB R H 2B 3B HR RBI BB SO PO A Miller, B, SS.243
The Rise in Infield Hits
 The Rise in Infield Hits Parker Phillips Harry Simon December 10, 2014 Abstract For the project, we looked at infield hits in major league baseball. Our first question was whether or not infield hits have
PHILLIES RECORD WHEN THEY
 WASHINGTON NATIONALS (2-1) vs. PHILADELPHIA PHILLIES (1-2) Friday, April 7, 2017 Citizens Bank Park 3:05 p.m. EDT Game 4; Home 1 RHP Max Scherzer (NR) vs. RHP Vince Velasquez (NR) YESTERDAY S ACTION: The
Legendre et al Appendices and Supplements, p. 1
 Legendre et al. 2010 Appendices and Supplements, p. 1 Appendices and Supplement to: Legendre, P., M. De Cáceres, and D. Borcard. 2010. Community surveys through space and time: testing the space-time interaction
2005 NFL Regular Season Pools. Bryan Clair
 2005 NFL Regular Season Pools Bryan Clair January 26, 2006 Chapter 1 Introduction This report concerns football pools for the 2005-6 National Football League regular season. The author applied techniques
WBSC - Premier
 WBSC - Premier12-2015 CUBA Game Results Overall Stats Category Leaders Games Summary Analysis Stats Per-game Stats Game Highs Team Game-by-Game Game Results Game date Opposing team Score r-h-e / r-h-e