40 th Street Green Shared Lane Evaluation DRAFT May 2014
|
|
|
- Hugh Brown
- 5 years ago
- Views:
Transcription
1
2 DRAFT May 2014 Table of Contents Introduction & Problem Statement... 2 Problem Statement... 4 Location of Proposed Experiment... 5 Description and Use of the Proposed Traffic Control Device... 6 Background/Literature Review... 9 Methodology Experiment Design Research Questions and Data Collection Plan Video Interpretation Findings Effects on Bicycle Volumes Effects on Bicycle Lateral Positioning Mid-Block Effects on Passing Distance Effects on Bicycle Lateral Positioning at Intersections Effects on Lane Utilization Effects on Vehicle Speeds Effects on Ability to Safely Change Lanes to Pass Effects on Crashes Effects on Transit Key Findings Implications for the MUTCD Appendix A: additional Literature Review
3 List of Figures Figure 1 Context Map... 7 Figure 2 Photos of Phased Improvements... 8 Figure 3 Conceptual Cross Section Figure 4a Green Shared Lane Striping Plan Figure 4b Green Shared Lane Striping Plan List of Tables TABLE 1: Data Interpretation Methodology and Statistical Analysis TABLE 2: Bike Distance from Curb t-test 1 Results Vehicles Parked TABLE 3: Percent of Bicyclists Riding in Green Zone Chi-Square 1 Results Vehicles Parked TABLE 8: Bike Distance from Curb t-test 1 Results Weekday, No Vehicles Parked TABLE 9: Vehicle-Bicycle Passing Distance t-test 1 Results TABLE 10: Vehicle Passing Distance Chi-Square 1 Results Weekday, Vehicles Parked TABLE A-1: Characteristics of Similar Experiments TABLE A-2: Outcomes of Similar Experiments
4 INTRODUCTION & PROBLEM STATEMENT In 2013 the City of Oakland, California implemented a continuous band of green color on the pavement in conjunction with shared roadway bicycle markings (sharrows) as an experimental traffic control device. The purpose of the experiment was to improve traffic operations on a multilane urban roadway frequented by cyclists. The request to experiment was approved by the Federal Highway Administration and the California Traffic Control Devices Committee as per the requirements of the Manual on Uniform Traffic Control Devices (MUTCD, Section 1A.10) and the California MUTCD. The City of Oakland conducted the experiment on 40th Street between Adeline and Webster Streets in proximity of the MacArthur BART Transit Station and Transit Village development. MacArthur BART, a heavy rail station operated by the Bay Area Rapid Transit District, is amongst the busiest BART stations for cyclists in the San Francisco Bay Area. The station entrance is on 40 th Street, a four-lane urban arterial with two travel lanes in each direction, a raised median with turn pockets at intersections, and parallel parking on both sides of the street. Average daily traffic was approximately 16,000 vehicles and there are seven traffic signals on the one-mile segment of roadway. Adjoining land uses are a mixture of multi-unit residential, single-family homes, and commercial. The purpose of the experiment was to promote: (a) safe and legal lane positioning by cyclists; and (b) safe and legal passing by motorists on a multi-lane urban roadway with frequent cyclists and no bike lanes. Such roadways are prone to the following operational issues. First, cyclists ride too close to vehicles parked parallel along the street, exposing themselves to collisions with opening car doors. Second, overtaking motorists pass cyclists by squeezing by, encroaching on the adjoining travel lane, creating conflicts with other motorists, and providing insufficient width for cyclists to operate safely. Third, cyclists controlling the right-hand lane in a safe and legal manner are subject to intimidation by overtaking motorists. The experiment sought to improve upon the standard treatments currently available: sharrows, parking edge line stripes or parking Ts to help delineate the door zone, and bicycle-related signage. The experiment included a phased before/after study with three rounds of data collection: (1) Baseline condition: previously installed bicycle guide signs; no bikeway striping; (2) Sharrows, parking edge line stripes, and Bicycles May Use Full Lane signs; and (3) Above plus five-foot wide green band centered in the right travel lane. Pneumatic tubes and video cameras collected data on cyclist volumes, vehicle volumes and speeds, vehicle lane utilization, cyclist lane positioning, motorist lane positioning, and motorist passing behavior. The green band was created by applying a colored epoxy to the surface of the roadway (StreetBondCL in Shamrock Green) at a cost of approximately $100,000 per centerline mile. The effects of the green band (or super sharrow ) on user behavior were isolated and compared to no bikeway striping and to standard sharrows using statistical analysis. The key findings are as follows: 2
5 Super sharrows resulted in cyclists riding further from parked cars ( outside of the door zone ). The shift was statistically significant compared to the baseline condition and to the standard sharrows condition. Standard sharrows had a small positive effect on cyclist positioning but the shift in bicyclists riding outside of the door zone was not statistically significant. In comparison, super sharrows had a greater effect with and without overtaking motorists that was statistically significant, increasing the percentage of bicyclists operating outside of the door zone from 5% (baseline) to 39% (super sharrows) in free flow conditions and 0% (baseline) to 19% (super sharrows) during overtaking events. Standard sharrows shifted motorists from the right travel lane to the left travel lane. Statistically significant compared to the baseline condition, two-thirds of motorists used the right lane under the baseline conditions and under the standard sharrows condition less than one-half of motorists used the right lane. The addition of the green band did not shift additional motorists from the right travel lane to the left lane. The passing distance for motorists overtaking cyclists did not change in a statistically significant manner. The average passing distance remained the same between baseline and with standard sharrows and increased slightly with super sharrows. The percentage of motorists leaving three or more feet decreased over the three phases, which was statistically significant between the baseline and super sharrow conditions. While super sharrows encourage cyclists to ride further from parked cars, the treatment may not affect the passing behavior of some motorists, resulting in some passing events where there is less space between the motorist and the cyclist. This indicates both that the average passing distance is unaffected by the treatments and that the variability in passing distance increases with the treatments, with some autos passing much further and other autos passing more closely with the treatments than without. Super sharrows and standard sharrows did not affect the number of cyclists who pass motorists on the right at red lights. At signalized intersections, cyclists continued to jump the queue, overtaking waiting motorists by passing on the right. The treatments were not effective in reducing the possibility of right hook collisions at signalized intersections by encouraging cyclists to take the lane and queue with motorists. The number of observations was limited and no conclusion can be drawn for cyclists arriving at traffic signals on green lights. While the experiment did not include a user survey, the City of Oakland received extensive informal feedback on the project. Cyclists were largely positive, describing the super sharrows as empowering and legitimizing their use of the roadway. The highly visible treatment created a situation in which there could be no doubt amongst motorists and cyclists that cyclists are legitimate users of the travel lane. Cyclists who were critical of the treatment generally expressed a desire for separation from motorists, either with conventional bike lanes or cycle tracks. 3
6 Motorists and residents were generally sympathetic to the goal of improving conditions for cyclists. Isolated complaints fell into three categories: that cyclists should ride somewhere else; that the treatment was a waste of money; and that the treatment was unsightly. Not all data are yet available and, as a result, the collision history and bicycle volume section will be completed once those respective data sources are available. Collision data is expected to be available in 2015, and bicycle volume data will be available in fall The key findings of the quantitative analysis plus anecdotal observations and user feedback suggest the following implications. An assertive shared lane treatment like super sharrows can improve conditions for cyclists on multi-lane urban roadways where bike lanes are not feasible. Specifically, the super sharrows shifted cyclists away from the door zone and such treatments communicate forcefully that cyclists are legitimate users of the shared travel lane. These benefits were achieved with no documented negative effects on operations or safety. Future research should evaluate the relative merits of a take the lane design approach directing cyclists to the center of the travel lane versus an avoid the door zone design approach directing cyclists to ride only as far left as necessary to avoid the door zone. PROBLEM STATEMENT On multi-lane urban arterials and collectors that are too narrow for bicycle lanes, bicyclists often ride in the door zone : the area immediately adjacent to curbside parallel parking into which car doors open. Overtaking motorists often pass such bicyclists without changing lanes, encroaching into the adjoining travel lane, and providing insufficient width for the bicyclist to operate safely. The California Vehicle Code requires bicyclists to ride as close as practicable to the right-hand curb or edge of the roadway (CVC 21202(a)). Exceptions to this requirement include roadways with a substandard width lane defined as a lane that is too narrow for a bicycle and a vehicle to travel safely side by side within the lane (CVC 21202(a)(3)). This exception is the basis for the Bicycles May Use Full Lane sign (R4-11) that is included in the MUTCD. In the City of Oakland, the majority of urban arterials and collectors have lane widths that are too narrow for a bicycle and vehicle to operate side by side in a safe manner. Oakland s design approach provides a minimum of 23 for side-by-side lane sharing where curbside parallel parking is allowed: 9.5 parking lane and door zone, 3.5 bicyclist operating space, 3 passing space for overtaking motorists, 6 width of a large passenger car, and 1 buffer to the travel lane line. Where this width is available, the City is in the process of adding bicycle lanes as per a citywide analysis of roadway widths completed for the City of Oakland s Bicycle Master Plan (2007). Where traffic volumes allow, the City is reducing the number of travel lanes to create space for bicycle lanes. In multi-lane roadways, CVC 21654(a) requires slow moving vehicles to operate in the right-hand lane for traffic or as close as practicable to the right-hand edge or curb. Exceptions to CVC 21202(a) allow a bicyclist to use the full extent of the right-hand lane if that lane is too narrow for a bicycle and vehicle to travel safely side by side. Thus the safe and legal behavior for the bicyclist 4
7 is to control the travel lane, riding clear of the door zone with overtaking motorists deliberately changing lanes to pass safely. A minority of bicyclists operates in this manner because the cultural expectation is that bicyclists should get out of the way of overtaking motorists. Incidents include motorists honking, yelling, driving aggressively, and physically assaulting bicyclists who were using the travel lane in a manner that inconvenienced motorists. 1 Traffic operations on multi-lane urban streets frequented by bicyclists are thus prone to the following operational issues: (1) Bicyclists ride too close to vehicles parked parallel along the street, exposing themselves to collisions with opening car doors. (2) Overtaking motorists pass bicyclists by squeezing by, encroaching on the adjoining travel lane, creating conflicts with other motorists, and providing insufficient width for bicyclists to operate safely. (3) Bicyclists controlling the right-hand lane in a safe and legal manner are subject to intimidation by overtaking motorists. Existing traffic control devices do not provide sufficient guidance to roadway users on the safe and legal path of travel for bicyclists in shared lane situations. Currently, the City s design options include sharrows, parking edge line stripes or parking Ts to help delineate the door zone, and bicycle-related signage. These treatments are in place on other multi-lane roadways in Oakland but, based on user feedback, they have been insufficient in addressing the operational issues noted above. The City sought to address these operational issues by experimenting with roadway delineation for shared lane situations that may promote: (a) safe and legal lane positioning by bicyclists; and (b) safe and legal passing by motorists. LOCATION OF PROPOSED EXPERIMENT The City of Oakland s Bicycle Master Plan, part of the Oakland General Plan, calls for the installation of bikeways to improve access to major transit stations. One of the busiest stations is MacArthur BART, located in North Oakland and operated by the Bay Area Rapid Transit District. As of 2008, 8.2% of BART patrons accessed the station by bicycle despite there being no bikeways serving the station. The station has the fourth largest number of bicyclists accessing the station out of the 43 BART stations in the San Francisco Bay Area. The primary station entrance is on 40 th Street, a four-lane urban arterial with two travel lanes in each direction, a 16-foot raised median with turn pockets at the intersections, and parallel parking lanes on both sides of the street. Average daily traffic is approximately 16,000 vehicles and there are seven traffic signals on this Peter G. Furth, Daniel M. Dulaski, Dan Bergenthal, and Shannon Brown. More Than Sharrows: Lane-Within- A-Lane Bicycle Priority Treatments in Three U.S. Cities. Transportation Research Board Annual Meeting,
8 mile segment of roadway. Figure 1 is a context map showing the location of the experiment and Oakland s bikeway network in the vicinity of MacArthur BART. The City made multiple prior efforts to develop a bikeway in the 40 th Street corridor to serve MacArthur BART. In 2006 and 2008, the City completed two studies on the removal of travel lanes and the installation of bicycle lanes. The City did not implement the road diet option because of (1) concerns from the public transit agency Alameda-Contra Costa Transit District (AC Transit) regarding delays to bus operations; and (2) future year traffic forecasts whereby the road diet would create significant and unavoidable impacts to motor vehicle delay under the California Environmental Quality Act. The City then studied the feasibility of maintaining the four travel lanes and adding bicycle lanes by narrowing the raised medians. This proposal was opposed by neighborhood groups who, over the duration of the City s studies, adopted and landscaped the medians. Given these constraints, the City sought an additional design treatment to improve the positive effects of sharrows in delineating the safe and legal path of travel for bicyclists. DESCRIPTION AND USE OF THE PROPOSED TRAFFIC CONTROL DEVICE Green Shared Lane Treatment In September 2013, the City installed a five-foot wide band of green color, applied to the surface of the pavement, and centered in the outside travel lane. The green band extends the length of the shared lane condition in the project area, excluding intersections and crosswalks. The use of green in the shared lane context is currently not approved under the federal MUTCD Interim Approval for green pavement, which only allows the use of green in bicycle lanes and their extensions through conflict zones. The objective of this experimental traffic control device is to provide continuous guidance in delineating the safe and legal path of travel for bicyclists. It was installed in conjunction with the following standard (MUTCD-approved) traffic control devices: Sharrows spaced at intervals of approximately 135 to 200 feet with a minimum of two sharrows in each direction on each block; Parking edge line stripes (Detail 27B) delineating the right edge of the outside travel lane along the length of the project, excluding intersections, crosswalks, and bus stops; and Bicycles May Use Full Lane (R4-11) signs on the far-side of each intersection with a collector or arterial roadway (6 intersections total). Figure 2 presents photographs from each phase of the study. Figures 3 and 4 present a conceptual section and striping plan for the experimental treatment as it was installed on 0.8 miles of 40 th Street from Adeline Street to Martin Luther King, Jr Way and from Telegraph Avenue to Webster Street. No change was made to the connecting 0.2 miles of 40 th Street from Martin Luther King, Jr Way to Telegraph Avenue. Bicycle lanes were installed along this segment at the MacArthur BART station entrance (and under State Highway 24) as part of a streetscape project in The width for the bike lanes was created by narrowing the median. Bicycle Route Signs (D11-1) were installed along the length of the corridor in May 2010 and remained throughout the experiment. 6


9 WEBSTER STREET TELEGRAPH AVENUE HWY 24 MARTIN LUTHER KING, JR WAY WEST STREET MARKET STREET ADELINE STREET Green Shared Lane 41ST STREET Green Shared Lane SA U VEN OA L B A NP E 40TH STREET LEGEND Class II Bicycle Lanes Location of Green Band Class III Bicycle Routes City Limit Class IIIB Bicycle Boulevards N Figure 1 40th Street Green Shared Lane Location and Adjacent Bicycle Network


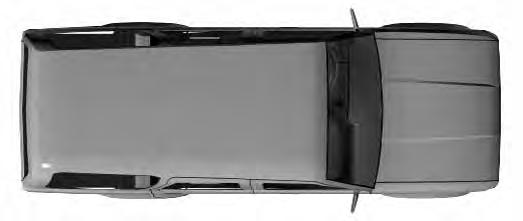
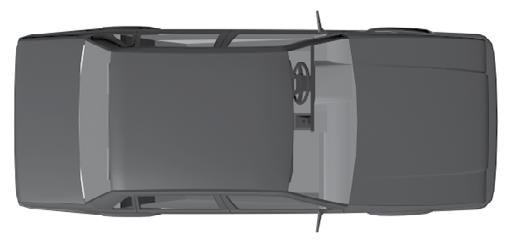
 Condition between September 2013 and present Figure 2 Photos of Phased")
10 Phase 1 Baseline Conditions Designated bicycle route with D11-1 signs Baseline condition prior to May 2013 Phase 2 MUTCD-Approved Treatments Designated bicycle route with D11-1 signs Sharrows centered on #2 travel lane Edgeline stripe (Detail 27B) Bicycle May Use Full Lane (R4-11) signs Condition between June and August 2013 Phase 3 Green Shared Lane Designated bicycle route with D11-1 signs Sharrows centered on #2 travel lane Edgeline stripe (Detail 27B) Bicycle May Use Full Lane (R4-11) signs 5 Foot experimental green band centered in #2 travel lane with sharrows on top ( green shared lane or super sharrow ) Condition between September 2013 and present Figure 2 Photos of Phased Improvements
11 The five-foot width of the green band was chosen in order to: (1) match established practice on bicycle operating and facility widths; (2) align with the center of the travel lane over a range of urban lane widths; and (3) ensure a prominent visual presence. The five-foot (60 ) green band is comparable to the width of sharrows (39 ), bike lane symbols (40 ), AASHTO s minimum width to operate a bicycle (40 ), and bike lane widths ( 60 ). In particular, the sharrow at 39 in width and the green band at 60 in width allows 10.5 of green on either side of the sharrow. This overlap improves the visibility of the sharrow and creates a consistent appearance for the green band. A five-foot band is located in the effective center of a travel lane and remains clear of the door zone over the range of typical urban lane widths: 17 feet to 20+ feet (measured from face of curb to lane line). In communicating the bicyclists path of travel, a five-foot green band is thus narrow enough to center in the lane, remain clear of the door zone, and be visually prominent. Intent of Green Pavement in Shared Lanes The green band was intended to delineate the bicyclists path of travel in a shared lane condition. It was not intended to denote a zone for the preferential or exclusive use of bicyclists. To date the various uses of green color pavement on bikeways have this underlying commonality: to indicate the bicyclists path of travel to motorists and bicyclists. The green color is used to enhance the delineation established by standard traffic control devices: bike lane stripes and sharrow markings. Standard lane lines and markings allocate the roadway width for established purposes while the green color indicates where to expect bicyclists. BACKGROUND/LITERATURE REVIEW To date, four other cities have installed continuous bands of green color pavement in conjunction with sharrows: Salt Lake City (200 South); Long Beach (2nd Street); Minneapolis (Hennepin Avenue and Bryant Avenue South); and Edina, MN (Valley View Road and West 70 th Street/Metro Boulevard). Three additional experiments are closely related: Philadelphia s sharrows on rectangular patches of green color pavement ( greenback sharrows ) on South 59 th Street; Los Angeles experiment with greenback sharrows 2 ; and Brookline, MA s sharrows flanked by dashed white lines on Longwood Avenue. 2 This project was approved by the California Traffic Control Devices Commission (CTCDC) but not by the Federal Highway Administration (FHWA). 9


12 Phase 3 Green Shared Lane Concept Section and Plan SIDEWALK EB TRAVEL EB TRAVEL WB TRAVEL WB TRAVEL PARKING LANE #2 LANE #1 MEDIAN LANE #1 LANE #2 PARKING SIDEWALK Figure 3 Phase 3 Green Shared Lane Concept Section and Plan
13 Figure 4a Phase 3 Green Shared Lane Striping Plan - Sheet 1
14 Figure 4b Phase 3 Green Shared Lane Striping Plan - Sheet 2
15 The projects with sharrows and green color pavement share the following characteristics: Locations where bicycle lanes are infeasible due to insufficient width. Sharrows typically centered on the effective width of the outside travel lane; Continuous green bands of four to six feet in width, underneath the sharrows and also centered on the effective lane width of the outside travel lane; Signs communicating shared lane messages (e.g., bikes may use full lane, share the road, and experimental alternatives); and The projects in Salt Lake City, Long Beach, and Minneapolis (Hennepin Avenue) were implemented on four-lane urban arterials. Table A-1 (Appendix A) summarizes the specific characteristics and evaluation methodologies for these six experiments. Across the available evaluation studies, the enhanced shared lane was found to shift a substantial percentage of bicyclists away from the door zone (or curb) and closer to the center of the lane. The changes in lateral positioning on enhanced shared lanes were more pronounced than those found in separate studies of sharrows without the green color pavement (or other enhancements); however, previous studies of enhanced shared lanes were not phased and therefore did not specifically isolate the effects of the green color pavement (or other enhancements). The green shared lane experiments in Long Beach and Minneapolis (Hennepin Avenue) both documented corresponding decreases in auto-bicycle collision rates. Table A-2 (Appendix A) summarizes the findings of the four completed projects and identifies outstanding issues that were addressed by the City of Oakland s experiment: Comparative effects of sharrows versus sharrows plus the green band; Changes in passing distance between overtaking motorists and bicyclists; Changes in auto lane utilization; and Effects on transit (including passing distance, leap-frogging, and delay). METHODOLOGY EXPERIMENT DESIGN A phased before/after study was designed to evaluate the effectiveness of the experimental treatment and to monitor safety. The implementation phases were as follows: (1) Baseline condition: bicycle guide signs (D11-1); no bikeway striping (prior to May 2013); (2) Sharrows, parking edge line stripes (Detail 27B), and Bicycles May Use Full Lane (R4-11) signs (June to August 2013); and (3) Above plus five-foot wide green band (September 2013 to present). The study was deliberately phased to use standard, currently-approved MUTCD traffic control devices first and then add the experimental device. The green band was introduced last in order 13
16 to compare its efficacy with the standard and simpler treatments. Each phase remained in place for a minimum of four weeks to allow for behavior to normalize. RESEARCH QUESTIONS AND DATA COLLECTION PLAN To address gaps in the existing literature, the evaluation study and data collection plan were designed to address the following research questions: A. Are bicyclist volumes increasing on 40 th Street? If so, is this a shift from parallel streets or an overall increase? B. Does the green band result in bicyclists riding further from parked cars? C. Does the green band result in motorists giving bicyclists more room when passing midblock? D. Does the green band result in motorists giving bicyclists more room when passing at intersections? E. Does the green band result in changes to lane utilization? F. Do auto speeds change in either lane with the green band in place? G. Are motorists safely able to change lanes to pass bicyclists? H. What is the collision history for motorists and bicyclists without and with the green band installed? I. How do bus drivers navigate the outside travel lane mid-block with the green band in place? J. How do bus drivers navigate the outside travel lane at intersections with the green band in place? Table 1 presents the research questions and the data collected to answer them. Data collection occurred in the final week of each phase. With scheduling constraints due to construction of the project and holidays, this allowed for four weeks during Phase 2 and six weeks during Phase 3 for motorist and bicyclist behavior to adjust to the newly introduced treatments. For each phase, the study collected two weekdays and two weekend days of video data between 12:00PM and 8:00PM. Data collection periods were chosen to exclude holidays and inclement weather. For this evaluation report, only the weekday PM peak (4:00-6:00PM) period and weekend afternoon (12:00-2:00PM) peak period were analyzed. In addition, seven days of bicycle and auto volume counts plus auto and bus speeds were collected. Bicycle tube counts were also collected on 42 nd Street and MacArthur Boulevard, which are parallel routes to the north and south of 40 th Street, respectively. The collision analysis was completed for the entire corridor, comparing one year of before data to one year of after data using Oakland Police Department and California Highway Patrol collision reports. For all other measures, data were collected for both directions of travel between Market Street and West Street, the mid-section of the corridor. 14
17 TABLE 1: Data Interpretation Methodology and Statistical Analysis Evaluation Questions Variables Coding Methodology Analytical Method A. Are bicyclist volumes increasing on 40th Street? If so, shifting from parallel streets or overall increase? Bicycle volumes on 40 th Street, 42 nd Street, and MacArthur Boulevard - Percentage change between phases B. Does the green band result in bicyclists riding further from parked cars? Mid-block lateral positioning of bicyclists and parked cars relative to lane line 2 Instances of sidewalk riding Instances of wrong-way riding Distance in feet between bicyclists and edge of curb 1 Notation of bicyclists riding on the sidewalk t-test to determine whether change in mid-block positioning is statistically significant Intersection lateral positioning 2, 3 Distance in feet between bicyclists and edge of curb 1 t-test to determine whether change in intersection positioning is statistically significant C. Does the green band result in motorists giving bicyclists more room when passing mid-block? Mid-block lateral positioning of bicyclists and autos Distance in feet between inside edge of auto to bicyclist 1 t-test to determine whether change in passing difference is statistically significant D. Does the green band result in motorists giving bicyclists more room when passing at intersections? Intersection lateral positioning of bicyclists and autos, distinguishing between left- and right-side passing Distance in feet between inside edge of auto to bicyclist 1 Whether or not bicyclist arrived first t-test to determine whether change in passing difference is statistically significant E. Does the green band result in changes to lane utilization? Vehicle volume by lane - Percentage change in lane 1 and lane 2 lane utilization between three phases 15
18 TABLE 1: Data Interpretation Methodology and Statistical Analysis Evaluation Questions Variables Coding Methodology Analytical Method F. Do auto speeds change in either lane when the green band is in place? 85 th percentile speed by lane - Percentage change in lane 1 and lane 2 speeds between three phases G. Are motorists safely able to change lanes to pass bicyclists? Assessment of motorist ability to safely change lanes to pass No Car Immediately Adjacent No Opportunity to Pass (Gap < 50 ) Car Immediately Adjacent Percentage change in ability to safely change lanes to pass between three phases H. What is the collision history for motorists and bicyclists without and with the green band installed? Bicycle-auto collision reports from Oakland Police Department (OPD) Collision summary review I. How do bus drivers navigate the outside travel lane mid-block with the green band in place? Mid-block lateral positioning of bicyclists and buses Qualitative observations J. How do bus drivers navigate the outside travel lane at intersections with the green band in place? Intersection lateral positioning of bicyclists and buses relative to curb face - Qualitative observations Notes 1. Data was recorded in half-foot increments. 2. The data collection methodology measured positioning relative to the lane line due to limited visibility of curb line in video and the variation in parked cars spacing relative to face of curb. Data analysis reports distance from face of curb to understand positioning of bicyclists relative to the door zone and allow direct comparison to other studies. 3. Only through bicyclists were analyzed, as right-turning bicyclists were assumed to position different at the intersection. 16


19 VIDEO INTERPRETATION Vehicle and bicycle volumes and auto speeds were received in Microsoft Excel format. For the experiment Fehr & Peers developed a methodology, using a constructed, perspectival grid, to measure bicycle and vehicle positioning from the video data. Previous studies measured lateral positioning through physical markings in the roadway. In order to avoid the possibility that physical markings affect bicyclist and vehicle positioning in the roadway, a post-processing approach was chosen. Screen captures of quality of video data prior to processing. Adobe software and known roadway and striping dimensions were used to construct a perspectival grid overlaid onto the video at half foot increments. Half foot increments were chosen in order to provide precision while also acknowledging the limitations of the media to provide more specific measurements. To facilitate video interpretation, half foot zones were drawn and centered on each half foot increment. Each event within that zone was recorded according to the band it was centered on. For example, if a bicyclist was positioned between and feet away from the curb, they would be recorded as traveling 10.5 feet from the curb. Screen captures of quality of video with measured ½ foot zones. 17
20 FINDINGS EFFECTS ON BICYCLE VOLUMES Analysis Methodology Results EFFECTS ON BICYCLE LATERAL POSITIONING MID-BLOCK Analysis Methodology Evaluation Question B posed the following question, Does the green band result in bicyclists riding further from parked cars? The purpose of this question was to analyze whether the applied treatments encouraged bicyclists to ride closer to the center of the lane or fully take the lane and to shift positioning to outside the door zone. The benefit of riding outside the door zone is that bicyclists would have a reduced risk of hitting a door opened by someone in a parked car. To evaluate this question, bicyclist lateral positioning was evaluated under two conditions: 1) bicycle free flow (no vehicle present), 2) vehicle interaction (vehicle either tailing or passing cyclist). For the purpose of this study, a vehicle interaction is defined as either (1) an auto that does not pass a bicyclist and continues to travel behind the bicyclist (whether or not an opportunity was available) or (2) an automobile that overtakes and passes a bicyclist. For each bicyclist, the distance between the curb and the center of the front wheel of the bicycle was recorded. Lateral positioning was evaluated both based on distance from the curb in half-foot increments, and organized by zone of travel ( in the door zone versus in or near the green band ). 3 Since it was expected that the presence of parked cars would influence bike positioning, the data were also separated by whether a car was parked to the right of the cyclist when the measurement was taken. Bicyclist distance from the curb was compared between weekday and weekend; however, for the most part, the cycling distance from the curb was not statistically different between weekday riders and weekend riders. The one exception is during Phase 3 when vehicles are present and cars are parked, where the results show that cyclists were riding further from the curb during weekends than during weekdays. Therefore, for the following analysis, unless otherwise noted, weekend and weekday data are aggregated together, which creates a larger sample size. 3 The door zone was assumed to be feet from the curb as measured to the center of the bicyclist. Positioning greater than 11 feet is considered to be the green zone which is in the green band or directly adjacent to it and therefore outside of the door zone. 18
21 To determine whether the shift in lateral positioning was statistically significant between each subsequent phase, t-test analysis was performed based on the bicyclist distance from the curb in half-feet. Chi-square tests were performed to evaluate whether there was a statistically significant shift in the percent of bicyclists cycling in the green zone. Results: Bicyclist Positioning with Vehicles Parked Numeric Distance from Curb Question B Key Findings with Parked Cars, Numeric Distance from Curb: (1) The average lateral bicycle free-flow positioning increased by 2.1 feet, from 9.0 to 11.1 between Phases 1 and 3, and the shift was found to be statistically significant. The average lateral bicycle free-flow positioning increase by 0.6 feet, from 9.0 to 9.6 feet, between Phases 1 and 2, and the shift was found to be statistically significant, (2) During overtaking events, the average lateral bicycle positioning increased by 1.3 feet, from 8.6 to 9.9 feet between Phases 1 and 3, and the shift was found to be statistically significant. Figure 5 summarizes the bicyclist distance from the curb for each condition during each of the three phases when cars were parked. The red boxes indicate the average bicyclist distance from the curb for each category. The lines, or whiskers, indicate the 10 th to the 90 th percentile values for bicyclist lateral positioning (the percentile is the value below which a given percentage of observations within a group fall). As the figure demonstrates, the average bicyclist distance from the curb increased between each subsequent phase for bicyclists under both free flow conditions and conditions in which a vehicle was present, but the range of values varied greatly. Under both conditions the range of values varied more during Phase 3 than during Phases 1 or 2. This is consistent with previous findings on the effectiveness of sharrows. 4 4 For example, in the San Francisco Shared Lane Marking Evaluation (2004), bicyclists shifted an additional eight inches away from parked cars with the presence of sharrows as compared to the baseline condition, which was a statistically significant finding. This is comparable to the statistically significant approximately seven inches, on average, observed in this study. 19
22 The t-test results are summarized in Table 2. Between each subsequent phase, the increase in the bicyclist distance from the curb during free flow conditions was found to be significant. This indicates that compared to the base condition with bicycle accommodation, both the presence of all MUTCD-approved treatments (Phase 2) and the presence of green pavement (Phase 3) increased the cyclist distance from the curb when no cars were present. The longer whiskers during Phase 3 indicate that there is more variation in bicyclist behavior during Phase 3; while the average distance from the curb increased significantly, some bicyclists still rode close to the curb, and others rode further from the curb than before the treatments were installed. This may indicate a varied response to the super sharrow amongst bicyclists. Likely this reflects (1) some bicyclists understanding that the green band is where they should ride and (2) varying degrees of bicyclist comfort with taking the lane. The variability in positioning and the statistically significant increase in average distance from the curb with the Phase 3 green pavement indicate that the treatment achieved the goal of encouraging bicyclists to take the lane. Cyclist distance from the curb while a vehicle was present did not change significantly between Phases 1 and 2. Between Phases 2 and 3 and between Phases 1 and 3, when vehicles were present, the increased bicyclist distance from the curb was significant. This indicates that, when vehicles are present, the super sharrow markings encourage cyclists to shift their positioning, cycling further from the curb than both the base scenario and the scenario with standard sharrows. However sharrows alone did not encourage a significant shift in cyclist distance from the curb over the base case when vehicles were present. 20
23 TABLE 2: Bike Distance from Curb t-test 1 Results Vehicles Parked Condition Phases p-value 2 (2-tailed) Significant? Between Phase 1 and Phase Yes Free Flow Between Phase 2 and Phase 3 < Yes Between Phase 1 and Phase 3 < Yes Between Phase 1 and Phase No Vehicle Present Between Phase 2 and Phase 3 < Yes Between Phase 1 and Phase 3 < Yes 1. A t-test is a statistical examination of two population means. A two-sample t-test examines whether two samples are different. 2. The p-value is the probability of obtaining a test statistic result at least as extreme as the one that was actually observed, assuming that the null hypothesis of no difference between the phases is true. The smaller the p-value, the more confidence that of statistical significance. Distance from Curb by Zone of Travel Question B Key Findings with Parked Cars, Zone of Travel: (1) During bicyclist free flow, the percentage of cyclists riding in the green zone increased from 5% to 39% between Phases 1 and 3 and from 5% to 10% between Phases 2 and 3. These shifts are statistically significant. (2) During overtaking events, the percentage of bicyclists riding in the green zone increased from 0% to 19% between Phases 1 and 3, and the shift is statistically significant. Between Phases 1 and 2, all overtaking events in the presence of parked cars occurred in the door zone. The results were also analyzed based on zone of travel. Figure 6 summarizes the percent of bicyclists riding within each of the following zones, during each of the three phases and under both conditions studied, when vehicles are parked: Door Zone ( feet from curb) In or Near Green Band, Green Zone (>11 feet from curb) The distances refer to the location of the bicyclists front wheel with respect to the roadway s curb. These results were analyzed to determine whether the percent of bicyclists riding outside of 21
24 the door zone (e.g. to the left of the door zone, either to the right of the green band, in the green band or to the left of the green band) increased between the subsequent phases. Figure 6: Cyclist Positioning Autos Parked 100% 90% 80% 70% 60% 50% 40% 30% 95% 90% 61% 100% 100% 81% In Door Zone In Green Zone 20% 10% 0% 5% Phase 1 (N=60) 10% Phase 2 (N=110) 39% Phase 3 (N=107) 0% 0% Phase 1 (N=37) Phase 2 (N=44) 19% Phase 3 (N=72) Freeflow Auto Interaction The chi-square results are summarized in Table 3. Between each subsequent phase, the increase in the percent of bicyclists riding in the green zone during free flow conditions increased. This increase was only found to be significant between Phases 2 and 3 (MUTCD approved treatments and green pavement plus MUTCD-approved treatments, respectively) and between Phases 1 and 3 (no bicycle treatment and green pavement plus MUTCD-approved treatments, respectively). This indicates that both the average cycling distance from the curb and the percentage of cyclists riding outside of the door zone increased with the green band in Phase 3. Although the MUTCDapproved treatments alone provided a statistically significant increase in bicyclist distance from the curb, the increase in the percent of cyclists riding outside of the door zone compared to base conditions was not statistically significant. The percent of bicyclists riding in the green zone while vehicles are present was zero in both Phases 1 and 2. However, this percent increased and was significant between Phases 2 and 3 and between Phases 1 and 3. This indicates that the percent of cyclists riding outside of the door zone increased significantly with the implementation of the green band plus MUTCD-approved treatments, even when vehicles were present. 22
25 TABLE 3: Percent of Bicyclists Riding in Green Zone Chi-Square 1 Results Vehicles Parked Condition Phases Chi- Square p-value 2 Significant? Between Phase 1 and Phase No Free Flow Between Phase 2 and Phase <0.001 Yes Between Phase 1 and Phase <0.001 Yes Between Phase 1 and Phase 2 NA NA No Vehicle Present Between Phase 2 and Phase Yes Between Phase 1 and Phase Yes 1. A Chi-square test is a statistical test commonly used for testing independence and goodness of fit. 2. The p-value is the probability of obtaining a test statistic result at least as extreme as the one that was actually observed, assuming that the null hypothesis of no difference between the phases is true. The smaller the p-value, the more confidence that there was a statistically significant increase in the percent of bicyclists riding in the green zone. Results No Vehicles Parked Question B Key Findings No Parked Cars: (1) With no autos parked, bicyclists appear to exhibit weaving behavior where space allowed them to ride in the parking lane. (2) Average distance from the curb was 8.8 (free flow) and 8.4 (auto interaction) during Phase 3, increased minimally between Phases 1 and 3, and did not increase between Phases 2 and 3, when autos were passing or tailing bicyclists. During bicycle free flow conditions, the difference between Phases 1 and 2 and Phases 1 and 3 were significant. (3) Sample size for this analysis was limited due to the highly utilized parking. The same analysis was performed when no cars were parked to the right of the cyclist. For the purpose of this analysis no parking is defined as either one or more unoccupied parking spaces or a break in parking as a result of a driveway or bus stop. Video data only captured the no parking condition during the weekday; as such, no weekend data is available. The average, 10 th percentile and 90 th percentile values for cyclist distance from the curb for each phase and condition are shown in Figure 7. Between Phases 1 and 2 and between Phases 1 and 3 under free flow conditions, cyclist distance from the curb increased significantly on weekdays when no cars 23
26 were parked. However, between other conditions and phases no statistically significant shift was found. This indicates that, even when no cars are parked, under free flow conditions both sharrows and super sharrows result in cyclists riding further from the curb than under base conditions. However, the shift was comparable with standard sharrows and super sharrows. Furthermore, variability in bicyclist distance from the curb is greatest with super sharrows. When autos are interacting with bicyclists, there is no statistically significant shift in bicyclist position with the sharrows or super sharrows. This indicates that when no cars are parked and vehicles are tailing or passing, cyclists tend to ride in, or close to, the parking lane rather than taking the lane. However, the sample size for this analysis was very small; a larger sample size could help to confirm these results. 24
27 TABLE 8: Bike Distance from Curb t-test 1 Results Weekday, No Vehicles Parked Condition Phases p-value 2 (2-tailed) Significant? Between Phase 1 and Phase 2 < Yes Free Flow Between Phase 2 and Phase No Between Phase 1 and Phase Yes Between Phase 1 and Phase No Vehicle Present Between Phase 2 and Phase No Between Phase 1 and Phase No 1. A t-test is a statistical examination of two population means. A two-sample t-test examines whether two samples are different. 2. The p-value is the probability of obtaining a test statistic result at least as extreme as the one that was actually observed, assuming that the null hypothesis of no difference between the phases is true. The smaller the p-value, the more confidence that there was a statistically significant increase in the bicyclist distance from the curb. EFFECTS ON PASSING DISTANCE Analysis Methodology Evaluation Question C posed the following question: Does the green band result in motorists giving bicyclists more room when passing mid-block? The purpose of this question was to analyze whether the applied treatments encouraged motorists to change lanes to pass and thereby give bicyclists more space. For each vehicle-bicyclist interaction, the distance between the center of the front wheel of the bicycle and the inner edge of the vehicle was recorded. The distance between the center of the front wheel of the cyclist and the edge of the cyclist was assumed to be 1 foot 5. Vehicle passing was evaluated both based on distance between vehicle 5 Average width of a bicycle is typically about 2 feet (Minnesota DOT Bikeway Facility Design Guide As a result, half of that distance is subtracted (1 foot) to measure the distance between the edge of the bicyclist and the edge of the passing automobile. 25
28 and bicycle in feet, and based on passing zone (passing with more than three feet versus less than three feet 6 ). In order to determine whether the shift in passing distance was statistically significant between each subsequent phase, t-test analysis was performed based on the distance between the vehicle and bicyclist in feet. Additionally, chi-square tests were performed to evaluate whether there was a statistically significant shift in the percent of vehicles passing at a safe distance (more than three feet). Results Question C Key Findings Weekday with Parked with Cars: Parked Cars: (1) Passing Average distance passing distance was over was 4 feet over in all 4 feet three in phases all three and phases though and the though average the passing average distance passing increased distance increased across the in threein the third the phase, third phases, this increase it this was increase not found was not to be found significant. to be significant. Passing distance between vehicles and cyclists during each phase is summarized in Figure 8. The average passing distance remained the same between Phases 1 and 2 and increased slightly in Phase 3. The variation in passing distance increased between each subsequent phase. This indicates that while some vehicles gave bicyclists more room while passing, other vehicles passed at a closer distance during Phases 2 and 3. This may be because bicyclists were riding further from the curb, vehicles had less room to pass within the lane, and therefore passed at a closer distance in order to stay within the lane of travel. 6 A three foot passing distance was used, as Assembly Bill 1371 will require motorists to give bicyclists three feet of passing distance in the State of California. The law takes effect in September
29 The t-test results are summarized in Table 9. Although the average passing distance increased slightly in Phase 3, this increase was not found to be statistically significant; the increase was within the margin of error. It should be noted that the travel lane plus parking lane is 20 feet in width.. When bicyclists are operating in or near the door zone, passenger vehicles typically have sufficient room to pass cyclists within the travel lane while still giving at least three feet of passing distance. 27
30 TABLE 9: Vehicle-Bicycle Passing Distance t-test 1 Results Condition Phases p-value 2 (2-tailed) Significant? Between Phase 1 and Phase No Vehicle Present Between Phase 2 and Phase No Between Phase 1 and Phase No 1. A t-test is a statistical examination of two population means. A two-sample t-test examines whether two samples are different. 2. The p-value is the probability of obtaining a test statistic result at least as extreme as the one that was actually observed, assuming that the null hypothesis of no difference between the phases is true. The smaller the p-value, the more confident we can be that there was a statistically significant shift in vehicle-bike passing distance between the two phases identified. Figure 9 shows a breakdown of the vehicle passing events observed during each phase between vehicles passing a bicyclist within three feet and those passing with more than three feet. The chisquare test results are summarized in Table 10. No significant shift in the percent of vehicles passing with more than three feet was seen between Phase 1 and Phase 2, however the difference between Phase 1 and Phase 3 was found to be significant. This suggests that, with super sharows, auto passing distance is more variable. Although the average passing distance remains fairly constant between the three phases, during Phase 3 a larger percent of autos are passing bicyclists with less than three feet of passing distance. 28
Complete Street Analysis of a Road Diet: Orange Grove Boulevard, Pasadena, CA
 Complete Street Analysis of a Road Diet: Orange Grove Boulevard, Pasadena, CA Aaron Elias, Bill Cisco Abstract As part of evaluating the feasibility of a road diet on Orange Grove Boulevard in Pasadena,
Active Transportation Facility Glossary
 Active Transportation Facility Glossary This document defines different active transportation facilities and suggests appropriate corridor types. Click on a facility type to jump to its definition. Bike
FEDERAL HIGHWAY ADMINISTRATION APPLICATION
 FEDERAL HIGHWAY ADMINISTRATION APPLICATION REQUEST FOR PERMISSION TO EXPERIMENT WITH A BICYCLE BOX INTERSECTION TREATMENT Submitted by: City of Columbus Department of Public Service Date: June 26, 2009
MEMORANDUM. Charlotte Fleetwood, Transportation Planner
 MEMORANDUM Date: Updated August 22, 2017 To: Organization: Charlotte Fleetwood, Transportation Planner Boston Transportation Department From: Jason DeGray, P.E., PTOE, Regional Director of Engineering
APPENDIX A: Complete Streets Checklist DRAFT NOVEMBER 2016
 APPENDIX A: Complete Streets Checklist DRAFT NOVEMBER 2016 Complete Streets Checklist MetroPlan Orlando s Complete Streets Checklist is an internal planning tool for staff to further implementation of
Cycle Track Design Best Practices Cycle Track Sections
 Design Best Practices Sections It is along street segments where the separation and protection methods of cycle tracks offer more comfort than conventional bicycle lanes, and are more attractive to a wide
A Survey of Planning, Design, and Education for Bikeways and Bus Routes on Urban Streets
 A Survey of Planning, Design, and Education for Bikeways and Bus Routes on Urban Streets, Community & Economic Development Agency, Transportation Services Division (510) 238-3983 bikeped@oaklandnet.com
EUCLID AVENUE PARKING STUDY CITY OF SYRACUSE, ONONDAGA COUNTY, NEW YORK
 EUCLID AVENUE PARKING STUDY CITY OF SYRACUSE, ONONDAGA COUNTY, NEW YORK CITY OF SYRACUSE DEPARTMENT OF PUBLIC WORKS 1200 CANAL STREET EXTENSION SYRACUSE, NEW YORK 13210 DRAFT REPORT DATE: November 13,
Chapter 3 BUS IMPROVEMENT CONCEPTS
 Chapter 3 BUS IMPROVEMENT CONCEPTS The purpose of this chapter is to describe potential bus improvement strategies and potential impacts or implications associated with BRT implementation within the existing
Implementing Complete Streets in Ottawa. Project Delivery Process and Tools Complete Streets Forum 2015 October 1, 2015
 Implementing Complete Streets in Ottawa October 1, 2015 The Essentials Complete Streets Implementation Framework will become part of the routine delivery of City transportation projects Approach uses every
Chapter 2: Standards for Access, Non-Motorized, and Transit
 Standards for Access, Non-Motorized, and Transit Chapter 2: Standards for Access, Non-Motorized, and Transit The Washtenaw County Access Management Plan was developed based on the analysis of existing
2.0 LANE WIDTHS GUIDELINE
 2.0 LANE WIDTHS GUIDELINE Road Engineering Design Guidelines Version 2.0.1 May 2018 City of Toronto, Transportation Services City of Toronto Page 0 Background In early 2014, Transportation Services initiated
REGIONAL BICYCLE AND PEDESTRIAN DESIGN GUIDELINES
 REGIONAL BICYCLE AND PEDESTRIAN DESIGN GUIDELINES November 16, 2011 Deb Humphreys North Central Texas Council of Governments Bicycle and Pedestrian Advisory Committee Snapshot of the Guide 1. Introduction
Dear Mr. Tweed: Sincerely, Min Zhou, P.E. Vice President
 December 17, 2012 Mr. Steve Tweed City of Long Beach, Department of Public Works Traffic & Transportation Bureau, 10 th Floor City Hall 333 West Ocean Boulevard Long Beach, CA 90802 Subject: Broadway and
CITY OF OAKLAND. 27th Street Bikeway Feasibility and Design. Final Report (v3) March 23, Kimley-Horn and Associates, Inc.
 March 23, Kimley-Horn and Associates, Inc.") CITY OF OAKLAND 27th Street Bikeway Feasibility and Design Final Report (v3) March 23, 2007 PREPARED BY: Kimley-Horn and Associates, Inc. Table of Contents 1. Introduction 3 2. 27 th Street/Bay Place Corridor
CITY OF OAKLAND 27th Street Bikeway Feasibility and Design Final Report (v3) March 23, 2007 PREPARED BY: Kimley-Horn and Associates, Inc. Table of Contents 1. Introduction 3 2. 27 th Street/Bay Place Corridor
Off-road Trails. Guidance
 Off-road Trails Off-road trails are shared use paths located on an independent alignment that provide two-way travel for people walking, bicycling, and other non-motorized users. Trails specifically along
Bicycle Facilities Planning
 Bicycle Facilities Planning Overview Types of Cyclists Purpose for Riding Types of Facilities Bike Lanes Bicycle Boulevards Cycle Tracks Intersections Signals Signing and Marking Discussion Types of Bicyclists
DEPARTMENT OF ENVIRONMENTAL SERVICES. North Harrison Street (Lee Highway to Little Falls Road) Comparative Analysis. Prepared for:
 Comparative Analysis. Prepared for:") DEPARTMENT OF ENVIRONMENTAL SERVICES North Harrison Street (Lee Highway to Little Falls Road) Comparative Analysis Prepared for: Arlington County Department of Environmental Services 2100 Clarendon Boulevard,
DEPARTMENT OF ENVIRONMENTAL SERVICES North Harrison Street (Lee Highway to Little Falls Road) Comparative Analysis Prepared for: Arlington County Department of Environmental Services 2100 Clarendon Boulevard,
Simulation Analysis of Intersection Treatments for Cycle Tracks
 Abstract Simulation Analysis of Intersection Treatments for Cycle Tracks The increased use of cycle tracks also known as protected bike lanes has led to investigations of how to accommodate them at intersections.
Appendix 3 Roadway and Bike/Ped Design Standards
 Appendix 3 Roadway and Bike/Ped Design Standards OTO Transportation Plan 2040 4/20/2017 Page A3-1 Adopted Standards The adopted OTO Design Standards and Major Thoroughfare Plan are contained herein.
Coquitlam Cross-town Bike Route Improving Bicycle Facilities in a Mature Suburban Environment
 Coquitlam Cross-town Bike Route Improving Bicycle Facilities in a Mature Suburban Environment Sarah Rocchi, Vice-President, Projects, Opus International Consultants (Main Presenter) Catherine Mohoruk,
Caltrans Sloat Boulevard Pedestrian Safety Project Response to Community Questions, Comments & Concerns
 Caltrans Sloat Boulevard Pedestrian Safety Project Response to Community Questions, Comments & Concerns Revised: May 10, 2016 The California Department of Transportation (Caltrans) is planning various
Dr. M.L. King, Jr. Street North Complete Streets Resurfacing Opportunities HOUSING, LAND USE, AND TRANSPORTATION COMMITTEE MARCH 22, 2018
 Dr. M.L. King, Jr. Street North Complete Streets Resurfacing Opportunities HOUSING, LAND USE, AND TRANSPORTATION COMMITTEE MARCH 22, 2018 What s Happening The City plans to mill and resurface Dr. M.L.
CURBSIDE ACTIVITY DESIGN
 5 CURBSIDE ACTIVITY DESIGN This chapter provides design guidance for separated bike lanes adjacent to curbside activities including parking, loading and bus stops. Typical configurations are presented
TRAFFIC IMPACT ANALYSIS
 TRAFFIC IMPACT ANALYSIS FOR THE CHAMPAIGN UNIT#4 SCHOOL DISTRICT PROPOSED HIGH SCHOOL (SPALDING PARK SITE) IN THE CITY OF CHAMPAIGN Final Report Champaign Urbana Urbanized Area Transportation Study 6/24/2014
Shared Lane Markings: When and Where to Use Them. Mike Sallaberry, SFMTA Pro Walk/Pro Bike in Seattle September 4, 2008
 Shared Lane Markings: When and Where to Use Them Mike Sallaberry, SFMTA Pro Walk/Pro Bike in Seattle September 4, 2008 San Francisco Bicycle Route Network Bike Network: 208 Total Miles 31 Miles of Bike
Designing On Road Bikeways
 Module B Learning Outcomes: Describe features of on road bikeways Select design criteria for on road bikeways in various contexts Bicycle Characteristics Height Handlebar 36 44 in Eye 60 in Operating 100
APPENDIX D LEVEL OF TRAFFIC STRESS METHODOLOGY
 APPENDIX D LEVEL OF TRAFFIC STRESS METHODOLOGY 01 WHAT IS LEVEL OF TRAFFIC STRESS? When people bicycle on roadways, they encounter varying levels of stress from traffic. A quiet residential street with
A Traffic Operations Method for Assessing Automobile and Bicycle Shared Roadways
 A Traffic Operations Method for Assessing Automobile and Bicycle Shared Roadways A Thesis Proposal By James A. Robertson Submitted to the Office of Graduate Studies Texas A&M University in partial fulfillment
Appendix C. TRAFFIC CALMING PROGRAM TOOLBOX
 Appendix C. TRAFFIC CALMING PROGRAM TOOLBOX PHASE I...2 Do Not Enter Sign...3 One-Way Sign...4 Turn Prohibition...5 Pavement Markings...6 Speed Monitoring Trailer...7 Neighborhood Speed Watch...8 Police
NJDOT Complete Streets Checklist
 Background The New Jersey Department of Transportation s Complete Streets Policy promotes a comprehensive, integrated, connected multi-modal network by providing connections to bicycling and walking trip
ADVISORY BICYCLE LANES REALITY VERSUS DESIGN GUIDANCE
 Michael Williams 0 ADVISORY BICYCLE LANES REALITY VERSUS DESIGN GUIDANCE Michael Williams (Corresponding author) Alta Planning + Design SE Grand Avenue Portland, OR Email: michaelwilliams@altaplanning.com
Pedestrian & Bicycle Safety Innovations & Applications
 Pedestrian & Bicycle Safety Innovations & Applications County Engineers Association of Maryland Spring, 2017 Conference May 25, 2017 George Branyan Pedestrian Program Coordinator District Department of
Northbound San Jose Avenue & I-280 Off-Ramp Road Diet Pilot Project
 Project Overview Fed by a two-lane Interstate-280 (I-280) off-ramp, high vehicular volumes and speeds are longstanding issues along San Jose Avenue. Residents in the surrounding neighborhoods have expressed
Lincoln Avenue Road Diet Trial
 Lincoln Avenue Road Diet Trial Data Collection Report June 1, 2015 Department of Transportation Table of Contents I. Introduction...... 3 II. Data Collection Methodology & Results...... 5 A. Traffic Volume
Operational Comparison of Transit Signal Priority Strategies
 Operational Comparison of Transit Signal Priority Strategies Revision Submitted on: November, 0 Author: Adriana Rodriguez, E.I Assistant Engineer Parsons Brinckerhoff 0 South Orange Avenue, Suite 00 Orlando,
Broad Street Bicycle Boulevard Design Guidelines
 Broad Street Bicycle Boulevard Design Guidelines Building from the strategies introduced in the 2013 Bicycle Transportation Plan and community input received thus far, City Transportation Staff have identified
10.0 CURB EXTENSIONS GUIDELINE
 10.0 CURB EXTENSIONS GUIDELINE Road Engineering Design Guidelines Version 1.0 March 2017 City of Toronto, Transportation Services City of Toronto Page 0 Background In early 2014, Transportation Services
Appendix A: Crosswalk Policy
 Appendix A: Crosswalk Policy Appendix A: Crosswalk Policy Introduction This citywide Crosswalk Policy is aimed at improving pedestrian safety and enhancing pedestrian mobility by providing a framework
Pavement Markings (1 of 3)
") Pavement Markings (1 of 3) DESCRIPTION AND DEFINITION Disadvantages Relatively high cost (over typical Crash reduction as yet unknown painted edge line) No tactile effect The STOP AHEAD pavement marking
Pavement Markings (1 of 3) DESCRIPTION AND DEFINITION Disadvantages Relatively high cost (over typical Crash reduction as yet unknown painted edge line) No tactile effect The STOP AHEAD pavement marking
CITY OF LOS ANGELES INTER-DEPARTMENTAL MEMORANDUM
 CITY OF LOS ANGELES INTER-DEPARTMENTAL MEMORANDUM Date: April 1, 219 To: Honorable City Council c/o City Clerk, Room 395, City Hall Attention: Honorable Mike Bonin, Chair, Transportation Committee From:
Southside Pilot Proposal
 To improve bicycle access and mobility to UC Berkeley, Downtown Berkeley, and the Southside area, a pilot project could include a two-way parking-protected cycle track. Turn pockets and island bus stops
CITY OF WEST LAKE HILLS. Forest View Neighborhood Traffic Calming Study
 CITY OF WEST LAKE HILLS 901 South Mopac Expressway Building V, Suite 220 Austin, Texas 78746 Texas P.E. Firm Registration No. F-929 Klotz Associates Final Report Submittal: March 20, 2015 Revised Final
East 12 th Street Bikeway Feasibility Study
 Final Report East 12 th Street Bikeway Feasibility Study Prepared for: City of Oakland Public Works Agency Submitted by: 180 Grand Avenue, Suite 250 Oakland, CA 94612 Phone: (510) 839-1742; Fax: (510)
Agenda. Overview PRINCE GEORGE S PLAZA METRO AREA PEDESTRIAN PLAN
 PRINCE GEORGE S PLAZA METRO AREA PEDESTRIAN PLAN May 28, 2008 Agenda Welcome and introductions Project overview and issue identification Planning context and strengths Design challenges and initial recommendations
Saturation Flow Rate, Start-Up Lost Time, and Capacity for Bicycles at Signalized Intersections
 Transportation Research Record 1852 105 Paper No. 03-4180 Saturation Flow Rate, Start-Up Lost Time, and Capacity for Bicycles at Signalized Intersections Winai Raksuntorn and Sarosh I. Khan A review of
Telegraph Avenue Complete Streets DRAFT Recommendations. Oakland Public Works Department September 11 and 13, 2014 Open Houses
 Telegraph Avenue Complete Streets DRAFT Recommendations Oakland Public Works Department September 11 and 13, 2014 Open Houses Presentation Overview What are complete streets? What problem are we trying
Figure 1: Vicinity Map of the Study Area
 ARIZONA TEXAS NEW MEXICO OKLAHOMA May 5, 2016 Mr. Anthony Beach, P.E. BSP Engineers 4800 Lakewood Drive, Suite 4 Waco, Texas 76710 Re: Intersection and Access Analysis along Business 190 in Copperas Cove
9/25/2018. Multi-Modal Level of Service (MMLOS) Bianca Popescu, Transportation Planner
 Bianca Popescu, Transportation Planner") Multi-Modal Level of Service (MMLOS) Bianca Popescu, Transportation Planner 1 What is MMLOS? Is this a nice place to walk? Is this a nice place to bike? Is transit convenient? Bottom line - Are there options
Multi-Modal Level of Service (MMLOS) Bianca Popescu, Transportation Planner 1 What is MMLOS? Is this a nice place to walk? Is this a nice place to bike? Is transit convenient? Bottom line - Are there options
2017 SAFETY EFFICACY CONFIDENCE LEVELS FOR PEDESTRIAN AND BICYCLE TREATMENTS
 2017 SAFETY EFFICACY CONFIDENCE LEVELS FOR PEDESTRIAN AND BICYCLE TREATMENTS APRIL 2017 INTRODUCTION... 1 HIGH CONFIDENCE LEVEL... 3 BICYCLE BOULEVARDS... 4 GREEN PAVEMENT... 5 LEADING PEDESTRIAN INTERVAL...
Richmond-Adelaide Cycle Tracks
 Public Drop-In Event Richmond-Adelaide Cycle Tracks June 25, 2018 12:00 p.m. 3:00 p.m. 4:30 p.m. 7:30 p.m. Metro Hall, Rotunda 55 John Street 1 Purpose of Event In Scope Communicate an update about the
Appendix A-2: Screen 1 Alternatives Report
 Appendix A-2: Screen 1 Alternatives Report SCREEN 1 ALTERNATIVES REPORT Western & Ashland Corridors Bus Rapid Transit (BRT) Project Prepared for Chicago Transit Authority 567 West Lake Street Chicago,
MEMORANDUM. Date: 9/13/2016. Citywide Crosswalk Policy
 MEMORANDUM Date: 9/13/2016 Re: Citywide Crosswalk Policy Foreword Through the s Circulation Element and Complete Streets Policy, it is the City s goal to promote walking trips and provide safe facilities
Defining Purpose and Need
 Advanced Design Flexibility Pilot Workshop Session 4 Jack Broz, PE, HR Green May 5-6, 2010 Defining Purpose and Need In your agency s project development process, when do design engineers typically get
CITY OF LOMITA CITY COUNCIL REPORT
 CITY OF LOMITA CITY COUNCIL REPORT TO: FROM: City Council Ryan Smoot, City Manager Item No. SCH 12 PREPARED BY: Mark A. McAvoy, P.E., Public Works Director/City Engineer MEETING DATE: August 1, 2017 SUBJECT:
Designing for Pedestrian Safety in Washington, DC
 Designing for Pedestrian Safety in Washington, DC February 25, 2014 George Branyan Pedestrian Program Coordinator District Department of Transportation DC Journey to work mode split: 2012 Means of Transportation
Roadways. Roadways III.
 Introduction 97 Roadway Design Principles 98 Safe Speeds 99 Optimizing of Street Space 00 Minimum Lane Widths in the City of Boston 02 Design Features that Reduce Operating Speeds 05 Travel Lanes Transit
Classification Criteria
 SCHEDULE D TO RECOMMENDED OFFICIAL PLAN AMENDMENT NO. 40 SCHEDULE C-4 Road Criteria Criteria Traffic Service Objective Land Service/Access Typical Daily Traffic Volume Flow characteristics Travel Speed
DRAFT - CITY OF MEDFORD TRANSPORTATION SYSTEM PLAN Roadway Cross-Sections
 Roadway Cross-Sections Medford s roadway cross-section standards apply to new and reconstructed roads. The crosssections take into consideration roadway function and operational characteristics, including
Design Guidance for Bicycle Lane Widths
 Fees et al. 1 1 2 3 Design Guidance for Bicycle Lane Widths Chris A. Fees (Corresponding Author) Staff Traffic Engineer MRIGlobal 425 Volker Boulevard Kansas City, MO 64110 Phone: (816) 326-5435 E-mail:
POLICY: TRAFFIC CALMING
 2006 MAY REFERENCE: COUNCIL APPROVED BY COUNCIL MAY 23, 2006 CITY OPERATIONS - NO. 608 POLICY: TRAFFIC CALMING A. All requests for traffic calming within the City shall be considered in accordance with
Item to be Addressed Checklist Consideration YES NO N/A Required Description Complete Streets Guidelines
 Passaic County Complete Streets Checklist - Concept Development Project Name Item to be Addressed Checklist Consideration YES NO N/A Required Description Complete Streets Guidelines Existing Plans Have
PRINCE GEORGE S PLAZA METRO AREA PEDESTRIAN PLAN
 PRINCE GEORGE S PLAZA METRO AREA PEDESTRIAN PLAN May 28, 2008 Agenda Welcome and introductions Project overview and issue identification Planning context and strengths Design challenges and initial recommendations
Bicycle Boulevards and Neighborhood Greenways
 Bicycle Boulevards and Neighborhood Greenways Traffic Safety is Improving for Everyone 90 80 70 60 50 40 30 20 10 0 PORTLAND: TOTAL TRAFFIC FATALITIES 1986-2008 1986 1987 1988 1989 1990 1991 1992 1993
TRAFFIC CALMING GUIDE FOR TORONTO CITY OF TORONTO TRANSPORTATION SERVICES DIVISION
 TRAFFIC CALMING GUIDE FOR TORONTO CITY OF TORONTO TRANSPORTATION SERVICES DIVISION CITY OF TORONTO TRANSPORTATION SERVICES DIVISION 2016 TRAFFIC CALMING GUIDE FOR TORONTO TABLE OF CONTENTS Introduction
Town of Mooresville, North Carolina Neighborhood Traffic Calming and Control Device Policy
 Town of Mooresville, North Carolina Neighborhood Traffic Calming and Control Device Policy Adopted January 6, 2014 Town of Mooresville Development Services Department TOWN OF MOORESVILLE NEIGHBORHOOD TRAFFIC
Complete Streets Policy DAVID CRONIN, P.E., CITY ENGINEER
 Complete Streets Policy DAVID CRONIN, P.E., CITY ENGINEER Complete Streets City Commission adopted a Complete Streets policy in 2012 Complete Streets are road networks that are designed for all users:
SECTION 1 - TRAFFIC PLANNING
 SECTION 1 - TRAFFIC PLANNING 1.1 TRAFFIC OPERATIONS 1.1.1 Roadway Functional Classification The Multnomah County Comprehensive Framework Plan s Policy 34: Trafficways and the Functional Classification
Data Analysis February to March Identified safety needs from reported collisions and existing travel patterns.
 Welcome! Thank you for participating in today s Valencia Bikeway Improvements workshop. Data Analysis February to March Identified safety needs from reported collisions and existing travel patterns. Initial
Protected Bike Lanes in San Francisco Mike Sallaberry SFMTA NACTO Workshop - Chicago IL
 Protected Bike Lanes in San Francisco Mike Sallaberry SFMTA 10 14 2011 NACTO Workshop - Chicago IL San Francisco 2 nd Highest Density in the U.S. 47 square miles Mild Climate Market Population ~810,000
Bike Planning: A New Day
 Bike Planning: A New Day Josh Sikich, AICP, LEED AP Chicago Office Director Alta Planning + Design 312-265-0628 joshuasikich@altaplanning.com cities of all sizes are changing Illinois Bike Summit October
CITY OF SARATOGA SPRINGS PEDESTRIAN CROSSING TOOLBOX
 CITY OF SARATOGA SPRINGS PEDESTRIAN CROSSING TOOLBOX This toolbox is to be used to guide pedestrian crossing improvements within the City of Saratoga Springs. Details for each crossing type are provided.
Bicyclist Lateral Roadway Position versus Motorist Overtaking Distance
 DeSousa, Gutierrez 0 0 Bicyclist Lateral Roadway Position versus Motorist Overtaking Distance Submitted: July, 00 (Edited on May, 00 to update contact information) Word Count:, words plus figures at 0
City of Elizabeth City Neighborhood Traffic Calming Policy and Guidelines
 City of Elizabeth City Neighborhood Traffic Calming Policy and Guidelines I. Purpose: The City of Elizabeth City is committed to ensure the overall safety and livability of residential neighborhoods. One
St. Francis Drive through the City of Santa Fe Corridor Study
 VII. ENGINEERING AND ENVIRONMENTAL EVALUATION TRAIL CONNECTIVITY In the southern portion of the Corridor there is a lack of a sidewalk, trail or bicycle facility within the right-ofway. However, the City
LANCASTER CITY BICYCLE NETWORK
 LANCASTER CITY BICYCLE NETWORK Downtown Merchants Meeting Wednesday, July 19, 2017 http://www.lancasteratp. DOWNTOWN WALKABILITY ANALYSIS What changes can be made, in the least amount of time, and for
Multimodal Analysis in the 2010 Highway Capacity Manual
 Multimodal Analysis in the 2010 Highway Capacity Manual It s not just cars anymore! Jamie Parks, AICP HCAT Conference May 9-10, 2011 Multimodal LOS in the 2010 HCM History and background Overview of methods
WELCOME Public Information Centre
 WELCOME Public Information Centre Fernforest Drive Brampton Soccer Centre Community Room #2 Tuesday January 19, 2016 6:30 p.m.to 9:00 p.m. Please sign in Neighbourhood Traffic Calming Guide Background
Welcome! San Jose Avenue Open House August 25, 2015
 Welcome! San Jose Avenue Open House August 25, 2015 Vision Zero The City and County of San Francisco adopted Vision Zero San Francisco Vision Zero High Injury Network as a policy in 2014, committing an
Public Information Centre
 WELCOME Public Information Centre Father Tobin Road Lougheed Middle School - Library Wednesday November 7, 2012 7:00 p.m.to 9:00 p.m. Please sign in Neighbourhood Traffic Calming Guide Background The City
Project Goal and Description. Why Broadway? Broadway SFMTA.COM/BROADWAY. The goal of the Broadway Safety Improvement
 PROJECT OVERVIEW Project Goal and Description The goal of the Broadway Safety Improvement d St Van Ness Ave Project is to improve safety and comfort for all who Franklin St Hyde St Octavia St Gough St
Public Works Committee Meeting Richard E. Mastrangelo Council Chamber November 20, 2017
 Public Works Committee Meeting Richard E. Mastrangelo Council Chamber November 20, 2017 Purpose of Meeting Why are we here? Project Recap/Updates Project Limits/Segments Road Diet Concept Lessons Learned
MEMORANDUM. Sutter Street Bicycle Lanes, Stockton, CA SF
 MEMORANDUM Date: To: From: Subject: PURPOSE Anthony J. Lopes, Siegfried Engineering Christine Carey & Matthew Ridgway, Fehr & Peers Sutter Street Bicycle Lanes, Stockton, CA SF09-0468 The City of Stockton
G AT E WAY PLAN. Community BRIEFING KIT GATEWAY BIKE
 G AT E WAY PLAN GATEWAY BIKE Community BRIEFING KIT PLAN August 2016 TABLE OF CONTENTS INTRODUCTION... 1 THE BENEFITS OF A BIKEABLE COMMUNITY... 2 ECONOMY...2 SAFETY...3 HEALTH...3 HOUSEHOLD SPENDING...3
TRANSPORTATION ANALYSIS REPORT US Route 6 Huron, Erie County, Ohio
 TRANSPORTATION ANALYSIS REPORT US Route 6 Huron, Erie County, Ohio December 12, 2012 Prepared for: The City of Huron 417 Main Huron, OH 44839 Providing Practical Experience Technical Excellence and Client
Planning Guidance in the 2012 AASHTO Bike Guide
 Planning Guidance in the 2012 AASHTO Bike Guide Presentation by: RJ Eldridge Peter Lagerwey August 22, 2012 WEBINAR 2: PLANNING GUIDANCE IN THE 2012 AASHTO BIKE GUIDE Today s Webinar Significant Updates
CHAPTER 3. Transportation and Circulation
 CHAPTER 3 Transportation and Circulation 3.0 TRANSPORTATION AND CIRCULATION This chapter evaluates traffic circulation, transit, parking, pedestrian, bicycle, and rail operational conditions in the Project
ORANGE COUNTY PUBLIC WORKS TRAFFIC INVESTIGATIONS
 ORANGE COUNTY PUBLIC WORKS TRAFFIC INVESTIGATIONS STAFF REPORT OF: January 6, 2019 SUPERVISORIAL DISTRICT: 5 SUBJECT: LOCATION: INVESTIGATOR: O Neill Drive at Roanoke Drive; Ladera Ranch; TB 922-E6 Clever
EVALUATION OF A GREEN BIKE LANE WEAVING AREA IN ST. PETERSBURG, FLORIDA. William W. Hunter Senior Research Scientist
 EVALUATION OF A GREEN BIKE LANE WEAVING AREA IN ST. PETERSBURG, FLORIDA William W. Hunter Senior Research Scientist Raghavan Srinivasan Senior Transportation Research Engineer Carol A. Martell Senior Applications
Magnolia Place. Traffic Impact Analysis. Prepared for: City of San Mateo. Prepared by: Hexagon Transportation Consultants, Inc.
 Magnolia Place Traffic Impact Analysis Prepared for: City of San Mateo Prepared by: Hexagon Transportation Consultants, Inc. Updated January 4, 2010 Table of Contents 1. Introduction...1 2. Existing Conditions...6
MUTCD Part 6G: Type of Temporary Traffic Control Zone Activities
 MUTCD Part 6G: Type of Temporary Traffic Control Zone Activities 6G.01 Typical Applications Each temporary traffic control (TTC) zone is different. Many variables, such as location of work, highway type,
Improving Cyclist Safety at the Dundas Street West and Sterling Road Intersection
 STAFF REPORT ACTION REQUIRED Improving Cyclist Safety at the Dundas Street West and Sterling Road Intersection Date: August 17, 2012 To: From: Wards: Reference Number: Public Works and Infrastructure Committee
Welcome. If you have any questions or comments on the project, please contact:
 Welcome This drop-in public open house is intended to provide information about the Bay Street bike lanes project. This project proposes a dedicated cycling facility along Bay Street between Aberdeen Avenue
Arlington Public Schools Thomas Jefferson Site Evaluation Transportation Networks. Thomas Jefferson Working Group Meeting #6 November 10, 2014
 Arlington Public Schools Thomas Jefferson Site Evaluation Transportation Networks Thomas Jefferson Working Group Meeting #6 November 10, 2014 2 3 INTRODUCTION 4 Goal of our work: Identify and assess multi-modal
Who is Toole Design Group?
 2018 AASHTO Bike Guide Status Update NCHRP 15 60 Amalia Leighton Cody, PE, AICP & Kenneth Loen, PE Washington APWA October 4, 2018 Who is Toole Design Group? TDG is a full service engineering, planning
Truck Climbing Lane Traffic Justification Report
 ROUTE 7 (HARRY BYRD HIGHWAY) WESTBOUND FROM WEST MARKET STREET TO ROUTE 9 (CHARLES TOWN PIKE) Truck Climbing Lane Traffic Justification Report Project No. 6007-053-133, P 101 Ι UPC No. 58599 Prepared by:
INDOT Complete Streets Guideline & Policy
 INDOT Complete Streets Guideline & Policy INTRODUCTION The Complete Streets guidelines build upon multiple efforts and promote a multimodal transportation system that is integrated and sustains land use
Outreach Approach RENEW SF served as the primary liaison with the North Beach community; the Chinatown. Executive Summary
 Executive Summary Executive Summary The Columbus Avenue Neighborhood Transportation Study s objective is to identify changes to transportation infrastructure and policies that could enhance the livability
Small Town & Rural Multimodal Networks
 Small Town & Rural Multimodal Networks Fred Young, PLA Andrea Clinkscales, AICP, PMP Alta Planning + Design Funding Partners Project Team Existing Design Guidance AASHTO Flexibility Guide 2004 AASHTO Bike
Development of Arlington County s Marked Crosswalk Guidelines. Jon Lawler, P.E. Design Engineer Arlington County, VA
 Development of Arlington County s Marked Crosswalk Guidelines Jon Lawler, P.E. Design Engineer Arlington County, VA April 13, 2015 Transportation System Users Residents Estimated 215,000 in 2014 Lowest