Where to from HERE: Mapping multimodal. in Australia
|
|
|
- Horace Norris
- 5 years ago
- Views:
Transcription

1 Where to from HERE: Mapping multimodal movement in Australia

2 Executive Summary
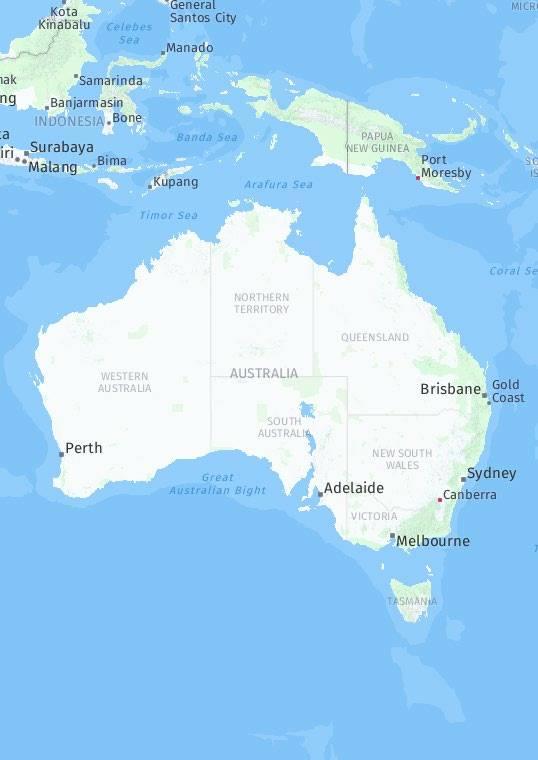
3 Feeling the squeeze of increasing traffic congestion? You re not alone. New research commissioned by HERE Technologies has uncovered Australian commuter attitudes and behaviours around transport are changing as a result of our cities clogged arteries. Some Australians are opting to use public transport more often; others are adjusting their office hours in order to spend less time on the roads; and more still are looking into alternate modes of transport. It s not just about getting to work before the boss arrives or dropping the kids at school on time. Traffic congestion impacts people s happiness, where they choose to live, how productive we are as a society and the success of our economy. But our roads are already reaching capacity with the weight of population growth and the increasing footprint of Australia s major cities. Despite the public and private sector s best efforts to compensate by increasing the capacity of road networks, provide greater availability of transport options and renewed investment in public transport and cycling infrastructure, it s clear that a future of four wheels per person is completely unsustainable. In fact, according to the latest Census data, Australian s have on average 1.8 cars per household that s more than one car per person in the average Australian home and the number of vehicles on the road is ever increasing. 2 Without adequate action, traffic congestion could cost Australia more than $50bn by At HERE, we ve monitored the intrinsically linked increase in traffic congestion and adoption of multi-modal transport in Australian cities over recent years not only through commuter research, but our bank of historic location data. As the leading provider of location technology to cities, transport authorities and on-demand service providers, we know that by pooling location data, governments, industries and businesses can create the infrastructure needed to support the evolution of our transportation systems and future city planning. Without this data at hand, we can t truly understand the issues at play, and consequently implement holistic solutions to ease the proverbial jam. Furthermore, giving commuters access to this real-time data empowers them to make more informed transport choices. This latest research project surveyed 1,260 Australians (aged 18+) hailing from a radius of max 50km from Australia s five largest city centres (Melbourne, Sydney, Brisbane, Perth and Adelaide) to gather insights on: how congestion impacted commuter transport choices; the changes commuters are willing to make to relieve congestion; and what s holding them back from changing their habits. Additional analysis was conducted using HERE s historical traffic data and real-time route planning technology. The results showed that among a myriad of hindrances, the majority of Australians are open to change to varying extents and with a variety of hesitations in mind. To help understand and guide authoritative perspectives on the road forward, this paper explores the world of the Australian commuter, how they currently get around, and how the future is shaping up. Mark Whitmore, Head of APAC at HERE Technologies
4 Getting around: A snapshot of the Australian commute Car Public transport Cycle Walk 70% 24.6% 1.2% 4.2% 70% of Australian commuters travel by car Using public transport is most popular among millennials (63.2% of year olds)

5 According to the most recent Australian census data, the last five years have introduced almost half a million cars to our nation s roads. The increased traffic congestion caused by these vehicles has resulted in a shift in commuter attitudes towards their mode of travel. HERE s research explored the current composition of the commuting population, their preferences and how it s all changing:
6 Driven to alternatives: how the commute is changing 63.2% are changing their travel habits to avoid traffic 28.5% Catch public transport more often 28.5% now take public transport more often double the number of year old Australians (42%) haven changed to using public transport compared to year olds (21.1%) Almost a fifth (18.1%) leave for work earlier to compensate for longer travel times 14% of Australians have ditched the car in favour of walking or cycling Take UBERs or taxis more often Cycle full/part journey more often Walk full/part journey more often Start work earlier/leave later to avoid peak times Leave for work earlier because commute takes longer Drive less direct routes to avoid traffic bottlenecks 9.2% 4.2% 9.8% 14.6% 18.1% 16.4% 36.8% of Australian haven t changed their commuting habits in recent years. Select driving routes based on live traffic updates (map app or navigation device) Choose mode of transport based on live traffic / public transport updates 10.1% 5.4%
7 Cycling is the least popular commuter method. Only one in ten Australians would be willing to cycle to work. Cycling is the least popular current commuter method, and only one in ten Australians would be willing to change to cycling to work. This attitude has worsened in recent years, with cycling down from 1.2% in 2011 to 1.1% today in the most recent census data. A quarter of Adelaide residents, as well as over a third of Sydney-siders and Melbournians, are starting to catch public transport more often. A quarter of Adelaide residents, as well as over a third of Sydney-siders and Melbournians, are starting to catch public transport more often, with Sydney s public transport the most popular network in the country for commuters. One in every five Perth and Brisbane workers is changing their working hours. Perth and Brisbane workers are changing their working hours, with one in every five people starting work earlier or leaving their house later in a bid to avoid battling peak congestion.
8
9 What s going to change? 71.8% of Australians are willing to change their commuting habits to help relieve congestion. Driving is the fastest and most convenient option for me 35% 55.8% are willing to ditch the car to relieve congestion. I think public transport is too unreliable and too expensive Almost a third (30.7%) are willing to opt for public transport. 35.3% Only 5.3% are willing to pay city tolls or higher city parking fees (to compensate for driving a car in city areas). I don't feel safe riding or there are not enough dedicated cycling lanes on my route 28.2% aren t willing to change their travel habits. 8.3%
10
11 Multi-modal travel time analysis In addition to the consumer research detailed in this paper, analysis of HERE s historic traffic data and routing technology also helped to explain where, within Australia s biggest cities, it's quicker to travel by one or a combination of other modes of transport (rather than driving). What we found was surprisingly consistent: while driving is still often the fastest route into the CBD, a combination of cycling and public transport often proved fastest in various instances across each city. Cycling to a station or stop before switching over to public transport would more than likely beat your fellow cars into the CBD in many places. Taking into consideration productivity of journeys on public transport vs cars, parking, fuel and tolls vs public transport ticket costs coupled with environmental footprints, it s hoped this analysis will help commuters think differently about their transport options.
12
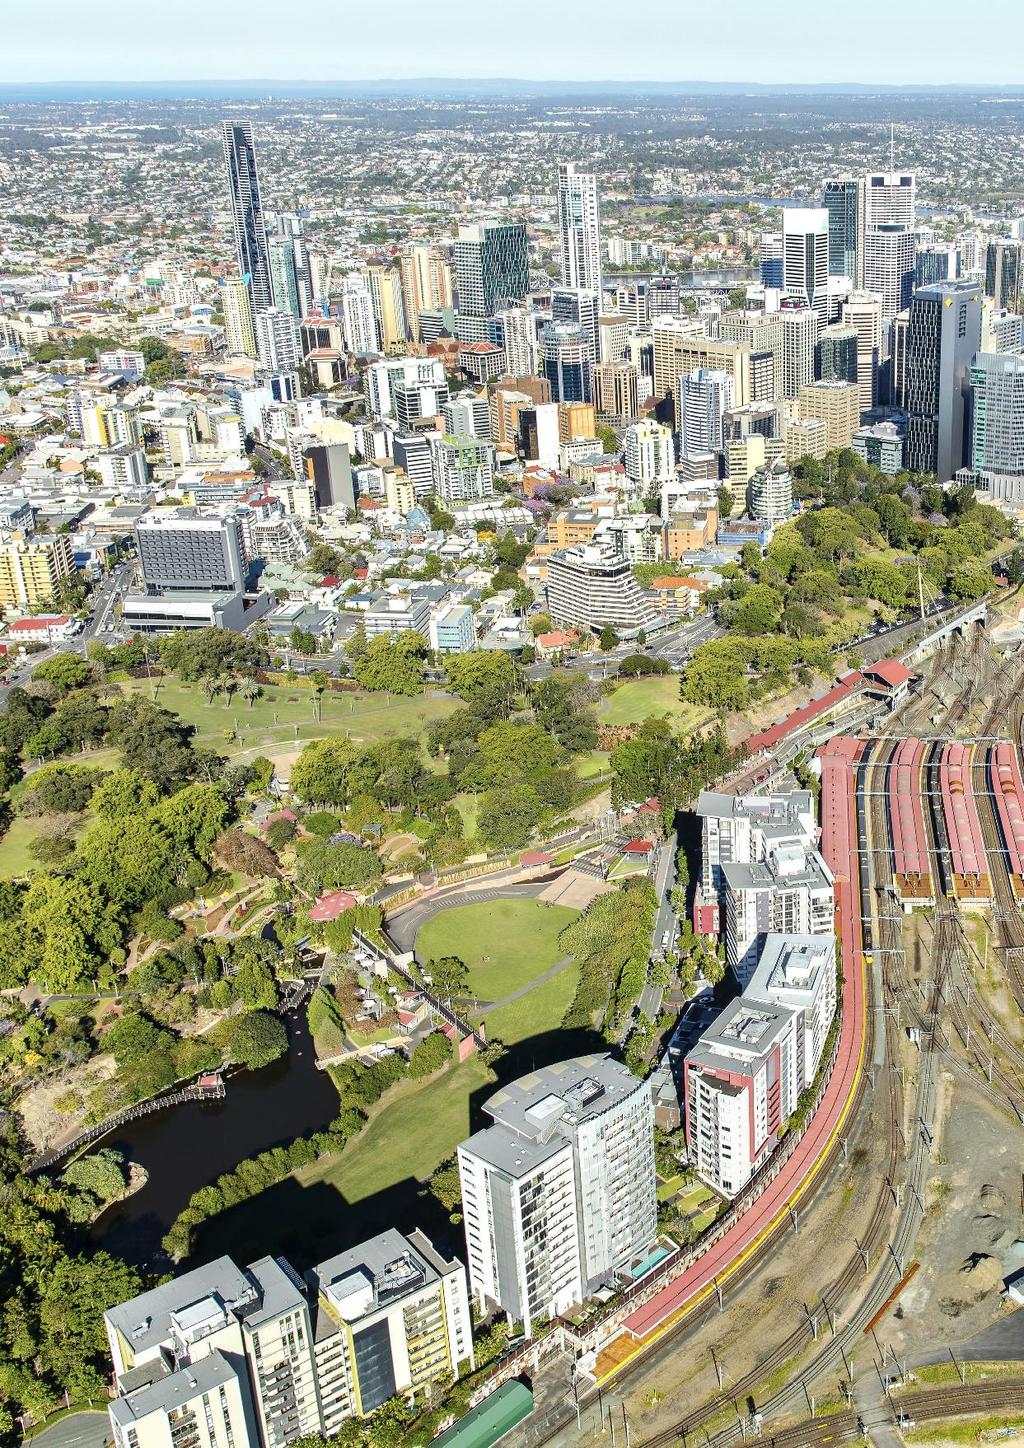
13 City by city: how commuters fair While general commuting trends from across the country are invaluable, it is often the state-specific findings that have the greatest impact. By looking in detail at each major city, public and private sector decision makers can make evidence-based infrastructure policy and planning decisions, and national stakeholders can look to the successes and hindrances in each state for inspiration, perspective and warning. Here, we detail the individual commuting habits of some of Australia s largest cities:
14 Sydney Australia s most popular public transport system. 44% 19.5% 7.9% 44% of those willing to change would consider public transport over driving 19.5% have started changing routes to avoid traffic 7.9% walk to work (the country s highest) % year olds most likely to choose mode of transport based on live traffic and public transport information updates (10%/6%) 5.1% have recently started cycling (all or part of their journey) Millennials the most common users of public transport in Sydney (47.7% of year olds currently use this method and 37.3% would commit to doing so more) Car Public transport Cycle Walk
 of those who don t use public transport would consider it more often to relieve future congestion. Currently, 7.9% of Sydney s commuters walk to work and 5.")
15 The city s public transport system is the most popular network in Australia with 33.2% of commuters opting for this mode over driving. In fact, almost half (44%) of those who don t use public transport would consider it more often to relieve future congestion. Currently, 7.9% of Sydney s commuters walk to work and 5.1% have started cycling more often (the highest in the country). Fastest commute into the city: The analysis of HERE s historic traffic data and routing technology also shows where, within Sydney, it s quicker to travel by one or a combination of other modes of transport, rather than driving: CREMORNE ASHFIELD NEWTOWN 21 mins 30 mins 22 mins 15 mins 32 mins 20 mins 58 mins 118 mins 67 mins LIVERPOOL BALGOWLAH GRANVILLE 64 mins 47 mins 48 mins 63 mins 30 mins 51 mins If you re in Ashfield or Granville, a combination of bike and public transport is your fastest option into the city
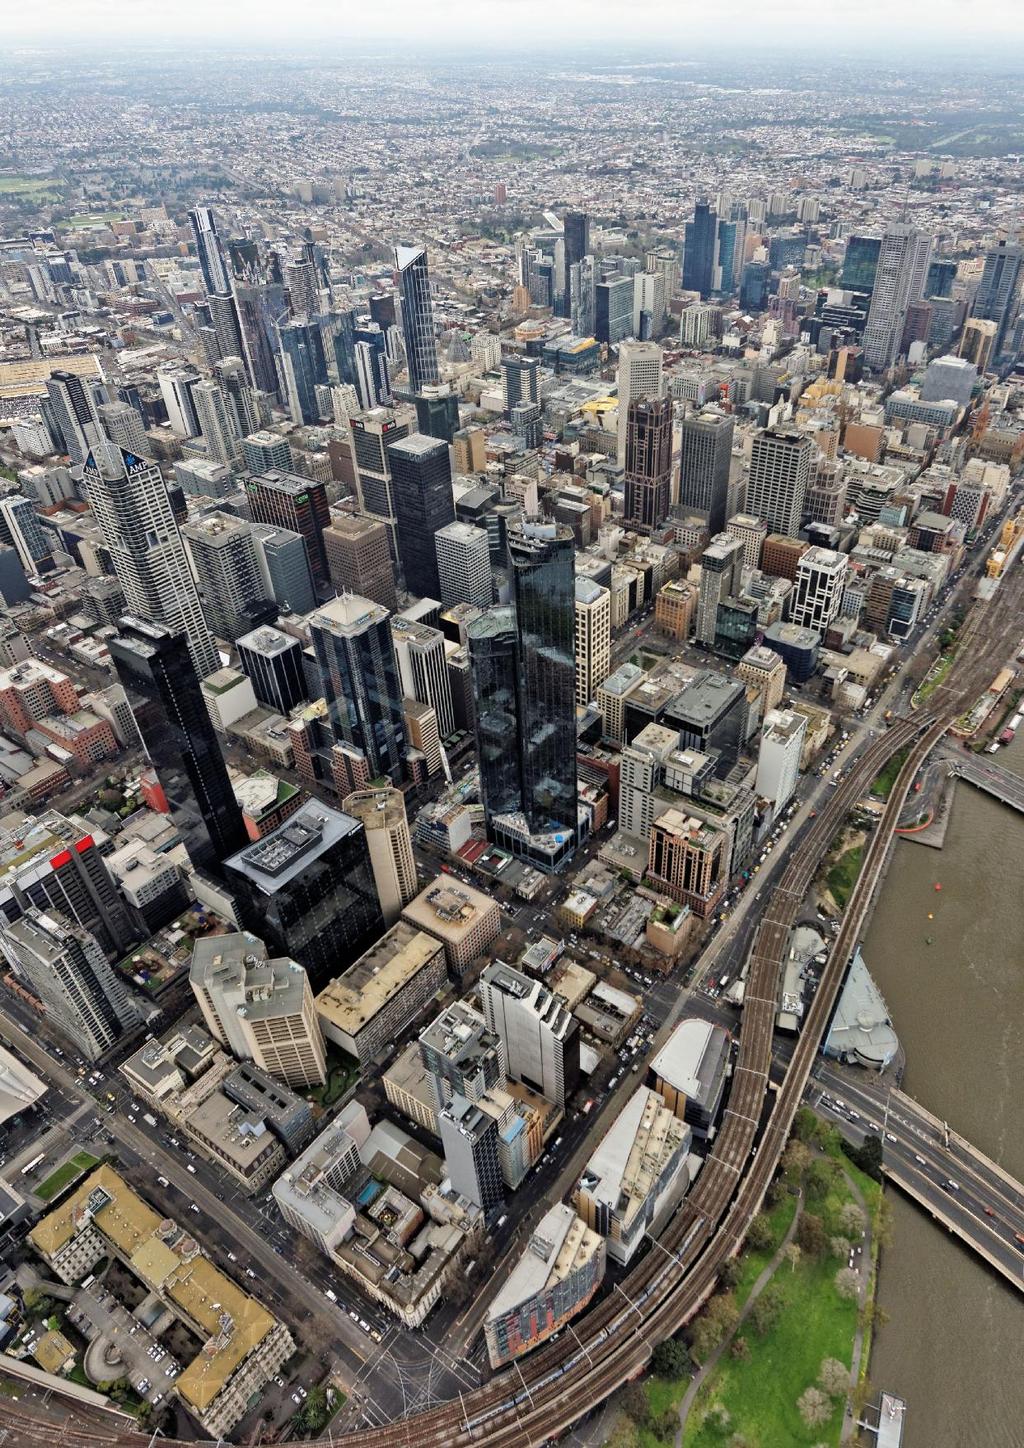
16 Melbourne Half of Melbournians are considering ditching the car. 10.6% 9.4% 0.8% have starting using Uber and taxis more often Almost one in ten drive because of unpredictable weather Only 0.8% cycle to work Millennials the most common users of public transport in Melbourne (68.1% currently travel by this method and 84.7% would commit to doing so more) year olds most likely to choose mode of transport based on live traffic and public transport information updates (10.9%) Millennials the most common users of public transport in Melbourne (34% of year olds currently use this method and 42.4% would commit to doing so more) Car Public transport Cycle Walk
. In addition, 9.")
17 While less than 1% currently cycle to work, half of Melbournian commuters are considering ditching the car in favour of public transport for their daily commute. But 18.9% also avoid public transport because it is too busy, with over a fifth already opting for Uber or taxi services (the highest in the country). In addition, 9.4% cite the city s unpredictable weather as their greatest hindrance to using alternate modes of transport. Fastest commute into the city: The analysis of HERE s historic traffic data and routing technology also shows where, within Melbourne, it s quicker to travel by one or a combination of other modes of transport, rather than driving: RICHMOND ELWOOD FOOTSCRAY 10 mins 22 mins 20 mins 8 mins 23 mins 17 mins 34 mins 86 mins 82 mins BERWICK SKYE PAKENHAM 73 mins 95 mins 70 mins 63 mins 74 mins 73 mins If you re in Elwood or Pakenham, a combination of bike and public transport is your fastest option into the city.
18 Perth Driverless vehicles most popular among Perth residents. 1.6% <1% 17.5% Only 1.6% walk to work (the country s lowest) Less than 1% cycle (tied with Melbourne for lowest in Aus) 17.5% have started avoiding peak hour by starting work earlier or leaving later % Perth residents are the country s most dissatisfied with cycling infrastructure (10.4%) year olds are the most common users of public transport in Perth (34.3% currently and 37.1% would commit to doing so more) and are most likely to choose mode of transport based on live traffic and public transport information updates (8.6%) Of those willing to make a change, 19.7% would travel in driverless vehicles Car Public transport Cycle Walk

19 While they re clearly not keen on walking (1.6%), Perth commuters are the country s most enthusiastic about travelling in driverless vehicles in order to reduce traffic congestion. They re also opting to drive at less congested times instead of cycling, with only 1% riding to work mostly thanks to their dissatisfaction with the safety and availability of cycle routes in the city. Fastest commute into the city: The analysis of HERE s historic traffic data and routing technology also shows where, within Perth, it s quicker to travel by one or a combination of other modes of transport, rather than driving: NORTH PERTH CLAREMONT MANNING 23 mins 23 mins 13 mins 10 mins 17 mins 14 mins 34 mins 86 mins 82 mins WOODBRIDGE ARMADALE SORRENTO 32 mins 50 mins 115 mins 32 mins 55 mins 36 mins If you re in Manning or Armadale, a combination of bike and public transport is your fastest option into the city
20 Brisbane Almost a quarter want flexible work hours to avoid traffic. 12.7% 6.8% 30.6% 12.7% rely on live traffic updates to choose their travel mode and route (the country s highest) 6.8% are willing to pay city driving/parking tolls 30.6% are committed to catching public transport more often 23% % 23% think public transport is too expensive year olds are the most common users of public transport in Brisbane (33.3% currently and 51.1% would commit to doing so more) 13.3% of year olds choose mode of transport based on live traffic and public transport information updates Car Public transport Cycle Walk

21 23.9% of Brisbane commuters want to work more flexible hours to avoid peak traffic times, and almost a third are willing to use public transport more often, while 18.3% have already started relying on live traffic updates to choose the least congested routes and transport modes. And while the rest of the country seems unwilling to fork out any extra cash, Brisbane and Melbourne residents were most willing to pay higher tolls and parking rates to compensate for driving in the city. But Brisbane commuters are also the most vocal about public transport prices, with almost a quarter citing that they re too expensive. Fastest commute into the city: The analysis of HERE s historic traffic data and routing technology also shows where, within Brisbane, it s quicker to travel by one or a combination of other modes of transport, rather than driving: WINDSOR BOWEN HILLS MILTON 15 mins 12 mins 10 mins 13 mins 8 mins 13 mins 51 mins 33 mins 27 mins LOGAN IPSWICH CABOOLTURE 54 mins 64mins 57 mins 40 mins 55 mins 70 mins If you re in Milton or Caboolture, a combination of bike and public transport is your fastest option into the city
22 Adelaide Adelaide is open to multi-modal solutions. 78.8% 46.8% Adelaide has the most drivers Australia s least popular public transport network 46.8% haven t made any changes to their commuting habits in recent years 13.2% % 13.2% admit that they drive because they re a bit lazy Adelaide the only city where year olds are the most common users of public transport (33.3%) and year olds most willing to use it more Adelaide residents least likely to choose their mode of transport based on live traffic and public transport information updates (7.2%) Car Public transport Cycle Walk
, one in five (18%) would consider driving to a nearby transport hub and then catching public transport from there.")
23 Despite the fact that Adelaide is home to the country s least popular public transport network and the highest percentage of drivers in the country (78.8%), one in five (18%) would consider driving to a nearby transport hub and then catching public transport from there. But almost half haven t made any changes to their habits in recent years, and more than a tenth (13.2%) admit that their driving habit stems from laziness. Fastest commute into the city: The analysis of HERE s historic traffic data and routing technology also shows where, within Adelaide, it s quicker to travel by one or a combination of other modes of transport, rather than driving: DUDLEY PARK EDINBURGH NORTH ASCOT PARK 14 mins 34 mins 22 mins 16 mins 45 mins 23 mins --- mins --- mins --- mins SEACLIFF BRIDGEWATER 26 mins 55 mins 35 mins 32 mins If you re in Dudley Park or Edinburgh North, a combination of bike and public transport is your fastest option into the city.
24 The road forward: key recommendations for traffic-free smart cities As a nation of car lovers, Australians aren t likely about to switch to alternate transport modes overnight. But with Australia s population set to increase by a million people every two to three years - many of whom will add new cars to an already straining road network something has to be done to unclog our cities in the interim decade before the expected mobility revolution of autonomous vehicles arrives. Luckily, there is much room for improvement on the road to reduced congestion particularly for those who rely on their cars to do their jobs. Applying innovative approaches to multi-modal transport can have a significantly positive impact on the traffic commuters face on a daily basis. But building smarter cities is no mean feat - it requires coordination between hundreds of disparate systems and testing in real-world environments. Governments and industry leaders need to work together, and by using location technology and analysing historical traffic data they can make more informed decisions on urban planning and infrastructure projects. Exploring and understanding the fears, preferences and needs of commuters provides an unrivalled foundation for decision making. Knowing that public transport prices, or lack of availability of safe cycle routes, are all that is holding a commuter back from leaving the car in the driveway is invaluable for decision makers.
25 Making better choices It is not just governments and industry that can benefit from using location technologies. In order to realise a sustainable future for Australia s road networks and burgeoning population of commuters, it is recommended that citizens are continually engaged with clear, timely and relevant information about what transport option is the fastest, cheapest and most convenient for them. This enables commuters to accurately choose whether to cycle, catch public transport or use a combination of transport modes based on real-time traffic information and any relevant disruptions to public transport systems or road network. It can also detect the speeds and traffic conditions on Australian roads, right down to helping commuters anticipate which lane of traffic to drive in to avoid the Monday morning bottleneck. In fact, with today s innovative location technologies at hand, there is no reason why an Australian commuter can t wake up to a notification on their smartphone telling them that today, thanks to a disturbance on their public transport route, an Uber or bicycle would be most efficient in getting them to their first meeting on time. Drivers can then make truly informed decisions about the changes they are willing to implement, while authorities evolve the commuting landscape from the data up. Better alternate infrastructure, affordable public transport and the availability of smart city technologies for commuters and decision makers alike are all key stepping stones on the road forward.
26 About HERE Technologies HERE, the Open Location Platform company, enables people, enterprises and cities to harness the power of location. By making sense of the world through the lens of location we empower our customers to achieve better outcomes from helping a city manage its infrastructure or an enterprise optimize its assets to guiding drivers to their destination safely. To learn more about HERE, including our new generation of cloud-based location platform services, visit and Methodology This survey was conducted via Pure Profile in October 2017 using an online survey method. It was completed by 1260 Australians aged 18 and over.
Bristol City Council has produced a draft Bristol Transport Strategy document.
 Bristol Transport Strategy Summary Document Introduction Bristol City Council has produced a draft Bristol Transport Strategy document. The Strategy fills a gap in transport policy for Bristol. We have
ENGAGING ENTREPRENEURS TO PROVIDE INTEGRATED MOBILITY SOLUTION AMIT BHATT, DIRECTOR- INTEGRATED TRANSPORT, WRI INDIA
 ENGAGING ENTREPRENEURS TO PROVIDE INTEGRATED MOBILITY SOLUTION AMIT BHATT, DIRECTOR- INTEGRATED TRANSPORT, WRI INDIA WHAT IS MULTI-MODAL INTEGRATION? BRINGING IT ALL TOGETHER EXAMPLES FROM GLOBAL CITIES
2. Context. Existing framework. The context. The challenge. Transport Strategy
 Transport Strategy Providing quality connections Contents 1. Introduction 2. Context 3. Long-term direction 4. Three-year priorities 5. Strategy tree Wellington City Council July 2006 1. Introduction Wellington
FACTS AND FIGURES: MAKING THE CASE FOR COMPLETE STREETS IN LEE COUNTY
 FACTS AND FIGURES: MAKING THE CASE FOR COMPLETE STREETS IN LEE COUNTY Safety: Close to 5,000 pedestrians and bicyclists die each year on U.S. roads, and more than 70,000 are injured. [Mean Streets, Surface
Travel Patterns and Cycling opportunites
 Travel Patterns and Cycling opportunites The Household Travel Survey is the largest and most comprehensive source of information on the travel patterns of residents of the Sydney Greater Metropolitan Area
Investment in Active Transport Survey
 Investment in Active Transport Survey KEY FINDINGS 3 METHODOLOGY 7 CYCLING INFRASTRUCTURE 8 Riding a bike 9 Reasons for riding a bike 9 Mainly ride on 10 Comfortable riding on 10 Rating of cycling infrastructure
Exceeding expectations: The growth of walking in Vancouver and creating a more walkable city in the future through EcoDensity
 Exceeding expectations: The growth of walking in Vancouver and creating a more walkable city in the future through EcoDensity Melina Scholefield, P. Eng. Manager, Sustainability Group, City of Vancouver
WELCOME. City of Greater Sudbury. Transportation Demand Management Plan
 WELCOME City of Greater Sudbury Transportation Demand Management Plan Public Consultation Session St. Andrew s Place, Activity Hall 111 Larch Street Wednesday September 13, 2017 6:00 to 8:00 pm Welcome
BUILDING THE CASE FOR TRAVEL OPTIONS IN WASHING TON COUNTY. Image: Steve Morgan. Image: Steve Morgan
 BUILDING THE CASE FOR TRAVEL OPTIONS IN WASHING TON COUNTY Image: Steve Morgan Image: Steve Morgan Image: TriMet Image: TriMet WHAT ARE TRAVEL OPTIONS PROGRAMS? Travel options programs encourage residents,
Congestion Management in Singapore. Assoc Prof Anthony TH CHIN Department of Economics National University of Singapore
 Congestion Management in Singapore Assoc Prof Anthony TH CHIN Department of Economics National University of Singapore anthonychin@nus.edu.sg Introduction 2 Introduction and What is Traffic Congestion?
ABERDEEN: CITY OF THE FUTURE
 ABERDEEN: CITY OF THE FUTURE A contribution towards discussions on a future transport strategy for Aberdeen and its Region Prepared by the Centre for Transport Research University of Aberdeen June 2010
Developing a Birmingham Transport Space Allocation policy. David Harris Transport Policy Manager Economy Directorate Birmingham City Council
 Developing a Birmingham Transport Space Allocation policy David Harris Transport Policy Manager Economy Directorate Birmingham City Council Birmingham s Sustainable Urban Mobility Plan Birmingham Connected
Clouds, Crowds, and Traffic: What 10 Emerging Megatrends Mean for the Future of Transportation
 Portland State University PDXScholar TREC Friday Seminar Series Transportation Research and Education Center (TREC) 11-1-2013 Clouds, Crowds, and Traffic: What 10 Emerging Megatrends Mean for the Future
Final Plan 20 December 2016
 Final Plan 20 December 2016 Introduction Aims of the Travel Plan How do we travel? Understanding travel behaviours? The University Master Plan and its implications Galway City sustainable transport policies
SUSTAINABLE TRAVEL TOWNS: RESULTS AND LESSONS
 SUSTAINABLE TRAVEL TOWNS: RESULTS AND LESSONS Joe Finlay Sustainable Travel Team Department for Transport (UK) Introduction I will: Give brief background on the Sustainable Travel Towns and the projects
What s the issue for transport in Cardiff?
 Demand for travel The number of commuters travelling to work in Cardiff has increased from 190,000 in 2001 to 198,000 in 2010, with some 124,000 Cardiff residents travelling across the city daily to their
Stepping up a gear. Our vision for cycling in Cardiff
 Stepping up a gear Our vision for cycling in Cardiff Cardiff is growing fast in fact, over the last 10 years its population has grown quicker than any UK city outside London and this rate of expansion
Transportation Assessment
 Transportation Assessment Midtown Open House February 10, 2018 Overview Midtown in Focus Overview & Purpose of Today Transportation Assessment overview Summary of Transportation work to date Review & Analysis
Typical Rush Hour Commute. PennyforTransportation.com
 Typical Rush Hour Commute In the News Overview of the Plan Collaborative plan with projects in every community Prioritizing connectivity and congestion relief Dedicated transportation-specific funding;
Travel Plan Monitoring Report. Buttercross Park, Whittlesey - Residential
 Travel Plan Monitoring Report Buttercross Park, Whittlesey - Residential Prepared by: Developer Eyes Property and Estate Management Limited Headlands, Kettering, Northants NN15 6XA Company Registration
Thank you for this opportunity to discuss with you how we can work together to make our streets more complete.
 Thank you for this opportunity to discuss with you how we can work together to make our streets more complete. 1 2 3 Thank you for this opportunity to discuss with you how we can work together to make
ENFIELD TOWN THE REVISED DESIGN
 TOWN THE REVISED DESIGN We re turning Enfield into a borough that encourages walking and cycling, a place that s easy for all of us to get around however we choose to travel. A greener place, with safer
The Amsterdam Story. The socio-economic value of cycling and innovative planning practices in context in transition. Kees van Ommeren.
 The Amsterdam Story The socio-economic value of cycling and innovative planning practices in context in transition Kees van Ommeren Paolo Ruffino Questions answered in this presentation What are the economic
TomTom South African Congestion Index
 TomTom South African Congestion Index Disclaimer All copyrights, commercial rights, design rights, trademarks and other elements considered intellectual property that are published in this report are reserved
Australia Major Capital Cities Central Business Districts & Work Trip Market Share 2006
 Australia Major Capital Cities Central Business Districts & Work Trip Market Share 2006 Brisbane Table 1 Area Summary SYD MEL BRS ADL PER Average Motorized 68.8% 76.8% 76.7% 81.8% 81.7% 77.2% Non-Motorized
City of Novi Non-Motorized Master Plan 2011 Executive Summary
 City of Novi Non-Motorized Master Plan 2011 Executive Summary Prepared by: February 28, 2011 Why Plan? Encouraging healthy, active lifestyles through pathway and sidewalk connectivity has been a focus
VILNIUS SUMP. Gintarė Krušinskaitė International project manager place your logo here
 VILNIUS SUMP Gintarė Krušinskaitė International project manager Gintare.krusinskaite@vilniustransport.lt place your logo here 19 April, 2017 WHERE DID WE CAME FROM? Mobility management and mobility planning
June 2015 REGIONAL TRANSPORTATION SNAPSHOT
 June 2015 REGIONAL TRANSPORTATION SNAPSHOT THE REGION Who are we? The Greater Toronto and Hamilton Area (GTHA), consisting of Durham Region, Halton Region, the City of Hamilton, Peel Region, the City of
Appendix A-K Public Information Centre 2 Materials
 Appendix A-K Public Information Centre 2 Materials Our Rapid Transit Initiative Make an impact on the future of transit Join the discussion on Rapid Transit in London You re invited to a Public Information
 Time of Change We Are Growing We Are An Attractive Place To Live We Are Age Diverse + Living Longer 50000 40000 30000 20000 10000 0 2010 Census Job Density Housing Sheds Transit Sheds The Project FUNDING
Local Sustainable Transport Fund
 I II III Sustainable travel in Greater Manchester: The journey to a low carbon economy Greater Manchester has a vision of sustainable commuting at the heart of its blueprint for a low carbon economy, as
City of Perth Cycle Plan 2029
 Bicycling Western Australia s response City of Perth Cycle Plan 2029 2012-2021 More People Cycling More Often ABOUT BICYCLING WESTERN AUSTRALIA Bicycling Western Australia is a community based, not-for-profit
SAN FRANCISCO WOMEN AND BIKING A CASE STUDY ON THE USE OF SAN FRANCISCO BIKE LANES SYNTHESIS
 SAN FRANCISCO WOMEN AND BIKING A CASE STUDY ON THE USE OF SAN FRANCISCO BIKE LANES SYNTHESIS WOMEN AND BIKING: A CASE STUDY ON THE USE OF SAN FRANCISCO BIKE LANES 2 TAKEAWAY KEY Increasing biking is a
University of Leeds Travel Plan
 University of Leeds Travel Plan 2015-2018 Contents 1: Introduction 1.1 What is a Travel Plan? 1.2 Why do we need one? 1.3 Sustainability Strategy 2: Overview 2.1 The bigger picture 2.2 The City scale 2.3
MTP BICYCLE ELEMENT UPDATE. November 2017
 MTP BICYCLE ELEMENT UPDATE November 2017 TIME FOR AN UPDATE Bicycle Element adopted in July 2008 Almost 10 years old Many planned facilities have been implemented 10 years more experience in planning,
Transportation Master Plan Advisory Task Force
 Transportation Master Plan Advisory Task Force Network Alternatives & Phasing Strategy February 2016 BACKGROUND Table of Contents BACKGROUND Purpose & Introduction 2 Linking the TMP to Key Council Approved
Update June 2018 OUR 2017 PUBLIC ENGAGEMENT
 Update June 2018 Hi, Let s Get Wellington Moving (LGWM) is developing a Recommended Programme of Investment (RPI) that meets our programme objectives and supports the city s and region s growth. As part
Towards a Sustainable Transport Network in the West Region. Padraic O Donoghue
 Towards a Sustainable Transport Network in the West Region Padraic O Donoghue Professor of Civil Engineer NUI Galway Engineers Ireland West Region March 3, 2015 Outline One Planet Living Engineering the
Exhibit 1 PLANNING COMMISSION AGENDA ITEM
 Exhibit 1 PLANNING COMMISSION AGENDA ITEM Project Name: Grand Junction Circulation Plan Grand Junction Complete Streets Policy Applicant: City of Grand Junction Representative: David Thornton Address:
Public Consultation Centre
 Region of Waterloo Transportation Master Plan Update Public Consultation Centre See the Information Package on how to contact the Project Team and complete the Comment Sheet www.regionofwaterloo.ca/en/exploring-the-region/transportation-master-plan.aspx
WELCOME Region of Waterloo Transportation Master Plan Update Public Consultation Centre
 WELCOME Region of Waterloo Transportation Master Plan Update Public Consultation Centre 1. What is the purpose of this event? To introduce Moving Forward and collect public input on: The Region s future
Cycling Master Plan Community Engagement Session WELCOME
 Cycling Master Plan Community Engagement Session WELCOME WHY COMMUNITIES PLAN Considering Short Term and Long Term Needs City of Lethbridge is committed to planning - to determine short term goals along
Briefing Paper #1. An Overview of Regional Demand and Mode Share
 2011 Metro Vancouver Regional Trip Diary Survey Briefing Paper #1 An Overview of Regional Demand and Mode Share Introduction The 2011 Metro Vancouver Regional Trip Diary Survey is the latest survey conducted
BICYCLE NETWORK CRASH REPORT
 BICYCLE NETWORK CRASH REPORT 2012-2016 Prepared July 2017 1. Executive Summary With more than 50,000 members, Bicycle Network is Australia s largest bike riding organisation. Through our advocacy, membership,
How to keep cities moving: Ideas for America s urban leaders
 JULY 2016 I n f r a s t r u c t u r e Getty Image How to keep cities moving: Ideas for America s urban leaders Shannon Bouton, Stefan M. Knupfer, and Steven Swartz There are signs that America s city dwellers
Moving Cambridge. City of Cambridge Transportation Master Plan Public Consultation Centre. March 7, :00 8:00 PM.
 City of Cambridge Transportation Master Plan Public Consultation Centre March 7, 2018 5:00 8:00 PM Region of Waterloo City of Cambridge Transportation Master Plan Public Consultation Centre March 7, 2018
Kevin Manaugh Department of Geography McGill School of Environment
 Kevin Manaugh Department of Geography McGill School of Environment Outline Why do people use active modes? Physical (Built environment) Factors Psychological Factors Empirical Work Neighbourhood Walkability
Promoting Active Travel to School: Progress and Potential
 Promoting Active Travel to School: Progress and Potential Foreword Public Health responsibilities will transfer from the NHS to local authorities over the next four years. As a result, local authorities
Our Cycle Promise. northernrailway.co.uk. Produced in partnership with Sustrans. July 2017
 Our Cycle Promise Produced in partnership with Sustrans July 2017 northernrailway.co.uk Contents Welcome 3 Working with others 4 Making your journey easier 5 to and from your local station 5 at the station
Sustainable Transport Blueprint for Canterbury. Lynn Sloman
 Sustainable Transport Blueprint for Canterbury Lynn Sloman 01654 781358 lynn@transportforqualityoflife.com www.transportforqualityoflife.com Travel to work by walk, bus, bike, carshare, train: 34% of
TOWARDS A BIKE-FRIENDLY CANADA A National Cycling Strategy Overview
 TOWARDS A BIKE-FRIENDLY CANADA A National Cycling Strategy Overview NationalCyclingStrategFrameworkv3.indd 1 Potential for this modal shift can be found in municipalities of all sizes, in every population
phoenix regional bike share program sponsorship
 phoenix regional bike share program sponsorship High visibility opportunities to promote a healthy lifestyle and sustainable transportation in the Phoenix area what is bike share? Bike share programs are
smartertravel >>> The New Policy Framework for Transport in Ireland Aoife O Grady
 The New Policy Framework for Transport in Ireland Aoife O Grady National Sustainable Transport Office Why Smarter Travel? The new national policy Smarter Travel Areas What does this mean for What does
TRANSPORTATION TOMORROW SURVEY
 Clause No. 15 in Report No. 7 of was adopted, without amendment, by the Council of The Regional Municipality of York at its meeting held on April 17, 2014. 15 2011 TRANSPORTATION TOMORROW SURVEY recommends
Travel Plan Monitoring Report. Bourton View, Wellingborough - Residential
 Travel Plan Monitoring Report Bourton View, Wellingborough - Residential Prepared by: Developer Eyes Property and Estate Management, Broughton Grange Business Centre, Headlands, Kettering, Northants, NN15
Active Travel Towns Funding Scheme Project Proposal. Sligo. Sligo Local Authorities
 Active Travel Towns Funding Scheme 2014-2016 Project Proposal for Sligo by Sligo Local Authorities Introduction Over the last two years, Sligo Local Authorities have implemented years 1 & 2 of their 5
Baseline Survey of New Zealanders' Attitudes and Behaviours towards Cycling in Urban Settings
 Baseline Survey of New Zealanders' Attitudes and Behaviours towards Cycling in Urban Settings Highlights 67% of urban New Zealanders, 18 years of age or more own or have access to a bicycle that is in
CASE STUDY City of Monrovia: Leveraging emerging ridesharing services to expand mobility options
 Advancing Mobility Management CASE STUDY City of Monrovia: Leveraging emerging ridesharing services to expand mobility options Agency: Location: Service Area: Modes: Community Context: Key Contacts: City
Policy factsheet 2 MOBILITY MANAGEMENT MEASURES FOR SCHOOLS.
 Information for schools boards, officials, regional and national mobility and educational associations Policy factsheet 2 MOBILITY MANAGEMENT MEASURES FOR SCHOOLS The Traffic Snake Game (TSG) is a campaign
The seamless journey The seamless journey: Public transport links with walking and cycling
 The seamless journey The seamless journey: Public transport links with walking and cycling The PEP Workshop Kyiv, Ukraine June 8-9, 2011 Susanne Stölting UITP - A global membership UITP is... The network
University of Victoria Campus Cycling Plan Terms of Reference. 1.0 Project Description
 University of Victoria Campus Cycling Plan Terms of Reference 1.0 Project Description The Campus Cycling Plan, a first for the University, will provide a comprehensive and coordinated approach to support
Gerald Ollivier Lead Transport Specialist World Bank, New Delhi. Transforming Cities through Integrated Planning Corridor Scale
 Gerald Ollivier Lead Transport Specialist World Bank, New Delhi Transforming Cities through Integrated Planning Corridor Scale JOB ACCESSIBILITY: ZHENGZHOU A: LINE 1, 2, AND 3 AND WALKING: 12% B. SCENARIO
INSIGHTS ON HOW BIKESHARING SUPPORTS URBAN DEVELOPMENT
 INSIGHTS ON HOW BIKESHARING SUPPORTS URBAN DEVELOPMENT INTRODUCTION Recent advances in mobile technology and big data analysis have enabled new opportunities to rethink how people live in and move through
Mobility and Congestion
 Technical Memorandum Mobility and Congestion Prepared for: Prepared by: September 25, 2013 1 Table of Contents 1. Introduction... 1 2. Congestion Forecasting Process... 1 2.1 Mobility and Congestion Terms...
Reflections on our learning: active travel, transport and inequalities
 Reflections on our learning: active travel, transport and inequalities Jill Muirie Glasgow Centre for Population Health Active travel definition Active travel refers to walking, cycling or using some other
NC Demographic Trends Through 2035
 NC Demographic Trends Through 2035 House Select Committee on Strategic Transportation Planning and Long Term Funding Solutions February 22, 2016 Rebecca Tippett, University of North Carolina July 1 Population
Congestion Evaluation Best Practices
 Congestion Evaluation Best Practices Todd Litman Victoria Transport Policy Institute Presented International Transportation and Economic Development Conference 10 April 2014 Congestion Indicators Indicator
Study on Development and Parking Management of Dockless Bike Share (DBS) and in Tianjin
 and in Tianjin") Study on Development and Parking Management of Dockless Bike Share (DBS) and in Tianjin Li Wei, Liu Shaokun, Deng Han @ ITDP Institute for Transportation and Development Policy Tianjin, one of the four
Study on Development and Parking Management of Dockless Bike Share (DBS) and in Tianjin Li Wei, Liu Shaokun, Deng Han @ ITDP Institute for Transportation and Development Policy Tianjin, one of the four
Public Consultation Centre For. Transportation Master Plan Update. Information Package
 Public Consultation Centre For Transportation Master Plan Update Information Package Date Location Hours Tuesday, September 12, 2017 Wednesday, September 13, 2017 Tuesday, September 19, 2017 Cambridge
Konstantin Glukhenkiy Economic Affairs Officer
 Konstantin Glukhenkiy Economic Affairs Officer Rapid growth of urban areas Very rapid increase in motorisation Substantial increases in traffic congestion Relative decline of public transport usage and
APPENDIX B. TDM Existing Conditions
 APPENDIX B TDM Existing Conditions SCARBOROUGH CENTRE TMP TRANSPORTATION DEMAND MANAGEMENT INTRODUCTION Scarborough Centre has grown into a mixed-use hub for population, transportation, and employment
GETTING WHERE WE WANT TO BE
 CAMBRIDGESHIRE & peterborough GETTING WHERE WE WANT TO BE A GREEN PARTY TRANSPORT POLICY CONTENTS Our Campaign Priorities 4 Bus Franchising 6 Supporting Active Transport 8 Workplace Parking Levy 9 Tackling
How Travel Demand Has Been Changing. Susan Handy Asilomar 2015
 How Travel Demand Has Been Changing Susan Handy Asilomar 2015 Annual VMT per Capita in U.S. 12,000 10,000 8,000 6,000 4,000 2,000-1936 1940 1944 1948 1952 1956 1960 1964 1968 1972 1976 1980 1984 1988 1992
NORTH ADELAIDE LOCAL AREA TRAFFIC AND PARKING MANAGEMENT ENGAGEMENT OUTCOMES EXECUTIVE SUMMARY PREPARED FOR THE CITY OF ADELAIDE
 NORTH ADELAIDE LOCAL AREA TRAFFIC AND PARKING MANAGEMENT OUTCOMES EXECUTIVE SUMMARY PREPARED FOR THE CITY OF ADELAIDE 2 MAY 2017 NORTH ADELAIDE LATPM EXECUTIVE SUMMARY PAGE 1 OF 8 PROJECT BACKGROUND The
How To Encourage More Efficient Transportation in Brazilian Cities
 How To Encourage More Efficient Transportation in Brazilian Cities Todd Litman Victoria Transport Policy Institute Presented Seminar on Discouraging The Use Of Cars São Paulo, Brazil 3 September 2013 Creating
York Scarborough Bridge Economic Appraisal Update Technical Note
 York Scarborough Bridge Economic Appraisal Update Technical Note Specification No. 1 Client name West Yorkshire Combined Authority Client reference M088 Discipline Transportation Project name CCAG2 Economics
DOE Climate Change Proposals
 DOE Climate Change Proposals Sustrans response to Proposals for Taking Forward NI Climate Change Legislation January 2016 About Sustrans Sustrans makes smarter travel choices possible, desirable and inevitable.
INTEGRATED MULTI-MODAL TRANSPORTATION IN INDIA
 INTEGRATED MULTI-MODAL TRANSPORTATION IN INDIA Tejas Rawal (Corresponding Author) Ph.D. Research Scholar, Dept. of Architecture & Planning, Indian Institute of Technology-Roorkee, Roorkee-247 667 Email:
RE-CYCLING A CITY: EXAMINING THE GROWTH OF CYCLING IN DUBLIN
 Proceedings ITRN2013 5-6th September, Caulfield: Re-cycling a city: Examining the growth of cycling in Dublin RE-CYCLING A CITY: EXAMINING THE GROWTH OF CYCLING IN DUBLIN Brian Caulfield Abstract In the
Loughborough University Travel Planning
 Document Ti tle Client Name Loughborough University Travel Planning Loughborough University Travel Plan Executive Summary 2015-2020 23 December 2015 Loughborough University Travel Planning Project no:
Measuring and Communicating Mobility:
 Measuring and Communicating Mobility: The District Mobility Project Stephanie Dock, District Department of Transportation TRB Transportation Issues in Major Cities Committee May 2, 2017 Deconstructing
Determining bicycle infrastructure preferences A case study of Dublin
 *Manuscript Click here to view linked References 1 Determining bicycle infrastructure preferences A case study of Dublin Brian Caulfield 1, Elaine Brick 2, Orla Thérèse McCarthy 1 1 Department of Civil,
The Development and Policy Recommendations for Dockless Bike Share (DBS) in China
 in China") The Development and Policy Recommendations for Dockless Bike Share (DBS) in China Liu Shaokun, Li Wei, Deng Han @ ITDP Institute for Transportation and Development Policy In 2014, the ofo was established
The Development and Policy Recommendations for Dockless Bike Share (DBS) in China Liu Shaokun, Li Wei, Deng Han @ ITDP Institute for Transportation and Development Policy In 2014, the ofo was established
Application of SUTI in Colombo (Western Region)
") Application of SUTI in Colombo (Western Region) Dr Dimantha De Silva Senior Lecturer, University of Moratuwa Capacity Building Workshop on Sustainable Urban Transport Index (SUTI) 30 th & 31 st October
Application of SUTI in Colombo (Western Region) Dr Dimantha De Silva Senior Lecturer, University of Moratuwa Capacity Building Workshop on Sustainable Urban Transport Index (SUTI) 30 th & 31 st October
Community & Transportation Preferences Survey
 Community & Transportation Preferences Survey Webinar: August 5, 2015 Hugh Morris, AICP, LEED Realtor.org Jennifer Dill, Ph.D. trec.pdx.edu 1 Introduction National Association of Realtors Over 1,000,000
Scotland s consultancy for sustainable transport.
 Scotland s consultancy for sustainable transport. Transform Consulting is Scotland s specialist research and communications consultancy for sustainable transport. Our work ranges from walking, cycling
Complete Streets 101: The Basics
 Complete Streets 101: The Basics Michigan Municipal League - Capital Conference March 21, 2017 Chip Smith, AICP - Senior Planner - Wade Trim Inc. and City Council member City of Ann Arbor 2017 MML Capital
Active Transportation Infrastructure Investment A Business Case
 Active Transportation Infrastructure Investment A Business Case In 2016, the Real Estate Foundation awarded the Capital Regional District a $50,000 grant for Shifting Gears: Land Use Change through Active
International Journal of Research (IJR) Vol-1, Issue-8, September *
 Vol-1, Issue-8, September *") Development towards Sustainable Transportation Planning in India through Management of Non-motorized Transport Akshay Patil 1 * & 2 * 1 3 rd year B. Tech Planning student at College of Engineering Pune,
Development towards Sustainable Transportation Planning in India through Management of Non-motorized Transport Akshay Patil 1 * & 2 * 1 3 rd year B. Tech Planning student at College of Engineering Pune,
Case study Dublin (IE)
") Case study Dublin (IE) Content: - City profile - Description of Bicycle Share Scheme - Operational aspects - User Profile - Communication / Marketing plan - Contact details 1. City profile Dublin is the
Case study Dublin (IE) Content: - City profile - Description of Bicycle Share Scheme - Operational aspects - User Profile - Communication / Marketing plan - Contact details 1. City profile Dublin is the
Online Open House Survey Report. December 2016
 December 216 I. OVERVIEW & OUTREACH SUMMARY Introduction Washington County evaluated long-term transportation investments and strategies as part of the Transportation Futures Study. The purpose of the
CITY OF BLOOMINGTON COMPLETE STREETS POLICY
 CITY OF BLOOMINGTON COMPLETE STREETS POLICY POLICY OBJECTIVE: The City of Bloomington will enhance safety, mobility, accessibility and convenience for transportation network users of all ages and abilities,
PERSONALISED TRAVEL PLANNING IN MIDLETON, COUNTY CORK
 PERSONALISED TRAVEL PLANNING IN MIDLETON, COUNTY CORK Elaine Brick Principal Transport Planner AECOM Abstract Smarter Travel funding was awarded to the Chartered Institute of Highways and Transportation
Active travel and economic performance: A What Works review of evidence from cycling and walking schemes
 1 Making the economic case for active travel Active travel and economic performance: A What Works review of evidence from cycling and walking schemes Active Travel Toolkit Slide Pack July 2017 Active travel
KEY FINDINGS OF THE INTERIM EVALUATION OF THE SMARTER TRAVEL AREAS PROGRAMME
 Proceedings 1st - 2nd September 2016 BRICK, CANTWELL, SWIFT: Smarter Travel Areas KEY FINDINGS OF THE INTERIM EVALUATION OF THE SMARTER TRAVEL AREAS PROGRAMME Elaine Brick Associate Director AECOM Mairead
GD 0043/18 ACTIVE TRAVEL STRATEGY
 GD 0043/18 ACTIVE TRAVEL STRATEGY 2018-2021 May 2018 Minister s Introduction There is strong evidence that regular physical activity reduces the risk of a range of health conditions. The best way to increase
Welcome. Background. Goals. Vision
 Welcome The formal Public Information Centre (PIC) for the Transportation Master Plan How We GO will be held in early 2017. At that time we will present the recommended transportation system for Niagara
Multi-Modal Transportation Programs
 Multi-Modal Transportation Programs Supporting the Lawrence Strategic Plan Critical Success Factors: Safe, Healthy and Welcoming Neighborhoods Innovative Infrastructure & Asset Management Effective Governance
WALKNBIKE DRAFT PLAN NASHVILLE, TENNESSEE EXECUTIVE SUMMARY NASHVILLE, TENNESSEE
 NASHVILLE, TENNESSEE EXECUTIVE SUMMARY Executive Summary A world-class multi-modal transportation system is essential to a vibrant city and better quality of life. -Mayor Barry The WalknBike plan aims
Making the case for active travel
 1 An insight from the Department for Transport s Economists Philipp Thiessen and Joe Gaytten Overview 2 3 Cycling Delivery Plan targets Cycling and Walking Investment Strategy (Infrastructure Bill amendment)