S-C1. Supplemental Aircraft Noise Technical Report
|
|
|
- Rodney Hancock
- 5 years ago
- Views:
Transcription
1 Appendix LAX Master Plan Supplement to the Draft EIS/EIR S-C1. Supplemental Aircraft Noise Technical Report June 2003 Prepared for: Los Angeles World Airports U.S. Department of Transportation Federal Aviation Administration Prepared by: Landrum & Brown
2
3 Table of Contents 1. Introduction The Physics and Measurement of Noise Standard Aircraft Noise Descriptors Noise Contours Year 2000 Conditions Data Sources and Assumptions Runway Definition Year 2000 Conditions Runway Utilization Flight Tracks Aircraft Performance Characteristics Year 2000 Fleet and Aircraft Operations Aircraft Ground Activity Relationship of 2000 Contours to 4th Quarter 2000 Report Contours Future Aircraft Operating Conditions Future Alternative D Conditions Alternative D Aircraft Operations and Fleet Mix Alternative D Runway Utilization Alternative D Flight Track Usage Alternative D Run-up Noise Alternative D, Aircraft Noise Pattern During Reconstruction of Runway 7R/25L Alternative D Mitigation Noise Screening of Alternative d Track Changes Above 3,000 Feet Altitude Location Impact Analysis Single Event Noise Analysis Nighttime Awakenings Analysis Threshold of Significance SEL Noise Contours Mitigation of Awakenings School Single Event Analysis Threshold of Significance School Disruption Impact Assessment Mitigation of Single Event Effects on Schools List of Tables Table S Baseline and Year 2000 Conditions Runways/Lengths... 7 Table S2 Year 2000 Conditions Runway Utilization Percentages... 7 Table S3 Flight Track Utilization Percentages - Year 2000 Conditions Table S4 Average Annual Day Operations and Fleet Mix Year 2000 Conditions Table S5 Average Annual Day Operations by Aircraft Category Baseline and Year 2000 Conditions Table S6 Alternative D 2015 (with Part 161 Mitigation) vs. Alternative D 2015 Without Mitigation Table S Average Annual Day Operations and Fleet Mix Alternative D Table S Runway Utilization Percentages - Alternative D Table S Flight Track Utilization Percentages Alternative D Table S10 Run-up Operations Summary Alternative D Table S11 Table S12 Table S13 Alternative D dba SEL Part 161 Mitigation Contour vs. Unmitigation Alternative D dba SEL LAX Master Plan Supplement to the Draft EIS/EIR Regular and Noise Sensitive Grid Point Locations LAX Master Plan Supplement to the Draft EIS/EIR Regular and Special Grid Point Assessment - Aircraft CNEL Comparison of Build Alternatives to1996 Baseline, Year 2000 Conditions, and 2015 No Los Angeles International Airport i LAX Master Plan Supplement to the Draft EIS/EIR
4 Table S14 Table S15 Table S16 Table S17 Table S18 Table S19 Table S20 Table S21 Table S22 Table S23 Table S24 Table S25 Table S26 Table S27 Table S28 Table S29 Table S30 Table S31 Action/No Project Alternative LAX Master Plan Supplement to the Draft EIS/EIR Regular and Special Grid Point Assessment - Aircraft DNL Comparison of Build Alternatives to Baseline, Year 2000 Conditions, and 2015 No Action/No Project Alternative LAX Master Plan Supplement to the Draft EIS/EIR Regular and Special Grid Point Assessment - Aircraft L max Comparison of Build Alternatives to 1996 Baseline, Year 2000 Conditions, and 2015 No Action/No Project Alternative LAX Master Plan Supplement to the Draft EIS/EIR Regular and Special Grid Point Assessment - Aircraft Time In Minutes Above 65 dba Comparison of Build Alternatives to 1996 Baseline, Year 2000 Conditions, and 2015 No Action/No Project Alternative LAX Master Plan Supplement to the Draft EIS/EIR Regular and Special Grid Point Assessment - Aircraft Time In Minutes Above 75 dba Comparison of Build Alternatives to 1996 Baseline, Year 2000 Conditions, and 2015 No Action/No Project Alternative LAX Master Plan Supplement to the Draft EIS/EIR Regular and Special Grid Point Assessment - Aircraft Time In Minutes Above 85 dba Comparison of Build Alternatives to 1996 Baseline, Year 2000 Conditions, and 2015 No Action/No Project Alternative LAX Master Plan Supplement to the Draft EIS/EIR Regular and Special Grid Point Assessment - Aircraft Time In Minutes Above 95 dba Comparison of Build Alternatives to 1996 Baseline, Year 2000 Conditions, and 2015 No Action/No Project Alternative LAX Master Plan Supplement to the Draft EIS/EIR Grid Points Within Future Alternatives That Experience Significant or Other Reportable Increases in CNEL- Comparison of Future Alternatives to 1996 Baseline, Year 2000 Conditions, and 2015 No Action/No Project Alternative Number of Significantly Impacted Grid Points Under Each Build Alternative Compared to 1996 Baseline, Year 2000 Conditions, and 2015 No Action/No Project Conditions (Increase of CNEL Noise Level of 1.5 dba within 65 CNEL) Estimated Population and Dwelling Units Within 94 dba SEL Contour of Nighttime Noise Baseline and Year 2000 Conditions Number of Takeoffs to the East at Night - Current and Projected Conditions Estimated Population and Dwelling Units Within 94 dba SEL Contour of Nighttime Noise No Action/No Project Alternative Estimated Population and Dwelling Units Within 94 dba SEL Contour of Nighttime Noise - Alternative A Estimated Population and Dwelling Units Within 94 dba SEL Contour of Nighttime Noise - Alternative B Estimated Population and Dwelling Units Within 94 dba SEL Contour of Nighttime Noise - Alternative C Estimated Population and Dwelling Units Within 94 dba SEL Contour of Nighttime Noise - Alternative D Dwellings Mitigated by Making Over-Ocean Procedures Mandatory When In Use To Limit Single Event Awakenings Impacts for Development Alternatives A, B, C, and D Dwellings Remaining Unmitigated for Single Event Awakenings Effects by Making Over-Ocean Procedures Mandatory for Development Alternatives A, B, C, and D Average Daily Minutes Above Threshold, Average Number of Daily Events and Average Event Duration (in Seconds) Above 55 Interior dba Speech Interference Levels During the Average School Day (8:00 a.m. 4:00 p.m.) Los Angeles International Airport ii LAX Master Plan Supplement to the Draft EIS/EIR
5 This Page Intentionally Left Blank. Los Angeles International Airport iv LAX Master Plan Supplement to the Draft EIS/EIR
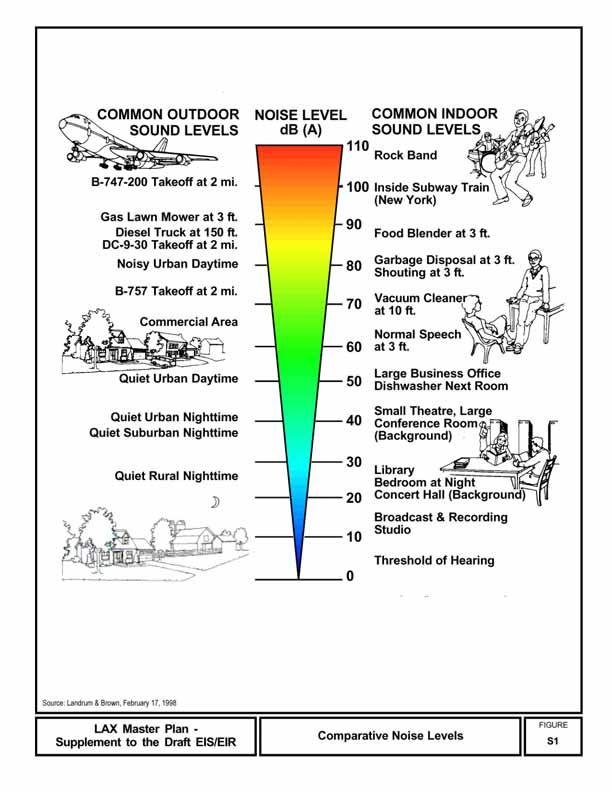
6 1. INTRODUCTION Detailed statistical data related to aircraft noise exposure patterns and impact evaluations presented in Section 4.1, Noise, of the Supplement to the Draft EIS/EIR are presented in this Appendix. The Appendix includes that information necessary to compute the noise exposure patterns present around the airport in 2000, as well as those forecast for the Year 2015 under a new alternative scenario (Alternative D). The patterns of aircraft-related noise are defined through use of noise contours and single-site data prepared with the FAA s Integrated Noise Model (INM), Version 6.0. This was the most current version of the INM at the time the noise contours for the Draft EIS/EIR were prepared. The retention of comparability between the evaluations prepared for the Supplement to the Draft EIS/EIR and the results presented in the Draft EIS/EIR was considered essential to enable the Federal decision makers to equitably compare the alternatives to conditions present in 1996, 2000 and for the future No Action/No Project Alternative. Noise contours are presented using the Community Noise Equivalent Level (CNEL) metric, while singlesite noise is described through use of CNEL and several supplemental noise level descriptors, including the Day-Night Average Sound Level (DNL), the Maximum Noise Level (L max ), the Sound Exposure Level (SEL), the 24-Hour Equivalent Noise Level (L eq -24) and the amount of time above preset decibel thresholds (TALA). Chapter 4, Section 4.1 Noise, describes the impacts associated with the aircraft noise exposure patterns for the 1996 baseline, Year 2000 conditions, No Action/No Project Alternative, and Build (Build) alternatives as defined in Chapters 2, Purpose and Need for the Proposed Action, of the Draft EIS/EIR and of the Supplement to the Draft EIS/EIR. The contours associated with those impacts are presented in Chapter 4, Section 4.2, Land Use of the Draft EIS/EIR and the Supplement to the Draft EIS/EIR. Portions of Appendix D, Aircraft Noise Technical Report, of the Draft EIS/EIR are repeated here to aid the continuity of the presentation. 1.1 The Physics and Measurement of Noise Noise is simply defined as unwanted sound. Noise and sound are thus physically the same, the difference being in the subjective opinion of the receiver. A sound is produced by a source, which induces vibrations in the air. The vibration produces alternating bands of relatively dense and sparse particles of air, spreading outward from the source, much like ripples do on water after a stone is dropped into it. The result of the air movement is sound waves, which radiate in all directions and may be reflected or scattered. Sound is measured by its pressure or energy in terms of decibels (db). Decibels are expressed on a logarithmic scale due to the range of sound intensities being so great that it is inconvenient to compress linearly the scale to include all the sounds that need to be measured. The decibel scale from zero to 120 covers most of the range of everyday sounds, as shown in Figure S1, Comparative Noise Levels. When the decibel counts go up by ten, the total sound energy increases tenfold and the perceived sound is doubled. Sound pressure levels of two separate sources are not arithmetically added. For example, if a sound of 60 db is added to another sound of 60 db, the total is a three-decibel increase to 63 db for the combined events, not a doubling to 120 db. The human ear has a wide range of perception; at the low end of the decibel scale, very faint sounds of less than 10 decibels can be heard, yet extremely loud sounds of more than 100 db can also be heard. 1.2 Standard Aircraft Noise Descriptors Under the guidance provided by FAA Orders A, D, and Federal Aviation Regulation (FAR) Part 150, noise exposure levels associated with aircraft activity are prepared to indicate cumulative noise exposure levels, averaged to represent single second expressions of the acoustic energy totals present on an annual average daily aircraft activity. Though a particular sound may be measured in decibels, the noise emanating from an airport rises, falls, and even ceases in many areas during the course of a 24- hour day. Therefore, various noise descriptors or measurements referred to as metrics, have been developed to summarize how people interpret sound and to describe average noise exposure levels resulting from aircraft operations. The Community Noise Equivalent Level (CNEL) is the standard noise metric used in California for environmental evaluations and periodic reporting to the California Los Angeles International Airport 1 LAX Master Plan Supplement to the Draft EIS/EIR
7 S-C1. Supplemental Aircraft Noise Technical Report Department of Transportation (Caltrans) of noise levels in the vicinity of airports. It has been accepted for use in federally sponsored environmental evaluations in California. 1 CNEL is based on Hourly Noise Levels (HNL). HNL is the average sound level, in decibels, which contains the same sound energy as the time-varying sound level. HNL also may be shown as L eq ( h). CNEL was developed to reflect the greater annoyance caused by noise events during evening or night hours. The CNEL metric assumes that the HNLs occurring between 7:00 p.m. and 9:59:59 p.m. would be augmented by 4.77 db, and that sound occurring between 10:00 p.m. and 6:59:59 a.m. would be augmented by 10 db before being combined with the equivalent sound level for the daytime period (7:00 a.m. to 6:59:59 p.m.). The effect of these adjustments reflects the assumption that one evening event has the equivalent annoyance of three daytime events of the same type, and one night event has the equivalent impact of 10 daytime events of the same type. The CNEL metric provides for a numeric description of the weighted 24-hour cumulative noise energy level using the A-weighted decibel (dba) scale over a period of a year. A-weighting most closely mimics the way people hear aircraft noise events. In addition to the CNEL, which will be used for the general assessment of noise impact, information on other metrics is presented in this appendix for numerous locations within the airport environs. These other metrics are: Day-Night Average Sound Level (DNL) - the 24-hour average sound level, in decibels, for the period from midnight to midnight, obtained after the addition of ten decibels to sound levels for the periods between midnight and 7:00 a.m. and between 10:00 p.m. and midnight local time. Maximum Noise Level (L max ) - indicates the highest decibel level of noise a location would typically experience on an average day of operation. The levels may occasionally be exceeded by some abnormal event. Of the metrics which can be computed by the INM, airport neighbors often relate the L max as being the nearest metric to the noise they actually hear at their homes. Time Above (TA) - the amount of time a site is exposed to noise in excess of selected decibel threshold levels. Conventional aircraft noise analysis evaluates the amount of time sites are exposed to noise in excess of 65, 75, 85, and 95 dba. The measure is helpful in determining the exposure of certain noise-sensitive uses (schools, sleeping quarters, religious facilities, etc.) to extended periods of noise at various levels that may be disruptive to the activity occurring there. Sound Exposure Level (SEL) - the amount of noise energy that occurs over a stated time interval or event, expressed as the equivalent decibel level for a single second. For example, if a single event consists of ten seconds of 80 dba each, the SEL would be 90 dba. The metric is used in the evaluation of single event effects. Equivalent Noise Level (L eq ) - the average sound level, in decibels, for any given period. The metric will be used in this Supplement to the Draft EIS/EIR as a tool to describe the effects of aircraft noise on school environments. 1 Paragraph 47(e)(1) of FAA Advisory Circular A, Airport Environmental Handbook, allows the use of the CNEL metric as an acceptable exception to the Day-Night Average Sound Level (DNL), which is normally used in FAA EIS documents for airport noise impact analysis. Los Angeles International Airport 2 LAX Master Plan Supplement to the Draft EIS/EIR
8
9 S-C1. Supplemental Aircraft Noise Technical Report Los Angeles International Airport 4 LAX Master Plan Supplement to the Draft EIS/EIR
10 1.3 Noise Contours S-C1. Supplemental Aircraft Noise Technical Report Contours of equal levels of noise are used to disclose the areas affected by aircraft noise. CNEL contours are the principal technique used in this evaluation to disclose general noise exposure patterns and noise impacts. Noise contours connect points of equal noise levels (at 65, 70, and 75 decibels of CNEL) to form patterns displaying the density of noise exposure. The size and shape of the contour pattern are functions of several different components of the aircraft fleet serving the airport. The principal factors controlling the contour pattern include the number of operations, the loudness of the fleet as a whole (as determined by fleet mix), the location of flight patterns, the time of day of operations, and the type of operation (arrival, departure or run-up). Each of these elements must be forecast and documented before operating information can be processed for noise contour computation. SEL contours will be used to describe the areas exposed to nighttime noise above threshold awakening levels to comply with requirements set forth by LAWA and a California Court of Appeal decision pertaining to the need to document single event effects of the airport on the surrounding community. 2 Aircraft noise contours presented in this appendix were generated using the Integrated Noise Model (INM), Version 6.0C. The INM is a state-of-the-art FAA approved computer model that is used to predict the noise impacts from aircraft operations. INM Version 6.0 was the most recent version of the aircraft noise calculation model available at the time of preparation of the noise contours for the Draft EIS/EIR. While the model has been updated since the release of the Draft EIS/EIR, the modifications of noise contour patterns between Version 6.0 and Version 6.0C are relatively insignificant, particularly for a large airport such as LAX with a great variety of aircraft types and large volumes of traffic. Version 6.0 was released in late 1999 and includes all enhancements to previous versions to allow consideration of many local conditions that may have an effect on the location of the noise contours, including both flight and ground run-up activities. Although the database of the model has been subsequently updated several times, the fundamental model is the same as was used to compute the noise contours prepared for the Draft EIS/EIR. The INM computer program predicts the pattern of noise dispersion over the airport environs, based on the operating characteristics and noise levels of the aircraft using or projected to use the airport. It interpolates noise exposure contours from the noise dispersion data, or provides detailed noise level information for selected locations in the environs. The data requirements necessary to develop the CNEL noise contours presented in Section 4.2, Land Use, of the Supplement to the Draft EIS/EIR, as well as the detailed single point output data, are discussed in the sections that follow. 2. YEAR 2000 CONDITIONS As discussed in the Draft EIS/EIR, the 1996 baseline for noise is represented by the conditions present in However, as was disclosed in that document, the large aircraft fleet operating at the airport was subject to requirements for noise reduction that were to be in place by the end of the year Comments were received during the public review phase of the Draft EIS/EIR suggesting that a more appropriate representation of current noise conditions would be the Year 2000 because it would incorporate the elimination of the louder fleet of large Stage 2 aircraft. For the Supplement to the Draft EIS/EIR, INM input files for the 4 th Quarter of 2000 were acquired from the LAWA Environmental Management Division-Noise Bureau. These files were used to compute a noise contour for the Year 2000 that would be comparable to the contours prepared for all other conditions assessed by this environmental evaluation. Unlike previous noise modeling efforts that have been conducted for the airport, this evaluation will include ground run-up noise exposure patterns, as well as the more traditional assessment of noise associated with aircraft in flight. The 2000 noise conditions represent the average annual operating condition for that calendar year. In developing noise contours, extensive data are necessary to describe the operating conditions at the airport. The following sections provide a description of the data and assumptions used to develop the noise contours. The input parameters include the average daily number of aircraft operations, the aircraft fleet mix and its distribution throughout the day, the current utilization of the runways, the location of the flight paths leading to and from the runways, and the distribution of flight operations on those flight paths. 2 Berkeley Keep Jets Over the Bay Committee vs. Board of Port Commissioners, (2001) 91 Cal. App. 4 th Los Angeles International Airport 5 LAX Master Plan Supplement to the Draft EIS/EIR
11 S-C1. Supplemental Aircraft Noise Technical Report The Year 2000 conditions consider not only the noise produced by aircraft in flight, but also that noise produced by aircraft that conduct engine maintenance run-ups on the ground. Typically, flight noise affects a broader area along the paths of flight, while run-up noise of similar levels is limited to areas on or near the airport. Both types of noise exposure patterns are dependent on the level, timing and location of aircraft activity. The patterns of flight noise are presented first, followed by the pattern of ground run-up noise. These are combined to indicate the overall pattern of aircraft noise exposure for the current condition. 2.1 Data Sources and Assumptions A variety of data from a number of sources are required in order to use the INM in the analysis of aircraft noise. This section presents the data employed in assessing the 1996 baseline impact. At LAX an automated noise and operations monitoring system is in use that provides daily records of flight operations by virtually all aircraft using the facility. The FAA s Automated Radar Terminal System (ARTS) records are accessed by software owned and operated by LAWA s Environmental Management Division-Noise Bureau to obtain location and other descriptive information related to each arrival and departure. This information is processed to assign each aircraft to one of several predefined flight track corridors and the resultant information is loaded into a relational database. The database includes aircraft type as designated by radar, runway and flight track assignments, user identification and flight number, type of operation (approach or take off), and its time of occurrence. Records of flights are extracted from this database with proprietary software developed for and owned by LAWA to produce a compiled report of operations for any period desired. This processing automatically assigns an INM aircraft type (based on the aircraft fleet records of each carrier) to each operation and summarizes the number of arrivals and departure by each type during day, evening and night hours. Subsequent processing provides take off trip distance assignments based on the scheduled destinations served by each aircraft type/carrier combination, as extracted from the Official Airline Guide for the period under consideration. The data are then compiled into a format that may be processed by the INM to produce patterns of noise exposure. The Environmental Management Division-Noise Bureau will continue to use this system in meeting its responsibility to regularly monitor and report on noise conditions in the airport environs. The Supplement to the Draft EIS/EIR relies on the results of LAWA s system in the definition of 1996 baseline noise levels (per the 4th Quarter 1996 Noise Report) and the Year 2000 conditions noise levels. Future noise patterns were defined using projected conditions for the annual average day. The following paragraphs describe the important characteristics of the Year 2000 operation that are essential to the location and extent of the noise exposure pattern around the airport. The conditions established for the 1996 baseline, as described in detail in Chapter 4, Section 4.1, Noise, of the Draft EIS/EIR and its Appendix D, Aircraft Noise Technical Report, remain consistent with the conditions present in the Year Runway Definition The Year 2000 conditions runway configuration at LAX is unchanged from the 1996 baseline described in the Draft EIS/EIR. The airfield consists of two complexes of two parallel runways. These runways are configured in the east to west (6R/24L and 7L/25R) direction. The 6R/24L runway complex is north of the core terminal area, while the 7L/25R complex lies south of the terminal core. The north runways are laterally separated by 700 feet and the south runways are separated by 745 feet. The two inboard runways (6R/24L and 7L/25R) are separated by 4,600 feet. The 1996 baseline runways and their lengths are shown in Table S1, 1996 Baseline and Year 2000 Runways/Lengths. Runway 7R/25L is 200 feet wide and all other runways are 150 feet wide. Each is capable of accommodating aircraft weighing up to 900,000 pounds - virtually every aircraft in operation today. The landing threshold of Runway 6R is displaced 301 feet. Los Angeles International Airport 6 LAX Master Plan Supplement to the Draft EIS/EIR
12 S-C1. Supplemental Aircraft Noise Technical Report Table S Baseline and Year 2000 Conditions Runways/Lengths Runway Total Length (feet) 6R/24L 10,285 6L/24R 8,925 7R/25L 11,095 7L/25R 12,090 Source: Los Angeles Department of Airports, Year 2000 Conditions Runway Utilization Runway end utilization refers to the percent of operations carried by a particular runway end for departures or arrivals. The percentage usage of the existing runways during the 2000 calendar year was based on information provided by LAWA s Environmental Management Division-Noise Bureau through analysis of records of flight operations appearing on radar managed by the FAA Air Traffic Control Tower staff at LAX. Each arrival and departure operation during the day (7:00 a.m. to 6:59 p.m.), evening (7:00 p.m. to 9:59 p.m.) and night (10:00 p.m. to 6:59 a.m.), by each INM type of aircraft was determined by the processing software and allocated to the appropriate runway end. The overall runway end utilization percentages recorded for the Year 2000 are provided in Table S2, Year 2000 Conditions Runway Utilization Percentages. The table demonstrates that approximately 98 percent of all departures during 2000 were made to the west, while 94 percent of all arrivals were made from the east. The data further indicates that during the hours between 10:00 p.m. and 7:00 a.m., nearly 31 percent of all arrivals were made to the east from over the ocean. Between midnight and 6:30 a.m., over ocean procedures are used. These procedures result in most arrivals during those hours being made from the west while nearly all departures are made to the west. During 2000, the annual proportions of departures were approximately 98 percent west flow and 2 percent east flow between 6:30 a.m. and midnight. It should be noted that a large number of arrivals occur between 10:00 p.m. and midnight, before over-ocean approach procedures come into effect. During over-ocean procedures, a majority of the arrivals are made to the inboard runway in the north complex (Runway 6R) and departures are made from the inboard runway in the south complex (Runway 25R). These data are comparable to those proportions used in the Bureau s quarterly mapping of noise exposure patterns for several years. Table S2 Year 2000 Conditions Runway Utilization Percentages Landings Takeoffs Runway Day Eve Night Total Day Eve Night Total 06L 1.0% 0.7% 1.3% 1.0% <0.1% <0.1% <0.1% <0.1% 06R <0.1% 0.1% 16.6% 2.2% 0.8% 0.1% 0.3% 0.6% 07L <0.1% <0.1% 8.8% 1.2% 1.1% 0.6% 1.0% 1.0% 07R 1.4% 0.4% 3.9% 1.5% 0.2% 0.1% 0.3% 0.2% 24L 2.8% 5.8% 1.3% 3.1% 45.3% 41.5% 25.0% 41.5% 24R 41.8% 42.9% 29.7% 40.4% 2.6% 2.2% 1.6% 2.4% 25L 50.0% 44.6% 34.4% 46.9% 6.8% 12.7% 11.1% 8.3% 25R 3.0% 5.4% 3.9% 3.6% 43.1% 42.9% 60.5% 45.9% Total 100.0% 100.0% 100.0% 100.0% 100.0% 100.0% 100.0% 100.0% Day: 7:00 a.m. to 6:59 p.m., Eve: 7:00 p.m. to 9:59 p.m., Night: 10:00 p.m. to 6:59 a.m. Totals may not add to 100 percent due to rounding. Source: Landrum & Brown, 2002, based on LAWA 4 th Quarter 2000 INM input files. Los Angeles International Airport 7 LAX Master Plan Supplement to the Draft EIS/EIR
13 S-C1. Supplemental Aircraft Noise Technical Report Flight Tracks Flight tracks are the paths aircraft follow over the ground on approach to and departure from an airport. The existing noise management system has set a series of nominal representative flight corridors among which are distributed all operations recorded from ARTS data. Each flight track recorded on radar passes through a series of gates in space as it approaches or departs the airport. Each gate is assigned one or more nominal flight tracks associated with a runway end and operation type. Nominal tracks are meant to represent a number of similar flight paths or a "flight corridor". 3 The assigned flight corridor is then stored with the record of each operation. A total of 52 departure and 22 approach corridors were automatically assigned operations during the average day of the assessment period. The assignment of operations to actual flight corridors will automatically result in the dispersion of flights as they leave or approach the airport. The flight tracks used in modeling noise exposure patterns for the 1996 baseline and Year 2000 conditions are presented in Figure S2, Existing Flight Tracks. The Environmental Management Division-Noise Bureau s computer program was used to automatically assign traffic to all consolidated flight tracks for all INM aircraft types. Table S3, Flight Track Utilization Percentages - Year 2000 conditions, provides the percentage of total landing or departure utilization of each flight track for the Year 2000 condition. These allocated operations were then coupled with digital information describing runway end point coordinates and the noise exposure pattern was computed. Using these assignments, it was found that during west traffic flows, 96 percent of all arrivals, and 92 percent of all departures were assigned to straight-in or straight-out alignments. An evaluation of the INM input files indicated that virtually all operations along other paths were conducted by small propeller aircraft. 3 The INM, Version 6.0, allows for an unlimited number of flight tracks. However, the run time of the model is closely related to the number of flight tracks incorporated. Furthermore, the model becomes less accurate as the number of operations on each track becomes smaller through a profusion of discrete flight tracks. The 74 tracks used to describe existing conditions is adequate to define existing conditions, while providing sufficient diversion to represent the array of flights experienced during a year to and from the airport. Los Angeles International Airport 8 LAX Master Plan Supplement to the Draft EIS/EIR

14
15 S-C1. Supplemental Aircraft Noise Technical Report Los Angeles International Airport 10 LAX Master Plan Supplement to the Draft EIS/EIR
16 S-C1. Supplemental Aircraft Noise Technical Report Table S3 Flight Track Utilization Percentages - Year 2000 Conditions Arrivals (East and West Flow) Departures (East Flow) Departures (West Flow) Rwy. Track Day Eve Night Total Rwy. Track Day Eve Night Total Rwy. Track Day Eve Night Total 06L L15 -*- -*- 1.0% 0.2% 06L T1 -*- -*- -*- -*- 24L T29 -*- -*- -*- -*- 06L L16 0.9% 0.7% 0.3% 0.8% 06L T10 -*- -*- -*- -*- 24L T30 0.1% 0.2% 0.3% 0.2% 06R L15 -*- -*- 15.6% 2.1% 06L T2 -*- -*- -*- -*- 24L T31 0.9% 0.8% 0.7% 0.8% 06R L16 -*- -*- 1.0% 0.2% 06L T3 -*- -*- -*- -*- 24L T32 2.4% 3.3% 3.0% 2.6% 07L L13 -*- -*- 2.1% 0.3% 06L T4 -*- -*- -*- -*- 24L T % 31.0% 17.6% 31.6% 07L L14 -*- -*- 6.6% 0.9% 06L T5 -*- -*- -*- -*- 24L T34 5.9% 5.1% 2.8% 5.3% 07R L13 1.3% 0.4% 1.6% 1.2% 06L T6 -*- -*- -*- -*- 24L T35 1.0% 1.0% 0.6% 0.9% 07R L14 -*- -*- 2.3% 0.3% 06L T7 -*- -*- -*- -*- 24L T36 0.1% -*- -*- 0.1% 24L L1 -*- -*- -*- -*- 06L T8 -*- -*- -*- -*- 24L T37 -*- -*- -*- -*- 24L L2 -*- -*- -*- -*- 06L T9 -*- -*- -*- -*- 24R T29 -*- -*- -*- -*- 24L L3 -*- -*- -*- -*- 06R T1 -*- -*- -*- -*- 24R T30 -*- -*- -*- -*- 24L L4 -*- -*- -*- -*- 06R T10 0.1% -*- -*- 0.1% 24R T31 -*- -*- -*- -*- 24L L5 -*- -*- -*- -*- 06R T11 -*- -*- -*- -*- 24R T32 0.1% 0.1% 0.1% 0.1% 24L L6 -*- -*- -*- -*- 06R T2 -*- -*- -*- -*- 24R T33 1.5% 1.2% 0.8% 1.3% 24L L7 2.5% 4.6% 1.2% 2.7% 06R T3 -*- -*- -*- -*- 24R T34 0.8% 0.6% 0.5% 0.7% 24L L8 0.2% 1.2% 0.1% 0.4% 06R T4 -*- -*- -*- -*- 24R T35 0.2% 0.2% 0.2% 0.2% 24L L8A -*- -*- -*- -*- 06R T5 -*- -*- -*- -*- 24R T36 -*- -*- -*- -*- 24R L1 -*- -*- -*- -*- 06R T6 -*- -*- -*- -*- 24R T37 -*- -*- -*- -*- 24R L2 -*- -*- -*- -*- 06R T7 0.2% -*- 0.1% 0.2% 25L T21 -*- -*- -*- -*- 24R L3 -*- -*- -*- -*- 06R T8 0.2% -*- 0.1% 0.2% 25L T22 -*- -*- -*- -*- 24R L4 -*- -*- -*- -*- 06R T9 0.2% -*- 0.1% 0.1% 25L T23 -*- -*- 0.1% -*- 24R L5 -*- -*- -*- -*- 07L T12 -*- -*- -*- -*- 25L T24 -*- -*- -*- -*- 24R L6 0.3% 0.2% 0.1% 0.2% 07L T13 0.2% 0.3% 0.2% 0.2% 25L T25 0.2% 0.9% 0.8% 0.4% 24R L7 39.1% 38.3% 28.4% 37.5% 07L T14 0.5% 0.2% 0.5% 0.4% 25L T26 2.3% 6.1% 4.4% 3.2% 24R L8 2.3% 4.4% 1.1% 2.6% 07L T15 0.3% 0.1% 0.2% 0.3% 25L T27 4.1% 5.5% 5.5% 4.5% 24R L8A -*- -*- -*- -*- 07L T16 0.1% 0.1% 0.1% 0.1% 25L T28 0.1% 0.2% 0.4% 0.2% 25L L10 -*- -*- -*- -*- 07L T17 -*- -*- -*- -*- 25R T21 -*- -*- -*- -*- 25L L11 2.3% 4.2% 2.8% 2.7% 07L T18 -*- -*- -*- -*- 25R T22 -*- -*- -*- -*- 25L L % 40.5% 31.6% 44.2% 07L T19 -*- -*- -*- -*- 25R T23 -*- -*- 0.1% -*- 25L L9 -*- -*- -*- -*- 07L T20 -*- -*- -*- -*- 25R T24 -*- 0.1% 0.1% 0.1% 25R L10 -*- -*- -*- -*- 07R T12 -*- -*- -*- -*- 25R T25 1.0% 1.4% 1.8% 1.1% 25R L11 0.2% 0.8% 1.0% 0.4% 07R T13 -*- -*- -*- -*- 25R T % 14.2% 16.6% 12.2% 25R L12 2.8% 4.6% 2.9% 3.2% 07R T14 0.1% -*- 0.2% 0.1% 25R T % 26.5% 40.8% 31.6% 25R L9 -*- -*- -*- -*- 07R T15 0.1% -*- 0.1% 0.1% 25R T28 0.8% 0.7% 1.1% 0.8% Total 100.0% 100.0% 100.0% 100.0% 07R T16 -*- -*- -*- -*- Total 100.0% 100.0% 100.0% 100.0% 07R T17 -*- -*- -*- -*- 07R T18 -*- -*- -*- -*- 07R T19 -*- -*- -*- -*- 07R T20 -*- -*- -*- -*- Day: 7:00 a.m. to 6:59 p.m., Evening: 7:00 p.m. to 9:59 p.m., Night: 10:00 p.m. to 6:59 a.m. -*- = less than 0.05 percent ** Totals may not add to 100 percent due to rounding Source: Landrum & Brown, 2002, based on LAWA 4 th Quarter 2000 INM input files Aircraft Performance Characteristics The INM provides a database of aircraft landing and takeoff performance characteristics for each aircraft type. These are based on standard conditions (sea level and 59 degrees Fahrenheit). For departing aircraft, the takeoff roll requirements and rate of climb are determined by aircraft weight, elevation and temperature. The INM uses the distance an aircraft flies to its initial destination as a surrogate for the weight of the aircraft. The model adjusts the takeoff database information to reflect average airport temperature and airport elevation conditions. For these evaluations, the elevation (126 feet above sea level) and the average annual temperature applicable at LAX (63 degrees Fahrenheit) are used. The model's default relative humidity function was used. A common 3-degree approach procedure is provided within the database of the model that may be assigned to all aircraft. Where the final instrument approach slope is 3 degrees, this standard is used. Where the approach slope varies from 3 degrees, approach procedures are defined to reflect local conditions. Three-degree descent profiles provided by the model were used for all runways, as verified by examination of the published instrument landing procedures presented in the Jeppesen Airway Los Angeles International Airport 11 LAX Master Plan Supplement to the Draft EIS/EIR
17 S-C1. Supplemental Aircraft Noise Technical Report Manuals. Jeppesen Airway Manuals are a resource used by pilots to provide aeronautical information in a graphic format Year 2000 Conditions Fleet and Aircraft Operations LAWA s Environmental Management Division-Noise Bureau uses the following protocols for the development of its noise model input files from raw radar data gathered on a continual basis. The ARTS records serve as the basis from which a table of average day operations for each INM aircraft type for the Year 2000 conditions was prepared. A comparison of the historic ARTS data with the Air Traffic Control Tower s daily activity reports indicated that the radar system captured nearly 85 percent of all operations reported. Average day numbers of operations by each aircraft type are proportionately increased to assure that the noise exposure evaluations represented the actual number of operations recorded by the Tower. 4 The underlying assumptions used in modifying the fleet mix and operations data are: The number of landings and departures by individual aircraft types were approximately equal on the average annual day. Where radar data indicate an unequal distribution of arrivals and departures, the lower number was increased to approximate the higher number. This presumes that average day flight cycles could be no less than the higher of the two numbers. The total distribution of commercial aircraft types are evaluated against the distribution of air carrier, air taxi, general aviation and military operations reported by the Air Traffic Control Tower. When there is a discrepancy between the reported numbers of operations and the collected radar data, the radar data detail is adjusted to reflect the number of operations reported by the Tower. Military operations were performed principally by helicopters operated by the Coast Guard located on the airport, but are sanitized from the radar records for national defense purposes. While the FAA reports approximately 2,200 annual military operations, no detailed records of military operations are maintained by the airport. Environmental Management Division-Noise Bureau officials report that helicopters, which operate almost exclusively over the airport or over the ocean, account for approximately 90 percent of the military activity, while the remaining operations are distributed among a wide variety of aircraft types. 5 The noise energy contributed by each military aircraft type to the CNEL contours is masked by civilian operations. The application of these assumptions for Year 2000 conditions results in the distribution of operations among separate INM aircraft types as indicated on Table S4, Average Annual Day Operations and Fleet Mix - Year 2000 Conditions. The time of day at which operations occur is important as input to the INM determination of CNEL due to the penalty assessed against evening (7:00 p.m. to 9:59 p.m.) and nighttime (10:00 p.m. to 6:59 a.m.) flights. An assessment of the operational records indicates that approximately 29.8 percent of all departures occur during the evening and nighttime hours; approximately 31.5 percent of arrivals occur during those hours. The mix of aircraft types replicates the aircraft used in the LAWA 4 th Quarter 2000 noise modeling report. Table S4 Average Annual Day Operations and Fleet Mix - Year 2000 Conditions INM Aircraft Part 36 Arrivals Takeoffs All Operations Type Category Stage Day Eve Night Total Day Eve Night Total Day Eve Night Total 707QN Heavy EM2 Jet Q15 Jet Q7 Jet Q9 Jet QF Jet Jet B2 Jet The average day data is defined as the total data for all available days divided by the number of days available. This process eliminates the extremes of operation that occur infrequently. Discussion with Mark Adams, Noise Management Bureau, May 26, 1995 at Noise Management Bureau offices. Los Angeles International Airport 12 LAX Master Plan Supplement to the Draft EIS/EIR
18 S-C1. Supplemental Aircraft Noise Technical Report Table S4 Average Annual Day Operations and Fleet Mix - Year 2000 Conditions INM Aircraft Part 36 Arrivals Takeoffs All Operations Type Category Stage Day Eve Night Total Day Eve Night Total Day Eve Night Total Jet Jet QN Jet Heavy Q Heavy Heavy A Heavy B Heavy Heavy SP Heavy PW Jet RR Jet Heavy CF6 Heavy JT9 Heavy Heavy A300 Heavy A310 Heavy A320 Jet A340 Jet A7D 6 Jet N/A BAE146 Jet BEC58P Prop N/A C130 Prop N/A CIT3 Jet CL600 Jet CL601 Jet CNA441 Prop N/A CNA500 Jet DC1010 Heavy DC1030 Heavy DC1040 Heavy DC3 Prop N/A DC870 Heavy DC8QN Heavy DC9Q7 Jet DC9Q9 Jet DHC6 Prop N/A DHC8 Prop N/A EMB120 Prop N/A F10062 Jet F28MK2 Jet FAL20 Jet GASEPF Prop N/A GASEPV Prop N/A GIIB Jet GIV Jet IA1125 Jet L1011 Heavy LEAR25 Jet LEAR35 Jet MD11GE Heavy MD11PW Heavy MD81 Jet MD82 Jet The A7D represents military jet activity. Los Angeles International Airport 13 LAX Master Plan Supplement to the Draft EIS/EIR
19 S-C1. Supplemental Aircraft Noise Technical Report Table S4 Average Annual Day Operations and Fleet Mix - Year 2000 Conditions INM Aircraft Part 36 Arrivals Takeoffs All Operations Type Category Stage Day Eve Night Total Day Eve Night Total Day Eve Night Total MD83 Jet MD9025 Jet MU3001 Jet SD330 Prop N/A SF340 Prop N/A Total Totals may not add due to rounding. Cell values of zero indicate less than ½ operation per day. Source: Landrum & Brown, 2002, based on LAWA 4 th Quarter 2000 INM input files. Interestingly, the number of operations by heavy jet aircraft that occur on the average annual day remain virtually the same as under the 1996 baseline condition, but the number of operations by propeller aircraft dropped substantially, with a comparable increase of activity by jet aircraft. Table S5, Average Annual Day Operations by Aircraft Category Baseline and Year 2000 Conditions, compares the two conditions. Table S5 Average Annual Day Operations by Aircraft Category Baseline and Year 2000 Conditions Aircraft 1996 Baseline Year 2000 Category Operations Percent of Mix Operations Percent of Mix Heavy Aircraft > 300,000# % % Jet Aircraft < 300,000# 1, % 1, % Propeller Aircraft % % Total 2, % 2, % Totals may not add due to rounding. Cell values of zero indicate less than ½ operation per day. Source: Landrum & Brown, 2002, based on LAWA 4 th Quarter 1996 and 2000 INM input files Aircraft Ground Activity Aircraft ground activity includes ground run-up activity, the testing of aircraft engines during or after maintenance. As disclosed by the Draft EIS/EIR, the Department of Airports (now LAWA) published a document in June of 1994 that reviewed its policies and detailed information relative to ground noise levels on and around the airport via a survey of airlines. That information was supplemented by a 1997 survey conducted for the Draft EIS/EIR. Similar information was not available for the Year 2000 conditions. Consequently, to estimate the run-up noise effects present during the Year 2000 conditions, the run-up operations projected for the future No Action/No Project Alternative condition was used as a foundation, and adjusted to reflect changing fleet mix and numbers of operations present in the Year 2000 conditions. Run-up locations will remain unchanged from 1996 baseline conditions. Since the number of run-up operations was not available, it is assumed that they will be in direct proportion to the change in operations volume. Because the locations have not changed and the mix of aircraft types are, on the whole, quieter than those present during the 1996 baseline condition presented in Figure 3, Current Ground Noise Pattern, of Appendix D, Aircraft Noise Technical Report, of the Draft EIS/EIR, the noise exposure pattern for 2000 run-up conditions will not be greater than that of the baseline condition, and Los Angeles International Airport 14 LAX Master Plan Supplement to the Draft EIS/EIR
20 S-C1. Supplemental Aircraft Noise Technical Report does not affect the location of CNEL contours beyond the airport boundary. The aircraft that conduct run-up activity were changed to reflect the fleet mix in use during Table S6, Alternative D 2015 (with Part 161 Mitigation) vs. Alternative D 2015 Without Mitigation, provides the number of operations by aircraft type assumed for future run-up conditions of the No Action/No Project Alternative. Table S6 Alternative D 2015 (with Part 161 Mitigation) vs. Alternative D 2015 Without Mitigation INM Aircraft Day Evening Night PW CF A MD11GE MD11PW MD Total Location Percent West Airfield Run-up Sites 47% Duration: Average Run-up East Airfield Run-up Site 53% 7.9 minutes Day: 7:00 a.m. to 6:59 p.m., Eve: 7:00 p.m. to 9:59 p.m., Night: 10:00 p.m. to 6:59 a.m. Totals may not add to 100 percent due to rounding. Source: Landrum & Brown, 2002; Landrum & Brown, based on interpolation of forecasted operations for Year 2000 conditions Relationship of 2000 Contours to 4th Quarter 2000 Report Contours The noise contours that result from application of the preceding information to the INM model differ from the noise contours presented by the LAWA Environmental Management Division-Noise Bureau in its Fourth Quarter Report for 2000 made to Caltrans. The difference is the result of two factors. First, LAWA does not include ground run-up noise in its quarterly report computations. Secondly, and of greater effect, LAWA modifies the contour output of the INM based on measurements made at 26 permanent monitoring sites throughout the airport environs. Historically, measured noise levels at LAX have been generally between 0 and 3 decibels higher than the modeled noise levels at the same locations. There is no correlation between the location of the noise measurement site and the degree of variance above or below the modeled noise level. The reasons for these differences have never been definitively resolved, but LAWA has taken the position that the contours based on measured data, being generally larger, are more conservative and consequently, of better use in the application of its noise mitigation program. This condition was described in detail in Section 4.1, Noise, of the Draft EIS/EIR for the 1996 baseline condition. On the other hand, the FAA prohibits the adjustment of noise contours to reflect measured noise levels in environmental documents sponsored by the agency 7. Consequently, the Supplement to the Draft EIS/EIR does not adjust modeled noise contour results to reflect field measurements. Furthermore, because the Supplement to the Draft EIS/EIR contours for alternatives reflect anticipated future conditions, there are no measurements with which to compare the contours. 7 See Federal Aviation Administration, Order D, Change 4, Policies and Procedure for Considering Environmental Impacts. June, Los Angeles International Airport 15 LAX Master Plan Supplement to the Draft EIS/EIR
21 S-C1. Supplemental Aircraft Noise Technical Report In future years, when measured noise levels become available for the projected conditions presented in this documentation, the comparison between modeled and measured noise levels will be made and then existing contours will be modified by future measurements. At the same time, modifications to the Aircraft Noise Mitigation Program (ANMP) (sound insulation) programmatic boundaries will be adjusted to reflect measured noise levels. Notably, the use of unadjusted noise contours for the environmental baseline and Year 2000 conditions will result in a larger amount of impact attributable to the future alternatives for CEQA purposes than would be the case if adjusted contours were used. 3. FUTURE AIRCRAFT OPERATING CONDITIONS Noise exposure patterns were projected for a No Action/No Project Alternative case and three build alternatives in two future target years. Contours were computed for both 2005 and All were presented in detail in Section 4.1, Noise, and Appendix D, Aircraft Noise Technical Report, of the Draft EIS/EIR. They are: No Action/No Project Alternative Alternative A - Five runways - three north and two south Alternative B - Five runways - two north and three south Alternative C - Four runways - two north and two south The No Action/No Project Alternative assumes the continued presence of the 1996 baseline runways and previously approved development, while Alternatives A, B, and C anticipate the movement of aircraft activity onto additional and/or relocated runways constructed through the intermediate and long-term (conceptual) course of the 15 year planning horizon. Alternatives A, B, and C assume the construction of runway facilities located either to the north of the existing north runway complex (Runways 6R/24L and 6L/24R) or to the south of the existing south runway complex (Runways 7R/25L and 7L/25R), as well as extensions and/or relocations of the existing runways, as described in Chapter 3, Alternatives, of the Draft EIS/EIR. In addition to the runway development actions, the taxiway system associated with each will change from 1996 baseline conditions, as will the locations designated for aircraft engine maintenance run-ups. The Supplement to the Draft EIS/EIR presents the results of an additional alternative (Alternative D) that has been developed in response to community comment and the modifications to the aviation system resulting from the incidents of September 11, Alternative D is similar to Alternative C in that it includes two runways in the north airfield and two runways in the south airfield. Unlike Alternative C, Alternative D calls for runways in the north airfield to be shifted to the south of their present location, away from the neighborhoods north of the airport. Runway 25L would be shifted 50 feet to the south to allow room to construct a taxiway between the two runways in the south airfield and substantially improve the operating efficiency of aircraft using that runway pair. Substantial changes would be required to the airport terminal areas to accommodate these modifications in an effort to minimize the expansion of new noise impacts in the area. Owing to the inability to complete any substantial construction by the Year 2005, Alternative D is evaluated only for its impacts during the year of its completion The effect of the peak year of the construction of Alternative D on aircraft noise levels will be presented in a later section of this document. The numbers of operations vary by alternative. In each case, the number of operations and their distribution throughout the average annual day were based on forecast schedules prepared for the Design Day condition of the Master Plan. Specific INM aircraft types selected to model the noise of each aircraft were based on current fleet configurations and aircraft acquisition trends among user carriers. Where the forecasts provided no guidance to the selection of specific INM aircraft types, the nationally dominant type(s) expected in the year of operation for each user group was selected. The numeric and time of day distribution of the Design Day forecasts of the Master Plan assume the presence of Visual Meteorological Conditions (VMC), the best available weather category when aircraft operate under Visual Flight Rules (VFR), which accommodates the greatest number of operations per Los Angeles International Airport 16 LAX Master Plan Supplement to the Draft EIS/EIR
22 S-C1. Supplemental Aircraft Noise Technical Report hour. The three weather-based operational conditions governing aircraft operations at the airport are defined as follows: VFR (VMC) Ceiling is above 5,000 feet, and visibility is three miles or more VFR (ILS/LDA) VFR use of Instrument Landing System or Locationally Displaced Approach technology, when ceiling is between 1,000 and 5,000 feet, and visibility is 3 miles or more IFR (IMC) Instrument Flight Rules during Instrument Meteorological Conditions when ceiling is less than 1,000 feet and/or visibility is less than 3 miles Using the Design Day forecasts, flight schedules are created based on the airlines flight patterns at the airport for the selected design day. The time-of-day distribution used represents the airlines estimates of when each flight will arrive or depart its gate. In reality, the ability of the flights to operate on time depends on many factors, including airborne travel times, taxi times, ground delay encountered at the origin airport, airspace delays, and ground delays at the destination airport. When the operational weather conditions drop below VMC, the capacity of the airport to accommodate the design day traffic decreases because some runways may be unusable or restricted due to inadequate spacing. During ILS/LDA and IMC conditions, the airport can only accept a certain number of arrivals, which may exceed the scheduled number of departures. When this happens, airlines must control the flow of traffic into the destination airport. Flow control is often accomplished by cancellation of flights if the delays become excessive. In the simulation model, the operating schedule accounts for the potential for such cancellations in assessing delays and capacity of conditions that are not VMC. Airspace/delay simulations (using the SIMMOD capacity model) were also prepared for two instrument flight conditions (ILS and IFR), 8 as well as for average east flow conditions (which are typically ILS), each of which will accommodate a lesser number of operations than VMC. The number of operations was modified during simulation modeling to reflect anticipated cancellations due to excessive delays during poor weather conditions. 9 The simulation modeling results, used to develop input to the INM, reflect the combination of all weather and service level conditions present during the forecast year of operation. The ratios between the resulting Design Day operations and the average annual level of operations, for each user group and alternative, were applied to reduce the number of operations to Design Day operations output from the simulation modeling to Average Annual Day operational levels used as input to the INM. This process annualizes operations, runway utilization, and time of day distributions for all cases enabling comparison of the environmental baseline, Year 2000 and future alternative cases. 3.1 Future Alternative D Conditions The conceptual plan (Year 2015) for Alternative D assumes the extension of Runway 6L/24R in the north airfield by 1,495 feet to the west along its present alignment, resulting in a total length of 10,420 feet. It would be used as the primary arrival runway in the north complex. Existing Runway 6R/24L will be reconstructed 338 feet south of its present centerline and extended 135 feet to the west and 1,280 feet to the east, with a width of 200 feet and total length of 11,700 feet. A center taxiway will be constructed between the two runways to minimize runway incursions. Runway 6R/24L will be used as the principal departure runway in the north airfield complex. Construction of the north airfield complex is planned during the later phases of the planning period and is not expected to require significant runway closures. In the south airfield, Runway 7L/25R will be unchanged. Runway 7R/25L will be reconstructed on an alignment 50 feet south of the existing runway centerline with a length of 11,090 feet and width of 200 feet. Its east end will be approximately 910 feet west of the east end of Runway 25R and the west end will be even with the existing 7L runway end. Construction in the south airfield is phased for early during the planning period (projected as the Year 2005) and will require the closure of Runway 7R/25L for approximately one year. As discussed in Section 3.1.5, Alternative D Aircraft Noise Pattern During Reconstruction of Runway 7R/25L, other runways will accommodate the traffic forecast for the construction year. 8 9 ILS (instrument landing system) operations occur during Visual Flight Rule conditions when approaches are made to two runways simultaneously. IFR (instrument flight rule) operations take place during poor weather conditions when ceiling and visibility minima for visual flight are not present. Cancellations during poor weather conditions are assumed to occur first among commuter and general aviation operations, then among regional (nearby origin/destination) operations, and not at all among long-haul domestic or international flights. Los Angeles International Airport 17 LAX Master Plan Supplement to the Draft EIS/EIR
23 S-C1. Supplemental Aircraft Noise Technical Report Other facilities will be added which will not directly impact upon the location or extent of the aircraft noise contours beyond the airport boundaries. These include the construction of Ground Run-up Enclosures (GREs) to house run-up operations at locations between the runways. The expansion of the terminal area to the west and the cargo area to the southeast may result in the modification of single-event noise levels from aircraft ground sources, such as taxiing and run-up noise, in adjacent off-airport areas Alternative D Aircraft Operations and Fleet Mix Owing to the limitations on operations imposed by the use of four runways rather than five, as proposed for Alternatives A and B, Alternative D will only accommodate operations counts similar to those of the No Action/No Project Alternative. The modifications of spacing between the runways will allow a limited increase in the number of annual operations (from 2,119 to 2,121). Table S7, 2015 Average Annual Day Operations and Fleet Mix Alternative D, provide the daily number and mix of aircraft operations forecast to occur under Alternative D conditions. The aircraft fleet mix is forecast to include less heavy aircraft than the No Action/No Project Alternative case. By 2015, the proportion of heavy jet operations will decline to 31 percent (643 of 2,121 total operations), compared to the No Action/No Project Alternative case which forecasts heavy jets to comprise 33 percent of the mix (706 of 2,119 operations). This reduction in the projected number of heavy jet aircraft operations is a function of the fewer number of wide-body gates available in the Alternative D terminal complex. Although the 643 heavy jet operations under Alternative D are less than are projected for the future No Action/No Project Alternative condition, they are nearly double the number of such flights present in the 1996 baseline (353) and Year 2000 (352 operations) conditions. The propeller aircraft category of Alternative D (519 operations) is forecast to continue to shrink from 1996 baseline (706 operations) and Year 2000 conditions (557 operations), but not to the level anticipated by the No Action/No Project Alternative for 2015 (468 operations). The absolute growth in the numbers of wide-body aircraft operations would more greatly affect the CNEL contours than the growth in propeller aircraft operations, relative to the No Action/No Project Alternative because each approach by a widebody aircraft is, with some exceptions, is louder than an approach by a propeller aircraft. Los Angeles International Airport 18 LAX Master Plan Supplement to the Draft EIS/EIR
24 S-C1. Supplemental Aircraft Noise Technical Report Table S Average Annual Day Operations and Fleet Mix Alternative D INM Aircraft Aircraft Part 36 Landings Takeoffs Total Operations Type Group Stage Day Eve Night Total Day Eve Night Total Day Eve Night Total 717 Jet ER Jet Jet B2 Jet Jet Jet B Heavy Heavy PW Jet RR Jet Heavy CF6 Heavy JT9 Heavy Heavy A300 Heavy A310 Heavy A319 Jet A320 Jet A330 Heavy A340 Heavy ATR42 Prop N/A ATR72 Prop N/A BAE146 Jet BAEJ31 Prop N/A BEC190 Prop N/A CL601 Jet CNA441 Prop N/A DC1030 Heavy DHC7 Prop N/A EMB110 Prop N/A EMB120 Prop N/A F10065 Jet FK50 Prop N/A FK70 Jet LEAR35 Jet MD11GE Heavy MD11PW Heavy MD81 Jet MD82 Jet MD83 Jet MD9028 Jet SA227 Prop N/A SAAB20 Prop N/A SD360 Prop N/A SF340 Prop N/A Total , , ,121 Day: 7:00 a.m. to 6:59 p.m., Eve: 7:00 p.m. to 9:59 p.m., Night: 10:00 p.m. to 6:59 a.m. Totals may not add up to 100 percent due to rounding. Source: Landrum & Brown, Alternative D Runway Utilization Figure S3, 2015 Airside Alternatives Runway Operating Plans, displays the general runway usage patterns of each future alternative for operation of the airport during the daytime hours in each of the four operating configurations identified for the facility. The information on the figure applies to the completed Alternative D airfield system development. Los Angeles International Airport 19 LAX Master Plan Supplement to the Draft EIS/EIR
25 S-C1. Supplemental Aircraft Noise Technical Report In all four operating configurations illustrated in Figure S3, the far north and far south (or outboard) runways are used principally for aircraft arrivals and the middle (inboard) runways are used primarily for aircraft departures. Mixed arrival and departure operations occur on all runways during VFR conditions, and on the outboard runways during ILS or IFR conditions. Forecast runway assignments are developed by the SIMMOD airfield and airspace simulation model, subject to constraints imposed on the modeling process by noise abatement measures. The function of the SIMMOD model is to assign individual flights to specific runways based largely on minimizing separation requirements between various aircraft types to increase operational efficiency and reduce delay. Table S8, 2015 Runway Utilization Percentages - Alternative D, presents the results of the simulation assignment of aircraft to runways. The airport s present noise abatement measures, which express a preference for over ocean procedures between midnight and 6:30 a.m., are reflected in the frequent use of runway 6R for arrival operations during the night hours. The dominant operating configuration during the period when over ocean procedures are in effect consists of approaches to the north inboard runway (Runway 6R) and departures from the south inboard runway (Runway 25R). Also reflected in the nighttime usage is the airport s policy that, to the extent practical, operations between 10:00 p.m. and 7:00 a.m. will be made to and from the inboard runways. Table S Runway Utilization Percentages - Alternative D Landings Takeoffs Runway Day Eve Night Total Day Eve Night Total 06L 1.7% 1.7% 1.1% 1.6% 0.1% 0.1% 0.0% 0.1% 06R 0.1% 0.0% 32.7% 3.9% 2.4% 2.6% 2.8% 2.5% 07L 0.0% 0.0% 4.4% 0.5% 2.0% 1.4% 2.0% 1.9% 07R 2.4% 2.3% 1.2% 2.3% 0.4% 0.8% 0.3% 0.4% 24L 8.4% 8.2% 14.1% 9.0% 39.8% 44.3% 29.4% 38.8% 24R 34.2% 33.8% 12.3% 31.6% 8.2% 7.6% 2.6% 7.3% 25L 47.9% 46.8% 16.0% 43.9% 8.6% 11.2% 3.4% 8.2% 25R 5.4% 7.1% 18.1% 7.2% 38.6% 32.1% 59.5% 40.8% Total 100.0% 100.0% 100.0% 100.0% 100.0% 100.0% 100.0% 100.0% Day: 7:00 a.m. to 6:59 p.m., Eve: 7:00 p.m. to 9:59 p.m., Night: 10:00 p.m. to 6:59 a.m. Totals may not add to 100 percent due to rounding. Source: Landrum & Brown, Alternative D Flight Track Usage The flight tracks and their usage for Alternative D are not substantially different from the utilization patterns of the No Action/No Project Alternative. They are illustrated in Figure S4, Alternative D Flight Tracks. The proportions of operations assigned to each flight track are indicated in Table S9, 2015 Flight Track Utilization Percentages-Alternative D. As is the case with all alternatives, the dominant flight paths that impact the noise exposure pattern at LAX are associated with the arrivals from the east. Departure operations along tracks to the east have little impact upon the CNEL noise contour locations, due to the infrequent use of east flow operations. Departure tracks to the west define the greatest area of the noise exposure pattern, but the least area of overflight impact because virtually all the area under the contours to the west is over the Santa Monica Bay. The dispersion of individual aircraft departure tracks around the flight paths will decrease in the future as the industry moves toward the development of Global Positioning System (GPS/FMS) flight procedures. Use of GPS procedures will result in the maintenance of more consistent flight paths than has been the case historically, because pilots (or on-board flight management systems (FMS)) will use specific geographic coordinates to navigate their way to and from the airport. Further, additional dispersion of flight tracks in the dominant departure direction lends no refinement to the definition of impacts, because there are no noise-sensitive properties directly west of the runways under the departure paths. Los Angeles International Airport 20 LAX Master Plan Supplement to the Draft EIS/EIR

26
27 S-C1. Supplemental Aircraft Noise Technical Report Los Angeles International Airport 22 LAX Master Plan Supplement to the Draft EIS/EIR

28
29 S-C1. Supplemental Aircraft Noise Technical Report Los Angeles International Airport 24 LAX Master Plan Supplement to the Draft EIS/EIR
30 S-C1. Supplemental Aircraft Noise Technical Report Table S Flight Track Utilization Percentages Alternative D Arrivals Departures Runway Track Day Eve Night Total Runway Track Day Eve Night Total 06L A6L1 0.9% 1.0% 0.8% 0.9% 06L D6LX 0.1% 0.1% 0.0% 0.1% 06L A6L2 0.2% 0.0% 0.0% 0.1% 06R D6R0 0.5% 0.8% 0.2% 0.5% 06L A6L6 0.0% 0.0% 0.0% 0.0% 06R D6R1 0.6% 0.5% 0.7% 0.6% 06L A6L7 0.6% 0.7% 0.3% 0.6% 06R D6R5 0.0% 0.0% 1.4% 0.2% 06R A6R1 0.0% 0.0% 32.2% 3.8% 06R D6R6 0.8% 0.6% 0.4% 0.7% 06R A6R2 0.0% 0.0% 0.2% 0.0% 06R D6RW 0.3% 0.4% 0.1% 0.3% 06R A6R7 0.0% 0.0% 0.3% 0.0% 06R D6RX 0.2% 0.2% 0.1% 0.2% 07L A7L1 0.0% 0.0% 4.0% 0.5% 07L D7L4 0.8% 0.5% 0.2% 0.7% 07L A7L6 0.0% 0.0% 0.1% 0.0% 07L D7L5 1.0% 0.7% 1.6% 1.0% 07L A7L7 0.0% 0.0% 0.3% 0.0% 07L D7LY 0.1% 0.1% 0.1% 0.1% 07R A7R1 1.3% 1.1% 0.6% 1.2% 07L D7LZ 0.2% 0.1% 0.1% 0.2% 07R A7R2 0.1% 0.0% 0.0% 0.0% 07R D7R1 0.0% 0.0% 0.0% 0.0% 07R A7R5 0.1% 0.0% 0.0% 0.1% 07R D7R4 0.0% 0.0% 0.0% 0.0% 07R A7R6 0.2% 0.2% 0.1% 0.2% 07R D7R5 0.1% 0.4% 0.2% 0.1% 07R A7R7 0.7% 1.0% 0.5% 0.8% 07R D7R6 0.0% 0.0% 0.0% 0.0% 24L A4L0 1.4% 0.6% 3.2% 1.5% 07R D7RV 0.0% 0.0% 0.0% 0.0% 24L A4L1 6.5% 7.6% 4.3% 6.5% 07R D7RW 0.1% 0.1% 0.0% 0.1% 24L A4L2 0.4% 0.0% 2.4% 0.6% 07R D7RX 0.1% 0.1% 0.0% 0.1% 24L A4L7 0.0% 0.0% 4.3% 0.5% 07R D7RZ 0.1% 0.1% 0.1% 0.1% 24R A4R0 3.3% 3.3% 1.6% 3.1% 24L D4L0 3.5% 10.7% 1.9% 4.2% 24R A4R1 11.9% 5.5% 3.9% 9.7% 24L D4L1 12.8% 12.2% 11.3% 12.5% 24R A4R2 3.9% 2.4% 1.3% 3.3% 24L D4L4 0.1% 0.0% 0.0% 0.1% 24R A4R3 0.1% 0.0% 0.0% 0.1% 24L D4L5 0.9% 0.7% 2.4% 1.1% 24R A4R4 1.9% 1.3% 0.0% 1.6% 24L D4L6 12.6% 9.7% 4.2% 11.1% 24R A4R6 0.0% 0.0% 0.0% 0.0% 24L D4LN 0.0% 0.0% 3.9% 0.6% 24R A4R7 13.2% 21.3% 5.6% 13.8% 24L D4LW 4.5% 4.3% 2.7% 4.2% 25L A5L0 4.4% 5.9% 1.0% 4.3% 24L D4LX 5.4% 6.5% 3.0% 5.2% 25L A5L1 5.7% 6.2% 2.4% 5.4% 24R D4R0 5.7% 3.7% 0.9% 4.8% 25L A5L2 1.4% 1.1% 0.5% 1.2% 24R D4RW 0.9% 3.1% 0.4% 1.1% 25L A5L3 1.7% 0.1% 0.0% 1.2% 24R D4RX 1.5% 0.7% 1.3% 1.4% 25L A5L4 14.9% 14.6% 5.8% 13.8% 25L D5L1 0.4% 0.6% 0.0% 0.3% 25L A5L5 1.8% 1.5% 0.0% 1.6% 25L D5L4 2.7% 0.0% 0.6% 2.1% 25L A5L6 4.6% 4.0% 0.6% 4.0% 25L D5L5 1.1% 4.8% 1.3% 1.5% 25L A5L7 13.3% 13.3% 5.7% 12.4% 25L D5L6 0.2% 0.0% 0.0% 0.2% 25R A5R0 0.5% 0.7% 0.5% 0.6% 25L D5LV 0.3% 0.6% 0.0% 0.3% 25R A5R1 0.1% 0.0% 0.0% 0.1% 25L D5LW 0.9% 1.3% 0.5% 0.9% 25R A5R4 0.2% 0.0% 9.2% 1.2% 25L D5LX 1.3% 1.9% 0.0% 1.1% 25R A5R6 0.0% 0.0% 2.7% 0.3% 25L D5LZ 1.7% 1.9% 1.0% 1.7% 25R A5R7 4.6% 6.5% 5.7% 5.1% 25R D5R4 12.9% 11.7% 3.5% 11.4% Total 100.0% 100.0% 100.0% 100.0% 25R D5R5 20.8% 15.2% 17.2% 19.7% 25R D5RN 0.0% 0.0% 34.9% 5.0% 25R D5RY 1.7% 2.0% 1.2% 1.6%. 25R D5RZ 3.1% 3.1% 2.8% 3.1% Total 100.0% 100.0% 100.0% 100.0% Day: 7:00 a.m. to 6:59 p.m., Eve: 7:00 p.m. to 9:59 p.m., Night: 10:00 p.m. to 6:59 a.m. Totals may not add to 100 percent due to rounding Source: Landrum & Brown, Alternative D Run-up Noise Changes in the Alternative D airfield layout and operating procedures will include relocation of run-up areas. Two sites in the interior of the airfield are planned for run-up use in Their locations would result in their having no effect on the noise exposure contour of 65 CNEL beyond the airport boundary. All sites would include ground run-up enclosures. Since the number of run-up operations was not forecast, it is assumed that they will increase in direct proportion to the increase in aircraft operations volume from the No Action/No Project Alternative Los Angeles International Airport 25 LAX Master Plan Supplement to the Draft EIS/EIR
31 S-C1. Supplemental Aircraft Noise Technical Report conditions. The aircraft that conduct run-up activity will change to reflect the fleet mix in use in Table S10, Run-Up Operations Summary Alternative D, provides a summary of the run-up activity assumed for Alternative D in the forecast year. Table S10 Run-up Operations Summary Alternative D INM Aircraft Day Evening Night PW CF A MD11GE MD11PW MD Total Location Percent Average Run-up Duration: East Run-up Site 50% 6.0 minutes West Run-up Site 50% Day: 7:00 a.m. to 6:59 p.m., Eve: 7:00 p.m. to 9:59 p.m., Night: 10:00 p.m. to 6:59 a.m. Totals may not add due to rounding. Source: Landrum & Brown, Alternative D, Aircraft Noise Pattern During Reconstruction of Runway 7R/25L The noise contour patterns presented in the body of the Supplement to the Draft EIS/EIR in Section 4.2, Land Use, and referenced in Section 4.1, Noise, indicate the expected pattern of aircraft noise dispersion during the Year During the period before 2015, various construction projects will result in temporary modifications to the noise patterns of Alternative D. This section provides an overview of the expected pattern changes that might be expected during these periods of construction. Reconstruction of the north airfield proposed by Alternative D would be accomplished without substantive effect on the operation of the airport. Relocated Runway 24L would be constructed prior to the closing of current Runway 24L, and any construction activity that may affect the utility of Runway 24R will be accomplished during the night hours when that runway is not used as part of the noise abatement program of the airport. In contrast, the reconstruction of Runway 25L, planned for the 2005 time frame, will require substantial changes to the way the airport is operated. It is anticipated that Runway 25L will be closed for a period of approximately one year while it is being shifted 50 feet to the south to accommodate a center taxiway between the two runways in the south airfield complex. During the period of closure, the airport would have only three serviceable runways. It is expected that the flight schedule for the construction period would be reduced to a level at or near the VFR capacity of the airport, and that most of the flights eliminated would be propeller and private jet aircraft. Runway 25R is expected to accommodate both landings and takeoffs, while the runways in the north airfield would continue to operate as they are now used - the outboard runway would predominantly serve landings and the inboard runway would predominantly serve takeoffs. Most heavy aircraft would be assigned Runway 25R for landings because the 5 mile separation requirements between heavy jet landings would allow controllers to launch westerly departures in between the heavy arrivals. The runway utilization proportions anticipated during the relocation of Runway 7R/24L is provided in Table S11, Alternative D dba SEL Part 161 Mitigation Contour vs. Unmitigation Alternative D dba SEL. Los Angeles International Airport 26 LAX Master Plan Supplement to the Draft EIS/EIR
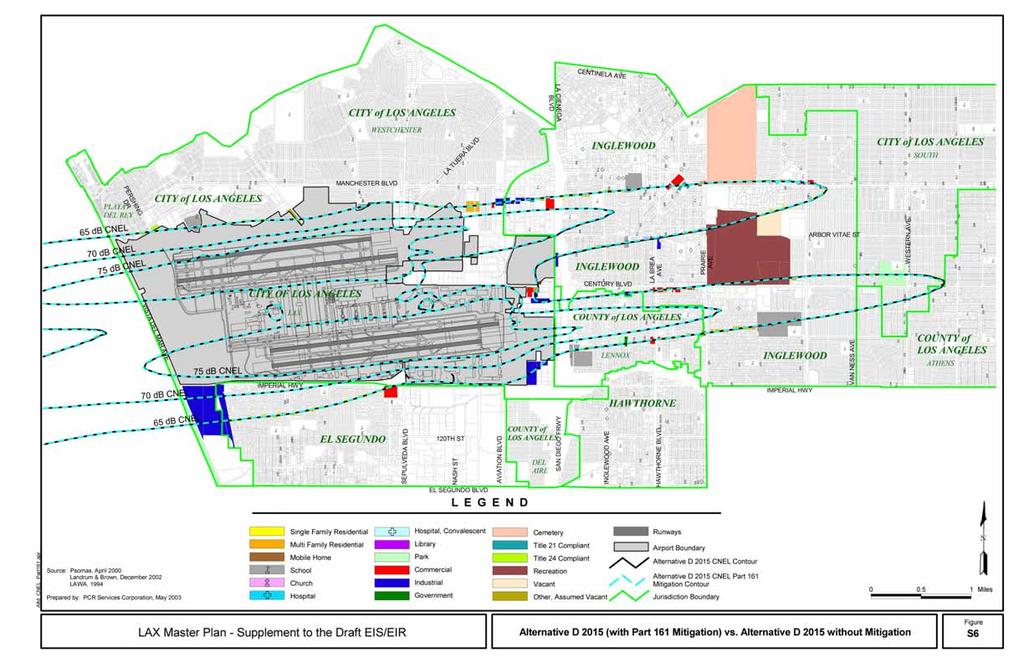
32 S-C1. Supplemental Aircraft Noise Technical Report Table S11 Alternative D dba SEL Part 161 Mitigation Contour vs. Unmitigation Alternative D dba SEL Landings Takeoffs Runway Day Eve Night Total Day Eve Night Total 06L 2.8% 2.7% 0.6% 2.4% 0.3% 0.1% 0.0% 0.2% 06R 0.0% 0.0% 24.8% 4.0% 2.8% 2.7% 3.1% 2.8% 07L 1.9% 1.8% 4.6% 2.3% 1.8% 1.0% 1.8% 1.7% 07R - NA - - NA - - NA - - NA - - NA - - NA - - NA - - NA - 24L 8.2% 12.7% 24.6% 11.6% 52.6% 55.9% 35.9% 50.6% 24R 51.7% 48.7% 14.0% 45.2% 5.0% 10.1% 0.1% 5.0% 25L - NA - - NA - - NA - - NA - - NA - - NA - - NA - - NA - 25R 35.4% 34.1% 31.4% 34.5% 37.5% 30.3% 59.0% 39.7% Total 100.0% 100.0% 100.0% 100.0% 100.0% 100.0% 100.0% 100.0% Day: 7:00 a.m. to 6:59 p.m., Eve: 7:00 p.m. to 9:59 p.m., Night: 10:00 p.m. to 6:59 a.m. Totals may not add to 100 percent due to rounding. Source: Landrum & Brown, 2002 Figure S5, Alternative D Noise Exposure During Relocation of Runway 7R/25L, indicates the pattern of noise that might be expected during the construction period. The notable difference between the construction pattern and the later 2015 noise exposure pattern is a northward shift and slight lengthening of the noise pattern leading to the south runways, reflecting the reassignment of approaches to the inboard runway. East of the north runways, the contour is slightly longer than is anticipated in Additionally, the contours north and south of the airport, in areas principally exposed to noise associated with takeoffs or the use of thrust reversal during landing, the contours are shifted slightly to the north as takeoffs are reassigned to the north from the south runway complex Alternative D Mitigation As was the case with Alternatives A, B, and C the extension of Runway 24L to the east will result in a slight shift of a bulge of significant noise levels by one to two thousand feet to the east, into a residential area that would not otherwise be exposed to levels of 65 CNEL. As discussed in Section 4.1, Noise, of the Draft EIS/EIR, the retention of the environmental baseline or No Action/No Project Alternative runway end as a takeoff initiation position for aircraft capable of using the available runway length for departure (9,100 feet) would not substantially relieve that increase. The aircraft that require longer runway lengths would continue to create the bulge, while the use of the existing runway end for departures by lighter aircraft would cause a portion of the bulge to remain in the area near Sepulveda Boulevard and La Tijera Boulevard (Figure S4.2-12, Alternative D 2015 vs Baseline Areas Newly Exposed, in Section 4.2, Land Use, of the Supplement to the Draft EIS/EIR). The first phase of development of Alternative D also includes the relocation of Runway 25L/7R 50 feet to the south. If the runway were limited to arrival operations with occasional departures, as was suggested for 2015 in the other build alternatives, the noise pattern along the approach from the east to the south complex would shift by 50 feet to the south. During the final phase of development, the runways in the north airfield complex would be relocated. At that time, the contour along the north side of the airport would shift south by 100 to 500 feet in those areas exposed predominantly to departure noise west of Lincoln Boulevard. East of the airport, the contour east of the north runway complex would shift northward in close alignment to the No Action/No Project Alternative contour (Figure S4.2-12, presented in Section 4.2, Land Use, of the Supplement to the Draft EIS/EIR). The measure is expected to delay each aircraft departure operation by 2 to 3 minutes, which equates to as much $35,000,000 total in To continue the noise abatement techniques assumed for both 2005 and 2015, new/replacement FMS/GPS or RNAV procedures are assumed for westerly departures from each relocated runway end. These procedures would be developed to accomplish the same goal as the existing measures - that aircraft reach the coastline before making turns. In 2000, LAWA signed a Memorandum of Understanding with the City of Inglewood that addressed noise mitigation actions east of the airport. In terms of its effect on noise distribution patterns east of the airport, Los Angeles International Airport 27 LAX Master Plan Supplement to the Draft EIS/EIR
33 S-C1. Supplemental Aircraft Noise Technical Report the most important of the terms of that agreement was a commitment by LAWA to undertake a Federal Aviation Regulation Part 161 Access Restriction Study to evaluate the effects of making the current Over- Ocean procedures mandatory. The intent of that action would be to eliminate pilot flexibility to select an easterly departure during periods when the over-ocean procedures are in effect. In summary, the overocean procedures are applicable between the hours of midnight and 6:30 a.m., when winds and visibility allow both arrivals and takeoffs to be made over the ocean. Currently, pilots have the flexibility to select an easterly takeoff over the city when over-ocean procedures are in effect if the weight of the aircraft is too great to safely take off to the west with winds from the east. Essentially this condition happens when large heavily loaded wide-body aircraft, bound for Asian or Australian destinations, take off with winds between 0 and 10 knots from the east. LAWA recently assessed the frequency of this occurrence and found that over a period of 18 months, 82 such takeoffs occurred. The effect on the noise distribution pattern is presented in Figure S6 Alternative D 2015 (with Part 161 Mitigation) vs. Alternative D 2015 Without Mitigation. It is extremely important that the mandatory use of over-ocean procedures not be overestimated. The application of the measure does not imply that all easterly departures between midnight and 6:30 a.m. would be eliminated. During periods of Santa Ana weather when easterly winds exceed 10 knots, or during periods of coastal fog when the visibility is severely limited west of the airport, safety considerations will require the use of east flow operations, and all traffic will take off to the east. Such conditions now account for the great majority of easterly takeoffs that occur during the year. No change is proposed for these existing procedures during high wind or low visibility periods. Los Angeles International Airport 28 LAX Master Plan Supplement to the Draft EIS/EIR

34
35 S-C1. Supplemental Aircraft Noise Technical Report Los Angeles International Airport 30 LAX Master Plan Supplement to the Draft EIS/EIR
36
37 S-C1. Supplemental Aircraft Noise Technical Report Los Angeles International Airport 32 LAX Master Plan Supplement to the Draft EIS/EIR
38 S-C1. Supplemental Aircraft Noise Technical Report 4. NOISE SCREENING OF ALTERNATIVE D TRACK CHANGES ABOVE 3,000 FEET ALTITUDE The FAA has provided a methodology to assess the effects of noise level changes associated with air traffic procedure changes at altitudes greater than 3,000 feet above an airport s elevation. 10 This methodology requires that changes in aircraft noise be evaluated if the noise associated with jet aircraft weighing more than 75,000 pounds changes by more than 5 decibels of DNL (CNEL in California) over residential areas and the aircraft is in flight at an altitude between 3,000 and 18,000 feet above the airport. The use of this process was retained for the evaluation of the effects of Alternative D changes to maintain consistency with similar evaluations conducted for all other alternatives presented in the Draft EIS/EIR. The applicable air traffic action associated with this project is the establishment of approach and departure flight tracks to and from all new and/or relocated runways. The flight tracks assumed for the runways are indicated on Figure S4. Since flight tracks of the new and relocated runways will be located within close proximity to the present flight tracks of the existing runways, and the aircraft activity on these tracks will not result in an increase of 5 decibels of DNL (CNEL) over any residential area when the aircraft are above 3,000 feet, no further noise review under this guideline is required. During preparation of the Draft EIS/EIR, the FAA independently modified departure tracks for westerly operations to better separate takeoffs by large and small aircraft. As a result of those modifications, propeller aircraft were routed parallel to the coastline, passing South Bay communities and ultimately turning back over land in the Torrance area. The South Bay communities vigorously expressed their displeasure with the revised measures and the FAA has consequently readjusted the measures to require propeller aircraft bound to airports other than Ontario International and Palm Springs to follow an ocean routing to clear the communities before turning east. The Ontario and Palm Springs departures remain on the departure route over Torrance. None of these actions is a result of Master Plan actions, but information on the changes was presented in the Draft EIS/EIR and here to assist public understanding of continuing evaluation and adjustments of airspace routings that are independent of the proposed development actions. Evaluation of these actions in the Supplement to the Draft EIS/EIR is not required under NEPA and CEQA guidance. 5. LOCATION IMPACT ANALYSIS As described in Appendix D, Aircraft Noise Technical Report, of the Draft EIS/EIR, the INM has the capability to compute noise characteristics of individual locations in the airport environs. Subsequent to the release of the Draft EIS/EIR, the listing of noise sensitive facilities in the airport environs was reviewed to eliminate duplications and add facilities that were omitted during earlier surveys. As a supplement to the contour analyses presented elsewhere, 646 separate individual sites located off the airport were identified for additional evaluation. This number has been reduced from the number of grid points evaluated during the Draft EIS/EIR through the elimination of duplications of multiple points on the same site. These sites consisted of four types, as follows: 26 locations of permanent noise monitors operated by the Noise Management Bureau near the airport. 406 noise-sensitive facilities (churches, schools, nursing homes, parks, etc.), identified as of February 2002, within the airport environs and further detailed in the report on existing land use conditions. 31 sites selected to evaluate the combined effect of aircraft and surface traffic noise levels on noisesensitive areas. 180 sites located on a regular grid of points having spacing intervals of 3,000 feet along both northsouth and east-west axes, generally patterned to include more than the land area within the anticipated 60 CNEL exposure level of the combined alternatives. These are used to assist estimation of various supplemental noise metrics throughout the study area. While noise was 10 Air Traffic Noise Screening Model, Version 2.0, FAA Office of Environment and Energy, January Los Angeles International Airport 33 LAX Master Plan Supplement to the Draft EIS/EIR
39 S-C1. Supplemental Aircraft Noise Technical Report computed at all locations on the regular grid, only those sites that are located over land and off the airport are reported. CNEL data was developed for the measurement sites for comparison with measured noise levels of the 1996 baseline and Year 2000 conditions. Daily average noise levels (24 hour L eq ) was computed for aircraft noise at each of the roadway noise locations as input information to combine with roadway noise for a description of the combined effects of both noise sources on 31 noise-sensitive locations near roadways. Information about these locations is reported in Section 4.1, Noise, of the Supplement to the Draft EIS/EIR. At the remaining 622 locations, several noise metrics were computed for comparison among themselves and among alternatives. A listing and brief description of the sites is provided in Table S12, LAX Master Plan Supplement to the Draft EIS/EIR Regular and Noise Sensitive Grid Point Locations. The sites are located by X-Y coordinates (in feet) centered on the airport at the Tom Bradley International Terminal. Figure S7, Regularly Spaced Grid Point Locations, indicates the locations of the regularly spaced grid points. Figure S8, Noise Sensitive Schools, shows the location of 111 schools in the study area, Figure S9, Noise Sensitive Churches, indicates the location of 219 churches in the study area, and Figure S10, Miscellaneous Noise Sensitive Facilities, shows the location of 11 hospitals, 10 libraries, 27 nursing homes, and 29 parks in the study area at which noise levels were computed. Several different metrics, previously explained, were computed for each grid point or noise-sensitive facility location. The results of these calculations are presented in Tables S13 through S19, LAX Master Plan Supplement to the Draft EIS/EIR Regular and Special Grid Point Assessment - Aircraft CNEL, Comparison of Build Alternatives to 1996 Baseline, Year 2000 Conditions and 2015 No Action/No Project Alternative; Regular and Special Grid Point Assessment - Aircraft DNL, Comparison of Build Alternatives to 1996 Baseline, Year 2000 Conditions and 2015 No Action/No Project Alternative; Regular and Special Grid Point Assessment - Aircraft L max, Comparison of Build Alternatives to 1996 Baseline, Year 2000 Conditions and 2015 No Action/No Project Alternative; Regular and Special Grid Point Assessment - Aircraft Time in Minutes Above 65 dba, Comparison of Build Alternatives to 1996 Baseline, Year 2000 Conditions and 2015 No Action/No Project Alternative; Regular and Special Grid Point Assessment - Aircraft Time in Minutes Above 75 dba, Comparison of Build Alternatives to 1996 Baseline, Year 2000 Conditions and 2015 No Action/No Project Alternative; Regular and Special Grid Point Assessment - Aircraft Time in Minutes Above 85 dba, Comparison of Build Alternatives to 1996 Baseline, Year 2000 Conditions and 2015 No Action/No Project Alternative; and Regular and Special Grid Point Assessment - Aircraft Time in Minutes Above 95 dba, Comparison of Build Alternatives to 1996 Baseline, Year 2000 Conditions and 2015 No Action/No Project Alternative, respectively. These tables present noise level information for not only the 1996 baseline conditions, but also the Year 2000 Conditions and No- Action/No-Project Alternative and all build alternative conditions for future Year It is important to emphasize that although the variety of metrics provide interesting information, only CNEL has a regulatory function in decision making on environmental projects under both NEPA and CEQA. SEL, TA, and L max data are used in the definition of thresholds of significance for CEQA single event impacts. Based upon the information provided in Table S13, relative to CNEL at each of the grid point locations, a determination may be made of which locations are significantly impacted under the standard thresholds of compatibility used for environmental considerations of aircraft noise. Table S20, LAX Master Plan Supplement to the Draft EIS/EIR Grid Points Within Future Alternatives That Experience Significant or Other Reportable Increases in CNEL-Comparison of Future Alternatives to 1996 Baseline, Year 2000 Conditions, and 2015 No Action/No Project Alternative, indicates those 38 locations that are exposed to at least 65 decibels of CNEL under the build alternative that experience a significant increase of 1.5 decibels of CNEL associated with the proposed action for the various build alternatives. 11 Only one location, school site PVS107 located near the relocated east departure ends in the north runway complexes of each alternative, is impacted by all four build alternatives. 11 The Federal Interagency Committee on Noise determined that an increase of DNL (CNEL in California) occurs as the result of a federal action, and that the location of that change falls within the 65 DNL contour of the proposed action, then a significant impact is presumed to exist. Where such impacts are present, then any area that is exposed to an increase of 3.0 DNL or more that falls between the 60 and 65 DNL contours, must also be reported, although it is not considered to be significantly impacted. Los Angeles International Airport 34 LAX Master Plan Supplement to the Draft EIS/EIR
40 S-C1. Supplemental Aircraft Noise Technical Report Table S12 LAX Master Plan Supplement to the Draft EIS/EIR Regular and Noise Sensitive Grid Point Locations Grid Cell ID Code Use X Distance Y Distance Owner of Record per County Assessor C08 Regular Grid Not Applicable C09 Regular Grid Not Applicable D06 Regular Grid Not Applicable D07 Regular Grid Not Applicable D08 Regular Grid Not Applicable D09 Regular Grid Not Applicable E07 Regular Grid Not Applicable E08 Regular Grid Not Applicable E09 Regular Grid Not Applicable F02 Regular Grid Not Applicable F03 Regular Grid Not Applicable F07 Regular Grid Not Applicable F08 Regular Grid Not Applicable F09 Regular Grid Not Applicable G01 Regular Grid Not Applicable G02 Regular Grid Not Applicable G03 Regular Grid Not Applicable G07 Regular Grid Not Applicable G08 Regular Grid Not Applicable G09 Regular Grid Not Applicable H01 Regular Grid Not Applicable H02 Regular Grid Not Applicable H03 Regular Grid Not Applicable H07 Regular Grid Not Applicable H08 Regular Grid Not Applicable H09 Regular Grid Not Applicable I01 Regular Grid Not Applicable I02 Regular Grid Not Applicable I03 Regular Grid Not Applicable I07 Regular Grid Not Applicable I08 Regular Grid Not Applicable I09 Regular Grid Not Applicable J01 Regular Grid Not Applicable J02 Regular Grid Not Applicable J03 Regular Grid Not Applicable J07 Regular Grid Not Applicable J08 Regular Grid Not Applicable J09 Regular Grid Not Applicable K01 Regular Grid Not Applicable K02 Regular Grid Not Applicable K03 Regular Grid Not Applicable K05 Regular Grid Not Applicable K07 Regular Grid Not Applicable K08 Regular Grid Not Applicable K09 Regular Grid Not Applicable L01 Regular Grid Not Applicable L02 Regular Grid Not Applicable L03 Regular Grid Not Applicable L04 Regular Grid Not Applicable L05 Regular Grid Not Applicable L06 Regular Grid Not Applicable L07 Regular Grid Not Applicable L08 Regular Grid Not Applicable L09 Regular Grid Not Applicable M01 Regular Grid Not Applicable M02 Regular Grid Not Applicable M03 Regular Grid Not Applicable M04 Regular Grid Not Applicable M05 Regular Grid Not Applicable Los Angeles International Airport 35 LAX Master Plan Supplement to the Draft EIS/EIR
41 S-C1. Supplemental Aircraft Noise Technical Report Table S12 LAX Master Plan Supplement to the Draft EIS/EIR Regular and Noise Sensitive Grid Point Locations Grid Cell ID Code Use X Distance Y Distance Owner of Record per County Assessor M06 Regular Grid Not Applicable M07 Regular Grid Not Applicable M08 Regular Grid Not Applicable M09 Regular Grid Not Applicable N01 Regular Grid Not Applicable N02 Regular Grid Not Applicable N03 Regular Grid Not Applicable N04 Regular Grid Not Applicable N05 Regular Grid Not Applicable N06 Regular Grid Not Applicable N07 Regular Grid Not Applicable N08 Regular Grid Not Applicable N09 Regular Grid Not Applicable O01 Regular Grid Not Applicable O02 Regular Grid Not Applicable O03 Regular Grid Not Applicable O04 Regular Grid Not Applicable O05 Regular Grid Not Applicable O06 Regular Grid Not Applicable O07 Regular Grid Not Applicable O08 Regular Grid Not Applicable O09 Regular Grid Not Applicable P01 Regular Grid Not Applicable P02 Regular Grid Not Applicable P03 Regular Grid Not Applicable P04 Regular Grid Not Applicable P05 Regular Grid Not Applicable P06 Regular Grid Not Applicable P07 Regular Grid Not Applicable P08 Regular Grid Not Applicable P09 Regular Grid Not Applicable Q01 Regular Grid Not Applicable Q02 Regular Grid Not Applicable Q03 Regular Grid Not Applicable Q04 Regular Grid Not Applicable Q05 Regular Grid Not Applicable Q06 Regular Grid Not Applicable Q07 Regular Grid Not Applicable Q08 Regular Grid Not Applicable Q09 Regular Grid Not Applicable R01 Regular Grid Not Applicable R02 Regular Grid Not Applicable R03 Regular Grid Not Applicable R04 Regular Grid Not Applicable R05 Regular Grid Not Applicable R06 Regular Grid Not Applicable R07 Regular Grid Not Applicable R08 Regular Grid Not Applicable R09 Regular Grid Not Applicable S01 Regular Grid Not Applicable S02 Regular Grid Not Applicable S03 Regular Grid Not Applicable S04 Regular Grid Not Applicable S05 Regular Grid Not Applicable S06 Regular Grid Not Applicable S07 Regular Grid Not Applicable S08 Regular Grid Not Applicable S09 Regular Grid Not Applicable T01 Regular Grid Not Applicable Los Angeles International Airport 36 LAX Master Plan Supplement to the Draft EIS/EIR
42 S-C1. Supplemental Aircraft Noise Technical Report Table S12 LAX Master Plan Supplement to the Draft EIS/EIR Regular and Noise Sensitive Grid Point Locations Grid Cell ID Code Use X Distance Y Distance Owner of Record per County Assessor T02 Regular Grid Not Applicable T03 Regular Grid Not Applicable T04 Regular Grid Not Applicable T05 Regular Grid Not Applicable T06 Regular Grid Not Applicable T07 Regular Grid Not Applicable T08 Regular Grid Not Applicable T09 Regular Grid Not Applicable U01 Regular Grid Not Applicable U02 Regular Grid Not Applicable U03 Regular Grid Not Applicable U04 Regular Grid Not Applicable U05 Regular Grid Not Applicable U06 Regular Grid Not Applicable U07 Regular Grid Not Applicable U08 Regular Grid Not Applicable U09 Regular Grid Not Applicable V01 Regular Grid Not Applicable V02 Regular Grid Not Applicable V03 Regular Grid Not Applicable V04 Regular Grid Not Applicable V05 Regular Grid Not Applicable V06 Regular Grid Not Applicable V07 Regular Grid Not Applicable V08 Regular Grid Not Applicable V09 Regular Grid Not Applicable W01 Regular Grid Not Applicable W02 Regular Grid Not Applicable W03 Regular Grid Not Applicable W04 Regular Grid Not Applicable W05 Regular Grid Not Applicable W06 Regular Grid Not Applicable W07 Regular Grid Not Applicable W08 Regular Grid Not Applicable W09 Regular Grid Not Applicable X01 Regular Grid Not Applicable X02 Regular Grid Not Applicable X03 Regular Grid Not Applicable X04 Regular Grid Not Applicable X05 Regular Grid Not Applicable X06 Regular Grid Not Applicable X07 Regular Grid Not Applicable X08 Regular Grid Not Applicable X09 Regular Grid Not Applicable Y01 Regular Grid Not Applicable Y02 Regular Grid Not Applicable Y03 Regular Grid Not Applicable Y04 Regular Grid Not Applicable Y05 Regular Grid Not Applicable Y06 Regular Grid Not Applicable Y07 Regular Grid Not Applicable Y08 Regular Grid Not Applicable Y09 Regular Grid Not Applicable Z01 Regular Grid Not Applicable Z02 Regular Grid Not Applicable Z03 Regular Grid Not Applicable Z04 Regular Grid Not Applicable Z05 Regular Grid Not Applicable Z06 Regular Grid Not Applicable Los Angeles International Airport 37 LAX Master Plan Supplement to the Draft EIS/EIR
43 S-C1. Supplemental Aircraft Noise Technical Report Table S12 LAX Master Plan Supplement to the Draft EIS/EIR Regular and Noise Sensitive Grid Point Locations Grid Cell ID Code Use X Distance Y Distance Owner of Record per County Assessor Z07 Regular Grid Not Applicable Z08 Regular Grid Not Applicable Z09 Regular Grid Not Applicable CH006 Church Alfredo Figueroa CH008 Church American Baptist Churches of The CH011 Church Amos Temple Christian Methodist CH012 Church Andrew & Carol Hammitt CH019 Church Archdiocese of LA Educ & Welfare Corp CH020 Church Archdiocese of LA Educ & Welfare Corp CH022 Church Archdiocese of LA Educ & Welfare Corp CH025 Church Archdiocese of LA Educ & Welfare Corp CH026 Church Archdiocese of LA Educ & Welfare Corp CH030 Church Archdiocese of LA Educ & Welfare Corp CH031 Church Arthur McGlothen CH032 Church Assembly of Christian CH037 Church Bay-West LA Southern Crescent CH044 Church Beth Ezel Baptist Church CH047 Church Bethany Apostolic Church Inc CH048 Church Bethany Prayer Temple Church CH049 Church Bethel African Methodist CH052 Church Bethel Missionary Baptist Church CH053 Church Bethlehem Missionary Baptist Church CH056 Church Bill & Lillie English CH058 Church Bobby Sheffield CH060 Church Bright Throne Missionary Baptist Church CH062 Church Calvary Baptist Ch of Hawthorne CH067 Church Cedar Grove Baptist Church CH069 Church Central Baptist Church CH072 Church Christ Centered Penecostal Church CH075 Church Christian Reformed Board Of CH076 Church Christian Tabernacle Inc CH078 Church Christ's Community Church LA CH082 Church Church of God Pentecostal INC CH083 Church Church of Messiah Congregational CH087 Church Church of Religious Science of Inglewood CH094 Church Compton Ave Church of the CH096 Church Corinthian Baptist Church of Los Angeles CH097 Church Corp of the Presiding Bishop CH098 Church Corp of the Presiding Bishop CH099 Church Corp of the Presiding Bishop CH100 Church Council of Rehoboth Christian CH101 Church Covenant Presbyterian Church CH102 Church Creative Investment Group CH103 Church Crenshaw Christian Center Church CH107 Church Del Aire Assembly of God Inc CH108 Church Del Aire Baptist Church CH109 Church Del Rey Hills Evangelical Free Church CH116 Church Edmund Bussey Foundation CH118 Church Eighty-Eighth Street Temple Church of God CH119 Church El Segundo Christian Church CH120 Church El Segundo City CH121 Church El Segundo Congregation Of CH122 Church El Segundo Masonic Temple Assn CH129 Church Emmanuel Missionary Bay Greater CH132 Church Ernesto & Elsa Ballesteros CH133 Church Eternal Promise Baptist Church CH135 Church Evangelical Lutheran Messiah CH137 Church Evangelistic World Outreach Inc CH139 Church Faith Church of God In Christ Los Angeles International Airport 38 LAX Master Plan Supplement to the Draft EIS/EIR
44 S-C1. Supplemental Aircraft Noise Technical Report Table S12 LAX Master Plan Supplement to the Draft EIS/EIR Regular and Noise Sensitive Grid Point Locations Grid Cell ID Code Use X Distance Y Distance Owner of Record per County Assessor CH140 Church Faith Missionary Greater CH144 Church Faith United Methodist Church CH145 Church Faith Way Missionary Baptist Ch CH146 Church Faithful Central Missionary Baptist Church CH150 Church First Apostolic Church of Inglewood CH151 Church First Apostolic Church of Inglewood CH156 Church First Baptist Church CH157 Church First Baptist Church Westchester CH158 Church First Church of God of Los Angeles CH160 Church First Evangelical Lutheran CH162 Church First Hungarian Reformed Church of Los A CH163 Church First Love Ch of God In Christ CH164 Church First Methodist Ch of Inglewood CH165 Church First New Christian Fellowship CH166 Church First Presbyterian Church of Inglewood CH168 Church Fortieth Ch of Christ Scientist CH172 Church Freddie Blackshear CH173 Church Free Wesleyan Church Tonga of Am CH174 Church Freewill Missionary Baptist Church CH175 Church Frieda Rentie CH177 Church Full Christian Fellowship Center CH180 Church Full Gospel Community Prayer Center CH182 Church General Assembly Church of The CH183 Church George & Lula Clark CH185 Church Girls Club of Los Angeles Inc CH186 Church Gods House of Deliverance CH188 Church Good News Prayer Center Cogic CH189 Church Good Shepherd Church God In Christ Inc CH190 Church Good Shepherd Church Assembly of God CH191 Church Good Shepherd Church God Chris CH193 Church Good Shepherd Lutheran Church CH197 Church Gospel Temple Baptist Church CH199 Church Grace Church of the Nazarene CH201 Church Granville Winstead CH205 Church Greater Bethany Comm Church CH206 Church Greater Circle Mission Inc CH208 Church Greater Faith Missionary Baptist Church CH211 Church Greater Mt Olive Baptist Ch Inc CH213 Church Greater New Bethel Baptist Church Inc CH216 Church Greater True Vine Temple Christ Corp CH218 Church Grevillea Ave Church of Christ CH219 Church Guidance Church of Religious Science Inc CH221 Church Hart Evangelistic Musical CH222 Church Hawthorne Church of Christ CH225 Church Hawthorne United Methodist Church CH230 Church Hazel Kornegay CH231 Church Henry & Maxine Wagoner CH234 Church Holy Deliverance House Prayer Inc CH235 Church Holy Light Baptist Church of Los Angeles CH239 Church Holy Pilgrim Temple Church Of CH240 Church Holy Rock Baptist Church Inc CH241 Church Holy Trinity Lutheran Church CH244 Church Hosanan Comm Church CH247 Church Iglesia Cristiana Juan 16 Inc CH250 Church Imperial Heights Church of the Brethren CH251 Church Inglewood Church of Christ CH254 Church Inglewood Congregation Of CH255 Church Inglewood Friends Church CH256 Church International Ch of Foursquare Gospel Los Angeles International Airport 39 LAX Master Plan Supplement to the Draft EIS/EIR
45 S-C1. Supplemental Aircraft Noise Technical Report Table S12 LAX Master Plan Supplement to the Draft EIS/EIR Regular and Noise Sensitive Grid Point Locations Grid Cell ID Code Use X Distance Y Distance Owner of Record per County Assessor CH257 Church International Ch of Foursquare Gospel CH259 Church International Church Of CH260 Church International Church of The CH261 Church Intl Ch of Foursquare Gospel CH262 Church Intl Church of the Foursquare Gospel Inc CH266 Church Jamat-E-Masjidul Islam Inc CH267 Church James & Audrey Thompson CH270 Church James Gardner CH273 Church John & Nettie Glover CH275 Church Joseph Freeman CH276 Church Kerry Brooks CH281 Church LA Baptist City Mission Soc CH282 Church LA Baptist Cy Mission Society CH284 Church La Tijera United Methodist CH285 Church LACO Elec Inc CH289 Church Lennox Blvd Community Methodist Church CH290 Church Lennox Congregation Of CH294 Church Live Oak Missionary Baptist Church CH300 Church Los Angeles Baptist City CH303 Church Los Angeles Christian Center CH304 Church Los Angeles Church Property CH308 Church Love of God Baptist Church of LA CH311 Church Mack & Geneva Washington CH313 Church Margaret Halleck CH316 Church Messiah Evangelical Lutheran Church of LA CH321 Church Morningside Congregation Of CH322 Church Morningside United Ch of Christ CH323 Church Mount Gilead Missionary Baptist Church CH329 Church Mt Horeb Missionary Baptist Ch CH332 Church Nathaniel Campbell CH334 Church Neva Renfro CH335 Church New Antioch Church of God In Christ CH338 Church New Congregational Baptist Church CH340 Church New Life Institutional Baptist CH343 Church New Mount Pleasant Baptist Church CH346 Church New Pleasant Hill Baptist Church CH350 Church New Vision Church of God In Christ Corp CH351 Church New Zion Missionary Greater CH352 Church Nicolas Davilla CH354 Church Norman Pomeranz CH359 Church Opportunity Baptist Church CH361 Church Our Savior Lutheran CH364 Church Pacific Baptist Church of El Segundo CH366 Church Pacifica Natl Mtg CH368 Church Park Windsor Baptist Church CH375 Church Pentecostal Church Resurrection CH378 Church Philippians Missionary Greater CH383 Church Prairie Congregation Of CH388 Church Prayer Tower Church of God In Christ CH390 Church Presbytery of the Pacific CH392 Church Raymond & Cleopatra Anderson CH393 Church Raymond & Jean Branch CH395 Church Rector Wardens & Vestrymen Of CH396 Church Rector Wardens & Vestrymen Of CH397 Church Religious of the Sacred Heart of Mary CH402 Church Richard Phillips CH405 Church Robert III Thrash CH408 Church Roman Catholic Archbishop of LA CH411 Church Roman Catholic Archbishop of LA Los Angeles International Airport 40 LAX Master Plan Supplement to the Draft EIS/EIR
46 S-C1. Supplemental Aircraft Noise Technical Report Table S12 LAX Master Plan Supplement to the Draft EIS/EIR Regular and Noise Sensitive Grid Point Locations Grid Cell ID Code Use X Distance Y Distance Owner of Record per County Assessor CH413 Church Roman Catholic Archbishop of LA CH415 Church Roman Catholic Archbishop of LA CH416 Church Roman Catholic Archbishop of LA CH423 Church Roman Catholic Archbishop of LA CH427 Church Roman Catholic Archbishop of LA CH430 Church Ruth Rockwell CH431 Church Saint Andrews Missionary Holy CH432 Church Saint Hillrie Church of God In Christ CH433 Church Saint John Institutional Baptist Church CH434 Church Saint John Missionary Little CH436 Church Saint Rest Baptist Church of LA CH438 Church Salvation Army CH440 Church Second Mount Nebo Baptist Church CH453 Church Southside Church of Christ CH457 Church St Augustine Missionary Baptist Church CH459 Church St John Institutional Baptist Church CH461 Church St Johns Lutheran Ch of El Segundo CH462 Church St Mark Missionary Faithful CH463 Church St Marks United Methodist Church CH465 Church St Thomas Baptist Church CH469 Church Steven Shaw CH470 Church Strait-Way Apostolic Church Inc CH471 Church Strangers Rest Missionary Baptist Church CH472 Church Sweet Hill Baptist Church Inc CH479 Church Thompson Memorial Chapel Church Inc CH480 Church Three Oaks Baptist Church CH481 Church Tikvah Congregation Bnai CH482 Church Tolutasi United Methodist Church CH485 Church Trinity C M E Church CH493 Church True Gospel Missionary Baptist Church CH497 Church Truevine Baptist Church CH500 Church Twenty Third Church of Christ Scientist CH503 Church United Methodist Church of El Segundo CH507 Church Upper Room Church God CH509 Church Vermont Ave Church of Christ CH513 Church Wardens & Vestrymen Rector CH518 Church Westchester Assembly of God CH519 Church Westchester Ch of the Nazarene CH520 Church Westchester Lutheran Church CH521 Church Westchester United Methodist Church CH522 Church Westside Christian Fellowship of Los An CH524 Church Wiley & Gloria Sapp Jr. CH529 Church Woodcrest Congregation Of CH532 Church Zion Hill Baptist Church CH533 Church Juan & Irma Aquilar HOS05 Hospital Burton Russell Co HOS07 Hospital Catholic Healthcare West Southern Calif HOS09 Hospital Crippled Children's Society Of HOS10 Hospital Desco Health Care Inc HOS11 Hospital Freeman Med Towers Lp HOS12 Hospital Golden West Convalescent Hospital Investm HOS13 Hospital Grp Bedford HOS15 Hospital Robert & Richard Binkert HOS16 Hospital Samuel & Kathryn Dixon HOS18 Hospital State of Calif HOS19 Hospital Washington Mut Bk LIB01 Library Hawthorne City LIB02 Library Inglewood City LIB03 Library Inglewood City Los Angeles International Airport 41 LAX Master Plan Supplement to the Draft EIS/EIR
47 S-C1. Supplemental Aircraft Noise Technical Report Table S12 LAX Master Plan Supplement to the Draft EIS/EIR Regular and Noise Sensitive Grid Point Locations Grid Cell ID Code Use X Distance Y Distance Owner of Record per County Assessor LIB04 Library Inglewood City Library LIB05 Library LA City LIB06 Library LA County LIB07 Library Lennox Branch LIB10 Library Mark Twain Branch LIB11 Library El Segundo Library LIB13 Library Loyola Village Branch NH003 Hospital, Convalescent American Philanthropy Assn Inc NH004 Hospital, Convalescent Archdiocese of LA Educ & Welfare Corp NH007 Hospital, Convalescent C & H Health Care NH008 Hospital, Convalescent Charles Perkins NH009 Hospital, Convalescent Curtis & Faye Melton NH010 Hospital, Convalescent Delores Allen NH012 Hospital, Convalescent Edward Gauthier Sr. NH013 Hospital, Convalescent Eugenia Durdall NH015 Hospital, Convalescent Greater Faith Baptist Church NH017 Hospital, Convalescent Home Elderly Pp NH018 Hospital, Convalescent Howard & Dorothy Bush NH019 Hospital, Convalescent Klokke Corp NH022 Hospital, Convalescent Manor Convalescent Hospital Manchester NH023 Hospital, Convalescent Mark & Emerita Mannarelli NH025 Hospital, Convalescent Mount Zion Baptist Church of Los Angeles NH026 Hospital, Convalescent Ollie Miller NH027 Hospital, Convalescent Ramon Duran NH028 Hospital, Convalescent Rebecca Conti NH033 Hospital, Convalescent Saint Erne Healthcare Center NH037 Hospital, Convalescent Skangel Inc NH038 Hospital, Convalescent Terrace Inglewood Brierwood NH040 Hospital, Convalescent Urban Healthcare Project Inc NH041 Hospital, Convalescent Watts Health Foundation NH042 Hospital, Convalescent Wells Fargo Bank NA NH043 Hospital, Convalescent Carewest Nursing Center NH044 Hospital, Convalescent Centinela Valley Care Center NH045 Hospital, Convalescent Hawthorne Convalescent Center PBS006 Public School th Street Elementary School PBS009 Public School th Street Preparatory School PBS011 Public School Arena High School PBS017 Public School Boulah Payne Elementary School PBS018 Public School Bret Harte Junior High School PBS019 Public School Buford Elementary School PBS021 Public School Center Street Elementary School PBS022 Public School Centinela Elementary School PBS023 Public School Centinela Valley Union High School Dist PBS024 Public School Century park Elementary School PBS026 Public School Clyde Woodworth Elementary PBS027 Public School Cowan Avenue Elementary School PBS028 Public School Crozier Middle School PBS029 Public School Daniel Freeman Elementary School PBS031 Public School El Segundo Jr. High School PBS032 Public School El Segundo Middle School PBS033 Public School Eucalyptus School PBS035 Public School Felton Elementary School PBS036 Public School Figueroa Street Elementary School PBS040 Public School George Washington High School and Magnet Center PBS041 Public School Grace Church of the Nazarene Of PBS042 Public School Hawthorne High School PBS047 Public School Hillcrest Continuation School PBS048 Public School Hudnall Elementary School PBS049 Public School Imperial Avenue School Special Education Facility Los Angeles International Airport 42 LAX Master Plan Supplement to the Draft EIS/EIR
48 S-C1. Supplemental Aircraft Noise Technical Report Table S12 LAX Master Plan Supplement to the Draft EIS/EIR Regular and Noise Sensitive Grid Point Locations Grid Cell ID Code Use X Distance Y Distance Owner of Record per County Assessor PBS050 Public School Inglewood High School PBS054 Public School Inglewood Unified School Dist PBS055 Public School Jefferson Elementary School PBS058 Public School Juan de Anza Elementary School PBS059 Public School Kelso Elementary School PBS061 Public School Kentwood Elementary School PBS062 Public School LA Unified School Dist PBS086 Public School LA Unified School Dist PBS090 Public School La Salle Avenue Elementary School PBS091 Public School Lennox Middle School PBS098 Public School Loren Miller Elementary School PBS099 Public School Loyola Village Elementary School PBS100 Public School Manchester Avenue Elementary School PBS101 Public School Manhattan Place Elementary School PBS102 Public School Moffet Elementary School PBS105 Public School Oak Street Elementary School PBS106 Public School Orville Wright Junior High School PBS107 Public School Paseo del Rey Magnet School PBS111 Public School Raymond Avenue Elementary School PBS113 Public School Sung & Keum Kim PBS117 Public School Warren Lane Elementary School PBS120 Public School Westchester High School and Magnet Center PBS121 Public School Westchester High School and Magnet Center PBS122 Public School Westpoint Heights Elementary School PBS123 Public School Whelan Elementary School PBS125 Public School Woodcrest Elementary School PBS127 Public School Worthington Elementary School PBS128 Public School York School PBS140 Public School Morningside High School PBS201 Public School Monroe Middle School PRK01 Park Ashwood Park PRK02 Park Carl E. Nielson Youth Park PRK03 Park Center Park PRK05 Park Del Aire Park PRK07 Park Del Rey Lagoon PRK10 Park El Segundo City PRK11 Park El Segundo City PRK13 Park El Segundo City PRK15 Park El Segundo City PRK16 Park El Segundo City PRK18 Park Eucalyptus Park PRK201 Park Westchester Recreation Center/Golf Course PRK32 Park Inglewood City PRK41 Park Inglewood City PRK42 Park Inglewood City PRK43 Park Inglewood City PRK45 Park LA City PRK46 Park LA City PRK52 Park LA County PRK56 Park LA County PRK59 Park Queen Park PRK60 Park Redevelopment Agency of Inglewood City PRK62 Park Robert Mork PRK65 Park State of Calif PRK67 Park Vista Del Mar Park PRK68 Park Westchester Municipal Golf Course PRK70 Park Little Green Acres Park PRK71 Park Holly Valley Park PRK72 Park Library Park Los Angeles International Airport 43 LAX Master Plan Supplement to the Draft EIS/EIR
49 S-C1. Supplemental Aircraft Noise Technical Report Table S12 LAX Master Plan Supplement to the Draft EIS/EIR Regular and Noise Sensitive Grid Point Locations Grid Cell ID Code Use X Distance Y Distance Owner of Record per County Assessor PVS001 Private School Angeles Urban League Los PVS002 Private School Archdiocese of Los Angeles Educ PVS003 Private School Archdiocese of LA Educ PVS004 Private School Archdiocese of LA Educ PVS007 Private School Archdiocese of LA Educ & Welfare Corp PVS011 Private School Archdiocese of LA Educ & Welfare Corp PVS012 Private School Archdiocese of LA Educ & Welfare Corp PVS017 Private School Archdiocese of LA Educ & Welfare Corp PVS025 Private School Australia Johnson PVS026 Private School Bethany Apostolic Church PVS028 Private School Brady & Margaret Johnson PVS029 Private School Brady & Margaret Johnson Jr. PVS030 Private School Carolyn & Stacey Carol Jenkins PVS031 Private School Chabad of the Marina PVS033 Private School Community Build Inc PVS034 Private School Constance Tucker PVS035 Private School Crenshaw Christian Center Church PVS036 Private School Dorothy Moore PVS037 Private School Edgar Palmer PVS044 Private School Gary & Linda Dunn PVS046 Private School Glen & Marjorie McKnight PVS048 Private School Hilltop Christian School PVS049 Private School Iglesia Cristiana Juan 3:16 PVS051 Private School Inglewood Christian School PVS054 Private School James McGregory PVS055 Private School Jeff D & Baasha K Johnson Jr. PVS056 Private School Jessie Jackson PVS060 Private School Keith & Maria Crisp PVS062 Private School LA Southside Christian Church PVS064 Private School Lindgren Ptnrshp 1 PVS065 Private School Lou-Ann Inv PVS066 Private School Lucian & Desirine Bingham PVS067 Private School Manor Hale-Morris-Lewis PVS069 Private School Michael & Sherry Baker PVS070 Private School Michael Hale PVS071 Private School Milton Raymond PVS073 Private School Morningside United Ch of Christ PVS074 Private School Musical Hart Evangelistic Assn Inc PVS077 Private School Paul & Willa Devan PVS081 Private School Providence Missionary Baptist PVS082 Private School R Marie Fegan PVS083 Private School Raymond & Carolyn Wilder PVS084 Private School Raymond Vanyek PVS085 Private School Riley & Faye Washington PVS086 Private School Ruth Cooper PVS087 Private School Samuel Amerson PVS091 Private School St Eugene's Catholic School PVS092 Private School St Marys Academy of LA PVS093 Private School St. Anastasia School PVS099 Private School Twyla Lang PVS101 Private School Verna Nelson PVS103 Private School Westchester Lutheran Church PVS104 Private School Westchester Neighborhood School PVS105 Private School Acacia Baptist School PVS106 Private School Calvary Christian School PVS107 Private School Escuela de Montessori PVS108 Private School Faith Lutheran Church School Los Angeles International Airport 44 LAX Master Plan Supplement to the Draft EIS/EIR
50 S-C1. Supplemental Aircraft Noise Technical Report Table S12 LAX Master Plan Supplement to the Draft EIS/EIR Regular and Noise Sensitive Grid Point Locations Grid Cell ID Code Use X Distance Y Distance Owner of Record per County Assessor PVS109 Private School K-Anthony's Middle School PVS110 Private School Saint Anthony's Catholic School PVS111 Private School St Joseph's Catholic Church School PBS114 1 Private School University of West Los Angeles PBS116 1 Private School University of West Los Angeles PVS138 Private School Loyola Marymount University 1 Modified since publication of the Draft EIS/EIR to correct an error in the Draft EIS/EIR. This modification does not alter the conclusions of the Draft EIS/EIR. Source Landrum & Brown, 2002 Los Angeles International Airport 45 LAX Master Plan Supplement to the Draft EIS/EIR
51 S-C1. Supplemental Aircraft Noise Technical Report This Page Intentionally Left Blank Los Angeles International Airport 46 LAX Master Plan Supplement to the Draft EIS/EIR
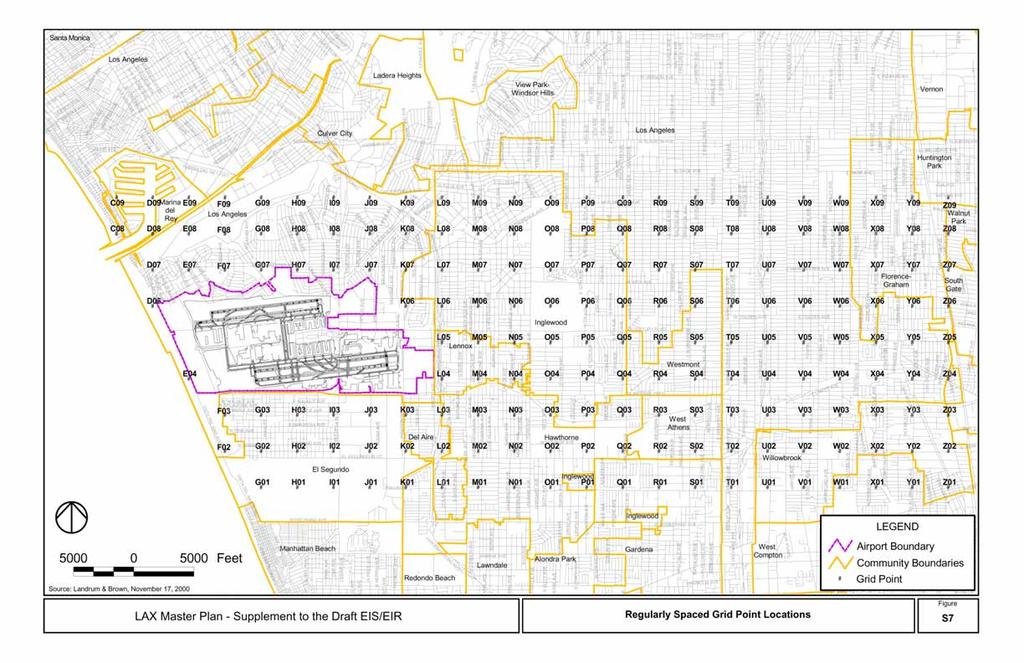
52
53 S-C1. Supplemental Aircraft Noise Technical Report Los Angeles International Airport 48 LAX Master Plan Supplement to the Draft EIS/EIR

54
55 S-C1. Supplemental Aircraft Noise Technical Report Los Angeles International Airport 50 LAX Master Plan Supplement to the Draft EIS/EIR
56
57 S-C1. Supplemental Aircraft Noise Technical Report Los Angeles International Airport 52 LAX Master Plan Supplement to the Draft EIS/EIR

58
I certify that the information contained in the following pages is correct to the best of my knowledge.
 CERTIFICATION Specific dates of summary: July 1, 2017 June 30, 2018 I certify that the information contained in the following pages is correct to the best of my knowledge. PREPARED BY: DATE: August 15,
San Francisco. Short Term Aircraft Noise Monitoring
 Short Term Aircraft Noise Monitoring San Francisco Prepared for the Visitacion Valley Neighborhood Noise Abatement Office P.O. Box 8097 San Francisco, CA 94128 (650) 821 5100 Technical Report #072016 P51
Noise Action Plan Contours for Heathrow Airport 2014
 Environmental Research and Consultancy Department Noise Action Plan Contours for Heathrow Airport ERCD REPORT 1504 Published by the Civil Aviation Authority, 2015 CAA House, 45-59 Kingsway, London WC2B
METHODOLOGY. Signalized Intersection Average Control Delay (sec/veh)
") Chapter 5 Traffic Analysis 5.1 SUMMARY US /West 6 th Street assumes a unique role in the Lawrence Douglas County transportation system. This principal arterial street currently conveys commuter traffic
Chapter 5 Traffic Analysis 5.1 SUMMARY US /West 6 th Street assumes a unique role in the Lawrence Douglas County transportation system. This principal arterial street currently conveys commuter traffic
Metropolitan Airports Commission. Annual Noise Contour Analysis
 Metropolitan Airports Commission Annual Noise Contour Analysis Table of Contents List of Tables... ii List of Figures... iii Chapter 1: Background... 1 1.1 Corrective Land Use Efforts at MSP to Address
6.0 OPERATING CONDITIONS. 6.1 Jet Engine Exhaust Velocities and Temperatures 6.2 Airport and Community Noise
 6. OPERATING CONDITIONS 6.1 Jet Engine Exhaust Velocities and Temperatures 6.2 Airport and Community Noise DISTANCE FROM AIRPLANE CL 8 1 PLAN 4 4 NOTES: 1. ENGINE CF6-8C2 2. THESE CONTOURS ARE TO BE USED
Carondelet High School Athletic Fields. Walnut Creek, CA
 Attachment 9 Walnut Creek, CA 29 September 2016 Prepared for: Jason White BKF Engineers 1646 North California Boulevard, Suite 400 Walnut Creek, CA 94596 Email: jwhite@bkf.com Prepared by: Charles M. Salter
APPENDIX J REQUIRED NAVIGATION PERFORMANCE IMPACTS EVALUATION REPORT
 APPENDIX J REQUIRED NAVIGATION PERFORMANCE IMPACTS EVALUATION REPORT February 01, 2007 Naverus, Inc. Seattle, WA This document contains commercially sensitive information and must be treated as Naverus,
TABLE OF CONTENTS EXECUTIVE SUMMARY THE PROJECT INTRODUCTION SITE DESCRIPTION NOISE SENSITIVE RECEPTORS...
 VALCOUSTICS CANADA LTD. File: 115-0395 2025 Guelph Line/Burlington Noise TABLE OF CONTENTS EXECUTIVE SUMMARY...1 1.0 THE PROJECT...1 1.1 INTRODUCTION...1 1.2 SITE DESCRIPTION...2 2.0 NOISE SENSITIVE RECEPTORS...2
Traffic Impact Study. Westlake Elementary School Westlake, Ohio. TMS Engineers, Inc. June 5, 2017
 TMS Engineers, Inc. Traffic Impact Study Westlake Elementary School Westlake, Ohio June 5, 2017 Prepared for: Westlake City Schools - Board of Education 27200 Hilliard Boulevard Westlake, OH 44145 TRAFFIC
5.0 Roadway System Plan
 Southwest Boise Transportation Study Page 16 5.0 Roadway System Plan The Roadway System Plan outlines roadway improvements in the Initial Study Area. It forecasts future deficiencies on the arterial system,
City of Elizabeth City Neighborhood Traffic Calming Policy and Guidelines
 City of Elizabeth City Neighborhood Traffic Calming Policy and Guidelines I. Purpose: The City of Elizabeth City is committed to ensure the overall safety and livability of residential neighborhoods. One
HAP e-help. Obtaining Consistent Results Using HAP and the ASHRAE 62MZ Ventilation Rate Procedure Spreadsheet. Introduction
 Introduction A key task in commercial building HVAC design is determining outdoor ventilation airflow rates. In most jurisdictions in the United States, ventilation airflow rates must comply with local
ENHANCED PARKWAY STUDY: PHASE 2 CONTINUOUS FLOW INTERSECTIONS. Final Report
 Preparedby: ENHANCED PARKWAY STUDY: PHASE 2 CONTINUOUS FLOW INTERSECTIONS Final Report Prepared for Maricopa County Department of Transportation Prepared by TABLE OF CONTENTS Page EXECUTIVE SUMMARY ES-1
Highway 111 Corridor Study
 Highway 111 Corridor Study June, 2009 LINCOLN CO. HWY 111 CORRIDOR STUDY Draft Study Tea, South Dakota Prepared for City of Tea Sioux Falls Metropolitan Planning Organization Prepared by HDR Engineering,
TRAFFIC IMPACT STUDY CRITERIA
 Chapter 6 - TRAFFIC IMPACT STUDY CRITERIA 6.1 GENERAL PROVISIONS 6.1.1. Purpose: The purpose of this document is to outline a standard format for preparing a traffic impact study in the City of Steamboat
MIL-STD-883G METHOD
 STEADY-STATE LIFE 1. PURPOSE. The steady-state life test is performed for the purpose of demonstrating the quality or reliability of devices subjected to the specified conditions over an extended time
HURRICANE SANDY LIMITED REEVALUATION REPORT UNION BEACH, NEW JERSEY DRAFT ENGINEERING APPENDIX SUB APPENDIX D SBEACH MODELING
 HURRICANE SANDY LIMITED REEVALUATION REPORT UNION BEACH, NEW JERSEY DRAFT ENGINEERING APPENDIX SUB APPENDIX D SBEACH MODELING Rev. 18 Feb 2015 1 SBEACH Modeling 1.0 Introduction Following the methodology
Transportation Engineering II Dr. Rajat Rastogi Department of Civil Engineering Indian Institute of Technology - Roorkee
 Transportation Engineering II Dr. Rajat Rastogi Department of Civil Engineering Indian Institute of Technology - Roorkee Lecture 31 Runway Orientation Dear students, I welcome you back to the lecture series
TRAFFIC STUDY GUIDELINES Clarksville Street Department
 TRAFFIC STUDY GUIDELINES Clarksville Street Department 9/1/2009 Introduction Traffic studies are used to help the city determine potential impacts to the operation of the surrounding roadway network. Two
1999 On-Board Sacramento Regional Transit District Survey
 SACOG-00-009 1999 On-Board Sacramento Regional Transit District Survey June 2000 Sacramento Area Council of Governments 1999 On-Board Sacramento Regional Transit District Survey June 2000 Table of Contents
Chapter 4 Traffic Analysis
 Chapter 4 Traffic Analysis PURPOSE The traffic analysis component of the K-68 Corridor Management Plan incorporates information on the existing transportation network, such as traffic volumes and intersection
THIS PAGE INTENTIONALLY BLANK
 THIS PAGE INTENTIONALLY BLANK Readers Guidance: This chapter provides responses to all comments submitted on the Draft Supplemental EIR of November 2011. All comments have been numbered and a corresponding
PC-21 A Damage Tolerant Aircraft. Paper presented at the ICAF 2009 Symposium by Lukas Schmid
 PC-21 A Damage Tolerant Aircraft Paper presented at the ICAF 2009 Symposium by Lukas Schmid PC-21 A Damage Tolerant Aircraft 12.05.2009 2 Acknowledgment Markus Gottier, Gottier Engineering Dave Boorman,
Helicopter Safety Recommendation Summary for Small Operators
 Helicopter Safety Recommendation Summary for Small Operators Prepared by the International Helicopter Safety Team September 2009 Introduction This document is intended to provide a summary of the initial
6.7 Aircraft Protection
 Schedules to Decision 377 6.7 Aircraft Protection 6.7.1 Introduction This introduction is to assist the lay reader to understand how this sub-chapter works and what it applies to. It is not an aid to interpretation
IVAO International Virtual Aviation Organization Training department
 1 Introduction IVAO International Virtual Aviation Organization Training department TRAFFIC PATTERN DESCRIPTION An aerodrome traffic pattern is used by VFR traffic for training purpose or to prepare the
Presented to the Israel Annual Conference on Aerospace Sciences, 2009 RISK-ANALYSIS A SUPPLEMENT TO DAMAGE-TOLERANCE ANALYSIS
 RISK-ANALYSIS A SUPPLEMENT TO DAMAGE-TOLERANCE ANALYSIS Abraham Brot Engineering Division Israel Aerospace Industries Ben-Gurion Airport, Israel abrot@iai.co.il ABSTRACT Risk-analysis, based on probabilistic
APPENDIX P. Noise Model Results and Supporting Material
 APPENDIX P Noise Model Results and Supporting Material Table of Contents Appendix P1 Summary of Technical Approach Appendix P2 Model Summary and Output Data Appendix P3 Illingworth & Rodkin Survey Report
DUNBOW ROAD FUNCTIONAL PLANNING
 DUNBOW ROAD FUNCTIONAL PLANNING Final Report August 3, 216 #31, 316 5th Avenue NE Calgary, AB T2A 6K4 Phone: 43.273.91 Fax: 43.273.344 wattconsultinggroup.com Dunbow Road Functional Planning Final Report
At each type of conflict location, the risk is affected by certain parameters:
 TN001 April 2016 The separated cycleway options tool (SCOT) was developed to partially address some of the gaps identified in Stage 1 of the Cycling Network Guidance project relating to separated cycleways.
MoPac South: Impact on Cesar Chavez Street and the Downtown Network
 MoPac South: Impact on Cesar Chavez Street and the Downtown Network Prepared by: The University of Texas at Austin Center for Transportation Research Prepared for: Central Texas Regional Mobility Authority
APPENDIX F SUPPLEMENTAL TRAFFIC DATA
 APPENDIX F SUPPLEMENTAL TRAFFIC DATA Environmental and Planning Consultants 440 Park Avenue South 7th Floor New York, NY 10016 tel: 212 696-0670 fax: 212 213-3191 www.akrf.com Draft Memorandum To: Michael
1.0 PURPOSE 2.0 REFERENCES
 Page 1 1.0 PURPOSE 1.1 This Advisory Circular provides Aerodrome Operators with guidance for the development of corrective action plans to be implemented in order to address findings generated during safety
Defining Purpose and Need
 Advanced Design Flexibility Pilot Workshop Session 4 Jack Broz, PE, HR Green May 5-6, 2010 Defining Purpose and Need In your agency s project development process, when do design engineers typically get
The Path to LUBRICATION EXCELLENCE
 The Path to LUBRICATION EXCELLENCE TABLE OF CONTENTS CHAPTER 3 Traditional Time-Based Lubrication CHAPTER 1 When Bearings Fail Prematurely CHAPTER 2 The Challenge For Maintenance Professionals CHAPTER
Revision Number Revision Date Insertion Date/Initials 1 st Ed. Oct 26, 00 2nd Ed. Jan 15, 08
 List of Effective Pages * Asterisk indicates pages changed, added, or deleted by current revision. Retain this record in front of handbook. Upon receipt of a Record of Revisions revision, insert changes
Safety assessments for Aerodromes (Chapter 3 of the PANS-Aerodromes, 1 st ed)
") Safety assessments for Aerodromes (Chapter 3 of the PANS-Aerodromes, 1 st ed) ICAO MID Seminar on Aerodrome Operational Procedures (PANS-Aerodromes) Cairo, November 2017 Avner Shilo, Technical officer
Safety assessments for Aerodromes (Chapter 3 of the PANS-Aerodromes, 1 st ed) ICAO MID Seminar on Aerodrome Operational Procedures (PANS-Aerodromes) Cairo, November 2017 Avner Shilo, Technical officer
Student Population Projections By Residence. School Year 2016/2017 Report Projections 2017/ /27. Prepared by:
 Student Population Projections By Residence School Year 2016/2017 Report Projections 2017/18 2026/27 Prepared by: Revised October 31, 2016 Los Gatos Union School District TABLE OF CONTENTS Introduction
CHAPTER 10 TOTAL RECREATIONAL FISHING DAMAGES AND CONCLUSIONS
 CHAPTER 10 TOTAL RECREATIONAL FISHING DAMAGES AND CONCLUSIONS 10.1 INTRODUCTION This chapter provides the computation of the total value of recreational fishing service flow losses (damages) through time
Advisory Circular. Runway Guard Light Installation Criteria. Aviation Safety Regulatory Framework Document No.: AC A P/A Issue No.
 Advisory Circular Subject: Runway Guard Light Installation Criteria Issuing Office: PAA Sub Activity Area: Classification File No.: Standards Aviation Safety Regulatory Framework Document No.: AC 302-005
Aerodrome Design Manual
 Doc 9157 AN/901 Aerodrome Design Manual Part 4 Visual Aids Approved by the Secretary General and published under his authority Fourth Edition 2004 International Civil Aviation Organization 8-12 Aerodrome
VISUAL AIDS FOR DENOTING OBSTACLES
 CHAPTER 6. VISUAL AIDS FOR DENOTING OBSTACLES 6.1 Objects to be marked and/or lighted Note. The marking and/or lighting of obstacles is intended to reduce hazards to aircraft by indicating the presence
E. Agu, M. Kasperski Ruhr-University Bochum Department of Civil and Environmental Engineering Sciences
 EACWE 5 Florence, Italy 19 th 23 rd July 29 Flying Sphere image Museo Ideale L. Da Vinci Chasing gust fronts - wind measurements at the airport Munich, Germany E. Agu, M. Kasperski Ruhr-University Bochum
Compression Study: City, State. City Convention & Visitors Bureau. Prepared for
 : City, State Prepared for City Convention & Visitors Bureau Table of Contents City Convention & Visitors Bureau... 1 Executive Summary... 3 Introduction... 4 Approach and Methodology... 4 General Characteristics
Advisory Circular (AC)
") Advisory Circular (AC) Stall, Compliance File No. 5009-6-525 AC No. 525-020 RDIMS No. 528401-V3 Issue No. 01 Issuing Branch Aircraft Certification Effective Date 2004-12-01 1.0 INTRODUCTION... 2 1.1 Purpose...
Advisory Circular (AC) Stall, Compliance File No. 5009-6-525 AC No. 525-020 RDIMS No. 528401-V3 Issue No. 01 Issuing Branch Aircraft Certification Effective Date 2004-12-01 1.0 INTRODUCTION... 2 1.1 Purpose...
TRAFFIC IMPACT ANALYSIS. For CHABAD LA JOLLA. Prepared for. Rabbi Baruch Ezagui. and. Edwin L. Laser, AIA. May 1, 2008
 TRAFFIC IMPACT ANALYSIS For CHABAD LA JOLLA Prepared for Rabbi Baruch Ezagui and Edwin L. Laser, AIA May 1, 2008 Note: This Traffic Impact Analysis (TIA) was prepared under the Direction of Andrew P. Schlaefli
MEMORANDUM. Charlotte Fleetwood, Transportation Planner
 MEMORANDUM Date: Updated August 22, 2017 To: Organization: Charlotte Fleetwood, Transportation Planner Boston Transportation Department From: Jason DeGray, P.E., PTOE, Regional Director of Engineering
Memorandum for the Joint Committee on New Aircraft in Japan (MV-22)
") Memorandum for the Joint Committee on New Aircraft in Japan (MV-22) References: a. The Agreement Under Article VI of the Treaty of Mutual Cooperation and Security Between the United States of America and
Memorandum for the Joint Committee on New Aircraft in Japan (MV-22) References: a. The Agreement Under Article VI of the Treaty of Mutual Cooperation and Security Between the United States of America and
City of Homewood Transportation Plan
 City of Homewood Transportation Plan Prepared for: City of Homewood, Alabama Prepared by: Skipper Consulting, Inc. May 2007 TABLE OF CONTENTS INTRODUCTION... 1 BACKGROUND INFORMATION... 1 EXISTING TRANSPORTATION
STUDY OF LANDING TECHNIQUE DURING VISUAL APPROACH
 24 TH INTERNATIONAL CONGRESS OF THE AERONAUTICAL SCIENCES STUDY OF LANDING TECHNIQUE DURING VISUAL APPROACH Hiroshi TAKAHARA*, Takashi KONDO*, Shinji SUZUKI** *All Nippon Airways Co., LTD., **University
FLIGHT CREW TRAINING NOTICE
 SAFETY REGULATION GROUP FLIGHT CREW TRAINING NOTICE 06/2009 Applicability: RETRE, TRIE, TRE, SFE, TRI, SFI Effective: Immediate AIRBORNE COLLISION AVOIDANCE SYSTEM (ACAS) TRAINING 1 The purpose of this
PDX Citizen Noise Advisory Committee / Noise Program Overview. LAX Community Noise Roundtable January 8, 2014
 PDX Citizen Noise Advisory Committee / Noise Program Overview LAX Community Noise Roundtable January 8, 2014 Jason Schwartz Noise Management Department Noise Management Department History / Origin of PDX
STATE OF NEW YORK PUBLIC SERVICE COMMISSION. At a session of the Public Service Commission held in the City of Albany on August 20, 2003
 STATE OF NEW YORK PUBLIC SERVICE COMMISSION At a session of the Public Service Commission held in the City of Albany on August 20, 2003 COMMISSIONERS PRESENT: William M. Flynn, Chairman Thomas J. Dunleavy
Plan B Dam Breach Assessment
 Plan B Dam Breach Assessment Introduction In support of the Local Sponsor permit applications to the states of Minnesota and North Dakota, a dam breach analysis for the Plan B alignment of the Fargo-Moorhead
The Air Travel Value Proposition: Safer, Cheaper, Greener, Quieter and Fast
 The Air Travel Value Proposition: Safer, Cheaper, Greener, Quieter and Fast Updated March 13, 2019 U.S. Airline Industry Safety Has Improved Markedly We re Experiencing the Safest Period in Aviation History
Chs. 16 and 17 Mechanical Waves
 Chs. 16 and 17 Mechanical Waves The nature of waves A wave is a traveling disturbance that carries energy from one place to another, and even though matter may be disturbed as a wave travels through a
Inspecting Aerodrome Construction
 Inspecting Aerodrome Construction Presented to: ICAO/ FAA Aerodrome Certification Inspectors Workshop for the Caribbean Region By: Laurie Dragonas, FAA Lead Airport Certification/Safety Inspector Date:
Guidelines for Providing Access to Public Transportation Stations APPENDIX C TRANSIT STATION ACCESS PLANNING TOOL INSTRUCTIONS
 APPENDIX C TRANSIT STATION ACCESS PLANNING TOOL INSTRUCTIONS Transit Station Access Planning Tool Instructions Page C-1 Revised Final Report September 2011 TRANSIT STATION ACCESS PLANNING TOOL INSTRUCTIONS
CLT Continued Aircraft Operations Evaluations
 CLT Continued Aircraft Operations Evaluations Airport Community Roundtable Presentation August 15, 2018 ACR Requests of the CLT Technical Consultant Continued review of open ACR motions Increase Base Leg
ADOT Statewide Bicycle and Pedestrian Program Summary of Phase IV Activities APPENDIX B PEDESTRIAN DEMAND INDEX
 ADOT Statewide Bicycle and Pedestrian Program Summary of Activities APPENDIX B PEDESTRIAN DEMAND INDEX May 24, 2009 Pedestrian Demand Index for State Highway Facilities Revised: May 29, 2007 Introduction
Wildlife Hazards Working Group Meeting July 19, Agenda Item: Safety concerns related to waterfowl movement during hunting season
 Wildlife Hazards Working Group Meeting July 19, 1022 Agenda Item: Safety concerns related to waterfowl movement during hunting season I. Summary of discussions to date. December 2, 2010 WHWG meeting At
S-TEC. Pilot s Operating Handbook
 S-TEC Pilot s Operating Handbook List of Effective Pages * Asterisk indicates pages changed, added, or deleted by current revision. Retain this record in front of handbook. Upon receipt of a Record of
Turn Lane Warrants: Concepts, Standards, Application in Review
 Turn Lane Warrants: Concepts, Standards, Application in Review David J. DeBaie P.E., P.T.O.E. 2004 ITE, District 1 Annual Meeting Burlington, Vermont Introduction Turning lanes at intersections reduce
Traffic Impact Analysis (TIA) Process and Procedures Manual. September 2017
 Process and Procedures Manual. September 2017") Traffic Impact Analysis (TIA) Process and Procedures Manual Post Office Box 664 101 Huntersville-Concord Road Huntersville, NC 28070 Phone 704-766-2220 Fax 704-992-5528 www.huntersville.org (c) 2017, Town
Traffic Impact Analysis (TIA) Process and Procedures Manual Post Office Box 664 101 Huntersville-Concord Road Huntersville, NC 28070 Phone 704-766-2220 Fax 704-992-5528 www.huntersville.org (c) 2017, Town
Aerodynamic Terms. Angle of attack is the angle between the relative wind and the wing chord line. [Figure 2-2] Leading edge. Upper camber.
![Aerodynamic Terms. Angle of attack is the angle between the relative wind and the wing chord line. [Figure 2-2] Leading edge. Upper camber.](/thumbs/82/86661300.jpg "Aerodynamic Terms. Angle of attack is the angle between the relative wind and the wing chord line. [Figure 2-2] Leading edge. Upper camber.") Chapters 2 and 3 of the Pilot s Handbook of Aeronautical Knowledge (FAA-H-8083-25) apply to powered parachutes and are a prerequisite to reading this book. This chapter will focus on the aerodynamic fundamentals
Chapters 2 and 3 of the Pilot s Handbook of Aeronautical Knowledge (FAA-H-8083-25) apply to powered parachutes and are a prerequisite to reading this book. This chapter will focus on the aerodynamic fundamentals
Tulsa Metropolitan Area LONG RANGE TRANSPORTATION PLAN
 Tulsa Metropolitan Area LONG RANGE TRANSPORTATION PLAN Indian Nations Council of Governments August 2005 CONTACTING INCOG In developing the Destination 2030 Long Range Transportation Plan, INCOG s Transportation
Questions & Answers About the Operate within Operate within IROLs Standard
 Index: Introduction to Standard...3 Expansion on Definitions...5 Questions and Answers...9 Who needs to comply with this standard?...9 When does compliance with this standard start?...10 For a System Operator
ATTACHMENT O WIPP MINE VENTILATION RATE MONITORING PLAN
 ATTACHMENT O WIPP MINE VENTILATION RATE MONITORING PLAN (This page intentionally blank) ATTACHMENT O WIPP MINE VENTILATION RATE MONITORING PLAN TABLE OF CONTENTS O- Definitions... O- Objective... O- Design
VISUAL AIDS FOR DENOTING OBSTACLES
 CHAPTER 6. VISUAL AIDS FOR DENOTING OBSTACLES 6.1 Objects to be marked and/or lighted Note.C The marking and/or lighting of obstacles is intended to reduce hazards to aircraft by indicating the presence
City of Memphis On-Street Parking Modification Guidelines
 City of Memphis Effective Date: December 1, 2013 Bicycle/Pedestrian Program 125 N. Main Street Memphis, TN 38103 (901) 576-6710 www.bikepedmemphis.com City of Memphis Executive Summary It is current practice
SULAYMANIYAH INTERNATIONAL AIRPORT MATS
 KURDISTAN REGIONAL GOVERNMENT SULAYMANIYAH INTERNATIONAL AIRPORT MATS APPENDIX " O " SPEED CONTROL GUIDANCE ( First Edition ) April 2012 Prepared By Fakhir.F. Mohammed Civil Aviation Consultant APPENDIX
New Airfield Risk Assessment / Categorisation
 New Airfield Risk Assessment / Categorisation Airfield Risk Assessment Prior to commencing operations to a new airfield, airfield risk assessment and categorisation will take place. For continued operations
Marine Renewables Industry Association. Marine Renewables Industry: Requirements for Oceanographic Measurements, Data Processing and Modelling
 Marine Renewables Industry Association Marine Renewables Industry: Requirements for Oceanographic Measurements, Data Processing and Modelling October 2009 Table of Contents 1. Introduction... 1 2. Measurements
Simulation Analysis of Intersection Treatments for Cycle Tracks
 Abstract Simulation Analysis of Intersection Treatments for Cycle Tracks The increased use of cycle tracks also known as protected bike lanes has led to investigations of how to accommodate them at intersections.
Assessment Summary Report Gulf of Mexico Red Snapper SEDAR 7
 Assessment Summary Report Gulf of Mexico Red Snapper SEDAR 7 Stock Distribution: Red snapper are found throughout the Gulf of Mexico, the Caribbean Sea, and from the U.S. Atlantic Coast to northern South
Special Condition. 10 Minutes OEI Take-off Thrust at High Ambient Temperature rating
 Special Condition 10 Minutes OEI Take-off Thrust at High Ambient Temperature rating Approval of Turbofan Engine 10 Minutes OEI Take-off Thrust at High Ambient Temperature rating This Special Condition
Travel and Rider Characteristics for Metrobus
 Travel and Rider Characteristics for Metrobus 040829040.15 Travel and Rider Characteristics for Metrobus: 2012-2015 Overview The Miami Dade County Metropolitan Planning Organization (MPO) conducted a series
ASSESSING THE RELIABILITY OF FAIL-SAFE STRUCTURES INTRODUCTION
 ASSESSING THE RELIABILITY OF FAIL-SAFE STRUCTURES Abraham Brot * Abstract: A computer simulation method is described, that can be used to assess the reliability of a dual-path fail-safe design. The method
POWER Quantifying Correction Curve Uncertainty Through Empirical Methods
 Proceedings of the ASME 2014 Power Conference POWER2014 July 28-31, 2014, Baltimore, Maryland, USA POWER2014-32187 Quantifying Correction Curve Uncertainty Through Empirical Methods ABSTRACT Christopher
Advisory Circular (AC)
") Advisory Circular (AC) Certification of Large Aeroplanes in the Restricted Category, Used for Special Purpose Operations File No. 5009-6-525 AC No. 525-012 RDIMS No. 1140123-V1 Issue No. 02 Issuing Branch
Advisory Circular (AC) Certification of Large Aeroplanes in the Restricted Category, Used for Special Purpose Operations File No. 5009-6-525 AC No. 525-012 RDIMS No. 1140123-V1 Issue No. 02 Issuing Branch
OBSTACLE DEPARTURE PROCEDURES Part 3
 OBSTACLE DEPARTURE PROCEDURES Part 3 In the last issue, I promised to discuss Visual Climb Over Airport (VCOA) departure procedures and to show examples of more complex ODPs than was discussed in that
Wind Flow Validation Summary
 IBHS Research Center Validation of Wind Capabilities The Insurance Institute for Business & Home Safety (IBHS) Research Center full-scale test facility provides opportunities to simulate natural wind conditions
CLEARED AND GRADED AREA (CGA): CRITICAL ANALYSIS AND PROPOSAL OF A CRITERION FOR GRADING ITS BEARING CAPACITY
: CRITICAL ANALYSIS AND PROPOSAL OF A CRITERION FOR GRADING ITS BEARING CAPACITY") CLEARED AND GRADED AREA (CGA): CRITICAL ANALYSIS AND PROPOSAL OF A CRITERION FOR GRADING ITS BEARING CAPACITY Ranieri V. Assistant professor, Polytechnic University of Bari, Italy v.ranieri@poliba.it D
CLEARED AND GRADED AREA (CGA): CRITICAL ANALYSIS AND PROPOSAL OF A CRITERION FOR GRADING ITS BEARING CAPACITY Ranieri V. Assistant professor, Polytechnic University of Bari, Italy v.ranieri@poliba.it D
TRAFFIC IMPACT STUDY And A TRAFFIC SIGNAL WARRANT ANALYSIS FOR A SENIOR LIVING AND APARTMENT DEVELOPMENT
 TRAFFIC IMPACT STUDY And A TRAFFIC SIGNAL WARRANT ANALYSIS FOR A SENIOR LIVING AND APARTMENT DEVELOPMENT DEERFIELD TOWNSHIP, WARREN COUNTY, OHIO Nantucket Circle and Montgomery Road () Prepared for: ODLE
1.0 INTRODUCTION 1.1 PURPOSE OF THIS REPORT
 1.0 INTRODUCTION This chapter provides an overview of the purpose, authorization and focus of this Recirculated Draft Environmental Impact Report (EIR), an identification of the Lead Agency, an outline
Report on the Assessment of proposed FTL tables for Air Taxi and Emergency Medical Services Operations
 Report on the Assessment of proposed FTL tables for Air Taxi and Emergency Medical Services Operations Prepared by: M Spencer Dr B. M. Stone FRMSc/EBAA/FTL 14 th March 2016 FRMSc Limited PO Box 631 Farnham
 TRAFFIC IMPACT STUDY CANYON HILLS PROJECT LOS ANGELES, CALIFORNIA INTRODUCTION This traffic analysis has been conducted to identify and evaluate the potential traffic impacts of the proposed Canyon Hills
Pressure and Density Altitude
 Pressure and Density Altitude Reference Sources Pilot s Handbook of Aeronautical Knowledge o Pages 9-1 to 9-4, Aircraft Performance o Pages 9-20 to 9-21, Density Altitude Charts Study Questions 1. Where
Minneapolis-St. Paul International Airport Noise Oversight Committee (NOC)
") Minneapolis-St. Paul International Airport Noise Oversight Committee (NOC) NOC Committee Members Jeffrey Hart Co-Chair (Delta Air Lines) Dianne Miller Co-Chair, City of Eagan Representative (City of Eagan)
Minneapolis-St. Paul International Airport Noise Oversight Committee (NOC) NOC Committee Members Jeffrey Hart Co-Chair (Delta Air Lines) Dianne Miller Co-Chair, City of Eagan Representative (City of Eagan)
Evan Johnson, Tindale Oliver & Associates. Alan Danaher, P.E., PTOE, AICP, PTP
 To: Copies: From: Evan Johnson, Tindale Oliver & Associates Matt Muller, RTS Jesus Gomez, RTS Alan Danaher, P.E., PTOE, AICP, PTP Date: January 14, 2014 Subject: Ridership Projections Gainesville Streetcar
SAN FRANCISCO MUNICIPAL TRANSPORTATION AGENCY
 THIS PRINT COVERS CALENDAR ITEM NO. : 12 DIVISION: Sustainable Streets BRIEF DESCRIPTION: SAN FRANCISCO MUNICIPAL TRANSPORTATION AGENCY Approving the traffic modifications associated with the Dolores Street
An Employee-Owned Company
 1927 Fifth Avenue 2033 East Grant Road 2027 Preisker Lane, Ste. G San Diego, CA 92101 Tucson, AZ 85719 Santa Maria, CA 93454 P 619.308.9333 P 520.325.9977 P 805.928.7907 F 619.308.9334 F 520.293.3051 F
Technical Brief - Wave Uprush Analysis Island Harbour Club, Gananoque, Ontario
 Technical Brief - Wave Uprush Analysis RIGGS ENGINEERING LTD. 1240 Commissioners Road West Suite 205 London, Ontario N6K 1C7 October 31, 2014 Table of Contents Section Page Table of Contents... i List
Climbs, descents, turns, and stalls These are some of the maneuvers you'll practice, and practice, and practice By David Montoya
 Climbs, descents, turns, and stalls These are some of the maneuvers you'll practice, and practice, and practice By David Montoya Air work stalls, steep turns, climbs, descents, slow flight is the one element
Complete Street Analysis of a Road Diet: Orange Grove Boulevard, Pasadena, CA
 Complete Street Analysis of a Road Diet: Orange Grove Boulevard, Pasadena, CA Aaron Elias, Bill Cisco Abstract As part of evaluating the feasibility of a road diet on Orange Grove Boulevard in Pasadena,
Portland International Airport Bicycle and Pedestrian Plan (October 2003) Staff Acknowledgements
 Staff Acknowledgements") Portland International Airport Bicycle and Pedestrian Plan (October 2003) Staff Acknowledgements Scott King, Senior Aviation Planner Jason Gately, Senior Aviation Planner Preston Beck, Associate Planner
Portland International Airport Bicycle and Pedestrian Plan (October 2003) Staff Acknowledgements Scott King, Senior Aviation Planner Jason Gately, Senior Aviation Planner Preston Beck, Associate Planner
Flight Profiles are designed as a guideline. Power settings are recommended and subject to change based
 MANEUVERS AND PROCEDURES Flight Profiles are designed as a guideline. Power settings are recommended and subject to change based upon actual conditions (i.e. aircraft weight, pressure altitude, icing conditions,
2600T Series Pressure Transmitters Plugged Impulse Line Detection Diagnostic. Pressure Measurement Engineered solutions for all applications
 Application Description AG/266PILD-EN Rev. C 2600T Series Pressure Transmitters Plugged Impulse Line Detection Diagnostic Pressure Measurement Engineered solutions for all applications Increase plant productivity
Traffic Impact Analysis
 Traffic Impact Analysis Isle of Capri Casinos, Inc. Waterloo, Iowa SEH No. A-CLAAS0501.00 November 16, 2004 Table of Contents (Continued) Table of Contents Certification Page Table of Contents Page 1.0