Guardrail and Bridge Rail Recommendations for Very Low-Volume Local Roads in Kansas
|
|
|
- Colin Goodwin
- 5 years ago
- Views:
Transcription

1 Report No. KS FINAL REPORT December 2014 Guardrail and Bridge Rail Recommendations for Very Low-Volume Local Roads in Kansas Ronald J. Seitz, P.E. Tod Salfrank Kansas Department of Transportation Bureau of Local Projects Division of Operations Bureau of Research
2 This page intentionally left blank.
3 1 Report No. 2 Government Accession No. 3 Recipient Catalog No. KS Title and Subtitle 5 Report Date Guardrail and Bridge Rail Recommendations for Very Low-Volume December 2014 Local Roads in Kansas 6 Performing Organization Code 7 Author(s) Ronald J. Seitz, P.E., and Tod Salfrank 9 Performing Organization Name and Address Kansas Department of Transportation Bureau of Local Projects 700 SW Harrison Street 3 rd Floor West Topeka, Kansas Sponsoring Agency Name and Address Kansas Department of Transportation Bureau of Research 2300 SW Van Buren Topeka, Kansas Supplementary Notes For more information write to address in block 9. 7 Performing Organization Report No. 10 Work Unit No. (TRAIS) 11 Contract or Grant No. 13 Type of Report and Period Covered Final Report 14 Sponsoring Agency Code The determination of warrants for bridge railing and approach guardrails is a fundamental roadside safety issue. These are specialized roadside safety barriers that are intended to capture and smoothly redirect errant vehicles that leave the roadway either on the bridge itself or on the approach to the bridge. The Federal Highway Administration (FHWA) requires tested bridge rails and approach guardrails on all National Highway System (NHS) Roadways. However, states are given the discretion to develop their own policies for non-nhs roads. Currently in Kansas, all bridges constructed with federal funds are required to have one of the Kansas Department of Transportation s (KDOT) standard bridge rails (either corral rail or barrier curb) and approach guardrail (including transition and end treatment). These systems are expensive in terms of the initial cost of a bridge and they have additional safety and maintenance considerations that may outweigh the expected safety benefits on many low-volume applications. In an effort to maximize the safety benefits of the limited funding, KDOT undertook the effort outlined in this report to establish practical risk-based guidelines and policies for bridge rails and guardrails on low-volume local roads. 17 Key Words Low Volume Roads, Rural, Guardrail, Bridge Rail, and Local Government 19 Security Classification (of this report) Unclassified Form DOT F (8-72) 20 Security Classification (of this page) Unclassified 18 Distribution Statement No restrictions. This document is available to the public through the National Technical Information Service 21 No. of pages 22 Price 166 i
4 Guardrail and Bridge Rail Recommendations for Very Low-Volume Local Roads in Kansas Prepared by Ronald J. Seitz, P.E. Bureau Chief and Tod Salfrank Associate Road Engineer Kansas Department of Transportation Bureau of Local Projects A Report on Research Sponsored by THE KANSAS DEPARTMENT OF TRANSPORTATION TOPEKA, KANSAS December 2014 Copyright 2014, Kansas Department of Transportation ii
5 NOTICE The authors and the state of Kansas do not endorse products or manufacturers. Trade and manufacturers names appear herein solely because they are considered essential to the object of this report. This information is available in alternative accessible formats. To obtain an alternative format, contact the Office of Public Affairs, Kansas Department of Transportation, 700 SW Harrison, 2 nd Floor West Wing, Topeka, Kansas or phone (785) (Voice) (TDD). DISCLAIMER The contents of this report reflect the views of the authors who are responsible for the facts and accuracy of the data presented herein. The contents do not necessarily reflect the views or the policies of the state of Kansas. This report does not constitute a standard, specification or regulation. iii
6 Abstract The determination of warrants for bridge railing and approach guardrails is a fundamental roadside safety issue. These are specialized roadside safety barriers that are intended to capture and smoothly redirect errant vehicles that leave the roadway either on the bridge itself or on the approach to the bridge. The Federal Highway Administration (FHWA) requires tested bridge rails and approach guardrails on all National Highway System (NHS) Roadways. However, states are given the discretion to develop their own policies for non-nhs roads. Currently in Kansas, all bridges constructed with federal funds are required to have one of the Kansas Department of Transportation s (KDOT) standard bridge rails (either corral rail or barrier curb) and approach guardrail (including transition and end treatment). These systems are expensive in terms of the initial cost of a bridge and they have additional safety and maintenance considerations that may outweigh the expected safety benefits on many low-volume applications. In an effort to maximize the safety benefits of the limited funding, KDOT undertook the effort outlined in this report to establish practical risk-based guidelines and policies for bridge rails and guardrails on low-volume local roads. iv
7 INTRODUCTION The determination of warrants for bridge railing and approach guardrails is a fundamental roadside safety issue. These are specialized roadside safety barriers that are intended to capture and smoothly redirect errant vehicles that leave the roadway either on the bridge itself or on the approach to the bridge. The FHWA requires tested bridge rails and approach guardrails on all National Highway System (NHS) roadways. However, states are given the discretion to develop their own policies for non- NHS roads. Currently in Kansas, all bridges constructed with federal funds are required to have one of KDOT s standard bridge rails (either corral rail or barrier curb) and approach guardrail (including transition and end treatment) all of which have met the crash test criteria of NCHRP Report 350 (1) or AASHTO s Manual for Assessing Safety Hardware (2), regardless of whether the structure is on the NHS and irrespective of the functional classification or ownership of the route. These systems are expensive in terms of the initial cost of a bridge (greater deck thickness, additional embankment, and additional right of way acquisition, to name a few), and they have additional safety and maintenance considerations that may outweigh the expected safety benefits on many low-volume applications. In an effort to maximize the safety benefits of the limited available funding on a system-wide basis, the Kansas Department of Transportation (KDOT) undertook the effort outlined in this paper to establish practical risk-based guidelines and policies for bridge rails and guardrails on low-volume local roads. The primary tasks included: 1
8 A review of the state of the practice, including current American Association of State Highway and Transportation Officials (AASHTO) policies and guidelines, to determine the amount of flexibility/discretion allowed. A review of research studies with similar objectives that have been performed elsewhere. A review of the policies of other state highway agencies. Analysis of bridge/approach guardrail crashes on low-volume local roads in Kansas. Benefit-cost analyses based on typical traffic and location features. DESCRIPTION OF THE PROBLEM Of the roughly 140,000 miles of public roads in the state of Kansas, only about 10,000 miles are under the state s jurisdiction. The remaining 130,000 miles are the responsibility of cities, counties or townships. Included on this local system are approximately 20,000 bridges. The National Bridge Inspection Program data for local bridges in Kansas shows that many of these local bridges are older structures and in deteriorated condition. Over 3,600 of them are currently rated as either structurally deficient or functionally obsolete. About one-half of these deficient structures are less than 50 feet long and are located on roads with average daily traffic (ADT) lower than 50 vehicles per day. See Figures 1 and 2. 2
9 Functionally Obsolete Bridges Structurally Deficient Bridges Approximately 3,600 total deficient bridges ' 30' 30' 40' 40' 50' 50' 60' 60' 70' 70' 80' 80' 90' 90' 100' Figure 1. Deficient Local Bridges by Length. (Source: Kansas Local NBI Data) Approximately 3,600 total deficient bridges to 50 vpd 50 to 100 vpd 100 to 500 vpd 500 to 1,000 vpd Over 1,000 vpd Figure 2. Deficient Local Bridges by Traffic Volume. (Source: Kansas Local NBI Data) 3
10 Compounding the problem is the age of the bridges on local roads. With nearly half of the local bridges exceeding 50 years age at this time, it is expected that there will be additional bridges added to the deficient list in coming years. See Figure Approximately 20,000 total local bridges to 25 years 25 to 50 years 50 to 75 years 75 to 100 years Over 100 years Figure 3. Numbers of Local Bridges by Age. (Source: Kansas Local NBI Data) Some of the deficient bridges are replaced by counties using local revenues. The current federalaid program for replacing local bridges uses Surface Transportation Program (STP) funds through the Off-System Bridge Program. This program is currently funded at approximately $8 million per year, which is sufficient to replace about 16 bridges per year using the current design standards and procedures for a federal-aid bridge project. The current replacement rate is not sufficient to significantly reduce the number of deficient bridges on the local system. 4
11 Although many of these deficient bridges are located on very low-volume roads, they are critical to Kansas agriculture industry. There is usually significant political pressure from local residents to replace these deficient bridges rather than close them. A study performed by Mulinazzi, et al (3), investigated, for a variety of traffic volumes and detour lengths, the comparison of highway agency costs to replace and maintain a bridge versus the user costs to detour around a closed bridge. The goal was to provide a tool that local elected officials could use to justify to their constituents the closure of some bridges when they could no longer be maintained to safely carry traffic. Surprisingly, the study results indicate that, even at traffic volumes in the range of 10 vehicles per day, the user costs over the 75-year assumed life of a bridge are sufficient to justify repair or replacement of the structure. There are obviously other factors that need to be considered, particularly the agency s ability to pay on a system-wide basis, but it is not anticipated that local agencies will be closing enough bridges to provide much contribution to reducing the numbers of deficient bridges in the future. In short, there appear to be only two ways to address the current and anticipated numbers of deficient bridges on the local system: 1) increase the amount of funding available for bridge replacements, and/or 2) allow more cost-effective or lower cost, design alternatives in appropriate locations utilizing federal-aid funds. In an effort to address these needs, KDOT has recently implemented a new state-funded program for local agencies that will provide funding for replacement of some of their deficient bridges. The program targets bridges ranging from 20 to 50 feet in length on roads with traffic volumes of 100 vpd or less, which comprise approximately one-half of all deficient locally-owned bridges. Funding levels are based on low-cost bridge options with features that are considered appropriate for very low-volume, and therefore low-risk, applications. The dollars available for this program 5
12 are limited and subject to legislative and other actions that may limit KDOT s revenues. Although it will be helpful, the program in itself will not come close to solving the locallyowned deficient bridge problem. Funding for local bridges may come from one or a combination of three sources: local revenues, state funds, and federal funds. In the current political climate at all levels of government, it is not anticipated that there will be a significant increase in the dollars made available to transportation from any of these sources in the foreseeable future. As a result, it is recommended that low-cost alternatives, such as those being used in the state-funded program, be explored that would reduce the cost of individual federal-aid bridge projects and allow replacement of a greater number of the deficient bridges with the limited amount of dollars available. OPTIONAL BRIDGE DESIGNS Typical bridges constructed under the Federal-Aid Off-System Bridge Program in Kansas are either reinforced concrete box culverts (RCB), rigid frame box culverts (RFB) or reinforced concrete haunched slab span bridges (RCSH). While these are all very good structures and have proven themselves over the years, the cost to construct them is difficult to justify on very lowvolume rural roads. In addition the cost of the bridge for the roadway itself, these projects all provide for either approach guardrail work or involve extending the culverts to an appropriate clear zone. As a result, the typical investment of federal dollars in one of these structures is nearly $500,000. This does not include the matching cost to the local agency for construction and inspection or the total cost of design, right-of-way acquisition, and utility relocations. 6
13 There are a number of counties in Kansas and elsewhere in the region that replace bridges regularly using their own funds. There are a number of fabricators who serve this market by offering low-cost bridge designs that are structurally sound and adequately meet the needs of a location that is unlikely to see traffic volumes of more than a few dozen vehicles per day during its lifetime. Although these designs meet the applicable structural and geometric design criteria, the bridge railings are lightweight and untested. Typically the rail is simply a W-beam rail mounted on standard guardrail posts or other light structural steel shape attached to the bridge with brackets. The rail is terminated with a blunt end and there is no approach guardrail. Object markers are installed at each corner of the bridge to delineate the end of the rail. These types of bridges are currently being constructed in a number of Kansas counties. When contractors are used for the construction, the prices range from less than $100,000 for a 20-foot long structure to around $140,000 for a 50-foot long bridge. (13) Since these are modular bridges produced by a number of manufacturers having their own specific design details, the upfront design effort is substantially less than a typical federal-aid bridge project. Two representative examples of these low-cost bridges are shown in Figures 4 and 5. A sample set of plans is included in Appendix F. 7

14 Figure 4. Low-Cost Bridge Design for Very Low-Volume Local Roads. Steel Girder Bridge. 8

15 Figure 5. Low-Cost Bridge Design for Very Low-Volume Local Roads. Precast concrete bridge. AASHTO CRITERIA There is a substantial amount of recognition in AASHTO documents of the unique characteristics of low-volume local roads and the challenges of making the most effective decisions on how to expend the limited funds available for these roads. Following is a brief summary of the AASHTO guidance. The AASHTO publication, A Policy on Geometric Design of Highways and Streets (Greenbook) (4), is the primary reference that provides guidelines and accepted engineering practices for 9
16 design of roads and streets. In addition to providing minimum values for the design of a variety of roadway features, the document also emphasizes a goal of cost-effective design by indicating that results may need to be modified to meet the needs-versus-funds challenges that highway administrators face (4, p. xlii). Based on this approach, dollars should be spent where they provide the greatest benefit to the system as a whole, rather than individual project sites. AASHTO outlines a hierarchy of functional classification that essentially replicates the system adopted by the Federal Highway Administration (FHWA) and is based on a number of factors, including connectivity of urban areas, trip length, and travel densities, as well as others. The local road network is the lowest level in this hierarchy and consists of roads that serve the primary function of providing access to adjacent land. Trips on these roads are typically of shorter distance, and most of the drivers have driven the road before and are familiar with the features of a particular road. Because of this function, many of these roads also have very low traffic volumes. Supplementing the Greenbook, AASHTO has also published the Guidelines for Geometric Design of Very Low-Volume Local Roads (ADT<400) (Low-Volume Guide) (5) to address criteria and considerations that are appropriate for the unique characteristics of these roads. The Low-Volume Guide recommends a rational approach to safety and discourages the expenditure of safety funds at sites where little safety benefit will be recognized (5, p. 2). The guidelines were based on a risk assessment approach that established criteria for very low-volume roads which, when applied system-wide, will provide safety similar to the guidelines in the Greenbook for higher-volume roads. The philosophy is based on safety concerns, but in recognition of the limited funds available for a very large local system, recommends that dollars only be used where there is likely to be an actual safety benefit in return. Based on the risk assessment 10
17 approach, AASHTO found that, even though there are clear safety benefits to providing an area free of obstacles on the roadside, it is generally not cost-effective to provide a clear zone on very low-volume local roads. Similarly, the use of guardrail or other barriers was also found to not be cost-effective. Determination of whether to provide a clear zone or install barriers on these very low-volume roads should be based on site-specific conditions and the engineering judgment of the designer. AASHTO s Roadside Design Guide (6) has, since its original publication, recognized the need to allow flexibility in the application of roadside safety principles. It promotes economic evaluation of alternative measures so the projects that are built are the ones that best meet the public s need for safety and mobility. The Guide has previously provided the ROADSIDE analysis program and currently supports the Roadside Safety Analysis Program (RSAP) as methods to analyze features to determine the cost-effectiveness of improvements. Also included in the most recent version of the Roadside Design Guide is a chapter providing guidance on roadside safety recommendations for low-volume roads and streets. This chapter recognizes that it may not be practical to design low-volume roads to the same criteria as higher volume facilities. It recommends that it may be more effective to provide smaller improvements across the system rather than focus on bringing individual sites up to the highest possible level of safety. In regard to bridges, this recommendation means that bridges in urban or low-volume roads that carry low traffic volumes, reduced speeds, or both may not need bridge railings designed to the same standard as bridge railings on high-speed, high-volume facilities (2, p. 7-9). The guidelines also state that under some circumstances (e.g., extremely low traffic volumes or approach speeds, good sight distance, and low probability of a severe crash), a decision to use no approach guardrail may be appropriate (2, p 12-7). 11
18 REVIEW OF RELEVANT SAFETY RESEARCH Although there appears to have been limited research efforts that are focused on the analysis and development of warrants/guidelines for bridge rail/approach guardrail on low-volume roads, a few studies have been done. Not insignificantly, one of these studies involved the review of sites in Kansas, while the other two are from Midwest states with locally-owned roads that have many similarities to those in Kansas. In 2012, Schrum et al. (7) conducted a study for the Midwest States Pooled Fund Crash Test Program to determine cost-effective roadside safety treatments for low-volume roads. This study was focused on roadways with traffic volumes less than 500 vehicles per day and legal speed limits of 55 mph or greater. A benefit-cost analysis, utilizing the Roadside Safety Analysis Program (RSAP) was performed for a variety of roadside features and treatment options. Depending on the minimum benefit-to-cost ratio selected to establish a warrant (This is an administrative decision to be made by the highway agency. In Kansas the minimum B/C ratio to approve a countermeasure is usually in the range of 2 to 4, depending on the situation.), the study found little justification for replacement of existing untested bridge railings with approved bridge rails on roads with traffic volumes under 350 vpd. Bigelow et al. (8) conducted a study in 2010 in the State of Iowa in which an analysis was performed regarding crashes on bridge rails and approach guardrails on low-volume road bridges in that state. The study involved statistical and benefit-cost analyses for the use of bridge rails and approach guardrails based on the bridge and crash features. Roadways included in the study 12
19 were those with traffic volumes less than or equal to 400 vpd and legal speed limit of 45 mph or higher. Benefit-to-cost analyses were done on a statewide basis, not for individual bridges, to compare the expected safety benefit of upgrading these systems to current standards versus the cost of making the improvement. This study found that, system-wide, the benefit-to-cost analyses resulted in very low B/C ratios, which would indicate that upgrading the bridge rails and approach guardrails to a current design is not cost-effective. Gates and Noyce (9) studied bridge approach guardrails on low-volume roads in Minnesota. The target of this study was to determine the average daily traffic volume at which the benefit-to-cost ratio for installation of approach guardrail on county-state-aid bridges in Minnesota exceeds 1.0. Based on a statistical and benefit-to-cost approach, the study recommended that approach guardrails be used on bridges with ADT equal to or greater than 400 vpd; bridges with ADT between 150 and 400 vpd should be studied individually to determine the appropriate treatment; and on bridges with ADT under 150 vpd, it is not cost-effective to install approach guardrail. POLICIES OF OTHER STATE TRANSPORTATION AGENCIES Several other state agencies currently have policies that allow bridges with no approach guardrails to be constructed using federal or state dollars. Following is a summary of the policies of three states in the same geographic region as Kansas. Iowa Department of Transportation in their Instructional Memorandum No (10) recommends that, in general, approach guardrails should be installed on all newly constructed bridges on the Farm-to-Market system and on federal-aid bridges where the speed limit exceeds 13
20 35 mph. However, several exceptions are provided where, if all are met, it is not required that an approach guardrail be installed. These exceptions are: 1. Current ADT is less than 400 vpd. 2. Structure is 24 feet or greater in width. 3. Structure is on tangent alignment. 4. Benefit/cost ratio is less than Bridge width is greater than the approach roadway width. The Illinois Department of Transportation Bureau of Local Roads and Streets Manual (11) does not require a bridge approach roadside barrier on the traffic approach end of the bridge if at least one of the following conditions applies: 1. The posted speed limit is less than 25 mph on an uncurbed section. 2. The ADT is less than 150 vpd, the bridge is at least the same width as the approach roadway, and the bridge is on tangent alignment. 3. A township or road district bridge is wider than the approaching roadway and the bridge is on tangent alignment. Approach barrier need on the downstream end (two-way traffic) is determined by whether the end of the bridge rail is within the appropriate clear zone. The Missouri Department of Transportation Engineering Policy Guide (12) allows delineating the end of a bridge in lieu of shielding on roads functionally classified as either Local Roads or Collectors where the operating speed is less than 60 mph and the AADT is 400 vpd or less. Elimination of approach barriers is not recommended where there are geometric or sight distance concerns or where there is a history of crashes exceeding the statewide average for similar roads. 14
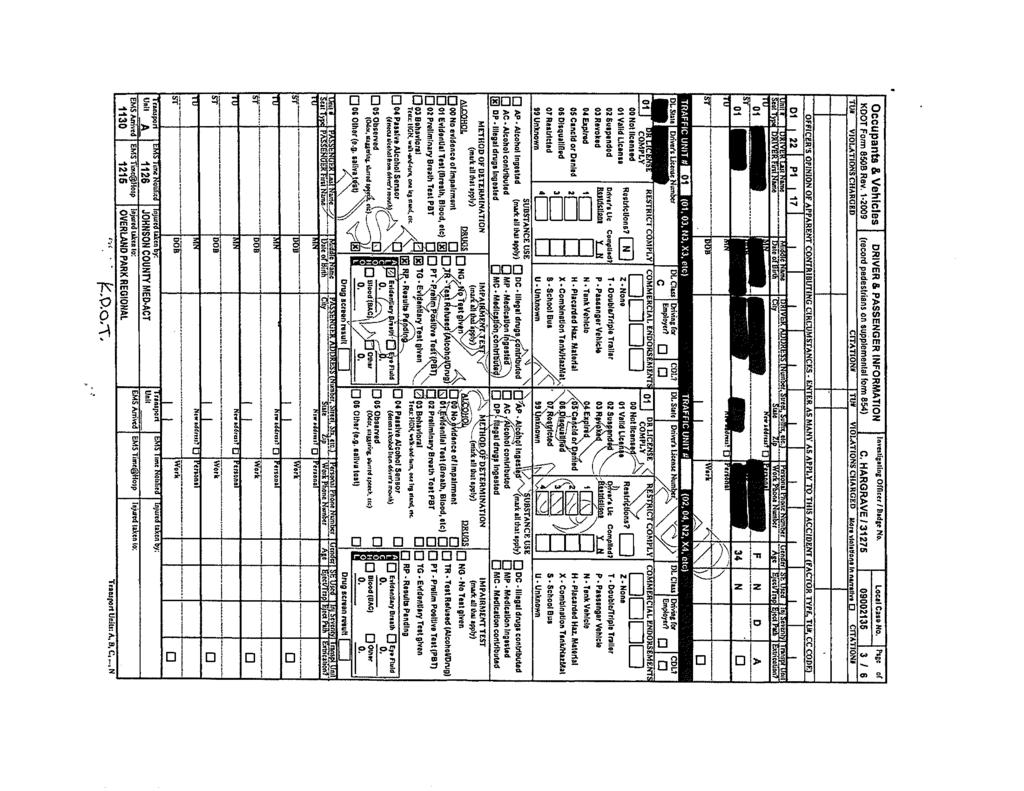
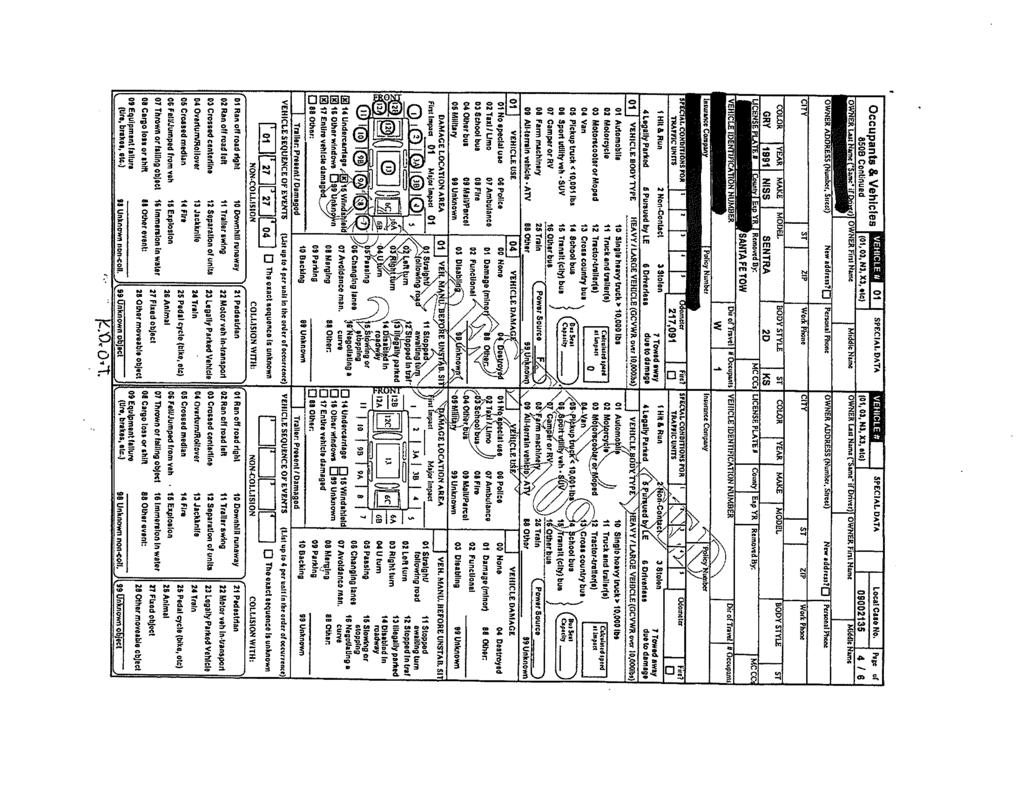
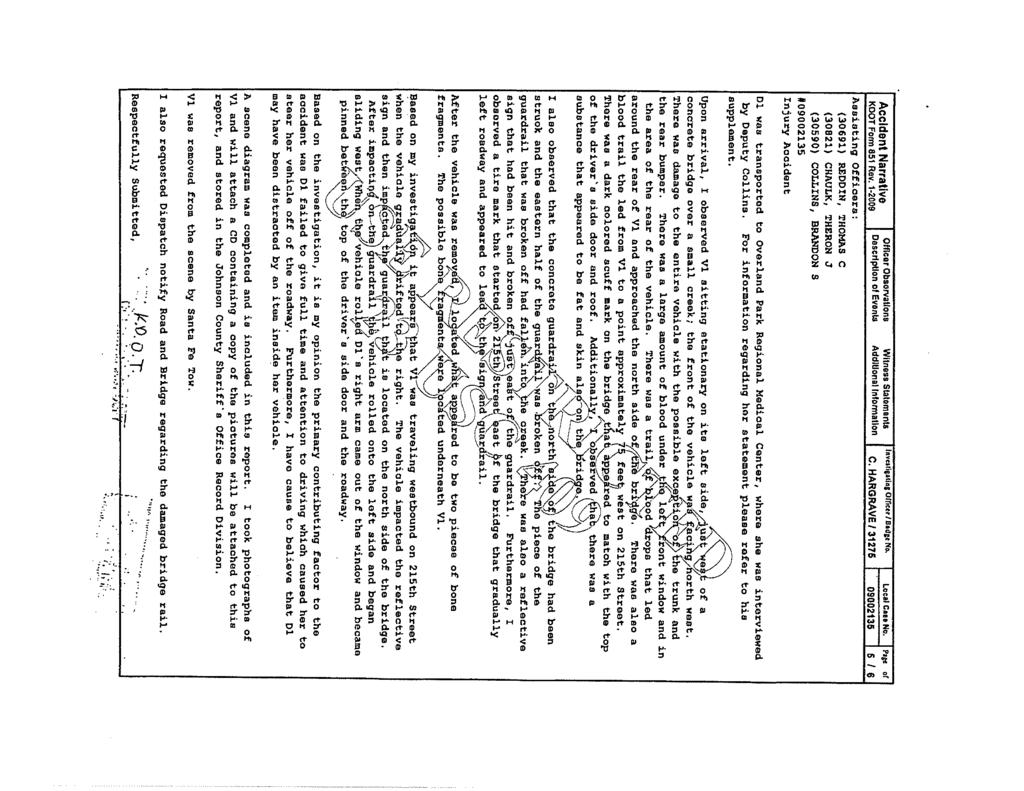
21 KANSAS BRIDGE CRASH DATA COLLECTION AND REVIEW A review of crashes was performed for the 5-year period of 2008 through The total number of reported crashes of all types in Kansas during this period was 306,056. Of these, 10,276 resulted in a fatality or serious injury. The Kansas crash database was queried to obtain data for crashes during this period that occurred on low volume roads and involved a bridge. In recognition of potential differences in terminology used by law enforcement officers in completing the reports, the database queries included a wide range of categories in an effort to capture all of the applicable data points. The query filters included the following: Functional class = Rural Minor Collector or Rural Local Road Surface type = Gravel or Dirt Crash type = Fixed Object Object type = Bridge Structure, Bridge Rail, Guard Rail, Culvert, Embankment, Curb, or Barricade The resulting crash data set included, for the five-year period, a total of 1,433 crashes, 30 of which were fatal and 65 of which were serious injury. All of the fatal and serious injury crash reports were reviewed. In addition, all of the crash reports for non-fatal/non-serious injury crashes were reviewed for crashes involving bridge structure (167 crashes), bridge rail (200 crashes), and guardrail (90 crashes). The remaining 15
22 categories of non-fatal/non-serious injury crashes were spot-reviewed since none of the fatal or serious injury crashes were in these categories and it would appear unlikely that a bridge crash would be miscoded to these categories. These included culvert (358 crashes, 74 reviewed), embankment (485 crashes, 48 reviewed), curb (31 crashes, 3 reviewed), and barricade (7 crashes, 1 reviewed). The review focused on determining the applicability of each crash to the specific parameters of this study which are as follows: functional classification of rural local road, average daily traffic less than or equal to 50 vpd, and bridge length of 50 ft. or less. Google Maps were used to locate structures from the location information on the crash report and, if available, to get a street view look at the site; this location was then found on KDOT s K-GATE GIS system, which has a link to the Bridge Structure Inventory and Appraisal Sheet that was used to determine if the structure is in fact a bridge and if its geometry applicable. The review yielded a total of 3 fatal crashes and 2 serious injury crashes in the five-year period on bridges meeting the parameters outlined previously. An additional 69 applicable crashes were identified that were coded as something other than fatal or serious injury. A complete breakdown of the crashes including the number of crashes that are applicable to the focus of this effort is shown in Table 1. 16
23 TABLE 1. SUMMARY OF CRASH REVIEW LOW VOLUME ROAD BRIDGE CRASHES Bridge Structure Bridge Rail Culvert Curb Embankment Barricade Guardrail Total Total Crashes Fatal Serious Injury non Fatal/Non Ser. Inj Crashes Applicable to Study Fatal 2 1 N/A N/A N/A N/A N/A 3 Serious Injury 1 1 N/A N/A N/A N/A N/A 2 non Fatal/Non Ser. Inj N/A N/A N/A N/A A rigorous statistical analysis of the crash data was not performed due to staffing and resource constraints. However, some important observations can be made. 1. Of primary importance is that crashes involving shorter bridges on low-volume local roads are extremely rare events. There were a total of 74 reported crashes (all severity levels) of this type over the 5-year review period in comparison to a total of 306,056 crashes of all types across the state in the same period. These crashes represent only 0.02% of the total. Fatal and serious injury crashes of this type account for less than 0.05% (5 out of a total of 10,276) of all fatal and serious injury crashes and % (5 out of 306,056) of all crashes. 2. The vast majority (93.2%) of crashes involving shorter bridges on low-volume local roads did not involve a fatality or serious injury. Factors that could contribute to the low rate of serious crashes include possible lower speeds due to the normally rougher surface on very low volume roads and/or geometric features that drivers recognize as requiring lower speed to safely travel. Additionally, driver familiarity with the road could be a 17
24 factor. Analysis of the factors that could influence the severity of crashes on low-volume local roads is beyond the scope of this current effort. 3. The percentage of fatal crashes relative to all crashes on shorter bridges on low-volume roads (3/74 or 4.05%) is higher than the percentage of all fatal crashes in relation to all crashes on Kansas roads during the review period (1,992/306,056 or 0.65%). The percentage of serious injury crashes relative to all serious injury crashes on shorter bridges on low-volume roads (2/74 or 2.7%) is the same as the percentage of all serious injury crashes relative to all crashes in Kansas during the review period (8,284/ or 2.7%). It should be noted that, due to the very small number of crashes with lowvolume bridges, the proportion of fatal crashes should be considered cautiously. Statistically, the confidence interval for this small group is very large, ranging from about 1.4% to 11.2% at the 95% confidence level. An increase or decrease of only one event can have a large effect on the rate, changing it by about 1.35%. As a result, one cannot interpret the data to indicate that a crash with a low-volume bridge is more likely to result in a fatality than any crash occurring in the State. 4. The bridge crashes identified as applicable to this study were primarily on tangent sections. However, there were a large number of crashes with non-bridge size structures and other features that occurred either on or immediately adjacent to a horizontal curve or intersection. Although the analysis of this factor is beyond the scope of this study, it does indicate that roadway alignment needs to be considered in developing the final recommendations. 18
25 5. All of the fatal crashes and one of the two serious injury crashes occurred on narrow bridges ranging in width from 15 to 21. Any new bridge constructed using state or federal funds will have a roadway width of at least 24, which will make the bridge railings less likely to be impacted. BENEFIT COST ANALYSES The final task performed as part of this investigation involved performing benefit-to-cost analyses to determine the efficacy of the various alternatives for some generalized typical bridge sites. The analyses were conducted using the Roadside Safety Analysis Program (RSAP), a probability-based encroachment tool that predicts crash costs associated with roadside features. Because the investigation is focused on bridges ranging from 20 to 50 feet in length, the analysis was performed on the two extremes with the assumption that if the recommended alternative is the same for both, then it could be applied to the entire range of lengths. Similarly, the high end of the traffic volume range (50 vpd) was evaluated with the assumption that it is a worst case scenario for this investigation. For each scenario, three safety treatment options were identified as being practical for a lowvolume road application. These are: 1. Bridge structure with no bridge rail. 2. Bridge structure with a w-beam rail (non-tested) and blunt end terminals. 3. Bridge structure with a w-beam rail (non-tested) and crashworthy end terminals. 19
26 Obviously there are other alternatives that could be considered, including the construction of crashworthy bridge railings along with approach guardrails with crashworthy end terminals and bridge-approach transitions. Because of the initial cost of this kind of improvement in comparison to a reasonably expected benefit on a road with 50 vpd, it was decided to evaluate this alternative only if the B/C of one of the w-beam bridge rail alternatives exceeds 1.0. Several general assumptions were made in the development of the datasets and modeling of the site characteristics. These include: 1. The minimum width of a new bridge will be 24 feet, which is consistent with the recommendations for an agricultural access road in AASHTO s Low-Volume Guide(5). 2. The roadway being investigated is a two-wheel-path road 24-feet in width with traffic generally located in the center of the roadway. Assuming a width of traveled way equal to 10 feet, this would provide the equivalent of a 7-foot wide shoulder on each side. 3. Design speed is 55 mph. This is the statutory speed limit for roads in Kansas unless posted otherwise. This is considered to be a conservative assumption for roads of this type. 4. The construction costs used for all alternatives only included the cost of the w-beam and/or end terminals on both sides of the roadway. No grading, R/W, or utility adjustments costs were included. This was done to provide the most conservative b/c possible. If these alternates are not cost beneficial using the lower costs, then any additional cost would make them even less cost beneficial. 5. Height of the structure above the stream or ground underneath is 13 feet. 20
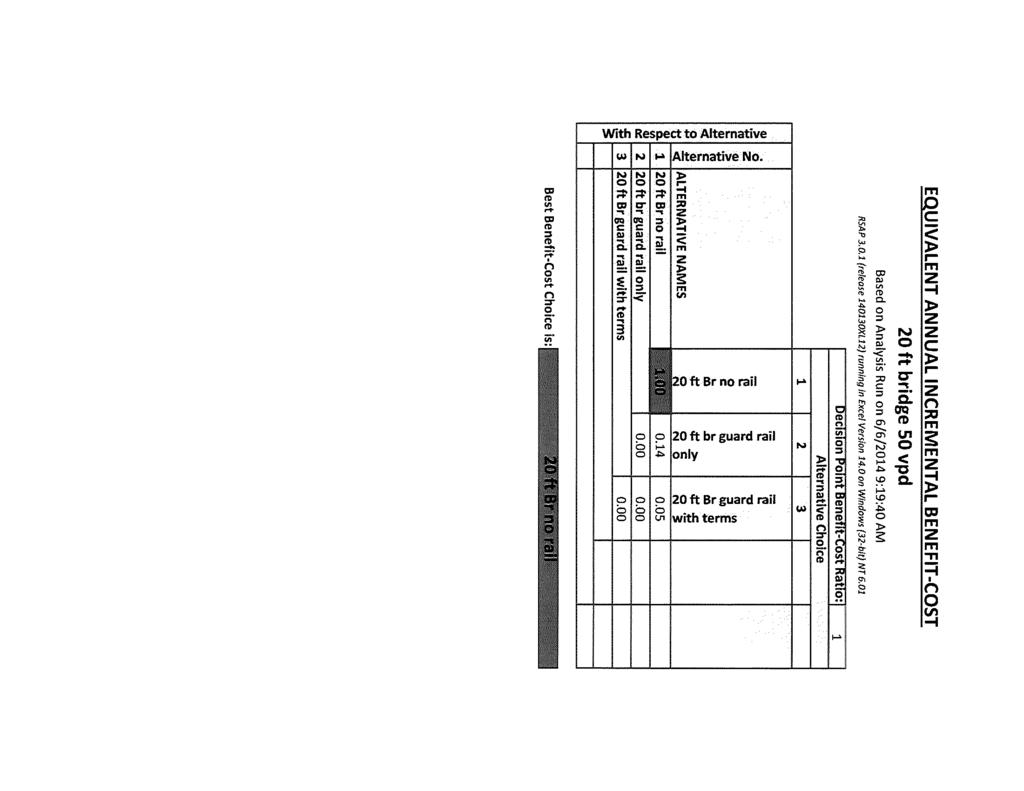
27 Initially, the analysis was done using RSAP Version 2.0.3, which is the version provided as part of the 2006 AASHTO Roadside Design Guide (14) and still in widespread use by the industry. Due to some shortcomings in this version of the program and the inability to specifically consider a bridge with no side rail, Alternative 1 (Base Alternate) was modeled as a road with a vertical slope. This is the condition that most closely resembles the bridge drop-off condition. The results of the analysis using RSAP Version are shown in Tables 2 and 3. TABLE 2. RSAP B/C RESULTS FOR 20-FOOT LONG BRIDGE Alternates Description of Alternate Incremental B/C 1 20 Ft. Bridge, No Rail 2 20 Ft. Bridge with W beam rail, blunt end terminals Ft. Bridge with W beam rail, crashworthy end terminals 0.20 TABLE 3. RSAP B/C RESULTS FOR A 50-FOOT LONG BRIDGE Alternates Description of Alternate Incremental B/C 1 50 Ft. Bridge, No Rail 2 50 Ft. Bridge with W beam rail, blunt end terminals Ft. Bridge with W beam rail, crashworthy end terminals 0.16 RSAP Version has more recently become available. This version of the program was developed to address the shortcomings of Version and to add a more user-friendly interface and more comprehensive model of roadway and roadside features. Although this version has not yet been adopted by KDOT, it was decided to repeat the analyses using this version because 21
28 these improvements allow for a more accurate modeling of the features being considered. The following parameter changes were made. 1. The roadway was analyzed as a one lane, one way roadway with 50 VPD all in the same direction. It should be noted that using a one way roadway with all traffic in the same direction will yield the same results as two-way traffic split 50/50 because the configuration would be identical regardless of direction. 2. Alternative 1 (Base Alternative) was modeled as a Bridge Edge, Medium Hazard. This hazard type more accurately reflects the condition being considered when compared to the hazard in the previous analysis. The results of these analyses are shown in Tables 4 and 5. TABLE 4. RSAP B/C RESULTS FOR A 20-FOOT LONG BRIDGE Alternates Description of Alternate Incremental B/C 1 20 Ft. Bridge, No Rail 2 20 Ft. Bridge with W beam rail, blunt end terminals Ft. Bridge with W beam rail, crashworthy end terminals 0.00 TABLE 5. RSAP B/C RESULTS FOR A 50-FOOT LONG BRIDGE Alternates Description of Alternate Incremental B/C 1 50 Ft. Bridge, No Rail 2 50 Ft. Bridge with W beam rail, blunt end terminals Ft. Bridge with W beam rail, crashworthy end terminals
29 As can be seen in the tables, the results from both versions are very similar. In all cases the B/C of adding a rail to the bridge is substantially lower than 1.0, which is generally considered the break even point for an investment. The generally accepted threshold for deciding to make a road or bridge improvement based on a B/C analysis is between 2.0 and 4.0. KDOT typically uses a B/C of 2.0 as the minimum to support that decision. Based on these thresholds, it is clear that the addition of a guardrail cannot be justified on a purely economic basis. Regardless of the results of this analysis, engineering judgment would lead one to consider the installation of the w-beam guardrail. This railing will provide delineation of the edge of the bridge deck, helping to funnel the traffic across the bridge, and it provides some redirection capability for lower speed traffic that might drift toward the edge at a low angle. To determine if there would be support for installing a w-beam bridge rail, an analysis was performed using RSAP using the feature, Bridge Edge, High Hazard. This hazard is of the most severe type and assumes there is a fatality each time a vehicle encroaches on it. Although this is for extreme conditions that don t exist in Kansas, it should be considered to establish an upper limit for decision-making. The results of this analysis are shown in Tables 6 and 7. TABLE 6. RSAP B/C RESULTS FOR A 20-FOOT LONG HIGH-HAZARD BRIDGE EDGE Alternates Description of Alternate Incremental B/C 1 20 Ft. Bridge, No Rail 2 20 Ft. Bridge with W beam rail, blunt end terminals Ft. Bridge with W beam rail, crashworthy end terminals
30 TABLE 7. RSAP B/C RESULTS FOR A 50-FOOT LONG HIGH-HAZARD BRIDGE EDGE Alternates Description of Alternate Incremental B/C 1 50 Ft. Bridge, No Rail 2 50 Ft. Bridge with W beam rail, blunt end terminals Ft. Bridge with W beam rail, crashworthy end terminals 0.02 As the tables indicate, even when a fatality is expected every time a vehicle departs the bridge, the B/C of installing a w-beam rail with blunt ends is just above the theoretical break-even point and substantially below the KDOT threshold. The B/C for installation of w-beam rail with crashworthy end terminals is well below the break-even point. As a result, neither installation is supported by the economic analysis. Details of the input and output for the RSAP analyses are included in Appendices G and H. CONCLUSIONS The analyses show that the risk of fatal or serious injury crashes occurring at shorter low-volume bridges is very low. In addition, on a system-wide basis, the costs of including a crash-tested bridge rail and properly installed approach guardrail section cannot be justified because they exceed the anticipated reductions in crash costs. In addition to the work completed in this study, there is ample support from AASHTO for using lower design criteria on very low-volume roads. Significant among AASHTO guidelines are the 24
31 AASHTO Low Volume Guide s allowance of no clear zone and its conclusion that barriers in general are not cost effective on very low-volume roads. Any new bridge constructed under this guideline will be no less than 24 feet in width. AASHTO s Roadside Design Guide provides information regarding the application of roadside safety principles, including the clear zone concept and guidelines for installation of various kinds of safety hardware. The clear zone recommended by the Guide for roads with less than 700 vpd is generally 6 to 10. For traffic volumes less than 50 vpd it would be appropriate to use the lower end values of this range. For two-wheel path roads (most rural local roads under 50 vpd are two-wheel path roads) the vehicles are driving in the center of the traveled way. Assuming a 12 driving lane in the center, a 6 clear zone would be provided on a bridge that is 24 wide. Therefore, the bridge rail is outside the clear zone and not likely to be struck. Previous studies in several states in the Midwest region have reached similar conclusions that upgrading to current bridge rail designs and/or installing approach guardrail are not recommended for locations with very low traffic volumes. RECOMMENDATIONS Although the findings of this investigation would support a policy that does not require installation of bridge rails on structures between 20 ft. and 50 ft. on roads functionally classified as Local Roads with less than 50 vpd traffic, it is recognized that there are benefits of the rail that cannot be evaluated by this effort. That is, they provide delineation to all drivers by indicating where the edge of the structure is located; additionally even a lightweight, non-tested rail has the ability to redirect some low-angle and/or low speed impacts. As a result it is recommended that 25
32 bridge rails installed on new or rehabilitated bridges utilizing federal funds could be of a nontested design if the structure meets the set of conditions outlined below. This non-tested design is constructed of a w-beam guardrail section mounted on standard guardrail posts that are fastened to the bridge structure either by welding or a bolted connection. In addition, no approach guardrail will be required on these bridges. In order to use this design, the bridge would need to meet all of the following conditions: 1. The bridge is located on a road functionally classified as a Local Road. 2. Traffic volume is less than or equal to 50 vpd. 3. The approach roadway is a two-wheel path road. 4. Roadway surface on approaches is gravel, sand or dirt. 5. Maximum length of bridge is 50 feet. 6. The new structure shall be no less than 24 ft. wide 7. Bridge is not located on or adjacent to a curve or intersection. 8. A Type 3 object marker shall be installed at each end of the bridge rails. 26
33 REFERENCES 1. Ross, H., Sicking, D., Zimmer, R., and Michie, J., National Cooperative Highway Research Program Report 350: Recommended Procedures for the Safety Performance Evaluation of Highway Features, Transportation Research Board, Washington, D.C., Manual for Assessing Safety Hardware, American Association of State Highway and Transportation Officials (AASHTO), Washington, D.C., Mulinazzi, T., Schrock, S., Fitzsimmons, E., and Roth, R., Economic Impact of Closing Low-Volume Rural Bridges, Kansas Department of Transportation K-TRAN Research Program, A Policy on Geometric Design of Highways and Streets, American Association of State Highway and Transportation Officials (AASHTO), Washington, D.C., Guidelines for Geometric Design of Very Low-Volume Local Roads (ADT<400), American Association of State Highway and Transportation Officials (AASHTO), Washington, D.C., Roadside Design Guide, Fourth Edition, American Association of State Highway and Transportation Officials (AASHTO), Washington, D.C., Schrum, K., Lechtenberg, K., Stolle, C., Faller, R., and Sicking, D., Cost-Effective Safety Treatments for Low-Volume Roads, MwRSF Research Report No. TRP , Midwest States Pooled Fund Program, Bigelow, J., Hans, Z., and Phares, B., Bridge Rail and Approach Railing For Low- Volume Roads in Iowa, Research paper presented at the 2011 Transportation Research Board Annual Meeting. 9. Gates, T. and Noyce, D., The Safety and Cost-Effectiveness of Bridge-Approach Guardrail for County State-Aid (CSAH) Bridges in Minnesota, Minnesota Department of Transportation, Traffic Barriers (Guardrail and Bridge Rail), Instructional Memorandum To Local Public Agencies, I.M. No , Iowa Department of Transportation,
34 11. Bureau of Local Roads and Streets Manual, Chapter 35 Roadside Safety, Illinois Department of Transportation, Engineering Policy Guide, Section Guardrail, Missouri Department of Transportation, last update Interview with and bid price examples provided by Mr. Tim Stallman, Decatur County Road Supervisor. 14. Roadside Design Guide, Third Edition, American Association of State Highway and Transportation Officials (AASHTO), Washington, D.C.,
35 APPENDIX A FATAL CRASHES Bridge Structure COUNTY_NAME Year ACCIDENT_KEY MEET CRITERIA? BRIDGE NUMBER ELLIS N NEMAHA Y BR # ?? OTTAWA Y BR # Bridge Rail COUNTY_NAME Year ACCIDENT_KEY MEET CRITERIA? BRIDGE NUMBER GREENWOOD N MEADE N JACKSON N RENO Y BR # Culvert COUNTY_NAME Year ACCIDENT_KEY MEET CRITERIA? BRIDGE NUMBER BOURBON N RICE N RICE N OSAGE N NEOSHO N CLOUD N SEWARD N Curb COUNTY_NAME Year ACCIDENT_KEY MEET CRITERIA? BRIDGE NUMBER SEDGWICK N Embankment COUNTY_NAME Year ACCIDENT_KEY MEET CRITERIA? BRIDGE NUMBER KINGMAN N BARTON N ELLSWORTH N BARBER N CLAY N CLAY N DONIPHAN N DOUGLAS N HARPER N MIAMI N ROOKS N SMITH N BROWN N MARSHALL N OSAGE N A 1
36 APPENDIX B SERIOUS INJURY CRASHES Bridge Structure COUNTY_NAME Year ACCIDENT_KEY MEET CRITERIA? BRIDGE NUMBER LINCOLN N BARTON N DOUGLAS N MIAMI Y BR # OSAGE N SALINE N FRANKLIN N MIAMI N SEDGWICK N WABAUNSEE N FINNEY N Bridge Rail COUNTY_NAME Year ACCIDENT_KEY MEET CRITERIA? BRIDGE NUMBER DECATUR N LYON N MCPHERSON N NEMAHA N SEDGWICK N NEOSHO N JOHNSON Y BR # Culvert COUNTY_NAME Year ACCIDENT_KEY MEET CRITERIA? BRIDGE NUMBER ELLIS N ELLSWORTH N JACKSON N MARION N SALINE N SEDGWICK N BUTLER N CHEROKEE N CRAWFORD N WABAUNSEE N WABAUNSEE N WOODSON N Barricade COUNTY_NAME Year ACCIDENT_KEY MEET CRITERIA? BRIDGE NUMBER SEDGWICK N B 1
37 Ditch COUNTY_NAME Year ACCIDENT_KEY MEET CRITERIA? BRIDGE NUMBER CHEYENNE N WABAUNSEE N Embankment COUNTY_NAME Year ACCIDENT_KEY MEET CRITERIA? BRIDGE NUMBER BROWN N CLOUD N COFFEY N ELLIS N HODGEMAN N JACKSON N MCPHERSON N MORRIS N OSAGE N WASHINGTON N MARION N ANDERSON N ATCHISON N CLAY N COWLEY N CRAWFORD N DICKINSON N DOUGLAS N FINNEY N MIAMI N MITCHELL N NEMAHA N SUMNER N WYANDOTTE N BUTLER N JEFFERSON N NEMAHA N GRAHAM N LEAVENWORTH N MORRIS N REPUBLIC N SEDGWICK N B 2
38 APPENDIX C NON FATAL OR SERIOUS INJURY CRASHES Bridge Structure COUNTY_NAME Year ACCIDENT_KEY MEET CRITERIA? BRIDGE NUMBER ALLEN N BOURBON N CHAUTAUQUA Y BR # CHEROKEE N GRAHAM N KINGMAN N MIAMI N PAWNEE N RICE N ALLEN N ATCHISON Y BR # ATCHISON N ATCHISON N BOURBON N BUTLER N BUTLER N BUTLER N BUTLER N BUTLER N BUTLER N BUTLER N BUTLER N BUTLER Y Br # BUTLER N CLAY N CLOUD Y Br # COFFEY N COWLEY N COWLEY N COWLEY N COWLEY Y BR # COWLEY N CRAWFORD N CRAWFORD N CRAWFORD N CRAWFORD N DICKINSON N DICKINSON N DONIPHAN N ELLSWORTH N FRANKLIN N FRANKLIN N C 1
39 GEARY N GEARY N GEARY N GREENWOOD N GREENWOOD N HARPER JEFFERSON N JOHNSON N KINGMAN Y BR # KINGMAN N LABETTE N LABETTE N LABETTE N LINCOLN N LINCOLN N LINN N LYON N MCPHERSON Y BR # MCPHERSON N MIAMI N MIAMI N MIAMI N MIAMI N MITCHELL N MORRIS N NEMAHA Y Bridge is removed NEOSHO N NEOSHO Y BR # NESS N OSAGE N OTTAWA N PAWNEE N PAWNEE N PAWNEE Y BR # POTTAWATOMIE N POTTAWATOMIE N RICE Y BR # RUSSELL N SALINE N SEDGWICK N SEDGWICK SEDGWICK N SHAWNEE N WILSON N Y Appears to be bridge. No bridge in inventory at this location. C 2
40 WILSON N WOODSON N WOODSON N WOODSON N CLAY N DONIPHAN N JACKSON N CHEROKEE N OSAGE N LABETTE N BUTLER N SUMNER N ANDERSON N SEDGWICK N ATCHISON N ATCHISON Y BR # BARTON N BARTON N BOURBON N Butler N BUTLER N BUTLER N BUTLER N BUTLER N CHEROKEE N CHEROKEE Y BR # CHEROKEE N CHEROKEE N CLARK N CLAY N CLOUD N COFFEY N COWLEY N CRAWFORD N DICKINSON N DOUGLAS N DOUGLAS N DOUGLAS N ELK N FRANKLIN N GOVE N GREENWOOD N HARPER N HARVEY N KIOWA LABETTE Y BR # LABETTE N C 3
41 LABETTE N LABETTE N LABETTE N LEAVENWORTH N LINN MARION N MCPHERSON Y BR # MCPHERSON N MEADE N MIAMI N MIAMI N MIAMI N MONTGOMERY N MONTGOMERY N MORRIS N NEOSHO N NEOSHO N OSAGE N OSAGE N OSBORNE N POTTAWATOMIE N RENO N RENO N RICE N SEDGWICK N WILSON N WOODSON N CRAWFORD N DOUGLAS N PRATT N SHAWNEE Y BR # DOUGLAS N KINGMAN N LINN N BridgeRail COUNTY_NAME Year ACCIDENT_KEY MEET CRITERIA? BRIDGE NUMBER ALLEN Y BR # BUTLER Y BR # BUTLER N BUTLER N CHASE N COWLEY N GRAY N MARION N MARSHALL N NESS N C 4
42 OSAGE N OSAGE N PHILLIPS Y BR # POTTAWATOMIE N SEDGWICK N SHERIDAN WABAUNSEE N WILSON N BUTLER N DOUGLAS N EDWARDS Y BR # NEOSHO N RICE Y BR # ANDERSON N ATCHISON N BARBER N BARTON N BOURBON N BOURBON N BOURBON N BROWN Y BR # BROWN N BUTLER N BUTLER N BUTLER N BUTLER N BUTLER Y BR # BUTLER N BUTLER Y BR # CHEYENNE N CLOUD N CLOUD N COFFEY Y BR # COMANCHE N COWLEY N COWLEY N CRAWFORD N CRAWFORD Y BR # DICKINSON N DOUGLAS N DOUGLAS N ELLIS N ELLSWORTH N FORD N FORD N FRANKLIN N FRANKLIN N C 5
43 FRANKLIN N FRANKLIN N FRANKLIN N GEARY N GRAHAM N GREENWOOD N HARPER Y BR # HARPER N JACKSON N JACKSON Y BR # JACKSON N JACKSON ? JACKSON N JEFFERSON Y BR # JOHNSON N KEARNY N KINGMAN N KINGMAN N LABETTE N LABETTE N LYON N MCPHERSON N MCPHERSON Y BR # MCPHERSON N MCPHERSON Y BR # MCPHERSON Y BR # MEADE N MIAMI N MIAMI N MIAMI N MIAMI N MIAMI N MONTGOMERY N MONTGOMERY N MONTGOMERY N MONTGOMERY N MORRIS N MORRIS N NEMAHA N NEMAHA N NORTON N OSAGE N OTTAWA N PAWNEE Y BR # PHILLIPS Y BR # PHILLIPS N POTTAWATOMIE N C 6
44 PRATT N RENO N REPUBLIC Y BR # RICE N ROOKS N ROOKS N SALINE N SALINE Y BR # SALINE N SEDGWICK N SEDGWICK N SEDGWICK N SEDGWICK N SEDGWICK Y BR # SEDGWICK N SHAWNEE Y BR # STAFFORD Y BR # SUMNER N SUMNER Y BR # SUMNER N THOMAS Y BR # WASHINGTON N WASHINGTON N WILSON Y BR # WILSON N WOODSON N CLAY N CLAY N DOUGLAS N NEOSHO N SEDGWICK N SMITH Y BR # SMITH N BUTLER N ALLEN N ANDERSON N ANDERSON N BUTLER N BUTLER Y BR # CHAUTAUQUA N CHEROKEE N CLOUD Y BR # DICKINSON N DONIPHAN N DOUGLAS N FRANKLIN N FRANKLIN N C 7
45 FRANKLIN N FRANKLIN N FRANKLIN N GRAHAM N GRAHAM N GREELEY N GREENWOOD N HARVEY N JACKSON N JEFFERSON N JOHNSON N KEARNY KEARNY KINGMAN N LABETTE N LINCOLN N MARSHALL Y BR # MCPHERSON Y BR # MCPHERSON N MIAMI N MIAMI N MIAMI N MIAMI N MITCHELL N MONTGOMERY N MORRIS N MORRIS N MORRIS Y BR # MORRIS N NEMAHA N NEOSHO N NEOSHO N POTTAWATOMIE N REPUBLIC Y BR # REPUBLIC N SEDGWICK N SEDGWICK N SEDGWICK N SHAWNEE N SHAWNEE N SHERIDAN N SUMNER Y BR # WABAUNSEE N WASHINGTON Y BR # WASHINGTON N WOODSON N FRANKLIN N C 8
46 MIAMI Y BR # JACKSON N GuardRail COUNTY_NAME Year ACCIDENT_KEY MEET CRITERIA? BRIDGE NUMBER ELLIS Y BR # GREENWOOD N JOHNSON N LABETTE N SEDGWICK N WASHINGTON N WILSON N BARBER N MIAMI Y BR # ANDERSON N BARTON N BUTLER N BUTLER N BUTLER N CHASE N CHEROKEE N CHEYENNE N CRAWFORD N DOUGLAS N ELLIS N FRANKLIN N FRANKLIN N GEARY N HARVEY Y BR # HARVEY N HARVEY N JACKSON Y BR # JEFFERSON N KEARNY N LINN N MARION N MARSHALL Y BR # MCPHERSON N MEADE Y BR # MIAMI N MIAMI N MONTGOMERY Y BR # MONTGOMERY N NEMAHA N OSAGE N OSAGE N POTTAWATOMIE N C 9
47 POTTAWATOMIE N RILEY N RUSSELL N SALINE N SEDGWICK N SEDGWICK Y BR # SHAWNEE Y BR # SUMNER N SUMNER N WABAUNSEE N NORTON Y BR # OTTAWA N DICKINSON N SHAWNEE N COFFEY N NEMAHA Y BR # SEWARD N BARBER Y BR # BARBER Y BR # BROWN N BUTLER N BUTLER N BUTLER N BUTLER N CRAWFORD N CRAWFORD N DOUGLAS N ELLIS N ELLSWORTH N FRANKLIN N HARVEY Y BR # JEFFERSON N JOHNSON Y BR # JOHNSON N JOHNSON Y BR # LYON N MARSHALL N MARSHALL N MIAMI N MIAMI N MIAMI N MIAMI N MONTGOMERY N OSAGE N PRATT N REPUBLIC N SALINE N C 10
48 SHAWNEE N Culvert COUNTY_NAME Year ACCIDENT_KEY MEET CRITERIA? BRIDGE NUMBER ANDERSON N BUTLER N CHAUTAUQUA N COWLEY N COWLEY N COWLEY N CRAWFORD N DICKINSON N DOUGLAS N FINNEY N FRANKLIN N FRANKLIN N GREENWOOD N GREENWOOD N HARPER N LABETTE N LOGAN N LYON N NEOSHO N PRATT N RICE N RUSSELL N SALINE N SALINE N SEDGWICK N SEDGWICK N SHAWNEE N WABAUNSEE N WASHINGTON N CLAY N RENO N BOURBON N OTTAWA N DICKINSON N ELLIS N DOUGLAS N MCPHERSON N MITCHELL N SEDGWICK N STAFFORD N WOODSON N ALLEN N ANDERSON N C 11
49 ANDERSON ANDERSON ANDERSON BARBER BARTON BARTON BARTON BARTON BARTON N BARTON BARTON BOURBON BROWN BUTLER BUTLER BUTLER BUTLER BUTLER BUTLER N BUTLER BUTLER BUTLER BUTLER BUTLER BUTLER BUTLER BUTLER BUTLER CHAUTAUQUA N CHEROKEE CHEROKEE CHEROKEE CHEROKEE CHEROKEE CLARK CLAY CLOUD CLOUD CLOUD N COFFEY COFFEY COFFEY COWLEY COWLEY COWLEY COWLEY COWLEY C 12
50 COWLEY CRAWFORD N CRAWFORD DICKINSON DOUGLAS DOUGLAS DOUGLAS DOUGLAS DOUGLAS ELK ELLIS ELLIS N ELLSWORTH FINNEY FINNEY FINNEY FORD FRANKLIN GRAY HARPER HARVEY HARVEY HARVEY N HARVEY HARVEY HODGEMAN JEFFERSON JOHNSON JOHNSON JOHNSON JOHNSON KEARNY LABETTE N LEAVENWORTH LYON LYON LYON MARION MARSHALL MCPHERSON MCPHERSON MCPHERSON MIAMI N MIAMI MITCHELL MONTGOMERY MONTGOMERY C 13
51 MONTGOMERY MORRIS NEOSHO NEOSHO NEOSHO NEOSHO N NEOSHO OSAGE PAWNEE POTTAWATOMIE POTTAWATOMIE POTTAWATOMIE POTTAWATOMIE RENO RENO RICE N RICE ROOKS ROOKS RUSSELL RUSSELL RUSSELL SALINE SALINE SALINE SALINE N SALINE SALINE SEDGWICK SEDGWICK SEDGWICK SEDGWICK SEDGWICK SEDGWICK SEDGWICK SEDGWICK N SEDGWICK SEDGWICK SEDGWICK SEDGWICK SHAWNEE SHAWNEE SHAWNEE SHAWNEE SHAWNEE SUMNER N SUMNER C 14
52 SUMNER THOMAS WABAUNSEE WABAUNSEE WILSON WILSON WOODSON WOODSON WOODSON N HARVEY LOGAN NEMAHA RICE RUSH BOURBON COWLEY CRAWFORD GRANT HARVEY N MARSHALL MCPHERSON NORTON OSAGE CHEYENNE JACKSON OSAGE WOODSON BUTLER BUTLER N DOUGLAS RUSH WILSON WOODSON COFFEY ALLEN ALLEN ALLEN ALLEN ALLEN N ANDERSON BARTON BOURBON BOURBON BROWN BROWN BUTLER BUTLER C 15
53 BUTLER BUTLER N BUTLER BUTLER BUTLER BUTLER BUTLER BUTLER CHEROKEE CHEROKEE CHEROKEE CHEROKEE N CLARK COFFEY COWLEY CRAWFORD CRAWFORD CRAWFORD DOUGLAS DOUGLAS DOUGLAS ELLSWORTH N FINNEY FRANKLIN FRANKLIN HARPER HARPER HARPER HARPER HARVEY HARVEY HARVEY N HARVEY HARVEY HARVEY HARVEY JACKSON JEFFERSON JEFFERSON KINGMAN LABETTE LABETTE N LABETTE LEAVENWORTH LEAVENWORTH LEAVENWORTH LEAVENWORTH C 16
54 LINCOLN LINN LINN LYON MARION N MCPHERSON MCPHERSON MCPHERSON MIAMI MONTGOMERY MONTGOMERY MONTGOMERY MORRIS MORRIS NEOSHO N NEOSHO NEOSHO OSAGE PHILLIPS RENO RENO RENO REPUBLIC RICE RUSH N SALINE SEDGWICK SEDGWICK SEDGWICK SEDGWICK SEDGWICK SEDGWICK SEDGWICK SEDGWICK SEWARD N SMITH SUMNER SUMNER WASHINGTON WILSON WILSON WOODSON DONIPHAN MCPHERSON BUTLER N BUTLER COWLEY C 17
55 CRAWFORD CRAWFORD DICKINSON DOUGLAS DOUGLAS HODGEMAN MARION MARSHALL N MITCHELL OSAGE REPUBLIC SALINE SEDGWICK TREGO TREGO WASHINGTON DOUGLAS SEDGWICK N SEDGWICK ATCHISON GEARY JACKSON LANE SEDGWICK MONTGOMERY SALINE BUTLER COFFEY N FINNEY GEARY HARVEY NEMAHA SUMNER Curb COUNTY_NAME Year ACCIDENT_KEY MEET CRITERIA? BRIDGE NUMBER CHEYENNE SEDGWICK SEDGWICK SEDGWICK SALINE N SEDGWICK SEDGWICK KINGMAN SEDGWICK SEDGWICK SEDGWICK C 18
56 JOHNSON RUSSELL JOHNSON LEAVENWORTH N MIAMI POTTAWATOMIE RENO SEDGWICK SHAWNEE HASKELL JOHNSON MEADE REPUBLIC RILEY N SEDGWICK SEDGWICK STAFFORD LABETTE SEDGWICK BARTON Barricade COUNTY_NAME Year ACCIDENT_KEY MEET CRITERIA? BRIDGE NUMBER EDWARDS COWLEY GRANT RICE N SALINE ALLEN BUTLER Embankment COUNTY_NAME Year ACCIDENT_KEY MEET CRITERIA? BRIDGE NUMBER BARBER BARTON BOURBON CHAUTAUQUA CHAUTAUQUA CHEROKEE CHEROKEE N CLOUD DOUGLAS ELLIS ELLIS GEARY GEARY GRANT C 19
57 GREELEY HARPER JEFFERSON N JEFFERSON JEFFERSON LEAVENWORTH LEAVENWORTH LEAVENWORTH MIAMI MITCHELL MONTGOMERY NORTON OTTAWA N PAWNEE RILEY RUSSELL SEDGWICK SUMNER THOMAS TREGO WABAUNSEE WASHINGTON ANDERSON N BOURBON BUTLER BUTLER BUTLER BUTLER BUTLER BUTLER CHAUTAUQUA COWLEY COWLEY N COWLEY DICKINSON DICKINSON DONIPHAN DOUGLAS DOUGLAS DOUGLAS DOUGLAS DOUGLAS EDWARDS N ELLIS ELLIS ELLIS FINNEY C 20
58 FRANKLIN FRANKLIN GRAHAM GREENWOOD HARPER HARPER N JACKSON JACKSON JOHNSON LABETTE LEAVENWORTH LEAVENWORTH LEAVENWORTH LEAVENWORTH LEAVENWORTH LEAVENWORTH N LEAVENWORTH LYON NEMAHA NORTON POTTAWATOMIE POTTAWATOMIE POTTAWATOMIE POTTAWATOMIE POTTAWATOMIE RENO N RENO RILEY SALINE SEDGWICK SHAWNEE SHERIDAN STEVENS TREGO WABAUNSEE WILSON N BARTON MARION SEDGWICK CLAY ELLIS GREENWOOD JEFFERSON JOHNSON LABETTE LANE N MARSHALL C 21
59 BUTLER CLAY FORD LABETTE LANE MONTGOMERY MONTGOMERY ROOKS BUTLER N CLAY DOUGLAS JEWELL JOHNSON LABETTE MCPHERSON SEWARD SHAWNEE ANDERSON ATCHISON N ATCHISON ATCHISON ATCHISON BARTON BARTON BARTON BARTON BARTON BARTON BARTON N BARTON BARTON BARTON BARTON BARTON BARTON BARTON BARTON BARTON BROWN N BUTLER BUTLER BUTLER BUTLER BUTLER BUTLER BUTLER BUTLER C 22
60 BUTLER BUTLER N CHAUTAUQUA CHAUTAUQUA CHEYENNE CLAY CLOUD CLOUD CLOUD COMANCHE COWLEY COWLEY N COWLEY COWLEY COWLEY COWLEY COWLEY CRAWFORD CRAWFORD CRAWFORD CRAWFORD DICKINSON N DICKINSON DICKINSON DICKINSON DICKINSON DICKINSON DONIPHAN DONIPHAN DOUGLAS DOUGLAS DOUGLAS N DOUGLAS DOUGLAS DOUGLAS DOUGLAS DOUGLAS DOUGLAS DOUGLAS DOUGLAS DOUGLAS DOUGLAS N DOUGLAS ELLIS ELLIS ELLIS ELLIS C 23
61 ELLIS FINNEY FINNEY FORD FRANKLIN N FRANKLIN GEARY GEARY GRAHAM GRAHAM GRAHAM GRAY GREENWOOD GREENWOOD HARPER N HARPER HARVEY HARVEY JACKSON JEFFERSON JEFFERSON JEFFERSON JEFFERSON JEFFERSON JOHNSON N JOHNSON JOHNSON KINGMAN KINGMAN KINGMAN KINGMAN KINGMAN KIOWA LEAVENWORTH LEAVENWORTH N LEAVENWORTH LEAVENWORTH LEAVENWORTH LEAVENWORTH LEAVENWORTH MARION MARION MARSHALL MARSHALL MARSHALL N MCPHERSON MCPHERSON C 24
62 MCPHERSON MCPHERSON MCPHERSON MIAMI MITCHELL MITCHELL MITCHELL MITCHELL N MONTGOMERY MORRIS MORTON NEMAHA NEMAHA NEMAHA NEMAHA NEMAHA NEMAHA NEMAHA N NEMAHA NORTON NORTON NORTON OSAGE OSAGE OSAGE PAWNEE POTTAWATOMIE POTTAWATOMIE N POTTAWATOMIE POTTAWATOMIE POTTAWATOMIE RENO RICE RICE RICE RILEY RILEY RILEY N RILEY ROOKS RUSSELL SALINE SALINE SALINE SCOTT SEDGWICK SEDGWICK C 25
63 SEDGWICK N SEDGWICK SEDGWICK SHAWNEE SHAWNEE SHAWNEE SHAWNEE SHAWNEE SHAWNEE SHAWNEE SMITH N SMITH SMITH SMITH SUMNER SUMNER SUMNER WABAUNSEE WABAUNSEE WASHINGTON WASHINGTON N WASHINGTON WILSON WILSON WOODSON WYANDOTTE ANDERSON BARTON BUTLER CLOUD DOUGLAS N DOUGLAS ELLIS HARPER BARTON BUTLER KINGMAN ATCHISON ATCHISON ATCHISON ATCHISON N ATCHISON ATCHISON BARBER BARBER BARTON BARTON C 26
64 BARTON BARTON BARTON BARTON N BARTON BARTON BARTON BARTON BARTON BARTON BROWN BUTLER BUTLER CHEROKEE N CLAY CLOUD COWLEY COWLEY DICKINSON DONIPHAN DONIPHAN DONIPHAN DOUGLAS DOUGLAS N DOUGLAS DOUGLAS DOUGLAS DOUGLAS DOUGLAS ELLIS ELLIS FINNEY FORD FRANKLIN N FRANKLIN FRANKLIN GEARY GRAHAM GRANT GRAY HARPER HARPER HARVEY HASKELL N HASKELL HODGEMAN JACKSON C 27
65 JEFFERSON JEFFERSON JEFFERSON JEFFERSON JEFFERSON JOHNSON JOHNSON N JOHNSON JOHNSON JOHNSON JOHNSON KINGMAN KIOWA LABETTE LEAVENWORTH LEAVENWORTH LEAVENWORTH N LEAVENWORTH LEAVENWORTH LEAVENWORTH LEAVENWORTH LEAVENWORTH LEAVENWORTH LINCOLN LYON LYON LYON N MARION MARSHALL MARSHALL MCPHERSON MCPHERSON MCPHERSON MIAMI MITCHELL MONTGOMERY MONTGOMERY N MONTGOMERY MORRIS NEMAHA NEMAHA NEMAHA NEMAHA NEMAHA NEOSHO NORTON OTTAWA N C 28
66 PAWNEE PHILLIPS POTTAWATOMIE POTTAWATOMIE POTTAWATOMIE POTTAWATOMIE POTTAWATOMIE PRATT PRATT PRATT N RENO REPUBLIC RICE SALINE SEDGWICK SEDGWICK SEDGWICK SEDGWICK SHAWNEE TREGO N WABAUNSEE WASHINGTON WASHINGTON WASHINGTON WASHINGTON WILSON WOODSON BROWN BUTLER DOUGLAS N LEAVENWORTH OTTAWA REPUBLIC WABAUNSEE WILSON SALINE JACKSON JEFFERSON ATCHISON CHEROKEE N OSAGE ELLIS FRANKLIN GREENWOOD NORTON RILEY SEDGWICK C 29
67 SHERIDAN C 30
68 APPENDIX D CRASH REPORTS FATAL CRASHES AT SHORT BRIDGES ON LOW VOLUME LOCAL ROADS
69
70
71
72
73
74
75
76
77
78
79
80
81 APPENDIX E CRASH REPORTS SERIOUS INJURY CRASHES AT SHORT BRIDGES ON LOW VOLUME LOCAL ROADS
82
83
84
85
86
87
88
89
90
91
92 APPENDIX F SAMPLE PLAN SET SHOWING ONE OPTIONAL LOW COST BRIDGE DESIGN
93
94
95
96 APPENDIX G BENEFIT/COST ANALYSES USING RSAP VERSION 2.03
97 Roadside Safety Analysis Program Version Date: June 05, 2014 Time: 13:03:51PM File Name: Project Description: Alternative Description 20 ft 50 vpd.rpd 20 ft bridge 1 20 ft bridge no rail 2 20 ft bridge with rail no terms 3 20 ft bridge with rail with terms Alternative Alternative Benefit/Cost Ratio Report Page: 1 G1
98 Roadside Safety Analysis Program Version Date: June 05, 2014 Time: 13:03:51PM File Name: Project Description: Alternative Description 20 ft 50 vpd.rpd 20 ft bridge 1 20 ft bridge no rail 2 20 ft bridge with rail no terms 3 20 ft bridge with rail with terms Alternative Cost Report Annual Annual Annual Annual Expected Crash Crash Installation Maintenance Repair Alternative Frequency (Acc/Yr) Cost ($) Cost ($) Cost ($) Cost ($) Page: 2 G2
99 Roadside Safety Analysis Program Version Date: June 05, 2014 Time: 13:03:51PM Feature Cost Report Page: 3 File Name: Project Description: 20 ft 50 vpd.rpd 20 ft bridge Alternative: 1 Description: 20 ft bridge no rail Distance From Expected Beginning Of Crash Average Annual Crash Feature First Segment Freq (Acc/Year) Severity Cost ($) Category Type Foreslopes 2:1, H = 2.0 m (7 ft) Foreslopes Vertical, H = 4.0 m (13 ft) Foreslopes 2:1, H = 2.0 m (7 ft) G3
100 Roadside Safety Analysis Program Version Date: June 05, 2014 Time: 13:03:51PM Feature Cost Report Page: 4 File Name: Project Description: 20 ft 50 vpd.rpd 20 ft bridge Alternative: 2 Description: 20 ft bridge with rail no terms Distance From Expected Beginning Of Crash Average Annual Crash Feature First Segment Freq (Acc/Year) Severity Cost ($) Category Type Foreslopes 2:1, H = 2.0 m (7 ft) Terminals and Crash Cushions Blunt End Longitudinal Barriers TL-2 Guardrail Foreslopes 2:1, H = 2.0 m (7 ft) G4
101 Roadside Safety Analysis Program Version Date: June 05, 2014 Time: 13:03:51PM Feature Cost Report Page: 5 File Name: Project Description: 20 ft 50 vpd.rpd 20 ft bridge Alternative: 3 Description: 20 ft bridge with rail with terms Distance From Expected Beginning Of Crash Average Annual Crash Feature First Segment Freq (Acc/Year) Severity Cost ($) Category Type Foreslopes 2:1, H = 2.0 m (7 ft) Terminals and Crash Cushions TL-3 Guardrail Terminal Longitudinal Barriers TL-2 Guardrail Terminals and Crash Cushions TL-3 Guardrail Terminal Foreslopes 2:1, H = 2.0 m (7 ft) G5
102 Roadside Safety Analysis Program Version Date: June 05, 2014 Time: 13:03:51PM Input Data Report Page: 6 File Name: Project Description: 20 ft 50 vpd.rpd 20 ft bridge Alternavtive Description 1[Baseline(Existing)Condition] Life(years) 25 Total Installation Cost ($) 0.00 Annual Maintenance Cost ($) 0.00 Discount Rate ft bridge no rail Area Type Rural Functional Class Local Highway Type Two-Way, Undivided Number of Lanes 2 Lane Width(ft) 10.0 Shoulder Width(ft) 7.0 Speed Limit(mph) 55.0 Nominal Percent Truck(%) 10.0 ADT 100 Traffic Growth Factor(%) 0.0 Encroachment Rate Adjustment Factor 1 Random Seed Number 1111 (User Specified) Median Percent Curvature Curvature Segment Length(ft) Width(ft) Grade(%) Direction Radius(ft) None G6
103 Roadside Safety Analysis Program Version Date: June 05, 2014 Time: 13:03:51PM Input Data Report Page: 7 File Name: Project Description: 20 ft 50 vpd.rpd 20 ft bridge Alternative 1 [Baseline(Existing) Conditions] Feature Category Type 1 Foreslopes 2:1, H = 2.0 m (7 ft) 2 Foreslopes Vertical, H = 4.0 m (13 ft) 3 Foreslopes 2:1, H = 2.0 m (7 ft) G7
104 Roadside Safety Analysis Program Version Date: June 05, 2014 Time: 13:03:51PM Input Data Report Page: 8 File Name: Project Description: 20 ft 50 vpd.rpd 20 ft bridge Alternative 1 [Baseline(Existing) Conditions] Feature Length(ft) Width(ft) Flare Rate Location Offset(ft) Distance(ft) Repetitions Spacing(ft) Right Right Right G8
105 Roadside Safety Analysis Program Version Date: June 05, 2014 Time: 13:03:51PM Input Data Report Page: 9 File Name: Project Description: 20 ft 50 vpd.rpd 20 ft bridge Alternavtive 2 Description Life(years) 25 Total Installation Cost ($) Annual Maintenance Cost ($) 0.00 Discount Rate ft bridge with rail no terms Area Type Rural Functional Class Local Highway Type Two-Way, Undivided Number of Lanes 2 Lane Width(ft) 10.0 Shoulder Width(ft) 7.0 Speed Limit(mph) 55.0 Nominal Percent Truck(%) 10.0 ADT 100 Traffic Growth Factor(%) 0.0 Encroachment Rate Adjustment Factor 1 Random Seed Number 1111 (User Specified) Median Percent Curvature Curvature Segment Length(ft) Width(ft) Grade(%) Direction Radius(ft) None G9
106 Roadside Safety Analysis Program Version Date: June 05, 2014 Time: 13:03:51PM Input Data Report Page: 10 File Name: Project Description: 20 ft 50 vpd.rpd 20 ft bridge Alternative 2 Feature Category Type 1 Foreslopes 2:1, H = 2.0 m (7 ft) 2 Terminals and Crash Cushions Blunt End 3 Longitudinal Barriers TL-2 Guardrail 4 Foreslopes 2:1, H = 2.0 m (7 ft) G10
107 Roadside Safety Analysis Program Version Date: June 05, 2014 Time: 13:03:51PM Input Data Report Page: 11 File Name: Project Description: 20 ft 50 vpd.rpd 20 ft bridge Alternative 2 Feature Length(ft) Width(ft) Flare Rate Location Offset(ft) Distance(ft) Repetitions Spacing(ft) Right Right Right Right G11
108 Roadside Safety Analysis Program Version Date: June 05, 2014 Time: 13:03:51PM Input Data Report Page: 12 File Name: Project Description: 20 ft 50 vpd.rpd 20 ft bridge Alternavtive 3 Description Life(years) 25 Total Installation Cost ($) Annual Maintenance Cost ($) 0.00 Discount Rate ft bridge with rail with terms Area Type Rural Functional Class Local Highway Type Two-Way, Undivided Number of Lanes 2 Lane Width(ft) 10.0 Shoulder Width(ft) 7.0 Speed Limit(mph) 55.0 Nominal Percent Truck(%) 10.0 ADT 100 Traffic Growth Factor(%) 0.0 Encroachment Rate Adjustment Factor 1 Random Seed Number 1111 (User Specified) Median Percent Curvature Curvature Segment Length(ft) Width(ft) Grade(%) Direction Radius(ft) None G12
109 Roadside Safety Analysis Program Version Date: June 05, 2014 Time: 13:03:51PM Input Data Report Page: 13 File Name: Project Description: 20 ft 50 vpd.rpd 20 ft bridge Alternative 3 Feature Category Type 1 Foreslopes 2:1, H = 2.0 m (7 ft) 2 Terminals and Crash Cushions TL-3 Guardrail Terminal 3 Longitudinal Barriers TL-2 Guardrail 4 Terminals and Crash Cushions TL-3 Guardrail Terminal 5 Foreslopes 2:1, H = 2.0 m (7 ft) G13
110 Roadside Safety Analysis Program Version Date: June 05, 2014 Time: 13:03:51PM Input Data Report Page: 14 File Name: Project Description: 20 ft 50 vpd.rpd 20 ft bridge Alternative 3 Feature Length(ft) Width(ft) Flare Rate Location Offset(ft) Distance(ft) Repetitions Spacing(ft) Right Right Right Right Right G14
111 Roadside Safety Analysis Program Version Date: June 05, 2014 Time: 13:05:39PM File Name: Project Description: Alternative Description 50 ft 50 vpd.rpd 50 ft bridge 1 50 ft bridge no rail 2 50 ft bridge with rail no terms 3 50 ft bridge with rail with terms Alternative Alternative Benefit/Cost Ratio Report Page: 1 G15
112 Roadside Safety Analysis Program Version Date: June 05, 2014 Time: 13:05:39PM File Name: Project Description: Alternative Description 50 ft 50 vpd.rpd 50 ft bridge 1 50 ft bridge no rail 2 50 ft bridge with rail no terms 3 50 ft bridge with rail with terms Alternative Cost Report Annual Annual Annual Annual Expected Crash Crash Installation Maintenance Repair Alternative Frequency (Acc/Yr) Cost ($) Cost ($) Cost ($) Cost ($) Page: 2 G16
113 Roadside Safety Analysis Program Version Date: June 05, 2014 Time: 13:05:39PM Feature Cost Report Page: 3 File Name: Project Description: 50 ft 50 vpd.rpd 50 ft bridge Alternative: 1 Description: 50 ft bridge no rail Distance From Expected Beginning Of Crash Average Annual Crash Feature First Segment Freq (Acc/Year) Severity Cost ($) Category Type Foreslopes 2:1, H = 2.0 m (7 ft) Foreslopes Vertical, H = 4.0 m (13 ft) Foreslopes 2:1, H = 2.0 m (7 ft) G17
114 Roadside Safety Analysis Program Version Date: June 05, 2014 Time: 13:05:39PM Feature Cost Report Page: 4 File Name: Project Description: 50 ft 50 vpd.rpd 50 ft bridge Alternative: 2 Description: 50 ft bridge with rail no terms Distance From Expected Beginning Of Crash Average Annual Crash Feature First Segment Freq (Acc/Year) Severity Cost ($) Category Type Foreslopes 2:1, H = 2.0 m (7 ft) Terminals and Crash Cushions Blunt End Longitudinal Barriers TL-2 Guardrail Foreslopes 2:1, H = 2.0 m (7 ft) G18
115 Roadside Safety Analysis Program Version Date: June 05, 2014 Time: 13:05:39PM Feature Cost Report Page: 5 File Name: Project Description: 50 ft 50 vpd.rpd 50 ft bridge Alternative: 3 Description: 50 ft bridge with rail with terms Distance From Expected Beginning Of Crash Average Annual Crash Feature First Segment Freq (Acc/Year) Severity Cost ($) Category Type Foreslopes 2:1, H = 2.0 m (7 ft) Terminals and Crash Cushions TL-3 Guardrail Terminal Longitudinal Barriers TL-2 Guardrail Terminals and Crash Cushions TL-3 Guardrail Terminal Foreslopes 2:1, H = 2.0 m (7 ft) G19
116 Roadside Safety Analysis Program Version Date: June 05, 2014 Time: 13:05:39PM Input Data Report Page: 6 File Name: Project Description: 50 ft 50 vpd.rpd 50 ft bridge Alternavtive Description 1[Baseline(Existing)Condition] Life(years) 25 Total Installation Cost ($) 0.00 Annual Maintenance Cost ($) 0.00 Discount Rate ft bridge no rail Area Type Rural Functional Class Local Highway Type Two-Way, Undivided Number of Lanes 2 Lane Width(ft) 10.0 Shoulder Width(ft) 7.0 Speed Limit(mph) 55.0 Nominal Percent Truck(%) 10.0 ADT 100 Traffic Growth Factor(%) 0.0 Encroachment Rate Adjustment Factor 1 Random Seed Number 1111 (User Specified) Median Percent Curvature Curvature Segment Length(ft) Width(ft) Grade(%) Direction Radius(ft) None G20
117 Roadside Safety Analysis Program Version Date: June 05, 2014 Time: 13:05:39PM Input Data Report Page: 7 File Name: Project Description: 50 ft 50 vpd.rpd 50 ft bridge Alternative 1 [Baseline(Existing) Conditions] Feature Category Type 1 Foreslopes 2:1, H = 2.0 m (7 ft) 2 Foreslopes Vertical, H = 4.0 m (13 ft) 3 Foreslopes 2:1, H = 2.0 m (7 ft) G21
118 Roadside Safety Analysis Program Version Date: June 05, 2014 Time: 13:05:39PM Input Data Report Page: 8 File Name: Project Description: 50 ft 50 vpd.rpd 50 ft bridge Alternative 1 [Baseline(Existing) Conditions] Feature Length(ft) Width(ft) Flare Rate Location Offset(ft) Distance(ft) Repetitions Spacing(ft) Right Right Right G22
119 Roadside Safety Analysis Program Version Date: June 05, 2014 Time: 13:05:39PM Input Data Report Page: 9 File Name: Project Description: 50 ft 50 vpd.rpd 50 ft bridge Alternavtive 2 Description Life(years) 25 Total Installation Cost ($) Annual Maintenance Cost ($) 0.00 Discount Rate ft bridge with rail no terms Area Type Rural Functional Class Local Highway Type Two-Way, Undivided Number of Lanes 2 Lane Width(ft) 10.0 Shoulder Width(ft) 7.0 Speed Limit(mph) 55.0 Nominal Percent Truck(%) 10.0 ADT 100 Traffic Growth Factor(%) 0.0 Encroachment Rate Adjustment Factor 1 Random Seed Number 1111 (User Specified) Median Percent Curvature Curvature Segment Length(ft) Width(ft) Grade(%) Direction Radius(ft) None G23
120 Roadside Safety Analysis Program Version Date: June 05, 2014 Time: 13:05:39PM Input Data Report Page: 10 File Name: Project Description: 50 ft 50 vpd.rpd 50 ft bridge Alternative 2 Feature Category Type 1 Foreslopes 2:1, H = 2.0 m (7 ft) 2 Terminals and Crash Cushions Blunt End 3 Longitudinal Barriers TL-2 Guardrail 4 Foreslopes 2:1, H = 2.0 m (7 ft) G24
121 Roadside Safety Analysis Program Version Date: June 05, 2014 Time: 13:05:39PM Input Data Report Page: 11 File Name: Project Description: 50 ft 50 vpd.rpd 50 ft bridge Alternative 2 Feature Length(ft) Width(ft) Flare Rate Location Offset(ft) Distance(ft) Repetitions Spacing(ft) Right Right Right Right G25
122 Roadside Safety Analysis Program Version Date: June 05, 2014 Time: 13:05:39PM Input Data Report Page: 12 File Name: Project Description: 50 ft 50 vpd.rpd 50 ft bridge Alternavtive 3 Description Life(years) 25 Total Installation Cost ($) Annual Maintenance Cost ($) 0.00 Discount Rate ft bridge with rail with terms Area Type Rural Functional Class Local Highway Type Two-Way, Undivided Number of Lanes 2 Lane Width(ft) 10.0 Shoulder Width(ft) 7.0 Speed Limit(mph) 55.0 Nominal Percent Truck(%) 10.0 ADT 100 Traffic Growth Factor(%) 0.0 Encroachment Rate Adjustment Factor 1 Random Seed Number 1111 (User Specified) Median Percent Curvature Curvature Segment Length(ft) Width(ft) Grade(%) Direction Radius(ft) None G26
123 Roadside Safety Analysis Program Version Date: June 05, 2014 Time: 13:05:39PM Input Data Report Page: 13 File Name: Project Description: 50 ft 50 vpd.rpd 50 ft bridge Alternative 3 Feature Category Type 1 Foreslopes 2:1, H = 2.0 m (7 ft) 2 Terminals and Crash Cushions TL-3 Guardrail Terminal 3 Longitudinal Barriers TL-2 Guardrail 4 Terminals and Crash Cushions TL-3 Guardrail Terminal 5 Foreslopes 2:1, H = 2.0 m (7 ft) G27
124 Roadside Safety Analysis Program Version Date: June 05, 2014 Time: 13:05:39PM Input Data Report Page: 14 File Name: Project Description: 50 ft 50 vpd.rpd 50 ft bridge Alternative 3 Feature Length(ft) Width(ft) Flare Rate Location Offset(ft) Distance(ft) Repetitions Spacing(ft) Right Right Right Right Right G28
125 APPENDIX H BENEFIT/COST ANALYSES USING RSAP VERSION 3.01
126 H1
127 H2
128 H3
129 H4
130 H5
131 H6
132 20 ft bridge 50 vpd TOTAL ALTERNATIVES DEFINED 3 ROADSIDE FEATURES FOR ALTERNATIVE NUMBER: ALTERNATIVE NAME 20 ft Br no rail DEFAULT X-SECTION 1 All 2:1 CONSTRUCTION COST $ - ANNUAL MAINTENANCE COST $ - GENERAL HAZARD TYPE SPECIFIC HAZARD TYPE START STATION START SIDE START OFFSET END STATION END SIDE END OFFSET STATIONS ft STATIONS ft SpecialEdge BridgeEdge_MedHaz R R 17 SpecialEdge BridgeEdge_MedHaz L L 5 PARAMETER VALUE H7
133 ROADSIDE FEATURES FOR ALTERNATIVE NUMBER: 2 ALTERNATIVE NAME 20 ft br guard rail only DEFAULT X-SECTION All 2:1 CONSTRUCTION COST $3,200 ANNUAL MAINTENANCE COST $0 GENERAL HAZARD TYPE SPECIFIC HAZARD TYPE START STATION START SIDE START OFFSET END STATION END SIDE END OFFSET STATIONS ft STATIONS ft Guardrails_SemiRigid TL3WbeamGR R R 17 Width (in.) 12 Guardrails_SemiRigid TL3WbeamGR L L 7 Width (in.) 12 PoleTreeSign Generic Fixed Obj R 17 NA NA NA Dia. (in.) 4 PoleTreeSign Generic Fixed Obj L 7 NA NA NA Dia. (in.) 4 PARAMETER VALUE H8
134 H9
135 H10
136 H11
137 H12
138 H13
139 H14
140 H15
141 H16
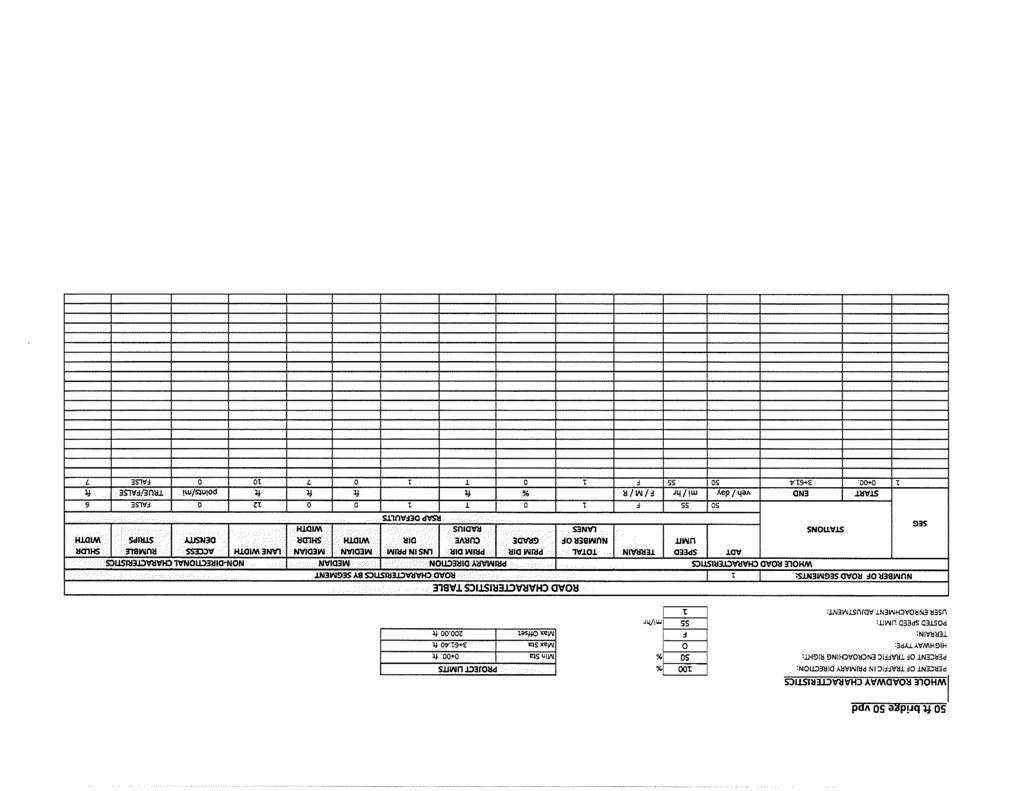
142 50 ft bridge 50 vpd TOTAL ALTERNATIVES DEFINED 3 ROADSIDE FEATURES FOR ALTERNATIVE NUMBER: ALTERNATIVE NAME 50 ft Br no rail DEFAULT X-SECTION 1 All 2:1 CONSTRUCTION COST $ - ANNUAL MAINTENANCE COST $ - GENERAL HAZARD TYPE SPECIFIC HAZARD TYPE START STATION START SIDE START OFFSET END STATION END SIDE END OFFSET STATIONS ft STATIONS ft SpecialEdge BridgeEdge_MedHaz R R 17 SpecialEdge BridgeEdge_MedHaz L L 5 PARAMETER VALUE H17
143 ROADSIDE FEATURES FOR ALTERNATIVE NUMBER: 2 ALTERNATIVE NAME 50 ft br guard rail only DEFAULT X-SECTION All 2:1 CONSTRUCTION COST $8,000 ANNUAL MAINTENANCE COST $0 GENERAL HAZARD TYPE SPECIFIC HAZARD TYPE START STATION START SIDE START OFFSET END STATION END SIDE END OFFSET STATIONS ft STATIONS ft Guardrails_SemiRigid TL3WbeamGR R R 17 Width (in.) 12 Guardrails_SemiRigid TL3WbeamGR L L 7 Width (in.) 12 PoleTreeSign Generic Fixed Obj R 17 NA NA NA Dia. (in.) 4 PoleTreeSign Generic Fixed Obj L 7 NA NA NA Dia. (in.) 4 PARAMETER VALUE H18
144 ROADSIDE FEATURES FOR ALTERNATIVE NUMBER: 3 ALTERNATIVE NAME 50 ft Br guard rail with terms DEFAULT X-SECTION All 2:1 CONSTRUCTION COST $13,000 ANNUAL MAINTENANCE COST $0 GENERAL HAZARD TYPE SPECIFIC HAZARD TYPE START STATION START SIDE START OFFSET END STATION END SIDE END OFFSET STATIONS ft STATIONS ft TerminalEnds GenericEnd R 17 NA NA NA 24 Guardrails_SemiRigid TL3WbeamGR R R 17 Width (in.) 12 TerminalEnds GenericEnd R 17 NA NA NA 24 TerminalEnds GenericEnd L 5 NA NA NA 24 Guardrails_SemiRigid TL3WbeamGR L L 5 Width (in.) 12 TerminalEnds GenericEnd L 5 NA NA NA 24 PARAMETER VALUE H19
145 H20
146 EQUIVALENT ANNUAL INCREMENTAL BENEFIT-COST 20 ft bridge 50 vpd Based on Analysis Run on 6/6/ :50:32 PM RSAP (release XL12) running in Excel Version 14.0 on Windows (32-bit) NT 6.01 Decision Point Benefit-Cost Ratio: Alternative Choice With Respect to Alternative Alternative No. ALTERNATIVE NAMES 20 ft Br no rail 20 ft br guard rail only 20 ft Br guard rail with terms 1 20 ft Br no rail ft br guard rail only ft Br guard rail with terms 0.00 Best Benefit-Cost Choice is: 20 ft br guard rail only H21
147 BASIC INFORMATION Today's date (i.e., run date) 6/30/2014 Title 20 ft bridge 50 vpd Units USCU (only USCU units at this time) Design Life 25 YRS Construction Year 2014 Rate of Return 4 % CRASH COSTS RSAP PROJECT INFORMATION Use GDP values during life? N Expand to current year by GDP? Y GDP Deflator to construction year 1.07 Crash Cost Timeline Base year for crash cost data Cost Used Value of Statistical Life $ 9,100,000 $ 9,295,782 $ 9,295,782 $ 9,295,782 $9,295,782 Reference for VSL Guidance on Treatment of the Economic Value of a Statistical Life, US Department of Transportation, Washington, D.C., October 4, RSAP Root Directory: C:\Program Files\RSAPv3 Notes: H22
148 20 ft bridge 50 vpd TRAFFIC INFORMATION CONSTRUCTION YEAR ADT: TRAFFIC GROWTH WHICH ADT TO USE? MID-LIFE ADT: END OF LIFE ADT: ADT USED BY RSAP 50 vehicles/day 0.0 % growth/yr Construction 50 vehicles/day 50 vehicles/day 50 vehicles/day PERCENT TRUCKS 12 % VEHICLE MIX RSAP VEHICLES FHWA RSAP PERCENT CLASS TYPE TYPICAL CHARACTERISTICS C.G. WEIGHT LENGTH WIDTH Long. % lbs ft ft ft ft Motorcycles M TrajectoryGrid1 RedirectionCars 1 Passenger Cars C 3, TrajectoryGrid2 RedirectionCars 1 PickupTruck PU 5, TrajectoryGrid2 RedirectionCars 1 Light Tractor Trailer LTT 16, TrajectoryGrid3 RedirectionTrucks 0.3 Average Tractor Trailer ATT 22, TrajectoryGrid3 RedirectionTrucks 0.3 Heavy Tractor Trailer HTT 37, TrajectoryGrid3 RedirectionTrucks 0.3 Light Single Unit Truck LSUT 6, TrajectoryGrid4 RedirectionTrucks 0.3 Average Single Unit Truck ASUT 12, TrajectoryGrid4 RedirectionTrucks 0.3 Heavy Single Unit Truck HSUT 22, TrajectoryGrid4 RedirectionTrucks 0.3 C.G. Hgt Crash Cost Adj. Trajectory Information Trajectory Grid Name Redirection Grid Name Encr Multiplier Total Click here for the on-line link to the FHWA classification system. H23
149 20 ft bridge 50 vpd WHOLE ROADWAY CHARACTERISTICS PERCENT OF TRAFFIC IN PRIMARY DIRECTION: 100 % PROJECT LIMITS PERCENT OF TRAFFIC ENCROACHING RIGHT: 50 % Min Sta ft HIGHWAY TYPE: O Max Sta ft TERRAIN: F Max Offset ft POSTED SPEED LIMIT: 55 mi/hr USER ENROACHMENT ADJUSTMENT: 1 SEG EXPECTED EQUIVALENT PASSENGER VEHICLE ENCROACHMENTS ROAD SEGMENT DATA TOTAL PRIMARY DIRECTION OPPOSING DIRECTION START STA END STA SEGMENT BASE ENCR MODIFIED PRIMARY PRIMARY LEFT OPPOSING OPPOSING LENGTH RATE ENCR RATE RIGHT ENCR ENCR RIGHT ENCR LEFT ENCR ft encr/yr encr/yr H24
150 20 ft bridge 50 vpd WHOLE ROADWAY CHARACTERISTICS PERCENT OF TRAFFIC IN PRIMARY DIRECTION: 100 % PROJECT LIMITS PERCENT OF TRAFFIC ENCROACHING RIGHT: 50 % Min Sta ft HIGHWAY TYPE: O Max Sta ft TERRAIN: F Max Offset ft POSTED SPEED LIMIT: 55 mi/hr USER ENROACHMENT ADJUSTMENT: 1 NUMBER OF ROAD SEGMENTS: 1 WHOLE ROAD CHARACTERISTICS ADT SPEED LIMIT STATIONS SEG TERRAIN TOTAL NUMBER OF LANES ROAD CHARACTERISTICS TABLE ROAD CHARACTERISTICS BY SEGMENT MEDIAN PRIM DIR GRADE PRIMARY DIRECTION PRIM DIR CURVE RADIUS LNS IN PRIM DIR RSAP DEFAULTS MEDIAN WIDTH MEDIAN SHLDR WIDTH NON-DIRECTIONAL CHARACTERISTICS LANE WIDTH ACCESS DENSITY RUMBLE STRIPS SHLDR WIDTH F 1 0 T FALSE 6 START END veh / day mi / hr F / M / R % ft ft ft ft points/mi TRUE/FALSE ft F 1 0 T FALSE 7 H25
151 20 ft bridge 50 vpd WHOLE ROADWAY CHARACTERISTICS PERCENT OF TRAFFIC IN PRIMARY DIRECTION: 100 % PROJECT LIMITS PERCENT OF TRAFFIC ENCROACHING RIGHT: 50 % Min Sta ft HIGHWAY TYPE: O Max Sta ft TERRAIN: F Max Offset ft POSTED SPEED LIMIT: 55 mi/hr USER ENROACHMENT ADJUSTMENT: 1 ENCROACHMENT ADJUSTMENTS SEG PRIM DIR ADJ OPPOSING DIR ADJ GRADE HORIZ'L CURVE NUMBER OF GRADE HORIZ'L NUMBER OF SPEED LIMIT RADIUS LANES CURVE RADIUS LANES NON-DIRECTIONAL ADJUSTMENTS LANE WIDTH ACCESS DENSITY RUMBLE STRIPS TERRAIN USER H26
152 20 ft bridge 50 vpd TOTAL ALTERNATIVES DEFINED 3 ROADSIDE FEATURES FOR ALTERNATIVE NUMBER: ALTERNATIVE NAME 20 ft Br no rail DEFAULT X-SECTION 1 All 2:1 CONSTRUCTION COST $ - ANNUAL MAINTENANCE COST $ - GENERAL HAZARD TYPE SPECIFIC HAZARD TYPE START STATION START SIDE START OFFSET END STATION END SIDE END OFFSET STATIONS ft STATIONS ft SpecialEdge BridgeEdge_HighHaz R R 17 SpecialEdge BridgeEdge_HighHaz L L 5 PARAMETER VALUE H27
153 ROADSIDE FEATURES FOR ALTERNATIVE NUMBER: 2 ALTERNATIVE NAME 20 ft br guard rail only DEFAULT X-SECTION All 2:1 CONSTRUCTION COST $3,200 ANNUAL MAINTENANCE COST $0 GENERAL HAZARD TYPE SPECIFIC HAZARD TYPE START STATION START SIDE START OFFSET END STATION END SIDE END OFFSET STATIONS ft STATIONS ft Guardrails_SemiRigid TL3WbeamGR R R 17 Width (in.) 12 Guardrails_SemiRigid TL3WbeamGR L L 7 Width (in.) 12 PoleTreeSign Generic Fixed Obj R 17 NA NA NA Dia. (in.) 4 PoleTreeSign Generic Fixed Obj L 7 NA NA NA Dia. (in.) 4 PoleTreeSign Generic Fixed Obj R 17 NA NA NA Dia. (in.) 4 PoleTreeSign Generic Fixed Obj L 7 NA NA NA Dia. (in.) 4 PARAMETER VALUE H28
154 ROADSIDE FEATURES FOR ALTERNATIVE NUMBER: 3 ALTERNATIVE NAME 20 ft Br guard rail with terms DEFAULT X-SECTION All 2:1 CONSTRUCTION COST $8,200 ANNUAL MAINTENANCE COST $0 GENERAL HAZARD TYPE SPECIFIC HAZARD TYPE START STATION START SIDE START OFFSET END STATION END SIDE END OFFSET STATIONS ft STATIONS ft TerminalEnds GenericEnd R 17 NA NA NA 24 Guardrails_SemiRigid TL3WbeamGR R R 17 Width (in.) 12 TerminalEnds GenericEnd R 17 NA NA NA 24 TerminalEnds GenericEnd L 5 NA NA NA 24 Guardrails_SemiRigid TL3WbeamGR L L 5 Width (in.) 12 TerminalEnds GenericEnd L 5 NA NA NA 24 PARAMETER VALUE H29
155 ANNUAL SEGMENT SUMMARY SEGMENT AND ALTERNATIVE COST SUMMARY 20 ft bridge 50 vpd Based on Analysis Run on 6/6/ :50:32 PM RSAP (release XL12) running in Excel Version 14.0 on Windows (32-bit) NT 6.01 Rate of Return 4 % Design Life 25 yrs A/P Segment Crashes Crash Costs Maintenance Cost Repair Costs Crash Rate (crashes/mvmt) Alternative Alternative # 1 1 $ 0 $ 0 $ 0 $ $ 261 $ $ 205 $ 0 $ $ 20 Alternative # 2 3 $ 525 $ 0 $ $ $ 20 $ 0 Alternative # $ 14 $ 0 Annualized Construction Cost Expected Annual Maintenance Cost Expected Annual Repair Cost Expected Annual Crash Cost H30
156 EQUIVALENT ANNUAL INCREMENTAL BENEFIT-COST 50 ft bridge 50 vpd Based on Analysis Run on 6/6/2014 1:43:00 PM RSAP (release XL12) running in Excel Version 14.0 on Windows (32-bit) NT 6.01 Decision Point Benefit-Cost Ratio: Alternative Choice With Respect to Alternative Alternative No. ALTERNATIVE NAMES 50 ft Br no rail 50 ft br guard rail only 50 ft Br guard rail with terms 1 50 ft Br no rail ft br guard rail only ft Br guard rail with terms 0.00 Best Benefit-Cost Choice is: 50 ft br guard rail only H31
157 BASIC INFORMATION Today's date (i.e., run date) 6/30/2014 Title 50 ft bridge 50 vpd Units USCU (only USCU units at this time) Design Life 25 YRS Construction Year 2014 Rate of Return 4 % CRASH COSTS RSAP PROJECT INFORMATION Use GDP values during life? N Expand to current year by GDP? Y GDP Deflator to construction year 1.07 Crash Cost Timeline Base year for crash cost data Cost Used Value of Statistical Life $ 9,100,000 $ 9,295,782 $ 9,295,782 $ 9,295,782 $9,295,782 Reference for VSL Guidance on Treatment of the Economic Value of a Statistical Life, US Department of Transportation, Washington, D.C., October 4, RSAP Root Directory: C:\Program Files\RSAPv3 Notes: H32
158 50 ft bridge 50 vpd TRAFFIC INFORMATION CONSTRUCTION YEAR ADT: TRAFFIC GROWTH WHICH ADT TO USE? MID-LIFE ADT: END OF LIFE ADT: ADT USED BY RSAP 50 vehicles/day 0.0 % growth/yr Construction 50 vehicles/day 50 vehicles/day 50 vehicles/day PERCENT TRUCKS 10 % VEHICLE MIX RSAP VEHICLES FHWA RSAP PERCENT CLASS TYPE TYPICAL CHARACTERISTICS C.G. WEIGHT LENGTH WIDTH Long. % lbs ft ft ft ft Motorcycles 1 0 M TrajectoryGrid1 RedirectionCars 1 Passenger Cars 2 60 C 3, TrajectoryGrid2 RedirectionCars 1 PickupTruck 3 20 PU 5, TrajectoryGrid2 RedirectionCars 1 Light Tractor Trailer LTT 16, TrajectoryGrid3 RedirectionTrucks 0.3 Average Tractor Trailer ATT 22, TrajectoryGrid3 RedirectionTrucks 0.3 Heavy Tractor Trailer HTT 37, TrajectoryGrid3 RedirectionTrucks 0.3 Light Single Unit Truck 5 0 LSUT 6, TrajectoryGrid4 RedirectionTrucks 0.3 Average Single Unit Truck 6 4 ASUT 12, TrajectoryGrid4 RedirectionTrucks 0.3 Heavy Single Unit Truck 7 0 HSUT 22, TrajectoryGrid4 RedirectionTrucks 0.3 C.G. Hgt Crash Cost Adj. Trajectory Information Trajectory Grid Name Redirection Grid Name Encr Multiplier Total Click here for the on-line link to the FHWA classification system. H33
159 50 ft bridge 50 vpd WHOLE ROADWAY CHARACTERISTICS PERCENT OF TRAFFIC IN PRIMARY DIRECTION: 100 % PROJECT LIMITS PERCENT OF TRAFFIC ENCROACHING RIGHT: 50 % Min Sta ft HIGHWAY TYPE: O Max Sta ft TERRAIN: F Max Offset ft POSTED SPEED LIMIT: 55 mi/hr USER ENROACHMENT ADJUSTMENT: 1 SEG EXPECTED EQUIVALENT PASSENGER VEHICLE ENCROACHMENTS ROAD SEGMENT DATA TOTAL PRIMARY DIRECTION OPPOSING DIRECTION START STA END STA SEGMENT BASE ENCR MODIFIED PRIMARY PRIMARY LEFT OPPOSING OPPOSING LENGTH RATE ENCR RATE RIGHT ENCR ENCR RIGHT ENCR LEFT ENCR ft encr/yr encr/yr H34
160 50 ft bridge 50 vpd WHOLE ROADWAY CHARACTERISTICS PERCENT OF TRAFFIC IN PRIMARY DIRECTION: 100 % PROJECT LIMITS PERCENT OF TRAFFIC ENCROACHING RIGHT: 50 % Min Sta ft HIGHWAY TYPE: O Max Sta ft TERRAIN: F Max Offset ft POSTED SPEED LIMIT: 55 mi/hr USER ENROACHMENT ADJUSTMENT: 1 NUMBER OF ROAD SEGMENTS: 1 WHOLE ROAD CHARACTERISTICS ADT SPEED LIMIT STATIONS SEG TERRAIN TOTAL NUMBER OF LANES ROAD CHARACTERISTICS TABLE ROAD CHARACTERISTICS BY SEGMENT MEDIAN PRIM DIR GRADE PRIMARY DIRECTION PRIM DIR CURVE RADIUS LNS IN PRIM DIR RSAP DEFAULTS MEDIAN WIDTH MEDIAN SHLDR WIDTH NON-DIRECTIONAL CHARACTERISTICS LANE WIDTH ACCESS DENSITY RUMBLE STRIPS SHLDR WIDTH F 1 0 T FALSE 6 START END veh / day mi / hr F / M / R % ft ft ft ft points/mi TRUE/FALSE ft F 1 0 T FALSE 7 H35
161 50 ft bridge 50 vpd WHOLE ROADWAY CHARACTERISTICS PERCENT OF TRAFFIC IN PRIMARY DIRECTION: 100 % PROJECT LIMITS PERCENT OF TRAFFIC ENCROACHING RIGHT: 50 % Min Sta ft HIGHWAY TYPE: O Max Sta ft TERRAIN: F Max Offset ft POSTED SPEED LIMIT: 55 mi/hr USER ENROACHMENT ADJUSTMENT: 1 ENCROACHMENT ADJUSTMENTS SEG PRIM DIR ADJ OPPOSING DIR ADJ GRADE HORIZ'L CURVE NUMBER OF GRADE HORIZ'L NUMBER OF SPEED LIMIT RADIUS LANES CURVE RADIUS LANES NON-DIRECTIONAL ADJUSTMENTS LANE WIDTH ACCESS DENSITY RUMBLE STRIPS TERRAIN USER H36
162 50 ft bridge 50 vpd TOTAL ALTERNATIVES DEFINED 3 ROADSIDE FEATURES FOR ALTERNATIVE NUMBER: ALTERNATIVE NAME 50 ft Br no rail DEFAULT X-SECTION 1 All 2:1 CONSTRUCTION COST $ - ANNUAL MAINTENANCE COST $ - GENERAL HAZARD TYPE SPECIFIC HAZARD TYPE START STATION START SIDE START OFFSET END STATION END SIDE END OFFSET STATIONS ft STATIONS ft SpecialEdge BridgeEdge_HighHaz R R 17 SpecialEdge BridgeEdge_HighHaz L L 5 PARAMETER VALUE H37
163 ROADSIDE FEATURES FOR ALTERNATIVE NUMBER: 2 ALTERNATIVE NAME 50 ft br guard rail only DEFAULT X-SECTION All 2:1 CONSTRUCTION COST $8,000 ANNUAL MAINTENANCE COST $0 GENERAL HAZARD TYPE SPECIFIC HAZARD TYPE START STATION START SIDE START OFFSET END STATION END SIDE END OFFSET STATIONS ft STATIONS ft Guardrails_SemiRigid TL3WbeamGR R R 17 Width (in.) 12 Guardrails_SemiRigid TL3WbeamGR L L 7 Width (in.) 12 PoleTreeSign Generic Fixed Obj R 17 NA NA NA Dia. (in.) 4 PoleTreeSign Generic Fixed Obj L 7 NA NA NA Dia. (in.) 4 PoleTreeSign Generic Fixed Obj R 17 NA NA NA Dia. (in.) 4 PoleTreeSign Generic Fixed Obj L 7 NA NA NA Dia. (in.) 4 PARAMETER VALUE H38
164 ROADSIDE FEATURES FOR ALTERNATIVE NUMBER: 3 ALTERNATIVE NAME 50 ft Br guard rail with terms DEFAULT X-SECTION All 2:1 CONSTRUCTION COST $13,000 ANNUAL MAINTENANCE COST $0 GENERAL HAZARD TYPE SPECIFIC HAZARD TYPE START STATION START SIDE START OFFSET END STATION END SIDE END OFFSET STATIONS ft STATIONS ft TerminalEnds GenericEnd R 17 NA NA NA 24 Guardrails_SemiRigid TL3WbeamGR R R 17 Width (in.) 12 TerminalEnds GenericEnd R 17 NA NA NA 24 TerminalEnds GenericEnd L 5 NA NA NA 24 Guardrails_SemiRigid TL3WbeamGR L L 5 Width (in.) 12 TerminalEnds GenericEnd L 5 NA NA NA 24 PARAMETER VALUE H39
165 ANNUAL SEGMENT SUMMARY SEGMENT AND ALTERNATIVE COST SUMMARY 50 ft bridge 50 vpd Based on Analysis Run on 6/6/2014 1:43:00 PM RSAP (release XL12) running in Excel Version 14.0 on Windows (32-bit) NT 6.01 Rate of Return 4 % Design Life 25 yrs A/P Segment Crashes Crash Costs Maintenance Cost Repair Costs Crash Rate (crashes/mvmt) Alternative Alternative # 1 1 $ 0 $ 0 $ 0 $ $ 650 $ $ 512 $ 0 $ $ 23 Alternative # 2 3 $ 832 $ 0 $ $ $ 23 $ 0 Alternative # $ 16 $ 0 Annualized Construction Cost Expected Annual Maintenance Cost Expected Annual Repair Cost Expected Annual Crash Cost H40
166
ANNUAL BUSINESS FORMATION REPORT January 11, 2013
 ANNUAL BUSINESS FORMATION REPORT January 11, 2013 When I became Kansas Secretary of State in January of 2011, one of my first goals was to charge my staff with analyzing the applicable laws and policies
FOR RELEASE: WEDNESDAY, OCTOBER 8 AT 4 PM
 Kansas In Kansas, interviews with 1,025 adult Americans conducted by telephone by ORC International on October 2-6, 2014. The margin of sampling error for results based on the total sample is plus or minus
DISTRIBUTION: Electronic Recipients List TRANSMITTAL LETTER NO. (13-01) MINNESOTA DEPARTMENT OF TRANSPORTATION. MANUAL: Road Design English Manual
 MINNESOTA DEPARTMENT OF TRANSPORTATION. MANUAL: Road Design English Manual") DISTRIBUTION: Electronic Recipients List MINNESOTA DEPARTMENT OF TRANSPORTATION DEVELOPED BY: Design Standards Unit ISSUED BY: Office of Project Management and Technical Support TRANSMITTAL LETTER NO.
DISTRIBUTION: Electronic Recipients List MINNESOTA DEPARTMENT OF TRANSPORTATION DEVELOPED BY: Design Standards Unit ISSUED BY: Office of Project Management and Technical Support TRANSMITTAL LETTER NO.
Access Location, Spacing, Turn Lanes, and Medians
 Design Manual Chapter 5 - Roadway Design 5L - Access Management 5L-3 Access Location, Spacing, Turn Lanes, and Medians This section addresses access location, spacing, turn lane and median needs, including
Geometric Design Tables
 Design Manual Chapter 5 - Roadway Design 5C - Geometric Design Criteria 5C-1 Geometric Design Tables A. General The following sections present two sets of design criteria tables - Preferred Roadway Elements
WYDOT DESIGN GUIDES. Guide for. Non-NHS State Highways
 WYDOT DESIGN GUIDES Guide for Non-NHS State Highways 2014 GUIDE FOR Non-NATIONAL HIGHWAY SYSTEM (Non-NHS) STATE HIGHWAYS PRESERVATION REHABILITATION RECONSTRUCTION INTRODUCTION This Guide is directed to
Estimated 2014 ARC-CO Wheat Payments Kansas and Oklahoma 1
 Disclaimer: This web page is designed to aid farmers with their marketing and risk management decisions. The risk of loss in trading futures, options, forward contracts, and hedge-to-arrive can be substantial
WYDOT DESIGN GUIDES. Guide for. NHS Arterial (Non-Interstate)
") WYDOT DESIGN GUIDES Guide for NHS Arterial (Non-Interstate) 2014 GUIDE FOR NATIONAL HIGHWAY SYSTEM (NHS) HIGHWAYS (NHS ARTERIALS, Non-Interstate) PRESERVATION REHABILITATION RECONSTRUCTION INTRODUCTION
WYDOT DESIGN GUIDES Guide for NHS Arterial (Non-Interstate) 2014 GUIDE FOR NATIONAL HIGHWAY SYSTEM (NHS) HIGHWAYS (NHS ARTERIALS, Non-Interstate) PRESERVATION REHABILITATION RECONSTRUCTION INTRODUCTION
Roadway depa epa tu tu e
 Roadway Departure Introduction According to the Federal Highway Administration, a roadway departure crash is a non-intersection event that occurs after a vehicle crosses an edge line or center line, or
Road Side Design: When is a Barrier Required?
 Road Side Design: When is a Barrier Required? Jennifer Schmidt, Ph.D., P.E. University of Nebraska-Lincoln Department of Civil Engineering Guide Rail Safety Symposium Brampton, ON October 24, 2017 Research
7 DESIGN CRITER RIA 7.1 Design Space Requirements
 7 DESIGN CRITERIA 7.1 Design Space Requirements The Nebraskaa Department of Roads (NDOR) provided examples of intersections where an approved guardrail end terminal and Approach Guardrail Transition (AGT)
DATE TIME TROOP LOCATION TYPE NOTES 1/1/ E U-53, Haskell/Seward Counties Saturation Patrol 1/3/ E Finney County
 DATE TIME TROOP LOCATION TYPE NOTES 1/1/2017 1900-2200 E U-53, Haskell/Seward Counties Saturation Patrol 1/3/2017 1300-1500 E Finney County Saturation Patrol 1/5/2017 0700-0900 F U-160, Sumner County Speed
Driveway Design Criteria
 Design Manual Chapter 5 - Roadway Design 5L - Access Management 5L-4 Driveway Design Criteria A. General For efficient and safe operations, access drives and minor public street intersections can be improved
RURAL HIGHWAY SHOULDERS THAT ACCOMMODATE BICYCLE AND PEDESTRIAN USE (TxDOT Project ) June 7, Presented by: Karen Dixon, Ph.D., P.E.
 June 7, Presented by: Karen Dixon, Ph.D., P.E.") RURAL HIGHWAY SHOULDERS THAT ACCOMMODATE BICYCLE AND PEDESTRIAN USE (TxDOT Project 0-6840) June 7, 2016 Presented by: Karen Dixon, Ph.D., P.E., TTI Team: Kay Fitzpatrick, Raul Avelar, & Subasish Das Project
RURAL HIGHWAY SHOULDERS THAT ACCOMMODATE BICYCLE AND PEDESTRIAN USE (TxDOT Project 0-6840) June 7, 2016 Presented by: Karen Dixon, Ph.D., P.E., TTI Team: Kay Fitzpatrick, Raul Avelar, & Subasish Das Project
Turn Lane Warrants: Concepts, Standards, Application in Review
 Turn Lane Warrants: Concepts, Standards, Application in Review David J. DeBaie P.E., P.T.O.E. 2004 ITE, District 1 Annual Meeting Burlington, Vermont Introduction Turning lanes at intersections reduce
Chapter 4 Traffic Analysis
 Chapter 4 Traffic Analysis PURPOSE The traffic analysis component of the K-68 Corridor Management Plan incorporates information on the existing transportation network, such as traffic volumes and intersection
Roadway Design Manual
 Roadway Design Manual Manual Notice Archive by Texas Department of Transportation (512) 302-2453 all rights reserved Manual Notice 2009-1 From: Manual: Mark A. Marek, P.E Roadway Design Manual Effective
Multimodal Design Guidance. October 23, 2018 ITE Fall Meeting
 Multimodal Design Guidance October 23, 2018 ITE Fall Meeting Introductions Jessica Wilson TDOT Multimodal Division Office of Multimodal Planning Program Supervisor Jessica.L.Wilson@tn.gov Ali Hangul TDOT
Geometric Categories as Intersection Safety Evaluation Tools
 Geometric Categories as Intersection Safety Evaluation Tools John R. Campbell Ayres Associates N19 W24075 Riverwood Drive, Suite 300 Waukesha, WI 53188 campbellj@ayresassociates.com Keith K. Knapp Engineering
GUIDELINES FOR USING DECISION SIGHT DISTANCE AT IGNALIZED INTERSECTIONS NEAR VERTICAL CURVES
 1. Report No. FHWA/TX-05/0-4084-P2 4. Title and Subtitle 2. Government Accession No. 3. Recipient's Catalog No. GUIDELINES FOR USING DECISION SIGHT DISTANCE AT IGNALIZED INTERSECTIONS NEAR VERTICAL CURVES
Sponsored by the Office of Traffic and Safety of the Iowa Department of Transportation NOVEMBER 2001 CTRE
 PAVED SHOULDERS ON PRIMARY HIGHWAYS IN IOWA: AN ANALYSIS OF SHOULDER SURFACING CRITERIA, COSTS, AND BENEFITS EXECUTIVE SUMMARY Sponsored by the Office of Traffic and Safety of the Iowa Department of Transportation
Safety Assessment of Installing Traffic Signals at High-Speed Expressway Intersections
 Safety Assessment of Installing Traffic Signals at High-Speed Expressway Intersections Todd Knox Center for Transportation Research and Education Iowa State University 2901 South Loop Drive, Suite 3100
October 2004 REVISIONS (2) SUPERELEVATION DEVELOPMENT 11.3(2)
 SUPERELEVATION DEVELOPMENT 11.3(2)") October 2004 REVISIONS (2) Chapter 11 HORIZONTAL ALIGNMENT SUPERELEVATION DEVELOPMENT 11.3(2) Chapter 12 VERTICAL ALIGNMENT VERTICAL CURVES PASSING SIGHT DISTANCE 12.5(2) VERTICAL CURVES STOPPING SIGHT
October 2004 REVISIONS (2) Chapter 11 HORIZONTAL ALIGNMENT SUPERELEVATION DEVELOPMENT 11.3(2) Chapter 12 VERTICAL ALIGNMENT VERTICAL CURVES PASSING SIGHT DISTANCE 12.5(2) VERTICAL CURVES STOPPING SIGHT
What Engineering Can Do for You! Low Cost Countermeasures for Transportation Safety
 What Engineering Can Do for You! Low Cost Countermeasures for Transportation Safety Adam Larsen Safety Engineer Federal Highway Administration 360-619-7751 Adam.Larsen@DOT.GOV Adam Larsen TTP Safety Engineer
H8 Signs, Supports and Poles
 Alberta Infrastructure and Transportation Roadside Design Guide November 2007 H8 Signs, Supports and Poles H8.1 Introduction This section identifies the appropriate roadside safety treatment for signs,
Evaluation of Large-Truck Fixed-Object Crashes at Bridge Structures in Kansas
 Report # MATC-KU: 466 Final Report 25-1121-0001-466 Evaluation of Large-Truck Fixed-Object Crashes at Bridge Structures in Kansas Steven D. Schrock, Ph.D., P.E. Associate Professor Civil, Environmental,
(This page left intentionally blank)
") (This page left intentionally blank) 2011 Edition - Revision 1 Page 553 Section 5A.01 Function CHAPTER 5A. GENERAL 01 A low-volume road shall be defined for this Part of the Manual as follows: A. A low-volume
(This page left intentionally blank) 2011 Edition - Revision 1 Page 553 Section 5A.01 Function CHAPTER 5A. GENERAL 01 A low-volume road shall be defined for this Part of the Manual as follows: A. A low-volume
Roadway Departure Focus State Initiative Roadside Safety Systems Inspection, Maintenance & Designers Mentoring Program
 Roadway Departure Focus State Initiative Roadside Safety Systems Inspection, Maintenance & Designers Mentoring Program Why worry about the roadside? 18,586 deaths per year in the USA Annual U.S. Fatalities
METHODOLOGY. Signalized Intersection Average Control Delay (sec/veh)
") Chapter 5 Traffic Analysis 5.1 SUMMARY US /West 6 th Street assumes a unique role in the Lawrence Douglas County transportation system. This principal arterial street currently conveys commuter traffic
Chapter 5 Traffic Analysis 5.1 SUMMARY US /West 6 th Street assumes a unique role in the Lawrence Douglas County transportation system. This principal arterial street currently conveys commuter traffic
Analysis of Run-Off-Road Crashes in Relation to Roadway Features and Driver Behavior
 Analysis of Run-Off-Road Crashes in Relation to Roadway Features and Driver Behavior Ertan Örnek University of Wisconsin, Madison Traffic Operations Lab 141 NW Barstow Street Waukesha, WI 53187 ornek@wisc.edu
Guidelines for Integrating Safety and Cost-Effectiveness into Resurfacing, Restoration, and Rehabilitation Projects
 Guidelines for Integrating Safety and Cost-Effectiveness into Resurfacing, Restoration, and Rehabilitation Projects NCHRP Project 15-50 July 2017 1 Research Objective Develop guidelines for safe and cost-effective
T R A N S P O R T A T I O N M E M O R A N D U M
 WILKINSON LLC t raffic engineering and t ransportation p lanning 3405 Harbor Way Fort Collins, CO 80524 phone: 970-988-0143 fax: 970-472-0223 martinawilkinson@msn.com T R A N S P O R T A T I O N M E M
City of Wayzata Comprehensive Plan 2030 Transportation Chapter: Appendix A
 A1. Functional Classification Table A-1 illustrates the Metropolitan Council s detailed criteria established for the functional classification of roadways within the Twin Cities Metropolitan Area. Table
Chapter 5 DATA COLLECTION FOR TRANSPORTATION SAFETY STUDIES
 Chapter 5 DATA COLLECTION FOR TRANSPORTATION SAFETY STUDIES 5.1 PURPOSE (1) The purpose of the Traffic Safety Studies chapter is to provide guidance on the data collection requirements for conducting a
KANSAS DEPARTM ENT OF TRANSPORTATION BUREAU OF TRANSPORTATION PLANNING JANUARY 2017 SIGNIFICANT FACTS AND TRENDS
 KANSAS DEPARTM ENT OF TRANSPORTATION BUREAU OF TRANSPORTATION PLANNING JANUARY 17 SIGNIFICANT FACTS AND TRENDS Month Jan Feb Mar Apr May Jun Jul Aug Sep Oct Nov Dec Average Travel on the Kansas State Highway
KANSAS DEPARTM ENT OF TRANSPORTATION BUREAU OF TRANSPORTATION PLANNING NOVEM BER 2018 SIGNIFICANT FACTS AND TRENDS
 KANSAS DEPARTM ENT OF TRANSPORTATION BUREAU OF TRANSPORTATION PLANNING NOVEM BER 018 SIGNIFICANT FACTS AND TRENDS Month Jan Feb Mar Apr May Jun Jul Aug Sep Oct Nov Dec Average Travel on the Kansas State
KANSAS DEPARTM ENT OF TRANSPORTATION BUREAU OF TRANSPORTATION PLANNING DECEM BER 2018 SIGNIFICANT FACTS AND TRENDS
 KANSAS DEPARTM ENT OF TRANSPORTATION BUREAU OF TRANSPORTATION PLANNING DECEM BER SIGNIFICANT FACTS AND TRENDS Month Jan Feb Mar Apr May Jun Jul Aug Sep Oct Nov Dec Average Travel on the Kansas State Highway
Engineering Countermeasures for Transportation Safety. Adam Larsen Safety Engineer Federal Highway Administration
 Engineering Countermeasures for Transportation Safety Adam Larsen Safety Engineer Federal Highway Administration 360-619-7751 Adam.Larsen@DOT.GOV Countermeasure Selection Resources Manual for Selecting
TRAFFIC CONTROL DEVICES FOR LOW VOLUME ROADS
 PART 5. TRAFFIC CONTROL DEVICES FOR LOW VOLUME ROADS TABLE OF CONTENTS Chapter 5A. GENERAL Page Section 5A.1 Function............................................................... 5A-1 5A.2 Application............................................................
DECEMBER 2007 SIGNIFICANT FACTS AND TRENDS
 KANSAS DEPARTMENT OF TRANSPORTATION BUREAU OF TRANSPORTATION PLANNING DECEMBER 0 SIGNIFICANT FACTS AND TRENDS DEPARTMENTOF DEPARTMENTOFTRANSPORTATION TRANSPORTATION KA N SAS Contact the Traffic and Field
3-13 UFC - GENERAL PROVISIONS AND GEOMETRIC DESIGN FOR ROADS, STREETS, WALKS, AND OPEN
 maintenance, and erosion. Stability is required to maintain the integrity of the pavement structure, and a slope stability analysis should be conducted for cuts and fills greater than 15 feet. For lower
Defining Purpose and Need
 Advanced Design Flexibility Pilot Workshop Session 4 Jack Broz, PE, HR Green May 5-6, 2010 Defining Purpose and Need In your agency s project development process, when do design engineers typically get
GUARDRAIL NEED FOR EMBANKMENTS AND CULVERTS
 NDOR Research Project Number SPR-PL-1(31) P478 Transportation Research Studies GUARDRAIL NEED FOR EMBANKMENTS AND CULVERTS Daniel F. Wolford and Dean L. Sicking F I N A L R E P O R T Department of Civil
STUDY PROCESS & SCHEDULE
 STUDY PROCESS & SCHEDULE Route Centennial Bridge Study KDOT Project No. -52 KA-3229-01 STUDY OVERVIEW STUDY SCHEDULE The Kansas Department of Transportation (KDOT) has identified a future need to replace
FOR HISTORICAL REFERENCE ONLY
 To: From: Subject: Electronic Distribution Recipients MINNESOTA DEPARTMENT OF TRANSPORTATION Engineering Services Division Technical Memorandum No. 12-14-B-03 December 18, 2012 Jon M. Chiglo, P.E. Division
PEDESTRIAN SAFETY IMPROVEMENT EVALUATION GUIDELINE FOR UNCONTROLLED CROSSINGS
 PEDESTRIAN SAFETY IMPROVEMENT EVALUATION GUIDELINE FOR UNCONTROLLED CROSSINGS Traffic Safety Engineering Division Updated: April 2018 EXECUTIVE SUMMARY NDOT Traffic Safety Engineering Division developed
A Traffic Operations Method for Assessing Automobile and Bicycle Shared Roadways
 A Traffic Operations Method for Assessing Automobile and Bicycle Shared Roadways A Thesis Proposal By James A. Robertson Submitted to the Office of Graduate Studies Texas A&M University in partial fulfillment
Traffic Impact Study. Westlake Elementary School Westlake, Ohio. TMS Engineers, Inc. June 5, 2017
 TMS Engineers, Inc. Traffic Impact Study Westlake Elementary School Westlake, Ohio June 5, 2017 Prepared for: Westlake City Schools - Board of Education 27200 Hilliard Boulevard Westlake, OH 44145 TRAFFIC
Traffic Accident Data Processing
 Traffic Accident Data Processing D o n a l d F. P e t t y Engineer of Traffic Research and Surveys Indiana State Highway Commission The following is a portion of the Highway Safety Program Standards developed
PART 5. TRAFFIC CONTROL DEVICES FOR LOW-VOLUME ROADS TABLE OF CONTENTS
 2005 Edition Page TC5-1 PART 5. TRAFFIC CONTROL DEVICES FOR LOW-VOLUME ROADS TABLE OF CONTENTS CHAPTER 5A. Section 5A.01 Section 5A.02 Section 5A.03 Section 5A.04 CHAPTER 5B. GENERAL Page Function...5A-1
Engineering Your Community Safe
 Engineering Your Community Safe Andi Bill Transportation Information Center thanks its partners for their support and assistance National Traffic Safety Goal Reasonable goal? Who s Involved? What can you
Chapter Twenty-eight SIGHT DISTANCE BUREAU OF LOCAL ROADS AND STREETS MANUAL
 Chapter Twenty-eight SIGHT DISTANCE BUREAU OF LOCAL ROADS AND STREETS MANUAL Jan 2006 SIGHT DISTANCE 28(i) Chapter Twenty-eight SIGHT DISTANCE Table of Contents Section Page 28-1 STOPPING SIGHT DISTANCE
Systemic Safety. Doug Bish Traffic Services Engineer Oregon Department of Transportation March 2016
 Systemic Safety Doug Bish Traffic Services Engineer Oregon Department of Transportation March 2016 Oregon averages 1700 fatal and serious injury crashes each year. Some of the more common crash types include:
THE FUTURE OF THE TxDOT ROADWAY DESIGN MANUAL
 THE FUTURE OF THE TXDOT ROADWAY DESIGN MANUAL Kenneth Mora, P.E. (Design Division) 10/10/2017 Table of contents 1 2 Reduction in FHWA design controlling criteria Innovative Intersection Guidance 3-7 8-42
JUNE 2007 SIGNIFICANT FACTS AND TRENDS
 KANSAS DEPARTMENT OF TRANSPORTATION BUREAU OF TRANSPORTATION PLANNING JUNE 07 SIGNIFICANT FACTS AND TRENDS Travel on the Kansas State Highway System Daily Vehicle Miles % Change (In Millions) 06 to 07
Kentucky s Surface Transportation System
 Kentucky s Surface Transportation System ROAD AND BRIDGE CONDITIONS, TRAFFIC SAFETY, TRAVEL TRENDS, AND NEEDS MARCH 2018 PREPARED BY WWW.TRIPNET.ORG Founded in 1971, TRIP of Washington, DC, is a nonprofit
Appendix A: Safety Assessment
 Appendix A: Safety Assessment Safety Assessment Appendix A A Statement of Philosophy The efficient and responsible investment of resources in addressing safety problems is a difficult task. Since crashes
Road Safety Assessments. Lt. Bob McCurdy Williamson County Sheriff s s Office Marion, IL.
 Road Safety Assessments Lt. Bob McCurdy Williamson County Sheriff s s Office Marion, IL. Why Are We Here? 2005 US Traffic Fatalities = 43,443 1429 4329 1361 1616 1534 3504 1729 3543 Illinois Annual Fatallities
TABLE OF CONTENTS. General... A. New Construction/Reconstruction (4R)...B. Resurfacing, Restoration and Rehabilitation (3R)...C
...B. Resurfacing, Restoration and Rehabilitation (3R)...C") - LOCAL AGENCY PROJECTS TABLE OF CONTENTS Section General... A New Construction/Reconstruction (4R)...B Resurfacing, Restoration and Rehabilitation (3R)...C Preventive Maintenance (PM)... D Design Exception...E
- LOCAL AGENCY PROJECTS TABLE OF CONTENTS Section General... A New Construction/Reconstruction (4R)...B Resurfacing, Restoration and Rehabilitation (3R)...C Preventive Maintenance (PM)... D Design Exception...E
Evaluating the Design Safety of Highway Structural Supports
 Evaluating the Design Safety of Highway Structural Supports by Fouad H. Fouad and Elizabeth A. Calvert Department of Civil and Environmental Engineering The University of Alabama at Birmingham Birmingham,
Figure 3B-1. Examples of Two-Lane, Two-Way Marking Applications
 Figure 3B-1. Examples of Two-Lane, Two-Way Marking Applications A - Typical two-lane, two-way marking with passing permitted in both directions B - Typical two-lane, two-way marking with no-passing zones
DEFINITIONS Activity Area - Advance Warning Area Advance Warning Sign Spacing Advisory Speed Approach Sight Distance Attended Work Space
 DEFINITIONS Activity Area - that part of a TTC zone activity area where the work actually takes place. It consists of the work space, traffic space and one or more buffer spaces. Advance Warning Area -
Auckland Transport Code of Practice 2013
 P age 234 9 Roadside Restraint Devices 9.1 Scope This chapter includes the following: Road Safety Barrier Systems Fences Railings Bollards Sight Rails It excludes: Fences and restraints required within
Texas Intersection Safety Implementation Plan Workshop JUNE 2, 2016
 Texas Intersection Safety Implementation Plan Workshop JUNE 2, 2016 Why Intersection Safety? A small part of overall highway system, but Each year roughly 50% of all crashes estimated 3 million involve
Work Zone Traffic Safety
 Work Zone Traffic Safety Summary The Hazard: death or serious injury from being struck by vehicles or equipment in work zones. Who is at risk: streets/highways, utilities and other public works department
Abstract. Background. protected/permissive operation. Source: Google Streetview, Fairview/Orchard intersection
 ITE 2015 Western District Annual Meeting Ada County Highway District s Flashing Yellow Arrow Initiative Primary Author: Tim Curns, PE Ada County Highway District Traffic Engineer Author: Andrew Cibor,
JONESBORO HIGHWAY 63 HIGHWAY 18 CONNECTOR STUDY
 JONESBORO HIGHWAY 63 HIGHWAY 18 CONNECTOR STUDY Craighead County May 2007 JONESBORO HIGHWAY 63 HIGHWAY 18 CONNECTOR STUDY Craighead County May 2007 Prepared by Planning and Research Division Arkansas State
TOWN OF CHAPEL HILL POLICY AND PROCEDURES FOR TRAFFIC CALMING MEASURES
 TOWN OF CHAPEL HILL POLICY AND PROCEDURES FOR TRAFFIC CALMING MEASURES (Adopted by the Town Council on June 30, 2004) (Revised December 6, 2010) (Revised February 8, 2016) POLICY AND PROCEDURES FOR TRAFFIC
M-58 HIGHWAY ACCESS MANAGEMENT STUDY Mullen Road to Bel-Ray Boulevard. Prepared for CITY OF BELTON. May 2016
 M-58 HIGHWAY ACCESS MANAGEMENT STUDY Prepared for CITY OF BELTON By May 2016 Introduction Missouri State Highway 58 (M-58 Highway) is a major commercial corridor in the City of Belton. As development has
1.3.4 CHARACTERISTICS OF CLASSIFICATIONS
 Geometric Design Guide for Canadian Roads 1.3.4 CHARACTERISTICS OF CLASSIFICATIONS The principal characteristics of each of the six groups of road classifications are described by the following figure
Owl Canyon Corridor Project Overview and Summary
 Owl Canyon Corridor Project Overview and Summary December 22, 2008 The Owl Canyon corridor (generally the connection between the I-25 / Larimer County Road 70 interchange and the US 287 / Larimer County
SELECTED ROADWAY CAPACITY ANALYSIS
 CHAPTERFOUR SELECTED ROADWAY CAPACITY ANALYSIS 4.1 SELECTED ROADWAY CAPACITY ANALYSIS Introduction Capacity analysis was performed on six selected roadways within the Dearborn County study area using the
ROUNDABOUTS/TRAFFIC CIRCLES
 GENERAL 1. Description This standard identifies minimum requirements that shall be met for Roundabouts and Neighborhood Traffic Circles in the design and construction of elements for Arlington County Horizontal
Secondary Road Program
 Secondary Road Program Joint Legislative Transportation Oversight Committee October 5, 2012 1 Secondary Roads Program The Big Picture The Secondary Road System Needs and Project Types Paved and Unpaved
Field Guide for Unpaved Rural Roads
 Field Guide for Unpaved Rural Roads Funded by the Federal Highway Administration Local Technical Assistance Program (LTAP) Developed by the Wyoming Technology Transfer (T2) Center, March 1997 Updated by
MUTCD Part 6: Temporary Traffic Control
 MUTCD Part 6: Temporary Traffic Control OMUTCD English units are preferred. OHIO MANUAL OF UNIFORM TRAFFIC CONTROL DEVICES TABLE OF CONTENTS PREFACE INTRODUCTION TABLE OF CONTENTS PART 1. GENERAL Chapter
Shared Use Path Design
 12B-2 Design Manual Chapter 12 - Sidewalks and Bicycle Facilities 12B - Bicycle Facilities Shared Use Path Design A. Accessible Shared Use Path Design 1. General: Applicable portions from the following
Texas Transportation Institute The Texas A&M University System College Station, Texas
 1. Report No. FHWA/TX-05/0-4084-P1 4. Title and Subtitle GUIDELINES FOR THE USE OF COUNTERMEASURES TO REDUCE CRASHES ON APPROACHES TO SIGNALIZED INTERSECTIONS NEAR VERTICAL CURVES 2. Government Accession
Memorandum. Exhibit 60 SSDP To: Jenny Bailey, Senior Planner. From: Bill Schultheiss, P.E. (WA. P.E. #46108) Date: June 20, 2017
 Date: June 20, 2017") Memorandum To: Jenny Bailey, Senior Planner From: Bill Schultheiss, P.E. (WA. P.E. #46108) Date: June 20, 2017 Re: East Lake Sammamish Trail, Segment 2B Review King County has asked Toole Design Group
Memorandum To: Jenny Bailey, Senior Planner From: Bill Schultheiss, P.E. (WA. P.E. #46108) Date: June 20, 2017 Re: East Lake Sammamish Trail, Segment 2B Review King County has asked Toole Design Group
Appendix T CCMP TRAIL TRAFFIC & TRANSPORTATION DESIGN STANDARD
 Appendix T CCMP 3.3.4 TRAIL TRAFFIC & TRANSPORTATION DESIGN STANDARD 3.3.4 Trail Traffic and Transportation Design Multi-use trails have certain design standards, which vary depending on the agency that
TRAFFIC CONTROL DEVICES
 TRAFFIC CONTROL DEVICES SIGNS Temporary traffic control work zone signs include regulatory, warning and guide signs utilized to provide regulations, warnings and guidance information to road users impacted
Chapter 5 FUNCTIONAL CLASSIFICATION
 Chapter 5 FUNCTIONAL CLASSIFICATION Functional classification is a system by which streets and roadways may be distinguished by types according to their function within the entire transportation network.
Access requests to County streets and roadways are processed through one of the following methods:
 13.1 GENERAL APPLICATION PROCESS Access requests to County streets and roadways are processed through one of the following methods: A. Planned Developments may set general locations for access points.
NOT TO SCALE PUBLIC WORKS STANDARD DETAILS CURB DETAILS DATE: MARCH 2013 FILE NAME: CURB.DWG
 NOT TO SCALE PUBLIC WORKS STANDARD DETAILS CURB DETAILS DATE: MARCH 2013 FILE NAME: CURB.DWG NOT TO SCALE PUBLIC WORKS STANDARD DETAILS SIDEWALK RAMPS DATE: MARCH 2013 FILE NAME: SIDEWALK RAMPS.DWG NOT
KDOT Access Management Policy (AMP)
") KDOT Access Management Policy (AMP) (January 2013 Edition) Errata KDOT intends to correct these errors during the next revision to the Policy. Corrections are denoted in red text with a solid line through
KDOT Access Management Policy (AMP) (January 2013 Edition) Errata KDOT intends to correct these errors during the next revision to the Policy. Corrections are denoted in red text with a solid line through
10.0 CURB EXTENSIONS GUIDELINE
 10.0 CURB EXTENSIONS GUIDELINE Road Engineering Design Guidelines Version 1.0 March 2017 City of Toronto, Transportation Services City of Toronto Page 0 Background In early 2014, Transportation Services
Roadside Safety Proven Countermeasures. Emmett McDevitt Transportation Safety Engineer Federal Highway Administration
 Roadside Safety Proven Countermeasures Emmett McDevitt Transportation Safety Engineer Federal Highway Administration Safety Statistics On average each year 43,000 + people die in traffic related crashes.
CHAPTER 7 ACCESS MANAGEMENT. Background. Principles of Access Management. Hennepin County Transportation Systems Plan (HC-TSP)
") CHAPTER 7 ACCESS MANAGEMENT Background Principles of Access Management Hennepin County Transportation Systems Plan (HC-TSP) Chapter 7 Access Management 7.1 Background Access management has become an important
CHAPTER 7 ACCESS MANAGEMENT Background Principles of Access Management Hennepin County Transportation Systems Plan (HC-TSP) Chapter 7 Access Management 7.1 Background Access management has become an important
Document 2 - City of Ottawa Pedestrian Crossover (PXO) Program
 Program") 40 Document 2 - City of Ottawa Pedestrian Crossover (PXO) Program OVERVIEW The City of Ottawa Pedestrian Crossover (PXO) Program provides the basis for PXO implementation in Ottawa. The program s processes
40 Document 2 - City of Ottawa Pedestrian Crossover (PXO) Program OVERVIEW The City of Ottawa Pedestrian Crossover (PXO) Program provides the basis for PXO implementation in Ottawa. The program s processes
Design Guidance for Construction Work Zones on High-Speed Highways. Kevin M. Mahoney Penn State University
 Design Guidance for Construction Work Zones on High-Speed Highways Kevin M. Mahoney Penn State University Overview Scope of study Method Results Overview Scope of study Method Results Panel, NCHRP 3-69
Development of Arlington County s Marked Crosswalk Guidelines. Jon Lawler, P.E. Design Engineer Arlington County, VA
 Development of Arlington County s Marked Crosswalk Guidelines Jon Lawler, P.E. Design Engineer Arlington County, VA April 13, 2015 Transportation System Users Residents Estimated 215,000 in 2014 Lowest
Parks Highway: MP Lucus Road to Big Lake Road
 2 Purpose and Need 2.1 Corridor History The Parks Highway is a 324-mile long Rural Interstate Highway that extends from its intersection with the Glenn Highway north to Fairbanks, Alaska. The Parks Highway
Access Management in the Vicinity of Intersections
 Access Management in the Vicinity of Intersections FHWA-SA-10-002 Technical Summary Photo: Ralph Bentley (used with permission) 0 Access Management is: The design, implementation and management of entry
Traffic Calming Policy
 Article I. Purpose and Goal. The purpose of this policy is to establish criteria and procedures the City will use to evaluate requests for, and if appropriate, implement traffic calming measures. Neighborhood
SECTION 3 STREET DESIGN
 3.01 GENERAL SECTION 3 STREET DESIGN For purposes of geometric and structural design, streets shall be classified according to the following table. The City Engineer will determine the class of all proposed
INDEX. Geometric Design Guide for Canadian Roads INDEX
 Acceleration lane, see Lanes, Acceleration Access, 8.1 Access Management and Functional Classification 8.2 Access Management by Design Classification 8.3 Access Configuration 8.4 Building Set-Back Guidelines
HSM PREDICTIVE METHODS IN PRELIMINARY ENGINEERING
 HSM PREDICTIVE METHODS IN PRELIMINARY ENGINEERING 2017 ILLINOIS THE CONFERENCE Filiberto Sotelo & Steven Schilke, P.E. OUTLINE Safety & Transportation Management Process What is HSM? Illinois HSM Predictive
TRAFFIC STUDY GUIDELINES Clarksville Street Department
 TRAFFIC STUDY GUIDELINES Clarksville Street Department 9/1/2009 Introduction Traffic studies are used to help the city determine potential impacts to the operation of the surrounding roadway network. Two
Technical Memorandum. Subject: Interchange Ramp Terminal Configuration. Expiration. Implementation. Introduction
 Minnesota Department of Transportation Engineering Services Division Technical Memorandum To: Electronic Distribution Recipients From: Nancy T. Daubenberger, P.E. Assistant Commisioner, Engineering Services
Kansas Active Livescans
 Kansas Active Livescans County Agency City LS Company Installation Date Status Allen Allen County Sheriff Iola CROSSMATCH 12/10/2004 Act Atchison Atchison County Sheriff Atchison CROSSMATCH 12/15/2005