The Future of Driving in the Land of Freeways
|
|
|
- Robyn Parrish
- 5 years ago
- Views:
Transcription

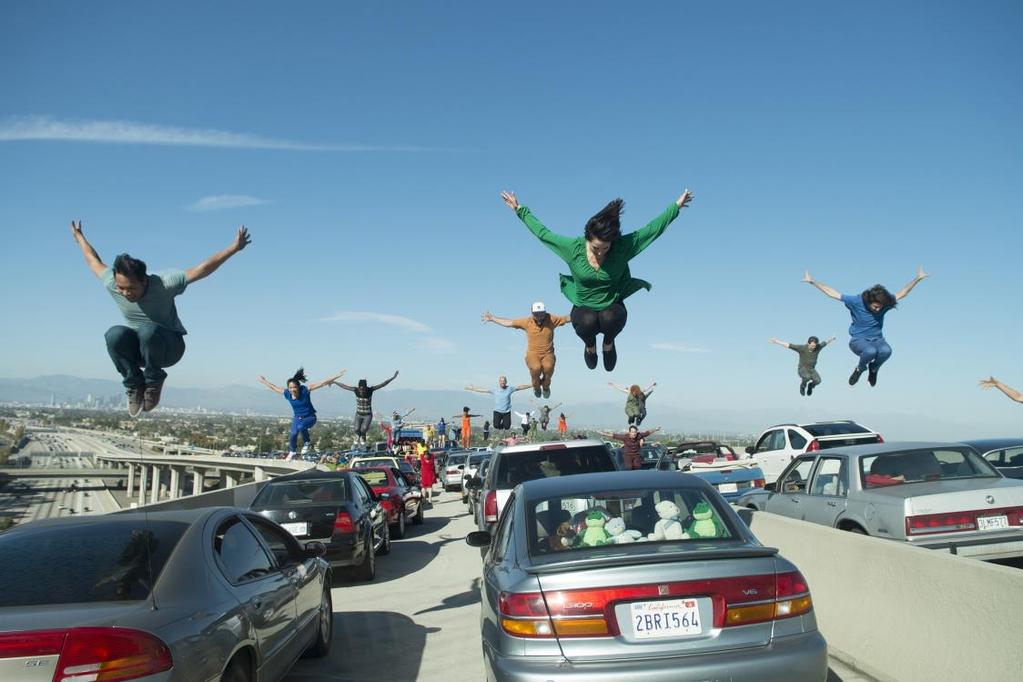
1 The Future of Driving in the Land of Freeways Susan Handy Center for Transportation Studies Annual Research Conference Minneapolis, MN November ,476 lane-miles of freeways 24.8 million licensed drivers 27.7 million cars & trucks 38.8 million residents nts/2014/jul/23/pat-buchanan/pat-buchananright-now-one-third-all-illegal-alien/ 1

2 4 2


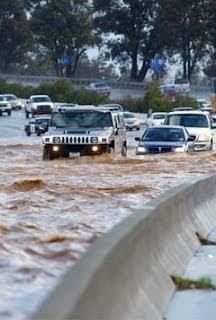
3 /la-me-pc-carpool-lane-opening ofaprepper.com/su rviving-a-forestfire/ ublicmedia.org/ eartheats/mass ive-droughtscomingcountrysummer-2060/ 3

4 Pacific Coast Highway, Big Sur, California, The California Experiment to reduce vehicle travel 8 4
5 Annual VMT per Capita in US (VMT = vehicle miles traveled) 12,000 10,000 8,000 6,000 4,000 2, Source: Bureau of Transportation Statistics, U.S. Census Annual VMT per Capita CA vs US (VMT = vehicle miles traveled) 10,500 10,000 9,500 US 9,000 8,500 California 8, Source: Bureau of Transportation Statistics, U.S. Census, CA Dept of Finance 5
6 AB32 The California Global Warming Solutions Act of % reduction of GHG from 1990 levels by SB 32 of 2016: 40% below 1990 by 2030 Million metric tons (CO 2 equivalent) California Emission Sources (2008) AB32 Emission Reduction Strategies High GWP gases, 3% Industrial, 20% Other, 6% Transport, 37% High GWP Measures, 7% Cap and Trade, 16% Forestry, 4% Clean Cars and Standards, 27% Renewable Energy, 19% LCFS, 13% Utilities, 34% Energy Efficiency, 12% Smart Growth, 3% Source: CARB, California GHG Inventory for ; Scoping Plan, 2020 Emissions Forecast 6


7 SB375 Sustainable Communities and Climate Protection Act of 2008 Targets for reducing per capita GHG emissions from cars and light trucks for metropolitan areas by reducing vehicle-miles-traveled (VMT) Examples Sacramento -7% -16% San Francisco Bay Area -7% -15% Los Angeles region -8% -13% San Diego -7% -13% 13 Sustainable Communities Strategies (SCSs) 14 7


8 San Diego Example Conventional vision for Post-SB375 vision for 2050 How do we know what will work? 16 8


.")
9 Research Contribution: Syntheses of Findings Impact of Transportation and Land-Use Related Policies on Greenhouse Gas Emissions Handy, Boarnet, with Tal, Lovejoy, Rodier, Circella, Spears, Shu, Weinreich for the California Air Resources Board, The impacts from the studies that used California data [lead us to the] conclusion that doubling density is associated with VMT reductions that range from approximately 5 to 12 percent (an elasticity of to -0.12). Google SB375 research 9

 2013 California Emissions Estimator Model (CalEEMod) 2016 California Smart Growth Trip Estimation Tool")
 https://ncst.ucdavis.")
10 Research Contribution: Syntheses of Findings Volker and Fang Boarnet Research Contribution: Planning Tools Evaluation of Sketch-Level VMT Quantification Tools Handy, Fang, Lee for the California Strategic Growth Council, tools initially identified 6 tools selected for application to case studies (in bold) Widely different estimates Pros and cons for each method California Emissions Estimator Model (CalEEMod) 2013 California Emissions Estimator Model (CalEEMod) 2016 California Smart Growth Trip Estimation Tool Envision Tomorrow / Envision Tomorrow+ GreenTrip Connect ITE Trip Generation for the Urban Context MXD Sketch 7 Watch it on YouTube! Urban Emissions Model (URBEMIS) UrbanFootprint edu/events/webinar- VMT+ quantifying-vehicle- miles-traveled/ VMT Impact Tool 20 10


11 Research Contribution: Planning Tools Quantification Methods for Estimating Greenhouse Gas and Air Pollutant Emission Reductions Handy, Kendall, Barbour, and Volker For the California Air Resources Board, Quantification methods used to estimate GHG emissions for proposed land development and transportation projects for Greenhouse Gas Reduction Fund Programs. Reviews of methods for: - Infill development - Transit investments - Bicycle facilities - Pedestrian facilities - More to come Research Contribution: Before-and-After Studies Driving Reduction After the Introduction of Light Rail Transit Spears, Boarnet, Houston for the California Air Resources Board, At 18 months after opening, daily mileage for households close to the line was approximately 30 percent lower than that of control households. This change appears to have resulted primarily from changes in car trip lengths. Average car trip length declined in each wave for the households within 1 km of new light rail stations, resulting in a difference of nearly four miles per trip 22 11
 81.7% 81.6% 120 80% 100 96.8 60% 79.")
12 Research Contribution: Before-and-After Studies Measuring the Impact of Local Land Use Policies on Vehicle Miles of Travel Handy, Lovejoy, Salon, Mokhtarian, Sciara for UC Davis Sustainable Transportation Center, % 98.2% Vehicle-miles (per capita 100% monthly) 81.7% 81.6% % % % % 0% Year 1 Year 2 Downtown Davis Elsewhere in town*** Beyond Davis *** at Target (in town) Overall ** Significance for t-test of means (across years): * p < 0.10; ** p < 0.05; *** p < It will take all of these strategies. It will take action at all levels of government. The benefits will go far beyond GHG reductions
13 The future of driving in California and beyond 25 VMT in the future? The aggregate trends discussed do not allow us to forecast with any certainty the car use that we can expect in the future. Goodwin and Van Dender, ,000 10,000 8,000 6,000? 4,000 2,


14 Autonomous Vehicles Predictions of the past 14

![[Inventor Dean] Kamen says it will be to the car what the car was to the horse](/docs-images/88/117776238/images/15-2.jpg "and buggy. - Wall Street Journal 9/27/10 http://blogs.w sj.")


15 Predictions of the past There s talk among tech insiders that it could be bigger than the PC. [Inventor Dean] Kamen says it will be to the car what the car was to the horse and buggy. - Wall Street Journal 9/27/10 sj.com/digits/ 2010/09/27/fr om-hype-todisastersegwaystimeline/ Technology as a social construct Technology does not act as a kind of traffic policeman that is distinct in nature from the traffic it directs. Wiebe Bijker, The Social Construction of Technological Systems Technological development should be viewed as a social process, not an autonomous occurrence. Wiebe Bijker, Of Bicycles, Bakelites, and Bulbs 15

16 What do AVs mean for the future of driving? Point 1: It depends on what people decide to do with them How do we as individuals and households make choices about travel? How and why are these choices changing? How can we nudge them in the right direction? Nested choices Long-term Choices Lifestyle Residential Location Mid-term Choices Driver s license Auto ownership Short-term Choices Trip frequency Trip destination Mode choice 16
17 Choice process Set of choices available Qualities of choices available Value placed on different qualities Drive alone Shared ride Bus Rail Bicycle Walk Skateboard Cost Time Comfort Safety Knowledge, perceptions Cost vs. Time vs. Comfort vs. Safety Needs, constraints Changes in all cells Choice Sets Choice Qualities Value of Qualities Long-term Choices Mid-term Choices Short-term Choices 17


18 B Bike Sharing Neighborhood Electric Vehicles Mobility as a Service 18
 and")
19 Changes in all cells Choice Sets Choice Qualities Value of Qualities Long-term Choices Mid-term Choices Short-term Choices Research Contribution: Behavioral Research California Panel Study of Emerging Transportation Trends Led by Giovanni Circella for the ITS-Davis 3 Revolutions Future Mobility Program Statewide longitudinal study with rotating panel 2015 survey: Millennials (18-34) and Generation X (35-50) 2018 survey: All age groups Quota sampling by geographic region and neighborhood type Focus on changing lifestyles, travel behavior, adoption of shared mobility and propensity to use AVs 19
20 Adoption of Shared Mobility: Bikesharing I use it 3 or more times a week I use it 1-2 times a week I use it 1-3 times a month I use it less than once a month I used it in the past, but not It's familiar but I ve never used it I am not familiar with it 0% 10% 20% 30% 40% 50% 60% 70% Carsharing I use it 3 or more times a week I use it 1-2 times a week I use it 1-3 times a month I use it less than once a month I used it in the past, but not It's familiar but I ve never used it I am not familiar with it 0% 10% 20% 30% 40% 50% 60% 70% Bikesharing I use it 3 or more times a week I use it 1-2 times a week I use it 1-3 times a month I use it less than once a month I used it in the past, but not anymore It's familiar but I ve never used it I am not familiar with it 0% 10% 20% 30% 40% 50% 60% 70% Carsharing I use it 3 or more times a week I use it 1-2 times a week I use it 1-3 times a month I use it less than once a month I used it in the past, but not anymore It's familiar but I ve never used it I am not familiar with it 0% 10% 20% 30% 40% 50% 60% 70% Adoption of Shared Mobility: Ridehailing I use it 3 or more times a I use it 1-2 times a week I use it 1-3 times a month I use it less than once a I used it in the past, but not It's familiar but I ve never I am not familiar with it 0% 20% 40% 60% 80% Ridehailing I use it 3 or more times a week I use it 1-2 times a week I use it 1-3 times a month I use it less than once a month I used it in the past, but not anymore It's familiar but I ve never used it I am not familiar with it 0% 10% 20% 30% 40% 50% 60% 70% Shared Ridehailing I use it 3 or more times a week I use it 1-2 times a week I use it 1-3 times a month I use it less than once a month I used it in the past, but not anymore It's familiar but I ve never used it I am not familiar with it 0% 10% 20% 30% 40% 50% 60% 70% 20


21 Changes in Use of Ridehailing by Region On average, the adoption and frequency of use of ridehailing almost doubled from 2015 to 2018: 90% 80% 70% 60% 50% 40% 30% 20% 10% 0% 74% 44% MTC 90% 85% 80% 70% 60% 52% 50% 40% 30% 30% 20% 16% 17% 8% 9% 10% 2% 0% Never used Never used Less than monthly basis Weekly basis or no longer once a month uses 90% 80% 70% 60% 50% 40% 30% 20% 10% 0% 71% 46% 15% 30% 17% 11% 3% 7% Never used Less than monthly basis Weekly basis or no longer once a month uses or no longer uses 9% SACOG 28% 15% 4% 2% 5% Less than monthly basis Weekly basis once a month 90% 80% 70% 60% 50% 40% 30% 20% 10% 0% SANDAG 71% 46% SCAG 30% 15% 17% 11% 3% 7% Never used Less than monthly basis Weekly basis or no longer once a month uses Preliminary results; 2015 data: N=1975; 2018 data: N=2451, online sample only Use of Ridehailing by Place Type Ridehailing is far lower in rural areas, regardless of region: 100% 80% 60% 40% 20% 0% 64% 75% 88% Urban Suburban Rural 100% 80% 60% 40% 72% 77% 20% 52% 0% Urban Suburban Rural 100% 80% 60% 40% 20% 0% 62% 71% 88% Urban Suburban Rural Uses at least once a month Uses less than once a month Never used or not longer use 42 21
22 Impact of Ridehailing on VMT 70% 60% 50% 40% 30% 20% 10% What Would You Have Done if Ridehailing Was Not Available? 0% Car Public bus Light rail/tram/subway Commuter rail Bike or walk Taxi I would not have made this trip (N=1,260) Attitudes Towards Autonomous Vehicles 80% 70% 60% 50% 40% 30% 20% 10% 0% Be one of the first people to buy a self-driving vehicle Gen Z (18-20 yrs old) Gen Y (21-37 yrs old) Gen X (38-53 yrs old) Baby Boomers (54-72 yrs old) Silent Generation and older (73-90 yrs old) Very unlikely Somewhat unlikely Neither unlikely nor likely Somewhat likely Very likely 22
 that I/my household owns (if any) and not use a driverless taxi or shuttle Get rid of one (or more) of my household vehicles and use a")

23 Attitudes Towards Autonomous Vehicles Expectations about the Adoption of Autonomous Vehicles and Changes in Vehicle Ownership 0% 10% 20% 30% 40% 50% 60% Keep the vehicle(s) that I/my household owns (if any) and not use a driverless taxi or shuttle Get rid of one (or more) of my household vehicles and use a driverless taxi or shuttle. Very unlikely Somewhat unlikely Neither unlikely nor likely Somewhat likely Very likely Research Contribution: Behavioral Research Behavioral Experiment to Simulate Life with an Autonomous Vehicle Walker and Circella for the UC Institute of Transportation Studies program Results from pilot study 23


24 What do AVs mean for the future of driving? Point 1: It depends on what people decide to do with them Point 2: It depends on what society decides to do about them Set of choices available Qualities of choices available Value placed on different qualities Things policy can influence Minnesota examples 48 24


25 What do AVs mean for the future of driving? Point 1: It depends on what people decide to do with them Point 2: It depends on what society decide to do about them Set of choices available Qualities of choices available Value placed on different qualities Knowledge, perceptions Policy can also influence these Minnesota examples


 is compared to hypothetical ridesharing and carsharing services.")
26 Research Contribution: Before-and-After Studies Impact of Bike Share on Bicycling Behavior and Attitudes: Assessment of the Sacramento Region Bike Share System Fitch and Handy for Caltrans and the National Center for Sustainable Transportation Before-and-after household survey Panel survey of Jump bike users How do people use Jump bike? What impact does Jump bike have on bicycling in general? How important is electric assist? 51 Research Contribution: Policy Possibilities Opportunities for Shared-Use Mobility Services in Rural Disadvantaged Communities in California s San Joaquin Valley: Existing Conditions and Conceptual Program Development Rodier for the National Center for Sustainable Transportation In this study, the cost-effectiveness of existing inter-city transit service in rural disadvantaged communities in the San Joaquin Valley (California) is compared to hypothetical ridesharing and carsharing services. The results show significant potential to reduce transit costs and reinvest those cost saving to expand shared mobility services


27 Research Contribution: Policy Possibilities Active Transportation in and Era of Sharing, Electrification and Automation Handy and others for the 3 Revolutions Initiative at UC Davis To maximize the societal benefits of the three revolutions, policies should prioritize human mobility and community livability over vehicle mobility. Communities should be designed for people, not vehicles; AVs should serve the community, rather than the community serving AVs. Policies with respect to Built environment Automated vehicles Planning processes and practices At all levels of government Research Contribution: Simulations Automated Vehicle Scenarios: Simulation of System-Level Travel Effects Using Agent- Based Demand and Supply Models in the San Francisco Bay Area Rodier for the National Center for Sustainable Transportation 27


28 Research Contribution: Policy Possibilities Three Revolutions in Urban Transportation Fulton, Mason, Meroux for the ClimateWorks Foundation, Hewlett Foundation, Barr Foundation The 3R scenario builds on the 2R scenario, with policy support for both electrification and automation, but also substantial policy support for shared-use mobility and urban planning that supports shorter trip lengths and high levels of walking, cycling, and public transport use, even in a future where vehicular travel is significantly less expensive. Without strong policy support for compact cities, even a scenario with fairly high levels of vehicle sharing in smaller vehicles could result in significantly higher vehicle kilometers and lower levels of access. 55 Lew Fulton, UC Davis Institute of Transportation Studies and the Institute for Transportation & Development Policy /threerevolutionslandingpage/ 28


29 57 AVs and other technological innovations - a threat and an opportunity for communities How do we as a society push their development and their use toward the desired outcome toward the community vision? Going Driverless 29


30 Thanks! Questions? 30
Travel Demand. Dr. Susan Handy TTP 282 Intro Seminar 10/6/17
 Travel Demand Dr. Susan Handy TTP 282 Intro Seminar 10/6/17 From last time What s it all about? What is the goal we re trying to achieve? Meeting transportation needs, given constraints, while minimizing
How Travel Demand Has Been Changing. Susan Handy Asilomar 2015
 How Travel Demand Has Been Changing Susan Handy Asilomar 2015 Annual VMT per Capita in U.S. 12,000 10,000 8,000 6,000 4,000 2,000-1936 1940 1944 1948 1952 1956 1960 1964 1968 1972 1976 1980 1984 1988 1992
Public Consultation Centre For. Transportation Master Plan Update. Information Package
 Public Consultation Centre For Transportation Master Plan Update Information Package Date Location Hours Tuesday, September 12, 2017 Wednesday, September 13, 2017 Tuesday, September 19, 2017 Cambridge
Urban planners have invested a lot of energy in the idea of transit-oriented
 DOES TRANSIT-ORIENTED DEVELOPMENT NEED THE TRANSIT? D A N I E L G. C H AT M A N Urban planners have invested a lot of energy in the idea of transit-oriented developments (TODs). Developing dense housing
Impact of Shared Mobility and Technology on Public Transportation
 Impact of Shared Mobility and Technology on Public Transportation Susan Shaheen, PhD Email: sshaheen@berkeley.edu Twitter: SusanShaheen1 LinkedIn: Susan Shaheen Overview Defining shared mobility and impacts
Travel Behavior 101 and Intro to Types of Evidence. TTP220 Transportation Policy and Planning S. Handy 5/16/16
 Travel Behavior 101 and Intro to Types of Evidence TTP220 Transportation Policy and Planning S. Handy 5/16/16 But first Is Your City's Street Grid Really a Grid? CityLab, 3/26/14 http://www.citylab.com/design/2014/03/how-symmetrical-your-city/8731/?utm_source=nl
Dear City Council Members,
 From: Bob Kenyon [mailto: ] Sent: Monday, February 08, 2016 10:20 AM To: City Clerk Subject: Please prioritize Caltrain and a complete transit network Thank you for prioritizing bringing BART to San Jose
Berkeley Strategic Transportation Plan A-76
 Berkeley Strategic Transportation Plan A-76 Appendices 1. A Team Effort 2. Where We ve Been A-11 Berkeley Strategic Transportation Plan Alameda County Transportation Plan Alameda County will be served
Where We Live and Work Today
 San Diego Forward: The 2019-2050 Regional Plan Network Concepts Transportation Committee Item 4 October 19, 2018 Where We Live and Work Today 2018 2 2019 Regional Plan Transportation Committee Item 4 October
WELCOME. City of Greater Sudbury. Transportation Demand Management Plan
 WELCOME City of Greater Sudbury Transportation Demand Management Plan Public Consultation Session St. Andrew s Place, Activity Hall 111 Larch Street Wednesday September 13, 2017 6:00 to 8:00 pm Welcome
THESE DAYS IT S HARD TO MISS the story that Americans spend
 WHICH COMES FIRST: THE NEIGHBORHOOD OR THE WALKING? BY SUSAN HANDY AND PATRICIA MOKHTARIAN THESE DAYS IT S HARD TO MISS the story that Americans spend more time stuck in traffic than ever, that they re
Transportation Master Plan Advisory Task Force
 Transportation Master Plan Advisory Task Force Network Alternatives & Phasing Strategy February 2016 BACKGROUND Table of Contents BACKGROUND Purpose & Introduction 2 Linking the TMP to Key Council Approved
WILMAPCO Public Opinion Survey Summary of Results
 Wilmington Area Planning Council WILMAPCO Public Opinion Survey Summary of Results Prepared by: 2955 Valmont Road, Suite 300 Boulder, Colorado 80301 t: 303-444-7863 f: 303-444-1145 www.n-r-c.com Table
FOR INFORMATION ONLY
 9 Date: August 6, 2012 Current Meeting: August 16, 2012 Board Meeting: September 6, 2012 BOARD MEMORANDUM TO: THROUGH: FROM: SUBJECT: Santa Clara Valley Transportation Authority Congestion Management Program
Bike Planner Overview
 Bike Planner Overview A Web-based Sketch Planning Tool for Los Angeles County presented by William E. Walter, GISP April 12, 2017 GIS-T Transportation leadership you can trust. Bike Planner Overview Guiding
Fresno Council of Governments Community Workshop. Tuesday, April 25, 2017 Hoover High School Fresno, California
 Fresno Council of Governments Community Workshop Tuesday, April 25, 2017 Hoover High School Fresno, California Who is Fresno COG? Fresno Council of Governments Association of local governments-the 15 cities
4. ENVIRONMENTAL IMPACT ANALYSIS 9. TRANSPORTATION AND TRAFFIC
 4. ENVIRONMENTAL IMPACT ANALYSIS 9. TRANSPORTATION AND TRAFFIC 4.9.1 INTRODUCTION The following section addresses the Proposed Project s impact on transportation and traffic based on the Traffic Study
Connecting Sacramento: A Trip-Making and Accessibility Study
 Connecting Sacramento: A Trip-Making and Accessibility Study Study Overview and Highlights July 2017 Purpose of this study Local governments and transportation agencies often make challenging decisions
Guidelines for Providing Access to Public Transportation Stations APPENDIX C TRANSIT STATION ACCESS PLANNING TOOL INSTRUCTIONS
 APPENDIX C TRANSIT STATION ACCESS PLANNING TOOL INSTRUCTIONS Transit Station Access Planning Tool Instructions Page C-1 Revised Final Report September 2011 TRANSIT STATION ACCESS PLANNING TOOL INSTRUCTIONS
Public Consultation Centre
 Region of Waterloo Transportation Master Plan Update Public Consultation Centre See the Information Package on how to contact the Project Team and complete the Comment Sheet www.regionofwaterloo.ca/en/exploring-the-region/transportation-master-plan.aspx
modes, the increased roadway capacity is the implied solution, which, in turn, has been shown to lead to more driving (induced demand).
.") EXECUTIVE SUMMARY A. Introduction The San Francisco Congestion Management Program (CMP) is a biennial program conducted in accordance with state law to monitor congestion and adopt plans for mitigating
EXECUTIVE SUMMARY A. Introduction The San Francisco Congestion Management Program (CMP) is a biennial program conducted in accordance with state law to monitor congestion and adopt plans for mitigating
An Assessment of Potential Greenhouse Gas Emissions Reductions from Proposed On Street Bikeways
 An Assessment of Potential Greenhouse Gas Emissions Reductions from Proposed On Street Bikeways Through the Sustainable Bethlehem Initiative, the Town of Bethlehem has identified both the improvement of
EXECUTIVE SUMMARY... vii 1 STUDY OVERVIEW Study Scope Study Area Study Objectives
 Contents EXECUTIVE SUMMARY... vii 1 STUDY OVERVIEW... 1-1 1.1 Study Scope... 1-1 1.2 Study Area... 1-1 1.3 Study Objectives... 1-3 2 EXISTING CONDITIONS... 2-1 2.1 Existing Freeway Conditions... 2-4 2.1.1
WELCOME Region of Waterloo Transportation Master Plan Update Public Consultation Centre
 WELCOME Region of Waterloo Transportation Master Plan Update Public Consultation Centre 1. What is the purpose of this event? To introduce Moving Forward and collect public input on: The Region s future
lowercase tod Rail~Volution October 22, 2013 Melanie Hare
 lowercase tod Rail~Volution October 22, 2013 Melanie Hare mhare@urbanstrategies.com overview 1 the challenge 2 on the ground 3 strategies the challenge suburban cities planning for re-urbanization and
SAN FRANCISCO MUNICIPAL TRANSPORTATION AGENCY
 THIS PRINT COVERS CALENDAR ITEM NO.: 13 DIVISION: Sustainable Streets BRIEF DESCRIPTION: SAN FRANCISCO MUNICIPAL TRANSPORTATION AGENCY Endorsing the Planning Department s 2014 Update to the conceptual
Measuring and Communicating Mobility:
 Measuring and Communicating Mobility: The District Mobility Project Stephanie Dock, District Department of Transportation TRB Transportation Issues in Major Cities Committee May 2, 2017 Deconstructing
Automobile Alternatives. S. Handy TTP282 Transportation Orientation Seminar 10/28/11
 Automobile Alternatives S. Handy TTP282 Transportation Orientation Seminar 10/28/11 Why worry about them? Air quality Climate change Congestion Sprawl Equity Health U.S. Mode Split in 2001 Share of Person
About the Active Transportation Alliance
 About the Active Transportation Alliance Chicagoland s voice for better biking, walking and transit Founded 1985 7,000 members, ~33 full time staff Serve Chicago metro region 1 More Cars, More Driving
OC Healthy Communities Forum. The proportion of the population that live within a half mile of a major transit access point.
 OC Healthy Communities Forum Transit Access The proportion of the population that live within a half mile of a major transit access point. Use of public transit can result in decreased greenhouse gas emissions
 Time of Change We Are Growing We Are An Attractive Place To Live We Are Age Diverse + Living Longer 50000 40000 30000 20000 10000 0 2010 Census Job Density Housing Sheds Transit Sheds The Project FUNDING
Vision Public Workshop: Findings
 Vision Public Workshop: Findings Long Range Transportation Plan & Bicycle Mobility Plan February 2018 Vision Workshop South Kingstown 1/23/18 Providence 1/24/18 Newport 1/31/18 Long Range Transportation
Online Open House Survey Report. December 2016
 December 216 I. OVERVIEW & OUTREACH SUMMARY Introduction Washington County evaluated long-term transportation investments and strategies as part of the Transportation Futures Study. The purpose of the
Measuring Transportation: Traffic, Mobility and Accessibility
 Measuring Transportation: Traffic, Mobility and Accessibility THIS FEATURE COMPARES THREE APPROACHES TO MEASURING TRANSPORTATION SYSTEM PERFORMANCE. TRAFFIC-BASED MEASUREMENTS EVALUATE MOTOR VEHICLE MOVEMENT;
T1-A - Service Reduction (Re-sizing)
") Key T1-A Choice A Key T1-B Choice B Key T1-C Choice C Key T1-D Choice D Key T1-E Choice E Key T1-F Choice F Key Choice G T2 T1-A - Service Reduction (Re-sizing) Description This key choice would represent
Key T1-A Choice A Key T1-B Choice B Key T1-C Choice C Key T1-D Choice D Key T1-E Choice E Key T1-F Choice F Key Choice G T2 T1-A - Service Reduction (Re-sizing) Description This key choice would represent
PRELIMINARY DRAFT FIRST AMENDMENT TO VISION 2050: A REGIONAL LAND USE AND TRANSPORTATION PLAN FOR SOUTHEASTERN WISCONSIN
 PRELIMINARY DRAFT FIRST AMENDMENT TO VISION 2050: A REGIONAL LAND USE AND TRANSPORTATION PLAN FOR SOUTHEASTERN WISCONSIN ESTABLISHING TARGETS FOR FEDERAL PERFORMANCE MEASURES: HIGHWAY SAFETY SOUTHEASTERN
I-105 Corridor Sustainability Study (CSS)
") I-105 Corridor Sustainability Study (CSS) Metro Streets and Freeways Subcommittee March 21, 2019 Gary Hamrick Cambridge Systematics, Inc. I-105 CSS Project History & Background Funded by Caltrans Sustainable
I-105 Corridor Sustainability Study (CSS) Metro Streets and Freeways Subcommittee March 21, 2019 Gary Hamrick Cambridge Systematics, Inc. I-105 CSS Project History & Background Funded by Caltrans Sustainable
2045 Long Range Transportation Plan. Summary of Draft
 2045 Long Range Transportation Plan Summary of Draft Fredericksburg Area Metropolitan Planning Organization The George Washington Region includes the City of Fredericksburg and the counties of Caroline,
MCTC 2018 RTP SCS and Madera County RIFP Multi-Modal Project Eval Criteria GV13.xlsx
 MCTC 8 RTP SCS and Madera County RIFP Multi-Modal Project Eval Criteria GV.xlsx Madera County Transportation Commission Regional Transportation Plan / Sustainable Communities Strategy Multi-Modal Project
Community & Transportation Preferences Survey
 Community & Transportation Preferences Survey Webinar: August 5, 2015 Hugh Morris, AICP, LEED Realtor.org Jennifer Dill, Ph.D. trec.pdx.edu 1 Introduction National Association of Realtors Over 1,000,000
Typical Rush Hour Commute. PennyforTransportation.com
 Typical Rush Hour Commute In the News Overview of the Plan Collaborative plan with projects in every community Prioritizing connectivity and congestion relief Dedicated transportation-specific funding;
Climate Change Action Plan: Transportation Sector Discussion Paper: Cycling
 Climate Change Action Plan: Transportation Sector Discussion Paper: Cycling ontario.ca/climatechange Contents 1. Minister of Transportation s message... 3 2. Introduction... 5 3. Sector Overview and Support
VISION ZERO: What will it take?
 1 Through Vision Zero SF we commit to working together to prioritize street safety and eliminate traffic deaths in San Francisco. VISION ZERO: What will it take? Tom Maguire, Director, Sustainable Streets
modes, the increased roadway capacity is the implied solution, which, in turn, has been shown to lead to more driving (induced demand).
.") CONGESTION MANAGEMEN T PROGRAM DECEMBER, 201 7 EXECUTIVE SUMMARY A. Introduction Every two years, the San Francisco County Transportation Authority (SFCTA) prepares the San Francisco Congestion Management
CONGESTION MANAGEMEN T PROGRAM DECEMBER, 201 7 EXECUTIVE SUMMARY A. Introduction Every two years, the San Francisco County Transportation Authority (SFCTA) prepares the San Francisco Congestion Management
FROM: CITY MANAGER DEPARTMENT: PLANNING AND COMMUNITY ENVIRONMENT DATE: OCTOBER 4, 2004 CMR:432:04
 TO: HONORABLE CITY COUNCIL FROM: CITY MANAGER DEPARTMENT: PLANNING AND COMMUNITY ENVIRONMENT DATE: OCTOBER 4, 2004 CMR:432:04 SUBJECT: FINANCE COMMITTEE RECOMMENDATION TO ADOPT TRANSPORTATION STRATEGIC
Transportation-Demand Management Community Presentation
 Transportation-Demand Management Community Presentation American University Office of Risk, Safety and Transportation programs Thursday, June 7, 2018 Program Objectives Improve transportation options for
Appendix T 1: Additional Supporting Data
 Appendix T 1: Additional Supporting Data Project Delivery Delays with the implementation of the 2000 TIP became apparent early in the decade. In response to direction among policy officials, ARC began
Exceeding expectations: The growth of walking in Vancouver and creating a more walkable city in the future through EcoDensity
 Exceeding expectations: The growth of walking in Vancouver and creating a more walkable city in the future through EcoDensity Melina Scholefield, P. Eng. Manager, Sustainability Group, City of Vancouver
INFRASTRUCTURE: Using the Grid to Create a more Self-Sustaining Downtown. Studio Spring 2013
 EMERGENT FUTURES The San Diego Section of the American Society of Civil Engineers (ASCE) released a new report, the 2012 San Diego County Infrastructure Report Card. Since the last San Diego Report Card
Eric Sundquist Managing Director State Smart Transportation Initiative (SSTI) Urban Sustainability Accelerator
 Urban Sustainability Accelerator") New tools for making better transportation system decisions Eric Sundquist Managing Director State Smart Transportation Initiative (SSTI) Urban Sustainability Accelerator Accessibility and trip-making
New tools for making better transportation system decisions Eric Sundquist Managing Director State Smart Transportation Initiative (SSTI) Urban Sustainability Accelerator Accessibility and trip-making
PERFORMANCE ANALYSIS of The Draft 2015 CLRP
 Item 9 PERFORMANCE ANALYSIS of The Draft CLRP Presentation to the Transportation Planning Board September 16, CLRP Performance Analysis 1 What is the Long-Range Transportation Plan (CLRP)? The CLRP identifies
Board-Approved Funding Awards for Cycle 4 Active Transportation Grant Program Projects (in Order of Project Rankings) Approved on
 Approved on") CAPITAL Large Category Projects Board-Approved Funding Awards for Cycle 4 Active Transportation Grant Program Projects (in Order of Project Rankings) Approved on 07-27-18 1 La Mesa University Ave Pedestrian
CAPITAL Large Category Projects Board-Approved Funding Awards for Cycle 4 Active Transportation Grant Program Projects (in Order of Project Rankings) Approved on 07-27-18 1 La Mesa University Ave Pedestrian
FACTS AND FIGURES: MAKING THE CASE FOR COMPLETE STREETS IN LEE COUNTY
 FACTS AND FIGURES: MAKING THE CASE FOR COMPLETE STREETS IN LEE COUNTY Safety: Close to 5,000 pedestrians and bicyclists die each year on U.S. roads, and more than 70,000 are injured. [Mean Streets, Surface
Purpose and Need. Chapter Introduction. 2.2 Project Purpose and Need Project Purpose Project Need
 Chapter 2 Purpose and Need 2.1 Introduction The El Camino Real Bus Rapid Transit (BRT) Project (Project) would make transit and other transportation improvements along a 17.6-mile segment of the El Camino
Why are we still talking about Complete Streets?
 Why are we still talking about Complete Streets? Jeremy R. Klop, AICP Complete Streets and Capital Projects Session March 1, 2013 Public Works Officers Institute League of California Cities Conference,
Win-Win Transportation Solutions
 Win-Win Transportation Solutions Todd Litman Victoria Transport Policy Institute Presented Lipinski Symposium on Transportation Policy Chicago, Illinois 15 October 2007 What is The Transportation Problem?
MEMORANDUM. Santa Clara Valley Transportation Authority
 MEMORANDUM TO: FROM: Board of Directors Kurt Evans, Government Affairs Manager DATE: September 12, 2014 SUBJECT: Legislative Update: Cap-and-Trade Together, the FY 2015 Budget Act and SB 862, a budget
San Francisco Mobility Trends Report 2018
 San Francisco Mobility Trends Report 2018 San Francisco Municipal Transportation Agency Jan 28, 2019 San Francisco, California 2 Table of Contents 2 5 6 7 9 11 12 13 Executive Summary Transit Bicycling
DRAFT MOVING FORWARD RHODE ISLAND BICYCLE MOBILITY PLAN 2018 PREPARED FOR PREPARED BY IN ASSOCIATION WITH
 RHODE ISLAND MOVING FORWARD BICYCLE MOBILITY PLAN 2018 PREPARED FOR PREPARED BY IN ASSOCIATION WITH T AF CHAPTER 1 D R INTRODUCTION CHAPTER 3 ARTICULATES VISION Bicycling is safe, fun and practical in
Active Transportation Infrastructure Investment A Business Case
 Active Transportation Infrastructure Investment A Business Case In 2016, the Real Estate Foundation awarded the Capital Regional District a $50,000 grant for Shifting Gears: Land Use Change through Active
Key objectives of the survey were to gain a better understanding of:
 3 COMMUNITY INPUT Community input is an essential part of corridor studies. For the SR 87 corridor study, VTA staff conducted an extensive online survey of people living and commuting along the corridor.
SACRAMENTO AREA TRAVEL SURVEY: BEFORE BIKE SHARE
 SACRAMENTO AREA TRAVEL SURVEY: BEFORE BIKE SHARE August 2017 A Research Report from the National Center for Sustainable Transportation Susan Handy, University of California, Davis Drew Heckathorn, University
THE 2010 MSP REGION TRAVEL BEHAVIOR INVENTORY (TBI) REPORT HOME INTERVIEW SURVEY. A Summary of Resident Travel in the Twin Cities Region
 REPORT HOME INTERVIEW SURVEY. A Summary of Resident Travel in the Twin Cities Region") THE 2010 MSP REGION TRAVEL BEHAVIOR INVENTORY (TBI) REPORT HOME INTERVIEW SURVEY A Summary of Resident Travel in the Twin Cities Region October 2013 WHAT IS THE TBI? The Travel Behavior Inventory (TBI)
THE 2010 MSP REGION TRAVEL BEHAVIOR INVENTORY (TBI) REPORT HOME INTERVIEW SURVEY A Summary of Resident Travel in the Twin Cities Region October 2013 WHAT IS THE TBI? The Travel Behavior Inventory (TBI)
Cities Connect. Cities Connect! How Urbanity Supports Social Inclusion
 Cities Connect! How Urbanity Supports Social Inclusion Todd Litman Victoria Transport Policy Institute Metropolis Toronto, Canada - 14 June 2006 Cities Connect People with people. People with jobs. People
TRANSIT & NON-MOTORIZED PLAN DRAFT FINAL REPORT Butte County Association of Governments
 1 INTRODUCTION Maintaining a high quality of life is the essence of this plan for transit and non-motorized transportation in Butte County. Curbing greenhouse gas emissions (GHG) by reducing congestion,
Pre-Plan Consultation Summary
 Transportation Master Plan Pre-Plan Consultation Summary Thursday July 7, 2011 Presentation ti Outline Consultation Objectives Scope of Consultation Who Responded? What did we hear? How well did we connect?
Coolest Cities Results Summary
 Coolest Cities Results Summary About Coolest Cities Canada s six largest urban areas provide homes and jobs for almost 15 million people, nearly half of our population. Transporting these citizens to and
Appendix C 3. Bicycle / Pedestrian Planning
 Appendix C 3. Bicycle / Pedestrian Planning BICYCLE/PEDESTRIAN PLANNING 2005 Master Plan GOAL: Provide for safe and convenient bicycle and pedestrian circulation throughout the City. Develop a city-wide
Regional Transportation Needs Within Southeastern Wisconsin
 Regional Transportation Needs Within Southeastern Wisconsin #118274 May 24, 2006 1 Introduction The Southeastern Wisconsin Regional Planning Commission (SEWRPC) is the official areawide planning agency
How To Encourage More Efficient Transportation in Brazilian Cities
 How To Encourage More Efficient Transportation in Brazilian Cities Todd Litman Victoria Transport Policy Institute Presented Seminar on Discouraging The Use Of Cars São Paulo, Brazil 3 September 2013 Creating
APPENDIX W OFF-MODEL ADJUSTMENTS
 APPENDIX W OFF-MODEL ADJUSTMENTS The three-county travel demand model was used to evaluate the land use and transportation project scenarios for the Regional Transportation Plan Update. The model provided
Peterborough Council on Aging
 Peterborough Council on Aging Discussion paper series #4, 2015 Transportation Transportation, including accessible and affordable public transport is a key factor influencing active aging. in particular,
Addressing Bicycle Capacity Issues on Public Transportation
 Addressing Bicycle Capacity Issues on Public Transportation Advanced Transportation Technologies Clean Transportation Solutions SM Whitney Pitkanen Project Manager MISSION STATEMENT CALSTART is dedicated
Memorandum. Fund Allocation Fund Programming Policy/Legislation Plan/Study Capital Project Oversight/Delivery Budget/Finance Contract/Agreement Other:
 Memorandum Date: November 20, 2017 To: Transportation Authority Board From: Eric Cordoba Deputy Director Capital Projects Subject: 12/5/17 Board Meeting: San Francisco Freeway Corridor Management Study
2016 Capital Bikeshare Member Survey Report
 2016 Capital Bikeshare Member Survey Report Prepared by: LDA Consulting Washington, DC 20015 (202) 548-0205 February 24, 2017 EXECUTIVE SUMMARY Overview This report presents the results of the November
NC Demographic Trends Through 2035
 NC Demographic Trends Through 2035 House Select Committee on Strategic Transportation Planning and Long Term Funding Solutions February 22, 2016 Rebecca Tippett, University of North Carolina July 1 Population
Integrating Community Development and Transportation Strategies. November 13, 2014
 R-B CORRIDOR 1970 R-B CORRIDOR TODAY Integrating Community Development and Transportation Strategies November 13, 2014 The Community Development Transportation Question Can communities support increased
Implementing Living Streets. Dena Belzer January 29, 2009
 Implementing Living Streets Dena Belzer January 29, 2009 February 22, 2004 Starting with Some Definitions 1.Living Streets/Complete Streets 2.Corridor Revitalization 3.Shopping Mall Reuse Living/Complete
2. Transportation in Ottawa Today and Tomorrow
 2. Transportation in Ottawa Today and Tomorrow 2.1 Transportation System Overview The City. The City of Ottawa is the largest municipality in the National Capital Region (NCR). Urban development covers
Public Bikesharing in North America: Early Operator and User Understanding
 Public in North America: Early Operator and User Understanding Elliot Martin, Ph.D. Assistant Research Engineer Susan Shaheen, Ph.D., Associate Adjunct Professor Bicycle Urbanism Symposium Washington University
INSIGHTS ON HOW BIKESHARING SUPPORTS URBAN DEVELOPMENT
 INSIGHTS ON HOW BIKESHARING SUPPORTS URBAN DEVELOPMENT INTRODUCTION Recent advances in mobile technology and big data analysis have enabled new opportunities to rethink how people live in and move through
Bicycle Master Plan Goals, Strategies, and Policies
 Bicycle Master Plan Goals, Strategies, and Policies Mobilizing 5 This chapter outlines the overarching goals, action statements, and action items Long Beach will take in order to achieve its vision of
Chapter 2. Bellingham Bicycle Master Plan Chapter 2: Policies and Actions
 Chapter 2 Bellingham Bicycle Master Plan Chapter 2: Policies and Actions Chapter 2: Policies and Actions The Bicycle Master Plan provides a road map for making bicycling in Bellingham a viable transportation
San Francisco Transportation Plan Update
 San Francisco Transportation Plan Update PART 2.3: Needs Assessment (continued) Spring 2013 www.sfcta.org/movesmartsf twitter.com/sanfranciscota www.facebook.com/movesmartsf SFTP Needs Assessment Planned
WHITE PAPER: TRANSIT SERVICE FOR SOUTH SHAGANAPPI
 9/27/2012 TRANSIT PLANNING WHITE PAPER: TRANSIT SERVICE FOR SOUTH SHAGANAPPI 2012 Calgary Transit 1 Table of Contents Purpose... 3 Area of Change... 3 Background... 3 Access to destinations... 5 Connecting
Perryville TOD and Greenway Plan
 Perryville TOD and Greenway Plan Greenway Glossary Pathway: A bicycle and pedestrian path separated from motorized vehicular traffic by an open space, barrier or curb. Multi-use paths may be within the
Rhode Island Moving Forward Long-Range Transportation Plan 2040 Municipal Roundtable Providence County
 Rhode Island Moving Forward Long-Range Transportation Plan 2040 Municipal Roundtable Providence County www.planri.com PlanRI2040@gmail.com Municipal Roundtable Meeting Summary Date/time: Location: Tuesday,
National Community and Transportation Preferences Survey. September 2017
 National Community and Transportation Preferences Survey September Executive Summary - Overview The Community and Transportation Preferences Survey echoes many of the major findings from the previous surveys.
VISION. Introduction WHAT S INSIDE. One Region, Focusing on Our Future
 VISION 2050 One Region, Focusing on Our Future A publication of the Southeastern Wisconsin Regional Planning Commission Fall 2015 THE ALTERNATIVES THE EVALUATION WHAT S INSIDE Land Use pgs. 2-3 Public
92% COMMUTING IN THE METRO. Congested Roadways Mode Share. Roadway Congestion & Mode Share
 COMMUTING IN THE METRO Roadway Congestion & Mode Share The majority of major roadways in Greater Des Moines are without congestion and have underutilized capacity. This surplus capacity could be used for
Capital Bikeshare 2011 Member Survey Executive Summary
 Capital Bikeshare 2011 Member Survey Executive Summary Prepared by: LDA Consulting Washington, DC 20015 (202) 548-0205 June 14, 2012 EXECUTIVE SUMMARY Overview This report presents the results of the 2012
First Mile, Last Mile: Plans for all Shapes and Sizes. Hannah Lindelof, Principal Planner San Francisco Bay Area Rapid Transit September 18, 2017
 First Mile, Last Mile: Plans for all Shapes and Sizes Hannah Lindelof, Principal Planner San Francisco Bay Area Rapid Transit September 18, 2017 BART Station Access Policy Goals A. Safer, Healthier, Greener.
North Coast Corridor:
 North Coast Corridor: Connecting People, Transportation & Environment Legislative Hearing: 11.8.10 1 North Coast Corridor Region s Lifeline A Regional Strategy Mobility, Economy & Environment North Coast
CONGESTED LOS ANGELES
 CONGESTED LOS ANGELES Prepared For: Mayor Antonio Villaraigosa and City Council City of Los Angeles Prepared By: Jacki Murdock Transportation Analyst LADOT December 11 th, 2011 Outline What causes congestion?
Driverless Vehicles Potential Influence on Bicyclist Facility Preferences
 Driverless Vehicles Potential Influence on Bicyclist Facility Preferences MICHAEL BLAU, MCRP, LCI O T E C O C T O B E R 2 6, 2 0 1 6 S E S S I O N # 8 2 - E V A L U AT I N G T H E P E R F O R M A N C E
We believe the following comments and suggestions can help the department meet those goals.
 The Honorable Secretary Anthony Foxx The Secretary of Transportation United States Department of Transportation 1200 New Jersey Avenue, SE Washington, DC 20590 August 30, 2013 Dear Secretary Foxx, Thank
HENDERSON DEVELOPMENT 213, 217, 221, 221 ½, 223 HENDERSON AVENUE and 65 TEMPLETON STREET OTTAWA, ONTARIO TRANSPORTATION OVERVIEW.
 HENDERSON DEVELOPMENT 213, 217, 221, 221 ½, 223 HENDERSON AVENUE and 65 TEMPLETON STREET OTTAWA, ONTARIO TRANSPORTATION OVERVIEW Prepared for: 2294170 Ontario Inc. February 2, 2017 117-652 Report_1.doc
Transit Ridership - Why the Decline and How to Increase. Hosted by the. Virginia Transit Association
 Transit Ridership - Why the Decline and How to Increase Hosted by the Virginia Transit Association Virginia Transit Association 1108 East Main Street, Suite 1108 Richmond, VA 23219 804.643.1166 www.vatransit.com
Trends in New Jersey Land Use: Addressing Obesity Through Planning. New Jersey Future Dan Fatton, Outreach and Development Director December, 2011
 Trends in New Jersey Land Use: Addressing Obesity Through Planning New Jersey Future Dan Fatton, Outreach and Development Director December, 2011 Smart Growth research, policy and advocacy organization
BUILDING THE CASE FOR TRAVEL OPTIONS IN WASHING TON COUNTY. Image: Steve Morgan. Image: Steve Morgan
 BUILDING THE CASE FOR TRAVEL OPTIONS IN WASHING TON COUNTY Image: Steve Morgan Image: Steve Morgan Image: TriMet Image: TriMet WHAT ARE TRAVEL OPTIONS PROGRAMS? Travel options programs encourage residents,