Analyses of Scatterometer and SAR Data at the University of Hamburg
|
|
|
- Jason Holmes
- 5 years ago
- Views:
Transcription
1 Analyses of Scatterometer and SAR Data at the University of Hamburg Wind, Waves, Surface Films and Rain ГАДЕ, Мартин Хорстович (aka Martin Gade) Institut für Meereskunde, Universität Hamburg, Германия Universität Hamburg
2 Outline SAR Examples Surface Films: Scat and SAR Rain on Scat and SAR data Multi³Scat Experiments Wind Scat and Ocean Color Summary Universität Hamburg Gade: Scatterometer and SAR Data at Univ Hamburg 2
 SAR sensors aboard")
 ENVISAT (2002)")
")


3 Synthetic Aperture Radar (SAR) SAR sensors aboard satellites ERS-1/2 (1991 / 1995) ENVISAT (2002) TerraSAR-X (2007) RADARSAT-1/2 (1995 / 2007) ALOS (2006) further SARs on Indian, Chinese, Russian satellites Universität Hamburg Gade: Scatterometer and SAR Data at Univ Hamburg 3
![SAR Examples (1) [Robinson, 2003] ERS SAR](/docs-images/93/112779633/images/4-0.jpg "image (100 km 100 km) Strait of Gibraltar (1")

4 SAR Examples (1) [Robinson, 2003] ERS SAR image (100 km 100 km) Strait of Gibraltar (1 January 1993, 2239 UTC, ESA) Universität Hamburg Gade: Scatterometer and SAR Data at Univ Hamburg 4
![SAR Examples (2) [Robinson, 2003] ERS SAR](/docs-images/93/112779633/images/5-0.jpg "image (100 km 100 km) Chinese coast (8 July")

5 SAR Examples (2) [Robinson, 2003] ERS SAR image (100 km 100 km) Chinese coast (8 July 1995, 0234 UTC, ESA) Universität Hamburg Gade: Scatterometer and SAR Data at Univ Hamburg 5
![SAR Examples (3) [Robinson, 2003] ERS SAR image (70 km 70 km) Bering Strait (24](/docs-images/93/112779633/images/6-0.jpg "June 1997, ESA) Universität Hamburg Gade: Scatterometer and SAR Data at Univ")
6 SAR Examples (3) [Robinson, 2003] ERS SAR image (70 km 70 km) Bering Strait (24 June 1997, ESA) Universität Hamburg Gade: Scatterometer and SAR Data at Univ Hamburg 6
 South China Sea (14 May 1998,")

7 SAR Examples (4) ERS SAR image (100 km 100 km) South China Sea (14 May 1998, 0252 UTC, ESA) Universität Hamburg Gade: Scatterometer and SAR Data at Univ Hamburg 7
![SAR Examples (5) [Barale & Gade 2008] SAR](/docs-images/93/112779633/images/8-0.jpg "images (80 km 80 km) Arctic sea ice at 82 N")
 right: Radarsat (C Band, HH")
 left: ERS (C Band, VV pol)")

8 SAR Examples (5) [Barale & Gade 2008] SAR images (80 km 80 km) Arctic sea ice at 82 N 12 E (19 September 1996, ESA, CSA) left: ERS (C Band, VV pol) right: Radarsat (C Band, HH pol) ERS SAR image (50 km 65 km) Arctic sea ice ( ESA, NASDA) left: ERS (C Band, VV pol) right: JERS-1 (L Band, HH pol) Universität Hamburg Gade: Scatterometer and SAR Data at Univ Hamburg 8

9 Surface Films Universität Hamburg Gade: Scatterometer and SAR Data at Univ Hamburg 9


 of the")
")

10 Surface Films on SAR Images ( 30 km x 40 km ) 11 January February May July October October 1998 ERS SAR images (30 km 40 km) of the north-western Med, off Barcelona ( ESA) Universität Hamburg Gade: Scatterometer and SAR Data at Univ Hamburg 10

11 Anthropogenic Surface Films on SAR Images SIR-C/X-SAR Baltic Sea e.g., 9 April 1994 Monotonous increase of damping ratios No dependency on polarization Universität Hamburg Gade: Scatterometer and SAR Data at Univ Hamburg 11

12 Biogenic Surface Films on SAR Images High damping ratios at low wavenumbers No dependency on polarization Universität Hamburg Gade: Scatterometer and SAR Data at Univ Hamburg 12
13 Wave Damping by Surface Films Use multi-frequency radar techniques to discriminate between biogenic and anthropogenic surface films Universität Hamburg Gade: Scatterometer and SAR Data at Univ Hamburg 13

14 Field Experiments With Artificial Surface Films Multi³SCAT of Univ Hamburg: Flown on helicopter BO frequencies: (L, S, C, X, Ku band) 4 polarisations (HH, HV, VV, VH) Incidence angle: nomin. flight altitude: 150 m Ø footprint: 1.6 m m Transmit power: 10 mw mw Universität Hamburg Gade: Scatterometer and SAR Data at Univ Hamburg 14
 Universität Hamburg Gade: Scatterometer and SAR Data at Univ Hamburg")
15 Field Experiments With Artificial Surface Films 1994: 2 SIR-C/X-SAR missions Field experiments with quasibiogenic slicks and anthropogenic oil spills Just minor differences in radar contrast at high wind speeds (12 m/s) Universität Hamburg Gade: Scatterometer and SAR Data at Univ Hamburg 15
16 Field Experiments With Artificial Surface Films 5-frequency/multi-polarization HELISCAT TOLG IFO Modeling damping ratios at high wind speeds Model can explain 2 (0) ( k) 0 ( k) s s g n 4 m ( s) ( k) s ( k) 0 2 0cg c 2u cos k g m : parameter describing reduction of friction velocity Δn : parameter describing reduction of wave breaking n monotonous increase of damping curves (no Marangoni maximum!) similar damping behavior of biogenic and anthropogenic films Universität Hamburg Gade: Scatterometer and SAR Data at Univ Hamburg 16
17 Field Experiments With Artificial Surface Films Comparison of SIR-C/X-SAR and HELISCAT results HELISCAT measured higher damping ratios! Difference depends on type of sensor? Universität Hamburg Gade: Scatterometer and SAR Data at Univ Hamburg 17

18 Statistical Analysis of SAR Images Oil Pollution Observed in European Marginal Seas most pollution along main ship traffic routes more pollution during summer? Universität Hamburg Gade: Scatterometer and SAR Data at Univ Hamburg 18
 Universität Hamburg Gade: Scatterometer and SAR Data at Univ Hamburg")
19 Statistical Analysis of SAR Images Wind Speed Dependency of Radar Contrast ERS-2 SAR image; 24 March 1997 / 1040 UTC (orbit 10068, frame 2529) Universität Hamburg Gade: Scatterometer and SAR Data at Univ Hamburg 19

20 Statistical Analysis of SAR Images Normalized Visibility Defined as ratio A/B of the wind speed distribution of detected oil spills (A) and model winds (B) Any oil pollution in the three CS test sites is visible only at wind speeds up to 9-10 m/s! Universität Hamburg Gade: Scatterometer and SAR Data at Univ Hamburg 20
 Universität Hamburg Gade: Scatterometer and SAR Data at Univ Hamburg 21")
21 Statistical Analysis of SAR Images Only those oil spills considered which were detected at low to moderate winds (U < 9m/s) Universität Hamburg Gade: Scatterometer and SAR Data at Univ Hamburg 21


:")
![D(i) = - log[n e (i)] / log[e] Gade:](/docs-images/93/112779633/images/22-3.jpg "Scatterometer and SAR Data at Univ Hamburg")
22 Statistical Analysis of SAR Images Fractal Dimension Box counting algorithm to detect selfsimilar characteristics of different phenomena: D = - log[n e ] / log[e] Calculate box counting dimensions for different image intensity levels i (NRCS): D(i) = - log[n e (i)] / log[e] Gade: Scatterometer and SAR Data at Univ Hamburg Universität Hamburg 22
 for different oceanic and atmospheric phenomena atmos. conv.")

23 Statistical Analysis of SAR Images Fractal Dimensions Examples of functions D(i) for different oceanic and atmospheric phenomena atmos. conv. cells spill Slicks & currents spill & ships purple: no filter pink: Kuan filter rain 23 Universität Hamburg Gade: Scatterometer and SAR Data at Univ Hamburg

24 Rain Universität Hamburg Gade: Scatterometer and SAR Data at Univ Hamburg 24

25 Rain Cells on SAR Images ERS-2 South China Sea May 11, 1998, 0246 UTC Gade: Scatterometer and SAR Data at Univ Hamburg 25 Universität Hamburg

26 Rain Cells on SAR Images SIR-C/X-SAR Carribean Sea April 17, 1994, 17:56 UTC Universität Hamburg Gade: Scatterometer and SAR Data at Univ Hamburg 26


27 Rain Cells on SAR Images TerraSAR-X German Bight 21 August 2008, 05:50 UTC Gade: Scatterometer and SAR Data at Univ Hamburg Universität Hamburg 27
")


28 Field Experiments / North Sea L, S, C, X band (1-10 GHz) HH-, VV-, HV-polarization = h = 24m R = 0 50 mm/h 28 Universität Hamburg Gade: Scatterometer and SAR Data at Univ Hamburg
29 Field Experiments : Results Wave damping coefficient Wave damping Wave generation Rain rates up to 50 mm/h S band: RCS reduction, C band: same values X band: RCS enhancement RCS reduction Braun, 2002 Universität Hamburg Gade: Scatterometer and SAR Data at Univ Hamburg 29
30 Multi³Scat on FINO 2 Universität Hamburg Gade: Scatterometer and SAR Data at Univ Hamburg 30
31 Direct Link Between σ 0 and k wind speed normalised radar cross section, σ 0 gas transfer Universität Hamburg Gade: Multi³Scat-Messungenl 31
 1.")


32 Multi³Scat: 5 radar frequencies (L,S,C,X,Ku) GHz (cf. cellphone 0.9 GHz (D) 1.8 GHz (E)) 4 polarizations (HH,HV,VV,VH) Transmit power < 1 W total (cf. cellphone 1 W - 2 W) Incidence angle Radar backscatter as measure of the sea surface roughness Universität Hamburg Gade: Multi³Scat-Messungenl 32
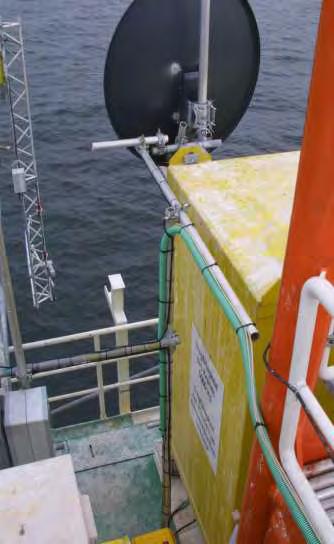
33 FINO 2 Universität Hamburg Gade: Multi³Scat-Messungenl 33

34 FINO 2 L S C X Ku Wind Universität Hamburg Gade: Multi³Scat-Messungenl 34


 JRC")

35 wind-driven processes in the Mediterranean Sea Ligurian-Provençal Sea stratification convection Levantine Basin Rhodes Gyre cyclonic: upwelling cold core AVHRR (82-91) JRC proc. Ierapetra Gyre Anticyclonic: downwelling, warm core Universität Hamburg

![Chl [mg m -3 ] 0.0 1 0.1 1.0 10. 100.](/docs-images/93/112779633/images/36-1.jpg "Chl [mg m -3 ] Gulf of Lion Rhodes gyre Ierapetra")
36 wind-driven blooming patterns in the Mediterranean Sea Chl [mg m -3 ] Chl [mg m -3 ] Gulf of Lion Rhodes gyre Ierapetra gyre February 2000 March 2000 Universität Hamburg
 2000 to 2007 (rows) QuikScat data Universität")
37 Ligurian-Provençal Sea, monthly mean winds Ligurian-Provençal Sea monthly mean winds January to May (columns) 2000 to 2007 (rows) QuikScat data Universität Hamburg
![Ligurian-Provençal Sea, monthly mean Chl Ligurian-Provençal Sea monthly mean Chl [mg/m 3 ]](/docs-images/93/112779633/images/38-0.jpg "January through May (columns) from 2000 to 2007 (rows) SeaWiFS data, NASA proc.")
38 Ligurian-Provençal Sea, monthly mean Chl Ligurian-Provençal Sea monthly mean Chl [mg/m 3 ] January through May (columns) from 2000 to 2007 (rows) SeaWiFS data, NASA proc. Universität Hamburg
 2000 to 2007 (rows) QuikScat data Universität")
39 Levantine Basin, monthly mean winds Levantine Basin monthly mean winds January to May (columns) 2000 to 2007 (rows) QuikScat data Universität Hamburg
![Levantine Basin, monthly mean Chl Levantine Basin monthly mean Chl [mg/m 3 ] January](/docs-images/93/112779633/images/40-0.jpg "through May (columns) from 2000 to 2007 (rows) SeaWiFS data, NASA proc.")
40 Levantine Basin, monthly mean Chl Levantine Basin monthly mean Chl [mg/m 3 ] January through May (columns) from 2000 to 2007 (rows) SeaWiFS data, NASA proc. Universität Hamburg
41 Summary SAR signatures of marine surface films, bottom topography, rain and sea ice UHH s Multi³Scat: multi-frequency scatterometer to be operated from helicopters or platforms Field experiments in the German Bight with (quasi-) biogenic and anthropogenic surface films: investigations on the use of radar for the discrimination of surface film types Discrimination possible at low to moderate winds, impossible at high winds Continuous scat measurements on platform FINO2 in the western Baltic Sea Joint use of Scat and OC Data in the Med Sea Universität Hamburg Gade: Scatterometer and SAR Data at Univ Hamburg 41

42 Благодарю за внимание! Universität Hamburg Gade: Scatterometer and SAR Data at Univ Hamburg 42
43 Благодарю за внимание! Universität Hamburg Gade: Scatterometer and SAR Data at Univ Hamburg 43
Development of SAR-Derived Ocean Surface Winds at NOAA/NESDIS
 Development of SAR-Derived Ocean Surface Winds at NOAA/NESDIS Pablo Clemente-Colón, William G. Pichel, NOAA/NESDIS Frank M. Monaldo, Donald R. Thompson The Johns Hopkins University Applied Physics Laboratory
THE POLARIMETRIC CHARACTERISTICS OF BOTTOM TOPOGRAPHY RELATED FEATURES ON SAR IMAGES
 THE POLARIMETRIC CHARACTERISTICS OF BOTTOM TOPOGRAPHY RELATED FEATURES ON SAR IMAGES Taerim Kim Professor, Ocean System Eng. Dept. Kunsan University Miryong Dong San 68, Kunsan, Jeonbuk, Korea, trkim@kunsan.ac.kr
Synthetic Aperture Radar imaging of Polar Lows
 Oslo Polar Low workshop 21-22 May 2012 Extended abstract Synthetic Aperture Radar imaging of Polar Lows Birgitte Furevik, Gunnar Noer and Johannes Röhrs met.no Forecasting polar lows is to a large degree
PRELIMINARY STUDY ON DEVELOPING AN L-BAND WIND RETRIEVAL MODEL FUNCTION USING ALOS/PALSAR
 PRELIMINARY STUDY ON DEVELOPING AN L-BAND WIND RETRIEVAL MODEL FUNCTION USING ALOS/PALSAR Osamu Isoguchi, Masanobu Shimada Earth Observation Research Center, Japan Aerospace Exploration Agency (JAXA) 2-1-1
Reprocessed QuikSCAT (V04) Wind Vectors with Ku-2011 Geophysical Model Function
 Wind Vectors with Ku-2011 Geophysical Model Function") Reprocessed QuikSCAT (V04) Wind Vectors with Ku-2011 Geophysical Model Function Lucrezia Ricciardulli and Frank Wentz Introduction In April 2011, we reprocessed the QuikSCAT ocean wind vectors using a
Reprocessed QuikSCAT (V04) Wind Vectors with Ku-2011 Geophysical Model Function Lucrezia Ricciardulli and Frank Wentz Introduction In April 2011, we reprocessed the QuikSCAT ocean wind vectors using a
STUDY OF LOCAL WINDS IN MOUNTAINOUS COASTAL AREAS BY MULTI- SENSOR SATELLITE DATA
 STUDY OF LOCAL WINDS IN MOUNTAINOUS COASTAL AREAS BY MULTI- SENSOR SATELLITE DATA Werner Alpers Institute of Oceanography, University of Hamburg, Bundesstrasse 53, D-20146 Hamburg, Germany E-mail: alpers@ifm.uni-hamburg.de
IMPROVED OIL SLICK IDENTIFICATION USING CMOD5 MODEL FOR WIND SPEED EVALUATION ON SAR IMAGES
 IMPROVED OIL SLICK IDENTIFICATION USING CMOD5 MODEL FOR WIND SPEED EVALUATION ON SAR IMAGES H.KHENOUCHI & Y. SMARA University of Sciences and Technology Houari Boumediene (USTHB). Faculty of Electronics
SAR images and Polar Lows
 SAR images and Polar Lows Gunnar Noer, Birgitte Furevik, Johannes Röhrs Observing polar lows in 2012: AVHRR Polar orbiting satellite imagery Primary source of info Observations at cloud tops Synoptic observations
Flow separation and lee-waves in the marine atmosphere
 Flow separation and lee-waves in the marine atmosphere Det norske Videnskabs-Akademi 16 Oct. 2009 Bjørn Gjevik Universitetet i Oslo epost: bjorng@math.uio.no Flow separation and lee-waves in the marine
Monitoring Conditions Offshore with Satellites
 Downloaded from orbit.dtu.dk on: Dec 15, 2017 Monitoring Conditions Offshore with Satellites Karagali, Ioanna; Hasager, Charlotte Bay; Badger, Merete; Bingöl, Ferhat; Ejsing Jørgensen, Hans Publication
Satellite information on ocean vector wind from Scatterometer data. Giovanna De Chiara
 Satellite information on ocean vector wind from Scatterometer data Giovanna De Chiara Why is Scatterometer important? The scatterometer measures the ocean surface winds (ocean wind vector). Ocean surface
Offshore wind resource mapping in Europe from satellites
 Offshore wind resource mapping in Europe from satellites Charlotte Bay Hasager Seminar at University of Auckland, Dept. of Physics 1 April 2015 Content DTU Wind Energy Offshore wind turbines New European
Geophysical Model Functions for the Retrieval of Ocean Surface Winds
 Geophysical Model Functions for the Retrieval of Ocean Surface Winds Donald R. Thompson and Frank M. Monaldo Johns Hopkins University Applied Physics Laboratory 11100 Johns Hopkins Road, Laurel, MD 20708
Combining wind and rain in spaceborne scatterometer observations: modeling the splash effects in the sea surface backscattering coefficient
 Combining wind and rain in spaceborne scatterometer observations: modeling the splash effects in the sea surface backscattering coefficient F. Polverari (1,2,4), F. S. Marzano (1,2), L. Pulvirenti (3,1),
High resolution wind fields over the Black Sea derived from Envisat ASAR data using an advanced wind retrieval algorithm
 High resolution wind fields over the Black Sea derived from Envisat ASAR data using an advanced wind retrieval algorithm Werner Alpers (1), Alexis Mouche (2), Andrei Yu. Ivanov (3), and Burghard Brümmer
The RSS WindSat Version 7 All-Weather Wind Vector Product
 2010 International Ocean Vector Winds Meeting Barcelona, Spain May 18 20, 2010 The RSS WindSat Version 7 All-Weather Wind Vector Product Thomas Meissner Lucrezia Ricciardulli Frank Wentz Outline 1. Overview:
Polar Activities at DLR Maritime Security Lab Bremen in the Projects EISTAK and EMS
 Polar Activities at DLR Maritime Security Lab Bremen in the Projects EISTAK and EMS Susanne Lehner, Anja Frost, Rudolf Ressel German Aerospace Center Chart 2 Maritime Security Lab in Bremen German Aerospace
Oceans and the Global Environment: Lec 2 taking physics and chemistry outdoors. the flowing, waving ocean
 Oceans and the Global Environment: Lec 2 taking physics and chemistry outdoors the flowing, waving ocean Peter Rhines 1 Eric Lindahl 2 Bob Koon 2, Julie Wright 3 www.ocean.washington.edu/courses/has221a-08
The Ice Contamination Ratio Method: Accurately Retrieving Ocean Winds Closer to the Sea Ice Edge While Eliminating Ice Winds
 The Ice Contamination Ratio Method: Accurately Retrieving Ocean Winds Closer to the Sea Ice Edge While Eliminating Ice Winds David Long Department of Electrical and Computer Engineering Brigham Young University
Introduction EU-Norsewind
 Satellite winds in EU-Norsewind Charlotte Bay Hasager, Risø DTU, Denmark Alexis Mouche, CLS, France Merete Badger, Poul Astrup & Morten Nielsen, Risø DTU, Denmark Romain Husson, ESA Introduction EU-Norsewind
OBSERVATIONS OF ATMOSPHERIC GRAVITY WAVES OVER THE CHINESE SEAS BY SPACEBORNE SYNTHETIC APERTURE RADAR
 OBSERVATIONS OF ATMOSPHERIC GRAVITY WAVES OVER THE CHINESE SEAS BY SPACEBORNE SYNTHETIC APERTURE RADAR W. Alpers (1), W. Huang (2), G. Xilin (2) (1) Center for Marine and Climate Research, Institute of
EVALUATION OF ENVISAT ASAR WAVE MODE RETRIEVAL ALGORITHMS FOR SEA-STATE FORECASTING AND WAVE CLIMATE ASSESSMENT
 EVALUATION OF ENVISAT ASAR WAVE MODE RETRIEVAL ALGORITHMS FOR SEA-STATE FORECASTING AND WAVE CLIMATE ASSESSMENT F.J. Melger ARGOSS, P.O. Box 61, 8335 ZH Vollenhove, the Netherlands, Email: info@argoss.nl
A. Bentamy 1, S. A. Grodsky2, D.C. Fillon1, J.F. Piollé1 (1) Laboratoire d Océanographie Spatiale / IFREMER (2) Univ. Of Maryland
 Laboratoire d Océanographie Spatiale / IFREMER (2) Univ. Of Maryland") Calibration and Validation of Multi-Satellite scatterometer winds A. Bentamy 1, S. A. Grodsky2, D.C. Fillon1, J.F. Piollé1 (1) Laboratoire d Océanographie Spatiale / IFREMER (2) Univ. Of Maryland Topics
Calibration and Validation of Multi-Satellite scatterometer winds A. Bentamy 1, S. A. Grodsky2, D.C. Fillon1, J.F. Piollé1 (1) Laboratoire d Océanographie Spatiale / IFREMER (2) Univ. Of Maryland Topics
TRMM TMI and AMSR-E Microwave SSTs
 TMI and AMSR-E Microwave SSTs Chelle Gentemann, Frank Wentz, & Peter Ashcroft Gentemann@remss.com www.remss.com TMI/AMSR-E MW SST algorithm development Validation Results Sensor Issues Useful for Climate
Central American Pacific Coast
 Overview The Pacific coast of Central America extends approximately 3700 km from central Mexico (20 o N, 106 o W) to the edge of South America (7 o N, 78 o W). A significant continental shelf exists from
OBSERVATION OF HURRICANE WINDS USING SYNTHETIC APERTURE RADAR
 OBSERVATION OF HURRICANE WINDS USING SYNTHETIC APERTURE RADAR Jochen Horstmann 1, Wolfgang Koch 1,DonaldR.Thompson 2, and Hans C. Graber 3 1 Institute for Coastal Research, GKSS Research Center, Geesthacht,
NONLINEAR INTERNAL WAVES IN THE SOUTH CHINA SEA
 25 th ACRS 2004 Chiang Mai, Thailand xxx NONLINEAR INTERNAL WAVES IN THE SOUTH CHINA SEA Ming-Kuang Hsu Professor, Kuang Wu Institute of Technology, Taipei, Taiwan, R.O.C. Hsumk@kwit.edu.tw Antony K. Liu
Cross-Calibrating OSCAT Land Sigma-0 to Extend the QuikSCAT Land Sigma-0 Climate Record
 Cross-Calibrating OSCAT Land Sigma-0 to Extend the QuikSCAT Land Sigma-0 Climate Record David G. Long Department of Electrical and Computer Engineering Brigham Young University May 2013 0 Scatterometer
High resolution wind retrieval for SeaWinds
 High resolution wind retrieval for SeaWinds David G. Long and Jeremy B. Luke Brigham Young University, 459 Clyde Building, Provo, UT 84602, USA ABSTRACT The SeaWinds instrument on the QuikSCAT satellite
CHANGE OF THE BRIGHTNESS TEMPERATURE IN THE MICROWAVE REGION DUE TO THE RELATIVE WIND DIRECTION
 JP4.12 CHANGE OF THE BRIGHTNESS TEMPERATURE IN THE MICROWAVE REGION DUE TO THE RELATIVE WIND DIRECTION Masanori Konda* Department of Geophysics, Graduate School of Science, Kyoto University, Japan Akira
Abstract. Lorenzzetti, J.A. (1), M. Kampel (1), C.M. Bentz (2), A.R. Torres Jr. (3)
, M. Kampel (1), C.M. Bentz (2), A.R. Torres Jr. (3)") A MESO-SCALE BRAZIL CURRENT FRONTAL EDDY: OBSERVATIONS BY ASAR, RADARSAT-1 COMPLEMENTED WITH VISIBLE AND INFRARED SENSORS, IN SITU DATA, AND NUMERICAL MODELING. Lorenzzetti, J.A. (1), M. Kampel (1), C.M.
A MESO-SCALE BRAZIL CURRENT FRONTAL EDDY: OBSERVATIONS BY ASAR, RADARSAT-1 COMPLEMENTED WITH VISIBLE AND INFRARED SENSORS, IN SITU DATA, AND NUMERICAL MODELING. Lorenzzetti, J.A. (1), M. Kampel (1), C.M.
SEA SURFACE TEMPERATURE RETRIEVAL USING TRMM MICROWAVE IMAGER SATELLITE DATA IN THE SOUTH CHINA SEA
 SEA SURFACE TEMPERATURE RETRIEVAL USING TRMM MICROWAVE IMAGER SATELLITE DATA IN THE SOUTH CHINA SEA Mohd Ibrahim Seeni Mohd and Mohd Nadzri Md. Reba Faculty of Geoinformation Science and Engineering Universiti
Observations of Oceanic Internal Waves in Bay of Bengal using Synthetic Aperture Radar
 Observations of Oceanic Internal Waves in Bay of Bengal using Synthetic Aperture Radar K.V.S.R. Prasad and M. Rajasekhar Department of Meteorology & Oceanography, Andhra University,Visakhapatnam-530 033,
THE EFFECT OF RAIN ON ASCAT OBSERVATIONS OF THE SEA SURFACE RADAR CROSS SECTION USING SIMULTANEOUS 3-D NEXRAD RAIN MEASUREMENTS
 THE EFFECT OF RAIN ON ASCAT OBSERVATIONS OF THE SEA SURFACE RADAR CROSS SECTION USING SIMULTANEOUS 3-D NERAD RAIN MEASUREMENTS David E. Weissman Hofstra University Hempstead, New York 11549 Mark A. Bourassa
Using several data sources for offshore wind resource assessment
 Author manuscript, published in ", Copenhagen : Denmark (2005)" Ben Ticha M. B., Ranchin T., Wald L., Using several data sources for offshore wind resource assessment, 2005, Using several data sources
RIVET Satellite Remote Sensing and Small Scale Wave Process Analysis
 DISTRIBUTION STATEMENT A. Approved for public release; distribution is unlimited. RIVET Satellite Remote Sensing and Small Scale Wave Process Analysis Hans C. Graber RSMAS Department of Ocean Sciences
Sentinel-1A Ocean Level-2 Products Validation Strategy
 Sentinel-1A Ocean Level-2 Products Validation Strategy Sentinel-1 Mission Performance Centre ESL L2 Team and Ocean Data Lab G.Hajduch (1), A.Mouche (2), P.Vincent (1), R.Husson (1), H.Johnsen (3), F.Collard
The Sea surface KInematics Multiscale (SKIM)
") The Sea surface KInematics Multiscale () proposal for ESA EE9 the team : https://www.facebook.com/4ee9 http://tinyurl.com/onrg http://www.umr-lops.fr/projets/projets-actifs/ 14 years of Doppler oceanography:
The Sea surface KInematics Multiscale () proposal for ESA EE9 the team : https://www.facebook.com/4ee9 http://tinyurl.com/onrg http://www.umr-lops.fr/projets/projets-actifs/ 14 years of Doppler oceanography:
SPATIAL AND TEMPORAL VARIATIONS OF INTERNAL WAVES IN THE NORTHERN SOUTH CHINA SEA
 SPATIAL AND TEMPORAL VARIATIONS OF INTERNAL WAVES IN THE NORTHERN SOUTH CHINA SEA Weigen Huang (1), Johnny Johannessen (2,3), Werner Alpers (4) Jingsong Yang (1), Xilin Gan (1) (1) Second Institute of
Lecture 13 El Niño/La Niña Ocean-Atmosphere Interaction. Idealized 3-Cell Model of Wind Patterns on a Rotating Earth. Previous Lecture!
 Lecture 13 El Niño/La Niña Ocean-Atmosphere Interaction Previous Lecture! Global Winds General Circulation of winds at the surface and aloft Polar Jet Stream Subtropical Jet Stream Monsoons 1 2 Radiation
Wind Direction Analysis over the Ocean using SAR Imagery
 Journal of Information & Computational Science 5: 1 (2008) 223-231 Available at http: www.joics.com Wind Direction Analysis over the Ocean using SAR Imagery Kaiguo Fan a,b,, Weigen Huang a, Mingxia He
ENVISAT WIND AND WAVE PRODUCTS: MONITORING, VALIDATION AND ASSIMILATION
 ENVISAT WIND AND WAVE PRODUCTS: MONITORING, VALIDATION AND ASSIMILATION Peter A.E.M. Janssen (), Saleh Abdalla (), Jean-Raymond Bidlot (3) European Centre for Medium-Range Weather Forecasts, Shinfield
An Atlas of Oceanic Internal Solitary Waves (February 2004) by Global Ocean Associates Prepared for Office of Naval Research Code 322 PO
 by Global Ocean Associates Prepared for Office of Naval Research Code 322 PO") Overview The is located in the North Atlantic Ocean between southern Ireland and southwest England (Figure 1). The Sea s western edge covers a continental shelf region characterized by rough and irregular
Overview The is located in the North Atlantic Ocean between southern Ireland and southwest England (Figure 1). The Sea s western edge covers a continental shelf region characterized by rough and irregular
Eastern Equatorial Pacific
 Overview The is the region of open ocean directly south of Mexico and Central America (between approximately 4 o to 16 o N, and 85 o to 105 o W) (Figure 1). Major bathymetric features include Guatemala
ERS WAVE MISSION REPROCESSING- QC SUPPORT ENVISAT MISSION EXTENSION SUPPORT
 REPORT 8/2011 ISBN 978-82-7492-248-8 ISSN 1890-5218 ERS WAVE MISSION REPROCESSING- QC SUPPORT ENVISAT MISSION EXTENSION SUPPORT - Annual Report 2010 Author (s): Harald Johnsen (Norut), Fabrice Collard
HIGH RESOLUTION WIND AND WAVE MEASUREMENTS FROM TerraSAR-X IN COMPARISON TO MARINE FORECAST
 SAR Maritime Applications German Aerospace Center (DLR) Remote Sensing Technology Institute Maritime Security Lab HIGH RESOLUTION WIND AND WAVE MEASUREMENTS FROM TerraSAR-X IN COMPARISON TO MARINE FORECAST
J4.2 AUTOMATED DETECTION OF GAP WIND AND OCEAN UPWELLING EVENTS IN CENTRAL AMERICAN GULF REGIONS
 J4.2 AUTOMATED DETECTION OF GAP WIND AND OCEAN UPWELLING EVENTS IN CENTRAL AMERICAN GULF REGIONS Xiang Li*, University of Alabama in Huntsville Huntsville, AL D. K. Smith Remote Sensing Systems Santa Rosa,
Synthetic aperture radar observations of sea surface signatures of atmospheric gravity waves over Southeast Asian coastal waters
 Synthetic aperture radar observations of sea surface signatures of atmospheric gravity waves over Southeast Asian coastal waters Werner Alpers Institute of Oceanography, University of Hamburg, Hamburg,
Comparison of data and model predictions of current, wave and radar cross-section modulation by seabed sand waves
 Comparison of data and model predictions of current, wave and radar cross-section modulation by seabed sand waves Cees de Valk, ARGOSS Summary SAR Imaging of seabed features Seabed Sand waves Objectives
ERS-1/2 Scatterometer new products: mission reprocessing and data quality improvement
 ERS-1/2 Scatterometer new products: mission reprocessing and data quality improvement Giovanna De Chiara (1), Raffaele Crapolicchio (1), Pascal Lecomte (2) (1) Serco SpA Via Sciadonna 22-24 Frascati (Roma),
Offshore wind mapping Mediterranean area using SAR
 Downloaded from orbit.dtu.dk on: Jan 12, 2019 Offshore wind mapping Mediterranean area using SAR Calaudi, Rosamaria; Arena, Felice; Badger, Merete; Sempreviva, Anna Maria Published in: Energy Procedia
The relevance of ocean surface current in the ECMWF analysis and forecast system. Hans Hersbach Jean-Raymond Bidlot
 The relevance of ocean surface current in the ECMWF analysis and forecast system Hans Hersbach Jean-Raymond Bidlot European Centre for Medium Range Weather Forecasts, Reading, U.K. hans.hersbach@ecmwf.int
An Atlas of Oceanic Internal Solitary Waves (May 2002) by Global Ocean Associates Prepared for the Office of Naval Research - Code 322PO
 by Global Ocean Associates Prepared for the Office of Naval Research - Code 322PO") Overview is located in the western Pacific Ocean along the west side of the Philippines (between approximately 5 o and 11 o N. latitude and 117 o and 123 o E. longitude). It is a deepwater sea, roughly
Overview is located in the western Pacific Ocean along the west side of the Philippines (between approximately 5 o and 11 o N. latitude and 117 o and 123 o E. longitude). It is a deepwater sea, roughly
SENSOR SYNERGY OF ACTIVE AND PASSIVE MICROWAVE INSTRUMENTS FOR OBSERVATIONS OF MARINE SURFACE WINDS
 SENSOR SYNERGY OF ACTIVE AND PASSIVE MICROWAVE INSTRUMENTS FOR OBSERVATIONS OF MARINE SURFACE WINDS N. Ebuchi Institute of Low Temperature Science, Hokkaido University, N19-W8, Kita-ku, Sapporo 060-0819,
Global Wind Speed Retrieval From SAR
 IEEE TRANSACTIONS ON GEOSCIENCE AND REMOTE SENSING, VOL. 41, NO. 10, OCTOBER 2003 2277 Global Wind Speed Retrieval From SAR Jochen Horstmann, Helmut Schiller, Johannes Schulz-Stellenfleth, and Susanne
Assessing the quality of Synthetic Aperture Radar (SAR) wind retrieval in coastal zones using multiple Lidars
 wind retrieval in coastal zones using multiple Lidars") Assessing the quality of Synthetic Aperture Radar (SAR) wind retrieval in coastal zones using multiple Lidars Tobias Ahsbahs Merete Badger, Ioanna Karagali, Xiaoli Larsen What is the coastal zone? Coastal
Assessing the quality of Synthetic Aperture Radar (SAR) wind retrieval in coastal zones using multiple Lidars Tobias Ahsbahs Merete Badger, Ioanna Karagali, Xiaoli Larsen What is the coastal zone? Coastal
USING SATELLITE SAR IN OFFSHORE WIND RESOURCE ASSESSMENT
 USING SATELLITE SAR IN OFFSHORE WIND RESOURCE ASSESSMENT B. R. Furevik (1), C. B. Hasager (2), M. Nielsen (2), T. Hamre (1), B. H. Jørgensen (2), O. Rathmann (2), and O. M. Johannessen (1,3) (1) Nansen
Aquarius Sca+erometer Calibra3on
 Aquarius Sca+erometer Calibra3on Fore, A., Neumann, G., Freedman, A., Chaubell, M., Tang, W., Hayashi, A., and Yueh, S. 217 California Ins3tute of Technology, Government Sponsorship acknowledged Aquarius
Sailing the Seas: Wind Driven Ocean Circulation Ocean Gyres
 Sailing the Seas: Wind Driven Ocean Circulation Ocean Gyres Ocean Currents What Happens at the Coast? Readings: Ch 9: 9.2-9.6, 9.8-9.13 Graphic: America's Cup sailboat race off Newport, Rhode Island. J.
QuikScat/Seawinds Sigma-0 Radiometric and Location Accuracy Requirements for Land/Ice Applications
 Brigham Young University Department of Electrical and Computer Engineering 459 Clyde Building Provo, Utah 84602 QuikScat/Seawinds Sigma-0 Radiometric and Location Accuracy Requirements for Land/Ice Applications
OCEAN vector winds from the SeaWinds instrument have
 IEEE GEOSCIENCE AND REMOTE SENSING LETTERS, VOL. 6, NO. 3, JULY 2009 413 Coastal Validation of Ultra-High Resolution Wind Vector Retrieval From QuikSCAT in the Gulf of Maine A. M. Plagge, Student Member,
Global Ocean Internal Wave Database
 Global Ocean Internal Wave Database Victor Klemas Graduate College of Marine Studies University of Delaware Newark, DE 19716 phone: (302) 831-8256 fax: (302) 831-6838 email: klemas@udel.edu Quanan Zheng
An Atlas of Oceanic Internal Solitary Waves (February 2004) by Global Ocean Associates Prepared for Office of Naval Research Code 322 PO
 by Global Ocean Associates Prepared for Office of Naval Research Code 322 PO") Overview covers approximately 5500 km of coast between Western Sahara (22 o N, 17 o W) and Angola (5 o S, 12 o E) (Figure 1). The continental shelf in the region varies significantly in width. The region
Overview covers approximately 5500 km of coast between Western Sahara (22 o N, 17 o W) and Angola (5 o S, 12 o E) (Figure 1). The continental shelf in the region varies significantly in width. The region
Validation of 12.5 km and Super-High Resolution (2-5 km)
") Coastal and Orographic Wind Analyses from High Resolution QuikSCAT and SeaWinds Measurements M.H. Freilich, COAS/OSU D.B. Chelton, COAS/OSU D.G. Long, BYU Clive Dorman, SIO Barry Vanhoff, COAS/OSU OVWST
Coastal and Orographic Wind Analyses from High Resolution QuikSCAT and SeaWinds Measurements M.H. Freilich, COAS/OSU D.B. Chelton, COAS/OSU D.G. Long, BYU Clive Dorman, SIO Barry Vanhoff, COAS/OSU OVWST
Plate 3. CZCS-derived chl Climatological Monthly Means
 Plate 3. CZCS-derived chl Climatological Monthly Means 15 16 2. Interannual variability The assessment of interannual variability in the 1998-2003 SeaWiFSderived data set was carried out by generating
Wind Stress Working Group 2015 IOVWST Meeting Portland, OR
 Wind Stress Working Group 2015 IOVWST Meeting Portland, OR Summary of Research Topics, Objectives and Questions James B. Edson University of Connecticut SPURS Mooring, Farrar, WHOI Background Motivation
Validation of 12.5 km Resolution Coastal Winds. Barry Vanhoff, COAS/OSU Funding by NASA/NOAA
 Validation of 12.5 km Resolution Coastal Winds Barry Vanhoff, COAS/OSU Funding by NASA/NOAA Outline Part 1: Determining empirical land mask Characterizing σ 0 near coast Part 2: Wind retrieval using new
HIGH RESOLUTION WIND RETRIEVAL FOR SEAWINDS ON QUIKSCAT. Jeremy B. Luke. A thesis submitted to the faculty of. Brigham Young University
 HIGH RESOLUTION WIND RETRIEVAL FOR SEAWINDS ON QUIKSCAT by Jeremy B. Luke A thesis submitted to the faculty of Brigham Young University in partial fulfillment of the requirements for the degree of Master
Ocean Wave Parameters Retrieval from TerraSAR-X Images Validated against Buoy Measurements and Model Results
 Remote Sens. 2015, 7, 12815-12828; doi:10.3390/rs71012815 Article OPEN ACCESS remote sensing ISSN 2072-4292 www.mdpi.com/journal/remotesensing Ocean Wave Parameters Retrieval from TerraSAR-X Images Validated
Coastal Scatterometer Winds Working Group
 Coastal Scatterometer Winds Working Group IOVWST Meeting 2015 Portland, Oregon, USA Melanie Fewings Julia Figa Saldaña Bryan Stiles Steve Morey Dmitry Dukhovskoy Larry O Neill if you want to be added to
Wave-Phase-Resolved Air-Sea Interaction
 DISTRIBUTION STATEMENT A. Approved for public release; distribution is unlimited. Wave-Phase-Resolved Air-Sea Interaction W. Kendall Melville Scripps Institution of Oceanography (SIO) UC San Diego La Jolla,
High Resolution Sea Surface Roughness and Wind Speed with Space Lidar (CALIPSO)
") High Resolution Sea Surface Roughness and Wind Speed with Space Lidar (CALIPSO) Yongxiang Hu NASA Langley Research Center Carl Weimer Ball Aerospace Corp. 1 CALIPSO Mission Overview CALIPSO seeks to improve
High Resolution Sea Surface Roughness and Wind Speed with Space Lidar (CALIPSO) Yongxiang Hu NASA Langley Research Center Carl Weimer Ball Aerospace Corp. 1 CALIPSO Mission Overview CALIPSO seeks to improve
Singularity analysis: A poweful technique for scatterometer wind data processing
 Singularity analysis: A poweful technique for scatterometer wind data processing M. Portabella (ICM-CSIC) W. Lin (ICM-CSIC) A. Stoffelen (KNMI) A. Turiel (ICM-CSIC) G. King (ICM-CSIC) A. Verhoef (KNMI)
First studies with the high-resolution coupled wave current model CWAM and other aspects of the project Sea State Monitor
 First studies with the high-resolution coupled wave current model CWAM and other aspects of the project Sea State Monitor Jens Kieser, Thomas Bruns German Meteorological Service (Deutscher Wetterdienst,
DIRECTION DEPENDENCY OF OFFSHORE TURBULENCE INTENSITY IN THE GERMAN BIGHT
 10 th Wind Energy Conference DEWEK 2010 DIRECTION DEPENDENCY OF OFFSHORE TURBULENCE INTENSITY IN THE GERMAN BIGHT Annette Westerhellweg, Beatriz Canadillas, Thomas Neumann DEWI GmbH, Wilhelmshaven, Germany,
Winds and Ocean Circulations
 Winds and Ocean Circulations AT 351 Lab 5 February 20, 2008 Sea Surface Temperatures 1 Temperature Structure of the Ocean Ocean Currents 2 What causes ocean circulation? The direction of most ocean currents
IMPROVED BAYESIAN WIND VECTOR RETRIEVAL SCHEME USING ENVISAT ASAR DATA: PRINCIPLES AND VALIDATION RESULTS
 IMPROVED BAYESIAN WIND VECTOR RETRIEVAL SCHEME USING ENVISAT ASAR DATA: PRINCIPLES AND VALIDATION RESULTS Vincent Kerbaol (1), and the SAR Ocean Wind, Waves and Currents Team (1) BOOST Technologies, 115
Yellow Sea with contributions by John R. Apel
 with contributions by John R. Apel Overview The is a shallow inland sea lying between northeastern China and the Korean Peninsula, with depths in its central north-south trough in excess of 60 to 80 m
LAMPEDUSA C B TRIPOLI
 ITALY SRR LAMPEDUSA 0 60 120 KILOMETERS MALTA SRR NATO MARITIME SURVEILLANCE AREA AS OF MARCH 23, 2011 D C B NATO MARITIME SURVEILLANCE AREA AS OF APRIL 8, 2011 A LIBYA SRR E TRIPOLI EXCERPT FROM: REPORT
Review of Equivalent Neutral Winds and Stress
 Review of Equivalent Neutral Winds and Stress Mark A. Bourassa Center for Ocean-Atmospheric Prediction Studies, Geophysical Fluid Dynamics Institute & Department of Earth, Ocean and Atmospheric Science
Surface Wave Parameters Retrieval in Coastal Seas from Spaceborne SAR Image Mode Data
 PIERS ONLINE, VOL. 4, NO. 4, 28 445 Surface Wave Parameters Retrieval in Coastal Seas from Spaceborne SAR Image Mode Data Jian Sun 1,2 and Hiroshi Kawamura 1 1 Graduate School of Science, Tohoku University,
Australian Northwest Shelf
 Overview The Australian Northwest shelf extends roughly 2000 km along the coast of Western Australia (Figure 1). The region is influenced by part of the South Equatorial Current that runs southwest out
Well, Well, Well. BACKGROUND Seasonal upwelling is a very important process in the coastal ocean of the Pacific Northwest.
 Well, Well, Well SUMMARY In this activity students investigate the relationship between winds, surface currents, sea surface temperature and upwelling and downwelling off the coast of OR and WA. Students
THE QUALITY OF THE ASCAT 12.5 KM WIND PRODUCT
 THE QUALITY OF THE ASCAT 12.5 KM WIND PRODUCT Jur Vogelzang, Ad Stoffelen, Maria Belmonte, Anton Verhoef, and Jeroen Verspeek Royal Netherlands Meteorological Institute, Wilhelminalaan 10, 3732 GK, De
ATOMOSPERIC PRESSURE, WIND & CIRCULATION
 ATOMOSPERIC PRESSURE, WIND & CIRCULATION A. INTRODUCTION Important because: pressure patterns drive wind patterns which in turn drive oceanic circulation patterns o atmospheric & oceanic circulation: major
REMOTE SENSING APPLICATION in WIND ENERGY
 REMOTE SENSING APPLICATION in WIND ENERGY Siraj Ahmed Professor & Head Department of Mechanical Engineering Maulana Azad National Iinstitute of Technology Bhopal, India sirajahmed@manit.ac.in Contents
Deborah K. Smith, Frank J. Wentz, and Carl A. Mears Remote Sensing Systems
 JP 4.9 RESULTS OF QUIKSCAT HIGH WIND DATA VALIDATION Deborah K. Smith, Frank J. Wentz, and Carl A. Mears Remote Sensing Systems ABSTRACT Traditional validation of satellite-derived winds includes comparison
HIGH RESOLUTION WIND FIELDS OVER THE BLACK SEA DERIVED FROM ENVISAT ASAR DATA USING AN ADVANCED WIND RETRIEVAL ALGORITHM
 HIGH RESOLUTION WIND FIELDS OVER THE BLACK SEA DERIVED FROM ENVISAT ASAR DATA USING AN ADVANCED WIND RETRIEVAL ALGORITHM Werner Alpers (1), Alexis Mouche (2), Andrei Yu. Ivanov (3), Burghard Brümmer (4)
The Effects of Gap Wind Induced Vorticity, the ITCZ, and Monsoon Trough on Tropical Cyclogenesis
 The Effects of Gap Wind Induced Vorticity, the ITCZ, and Monsoon Trough on Tropical Cyclogenesis Heather M. Holbach and Mark A. Bourassa Center for Ocean-Atmospheric Prediction Studies Department of Earth,
Wavelet Analysis for Wind Fields Estimation
 Sensors 2010, 10, 5994-6016; doi:10.3390/s100605994 OPEN ACCESS sensors ISSN 1424-8220 www.mdpi.com/journal/sensors Article Wavelet Analysis for Wind Fields Estimation Gladeston C. Leite 1, Daniela M.
WaMoS II Wave Monitoring System
 WaMoS II Wave Monitoring System - An application of WaMoS II at Duck - Katrin Hessner, K. Reichert, J. Dannenberg OceanWaveS GmbH, Germany Kent Hathaway, Don Resio Engineering Research Development Center
Chapter 6. Atmospheric and Oceanic. Circulations. Circulations
 Chapter 6 Atmospheric and Oceanic Circulations Robert W. Christopherson Charlie Thomsen Winds: Transfer energy and mass (1) Balance energy equatorial energy surplus and polar energy deficit (2) Generate
Section 1. Global Wind Patterns and Weather. What Do You See? Think About It. Investigate. Learning Outcomes
 Chapter 5 Winds, Oceans, Weather, and Climate Section 1 Global Wind Patterns and Weather What Do You See? Learning Outcomes In this section, you will Determine the effects of Earth s rotation and the uneven
Development of Sea Surface Temperature (SST) in the Baltic Sea 2012
 in the Baltic Sea 2012") Development of Sea Surface Temperature (SST) in the Baltic Sea 2012 Authors: Herbert Siegel and Monika Gerth, Leibniz Institute for Baltic Sea Research Warnemünde (IOW) Key message The year 2012 was characterized
Development of Sea Surface Temperature (SST) in the Baltic Sea 2012 Authors: Herbert Siegel and Monika Gerth, Leibniz Institute for Baltic Sea Research Warnemünde (IOW) Key message The year 2012 was characterized
Statistics of wind and wind power over the Mediterranean Sea
 Conférence Méditerranéenne Côtière et Maritime EDITION 2, TANGER, MAROC (2011) Coastal and Maritime Mediterranean Conference Disponible en ligne http://www.paralia.fr Available online Statistics of wind
Ocean Circulation, Food Webs and Climate What does the wind have to do with feeding fish (and feeding us)?
?") Ocean Circulation, Food Webs and Climate What does the wind have to do with feeding fish (and feeding us)? El Niño: Tropical Oceans and Global Climate Reading: 9.10-9.13, 9.15 Graphic: Upwelling off Cape
Ocean Circulation, Food Webs and Climate What does the wind have to do with feeding fish (and feeding us)? El Niño: Tropical Oceans and Global Climate Reading: 9.10-9.13, 9.15 Graphic: Upwelling off Cape
Advection of deep-sea and coastal water into the HNLC region of the northeast Pacific Ocean
 Advection of deep-sea and coastal water into the HNLC region of the northeast Pacific Ocean William Crawford, Nick Bolingbroke William Crawford, Nick Bolingbroke Inst. Ocean Sciences, Sidney, BC, Canada
MOTUS Wave Buoys. Powered By the Aanderaa MOTUS Directional Wave Sensor
 MOTUS Wave Buoys Powered By the Aanderaa MOTUS Directional Wave Sensor Two Buoys, One Brain The Aanderaa MOTUS directional wave sensor factory calibrated and currently available on two proven buoy platforms:
DANISH METEOROLOGICAL INSTITUTE
 DANISH METEOROLOGICAL INSTITUTE TECHNICAL REPORT No. 01-04 Detailed Wind Speed Information From RADARSAT ScanSAR Wide February 2001 Rasmus Tage Tonboe ISSN 0906-897X Copenhagen 2001 0 Preface This report
ADVANCES ON WIND ENERGY RESOURCE MAPPING FROM SAR
 ADVANCES ON WIND ENERGY RESOURCE MAPPING FROM SAR C.B. Hasager, M. Nielsen, M.B. Christiansen, R. Barthelmie, P. Astrup Risoe National Laboratory, Wind Energy Department, Frederiksborgvej 399, DK-4000