Noise Level Compliance Report
|
|
|
- Wilfrid Price
- 5 years ago
- Views:
Transcription

1 Noise Level Compliance Report for the Lake Winds Energy Park Spring 2017 Noise Level Measurements Mason County, Michigan September 2017 Prepared for: Mason County, Michigan Scottville, Michigan Prepared by: Hankard Environmental, Inc. Verona, Wisconsin
2 Contents Executive Summary Introduction Applicable Regulation Noise Level Measurement Methods Equipment Locations Dates Procedures Source and Atmospheric Conditions during Measurements Turbine Operations Wind Direction Atmospheric Conditions Representation of Loudest Conditions Noise Level Analysis Method Measurement and Analysis Results Location Location Location Location Conclusions Appendix A Measurement Equipment Calibration Records... A-1 LWEP Spring 2017 Noise Level Compliance Analysis September 2017 i
3 Figures Figure 1-1: General Location of the LWEP... 8 Figure 1-2: LWEP Facility Layout... 9 Figure 3-1: Typical Noise/Wind Measurement Setup Figure 3-2: Map of Measurement Location Figure 3-3: Map of Measurement Location Figure 3-4: Map of Measurement Location Figure 3-5: Map of Measurement Location Figure 3-6: Field Notes from a Night when WTG Noise was Dominant Figure 3-7: Field Notes from a Night when Non-WTG Noise was Dominant Figure 6-1: Location 1 Raw Time Series May Figure 6-2: Location 1 Time Series Without Transient Events May Figure 6-3: Location 1 Ten-Minute Spectra May Figure 6-4: Location 2 Raw Time Series May Figure 6-5: Location 2 Time Series Without Transient Events May Figure 6-6: Location 2 Ten-Minute Spectra May Figure 6-7: Location 6 Raw Time Series May Figure 6-8: Location 6 Time Series Without Transient Events May Figure 6-9: Location 6 Ten-Minute Spectra May Figure 6-10: Location 6 Raw Time Series May Figure 6-11: Location 6 Time Series Without Transient Events May Figure 6-12: Location 6 Noted Ten-Second Spectra May Figure 6-13: Location 6 Ten-Minute Spectra May Figure 6-14: Location 10 Raw Time Series May Figure 6-15: Location 10 Time Series Without Transient Events May Figure 6-16: Location 10 Ten-Minute Spectrum May Figure 6-17: Location 10 Noted Ten-Second Spectra May LWEP Spring 2017 Noise Level Compliance Analysis September 2017 ii
4 Tables Table 3-1: Distance and Direction from Measurement Locations to Nearest Turbines Table 3-2: Dates and Times of Spring 2017 Measurements Table 4-1: Turbine Operations During 2017 Measurements Table 4-2: Turbine Wind Orientation Relative to Measurement Location Table 4-3: Measurements Representative of Loudest Conditions Table 6-1: Location 1 Measured & WTG Noise Levels May Table 6-2: Location 2 Measured Noise Levels May Table 6-3: Location 6 Measured & WTG Noise Levels May Table 6-4: Location 10 Measured Noise Level May LWEP Spring 2017 Noise Level Compliance Analysis September 2017 iii
5 Executive Summary Hankard Environmental conducted noise level measurements at the Lake Winds Energy Park (LWEP) in Mason County, Michigan in the spring of The measurements were conducted at the request of Mason County, and followed the procedures laid out in the April 2015 Mitigation Plan Sound Testing Protocol and the acoustical standards referenced therein, the December 2015 Consent Judgement, and the January 2017 First Amendment to Consent Judgement. The purpose of the measurements was to determine whether noise emissions from the LWEP comply with Section a of the Mason County Zoning Ordinance, which states that noise from a wind energy facility cannot exceed 45 dba at the property line of an unpooled parcel on which there is an occupied building or dwelling. Measurements were conducted at four locations: two from the 2016 measurement campaign (Locations 2 and 10), and two new locations (Locations 1 and 6). Noise levels were measured during two different multi-day surveys: one three-day survey in April 2017 and one five-day survey in May Per the January 2017 First Amendment to the Consent Judgement, testing at all locations was to be conducted with all turbines at the LWEP operating at full electrical power under unmitigated conditions. For the purposes of this 2017 analysis, turbines operating in normal mode (NRO 0) were considered to be at full electrical power when their output was 90% or more of rated power (1,815 kw). Unfortunately, a review of power output versus wind speed data by Hankard Environmental found that many turbines were operated in reduced power mode during the April 2017 measurements. Many of the turbines closest to the measurement locations were programmed to reach a maximum power output of approximately 85% of full capacity. Thus, all of the April measurement data is invalid for the purposes of this analysis. Furthermore, repairs, programming changes, and validation of full operations were not fully completed until approximately May 10 th. Thus, no valid measurement could be obtained until at least that date. Once Hankard Environmental received word on May 10 th that turbines were back at 100%, we began to watch the weather forecast, and not until May 16 th were the winds forecast to be sufficient for measurements. Typically, measurements on this project are conducted from mid to late March until late May. Thus, most of the Spring 2017 measurement season was unavailable to us due to the turbine malfunctions. Even after all repairs were made, one turbine was still operating in reduced mode. However, this turbine is the fourth-closest to one of the measurement locations and did not have a significant acoustical affect, and data from that site in May 2017 is considered valid. The Mason County noise limit applies only to noise generated by the wind turbine generators (WTGs). However, microphones placed outside measure all noise that is present in the environment, including that from the WTGs and that from non-wtg sources such as traffic, aircraft, farming activities, homeowner activities, dogs, birds/insects/amphibians, and wind blowing across the microphone and through nearby vegetation. To separate WTG from non-wtg noise, the measured data was analyzed in accordance with the LWEP Mitigation Plan Sound Testing Protocol, applicable portions of American National Standards Institute (ANSI) S12.9 Part 3 and ANSI S12.18, as well as methods developed by Hankard Environmental based on our experience with previous WTG field measurement surveys. The following paragraphs summarize, for each measurement location, the levels of WTG-only noise measured, whether the measured levels meet the Mason County limit, and whether the LWEP Spring 2017 Noise Level Compliance Analysis September
6 measured data set is sufficient to confidently conclude that maximum WTG noise levels were captured and compliance has been adequately demonstrated. Our conclusions regarding the latter are based primarily on the provisions of ANSI S This is prudent, as the Consent Judgement states that testing shall be conducted in accordance with the mitigation plan and incorporated protocols, which refers to the Mitigation Plan Sound Testing Protocol. The Sound Testing Protocol states that testing will follow the procedures of ANSI Standard S12.9/Part 3... and ANSI S ANSI S12.9 primarily covers the procedures for measuring noise levels and analyzing the resulting data to determine WTG-only noise levels. The purpose of ANSI S12.18 is to specify procedures for measuring and reporting sound pressure levels from specific sources outdoors and to specify a set of reproducible atmospheric conditions to obtain reproducible measurements. The Applications section of ANSI S12.18 says A major application of this standard is obtaining reproducible sound pressure levels from the same source at the same microphone location on different days. Section 7.4 of S12.18 states that repeated measurements at a receiver position are required to assess the repeatability of the measurement results and A minimum of three repetitions under equivalent conditions is recommended." Given that the noise level data measured for this study will be used to demonstrate that maximum WTG-only noise levels are consistently in compliance with Mason County Standards, not just during the measurements but for all time going forward, the data set needs to be robust. This is further mandated by the complexities of WTG noise emissions (changing source strength, multiple large noise sources located high in the air, and sources located in many different directions from receptor locations), and the complexities of the propagation of WTG noise through the atmosphere (varying atmospheric conditions including stability, wind direction, and wind speed). In our professional opinion, for a given set of data to be used to confidently conclude that maximum WTG-only noise levels have been captured, and that the levels are reasonably representative of the maximum levels that regularly occur at a site, even a conservative reading of ANSI S12.18 would require the following: 1. The source should be at full power. This is defined on this project as the nearest turbine(s) at 90% of full electric power or greater on a 10-minute average basis. Clearly, the closest turbine must be at full power. In most cases, the second-closest turbine has a measurable effect on the total WTG-only noise, so it should also be at full power. Having additional nearby turbines at full power only increases the quality of the data. 2. The atmospheric conditions should include, at a minimum, the wind direction, wind speed, and temperature inversion parameters defined by ANSI S It is also known that noise propagates more efficiently in a stable atmosphere, thus this condition increases the quality of the data. 3. The quantity of data needed depends on both the quality of the data and how close the measured levels are to the limit. The standard is clear in that a minimum of three repetitions under equivalent conditions is recommended." Thus, three 10-minute periods of valid data should be the minimum requirement. To determine if the data satisfies the LWEP Spring 2017 Noise Level Compliance Analysis September
7 standard s call for the measured noise levels to be representative of maximum WTG noise levels on different days, the data should either (1) be actually conducted on different days (nights) and show similar, reproducible results, or (2) be of a quantity and quality on one day (night) such that reproducibility is well demonstrated. For example, a significant quantity (at least twice the minimum of 3 periods to represent two nights) of high quality data (four closest turbines at full power and a stable atmosphere) could be used to confidently claim compliance. Also of importance is how close the results are to the limit. Results that are within 1 db of the limit should receive more scrutiny than those that are 2 to 3 db below the limit. It is within this framework that the following conclusions are made regarding the 2017 noise level measurement data, and the confidence with which it can be used to demonstrate compliance with the Mason County noise level standard. Location 1 The noise level data collected on the night of May 16-17, 2017 are representative of loudest WTG conditions. The wind direction was from the south, placing T-23, T-20, and T-24 upwind of the measurement location and T-10 downwind. There were minute periods during which the closest turbine (T-23) was operating at full power. Of these, there were 9 periods during which the closest 2 turbines were at full power, and 6 periods during which all four closest turbines were at full power. The total measured noise level (10-minute L eqs, dba), including noise from both turbine and non-turbine sources, ranges from 42.8 to 43.2 dba. A shutdown of the nearby turbines was conducted, and the measured ambient noise level was 35.6 dba. The resulting WTGonly noise levels range from 42.2 to 42.5 dba (10-minute L eqs ), all of which comply with the 45 dba standard. Data collected on the other two nights of measurements in 2017 were not valid due to nearby turbines being operated in reduced-power mode. The measured WTG-only one-third octave band frequency spectra show only a weak resemblance to the characteristic shape of WTG-only noise that has previously been identified at the LWEP. As described in the Noise Level Compliance Report for the Lake Winds Energy Park Spring 2016 Noise Level Measurements (Figure 7-5 therein), WTG-only spectra contain low frequency noise levels below 60 db, a dip in the 125 to 200 Hz region, a peak at 315 Hz, and a steady drop off in noise levels above this peak (approximately 9 db per octave). The somewhat weak resemblance of the Location 1 spectra to this shape are due to the relatively low WTG noise levels (because of the greater distance to the nearest turbines relative to other locations) and the presence of some background noise (mainly ground wind) remaining in the WTG-only levels even after processing. The data collected at Location 1 in 2017 are sufficient to confidently demonstrate compliance with the Mason County standard. While only consisting of one night, the data are of high quality (four closest turbines at full power, stable atmosphere), the atmospheric conditions were within ANSI S12.18 parameters, three times the minimum number of data points were collected, and the resulting levels are more than 2 db below the standard. Thus, compliance is considered demonstrated, and no further testing is recommended. LWEP Spring 2017 Noise Level Compliance Analysis September
8 Location 2 The noise level data measured on the night of May 17-18, 2017 are representative of loudest WTG noise conditions. The wind direction was from the south-southwest, placing T-6 and T-4 downwind of the measurement location, and T-15 and T-18 upwind. After a storm passed through, measurement conditions were excellent for the direct measurement of WTG-only noise levels due to the significant decrease in ground-level wind speeds. There were three 10-minute periods when the nearest turbine (T-6) was operating at full electrical power. During one of these periods, three of the four closest turbines were at full power, and the third-closest was at 88%. The measured 10-minute noise levels range from 43.8 to 44.3 dba, all of which comply with the 45 dba standard. No shutdown was conducted due to the compliance of the directly measured noise levels, and because of the warm temperature it would have taken about two hours for the turbine cooling fans to completely shut off, at which point the sun would be rising and traffic would increase, thus significantly changing conditions. As expected, even the directly measured one-third octave band spectra for the three full-power 10-minute periods show the characteristic shape of WTG-only noise. Data collected on two other nights in 2017 were not valid due to nearby turbines being operated in reduced-power mode (April) or insufficient wind for full power operation (May). The data collected at Location 2 on May 17-18, 2017 provide one night of valid data. However, in our opinion it cannot be used alone to confidently conclude that noise levels are in compliance with the Mason County standard. This is because the nearest turbine was at full power for only the minimum three periods, let alone twice that many. During only one of these periods were the nearest two turbines at full power. In our opinion, this does not satisfy ANSI S12.18 as described above. Furthermore, the data collected at Location 2 in 2016 was insufficient to assess compliance. Location 6 The noise level data collected on the night of May 16-17, 2017 are representative of loudest WTG noise conditions. The wind direction was from the south, placing all four closest turbines (T-28, T-34, T-39, and T-38) upwind of the measurement location. There were eight 10-minute periods during which the closest turbine (T-24) was operating at full power, of which six periods had the closest 3 turbines at full power. The fourth-closest turbine (T-38) never reached full power, as it was apparently being operated in a reduced-noise mode. This is not significant due to the relative distance of this and the other 3 turbines. Thus, the resulting measurements contain 8 10-minute periods that are valid for demonstrating compliance at Location 6. During this night, total levels were in the 45 to 46 dba range, and field personnel noted the influence of frogs and wind on the measured levels. Because of this, all turbines within approximately 8,000 feet of Location 6 were shut down to obtain an ambient noise level. The two 10-minute periods toward the end of the shutdown were representative of ambient conditions, as this was when the turbine cooling fans finally became inaudible. The wind speeds during the turbine-on periods were within 1.5 m/s of the values during the ambient periods, which is in accordance with the Mitigation Plan Sound Testing Protocol. The ambient noise levels were subtracted from the total measured noise levels in accordance with ANSI S12.9. The resulting WTG-only noise levels range from 43.7 to 44.1 dba, all of which comply with the Mason County standard. The spectra resemble the characteristic shape of WTG-only LWEP Spring 2017 Noise Level Compliance Analysis September
9 noise that has been previously identified at the LWEP. At this site, this includes a dip around 200 Hz and a peak at 315 Hz. The slope above the peak was not as steep in this case due to the significant amount of frog noise at 1 khz and 2 khz. The data collected at Location 6 in 2017 provide one night of valid data. However, in our opinion it cannot be used alone to confidently conclude that noise levels are in compliance with the Mason County standard. This is primarily because the measured WTG-only noise level is within 1 db of the standard. In addition, the six valid periods of data represent the minimum number of samples, but over the same night instead of two different nights. Finally, the fourth-closest turbine was in reduced-power mode. Location 10 The noise level data collected on the night of May 19-20, 2017 are representative of loudest WTG noise conditions. The wind direction was from the east-northeast, placing the nearest turbine (T- 47) in a downwind/crosswind position, T-46 upwind, T-49 crosswind, and T-50 downwind of the measurement location. The two closest turbines (T-47 and T-46) reached full power during one 10-minute period. During that period, T-49 was at 74% power and T-50 was at 82% power. The measured total noise level during this period was 44.8 dba, which complies with the Mason County standard. The spectrum for this period shows only a weak resemblance to a WTG-only spectrum, with the 200 Hz dip and the 315 Hz peak mostly obscured by wind noise. Therefore, this level of 44.8 dba certainly contains some background noise, and the WTG-only level is certainly lower. The data collected at Location 10 in 2017 provide one 10-minute period of valid data. Noise levels were collected on other nights in 2017 at Location 10, but the nearest turbines were not operating at full power during any of those periods. In 2016, valid noise levels were collected for two 10- minute periods on one night and one 10-minute period on another night. During these three 10- minute periods in 2016, the nearest turbine operated at full power, but operations of the other nearby three turbines ranged from 50 to 80%. At no time did the nearest two turbines operate at full power. Thus, even taken collectively, the valid 2016 and 2017 data at Location 10 only provide one night of data that satisfy ANSI S Additionally, the WTG-only noise levels are within 1 db of the standard. Future Testing Recommendations At this point in the noise testing process, a sufficient number of valid test samples have been obtained on a sufficient number of nights to confidently conclude that maximum WTG-only noise levels are in compliance with the Mason County standard at Location 5 (from 2016) and Location 1 (2017). Valid WTG-only noise levels have been obtained on one night at each of Locations 2, 6, and 10, and all measured levels comply with the Mason County standard. In our opinion, one additional night of valid data should be obtained at each of these three locations in order to confidently conclude that WTG-only noise levels are in compliance with the Mason County standard. LWEP Spring 2017 Noise Level Compliance Analysis September
10 1. Introduction The Lake Winds Energy Park (LWEP) is a 100 megawatt (MW) utility-grade wind energy system consisting of 56 Vestas V MW wind turbine generators (WTG) located in the Riverton and Summit Townships of Mason County, Michigan. The general location of the facility is shown in Figure 1-1, and the layout of the facility is shown in Figure 1-2. The LWEP was constructed in 2011 and 2012, and began commercial operation in November Noise emissions from the LWEP must meet the sound level limits of the Mason County Zoning Ordinance 1. Postconstruction sound studies were completed by other acoustical consultants in 2013, 2014, and Court proceedings arose from those test results. Subsequent to the initiation of legal action, a Mitigation Plan Sound Testing Protocol 2 was agreed to by the parties. In 2015, testing according to this protocol confirmed that the noise mitigation measures (Noise Reduced Operation (NRO) Mode 2) in place at four of the eight original testing locations were both necessary and sufficient to maintain compliance. Pursuant to the December 2015 Consent Judgement 3, turbines near one of the eight original testing locations (Location 7) is to remain in NRO Mode 2 for the remainder of LWEP operations. After three rounds of testing at another of the locations (Location 5), there was still no viable data for the Mason County Planning Commission (the Commission) to form a conclusion on compliance. Through the terms of the December 2015 Consent Judgement, the Commission selected Hankard Environmental, Inc. as a new third-party acoustical consultant. Hankard Environmental is a Wisconsin-based acoustical consulting firm with significant wind energy facility noise measurement and analysis experience. The Commission requested that Hankard Environmental conduct a new post-construction sound survey per the Consent Judgement and the April 2015 revision 4 to the Mitigation Plan Sound Testing Protocol. Hankard Environmental conducted testing at four locations around the LWEP in the spring of Testing was conducted during three four-day surveys: one in each of March, April, and May These surveys and their results are outlined in Hankard Environmental s Noise Level Compliance Report for the Lake Winds Energy Park Spring 2016 Noise Level Measurements 5, which was submitted to Mason County in August Mason County, Michigan. Mason County Zoning Ordinance, Section Utility Grid Wind Energy Systems, Subsection 17.a Sound Level Limits. 2 Appendix 2 of April 18, 2014 memorandum from Consumers Energy to Mason County. 3 Consent Judgment. Consumers Energy Company v. Mason County. 51 st Circuit Court for the County of Mason, Case No AA. Entered December 18, Appendix 2 of May 8, 2015 memorandum from Consumers Energy to Mason County. 5 Hankard Environmental, Inc. Noise Level Compliance Report for the Lake Winds Energy Park Spring 2016 Noise Level Measurements. August LWEP Spring 2017 Noise Level Compliance Analysis September
11 Pursuant to the January 2017 First Amendment to the Consent Judgement 6 and the March 2017 update to the Mitigation Plan Sound Testing Protocol 7, Hankard Environmental conducted further testing at four locations at the LWEP in the spring of Testing was conducted during two multi-day surveys: one in April and one in May. This report describes the Mason County noise standard, the layout of the LWEP and the locations where noise levels were measured in 2017, the noise level measurement methods and data analysis methods, the resulting noise levels, and conclusions regarding the sufficiency of the measured data to confidently conclude whether the LWEP WTG-only noise levels comply with the sound level limits of the Mason County Zoning Ordinance. The latter takes into account the noise levels measured in 2016 as well. 6 First Amendment to Consent Judgment. Consumers Energy Company v. Mason County. 51st Circuit Court for the County of Mason, Case No AA. Entered January 10, Appendix 2 of March 3, 2017 memorandum from Consumers Energy to Mason County. LWEP Spring 2017 Noise Level Compliance Analysis September

12 Figure 1-1: General Location of the LWEP LWEP Spring 2017 Noise Level Compliance Analysis September


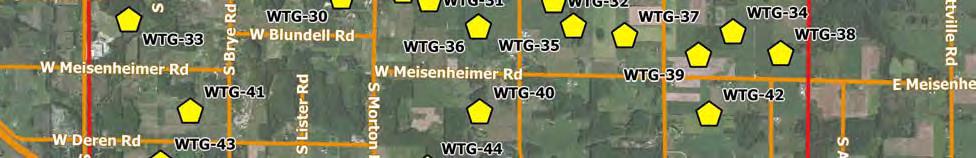

13 Figure 1-2: LWEP Facility Layout LWEP Spring 2017 Noise Level Compliance Analysis September
14 2. Applicable Regulation Noise emissions from the LWEP must adhere to the sound level limits contained within the Mason County Zoning Ordinance, Section 17.70, Subsection 17.a. The pertinent portion of this ordinance is provided below. 17. Noise levels. a. Sound Level Limits. 1. The A-weighted equivalent sound level (LA eq ) measured at the property line of an unpooled (single) parcel (as defined in subsection 19 hereof) upon which there is an occupied building or dwelling shall not exceed 45 dba. If the unpooled parcel does not have an occupied principal building or dwelling on it, then the 45 dba sound limit may be exceeded at the property line; provided that when an occupied principal building or dwelling is built on such unpooled parcel after the special land use permit has been issued, the sound level shall not exceed 45 dba measured at the nearest wall of the occupied building or dwelling located on the unpooled parcel and in compliance with the minimum required front, side and rear yard setbacks then in effect within the zoning district in which the occupied building or dwelling is located. 2. On a pooled parcel, the ten-minute LA eq sound level measured at the wall of an occupied building nearest to the wind turbine or turbines shall not exceed 55 dba. 3. These sound level limits are to be evaluated using the A-weighted equivalent sound level (LA eq ) descriptor. The LA eq should be measured using a ten-minute time interval. 4. The sound level limits listed above apply to the contribution from the wind energy system only and do not include contributions from background ambient sounds. LWEP Spring 2017 Noise Level Compliance Analysis September
15 3. Noise Level Measurement Methods 3.1 Equipment All noise measurement equipment used on this project meets the Type 1 requirements of American National Standards Institute (ANSI) standard S Noise levels were measured using Larson Davis Model 831 sound level meters, associated pre-amplifiers, and ½-inch-diameter freefield precision microphones. All noise measurement and field calibration equipment was certified by a traceable laboratory within the past year. (Calibration certificates can be found in Appendix A). In addition, field calibrations were conducted before and after each measurement. The drift in the measured noise level was minimal (±0.2 db over the entire measurement survey) and within acceptable limits defined by ANSI standards. The microphones were mounted on tripods and positioned approximately 1.5 meters above the ground (per ANSI standard S ). The microphones were covered with hydrophobically treated seven-inch diameter, 80 pores per inch density windscreens (ACO-Pacific WS7-80T). All electronic equipment was contained in weatherproof cases and was powered by batteries. At each measurement location, ground wind speed and direction were measured using a Vaisala WXT532 ultrasonic anemometer mounted on a tripod approximately 2 meters above the ground (per ANSI standard S ), and placed within approximately 3 meters of the microphone. Figure 3-1 shows a typical noise/wind measurement configuration. The sound level meters were time-synchronized with the LWEP control system to within approximately 1 second to allow for the integration of noise and ground wind data with WTG operations data. The sound level meters were configured to continuously measure and record 10- second averages of the following metrics: overall L eq, L 10, L 50, and L 90, as well as the one-third octave band L eq levels (6.3 Hz to 10 khz). The meters also logged ground wind speed and direction every 10 seconds. 8 ANSI. American National Standard Specification for Sound Level Meters. Standard ANSI S (R2006). 9 ANSI. Quantities and Procedures for Description and Measurement of Environmental Sound Part 3: Short term Measurements with an Observer Present. Standard ANSI/ASA S /Part 3. Available at webstore.ansi.org. 10 ANSI. Outdoor Measurement of Sound Pressure Level. Standard ANSI/ASA S (R2009). LWEP Spring 2017 Noise Level Compliance Analysis September
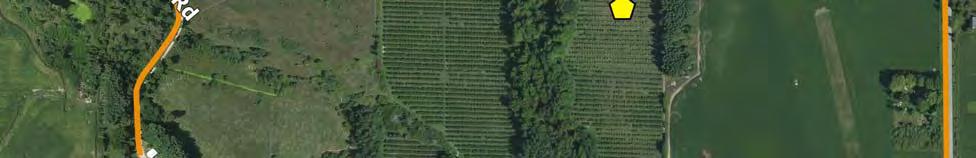
16 3.2 Locations Figure 3-1: Typical Noise/Wind Measurement Setup As mandated by the Mitigation Plan Sound Testing Protocol, the Consent Judgement, and the First Amendment to the Consent Judgment, measurements were conducted at four sites: Locations 1, 2, 6, and 10. Figures 3-2 through 3-5 each show a map of one measurement location. Table 3-1 lists, for each measurement location, the distance and direction to the nearest four turbines. (The directions listed are from the measurement location to the turbine.) Table 3-1: Distance and Direction from Measurement Locations to Nearest Turbines Meas Nearest Turbine 2 nd Nearest 3 rd Nearest 4 th Nearest Loc ID Dist (ft) Dir (deg) ID Dist (ft) Dir (deg) ID Dist (ft) Dir (deg) ID Dist (ft) Dir (deg) 1 T-23 1, T-20 1, T-10 2, T-24 2, T-6 1, T-15 1, T-4 2,040 0 T-18 2, T-28 1, T-34 2, T-39 3, T-38 4, T-47 1, T-46 1, T-49 1, T-50 2, LWEP Spring 2017 Noise Level Compliance Analysis September

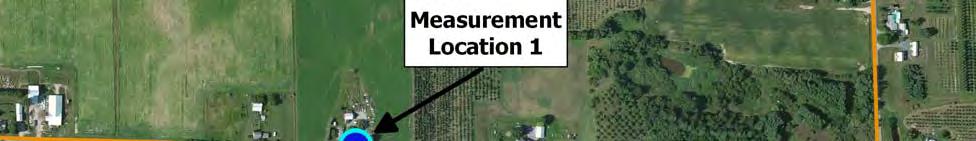
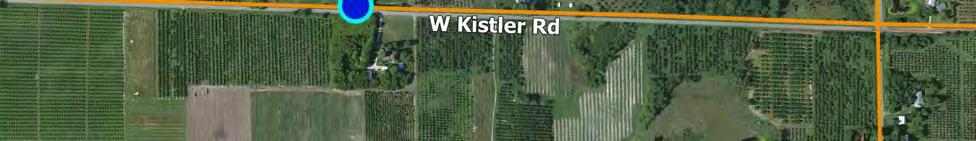
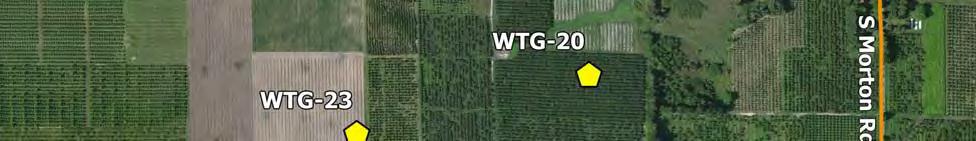
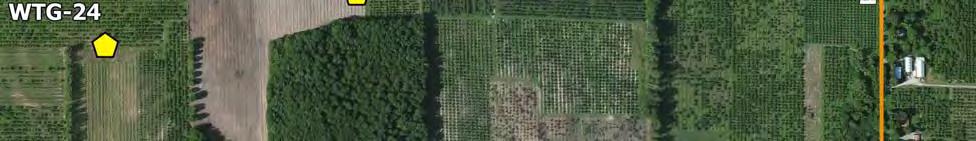
17 Figure 3-2: Map of Measurement Location 1 LWEP Spring 2017 Noise Level Compliance Analysis September

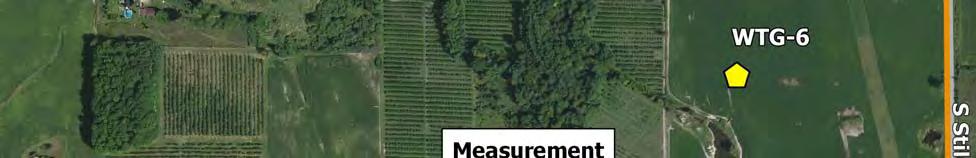
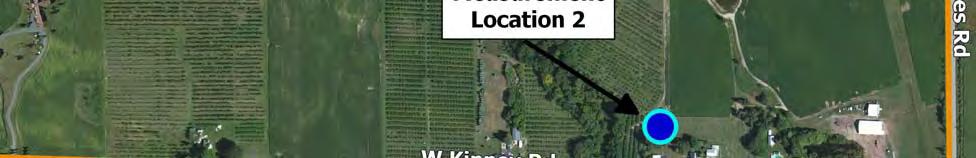
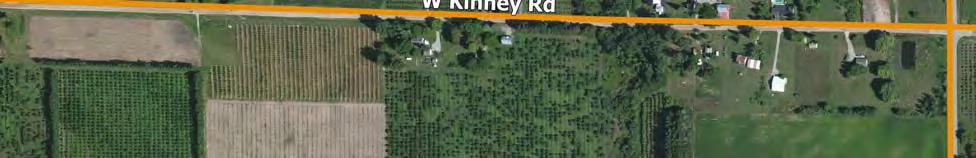
18 Figure 3-3: Map of Measurement Location 2 LWEP Spring 2017 Noise Level Compliance Analysis September


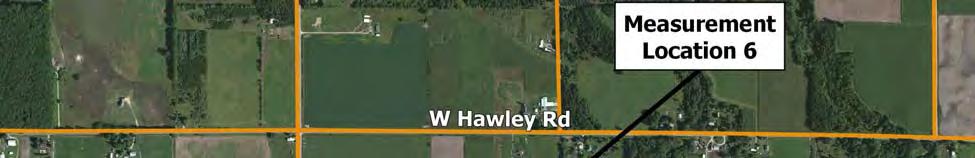
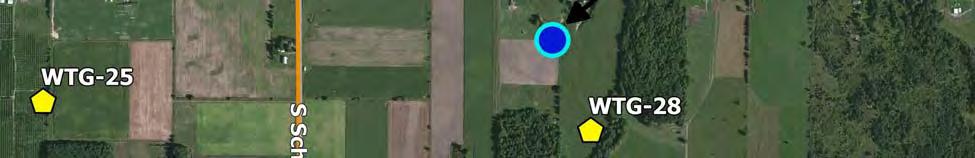
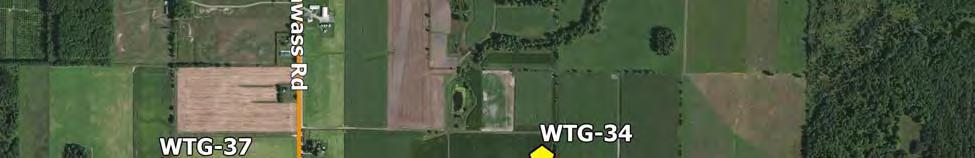
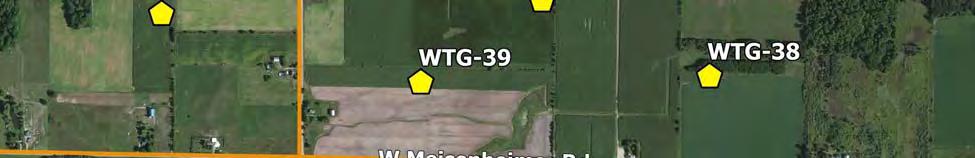
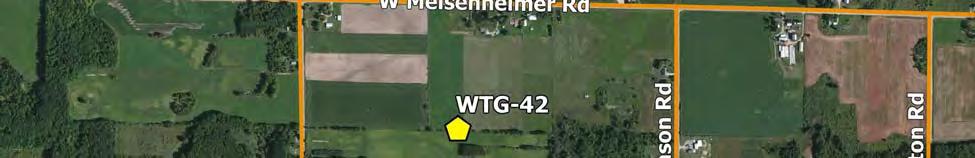
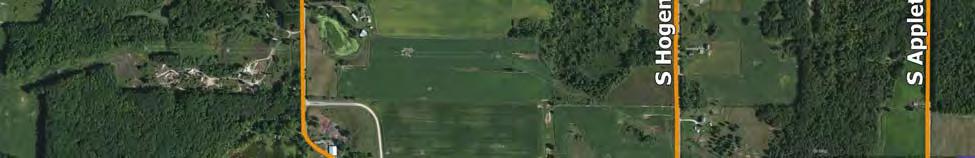
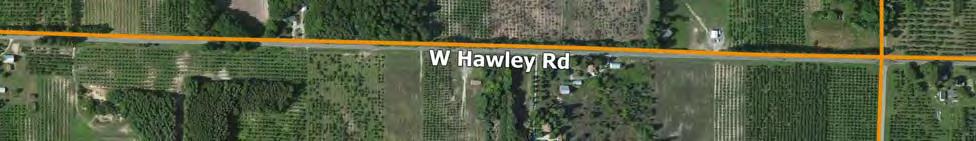
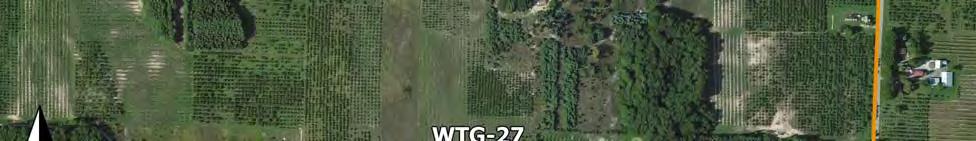
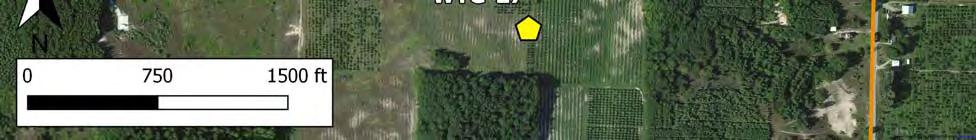
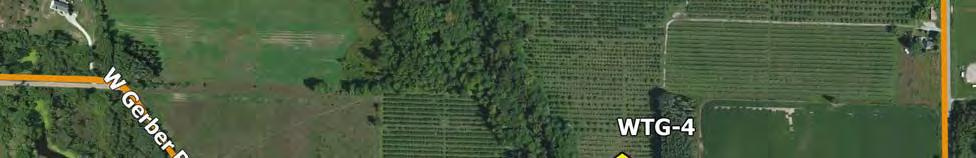
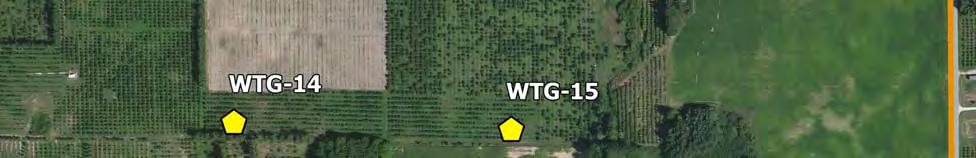
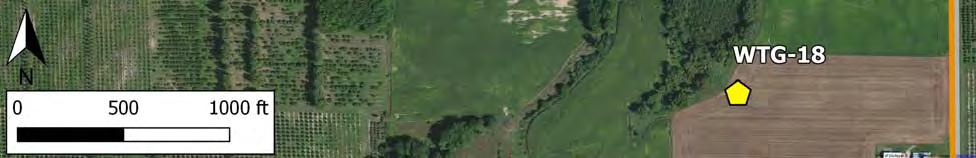
19 Figure 3-4: Map of Measurement Location 6 LWEP Spring 2017 Noise Level Compliance Analysis September

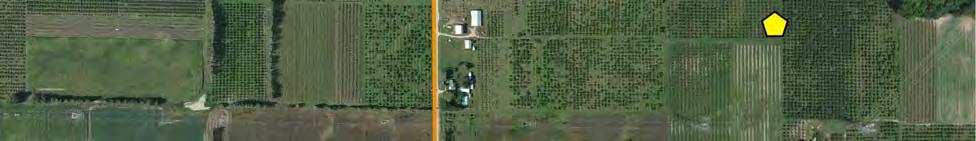
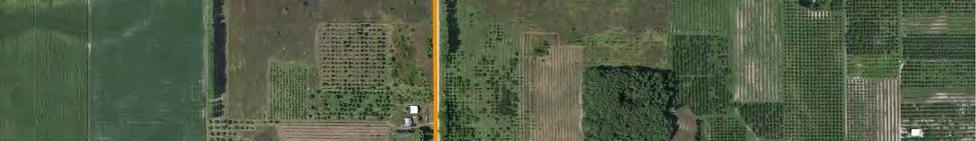
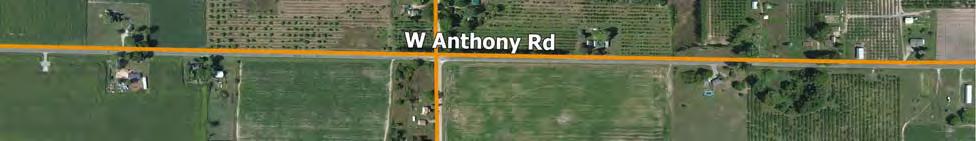
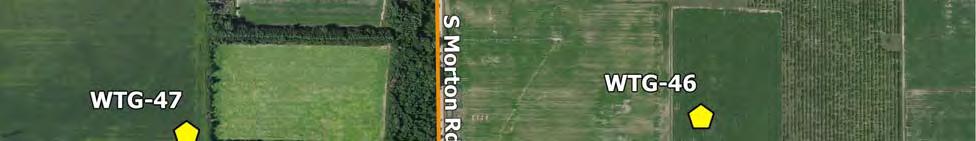
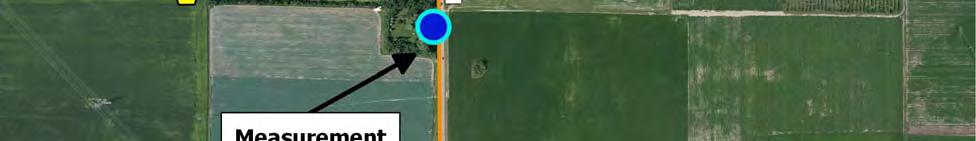
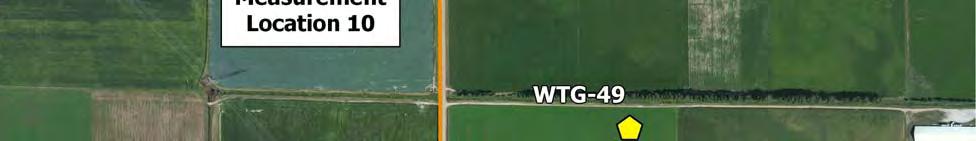
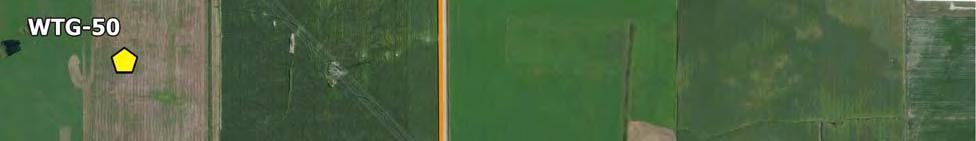
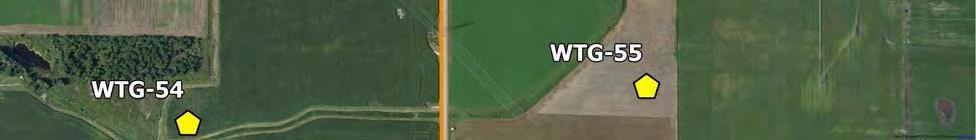
20 Figure 3-5: Map of Measurement Location 10 LWEP Spring 2017 Noise Level Compliance Analysis September
21 3.3 Dates Noise levels were measured during two multi-day surveys in April and May of After contracting was complete in mid-february, staff monitored the weather forecast for the area on a daily basis. The first survey was scheduled as soon as sufficient nighttime hub-height wind speeds were forecast. Once on-site, measurements were conducted each night unless the wind turbines were not operating at sufficient power and not forecast to do so, or during rain or storms. Staff stayed on-site for four to six nights, and only left when the forecast called for prolonged periods (i.e. days) of insufficient hub-height wind speeds or inclement weather. This process was planned to continue until three surveys had been completed, or until the beginning of June, at which time weather and other environmental conditions have historically been less conducive to measuring turbine noise. Table 3-2 lists the dates and times when measurements were conducted. Although the LWEP is in the Eastern time zone, the turbine control system is on Central time, thus all dates and times in this report are given in Central Daylight Time (CDT) to synchronize with the control system. Table 3-2: Dates and Times of Spring 2017 Measurements Date Location Start Time End Time Start Time End Time Location (CDT) (CDT) (CDT) (CDT) April :30 4: :50 3:40 April :00 1: :50 1:10 April :30 17: :30 17:10 May :40 3: :00 3:00 May :50 4: :10 4:00 May :20 0: May :10 4: May :10 23: Procedures The measurement and analysis procedures followed the applicable portions of ANSI S12.9 Part 3 (2013) Quantities and Procedures for Description and Measurement of Environmental Sound: Short-Term Measurements with an Observer Present, and ANSI S (R2009) Outdoor Measurement of Sound Pressure Level. Noise levels were measured at two locations on any given night, except on nights when forecast turbine operations and wind direction indicated that only one location had a chance of producing valid measurements. The selection of which locations to measure on any given night was made by Hankard Environmental on the day of the measurement, and was based primarily on wind direction and forecast wind speed at a height of 100 meters. (In general, the loudest WTG noise levels are measured when the closest turbines are situated upwind of the measurement location and the hub-height wind speed is approximately 10 m/s.) Once measurement locations for the day were chosen, wind conditions were monitored and field staff deployed to the locations as soon as turbine operations exceeded approximately 50% of capacity. The measurement equipment was set up, which generally takes about 15 minutes, and left to run continuously as described in Section 3.1 above. LWEP Spring 2017 Noise Level Compliance Analysis September
22 Next, field staff began noting the audibility of turbine noise and flagging the times when non- WTG noise sources were present, including but not limited to traffic, aircraft overflights, wind blowing through nearby vegetation, insects/birds/frogs, and barking dogs. Based on our experience with previous wind turbine noise measurement projects, the type of notes that prove most useful in the subsequent data analysis depends on the onsite conditions. On nights when ground winds are calm (less than about 1 to 2 m/s) and non-wtg noise sources are present infrequently, one only needs to note the approximate times when non-wtg noise is audible. After a review of the resulting noise level time history and frequency spectra to remove any non-wtg event noise, the remaining dataset consists of primarily WTG-only noise. Figure 3-6 shows an example field measurement form from such a night. The more challenging situation is a night when ground wind speeds are moderate (about 2 to 5 m/s) on a continuous basis, and/or consistent non-wtg noise (particularly traffic) is present. In this case, the objective of the field notes is to identify those periods when WTG noise is most prominent. For example, 10-second intervals are noted when there was a lull in ground wind or when no traffic was audible. Intervals when wind or traffic is particularly audible are also noted. In the subsequent analysis of the data, frequency spectra from these 10-second intervals are compared to determine which times are and are not related to WTG operations. Figure 3-7 shows an example field form from such a night. Turbine shutdowns were conducted in order to measure the ambient (non-wtg) noise levels. If the non-turbine conditions (wind, local activity, insect/bird/frog noise) during the shutdown are comparable to the conditions while the turbines are at full power, the ambient noise level can be logarithmically subtracted from the full-power turbine-on level to determine the WTG-only level. After the first week of testing in March 2016, Hankard Environmental concluded that shutting down the turbines every other hour (as outlined in the Mitigation Plan Sound Testing Protocol) is only necessary if during any given measurement it is the opinion of field personnel that the WTG-only noise level is approaching or greater than the 45 dba limit. This determination comes from our intent watching of the instantaneous noise level (L eq, fast, dba), listening to the acoustic environment, and monitoring of the L eq calculated over the 31 to 1,000 Hz octave bands only. Until the WTG-only noise level regularly exceeds about 44 dba, it is preferable to keep the turbines running. This maximizes the amount of time spent measuring turbine on conditions, which maximizes the chance that the loudest turbine conditions will be captured. This is particularly important for establishing the repeatability of the turbine-on levels. In addition, it takes time for the turbines to fully shut down. Once the shutdown signal is sent to a turbine, the blades stop rotating within minutes. However, the cooling fans continue to run until the internal nacelle temperature reaches a fixed setpoint. Depending on the outside temperature, this can take from 45 minutes to over 2 hours. An accurate turbine off measurement cannot be made until the fans are inaudible. During the intervening time, it is possible for the local conditions and ground winds to change dramatically, making the turbine off measurement not comparable to the turbine on measurement. LWEP Spring 2017 Noise Level Compliance Analysis September


23 Figure 3-6: Field Notes from a Night when WTG Noise was Dominant LWEP Spring 2017 Noise Level Compliance Analysis September


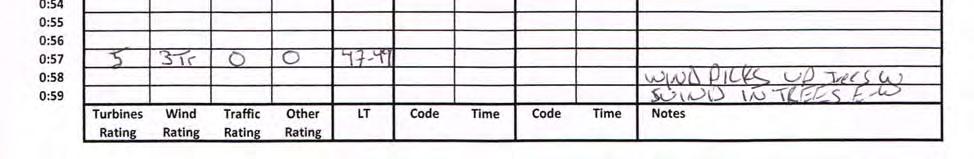
24 Figure 3-7: Field Notes from a Night when Non-WTG Noise was Dominant LWEP Spring 2017 Noise Level Compliance Analysis September
25 4. Source and Atmospheric Conditions during Measurements The goal of this study is to determine if noise levels from the WTGs are in compliance with the Mason County Zoning Ordinance, which states that WTG noise levels shall not exceed 45 dba at an unpooled parcel. If a small number of noise samples are used to demonstrate compliance for all time, the measurements must capture conditions that produce the loudest WTG noise levels at residences. Loudest conditions are present when (1) nearby WTG operations are at or near full capacity, (2) the measurement locations are downwind from the noise sources, and (3) atmospheric conditions are conducive to efficient propagation of sound from the turbines to the measurement locations. The following sections describe the extent to which each of these conditions was present during the spring 2017 measurements, and Section 4.4 outlines which measurements represent the loudest conditions for each site. 4.1 Turbine Operations The Vestas V turbines reach their maximum acoustical output when hub-height wind speeds are approximately 10 m/s, at which point the turbine rotor reaches its maximum rotational speed. Winds speeds in excess of this create more electrical power, but do not create additional acoustic output because the blades do not rotate any faster. For the purposes of this analysis, maximum turbine operation is defined by the Mitigation Plan Sound Testing Protocol, which states Full electrical power shall be defined as the nearest mitigated turbine(s) to a test location producing at least 80% of rated electric power in the applicable Mode 2, or 90% for the nearest turbine operating in NRO Mode 0 (test site 5 only). If testing under full electrical power, and suitable weather/ambient sound conditions, is not achieved in six nights, the testing shall be extended. Given that all turbines are to be running in normal mode for the spring 2017 testing, it is the 90% threshold that applies. Table 4-1 lists, for each location and measurement day, the number of 10-minute intervals during which there was full electrical power production ( 90%) at the four nearest turbines. 4.2 Wind Direction In general, outdoor noise levels are louder downwind of a source than they are upwind or at some intermediate angle. In the case of wind farms, this is not straightforward because the noise sources (nearby turbines) are distributed around and in many different directions from any given measurement location. Wind direction is less important for those turbines within approximately 2,000 feet because WTG noise emissions are similar upwind and downwind of the turbine (and somewhat lower to the sides). Wind direction and atmospheric conditions become more important for middle-distance turbines (2,000 to 5,000 feet), as they play a greater role in how much emitted sound energy reaches a measurement location. Turbines that are more than 5,000 feet from measurement locations where the closest turbines are in the 1,500-foot range do not significantly affect the total measured level, as their contribution is more than 10 db below that from the closest turbines, adding a negligible amount to the total sound level. Table 4-2 lists the prevailing wind direction during each measurement, as well as which locations were downwind of which turbines. LWEP Spring 2017 Noise Level Compliance Analysis September
26 Table 4-1: Turbine Operations During 2017 Measurements Location Number of Valid 10-Minute Periods with Full Power Date Nearest Upwind Turbine Nearest 2 Turbines Nearest 4 Turbines April April May April May * 1* 0 May April April May May * 0* 0 April May May * After excluding periods with excessive wind noise contamination or ground wind speed above 5 m/s Location Table 4-2: Turbine Wind Orientation Relative to Measurement Location Wind Nearest Turbine 2 nd Nearest 3 rd Nearest 4 th Nearest Date Direction (from) ID Orientation ID Orientation ID Orientation ID Orientation April 8-9 S T-23 upwind T-20 crosswind T-10 downwind T-24 upwind April 9-10 SSW T-23 upwind T-20 crosswind T-10 crosswind T-24 upwind May SSW T-23 upwind T-20 crosswind T-10 crosswind T-24 upwind April NNE T-6 upwind T-15 downwind T-4 upwind T-18 downwind May SSW T-6 downwind T-15 upwind T-4 downwind T-18 upwind May N T-6 upwind T-15 downwind T-4 upwind T-18 downwind April 8-9 SSW T-28 upwind T-34 upwind T-39 upwind T-38 upwind April 9-10 S T-28 upwind T-34 upwind T-39 upwind T-38 upwind May SSW T-28 upwind T-34 upwind T-39 upwind T-38 upwind May SSW T-28 upwind T-34 upwind T-39 upwind T-38 upwind April NNE T-47 crosswind T-46 crosswind T-49 crosswind T-50 downwind May ENE T-47 downwind T-46 upwind T-49 crosswind T-50 downwind May E T-47 downwind T-46 upwind T-49 upwind T-50 crosswind LWEP Spring 2017 Noise Level Compliance Analysis September
27 4.3 Atmospheric Conditions Certain atmospheric conditions can increase or decrease the level of sound received at the ground away from the source. The most important of these are atmospheric stability, wind gradients, and temperature inversions. Atmospheric stability describes the tendency of pockets of air to move vertically. During sunny days, the sun heats the ground and the ground then heats the air. Heated masses of air rise and shift, and in this unstable state, there is a lot of atmospheric mixing and turbulence. These conditions are not favorable for sound propagation, and therefore measurements taken under such conditions should not be considered representative of loudest conditions. Neutral stability is more favorable for sound propagation, and a stable atmosphere is most conducive to long-range sound propagation. Atmospheric stability is rarely measured directly, and for this study was inferred based on other observations (such as ground wind speed, time of day, solar insolation, and cloud cover) using the meteorological Pasquill stability classes. After sunset and at night, there is a greater chance for both wind gradients and temperature inversions to occur. A wind gradient is the difference between the wind speeds at the ground and at hub height. A strong positive wind gradient is when ground wind speeds are low ( 3 m/s) while hub-height wind speeds are relatively high ( 8 m/s). Under these conditions, sound waves traveling away from and downwind of a source bend down toward the ground and noise levels are greater than in the upwind direction. Temperature inversions, where temperature increases with height, bend sound waves down toward the ground in all directions from the source. Noise levels during a temperature inversion are, as a result, louder than what they would be otherwise. Temperature inversions form most often on calm, clear evenings and nights, when the ground (no longer heated by the sun) and the air close to the ground cool faster the air higher up. In the next section, Table 4-3 lists the atmospheric stability and the strength of the wind gradient during each measurement. On many nights, turbine operations were at or near maximum (high hub-height wind speeds) and ground winds were low, indicating a strong wind gradient. On days when conditions required late afternoon measurements, both hub-height and ground winds were low to moderate, indicating a weak wind gradient. 4.4 Representation of Loudest Conditions Table 4-3 summarizes, for each measurement, the occurrence of full operation of at least the closest turbine for at least one 10-minute interval, the observed atmospheric stability, and whether the wind direction was such that the measurement location was downwind of the nearest turbine(s). Also shown is our opinion as to whether the measured noise levels are representative of the loudest condition that might occur at each location. At Location 1, data representative of loudest conditions was measured on May Optimal wind and atmospheric conditions were present, and all four nearest turbines were operating at full power. Thus, as described in Section 7 below, definitive conclusions can be reached about WTG noise levels at Location 1 on one night. On the other nights, nearby turbine operations were not at full power due to being in low power mode. LWEP Spring 2017 Noise Level Compliance Analysis September
28 Data representative of loudest conditions was measured at Location 2 on May The closest two turbines operated at full power, although only for one 10-minute period. The atmosphere was stable at this time, and the south-southwest wind placed the nearest turbines either directly upwind or downwind of the measurement (which the best that can be expected due to Location 2 having nearest turbines to the north and south). On the other nights, nearby turbine operations were not at full power due to being in low power mode (April) or lack of sufficient wind (May). In April at Location 6, the nearest turbine was (just) at full power, but the second- and fourthclosest turbines were running in reduced-noise mode. Therefore, these nights are not representative of loudest conditions. On May 16-17, there were six 10-minute periods of full operations at the nearest three turbines, the wind and stability criteria were satisfied, and therefore this data is representative of loudest conditions. On May 17-18, prior to a storm passing through, full operations were achieved at the nearest three turbines and the atmospheric stability was neutral. However, the pre-storm data contained a significant amount of wind noise, and no background levels could be measured due to the storm and the difference between pre- and poststorm wind conditions. Therefore, data from this night is not useful for determining compliance. At location 10, there was one 10-minute period on May when the closest two turbines were at full power and the atmosphere was neutral. This data is considered representative of loudest conditions. On the other nights, nearby turbine operations were not at full power. On the other nights, nearby turbine operations were not at full power due to being in low power mode (April) or lack of sufficient wind (May). Location Date Table 4-3: Measurements Representative of Loudest Conditions Wind Direction (from) Loudest Wind Direction? Wind Gradient Atmospheric Stability Full Turbine Power? Loudest Nearest Nearest Nearest Conditions? Upwind 2 4 April 8-9 S YES strong neutral no no no no April 9-10 SSW YES strong unstable/neutral no no no no May SSW YES strong stable YES YES YES YES April NNE YES v. weak neutral no no no no May SSW YES v. strong stable YES YES no YES May N YES weak neutral no no no no April 8-9 SSW YES mid neutral YES no no no April 9-10 S YES mid unstable/neutral YES no no no May SSW YES strong stable YES YES no YES May SSW YES strong neutral YES YES no no April NNE no v. weak neutral no no no no May ENE YES strong neutral YES YES YES YES May E YES weak neutral no no no no LWEP Spring 2017 Noise Level Compliance Analysis September
29 5. Noise Level Analysis Method As described in Section 2, the noise level limit at the property line of an unpooled parcel upon which there is an occupied building or dwelling is 45 dba. However, this applies to WTG noise only, and the microphones placed at the measurement locations measure noise from the WTGs, as well as that from traffic, planes, birds/insects/amphibians, the activities of residents, and wind blowing across the microphone and through vegetation. The measurement data must be analyzed in order to separate WTG noise from non-wtg noise. The data analysis process is outlined in the LWEP Mitigation Plan Sound Testing Protocol, follows applicable portions of ANSI S12.9 Part 3, and includes techniques developed by Hankard Environmental based on our in-depth experience with other wind turbine noise projects. The first step in the data analysis process is to identify all of the 10-minute periods for which the closest WTG was operating at full electric power (90% of rated load or greater). According to the Mitigation Plan Sound Testing Protocol, it is these periods that must be analyzed to determine compliance. Other periods may be analyzed, but only for the sake of providing additional information that may be useful in general, and not to determine compliance. The next step in the Mitigation Plan and ANSI S12.9 data analysis method is to create and review noise level versus time plots (time series) for each measurement survey at each location. For those 10-minute periods being analyzed, the 10-second samples during which non-wtg noise was noted by field technicians are removed. This mainly applies to noise from traffic, planes, dogs, etc. In addition, Hankard Environmental reviews the frequency spectrum of each 10-second sample remaining in the dataset. We further eliminate 10-second samples that have an erratic spectral shape, often due to sources that the technicians may not have noticed. WTG-only noise level has a distinct spectral shape, and no 10-second samples with any sign of WTG noise are eliminated in this manner. Finally, per ANSI S12.9, noise level measurements made when ground wind speeds exceed 5 m/s are discarded. ANSI S12.9 allows for the elimination of up to half of the data points in any given interval (10 minutes in this case). The remaining 10-second L eq samples are then used to calculate the 10-minute L eq. Next, per ANSI S12.9, the overall A-weighted L eq can be re-calculated using only the 31.5 through 1,000 Hz octave band noise levels if there is noise present from bird/insect/amphibian noise or wind noise present. Given that noise from frogs and/or wind was audible during all of the Spring 2017 measurements, this method was applied to all of the measured data. The resulting noise level is termed the special L eq herein, noted as L eqs (dba). This was applied to both turbine-on and turbine-off measurements. On nights when a valid background noise level was obtained (turbines off), this was logarithmically subtracted from the turbine-on noise level (after having a 1.5 dba uncertainty subtracted from it per ANSI S12.9) to obtain the WTG-only 10-minute L eqs (dba). On nights when no valid background noise level data was obtained, the measured levels were taken directly as the WTG-only levels. It is these WTG-only noise levels that were compared to the Mason County standard. LWEP Spring 2017 Noise Level Compliance Analysis September
30 6. Measurement and Analysis Results This section describes the results of the noise level measurements and data analysis for each location. Conclusions are given in Section 7, along with statements on data validity and compliance with Mason County standards. 6.1 Location 1 April 8-9, 2017 Measurements were conducted between 21:30 CDT on April 8 th and 4:00 on April 9 th. The wind direction was from the south, placing T-23, T-20, and T-24 upwind of the measurement location and T-10 downwind. Of the four closest turbines only T-10 (the third closest) consistently operated at full output during the measurements. T-20, the second closest turbine, reached 90% power during approximately 50 minutes of the night (0:30 to 1:10). However, the closest turbine (T-23) never achieved 90% power, and its output never exceeded 1,540 kw. Therefore, the April 8-9 measurements contain no 10-minute periods that are valid for determining compliance at Location 1, because the nearest turbine was being operated in reduced power mode. April 9-10, 2017 Measurements were conducted between 19:00 on April 9 th and 1:20 on April 10 th. The wind direction was from the south, placing T-23, T-20, and T-24 upwind of the measurement location and T-10 downwind. Of the four closest turbines only T-10 (the third closest) consistently operated at full output during the measurements. T-20, the second closest turbine, reached 90% power during four 10-minute periods (22:40, 22:50, 0:20, and 1:10). However, the closest turbine (T-23) never achieved 90% power, with its output never exceeding approximately 1,540 kw. Therefore, the April 9-10 measurements contain no valid periods for demonstrating compliance at Location 1, because the nearest turbine was being operated in reduced power mode. May 16-17, 2017 Measurements were conducted between 20:40 on May 16 th and 3:08 on May 17 th. The wind direction was from the south, placing T-23, T-20, and T-24 upwind of the measurement location and T-10 downwind. There were minute periods during which the closest turbine (T-23) was operating at or above 90%. Of these, there were 9 periods during which the closest 2 turbines were operating at full power, and 6 periods (21:20 through 21:50, and again from 22:20 through 22:50) during which all four closest turbines were at full power. Therefore, the April 9-10 measurements contain minute periods that are valid for demonstrating compliance at Location 1. Figure 6-1 shows the time series for the entire measurement period, including the 10-second L eqs (dba), the 1-minute average ground wind speed, the 10-minute average ground wind speed, and the 10-minute average hub-height wind speed at the nearest turbines. Transient noise from passing vehicles and aircraft overflights is obvious. Figure 6-2 removes the noise levels during non-wtg events (based on field notes, the level versus time signature, and the spectral content of the signal during noted events) and adds the 10-minute L eqs calculated without those events. LWEP Spring 2017 Noise Level Compliance Analysis September


31 Figure 6-1: Location 1 Raw Time Series May LWEP Spring 2017 Noise Level Compliance Analysis September


32 Figure 6-2: Location 1 Time Series Without Transient Events May LWEP Spring 2017 Noise Level Compliance Analysis September
33 All turbines within approximately 8,000 feet of Location 1 were shut down from 23:10 to 1:15 to obtain an ambient noise level. Table 6-1 lists the 10-minute L eqs for each of the 15 full-power turbine-on periods, as well as the lowest 10-minute turbine-off L eqs measured during the shutdown after the cooling fans had become inaudible. The shading corresponds to the shading of the 10-minute periods in the time series plots (Figures 6-1 and 6-2), with light grey representing periods with the nearest turbine at full power, medium grey representing the nearest two at full power, dark grey representing all four nearest turbines at full power, and light red representing the ambient period. Note that because the night s measurements ended at 3:08, the 3:00 measurement is an 8-minute average level rather than a 10-minute level. Except for the period beginning at 3:00, all of the turbine-on periods had wind speeds within 1.5 m/s of the values during the ambient period. Also shown is the 1.5 db uncertainty level from ANSI S12.9 Part 3 and the resulting WTG-only L eqs for each turbine-on period. The WTG-only 10-minute L eqs ranges from 42.2 to 42.7 dba. Table 6-1: Location 1 Measured & WTG Noise Levels May Minute WSg WShh # Nearest 10-Minute LeqS (dba) Full Measured Measured Imputed (m/s) (m/s) Uncertainty Time Power Turbine-On Ambient Ambient WTG-Only 20: : : : : : : : : : : ambient : : : : :00* * 42.2 * The period beginning at 3:00 was 8 minutes in duration and had a hub-height wind speed more than 1.5 m/s different than the ambient period beginning at 1:00. Figure 6-3 shows the one-third octave band frequency spectra for the minute periods of fullpower turbine-on data shown in Table 6-1, as well as the one 10-minute ambient period. The presence of frogs is evident in the primary peak at 2 khz, and a lesser peak at 1 khz. The frogs were active throughout the night, becoming quieter in the early morning hours, and the peaks persist in most 10-minute spectra. This primary peak is not included in the calculated 10-minute L eqs values, because the L eqs spans only the 25 Hz to 1,250 Hz portion of the frequency range. LWEP Spring 2017 Noise Level Compliance Analysis September
34 Figure 6-3: Location 1 Ten-Minute Spectra May These spectra show only a weak resemblance to the characteristic shape of WTG-only noise that has been identified on the LWEP. As described in the Noise Level Compliance Report for the Lake Winds Energy Park Spring 2016 Noise Level Measurements (Figure 7-5 therein), WTG-only spectra contain a dip in the 125 to 200 Hz region, a peak at 315 Hz, and an approximately 9 db per octave slope above 315 Hz. The lack of this shape for the Location 1 spectra shown in Figure 6-3 are due to the relatively low WTG noise levels (because of the slightly greater distance to the nearest turbines relative to other locations) and the presence of some background noise (wind through the trees). LWEP Spring 2017 Noise Level Compliance Analysis September
35 6.2 Location 2 April 10-11, 2017 Due to weather conditions, measurements on April 10 th were conducted in the late afternoon. Measurement began at 15:30, but ended at 17:14 as field staff were alerted to an approaching thunderstorm by Consumers Energy. During the measurements, the wind direction was initially from the north-northwest, and then shifted to the north-northeast. This placed T-6 and T-4 upwind of the measurement location, and T-15 and T-18 downwind. None of the four closest turbines reached more than 30% output during the measurement. Therefore, the April 10 measurements contain no 10-minute periods that are valid for determining compliance at Location 2. May 17-18, 2017 Measurements were conducted between 20:50 on May 17 th and 4:00 on May 18 th. The wind direction was from the south-southwest, placing T-6 and T-4 downwind of the measurement location, and T-15 and T-18 upwind. A thunderstorm passed through the area between approximately 0:10 and 02:30 on May 18. Staff took shelter and covered the windscreen to protect the microphone from the rain, but left the sound level meter and anemometer running during the storm. The microphone cover was removed at approximately 2:42. Figure 6-4 shows the noise level versus time for the entire measurement period, including the 10-second L eqs (dba), the 1- minute average ground wind speed, the 10-minute average ground wind speed, and the 10- minute hub-height wind speed at the nearest turbines. Figure 6-5 removes the noise levels during transient non-wtg events (based on field notes, the time series, and the spectral content of the signal during noted events) and adds the 10-minute L eqs calculated without those events. As can be seen, the 10-minute noise levels before the storm (20:40 to 0:30) range from about 47 to 53 dba. These levels contain both WTG noise and a significant amount of wind noise. In particular, field notes indicate there was audible noise from the wind blowing through the thick stand of mature pine trees located to the southwest and southeast. Staff expected to see higher ground-level wind speeds than those observed (1-2 m/s on average, with gusts only as high as 3 m/s). We believe this is because Location 2 is well-protected (shielded) from ground-level winds from the south due to the pine trees, other trees and vegetation, and the residence and garage. Before the storm, it was staff s intent to call for a turbine shut-down in order to measure ambient noise levels. After the storm, a decision had to be made whether to continue turbine-on measurements (conditions were excellent and turbine sound was clearly audible) or to call for a shutdown to obtain an ambient noise level to correct the pre-storm measurements. For two reasons, it was felt that it was either one or the other. First, there were only two to three hours before birds and traffic activity would start. Second, due to the temperature, the shutdown would take at least two hours before the cooling fans would fully shut down. In the field, staff noticed a significant decrease in background sound levels compared to before the storm. In retrospect, the ground-level winds decreased by about 1 m/s after the storm, hub-height wind speeds decreased by 5 m/s. Specifically, hub-height winds decreased from between 12 and 15 m/s before the storm between 7 and 10 m/s afterward. Due to this decrease in hub-height wind speeds and the corresponding LWEP Spring 2017 Noise Level Compliance Analysis September
36 decrease in audible background noise, the shutdown would not have represented pre-storm turbine-off conditions. Thus, we feel the right decision was made. After the storm, conditions were excellent for the direct measurement of WTG-only noise levels due to the significant decrease in ground-level and hub-height wind speeds. There were three 10- minute periods after the storm when the nearest turbine (T-6) was operating at full electrical power. During one of these periods, three of the four closest turbines were operating at full electric power, and the third-closest was at 88%. Table 6-2 lists the 10-minute L eqs for each of the three full-power turbine-on periods after the storm. Note that because the cover was removed from the microphone between 2:42 and 2:43, the 2:40 measurement is actually a 7-minute average level rather than a 10-minute level. The resulting measured 10-minute L eqs range from 43.8 to 44.3 dba. Table 6-2: Location 2 Measured Noise Levels May Minute WSg WShh # Nearest 10-Minute LeqS (dba) Full Measured Measured Imputed (m/s) (m/s) Uncertainty Time Power Turbine-On Ambient Ambient WTG-Only 2:40* < : < : < 44.0 * The period beginning at 2:40 was 7 minutes in duration. LWEP Spring 2017 Noise Level Compliance Analysis September


37 Figure 6-4: Location 2 Raw Time Series May LWEP Spring 2017 Noise Level Compliance Analysis September

38 Figure 6-5: Location 2 Time Series Without Transient Events May LWEP Spring 2017 Noise Level Compliance Analysis September


39 Figure 6-6 shows the one-third octave band spectra for the three full-power 10-minute periods. The turbine-on spectra show the characteristic shape of WTG-only noise levels, specifically lowfrequency levels below about 60 dba, a mid-frequency dip, a peak at 315 Hz, and a steady dropoff in levels at frequencies higher than the mid-band peak. Figure 6-6: Location 2 Ten-Minute Spectra May May 18-19, 2017 Measurements were conducted between 21:20 on May 18 th and 0:00 on May 19 th. The wind direction was from the north, placing T-6 and T-4 upwind of the measurement location, and T-15 and T-18 downwind. T-15, the third closest turbine, reached 90% power during one 10-minute period (21:40). However, the closest turbine (T-6) never achieved 90% power. Therefore, the May measurements contain no 10-minute periods that are valid for demonstrating compliance at Location 2. LWEP Spring 2017 Noise Level Compliance Analysis September
40 6.3 Location 6 April 8-9, 2017 Measurements were conducted between 21:50 on April 8 th and 3:40 on April 9 th. The wind direction was from the south, placing all four of the nearest turbines upwind of the measurement location (T-28, T-34, T-39, and T-38). The closest turbine, T-28, achieved full electric power during five 10-minute intervals during the course of the measurement. Based on a comparison of power production versus hub-height wind speed during this measurement period and during the May 2017 measurements, it appears that this turbine was not fully functioning in April. Furthermore, the 2 nd closest turbine (T-34) and 4 th closest (T-38) never achieved more than 85% of full power due to being operated in low noise mode. The third closest turbine did achieve full power for a number of periods, and appears to have been working properly. Based primarily on the lack of full power at the 2 nd closest turbine, but also on the questionable operation of the nearest turbine and the reduced operation of the 4 th closest, none of the data collected during this measurement period is considered valid for analysis. April 9-10, 2017 Measurements were conducted between 19:50 on April 9th and 1:10 on April 10th. The wind direction was from the south, placing all four of the nearest turbines upwind of the measurement location (T-28, T-34, T-39, and T-38). The closest turbine, T-28, achieved full electric power during three 10-minute intervals during the course of the measurement. Based on a comparison of power production versus hub-height wind speed during this measurement period and during the May 2017 measurements, it appears that this turbine was not fully functioning in April. Furthermore, the 2nd closest turbine (T-34) and 4th closest (T-38) never achieved more than 85% of full power due to being operated in low noise mode. The third closest turbine did achieve full power for a number of periods, and appears to have been working properly. Based primarily on the lack of full power at the 2nd closest turbine, but also on the questionable operation of the nearest turbine and the reduced power operation of the 4th closest, none of the data collected during this measurement period is considered valid for analysis. May 16-17, 2017 Measurements were conducted between 21:00 on May 16 th and 3:00 on May 17 th. The wind direction was from the south, placing all four closest turbines (T-28, T-34, T-39, and T-38) upwind of the measurement location. There were eight 10-minute periods during which the closest turbine (T-28) was operating at or above 90%, of which six periods had the closest 3 turbines operating at full power. The fourth-closest turbine (T-38) never reached full power. With a maximum output of approximately 1,540 kw, this turbine was operating in a reduced mode. Overall, the May measurements contain 8 10-minute periods that are valid for demonstrating compliance at Location 6. Figure 6-7 shows the time series for the entire measurement period, including the 10-second L eqs (dba), the 1-minute average ground wind speed, the 10-minute average ground wind speed, and the 10-minute average hub-height wind speed at the nearest turbines. Higher levels of transient noise from passing vehicles, wind gusts, and aircraft overflights are evident. Also indicated by shading are the 10-minute periods where the nearest turbines were operating at full electrical LWEP Spring 2017 Noise Level Compliance Analysis September
41 power. Figure 6-8 shows the same information, but with transient events removed based on a review of field notes, the level versus time signature, and the spectral content of the signal during noted events. Also shown in Figure 6-8 is the 10-minute L eqs calculated without the transient events. All turbines within approximately 8,000 feet of Location 6 were shut down from 23:10 to 1:15 to obtain an ambient noise level. Total levels prior to the shutdown were in the 45 to 46 dba range, and field personnel noted the influence of frogs and wind on the measured levels. The two 10- minute periods toward the end of the shutdown were used as representative of ambient conditions, as this is when the cooling fans in the turbines finally became inaudible. LWEP Spring 2017 Noise Level Compliance Analysis September


42 Figure 6-7: Location 6 Raw Time Series May LWEP Spring 2017 Noise Level Compliance Analysis September


43 Figure 6-8: Location 6 Time Series Without Transient Events May LWEP Spring 2017 Noise Level Compliance Analysis September
44 Table 6-3 lists the measured noise levels, wind conditions, and turbine operating conditions for both the eight 10-minute periods during which the nearest turbine was operating at full electric power and the two 10-minute turbine-off periods during which the turbine cooling fans had become inaudible. All of the turbine-on periods had wind speeds within 1.5 m/s of the values during the ambient period. Also shown is the 1.5 db uncertainty level from ANSI S12.9 Part 3 and the resulting WTG-only L eqs for each turbine-on period. The WTG-only 10-minute L eqs ranges from 43.7 to 44.1 dba. Table 6-3: Location 6 Measured & WTG Noise Levels May Minute WSg WShh # Nearest 10-Minute LeqS (dba) Full Measured Measured Imputed (m/s) (m/s) Uncertainty Time Power Turbine-On Ambient Ambient WTG-Only 0: ambient : ambient : : : : : : : : Figure 6-9 shows the one-third octave band frequency spectra for the 8 10-minute periods of fullpower turbine-on data shown in Table 6-3, as well as the two 10-minute ambient periods. The presence of frogs is evident in the local peaks at 1 khz and 2 khz. The frogs were active throughout the night, becoming quieter in the early morning hours, and the peaks persist in most 10-minute spectra. The 2 khz and part of the 1 khz peak are not included in the calculated 10- minute L eqs values, because that only spans the 25 Hz to 1,250 Hz portion of the frequency range. These spectra resemble the characteristic shape of WTG-only noise that has been identified at the LWEP. At this site, this includes a dip around 125 to 200 Hz and a peak at 315 Hz. The slope above the peak was shallower in this case due to the significant amount of frog noise. LWEP Spring 2017 Noise Level Compliance Analysis September
45 Figure 6-9: Location 6 Ten-Minute Spectra May LWEP Spring 2017 Noise Level Compliance Analysis September
46 May 17-18, 2017 Measurements were conducted between 21:10 on May 17th and 4:00 on May 18th. The wind direction was from the south-southwest, placing the four closest turbines upwind of the measurement location. There were minute periods where the nearest turbine operated at full electric power. Of these, the 2 nd and 3 rd closest were also at full power for 27 periods. The 4 th closest turbine was in low power mode, so it never exceeded 85% power. A thunderstorm passed through the area between approximately 0:10 and 02:30 on May 18. Staff took shelter and removed the measurement system from the site for the duration of the storm. Staff did not return to Location 6 after the storm, because (1) power production was very low via the reports we received from the LWEP operator, thus full power data would not have been obtained, (2) atmospheric conditions had changed drastically, thus valid ambient measurements could not be taken, and (3) conditions at Location 2 where we were at the time were very good for measurements, thus we decided to focus our efforts there. Figure 6-10 shows the time series for the entire measurement period, including the 10-second L eqs (dba), the 1-minute average ground wind speed, the 10-minute average ground wind speed, and the 10-minute average hub-height wind speed at the nearest turbines. Higher levels of transient noise from passing vehicles and wind gusts are evident. Also indicated by shading are the 10- minute periods where the nearest turbines were operating at full electrical power. Figure 6-11 shows the same information, but with transient events removed based on a review of field notes, the level versus time signature, and the spectral content of the signal during noted events. Also shown in Figure 6-11 is the 10-minute L eqs calculated without the transient events. As can be seen, the 10-minute noise levels before the storm (21:10 to 0:10) range from about 46.5 to 49.0 dba. These levels contain both WTG noise and a significant amount of wind noise, as well as frog noise. Before the storm, it was staff s intent to call for a turbine shutdown in order to measure ambient noise levels. After the storm, staff called the control center for turbine power information approximately every half hour. Post-storm power levels were significantly below pre-storm levels, indicating significantly lower hub-height wind speeds. This was borne out by data subsequently received from Consumers Energy, which showed that hub-height winds decreased from between 12 and 15 m/s before the storm to between 6 and 8 m/s afterward. This is well outside the 1.5 m/s acceptable wind speed difference. Due to the significant decrease in hub-height wind speeds and the corresponding decrease in audible background noise, a shutdown would not have represented pre-storm turbine-off conditions. Therefore, the May data cannot be used to demonstrate compliance due to the significant influence of wind noise that cannot be separated out. LWEP Spring 2017 Noise Level Compliance Analysis September


47 Figure 6-10: Location 6 Raw Time Series May LWEP Spring 2017 Noise Level Compliance Analysis September

48 Figure 6-11: Location 6 Time Series Without Transient Events May LWEP Spring 2017 Noise Level Compliance Analysis September

49 To confirm this conclusion, we analyzed the 10-second periods that staff had noted as having less wind influence than turbines (although none of the periods were noted as having zero wind influence). Figure 6-12 shows the spectra of these 10-second periods. These spectra show evidence of both high winds and turbine operations. High winds are evident in the less prominent 315 Hz turbine peak and the less steep high-frequency roll-off. The noise from turbine operations is only somewhat evident given the peak at 315 Hz and the slight dip around 200 Hz. In addition, frog activity is evident in the peaks at 1 khz and 2 khz. Figure 6-12: Location 6 Noted Ten-Second Spectra May Figure 6-13 shows the one-third octave band frequency spectra for the 10-minute periods of fullpower turbine-on data before the storm. These spectra also show evidence of both high winds and turbine operations. High winds here are evident in the low frequency levels, which are above 60 db, as well as the less prominent 315 Hz turbine peak and the less steep high-frequency rolloff. The noise from turbine operations only barely evident given the slight peak at 315 Hz and the slight dip around 200 Hz. In addition, frog activity is evident in the peaks at 1 khz and 2 khz. LWEP Spring 2017 Noise Level Compliance Analysis September

50 Figure 6-13: Location 6 Ten-Minute Spectra May LWEP Spring 2017 Noise Level Compliance Analysis September
51 6.4 Location 10 April 10-11, 2017 Due to weather conditions, measurements on April 10 th were conducted in the late afternoon. Measurement began at 15:30, but ended at 17:10 as field staff were alerted to an approaching thunderstorm by Consumers Energy. During the measurements, the wind direction was from the north. This placed the closest 2 turbines (T-46 and T-47) in a crosswind position, and the next 2 turbines (T-49 and T-50) in a downwind/crosswind position. None of the four closest turbines reached more than 30% output during the measurement. Therefore, the April 10 measurements contain no 10-minute periods that are valid for determining compliance at Location 10. May 19-20, 2017 Measurements were conducted between 1:10 and 4:30 on May 20 th. The wind direction was from the east-northeast, placing the T-47 in a downwind/crosswind position, T-46 upwind, T-49 crosswind, and T-50 downwind of the measurement location. closest turbines upwind of the measurement location. The closest turbines (T-47 and T-46) reached full power during one 10- minute period. During that period, T-49 was at 74% power and T-50 was at 82% power. Figure 6-14 shows the time series for the entire measurement period, including the 10-second L eqs (dba), the 1-minute average ground wind speed, the 10-minute average ground wind speed, and the 10-minute average hub-height wind speed at the nearest turbines. The transient higher levels are due to staff activity, wind gusts, aircraft overflights, and audible traffic on both Anthony Road and Morton Road. Also indicated by shading is the one 10-minute period (2:10) where the nearest 2 turbines were operating at full electrical power. Figure 6-15 shows the same information, but with transient events removed based on a review of field notes, the level versus time signature, and the spectral content of the signal during noted events. Also shown in Figure 6-15 is the 10-minute L eqs calculated without the transient events. As can be seen, the 10-minute noise level for the one full-power period is 44.8 dba. This is also shown in tabular form in Table 6-4. Table 6-4: Location 10 Measured Noise Level May Minute WSg WShh # Nearest 10-Minute LeqS (dba) Full Measured Measured Imputed (m/s) (m/s) Uncertainty WTG-Only Time Power Turbine-On Ambient Ambient 2: < 44.8 LWEP Spring 2017 Noise Level Compliance Analysis September

52 Figure 6-14: Location 10 Raw Time Series May LWEP Spring 2017 Noise Level Compliance Analysis September


53 Figure 6-15: Location 10 Time Series Without Transient Events May LWEP Spring 2017 Noise Level Compliance Analysis September
54 Figure 6-16 shows the 10-minute spectrum for the one full-power period after the transient events have been removed. The turbine noise shape is only faintly visible, with the 200 Hz dip and the 315 Hz peak mostly obscured by wind noise. An ambient measurement would be useful to separate the turbine noise from the wind noise, but (as can be seen in Figures 6-14 and 6-15) the hub-height wind consistently decreased after this 10-minute period and did not recover for the rest of the night. Figure 6-16: Location 10 Ten-Minute Spectrum May LWEP Spring 2017 Noise Level Compliance Analysis September
.")
55 It is possible, however, to partially separate the wind component from the turbine component on a time basis. Figure 6-17 shows the spectra of those 10-second periods that staff had noted as having less wind influence than turbines (although none of the periods were noted as having zero wind influence). There is less wind influence as the low-frequency levels are below 60 db, the 200 Hz dip is more visible, and the high-frequency roll-off is slightly steeper. Figure 6-17: Location 10 Noted Ten-Second Spectra May May 20-21, 2017 Measurements were conducted between 20:10 and 23:00 on May 20 th. The wind direction was from the east, placing T-47 downwind of the measurement location, T-46 upwind, T-49 crosswind, and T-50 within 45 degrees of downwind. Of the four closest turbines only T-50 (the fourth closest) reached 90% power during one 10-minute period. Neither of the closest two turbines (T-47 and T-46) achieved 90% power. In addition, the 10-minute average ground wind speed ranged from 3.8 to 5.4 m/s. Therefore, the May measurements contain no 10-minute periods that are valid for determining compliance at Location 10. LWEP Spring 2017 Noise Level Compliance Analysis September
56 7. Conclusions The following paragraphs summarize, for each measurement location, the levels of WTG-only noise measured, whether the measured levels meet the Mason County limit, and whether the measured data set is sufficient to confidently conclude that maximum WTG noise levels were captured and compliance has been adequately demonstrated. Our conclusions regarding the latter are based primarily on the provisions of ANSI S This is prudent, as the Consent Judgement states that testing shall be conducted in accordance with the mitigation plan and incorporated protocols, which refers to the Mitigation Plan Sound Testing Protocol. The Sound Testing Protocol states that testing will follow the procedures of ANSI Standard S12.9/Part 3... and ANSI S ANSI S12.9 primarily covers the procedures for measuring noise levels and analyzing the resulting data to determine WTG-only noise levels. The purpose of ANSI S12.18 is to specify procedures for measuring and reporting sound pressure levels from specific sources outdoors and to specify a set of reproducible atmospheric conditions to obtain reproducible measurements. The Applications section of ANSI S12.18 says A major application of this standard is obtaining reproducible sound pressure levels from the same source at the same microphone location on different days. Section 7.4 of S12.18 states that repeated measurements at a receiver position are required to assess the repeatability of the measurement results and A minimum of three repetitions under equivalent conditions is recommended." Given that the noise level data measured as part of this study will be used to demonstrate that maximum WTG-only noise levels are consistently in compliance with Mason County Standards, not just during the measurements but for all time going forward, the data set needs to be robust. This is further mandated by the complexities of WTG noise emissions (changing source strength, multiple large noise sources located high in the air, and sources located in many different directions from receptor locations), and the complexities of the propagation of WTG noise through the atmosphere (varying atmospheric conditions including stability, wind direction, and wind speed). In our professional opinion, for a given set of data to be used to confidently conclude that maximum WTG-only noise levels have been captured, and that the levels are reasonably representative of the maximum levels that regularly occur at a site, even a conservative reading of ANSI S12.18 would require the following: 1. The source should be at full power. This is defined on this project as the nearest turbine(s) at 90% of full electric power or greater on a 10-minute average basis. Clearly the closest turbine needs to be at full power. In most cases, the second-closest turbine has a measurable effect on the total WTG-only level, so it to should also be at full power. Having additional nearby turbines at full power only increases the quality of the data. 2. The atmospheric conditions should include, at a minimum, the wind direction, wind speed, and temperature inversion parameters defined by ANSI S It is also known that noise propagates more efficiently in a stable atmosphere, thus this condition increases the quality of the data. LWEP Spring 2017 Noise Level Compliance Analysis September
57 3. The quantity of data needed depends on both the quality of the data and how close the measured levels are to the limit. The standard is clear in that a minimum of three repetitions under equivalent conditions is recommended." Thus, three 10-minute periods of valid data should be the minimum requirement. To determine if the data satisfies the standard s call for the measured noise levels to be representative of maximum WTG noise levels on different days, the data should either (1) be actually conducted on different days (nights) and show similar, reproducible results, or (2) be of a quantity and quality on one day (night) such that reproducibility is well demonstrated. For example, a significant quantity (at least twice the minimum of 3 periods to represent two nights) of high quality data (four closest turbines at full power and a stable atmosphere) could be used to confidently claim compliance. Also of importance is how close to the limit the results are. Those that are within 1 db of the limit should receive more scrutiny than those that are 2 to 3 db below the limit. It is within this framework that the following conclusions are made regarding the 2017 noise level measurement data, and the confidence to which it can be used to demonstrate compliance with the Mason County noise level standard. Location 1 The noise level data collected on the night of May 16-17, 2017 are representative of loudest WTG conditions. The wind direction was from the south, placing T-23, T-20, and T-24 upwind of the measurement location and T-10 downwind. There were minute periods during which the closest turbine (T-23) was operating at full power. Of these, there were 9 periods during which the closest 2 turbines were at full power, and 6 periods during which all four closest turbines were at full power. The total measured noise level (10-minute L eqs, dba), including noise from both turbine and non-turbine sources, ranges from 42.8 to 43.2 dba. A shutdown of the nearby turbines was conducted, and the measured ambient noise level was 35.6 dba. The resulting WTGonly noise levels range from 42.2 to 42.5 dba (10-minute L eqs ), all of which comply with the 45 dba standard. Data collected on the other two nights of measurements in 2017 were not valid due to nearby turbines being operated in reduced-power mode. The measured WTG-only one-third octave band frequency spectra show only a weak resemblance to the characteristic shape of WTG-only noise that has previously been identified at the LWEP. As described in the Noise Level Compliance Report for the Lake Winds Energy Park Spring 2016 Noise Level Measurements (Figure 7-5 therein), WTG-only spectra contain low frequency noise levels below 60 db, a dip in the 125 to 200 Hz region, a peak at 315 Hz, and a steady drop off in noise levels above this peak (approximately 9 db per octave). The somewhat weak resemblance of the Location 1 spectra to this shape are due to the relatively low WTG noise levels (because of the greater distance to the nearest turbines relative to other locations) and the presence of some background noise (mainly ground wind) remaining in the WTG-only levels even after processing. The data collected at Location 1 in 2017 are sufficient to confidently demonstrate compliance with the Mason County standard. While only consisting of one night, the data are of high quality (four closest turbines at full power, stable atmosphere), the atmospheric conditions were within ANSI S12.18 parameters, three times the minimum number of data points were collected, and the LWEP Spring 2017 Noise Level Compliance Analysis September
58 resulting levels are more than 2 db below the standard. Thus, compliance is considered demonstrated, and no further testing is recommended. Location 2 The noise level data measured on the night of May 17-18, 2017 are representative of loudest WTG noise conditions. The wind direction was from the south-southwest, placing T-6 and T-4 downwind of the measurement location, and T-15 and T-18 upwind. After a storm passed through, measurement conditions were excellent for the direct measurement of WTG-only noise levels due to the significant decrease in ground-level wind speeds. There were three 10-minute periods when the nearest turbine (T-6) was operating at full electrical power. During one of these periods, three of the four closest turbines were at full power, and the third-closest was at 88%. The measured 10-minute noise levels range from 43.8 to 44.3 dba, all of which comply with the 45 dba standard. No shutdown was conducted due to the compliance of the directly measured noise levels, and because of the warm temperature it would have taken about two hours for the turbine cooling fans to completely shut off, at which point the sun would be rising and traffic would increase thus significantly changing conditions. As expected, even the directly measured one-third octave band spectra for the three full-power 10-minute periods show the characteristic shape of WTG-only noise. Data collected on two other nights in 2017 were not valid due to nearby turbines being operated in reduced-power mode (April) or insufficient wind for full power operation (May). The data collected at Location 2 on May 17-18, 2017 provide one night of valid data. However, in our opinion it cannot be used to confidently conclude that noise levels are in compliance with the Mason County standard. This is because the nearest turbine was at full power for only the minimum three periods, let alone twice that many. During only one of these periods were the nearest two turbines at full power. In our opinion, this does not satisfy ANSI S12.18 as described above. Furthermore, the data collected at Location 2 in 2016 was insufficient to assess compliance. Location 6 The noise level data collected on the night of May 16-17, 2017 are representative of loudest WTG noise conditions. The wind direction was from the south, placing all four closest turbines (T-28, T-34, T-39, and T-38) upwind of the measurement location. There were eight 10-minute periods during which the closest turbine (T-28) was operating at full power, of which six periods had the closest 3 turbines at full power. The fourth-closest turbine (T-38) never reached full power, as it was apparently being operated in a reduced-noise mode. This is not significant due to the relative distance of this and the other 3 turbines. Thus, the resulting measurements contain 8 10-minute periods that are valid for demonstrating compliance at Location 6. During this night, total levels were in the 45 to 46 dba range, and field personnel noted the influence of frogs and wind on the measured levels. Because of this, all turbines within approximately 8,000 feet of Location 6 were shut down to obtain an ambient noise level. The two 10-minute periods toward the end of the shutdown were representative of ambient conditions, as this is when the turbine cooling fans finally became inaudible. The wind speeds during the turbine-on periods were within 1.5 m/s of the values during the ambient periods, which is in accordance with the Mitigation Plan Sound Testing Protocol. LWEP Spring 2017 Noise Level Compliance Analysis September
59 The ambient noise levels were subtracted from the total measured noise levels in accordance with ANSI S12.9. The resulting WTG-only noise levels range from 43.7 to 44.1 dba, all of which comply with the Mason County standard. The spectra resemble the characteristic shape of WTG-only noise that has been previously identified at the LWEP. At this site, this includes a dip around 200 Hz and a peak at 315 Hz. The slope above the peak was not as steep in this case due to the significant amount of frog noise at 1 khz and 2 khz. The data collected at Location 6 in 2017 provide one night of valid data. However, in our opinion it cannot be used to confidently conclude that noise levels are in compliance with the Mason County standard. This is primarily because the measured WTG-only noise level is within 1 db of the standard. In addition, the six valid periods of data represent the minimum number of samples, but over the same night instead of two different nights. Finally, the fourth-closest turbine was in reduced-power mode. Location 10 The noise level data collected on the night of May 19-20, 2017 are representative of loudest WTG noise conditions. The wind direction was from the east-northeast, placing the nearest turbine (T- 47) in a downwind/crosswind position, T-46 upwind, T-49 crosswind, and T-50 downwind of the measurement location. The two closest turbines (T-47 and T-46) reached full power during one 10-minute period. During that period, T-49 was at 74% power and T-50 was at 82% power. The measured total noise level during this period was 44.8 dba, which complies with the Mason County standard. The spectrum for this period shows only a weak resemblance to a WTG-only spectrum, with the 200 Hz dip and the 315 Hz peak mostly obscured by wind noise. Therefore, this level of 44.8 dba certainly contains some background noise, and the WTG-only level is certainly lower. The data collected at Location 10 in 2017 provide one 10-minute period of valid data. Noise levels were collected on other nights in 2017 at Location 10, but the nearest turbines were not operating at full power during any of those periods. In 2016, valid noise levels were collected for two 10- minute periods on one night and one 10-minute period on another night. During these three periods in 2016, the nearest turbine operated at full power, but operations of the other nearby three turbines ranged from 50 to 80%. At no time did the nearest two turbines operate at full power. Thus, even taken collectively, the valid 2016 and 2017 data at Location 10 only provide one night of data that satisfy ANSI S Additionally, the WTG-only noise levels are within 1 db of the standard. Future Testing Recommendations At this point in the noise testing process, a sufficient number of valid test samples have been obtained on a sufficient number of nights to confidently conclude that maximum WTG-only noise levels are in compliance with the Mason County standard at Location 5 (from 2016) and Location 1 (2017). Valid WTG-only noise levels have been obtained on one night at each of Locations 2, 6, and 10, and all measured levels comply with the Mason County standard. In our opinion, one additional night of valid data should be obtained at each of these three locations in order to confidently conclude that WTG-only noise levels are in compliance with the Mason County standard. LWEP Spring 2017 Noise Level Compliance Analysis September
60 APPENDIX A Measurement Equipment Calibration Records LWEP Spring 2017 Noise Level Compliance Analysis September 2017 A-1

61 Figure A Calibration Certificate for Field Calibrator LWEP Spring 2017 Noise Level Compliance Analysis September 2017 A-2


62 Figure A Calibration Certificate for Field Calibrator LWEP Spring 2017 Noise Level Compliance Analysis September 2017 A-3
63 Figure A Calibration Certificate for Sound Level Meter 4244 LWEP Spring 2017 Noise Level Compliance Analysis September 2017 A-4
64 Figure A Calibration Certificate for Sound Level Meter 4250 LWEP Spring 2017 Noise Level Compliance Analysis September 2017 A-5


65 Figure A-5. Calibration Certificate for Microphone Capsule LWEP Spring 2017 Noise Level Compliance Analysis September 2017 A-6


66 Figure A-6. Calibration Certificate for Microphone Capsule LWEP Spring 2017 Noise Level Compliance Analysis September 2017 A-7
67 Figure A-7. Conformance Certificate for Anemometer M LWEP Spring 2017 Noise Level Compliance Analysis September 2017 A-8

68 Figure A-8. Conformance Certificate for Anemometer M LWEP Spring 2017 Noise Level Compliance Analysis September 2017 A-9
Oldman 2 Wind Farm Limited
 Decision 22676-D01-2017 Spring 2017 Post-Construction Sound Survey at Receptors B, J and K August 1, 2017 Alberta Utilities Commission Decision 22676-D01-2017 Proceeding 22676 Application 22676-A001 August
7 th International Conference on Wind Turbine Noise Rotterdam 2 nd to 5 th May 2017
 7 th International Conference on Wind Turbine Noise Rotterdam 2 nd to 5 th May 2017 Sound power level measurements 3.0 ir. L.M. Eilders, Peutz bv: l.eilders@peutz.nl ing. E.H.A. de Beer, Peutz bv: e.debeer@peutz.nl
Influence of non-standard atmospheric conditions on turbine noise levels near wind farms
 Influence of non-standard atmospheric conditions on turbine noise levels near wind farms Jonathan COOPER 1 ; Tom EVANS 1 ; Vahid ALAMSHAH 1 1 Resonate Acoustics, Australia ABSTRACT This paper investigates
Status: Rev: Comments Date: Author: Reviewer:
 MT EMERALD WIND FARM REVISED A-WEIGHTED NOISE ASSESSMENT Rp 002 R01 2015545ML 30 January 2017 6 Gipps Street Collingwood VIC 3066 Australia T: +613 9416 1855 ABN: 53 470 077 191 www.marshallday.com Project:
Influence of wind direction on noise emission and propagation from wind turbines
 Influence of wind direction on noise emission and propagation from wind turbines Tom Evans and Jonathan Cooper Resonate Acoustics, 97 Carrington Street, Adelaide, South Australia 5000 ABSTRACT Noise predictions
Wind turbine noise at neighbor dwellings, comparing calculations and measurements
 Wind turbine noise at neighbor dwellings, comparing calculations and measurements Rune EGEDAL 1 ; Morten Bording HANSEN 2 ; Lars Sommer SØNDERGAARD 3 1, 2, 3 DELTA a part of FORCE Technology, Aarhus Denmark
Ambient Sound Survey of the Blue Creek Wind Farm Project Area
 MEMORANDUM Ambient Sound Survey of the Blue Creek Wind Farm Proect Area TO: FROM: Heartland Wind, LLC Blue Creek Wind Farm Proect Team Mark Bastasch, P.E./CH2M HILL DATE: April 30, 2010 Summary This memorandum
MICROPHONE WIND SPEED LIMITS DURING WIND FARM NOISE MEASUREMENTS
 MICROPHONE WIND SPEED LIMITS DURING WIND FARM NOISE MEASUREMENTS Abstract Jon Cooper 1 and Tom Evans 2 1 Resonate Acoustics, Level 1/23 Peel St, Adelaide SA 5000, Australia Email: jon.cooper@resonateacoustics.com
TABLE OF CONTENTS EXECUTIVE SUMMARY THE PROJECT INTRODUCTION SITE DESCRIPTION NOISE SENSITIVE RECEPTORS...
 VALCOUSTICS CANADA LTD. File: 115-0395 2025 Guelph Line/Burlington Noise TABLE OF CONTENTS EXECUTIVE SUMMARY...1 1.0 THE PROJECT...1 1.1 INTRODUCTION...1 1.2 SITE DESCRIPTION...2 2.0 NOISE SENSITIVE RECEPTORS...2
8 SHADOW FLICKER 8.1 INTRODUCTION 8.2 RECEIVING ENVIRONMENT
 QS-000169-02-R460-003 Assessment Report of Phase 1 and Phase 2 8 SHADOW FLICKER 8.1 INTRODUCTION A shadow flicker assessment has been undertaken for the Phase 1 and Phase 2 only part of the development
Wind shear and its effect on wind turbine noise assessment Report by David McLaughlin MIOA, of SgurrEnergy
 Wind shear and its effect on wind turbine noise assessment Report by David McLaughlin MIOA, of SgurrEnergy Motivation Wind shear is widely misunderstood in the context of noise assessments. Bowdler et
Pre Feasibility Study Report Citiwater Cleveland Bay Purification Plant
 SOLAR POWER SPECIALISTS.Pure Power ACN 074 127 718 ABN 85 074 127 718 POWER MAGIC PTY LTD 245 INGHAM RD GARBUTT QLD 4814 Phone: 1800 068 977 Fax: 07 4725 2479 Email: FNQSOLAR@bigpond.com Pre Feasibility
Lely Aircon LA30 Wind turbine
 Lely Aircon LA30 Wind turbine Summary Details for Performance, Duration and Acoustic Measurements Lely Aircon 30 Wind Turbine UK MCS Certification Summary List of contents 1. List of included Amendments...
A review of Australian wind farm noise assessment procedures
 Proceedings of ACOUSTICS 2016 9-11 November 2016, Brisbane, Australia A review of Australian wind farm noise assessment procedures Tom Evans 1 and Jon Cooper 2 1 Resonate Acoustics, Level 4, 10 Yarra Street,
Intertek Test Report No CRT-003 Project No. G
 3933 US Route 11 Cortland, NY 13045 Telephone: (607) 753-6711 Facsimile: (607) 753-1045 www.intertek.com Intertek Project No. G100413407 Mr. Steve Turek Phone: 952-447-6064 Wind Turbine Industries, Corporation
Test Summary Report Giraffe 2.0 Hybrid Wind-Solar Power Station - for wind: according to IEC Annex M - for solar: measurement report
 Contact person Tanja Tränkle 2016-06-29 4P05805-R01 rev. 1 1 (7) Safety +46 10 516 57 19 Tanja.Trankle@sp.se Innoventum AB Morgan Widung / Marcus Ulmefors Turning Torso office 275 Lilla Varvsgatan 14 211
Carondelet High School Athletic Fields. Walnut Creek, CA
 Attachment 9 Walnut Creek, CA 29 September 2016 Prepared for: Jason White BKF Engineers 1646 North California Boulevard, Suite 400 Walnut Creek, CA 94596 Email: jwhite@bkf.com Prepared by: Charles M. Salter
Boherkill gravel pit restoration project
 NOISE IMPACT ASSESSMENT Boherkill gravel pit restoration project FITZSIMONS WALSH ENVIRONMENTAL LIMITED Noise Impact Assessment Report prepared by Oliver Fitzsimons MSc. BSc. Noise Impact Assessment 2
Operating Manual for the Evance Iskra R9000 Wind Turbine
 L3 CS-01 Operating Manual Operating Manual for the Evance Iskra R9000 Wind Turbine //Level 3 Procedures/L3-CS-01 Operating Manual Date of Issue : 8 th December 2009 Page 1 of 13 Description Author Checked
Wind Project Siting & Resource Assessment
 Wind Project Siting & Resource Assessment David DeLuca, Project Manager AWS Truewind, LLC 463 New Karner Road Albany, NY 12205 ddeluca@awstruewind.com www.awstruewind.com AWS Truewind - Overview Industry
Global Flow Solutions Mark Zagar, Cheng Hu-Hu, Yavor Hristov, Søren Holm Mogensen, Line Gulstad Vestas Wind & Site Competence Centre, Technology R&D
 Global Flow Solutions Mark Zagar, Cheng Hu-Hu, Yavor Hristov, Søren Holm Mogensen, Line Gulstad Vestas Wind & Site Competence Centre, Technology R&D vestas.com Outline The atmospheric modeling capabilities
DETERMINATION OF SOUND POWER LEVEL OF A TRANSFORMER
 DETERMINATION OF SOUND POWER LEVEL OF A TRANSFORMER Prepared for: McLean s Mountain Wind GP Inc. 30 St. Clair Avenue West, 12 th Floor Toronto, ON M4V 3A1 November 20, 2014 1 INTRODUCTION HGC Engineering
V MW Versatile megawattage
 V80-1.8 MW Versatile megawattage This system features microprocessors that rotate the blades around their longitudinal axes, thus ensuring continuous adjustment to maintain optimal blade angles in relation
Start-up, Shutdown and Malfunction Plans. Norman L. Morrow Fresh Air Consulting
 Start-up, Shutdown and Malfunction Plans Norman L. Morrow Disclaimer This presentation provides a summary of some SS&M provisions and is not a complete description. Refer to the current Code of Federal
6th International Meeting
 6th International Meeting on Wind Turbine Noise Glasgow 20-13 April 2015 Noise from wind turbines and health effects - Investigation of wind turbine noise spectra Lars Sommer Søndergaard DELTA Acoustics,
ESB TONAL NOISE ASSESSMENT. 30 May West Offaly Power Station. Report Author: Stephen Kearney
 Allegro Acoustics Limited, Unit 2A Riverside, Tallaght Business Park, Tallaght, Dublin 24 Tel/Fax: +353 (0) 1 4140485 ESB West Offaly Power Station TONAL NOISE ASSESSMENT 30 May 2016 Report Author: Stephen
Radiation characteristics of noise generated from a wind turbine
 Acoust. Sci. & Tech. 36, 5 (15) PAPER #15 The Acoustical Society of Japan Radiation characteristics of noise generated from a wind turbine Yasuaki Okada 1;, Koichi Yoshihisa 1;y, Kazuki Higashi 2;z and
Title: Standard Operating Procedure for R&R Environmental Devices Model MFC201 Gas Dilution Calibrator
 Procedure No: SOP-029 Revision No: 1.1 (December 29, 2010) Page No.: 1 of 7 1. INTRODUCTION AND SCOPE To obtain timely data for the purpose of air quality assessment, air quality trend reporting, air quality
Melancthon Pits Extension Noise Study Part of West Half of Lots 12 and 14, Concession 3 O.S. Township of Melancthon, County of Dufferin
 NOISE IMPACT STUDY - Project: 16099 Melancthon Pits Extension Noise Study Part of West Half of Lots 12 and 14, Concession 3 O.S. Township of Melancthon, County of Dufferin Prepared for: MHBC Planning c/o
Outside Air Nonresidential HVAC Stakeholder Meeting #2 California Statewide Utility Codes and Standards Program
 1 Outside Air Nonresidential HVAC Stakeholder Meeting #2 California Statewide Utility Codes and Standards Program Jim Meacham, CTG Energetics Agenda 2 In Situ Testing Results Reduced Ventilation after
INSTRUCTION MANUAL. Microphone Type 4966 for Hand held Analyzer Types 2250, 2250 L and Supplement to Instruction Manual BE 1712
 INSTRUCTION MANUAL Microphone Type 4966 for Hand held Analyzer Types 2250, 2250 L and 2270 Supplement to Instruction Manual BE 1712 BE 1897 11 English Microphone Type 4966 for Hand-held Analyzer Types
Wind tunnel acoustic testing of wind generated noise on building facade elements
 See discussions, stats, and author profiles for this publication at: https://www.researchgate.net/publication/307638896 Wind tunnel acoustic testing of wind generated noise on building facade elements
Criteria for wind farm noise: Lmax and Lden
 Criteria for wind farm noise: Lmax and Lden F. Van Den Berg University of Groningen - Science & Society Group, Nijenborgh 4, 9747AG Groningen, Netherlands fvdberg@ggd.amsterdam.nl 4043 Wind turbine noise
Wind Turbine Noise Measurements How are Results influenced by different Methods of deriving Wind Speeds? Sylvia Broneske
 INTERNOISE 2014 16 19 November in Melbourne, Australia Wind Turbine Noise Measurements How are Results influenced by different Methods of deriving Wind Speeds? Sylvia Broneske Hayes McKenzie Partnership
Description of Underwater Noise Attenuation System Design Unit 2. New NY Bridge Project
 New NY Bridge Project Description of Underwater Noise Attenuation System (NAS) Design Unit 2 Description of Underwater Noise Attenuation System Design Unit 2 for the New NY Bridge Project Revision 1 May
APPENDIX A
 APPENDIX A APPENDIX B Staff GIS Empey Hill Area West Legend 0 800 1600 2400 m. This map is a user generated static output from an Internet mapping site and is for general reference only.
British Wind Energy Association Small Wind Turbine Performance and Safety Standard 29 Feb 2008
 British Wind Energy Association Small Wind Turbine Performance and Safety Standard 29 Feb 2008 British Wind Energy Association Renewable Energy House 1 Aztec Row, Berners Road London, N1 0PW, UK Telephone:
Appendix 7. Wind and Comfort Impact Analysis
 Appendix 7 Wind and Comfort Impact Analysis Donald Ballanti Consulting Meteorologist 1424 Scott Street El Cerrito, CA 94530 (510) 234-6087 Abe Leider Rincon Consultants 449 15th Street, Suite 303 Oakland,
COLLECTOR WIND FARM SHADOW FLICKER ASSESSMENT
 COLLECTOR WIND FARM SHADOW FLICKER ASSESSMENT Prepared by: Terry Johannesen (BEng, RPEQ) 1. INTRODUCTION This report discusses the shadow flicker phenomenon and presents an assessment of the associated
San Francisco. Short Term Aircraft Noise Monitoring
 Short Term Aircraft Noise Monitoring San Francisco Prepared for the Visitacion Valley Neighborhood Noise Abatement Office P.O. Box 8097 San Francisco, CA 94128 (650) 821 5100 Technical Report #072016 P51
COMPARISON OF DEEP-WATER ADCP AND NDBC BUOY MEASUREMENTS TO HINDCAST PARAMETERS. William R. Dally and Daniel A. Osiecki
 COMPARISON OF DEEP-WATER ADCP AND NDBC BUOY MEASUREMENTS TO HINDCAST PARAMETERS William R. Dally and Daniel A. Osiecki Surfbreak Engineering Sciences, Inc. 207 Surf Road Melbourne Beach, Florida, 32951
Torrild - WindSIM Case study
 Torrild - WindSIM Case study Note: This study differs from the other case studies in format, while here another model; WindSIM is tested as alternative to the WAsP model. Therefore this case should be
Noise from wind turbines under non-standard conditions
 Noise from wind turbines under non-standard conditions Lars S. Søndergaard a) DELTA Acoustics Agro Food Park 13, 8200 Aarhus N, Denmark Noise prediction for wind turbines and wind farms are often based
Assembly Committee Document 7.5
 Assembly Committee Document 7.5 Proposed Section 21.07.130C., Tall Buildings, amending and replacing the Tall Buildings section content as it appeared in Assembly Document 7.4.A. May 6, 2010 C. Tall Buildings
Currents measurements in the coast of Montevideo, Uruguay
 Currents measurements in the coast of Montevideo, Uruguay M. Fossati, D. Bellón, E. Lorenzo & I. Piedra-Cueva Fluid Mechanics and Environmental Engineering Institute (IMFIA), School of Engineering, Research
WIND DATA REPORT. Swan s Island, ME
 WIND DATA REPORT Swan s Island, ME June 1, 2009 August 31, 2009 Prepared for US Department of Energy by Daniel T. Grip Utama Abdulwahid James F. Manwell Anthony F. Ellis September 17, 2009 Report template
Analyses of the mechanisms of amplitude modulation of aero-acoustic wind turbine sound
 Analyses of the mechanisms of amplitude modulation of aero-acoustic wind turbine sound Andreas Fischer Helge Aagaard Madsen Knud Abildgaard Kragh Franck Bertagnolio DTU Wind Energy Technical University
Wind Turbine Generator System Pika T701 Acoustic Test Report
 Wind Turbine Generator System Pika T701 Acoustic Test Report Conducted by High Plains Small Wind Test Center Colby, KS November 10, 2015 Approval By: Ruth Douglas Miller, Lead Engineer, Date Review By:
VISUAL AIDS FOR DENOTING OBSTACLES
 CHAPTER 6. VISUAL AIDS FOR DENOTING OBSTACLES 6.1 Objects to be marked and/or lighted Note. The marking and/or lighting of obstacles is intended to reduce hazards to aircraft by indicating the presence
VINDKRAFTNET MEETING ON TURBULENCE
 VINDKRAFTNET MEETING ON TURBULENCE On-going Work on Wake Turbulence in DONG Energy 28/05/2015 Cameron Brown Load Engineer Lucas Marion R&D graduate Who are we? Cameron Brown Load Engineer from Loads Aerodynamics
MIL-STD-883G METHOD
 STEADY-STATE LIFE 1. PURPOSE. The steady-state life test is performed for the purpose of demonstrating the quality or reliability of devices subjected to the specified conditions over an extended time
Increased Project Bankability : Thailand's First Ground-Based LiDAR Wind Measurement Campaign
 Increased Project Bankability : Thailand's First Ground-Based LiDAR Wind Measurement Campaign Authors: Velmurugan. k, Durga Bhavani, Ram kumar. B, Karim Fahssis As wind turbines size continue to grow with
When Is Wind Speed Excessive for the Safe Display of Fireworks?
 An earlier version appeared in Fireworks Business, No. 248, 2004. When Is Wind Speed Excessive for the Safe Display of Fireworks? K. L. and B. J. Kosanke While working on the 2006 edition of NFPA- 1123
ABNORMALLY HIGH STORM WAVES OBSERVED ON THE EAST COAST OF KOREA
 ABNORMALLY HIGH STORM WAVES OBSERVED ON THE EAST COAST OF KOREA WEON MU JEONG 1 ; SANG-HO OH ; DONGYOUNG LEE 3 ; KYUNG-HO RYU 1 Coastal Engineering Research Department, Korea Ocean Research and Development
LIDAR Correlation to Extreme Flapwise Moment : Gust Impact Prediction Time and Feedforward Control
 Downloaded from orbit.dtu.dk on: Dec 20, 2017 LIDAR Correlation to Extreme Flapwise Moment : Gust Impact Prediction Time and Feedforward Control Meseguer Urban, Albert; Hansen, Morten Hartvig Publication
3D Turbulence at the Offshore Wind Farm Egmond aan Zee J.W. Wagenaar P.J. Eecen
 3D Turbulence at the Offshore Wind Farm Egmond aan Zee J.W. Wagenaar P.J. Eecen OWEZ_R_121_3Dturbulence_20101008 ECN-E--10-075 OCTOBER 2010 Abstract NoordzeeWind carries out an extensive measurement and
COMPARISON OF CONTEMPORANEOUS WAVE MEASUREMENTS WITH A SAAB WAVERADAR REX AND A DATAWELL DIRECTIONAL WAVERIDER BUOY
 COMPARISON OF CONTEMPORANEOUS WAVE MEASUREMENTS WITH A SAAB WAVERADAR REX AND A DATAWELL DIRECTIONAL WAVERIDER BUOY Scott Noreika, Mark Beardsley, Lulu Lodder, Sarah Brown and David Duncalf rpsmetocean.com
RESOLUTION MSC.235(82) (adopted on 1 December 2006) ADOPTION OF THE GUIDELINES FOR THE DESIGN AND CONSTRUCTION OF OFFSHORE SUPPLY VESSELS, 2006
 (adopted on 1 December 2006) ADOPTION OF THE GUIDELINES FOR THE DESIGN AND CONSTRUCTION OF OFFSHORE SUPPLY VESSELS, 2006") MSC 82/24/Add.2 RESOLUTION MSC.235(82) CONSTRUCTION OF OFFSHORE SUPPLY VESSELS, 2006 THE MARITIME SAFETY COMMITTEE, RECALLING Article 28(b) of the Convention on the International Maritime Organization
MSC 82/24/Add.2 RESOLUTION MSC.235(82) CONSTRUCTION OF OFFSHORE SUPPLY VESSELS, 2006 THE MARITIME SAFETY COMMITTEE, RECALLING Article 28(b) of the Convention on the International Maritime Organization
WIND DATA REPORT. Vinalhaven
 WIND DATA REPORT Vinalhaven January - December, 2003 Prepared for Fox Islands Electric Cooperative by Anthony L. Rogers May 12, 2004 Report template version 1.1 Renewable Energy Research Laboratory 160
Can Wind Energy Be Captured in New York City? Case Study on Urban Wind based on a Feasibility Study by Orange Line Studio. Spark 101 Educator Resource
 Can Wind Energy Be Captured in New York City? Case Study on Urban Wind based on a Feasibility Study by Orange Line Studio Spark 101 Educator Resource Copyright 2013 Defining Key Concepts What is wind power?
The Wind Resource: Prospecting for Good Sites
 The Wind Resource: Prospecting for Good Sites Bruce Bailey, President AWS Truewind, LLC 255 Fuller Road Albany, NY 12203 bbailey@awstruewind.com Talk Topics Causes of Wind Resource Impacts on Project Viability
WIND DATA REPORT. Bourne Water District
 WIND DATA REPORT Bourne Water District July to September 2010 Prepared for Massachusetts Clean Energy Center 55 Summer Street, 9th Floor Boston, MA 02110 by Dylan Chase James F. Manwell Utama Abdulwahid
Wind Power. Kevin Clifford METR 112 April 19, 2011
 Wind Power Kevin Clifford METR 112 April 19, 2011 Outline Introduction Wind Turbines Determining Wind Power Output The Price of Wind Power Wind Power Availability across the World and US California Wind
LiDAR Application to resource assessment and turbine control
 ENERGY LiDAR Application to resource assessment and turbine control Dr. Avishek Kumar The New Zealand Wind Energy Conference 13 th April 2016 1 SAFER, SMARTER, GREENER Agenda What is LiDAR? Remote Sensing
Wind Resource Assessment for NOME (ANVIL MOUNTAIN), ALASKA Date last modified: 5/22/06 Compiled by: Cliff Dolchok
, ALASKA Date last modified: 5/22/06 Compiled by: Cliff Dolchok") 813 W. Northern Lights Blvd. Anchorage, AK 99503 Phone: 907-269-3000 Fax: 907-269-3044 www.akenergyauthority.org SITE SUMMARY Wind Resource Assessment for NOME (ANVIL MOUNTAIN), ALASKA Date last modified:
813 W. Northern Lights Blvd. Anchorage, AK 99503 Phone: 907-269-3000 Fax: 907-269-3044 www.akenergyauthority.org SITE SUMMARY Wind Resource Assessment for NOME (ANVIL MOUNTAIN), ALASKA Date last modified:
At each type of conflict location, the risk is affected by certain parameters:
 TN001 April 2016 The separated cycleway options tool (SCOT) was developed to partially address some of the gaps identified in Stage 1 of the Cycling Network Guidance project relating to separated cycleways.
Vestas Cold Climate Solutions and next stepsclimate Offerings
 06-02-2018 Vestas Cold Climate Solutions and next stepsclimate Offerings Brian Daugbjerg Nielsen, Product Management Winterwind 2019 VESTAS COLD CLIMATE OFFERINGS FEATURING MODULAR ANTI-ICING ON ENVENTUS
Validation of Measurements from a ZephIR Lidar
 Validation of Measurements from a ZephIR Lidar Peter Argyle, Simon Watson CREST, Loughborough University, Loughborough, United Kingdom p.argyle@lboro.ac.uk INTRODUCTION Wind farm construction projects
Site Assessment Report. Wind farm: Ascog Farm (GB)
") Site Assessment Report Energy Yield Estimation Wind farm: (GB) 3 x E- kw with 5m hh Imprint Publisher Copyright notice ENERCON GmbH 5 Aurich Germany Phone: +9 91 97- Fax: +9 91 97-19 E-mail: info@enercon.de
Site Assessment Report Energy Yield Estimation Wind farm: (GB) 3 x E- kw with 5m hh Imprint Publisher Copyright notice ENERCON GmbH 5 Aurich Germany Phone: +9 91 97- Fax: +9 91 97-19 E-mail: info@enercon.de
3D Nacelle Mounted Lidar in Complex Terrain
 ENERGY 3D Nacelle Mounted Lidar in Complex Terrain PCWG Hamburg, Germany Paul Lawson 25.03.2015 1 DNV GL 125.03.2015 SAFER, SMARTER, GREENER Agenda Introduction and Project Background Lidar Specifications
Donald Ballanti, Certified Consulting Meteorologist, Wind Impact Evaluation for the Menlo Park Facebook Campus Project, August 26, 2011.
 3.4 WIND Introduction This section describes wind conditions in the Project area and at the Project site. This section provides a general discussion of the relationship between building design and wind
inter.noise 2000 The 29th International Congress and Exhibition on Noise Control Engineering August 2000, Nice, FRANCE
 Copyright SFA - InterNoise 2000 1 inter.noise 2000 The 29th International Congress and Exhibition on Noise Control Engineering 27-30 August 2000, Nice, FRANCE I-INCE Classification: 4.5 THE PROPAGATION
CADWELL INDUSTRIES, INC. TEST REPORT FOR THE ELECTRONEURODIAGNOSTIC MONITORING SYSTEM, EASY WIRELESS EEG
 TESTING CERT #803.01, 803.02, 803.05, 803.06 CADWELL INDUSTRIES, INC. TEST REPORT FOR THE ELECTRONEURODIAGNOSTIC MONITORING SYSTEM, EASY WIRELESS EEG FCC PART 15 SUBPART B SECTIONS 15.107 AND 15.109 CLASS
Strategic Advice about Floating LiDAR Campaigns. Borssele offshore wind farm
 Strategic Advice about Floating LiDAR Campaigns Borssele offshore wind farm Strategic Advice about Floating LiDAR Campaigns Borssele offshore wind farm Project number: ESMWT16419 Prepared: Dhruv Dhirendra
MORE THAN ONE INSERTION LOSS, THROUGHOUT THE DAY, FOR THE SAME OUTDOOR NOISE BARRIER
 MORE THAN ONE INSERTION LOSS, THROUGHOUT THE DAY, FOR THE SAME OUTDOOR NOISE BARRIER Vitor Rosão e Eusébio Conceição Faculdade de Ciências e Tecnologia, Universidade do Algarve, Campus de Gambelas, 8005-139,
Underwater noise and offshore windfarms
 Underwater noise and offshore windfarms Dr Jeremy Nedwell, Mr John Langworthy and Mr Daren Howell BWEA Conference 4/3/04 Subacoustech reference: 544R0503, COWRIE Copyright. Aim of study To evaluate the
Testing and Validation of the Triton Sodar
 Testing and Validation of the Triton Sodar September 24, 2008 AWEA Resource Assessment Workshop Ron Nierenberg, Consulting Meteorologist Liz Walls, Second Wind Inc. Ron Consulting Nierenberg Meteorologist
Final Bull Trout Redd Monitoring Report for the Wallowa Falls Hydroelectric Project
 Final for the Wallowa Falls Hydroelectric Project East Fork Wallowa River barrier to upstream fish migration, photo courtesy of Kendrick Moholt (FERC No. P-308) December 18, 2017 Prepared by: Jeremiah
E. Agu, M. Kasperski Ruhr-University Bochum Department of Civil and Environmental Engineering Sciences
 EACWE 5 Florence, Italy 19 th 23 rd July 29 Flying Sphere image Museo Ideale L. Da Vinci Chasing gust fronts - wind measurements at the airport Munich, Germany E. Agu, M. Kasperski Ruhr-University Bochum
Near-Field Sturgeon Monitoring for the New NY Bridge at Tappan Zee. Quarterly Report July 1 September 30, 2014
 Near-Field Sturgeon Monitoring for the New NY Bridge at Tappan Zee Quarterly Report July 1 September 30, 2014 Prepared by AKRF, Inc. 7250 Parkway Drive, Suite 210 Hanover, MD 21076 for New York State Thruway
Site Summary. Wind Resource Summary. Wind Resource Assessment For King Cove Date Last Modified: 8/6/2013 By: Rich Stromberg & Holly Ganser
 Site Summary Wind Resource Assessment For King Cove Date Last Modified: 8/6/2013 By: Rich Stromberg & Holly Ganser Station ID: 2857 Latitude: 55 7 45.8 N Longitude: 162 16 10.6 W Tower Type: 30 m NRG Tall
Control Strategies for operation of pitch regulated turbines above cut-out wind speeds
 Control Strategies for operation of pitch regulated turbines above cut-out wind speeds Helen Markou 1 Denmark and Torben J. Larsen, Risø-DTU, P.O.box 49, DK-4000 Roskilde, Abstract The importance of continuing
Dick Bowdler Acoustic Consultant
 Dick Bowdler Acoustic Consultant 01383 882 644 077 8535 2534 dick@dickbowdler.co.uk WIND SHEAR AND ITS EFFECT ON NOISE ASSESSMENT OF WIND TURBINES June 2009 The Haven, Low Causeway, Culross, Fife. KY12
Janek LAANEARU and Aleksander KLAUSON Department of Mechanics, Tallinn University of Technology
 seminar in Tallinn, 5.01.013 PRINCIPAL UNDERWATER NOISE SOURCES IN BALTIC SEA AND METRICS USED IN NOISE LEVEL ASSESSMENT Janek LAANEARU and Aleksander KLAUSON Department of Mechanics, Tallinn University
TOPICS TO BE COVERED
 UNIT-3 WIND POWER TOPICS TO BE COVERED 3.1 Growth of wind power in India 3.2 Types of wind turbines Vertical axis wind turbines (VAWT) and horizontal axis wind turbines (HAWT) 3.3 Types of HAWTs drag and
ITTC Recommended Procedures and Guidelines
 Page 1 of 6 Table of Contents 1. PURPOSE...2 2. PARAMETERS...2 2.1 General Considerations...2 3 DESCRIPTION OF PROCEDURE...2 3.1 Model Design and Construction...2 3.2 Measurements...3 3.5 Execution of
Wake Effects from Wind Turbines
 Wake Effects from Wind Turbines Brian Wareing Brian Wareing.Tech Ltd Chester, UK Secretary WG28 Meteorology for overhead lines Wind power Over 70GW installed capacity of wind power world-wide Europe is
POWER Quantifying Correction Curve Uncertainty Through Empirical Methods
 Proceedings of the ASME 2014 Power Conference POWER2014 July 28-31, 2014, Baltimore, Maryland, USA POWER2014-32187 Quantifying Correction Curve Uncertainty Through Empirical Methods ABSTRACT Christopher
Aalborg Universitet. Published in: Proceedings of Offshore Wind 2007 Conference & Exhibition. Publication date: 2007
 Aalborg Universitet Design Loads on Platforms on Offshore wind Turbine Foundations with Respect to Vertical Wave Run-up Damsgaard, Mathilde L.; Gravesen, Helge; Andersen, Thomas Lykke Published in: Proceedings
Wind Resource Assessment for FALSE PASS, ALASKA Site # 2399 Date last modified: 7/20/2005 Prepared by: Mia Devine
 813 W. Northern Lights Blvd. Anchorage, AK 99503 Phone: 907-269-3000 Fax: 907-269-3044 www.aidea.org/wind.htm Wind Resource Assessment for FALSE PASS, ALASKA Site # 2399 Date last modified: 7/20/2005 Prepared
Interim Guidance Fish Presence Absence
 Interim Guidance Fish Presence Absence Source: Forest Practices Act Guidance for Division 635 of the forest practices act dealing with stream classification when no fish surveys have been done (referenced
Tutorial for the. Total Vertical Uncertainty Analysis Tool in NaviModel3
 Tutorial for the Total Vertical Uncertainty Analysis Tool in NaviModel3 May, 2011 1. Introduction The Total Vertical Uncertainty Analysis Tool in NaviModel3 has been designed to facilitate a determination
OBJECTIVE 6: FIELD RADIOLOGICAL MONITORING - AMBIENT RADIATION MONITORING
 OBJECTIVE 6: FIELD RADIOLOGICAL MONITORING - AMBIENT RADIATION MONITORING OBJECTIVE Demonstrate the appropriate use of equipment and procedures for determining field radiation measurements. INTENT This
PROJECT CYCLOPS: THE WAY FORWARD IN POWER CURVE MEASUREMENTS?
 Title Authors: Organisation PROJECT CYCLOPS: THE WAY FORWARD IN POWER CURVE MEASUREMENTS? Simon Feeney(1), Alan Derrick(1), Alastair Oram(1), Iain Campbell(1), Gail Hutton(1), Greg Powles(1), Chris Slinger(2),
Atmospheric Stability Affects Wind Turbine Performance and Wake Effect
 Atmospheric Stability Affects Wind Turbine Performance and Wake Effect Hong Liu, John Liu*, Gus DiMaria and Jon Fournier CanWEA Annual Conference and Exhibition, October 23-25, 2018, Calgary, AB *York
TOWN OF WILMINGTON DEVELOPMENT REVIEW BOARD FINDINGS OF FACT AND STATEMENT OF FINDINGS WILMINGTON, VERMONT 05363
 TOWN OF WILMINGTON DEVELOPMENT REVIEW BOARD FINDINGS OF FACT AND STATEMENT OF FINDINGS WILMINGTON, VERMONT 05363 A request for a permit was made to the Board by: Christina Cullen & Christopher Adams Owner/Applicant(s)
Citation Journal of Thermal Science, 18(4),
,") NAOSITE: Nagasaki University's Ac Title Author(s) Noise characteristics of centrifuga diffuser (Noise reduction by means leading tip) Murakami, Tengen; Ishida, Masahiro; Citation Journal of Thermal Science,
NAOSITE: Nagasaki University's Ac Title Author(s) Noise characteristics of centrifuga diffuser (Noise reduction by means leading tip) Murakami, Tengen; Ishida, Masahiro; Citation Journal of Thermal Science,
EASA/FAA Significant Standard Differences (SSD) Technical Implementation Procedures (TIP) - Turbine Engines -
 Technical Implementation Procedures (TIP) - Turbine Engines -") European Aviation Safety Agency SSD # EASA/FAA Significant Standard Differences (SSD) Technical Implementation Procedures (TIP) - Turbine Engines - TIP Rev SSD Issue & Date Standard Amendment Pairs (1)
European Aviation Safety Agency SSD # EASA/FAA Significant Standard Differences (SSD) Technical Implementation Procedures (TIP) - Turbine Engines - TIP Rev SSD Issue & Date Standard Amendment Pairs (1)
Uncertainties in Environmental Noise Assessments ISO 1996, Effects of Instrument Class and Residual Sound
 Uncertainties in Environmental Noise Assessments ISO 1996, Effects of Instrument Class and Residual Sound Douglas Manvell, Erik Aflalo Brüel & Kjær Sound & Vibration A/S, Skodsborgvej 307, DK-2850 Nærum,
2005 CERTIFICATE OF ACCEPTANCE (Part 1 of 3) MECH-1-A
 MECH-1-A") 2005 CERTIFICATE OF ACCEPTANCE (Part 1 of 3) MECH-1-A PROJECT ADDRESS TESTING AUTHORITY TELEPHONE Checked by/date Enforcement Agency Use GENERAL INFORMATION OF BLDG. PERMIT PERMIT # BLDG. CONDITIONED FLOOR
2005 CERTIFICATE OF ACCEPTANCE (Part 1 of 3) MECH-1-A PROJECT ADDRESS TESTING AUTHORITY TELEPHONE Checked by/date Enforcement Agency Use GENERAL INFORMATION OF BLDG. PERMIT PERMIT # BLDG. CONDITIONED FLOOR