Steeple Road Industrial Estate Antrim Northern Ireland BT41 1AB
|
|
|
- Spencer Lyons
- 5 years ago
- Views:
Transcription
1 Investigation into the in situ thermal performance of 2 static caravans - Assessing the change in heat loss behaviour due to thermally superior replacement windows. Client: Researchers: Site Address: Camden Group Steeple Road Industrial Estate Antrim Northern Ireland BT41 1AB Dominic Miles-Shenton, David Farmer, Prof. David Johnston CeBE Group Leeds Sustainability Institute Leeds Beckett University Enterprises Ltd Leeds LS2 9EN Units C05 & C10, Holly Bank Blue Dolphin Holiday Park Filey North Yorkshire YO14 9PU April, 2015 Leeds Sustainability Institute 1
2 Table of Contents Introduction... 3 Thermal Imaging... 4 Method... 4 Discussion... 4 Airtightness... 7 Method... 7 Results... 7 Air leakage paths... 7 Actual ventilation rate Coheating Tests Method Results Caravan C Caravan C Coheating test summary and conclusions In situ U-value Measurement Method Results Conclusions Summary Bibliography Appendix 1 - Blower door spread sheets Appendix 2 - Images 16-Mar Appendix 3 - Images 18-Mar Appendix 4 - Images 20-Mar Leeds Sustainability Institute 2
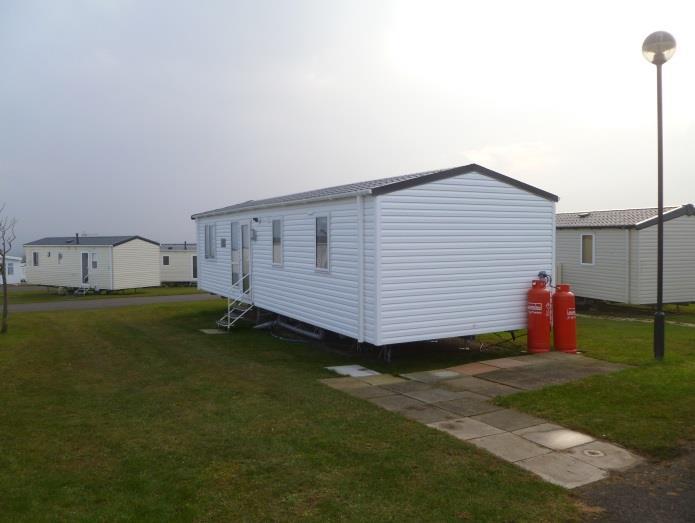
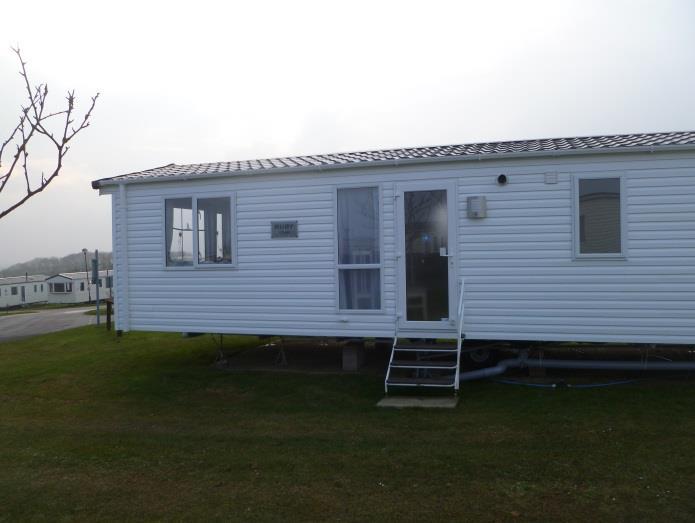
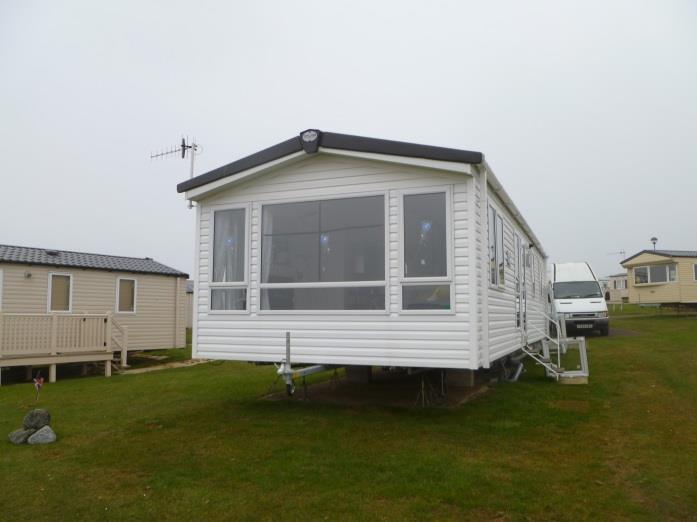
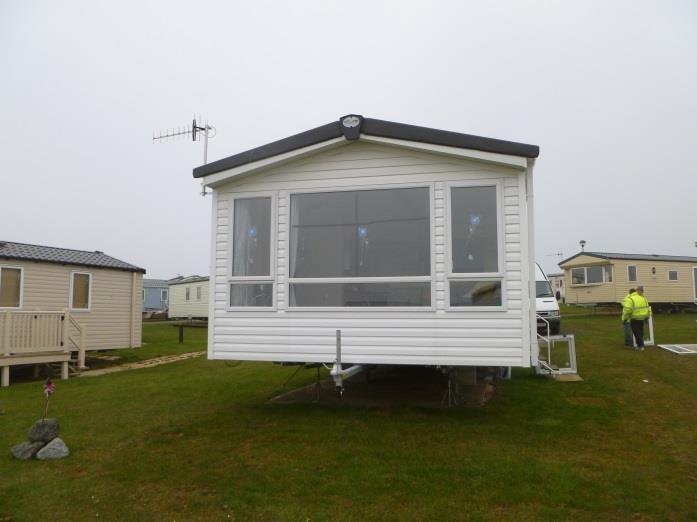
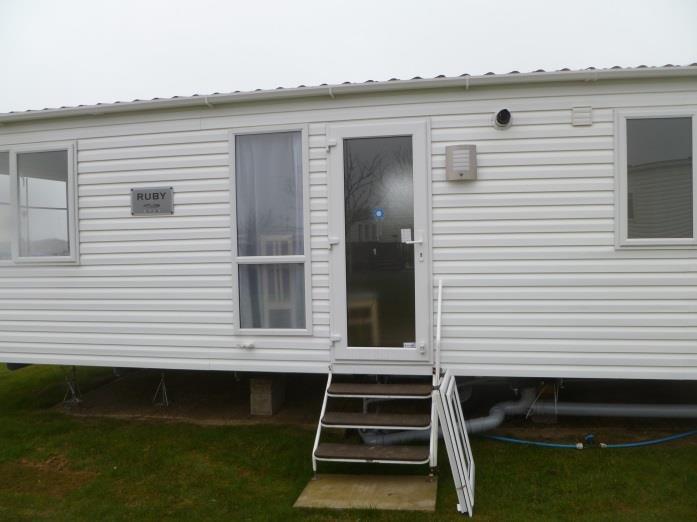
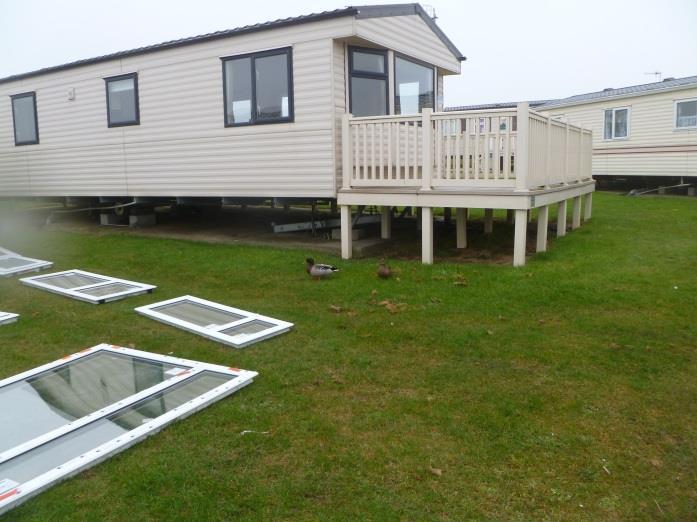
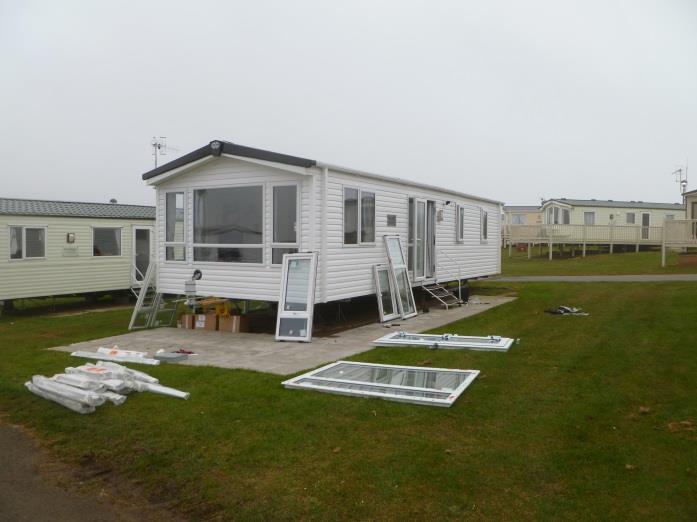
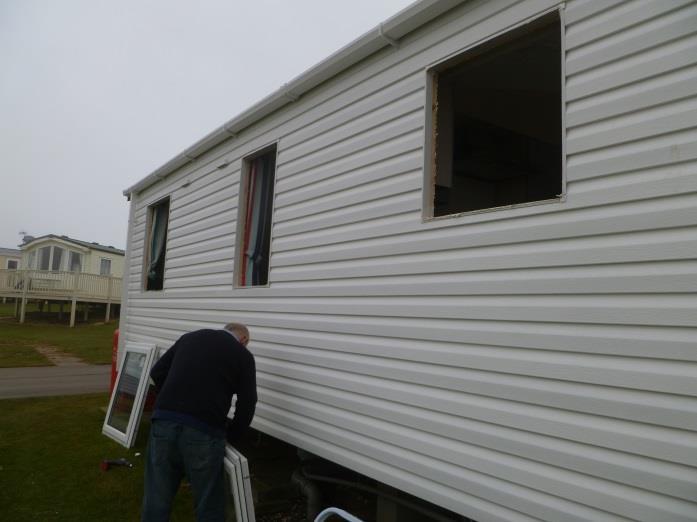
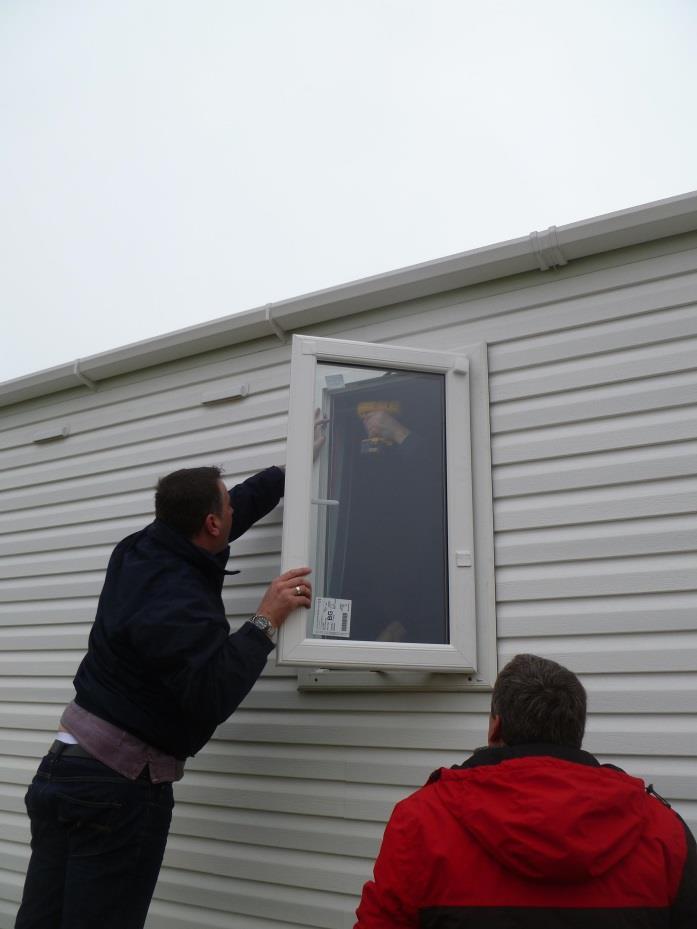
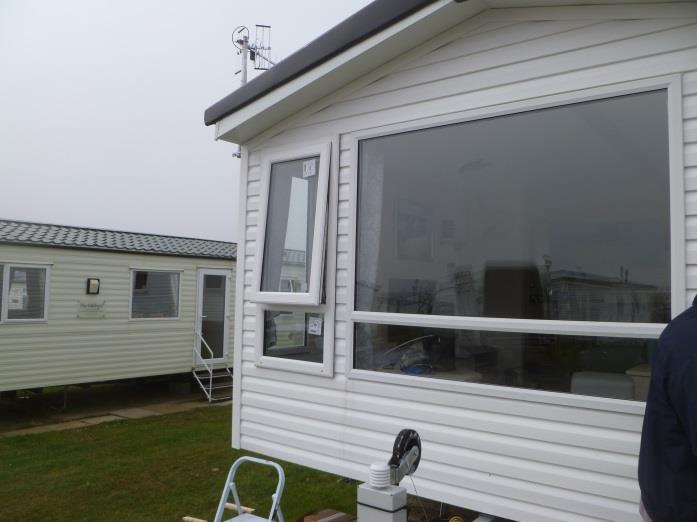
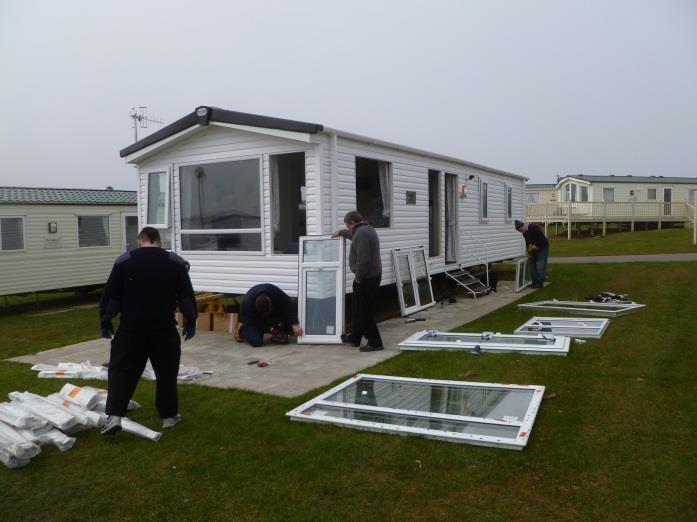
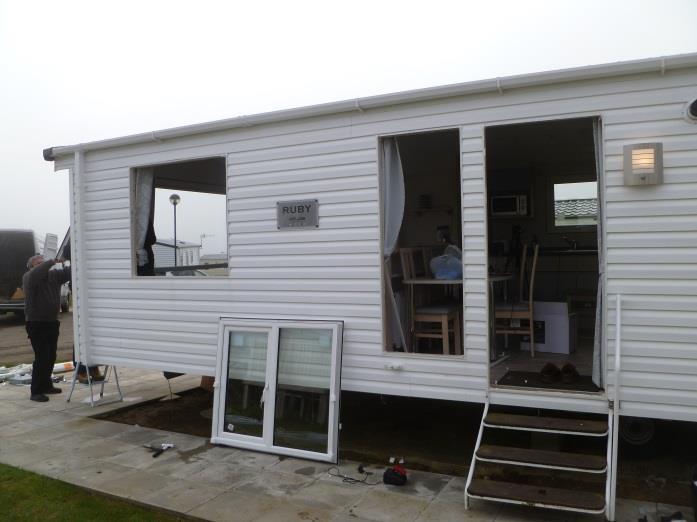
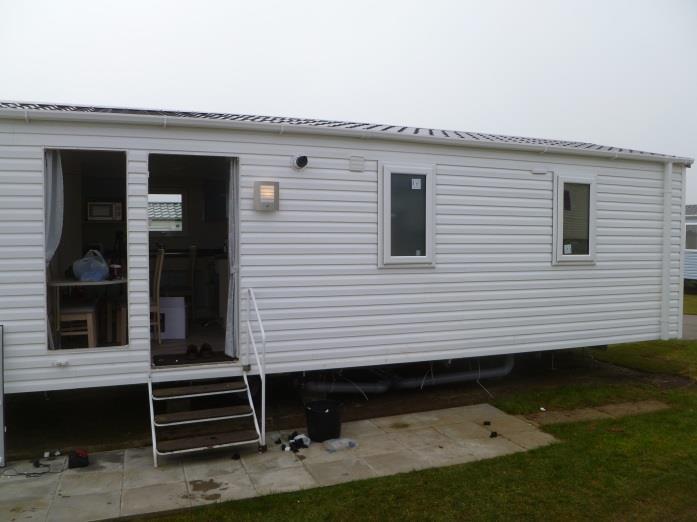
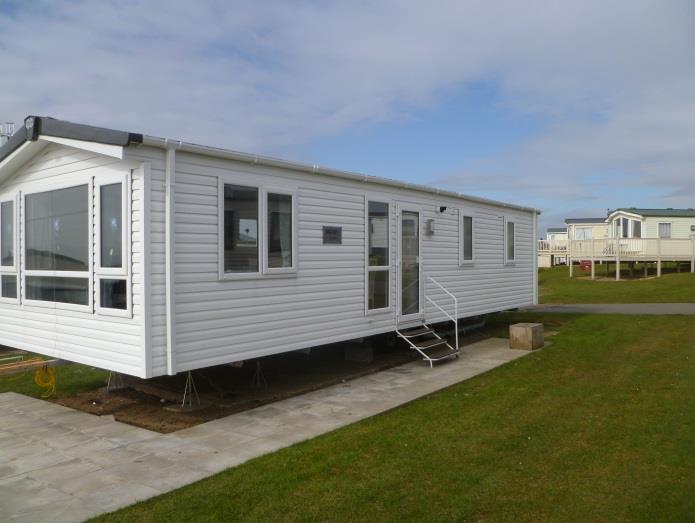
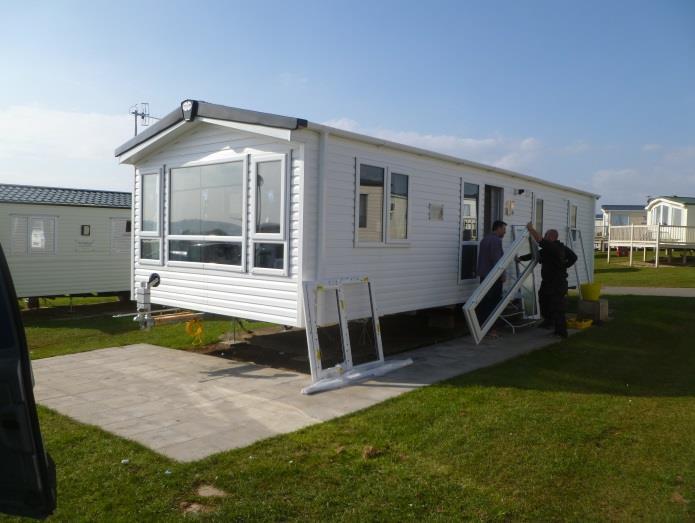
3 Introduction The purpose of this investigation is to assess the in situ thermal performance of upgraded replacement windows and door installed into a static caravan located at the Blue Dolphin Holiday Park, Filey, North Yorkshire. Two static caravans were supplied by Camden Group to the research team within the Centre for the Built Environment (CeBE) Group at Leeds Beckett University for an initial 1 week period. One caravan (Unit 10) was to be tested over the entire period as a control, with no interventions made to the van; the second van (Unit C05) was due to be tested for 2 nights in its original state followed by a further 2 nights with its original windows and door replaced with higher specification replacements. Supply issues with the door resulted in this test programme being extended and a 3-stage test being performed. Details of the tests are outlined below in Table 1. Table 1: Test Programme Date 16-Mar Mar Mar Mar-2015 Action Install & set-up test equipment Initial airtightness tests Commence coheating stage 1 Replacement of windows in Unit C05 Thermal imaging Airtightness test of C05 with replacement windows Download coheating stage 1 data Commence coheating stage 2 Replacement of door in Unit C05 Thermal imaging Airtightness test of C05 with replacement door Download coheating stage 2 data Commence coheating stage 3 Download coheating stage 3 data Uninstall test equipment During the test period measurements of the internal and external temperatures were recorded, along with the power consumption required to maintain that temperature difference. These measurements enabled a metric for the whole caravan heat loss to be determined, namely the heat loss coefficient (HLC) in W/K. Additionally, the heat flow through a number of different fabric elements (glazed elements, roof, walls and floor) was also measured in W/m 2. The value of undertaking both sets of measurements is that a comparison can be made between the two datasets. Consequently, any changes in performance pre- and post-intervention should be reflected in both sets of measurements (power consumption and aggregate elemental heat flow), thus providing a degree of cross-validation between the two sets of results obtained. Leeds Sustainability Institute 3


 prior to any other access being gained to the caravan that morning.")
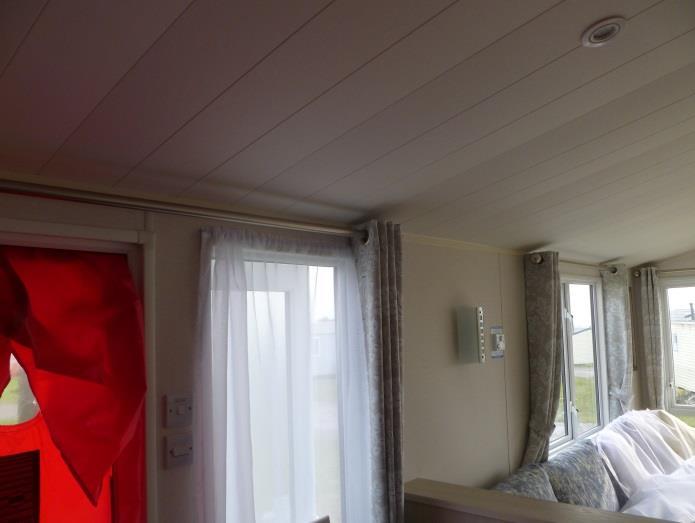
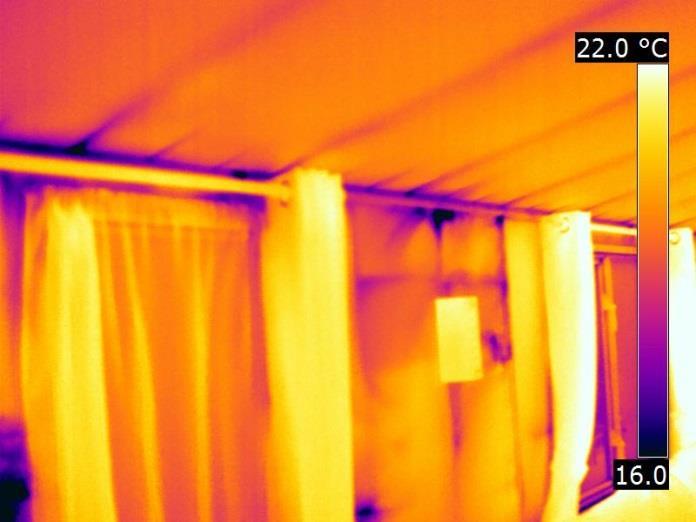
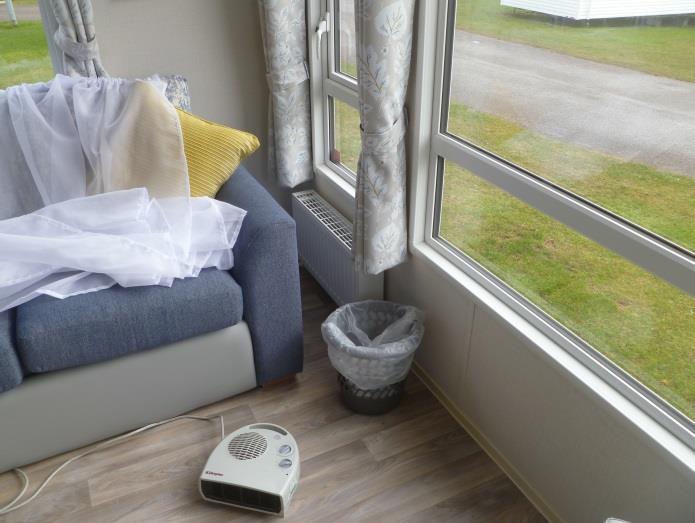
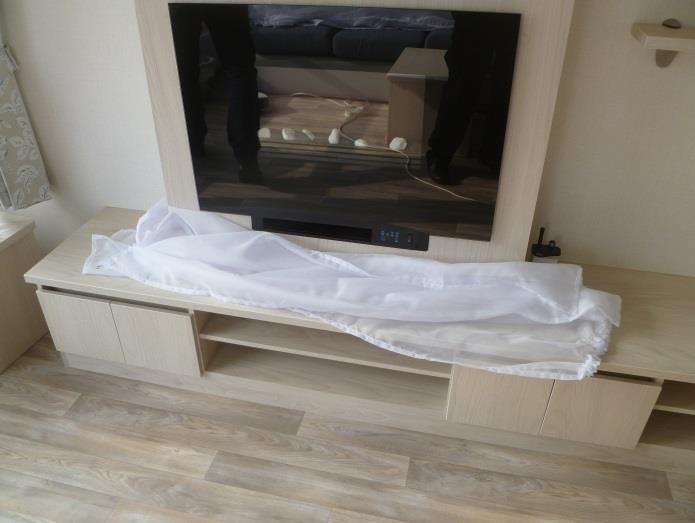
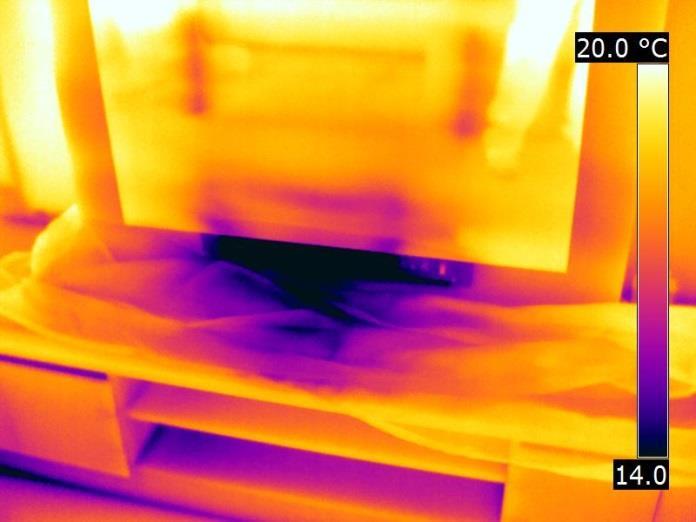
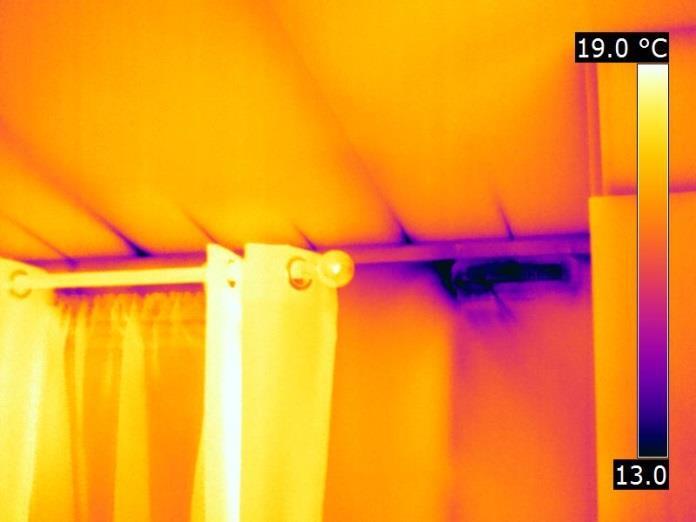
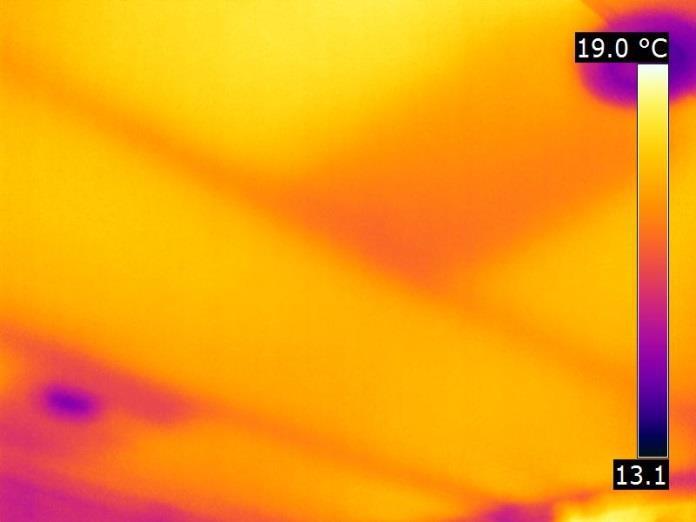
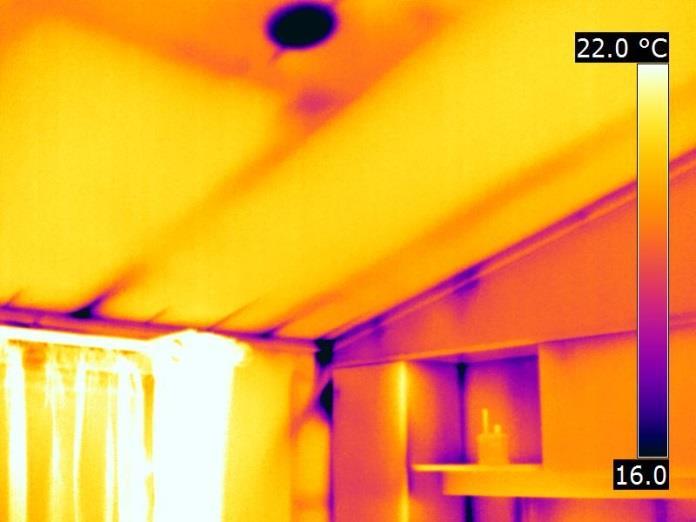
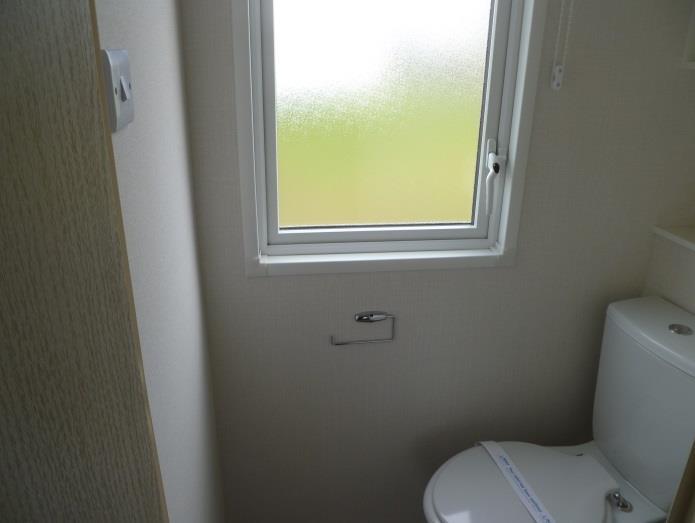
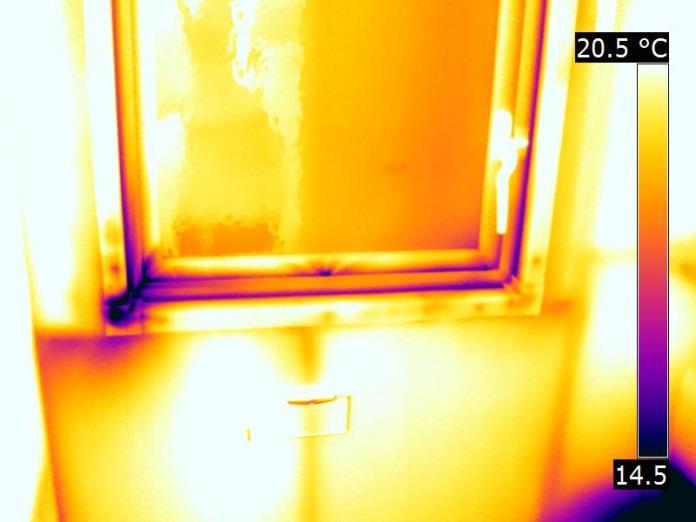
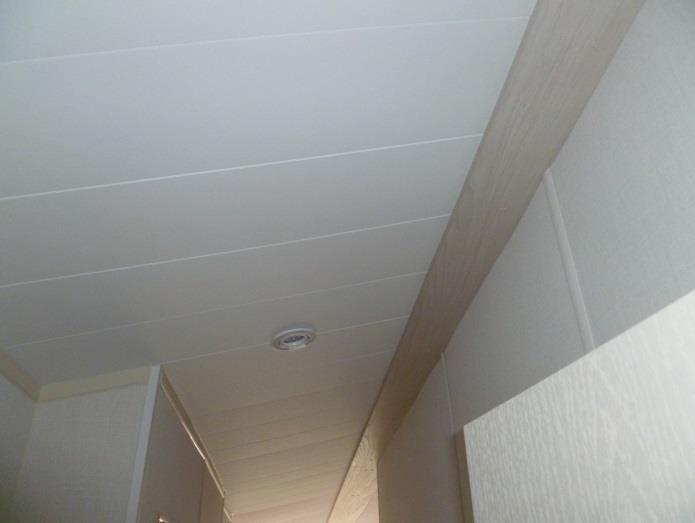
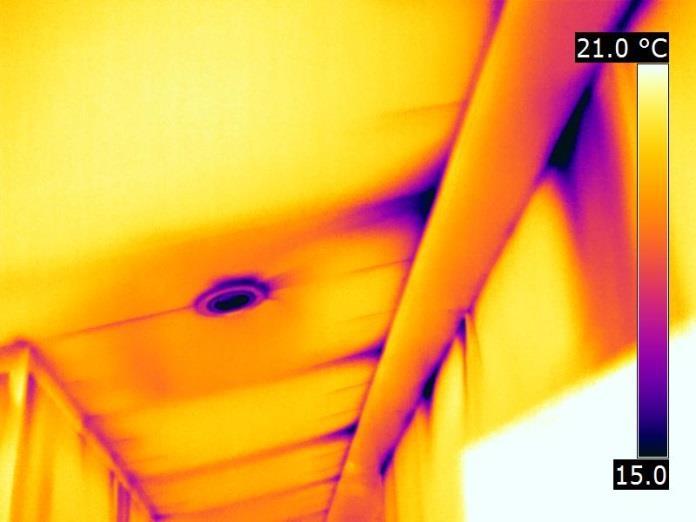
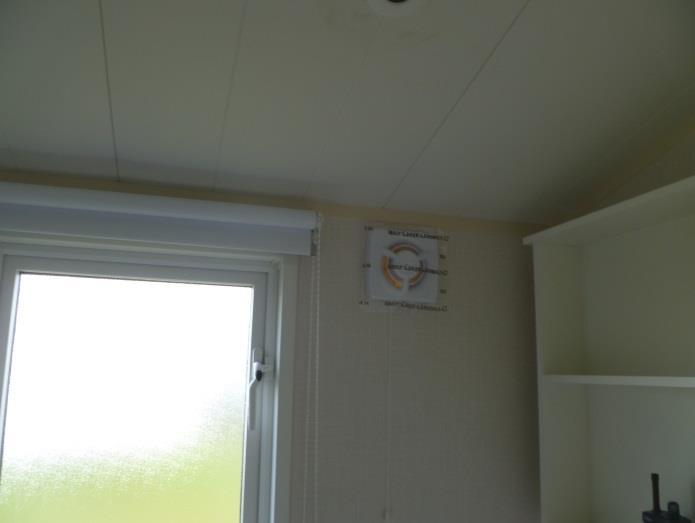
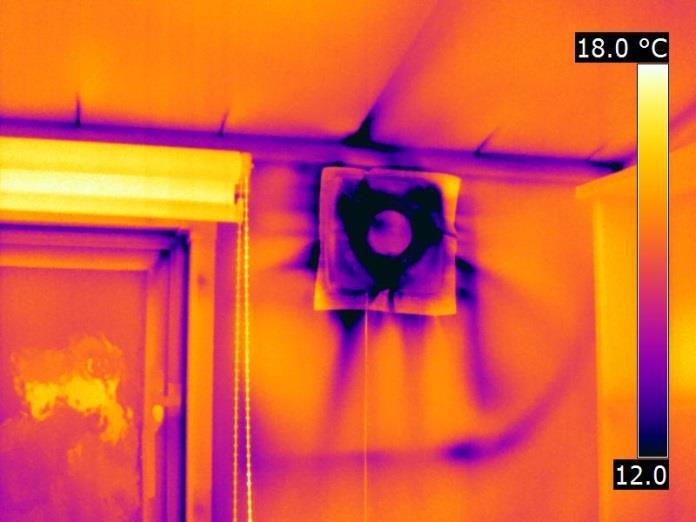
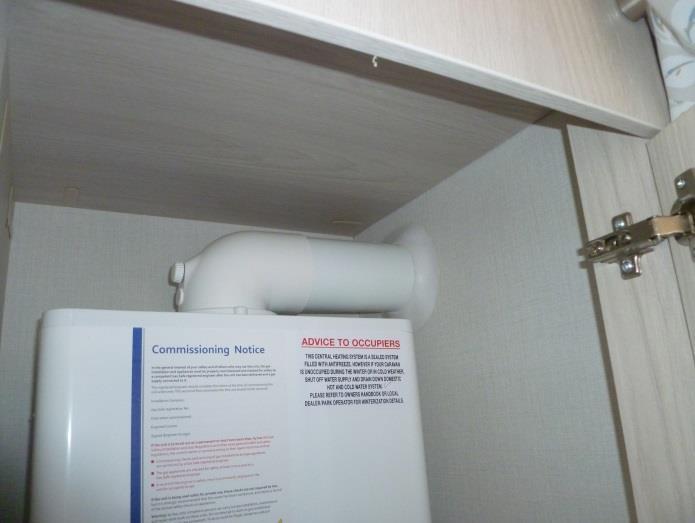
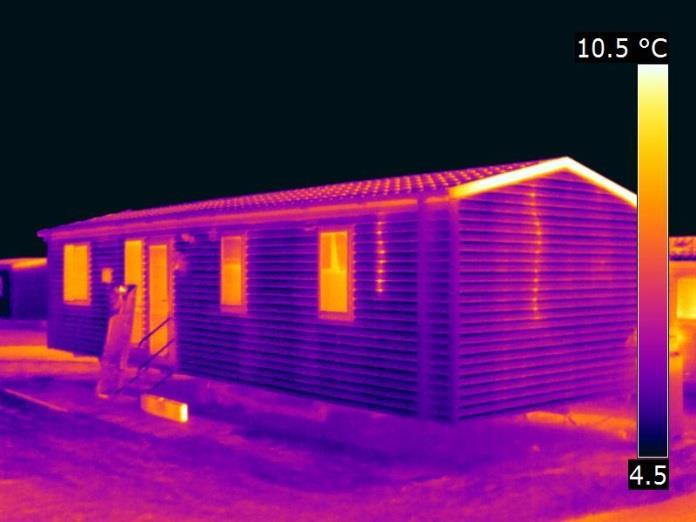
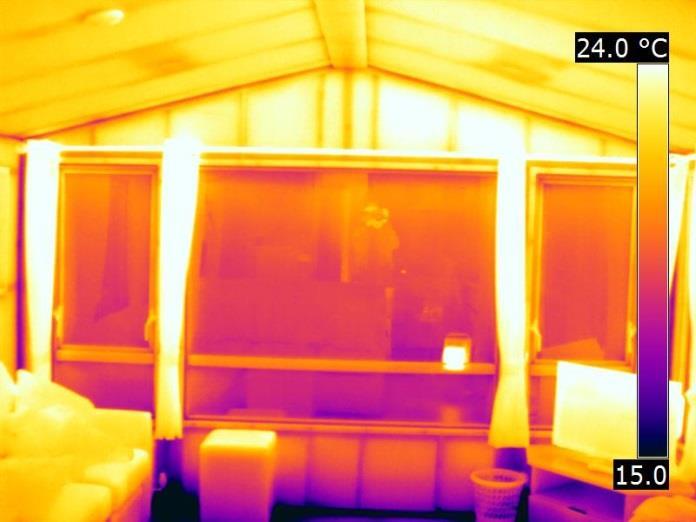
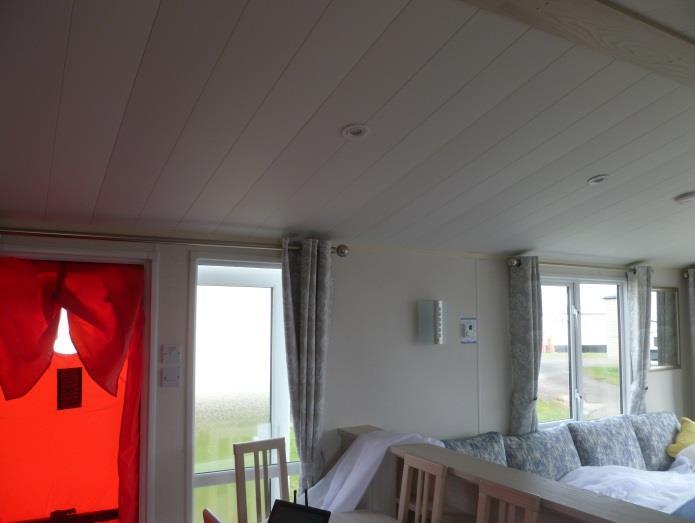
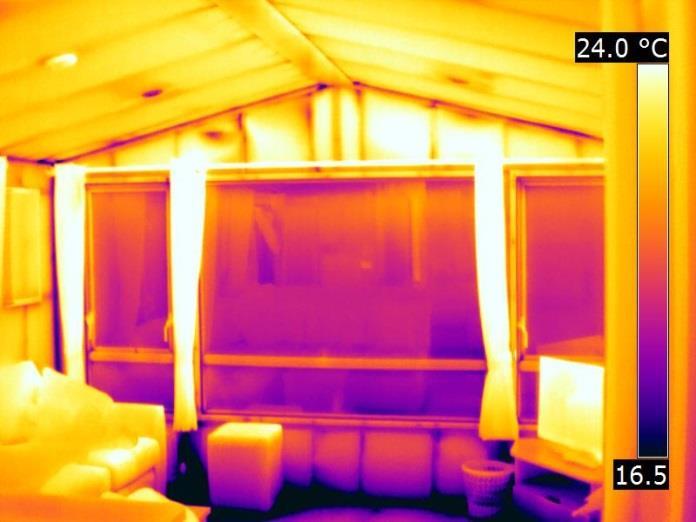
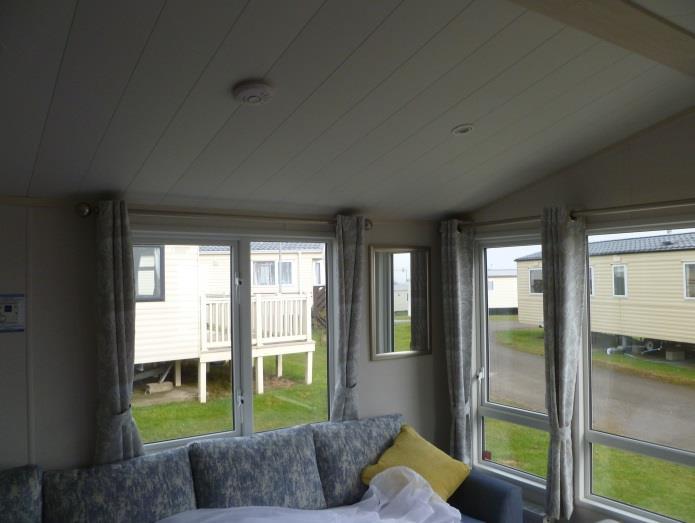
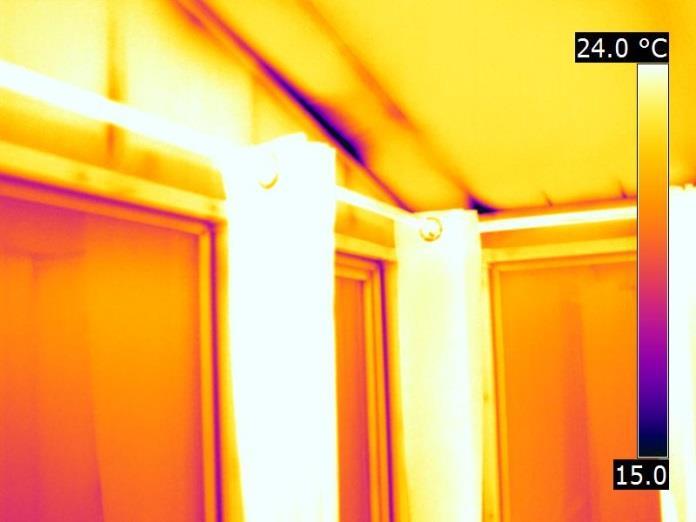
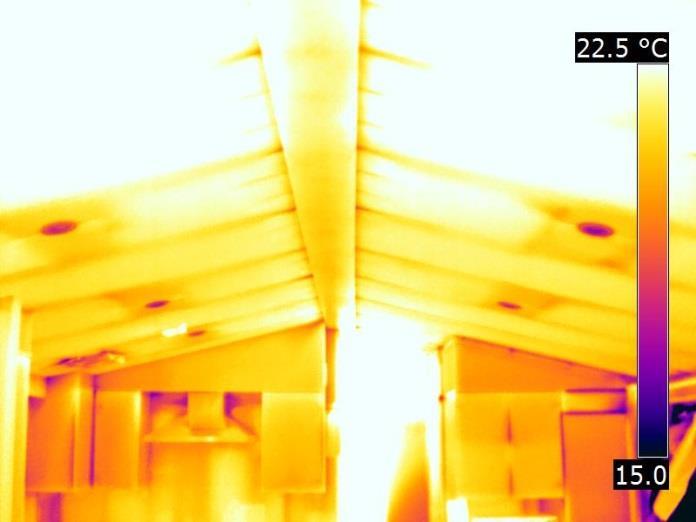
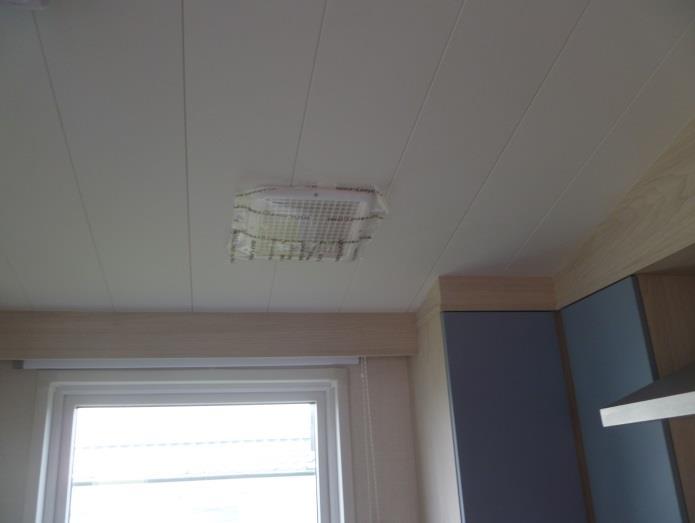
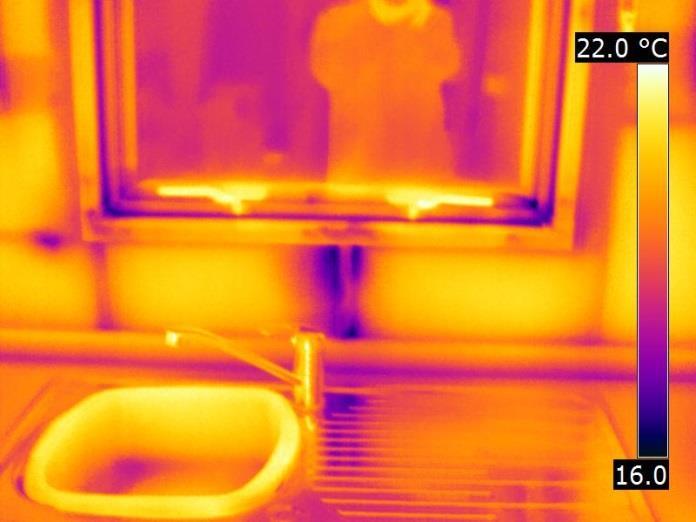
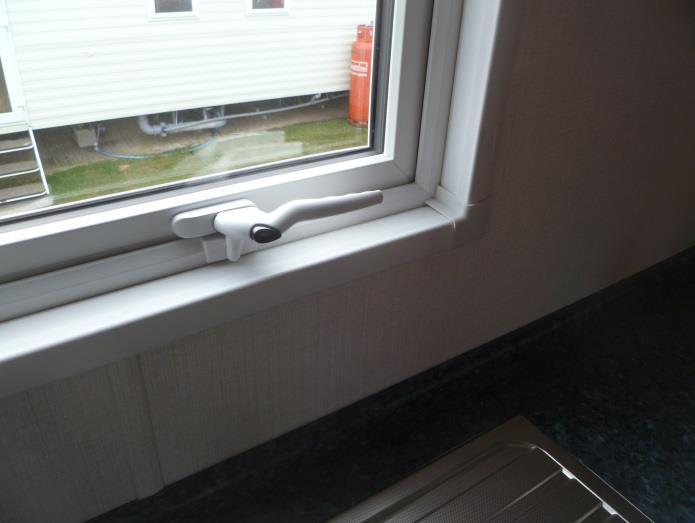
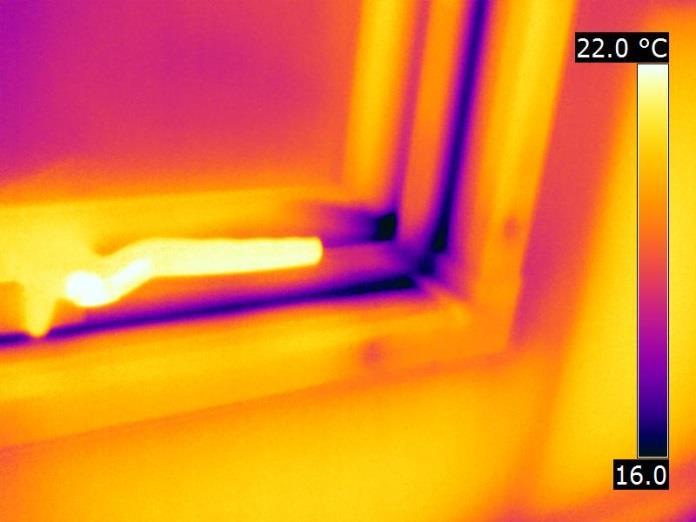
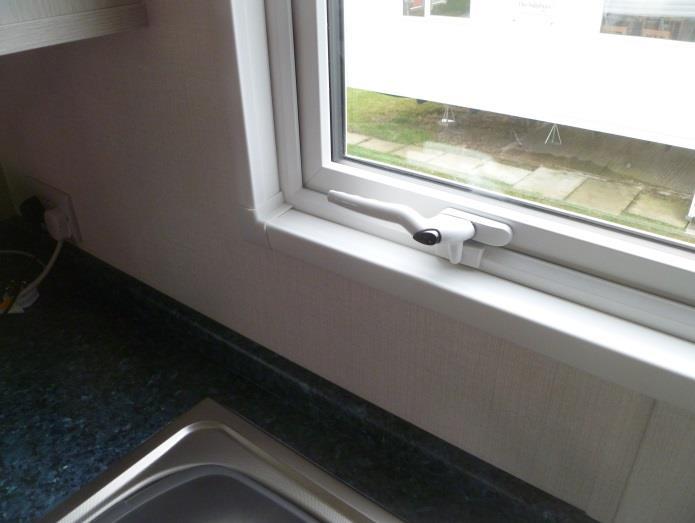
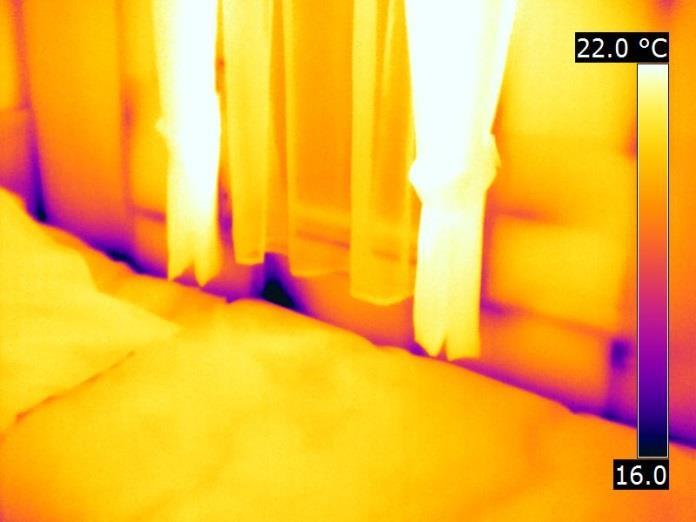
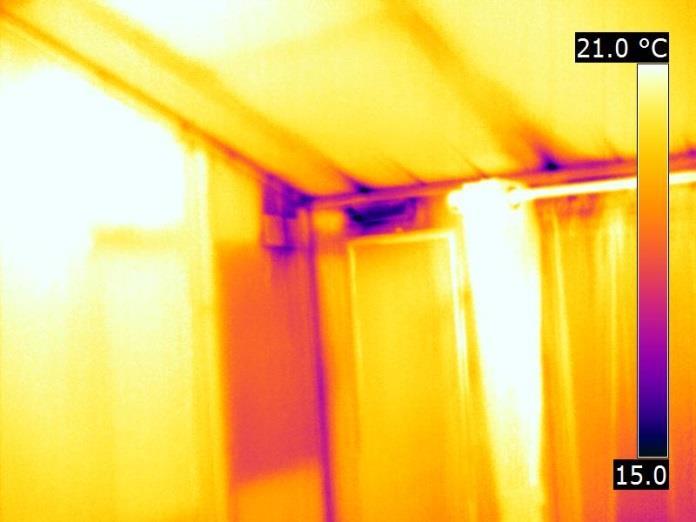
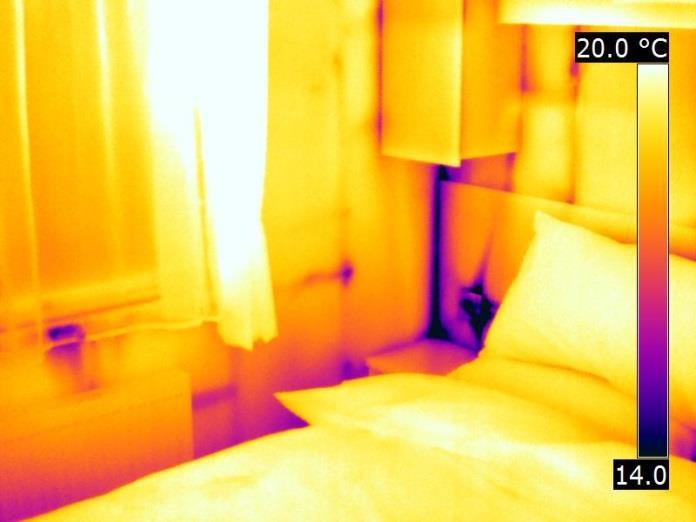
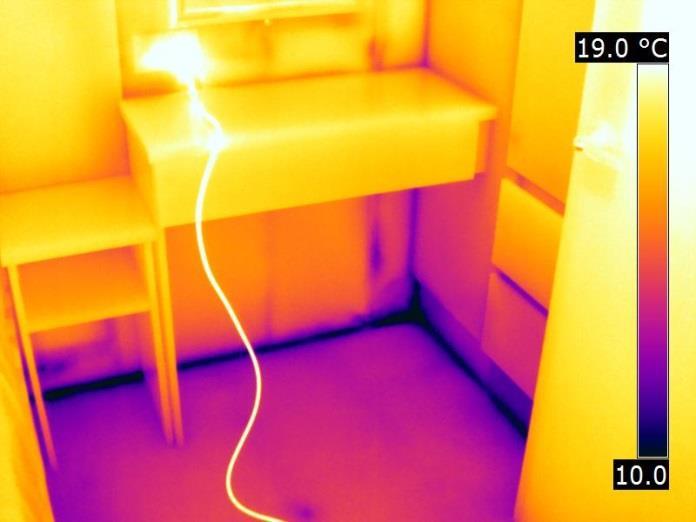
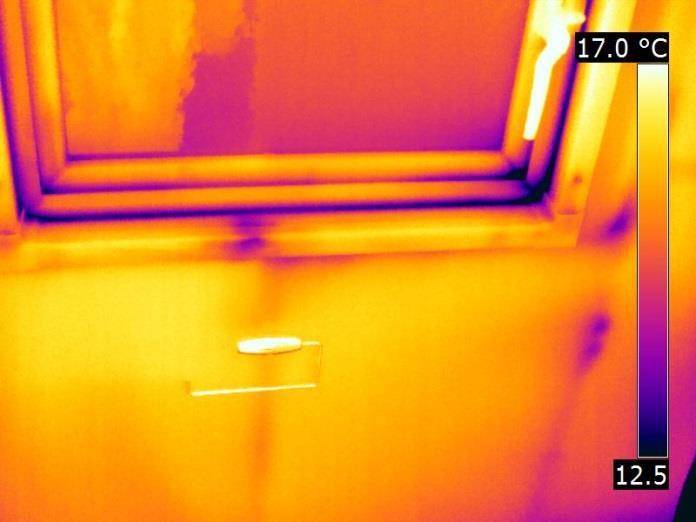
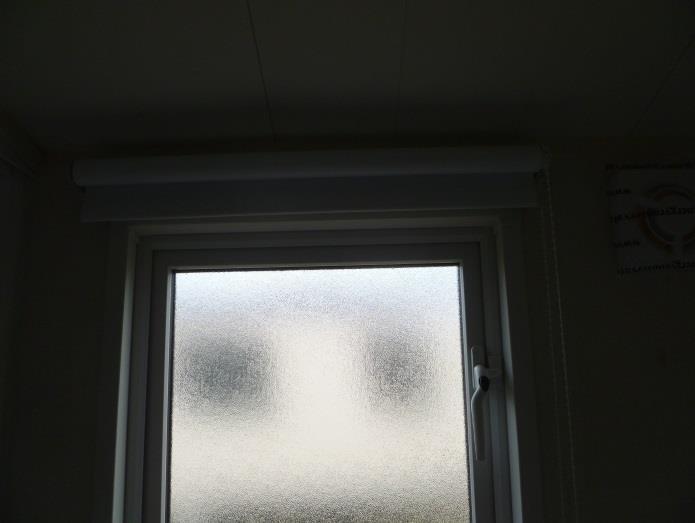
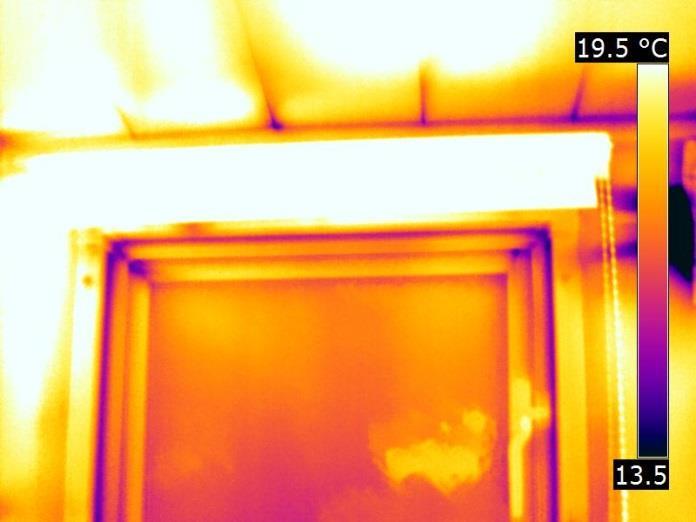
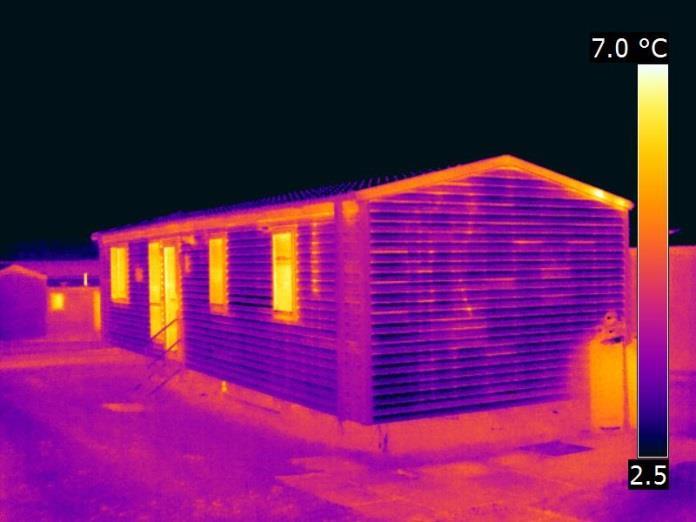
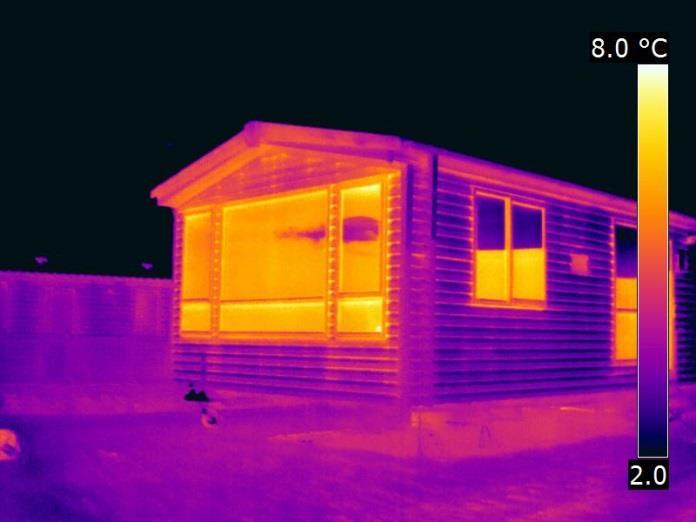
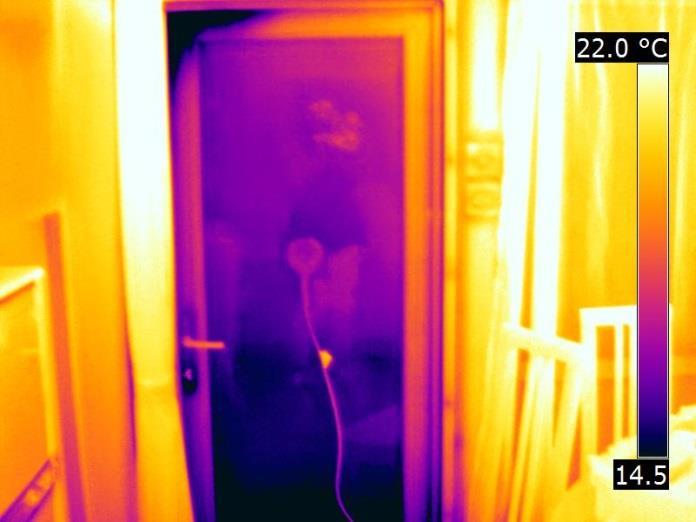
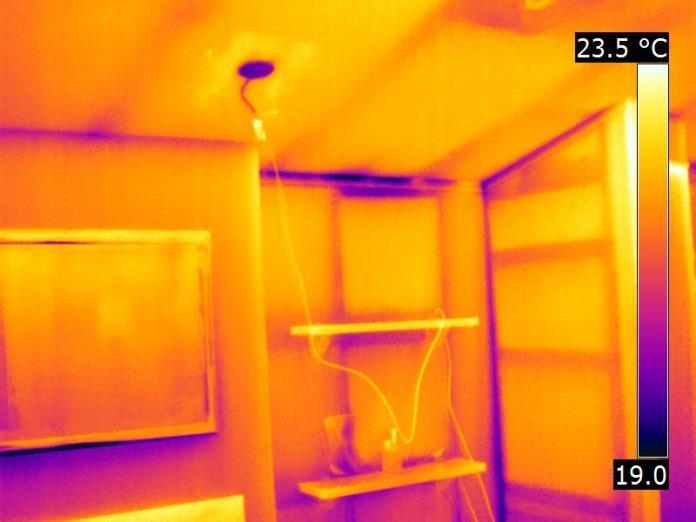
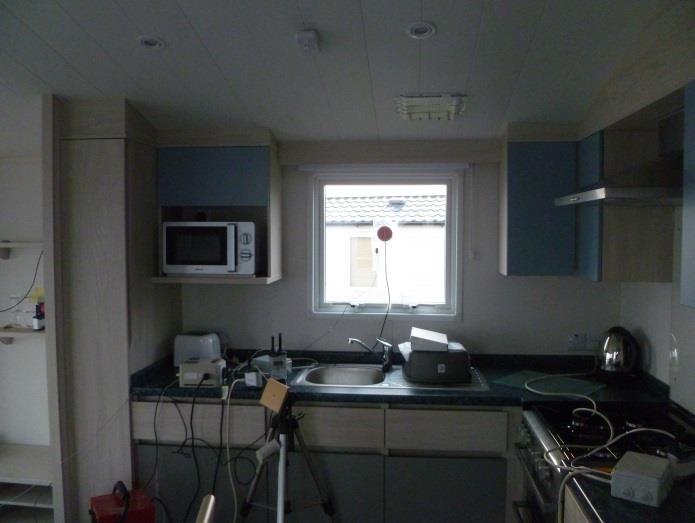
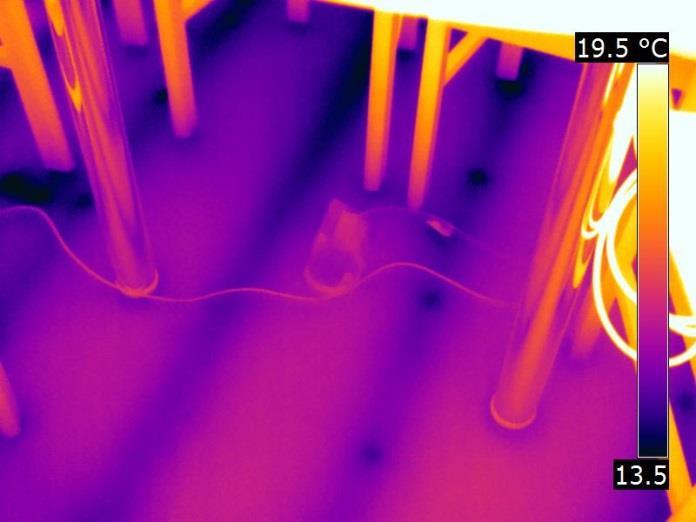
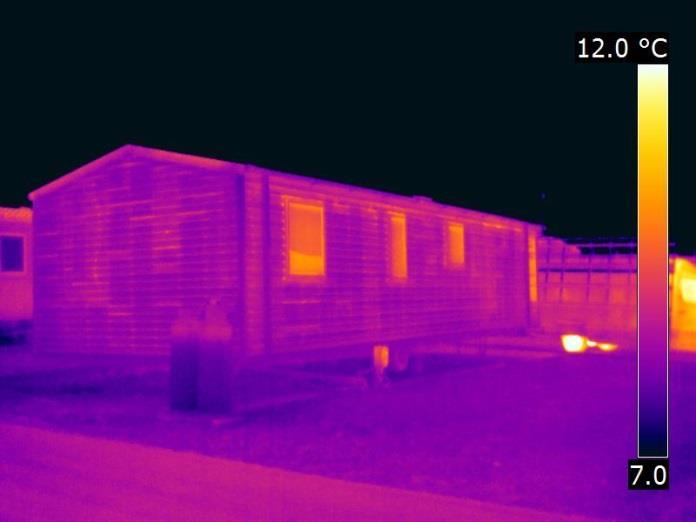
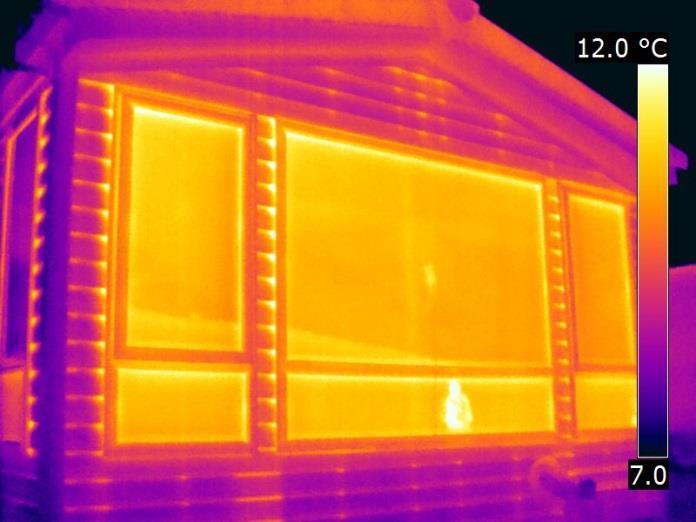
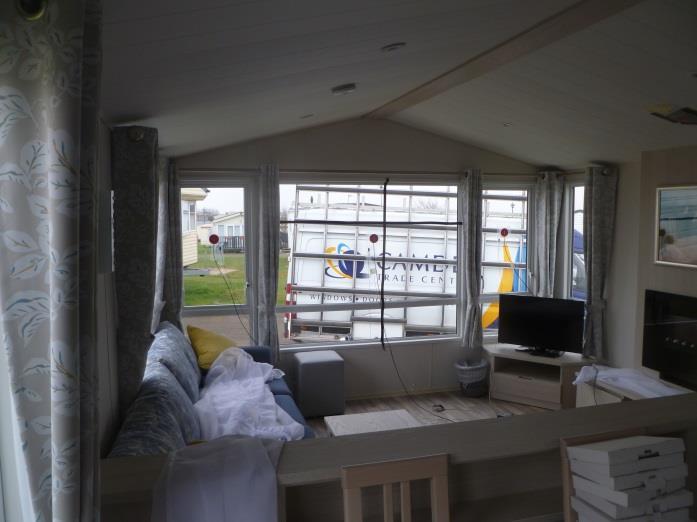
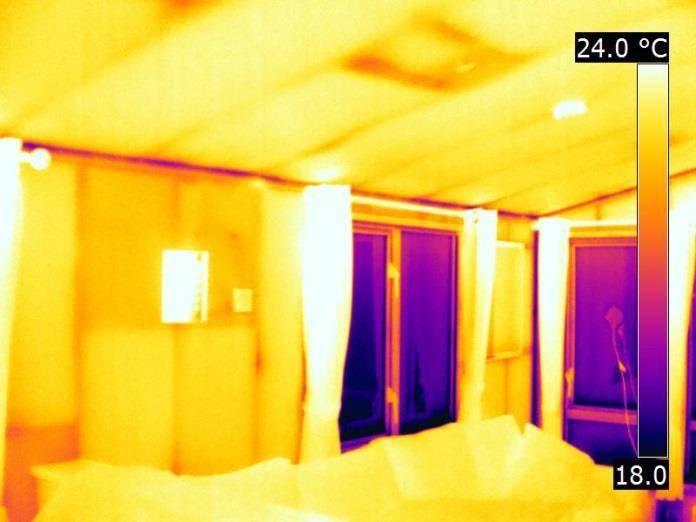
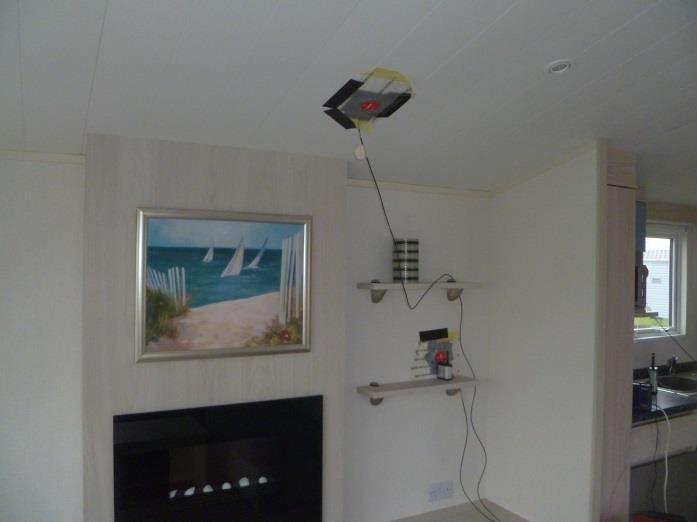
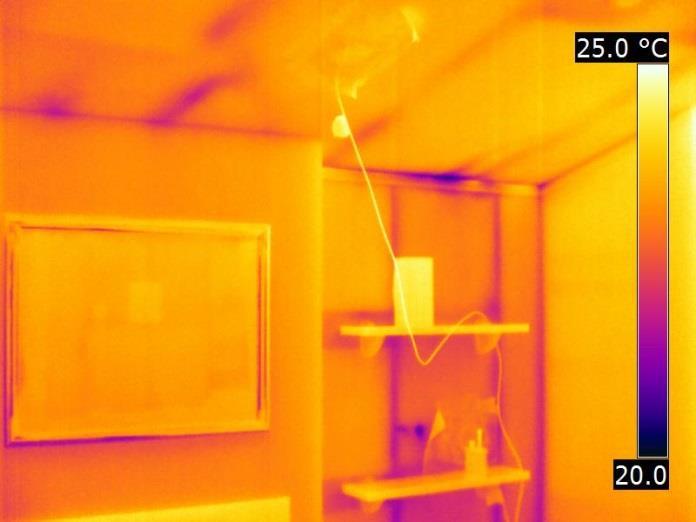
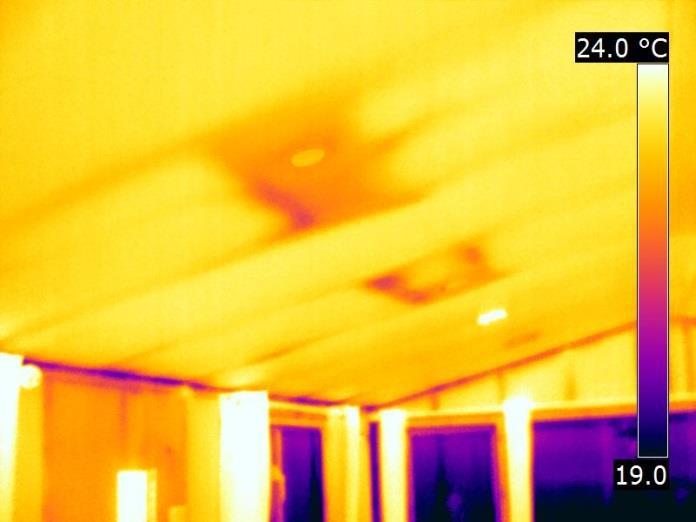
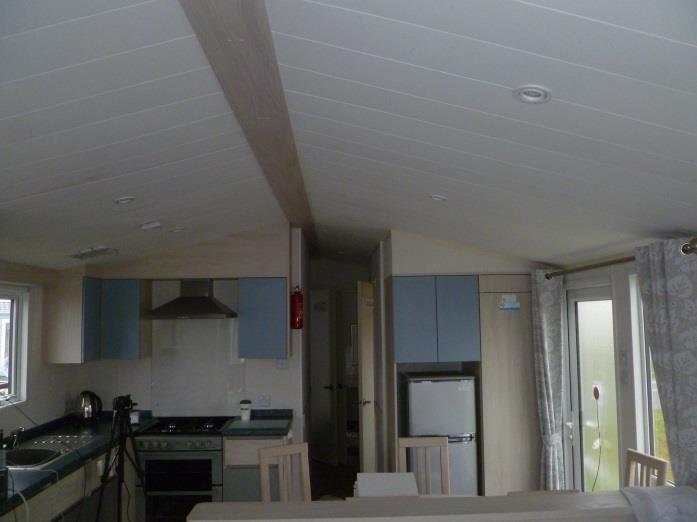
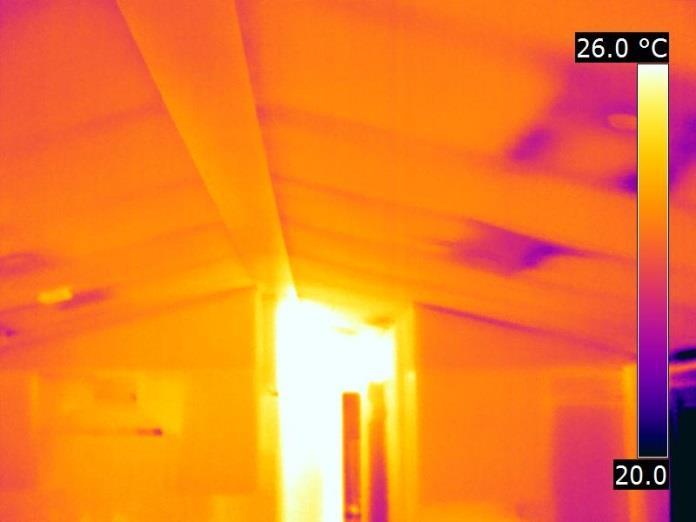
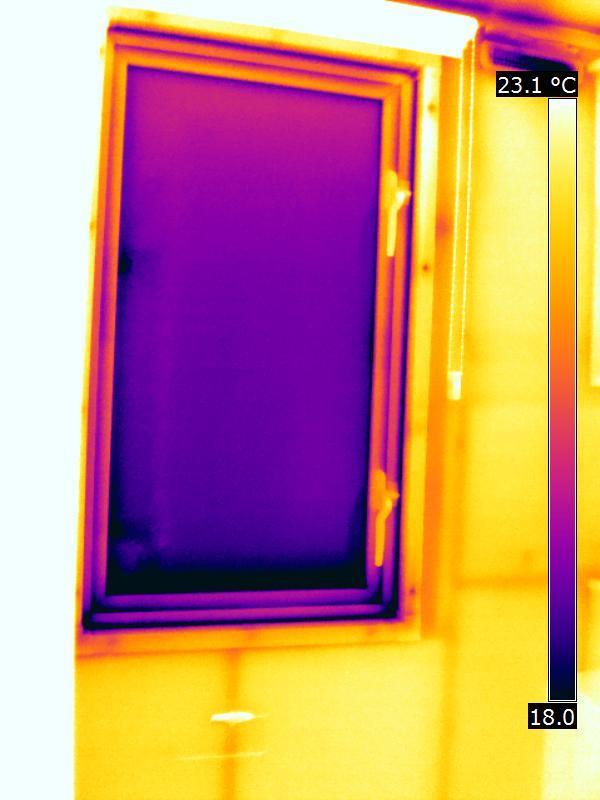
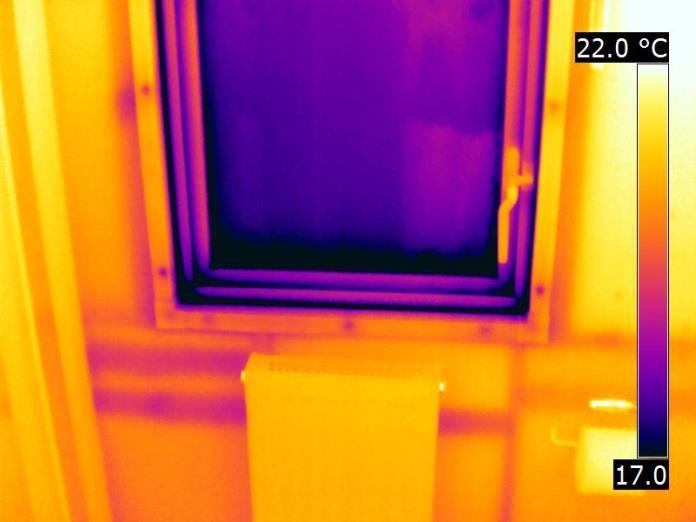
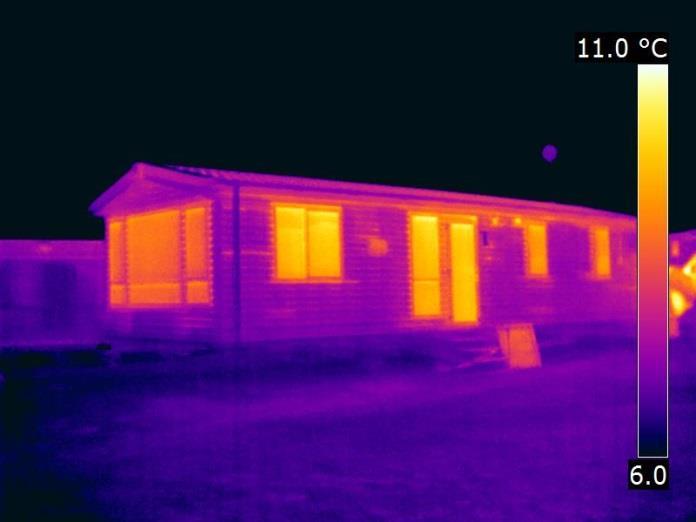
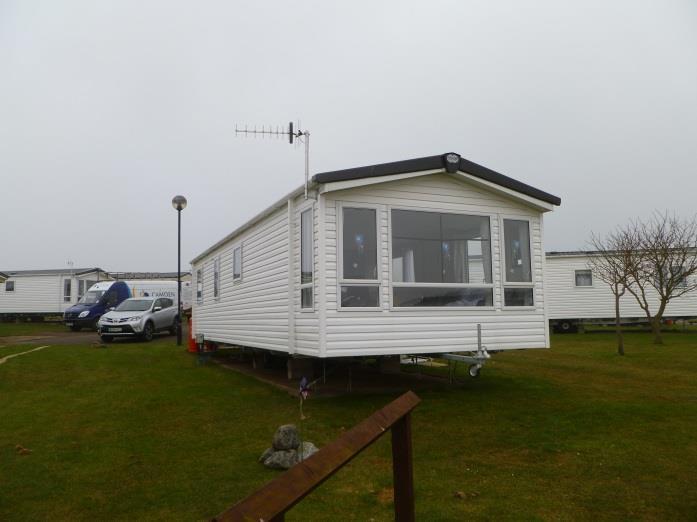
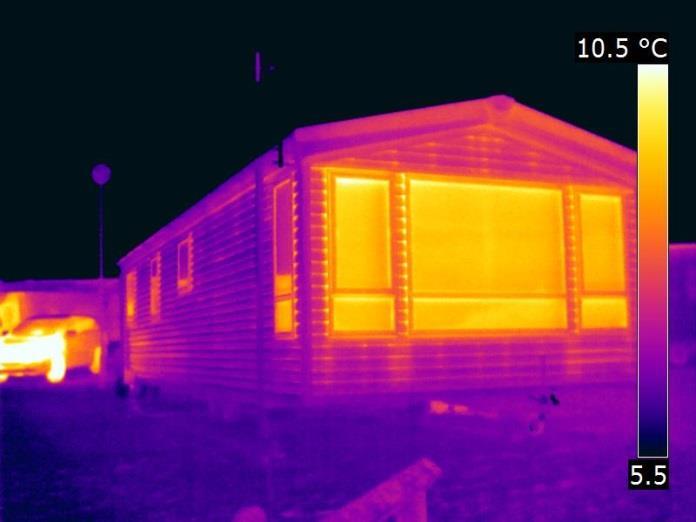
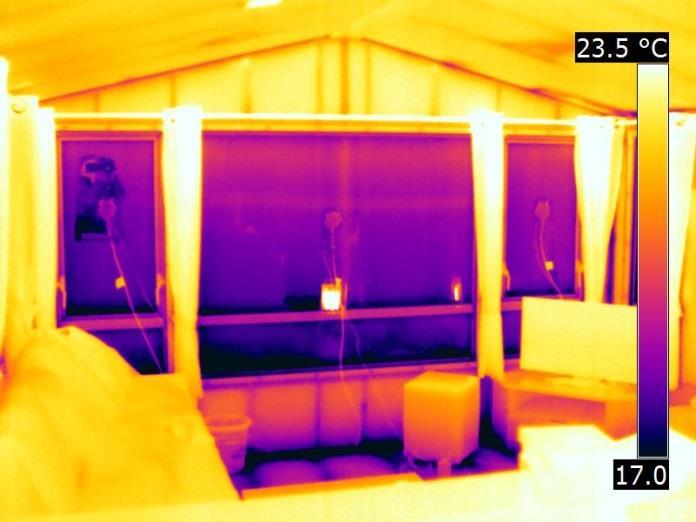
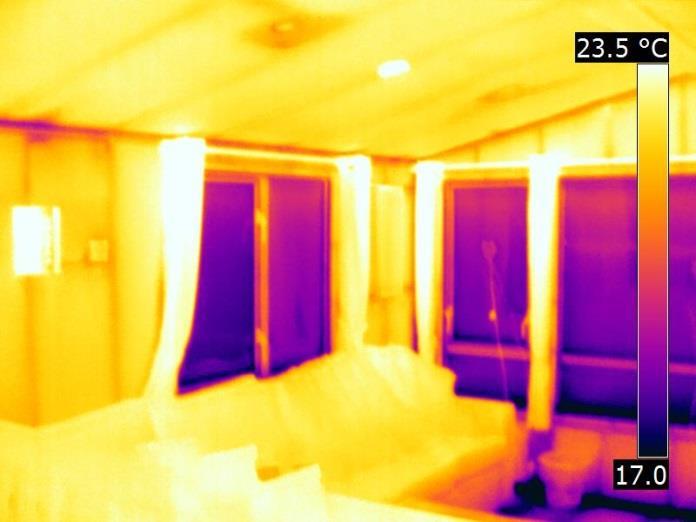
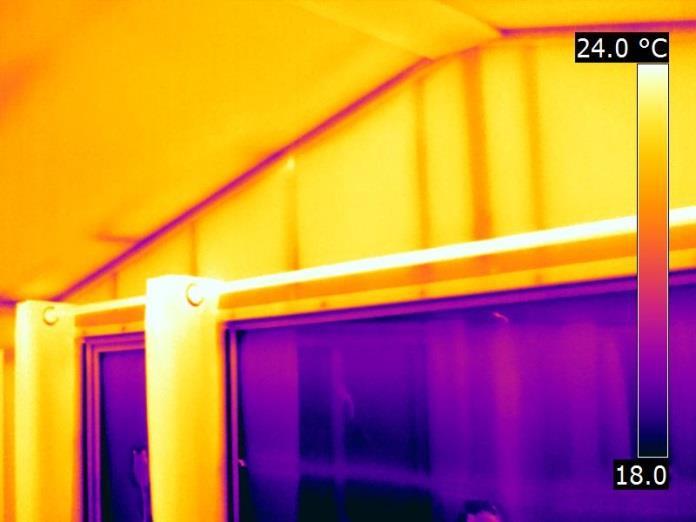
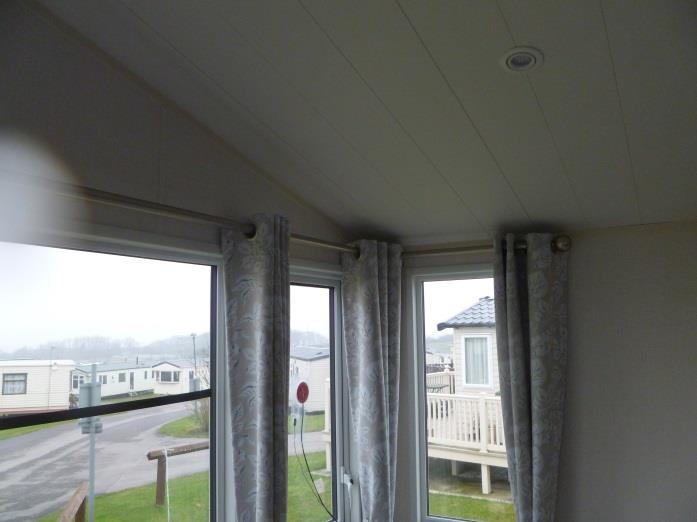
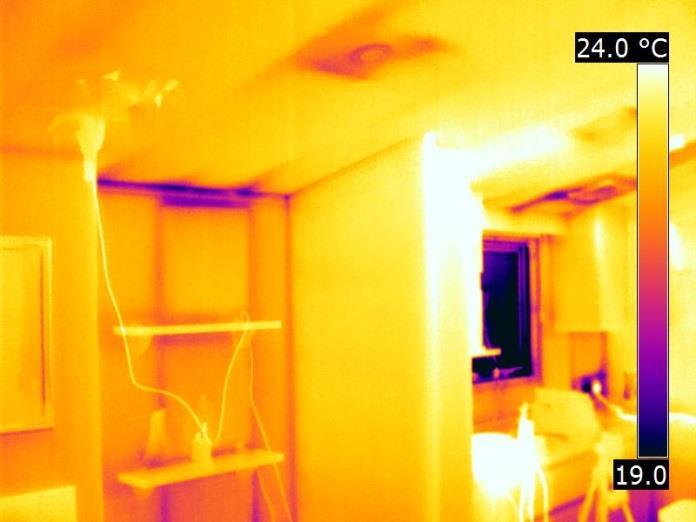
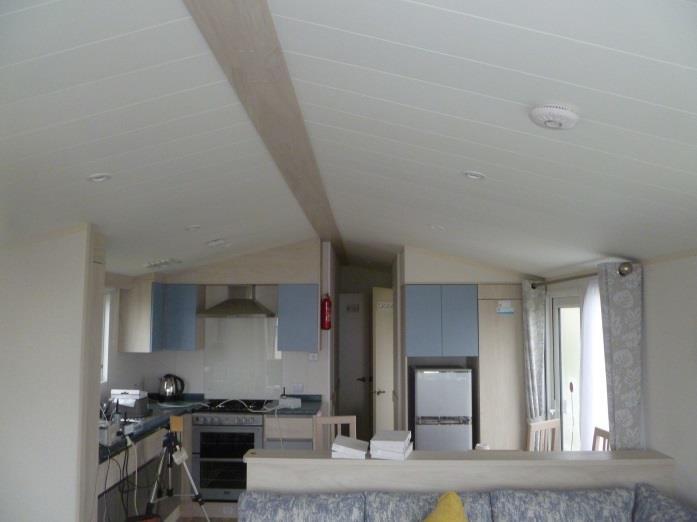
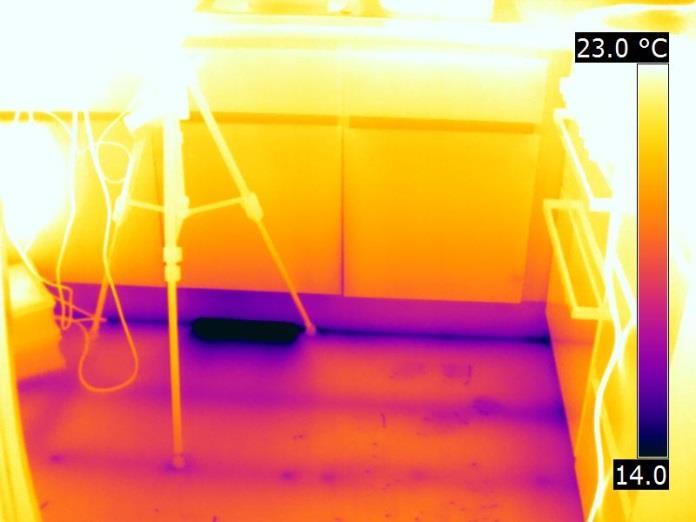
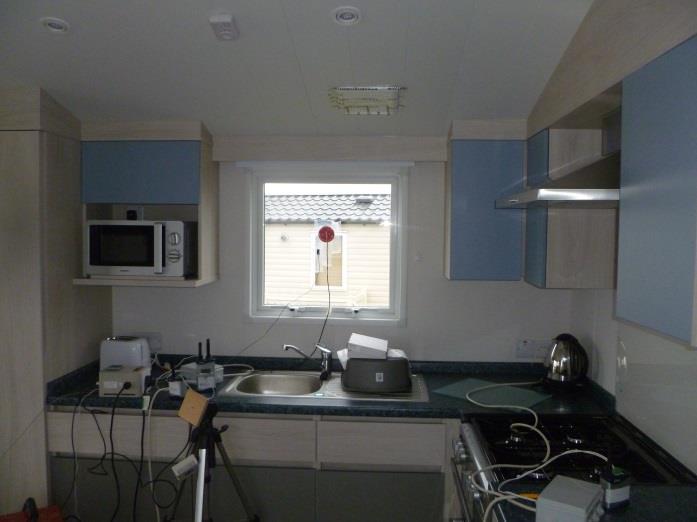
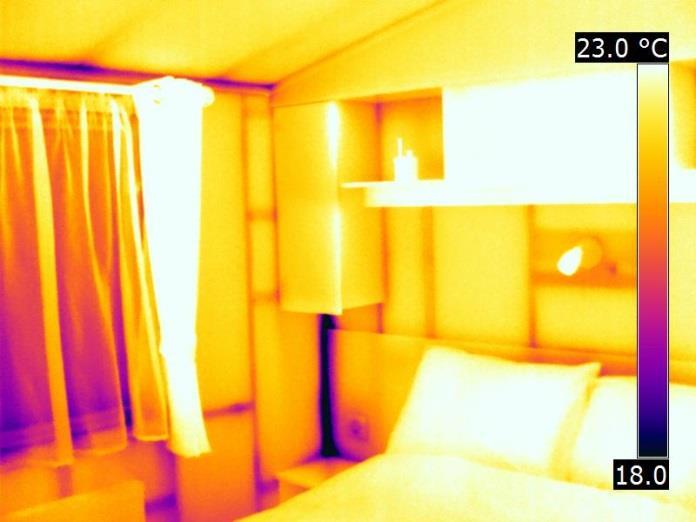
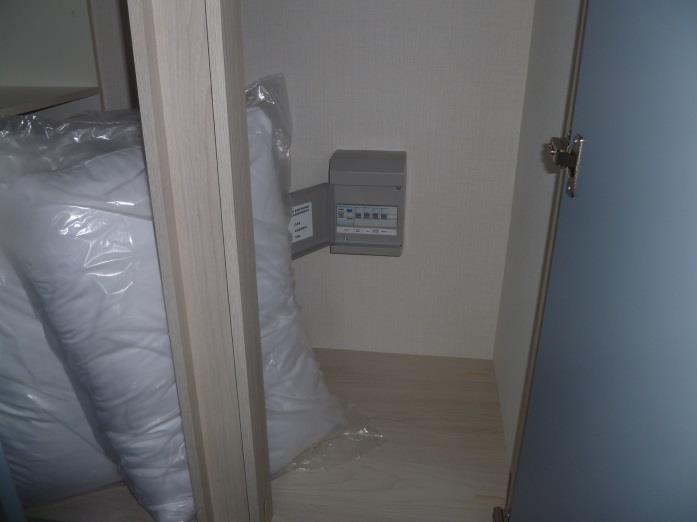
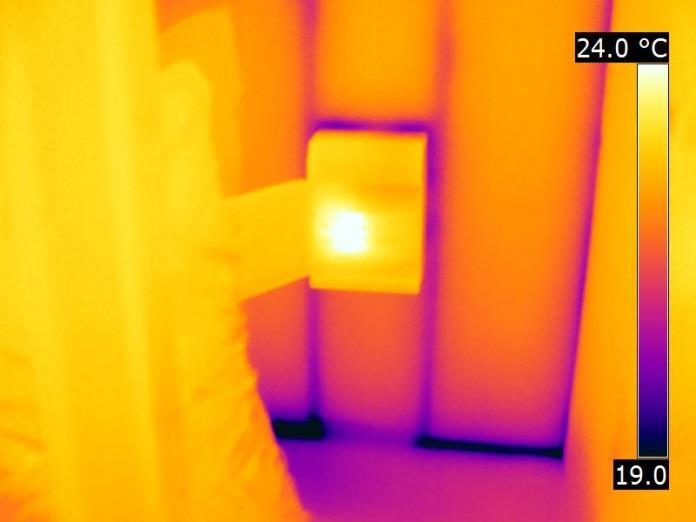
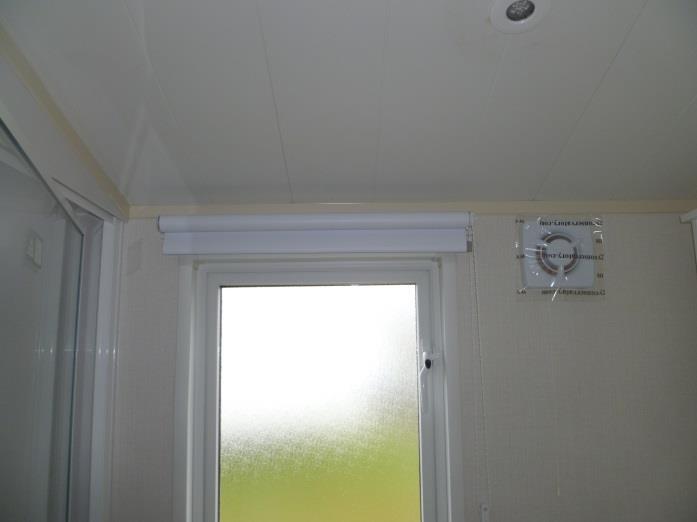
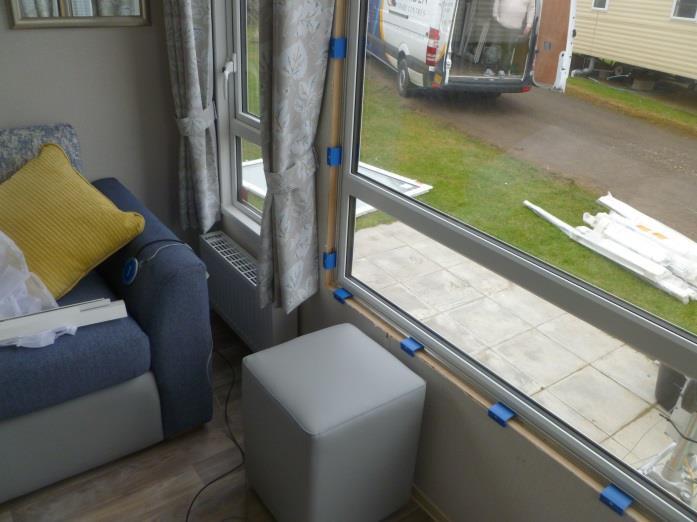
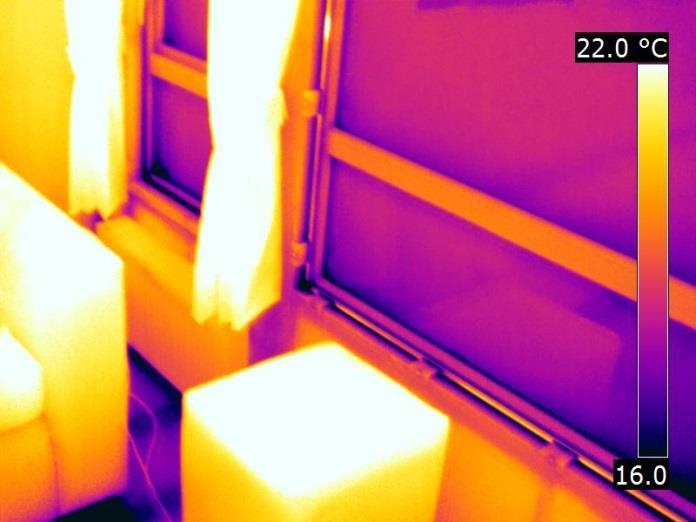
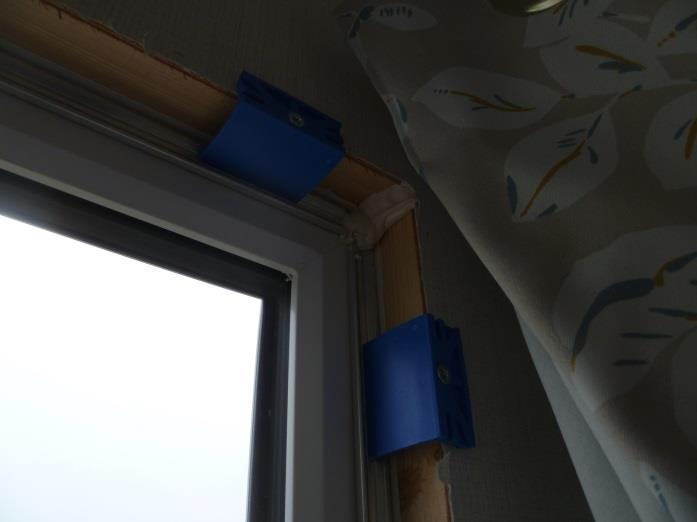
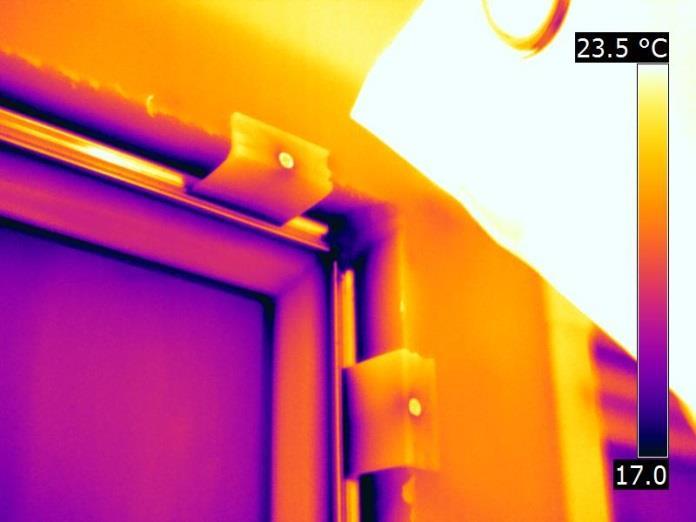
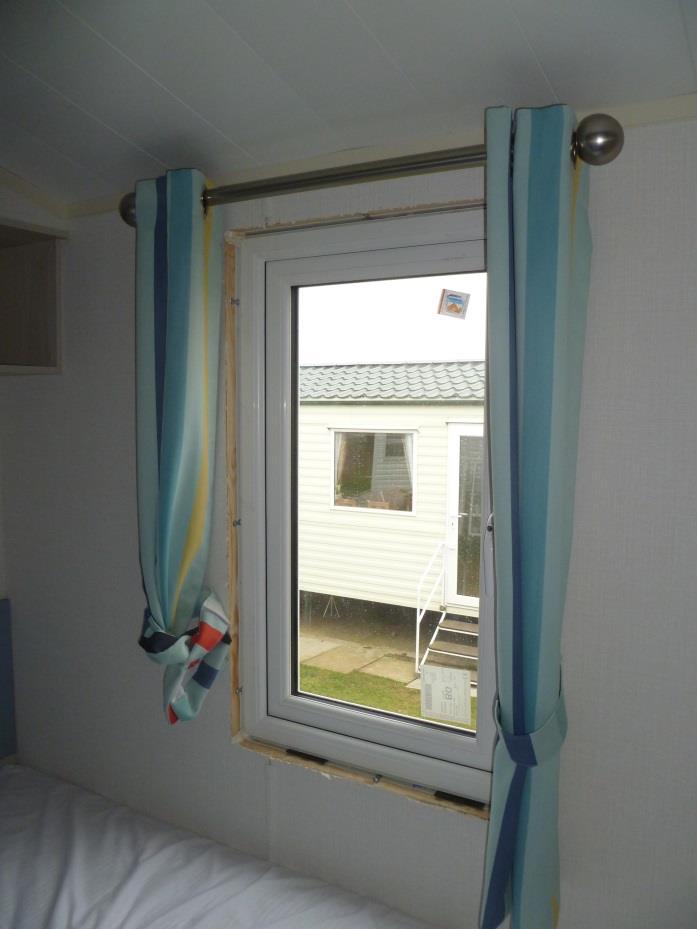
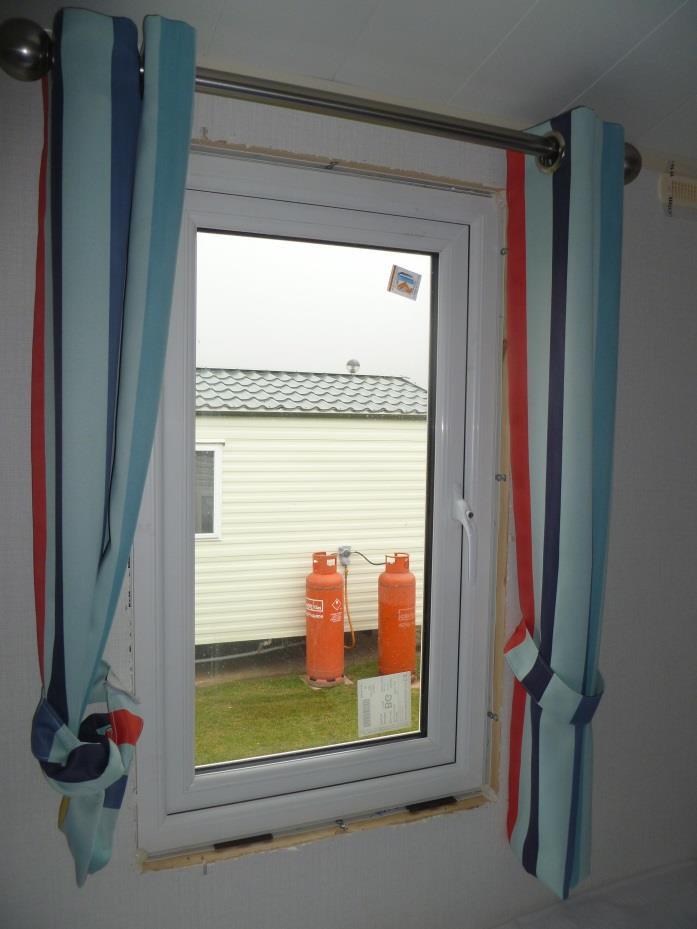
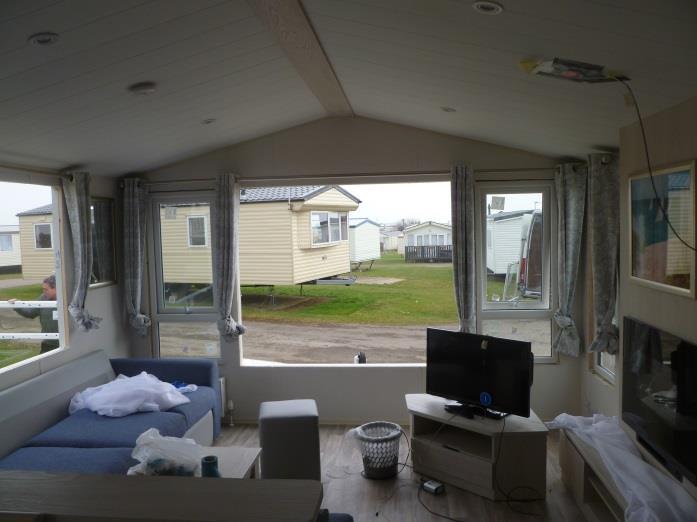
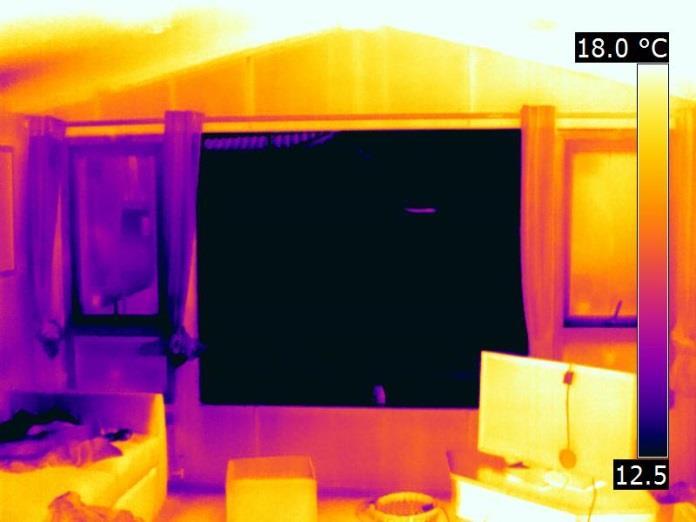
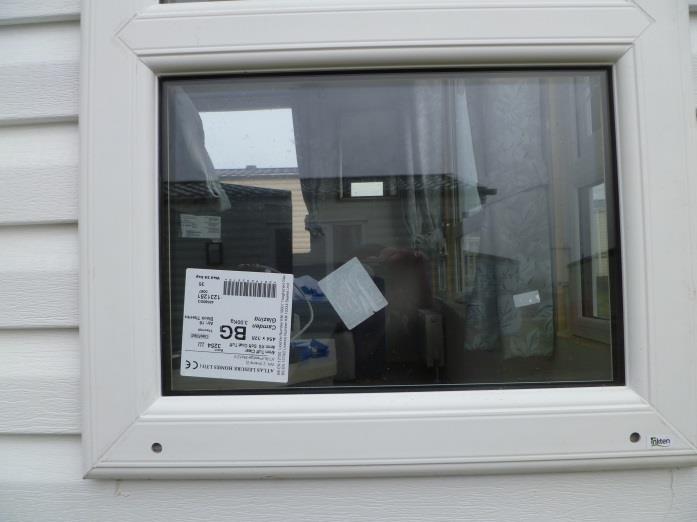
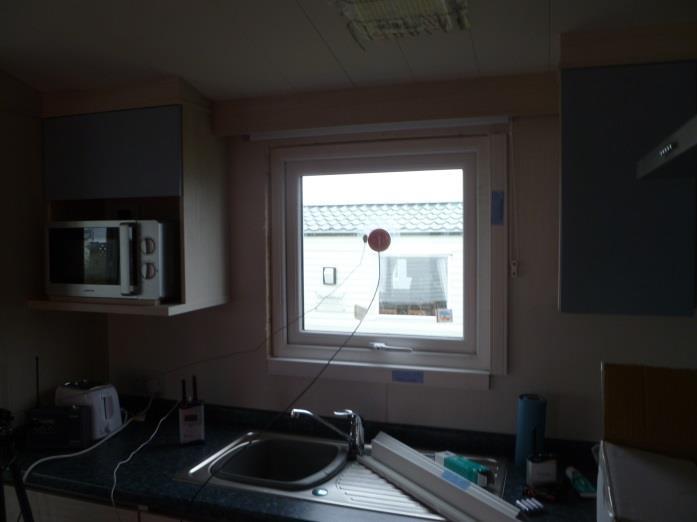
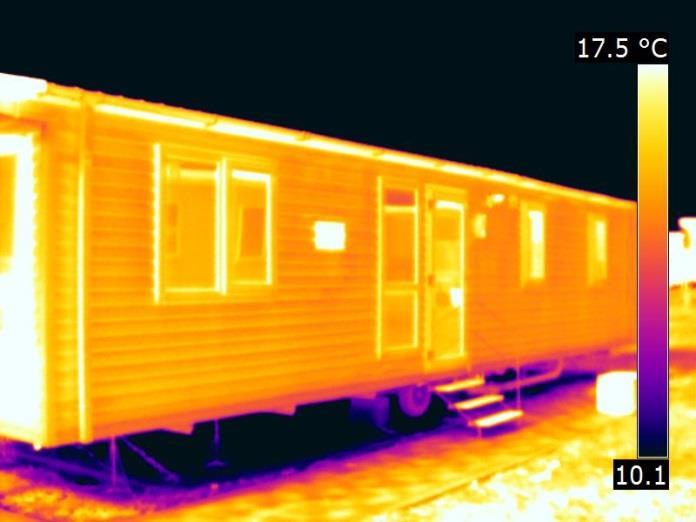
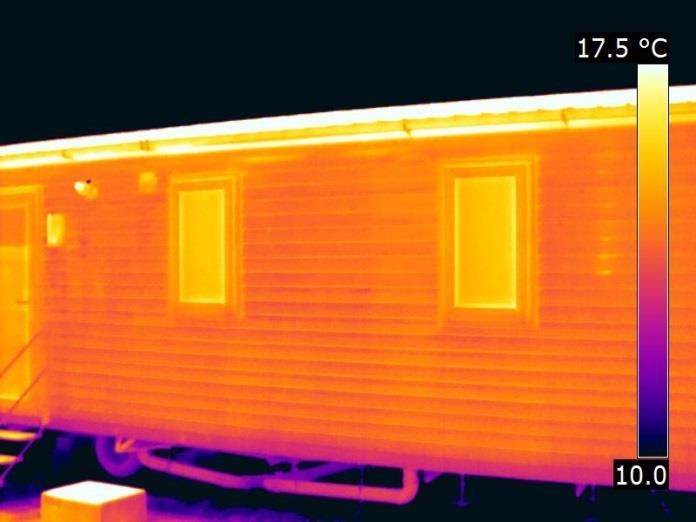
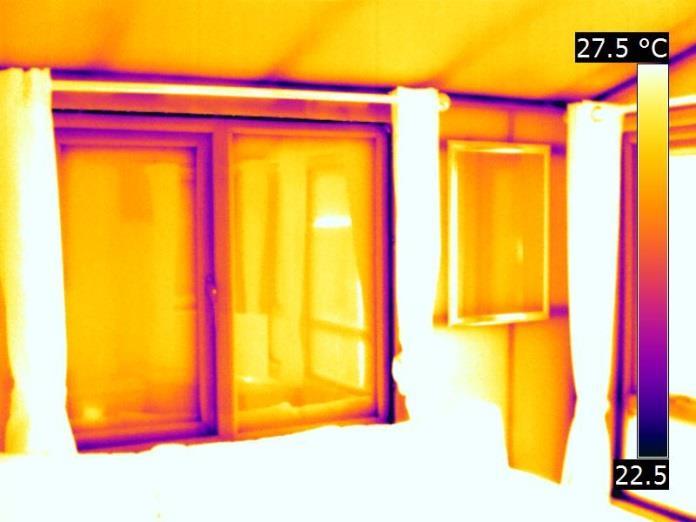
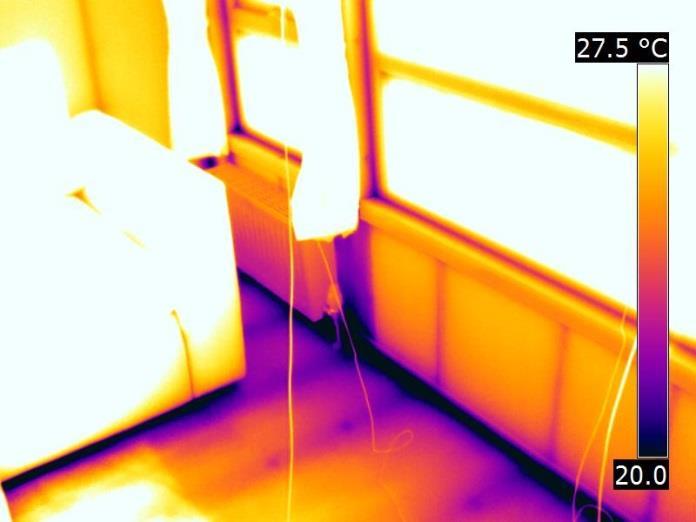
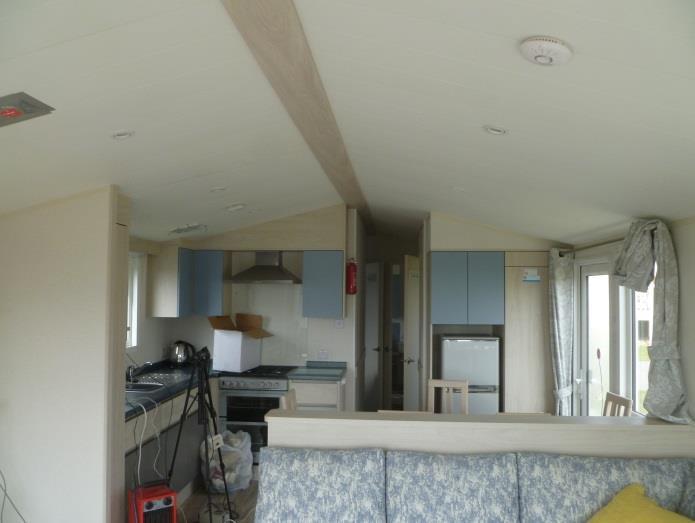
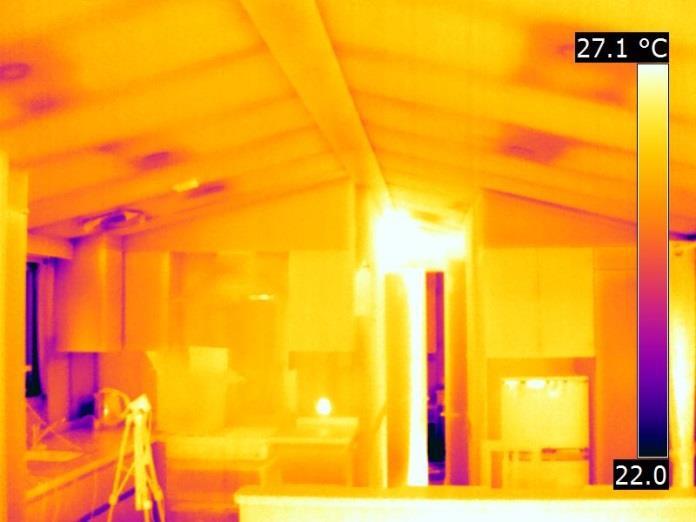
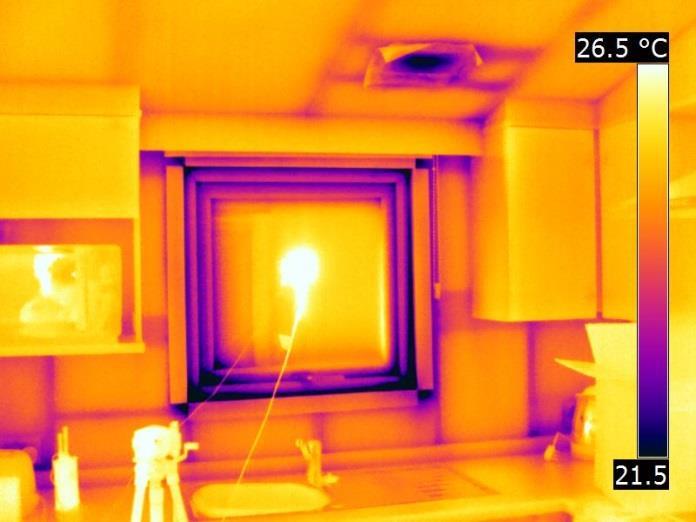
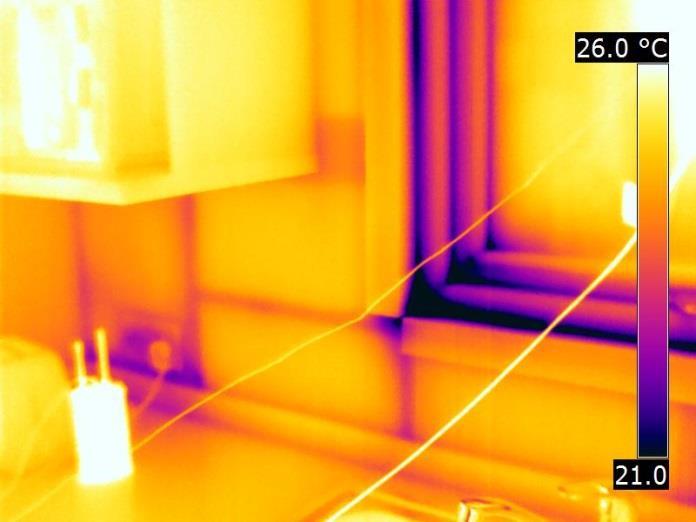
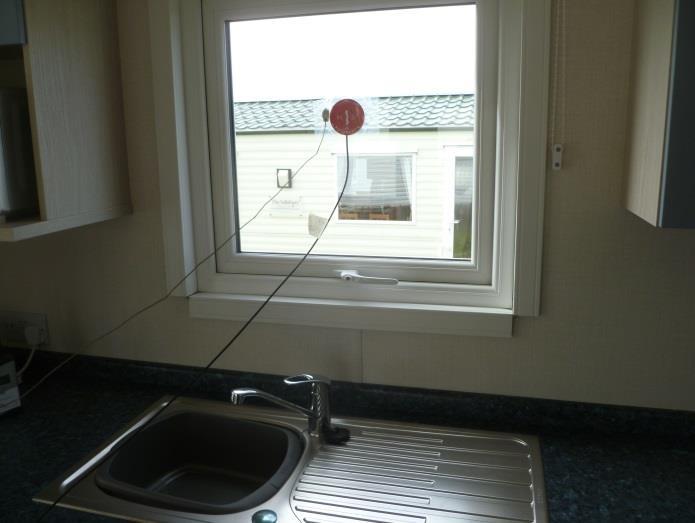
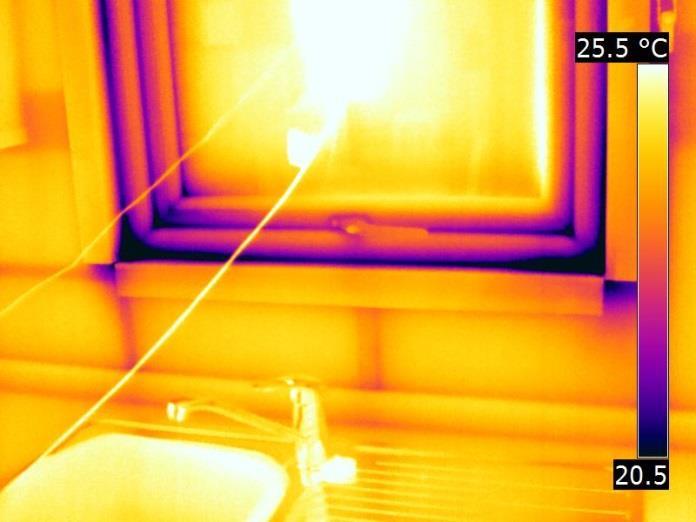
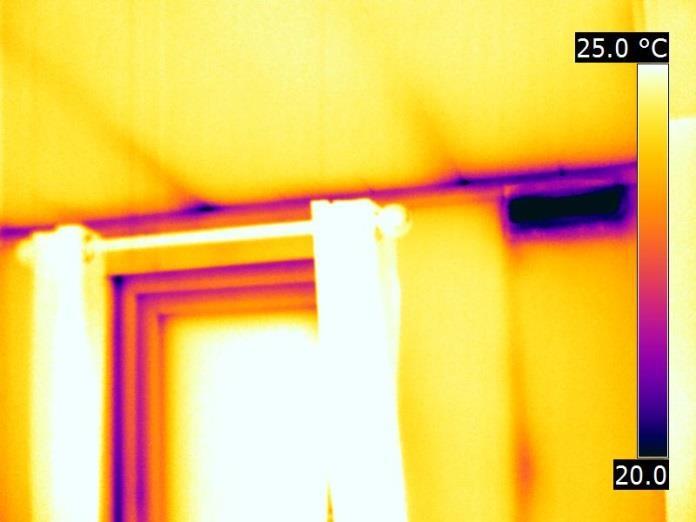
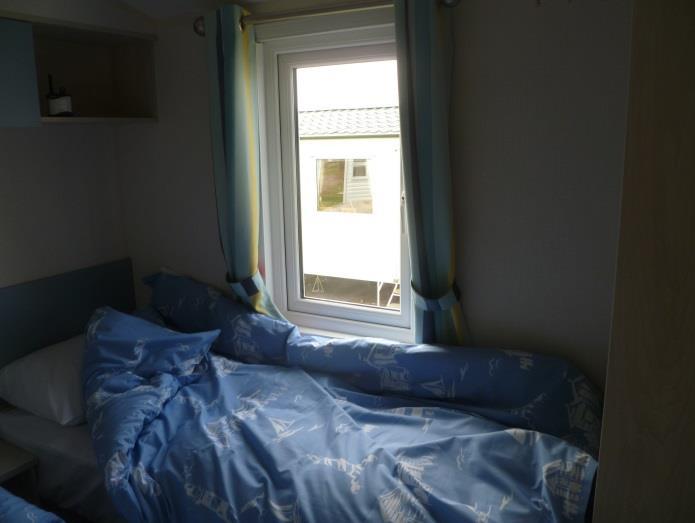
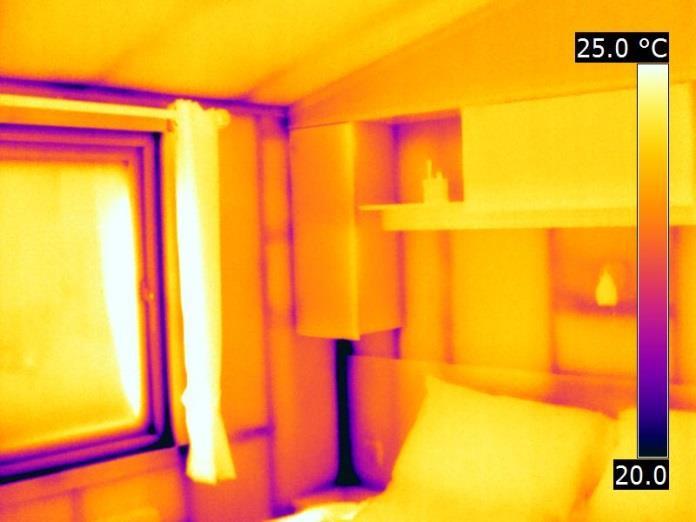
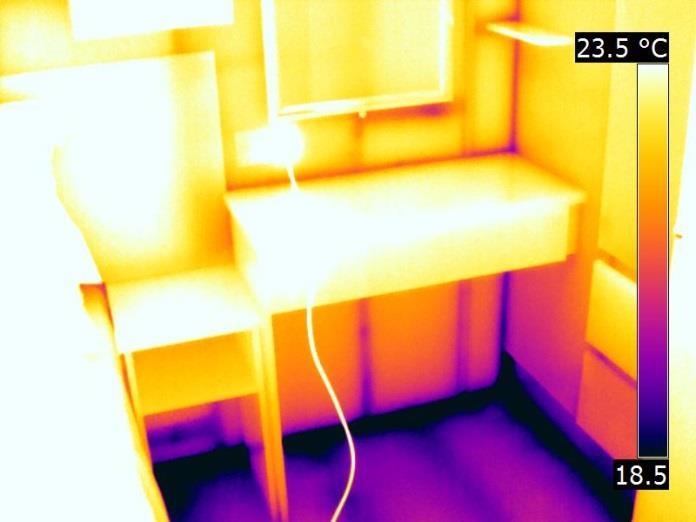
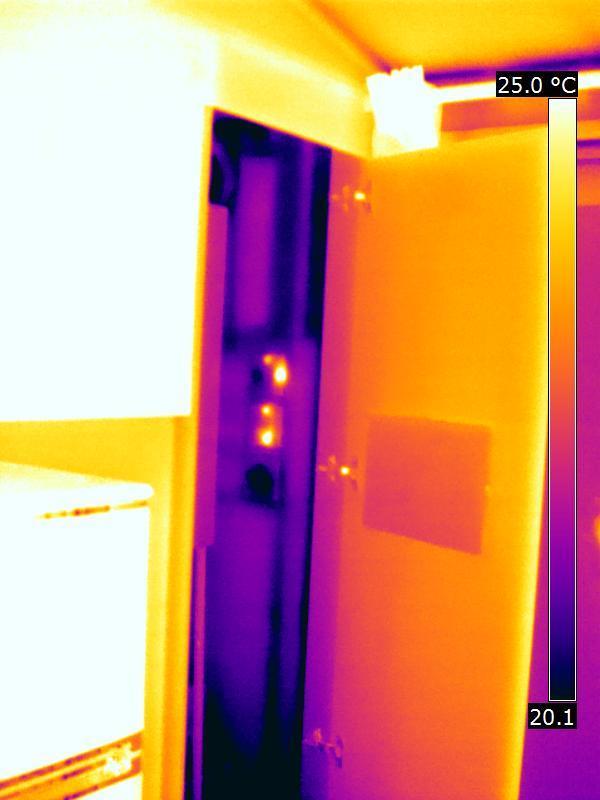
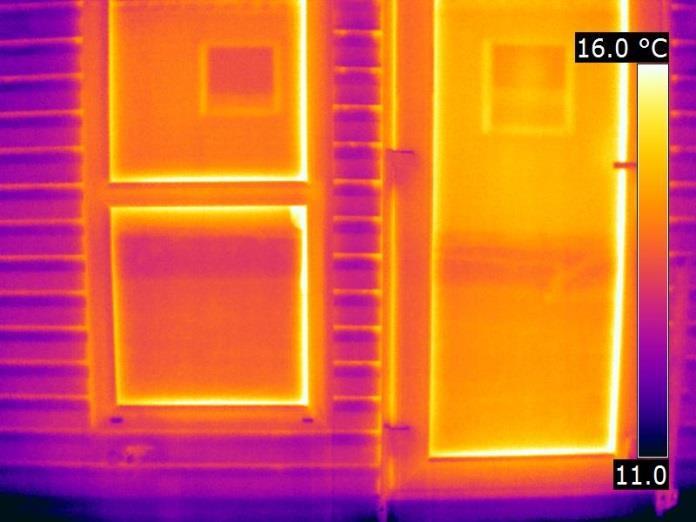
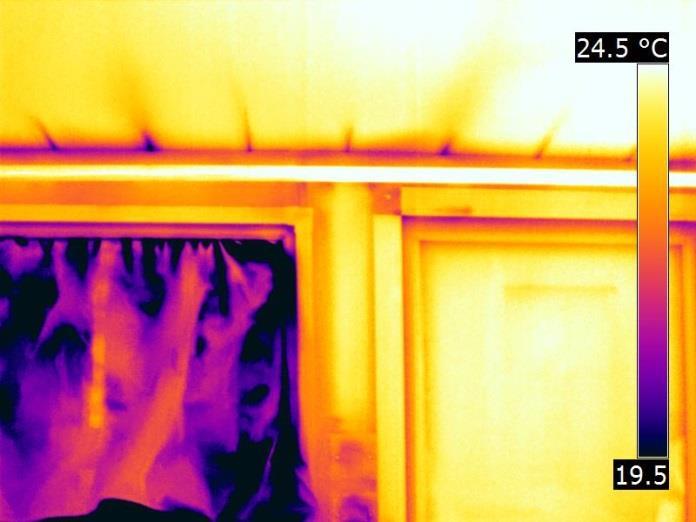
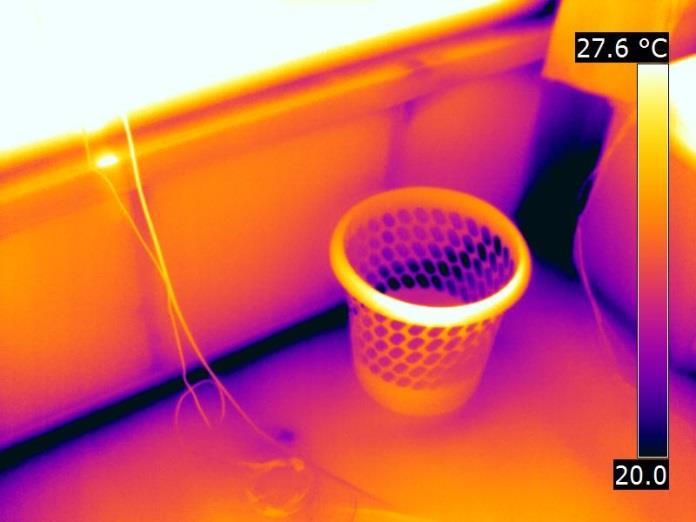
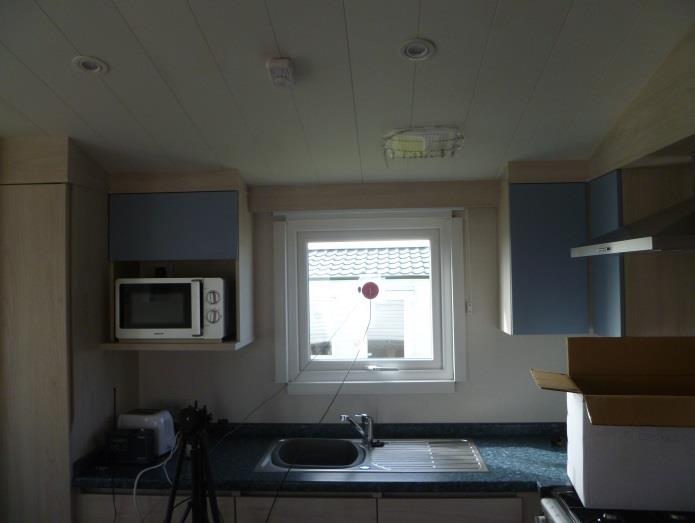
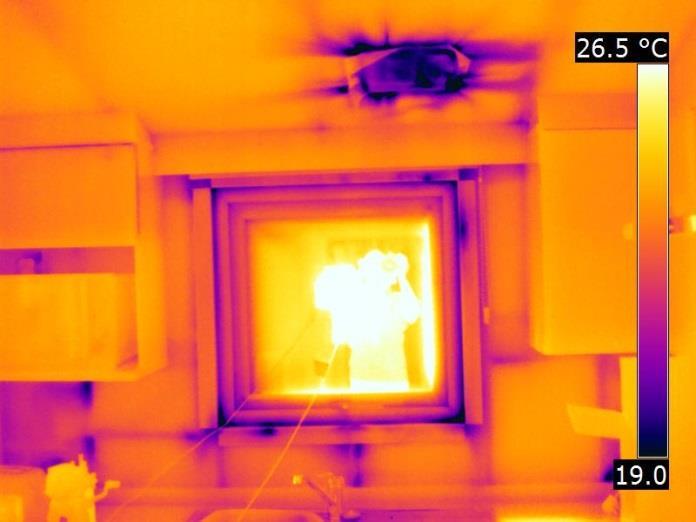
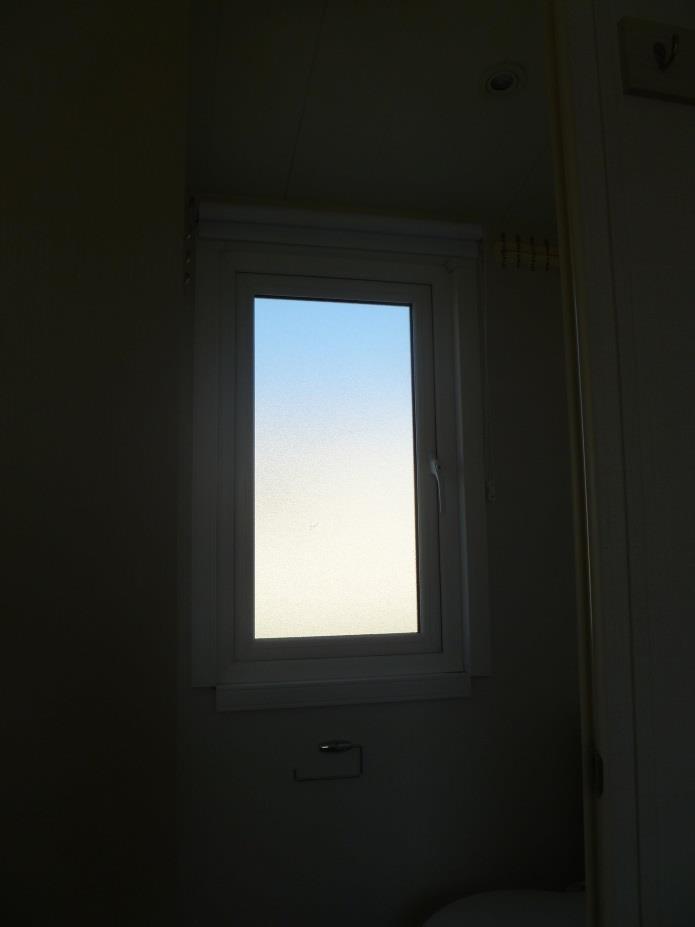
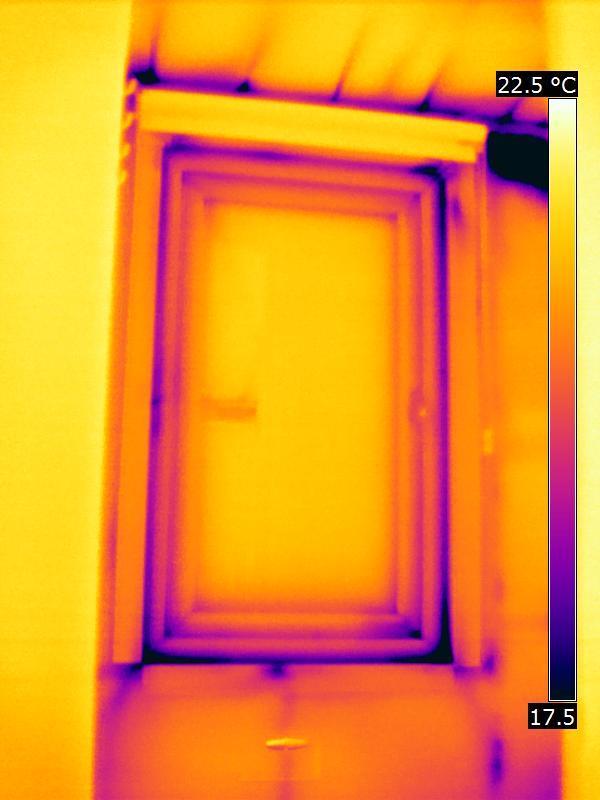
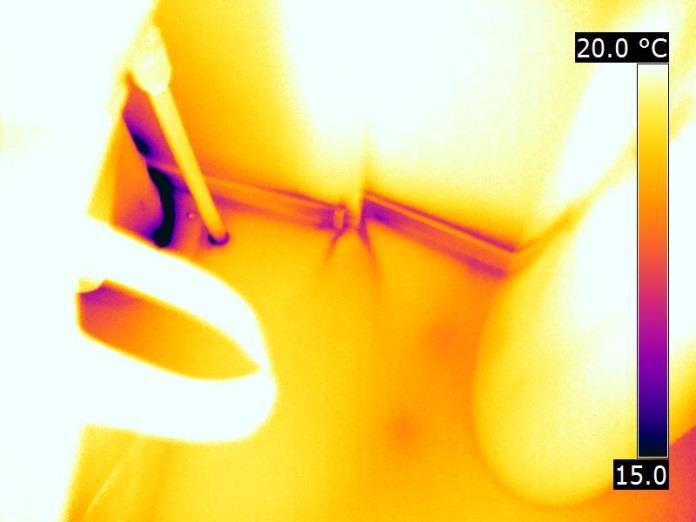
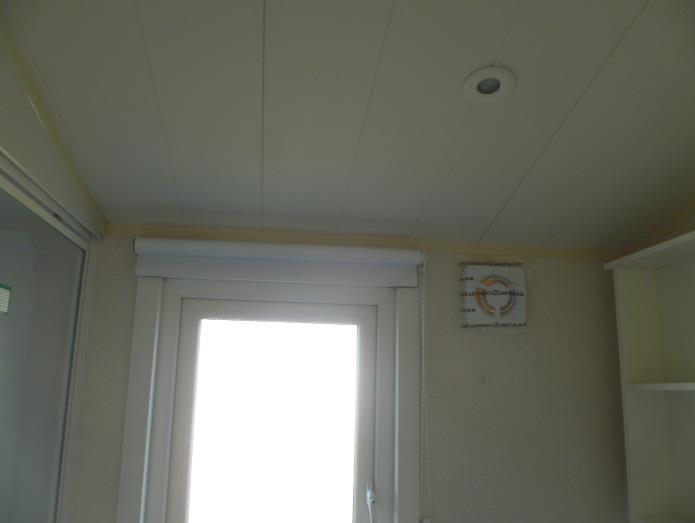
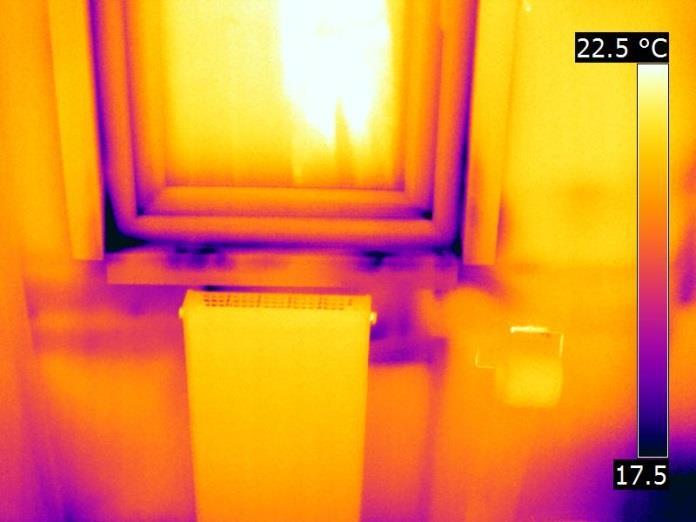
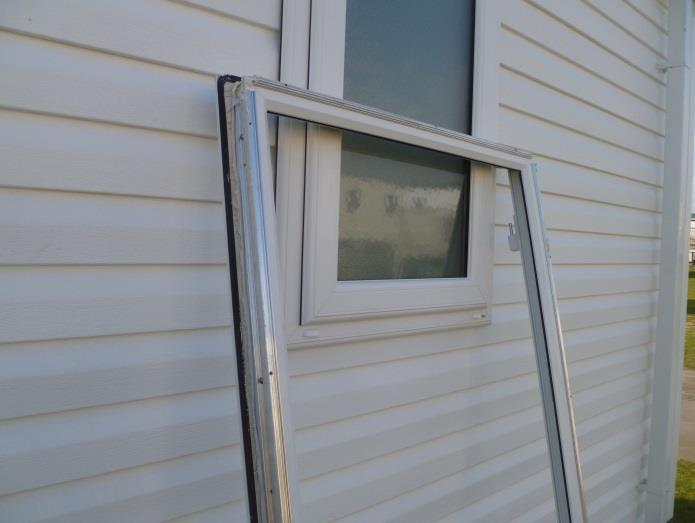
4 Thermal Imaging Method Thermal imaging was performed at various stages throughout the investigation using a Flir B620 Infra-Red Thermal Imaging Camera. Images contained within this section were captured under a natural pressure differential between the inside and outside of the caravans. A selection of thermal images captured under depressurisation is included in the Airtightness section of this report. A full list of all the thermal images captured during this investigation can be found in Appendix 2 - Images 16-Mar & 4. Discussion Figure 1 & Figure 2 show the original and replacement windows in C05. In both examples the thermal images were captured on arrival at the site (on the 18 th and 20 th March respectfully) prior to any other access being gained to the caravan that morning. Additionally, both sets of thermal images were set to a temperature span of 5 ⁰C to allow better direct comparisons to be made between them. The difference in surface temperature, and hence heat loss, due to the replacement glazing is stark; the surface temperatures of the original glazing were the lowest observable temperatures in the images, indicating the maximum heat loss and the first or most likely areas to foster surface condensation. Original Window 18-Mar-2015 Replacement Window 20-Mar-2015 Figure 1: C05 Kitchen window original and replacement Original Window 18-Mar-2015 Replacement Window 20-Mar-2015 Leeds Sustainability Institute 4


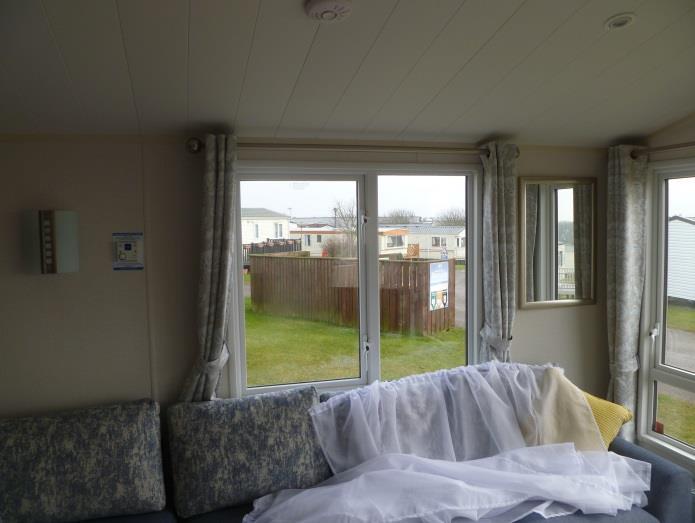
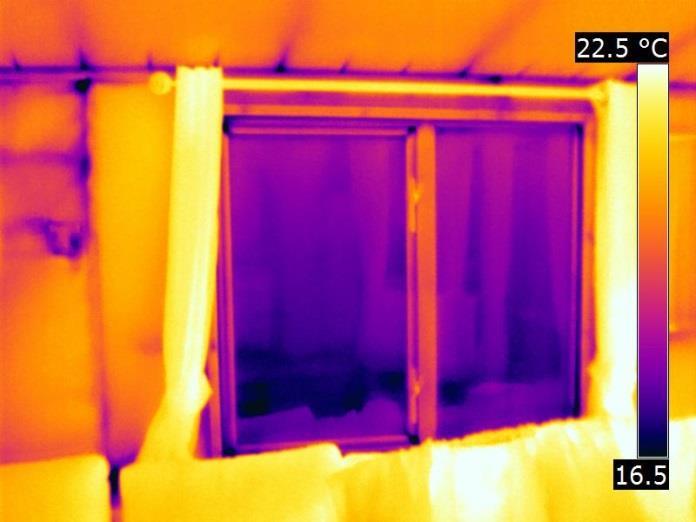
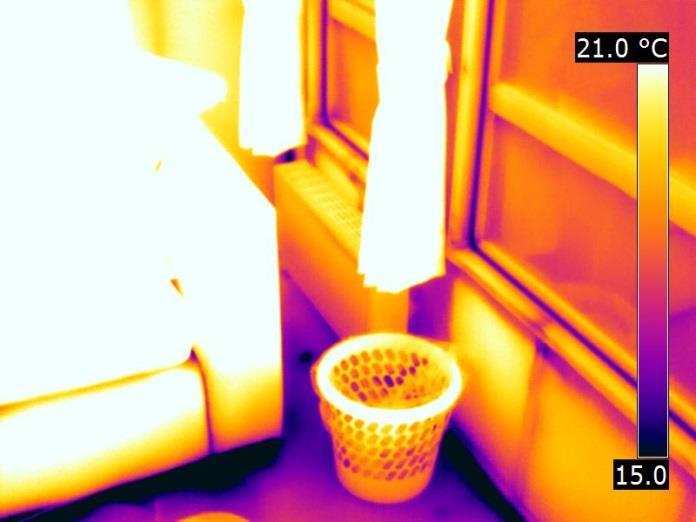
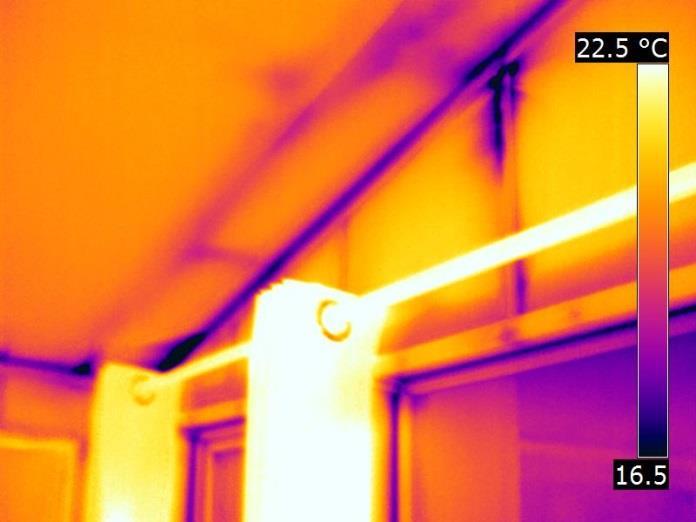
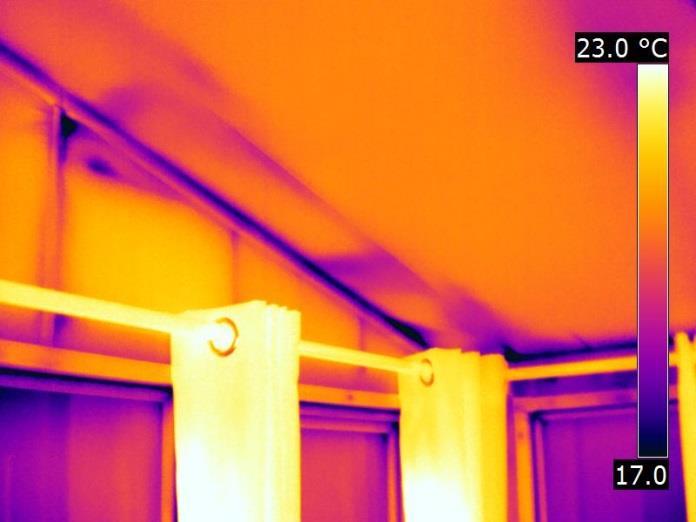
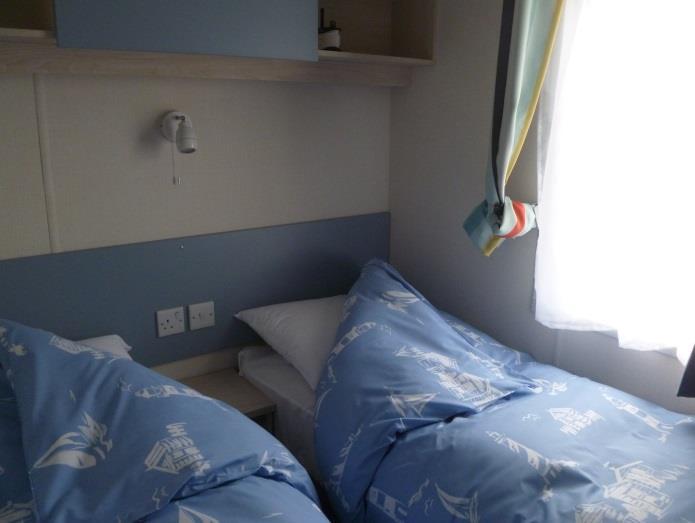
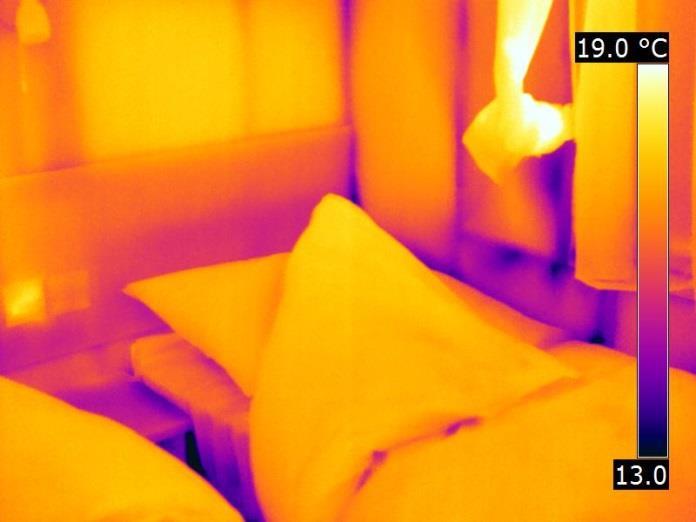
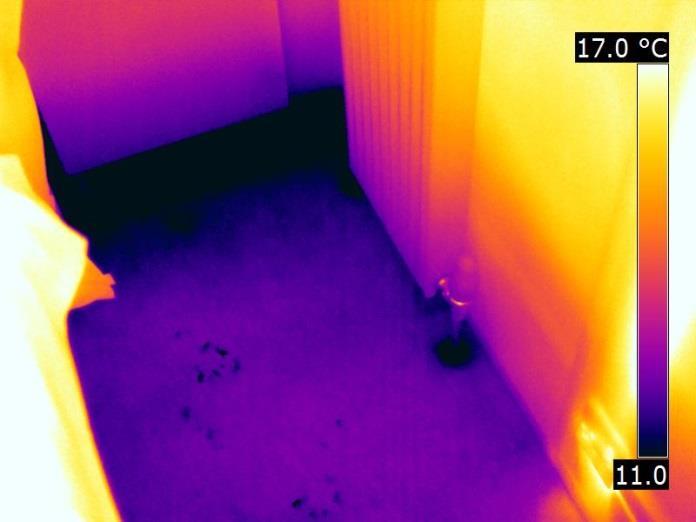
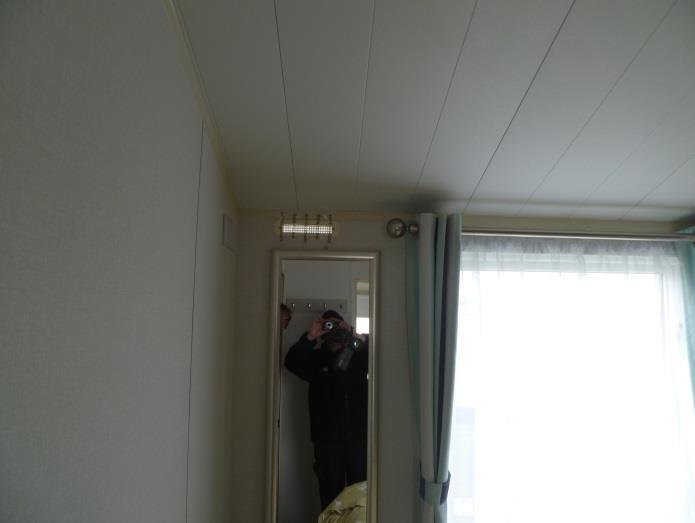
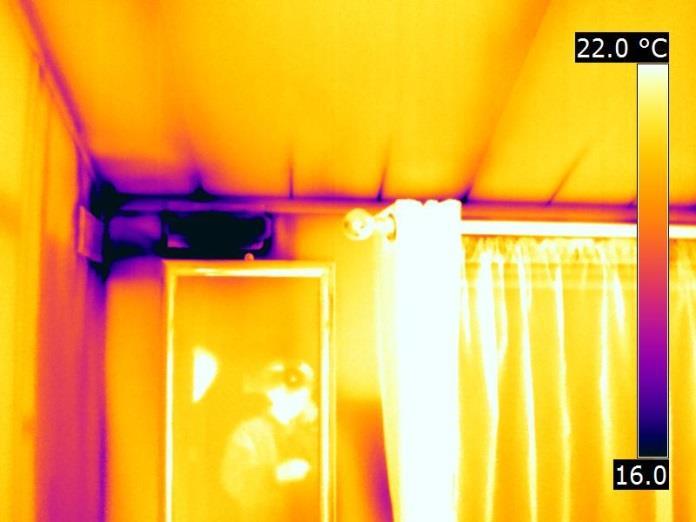
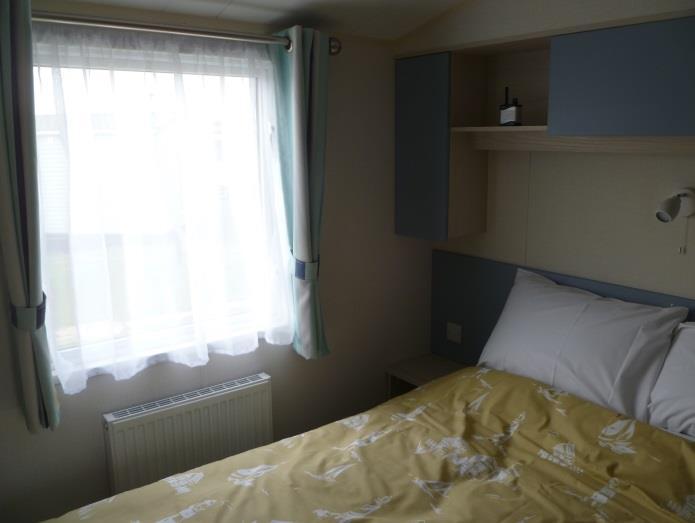
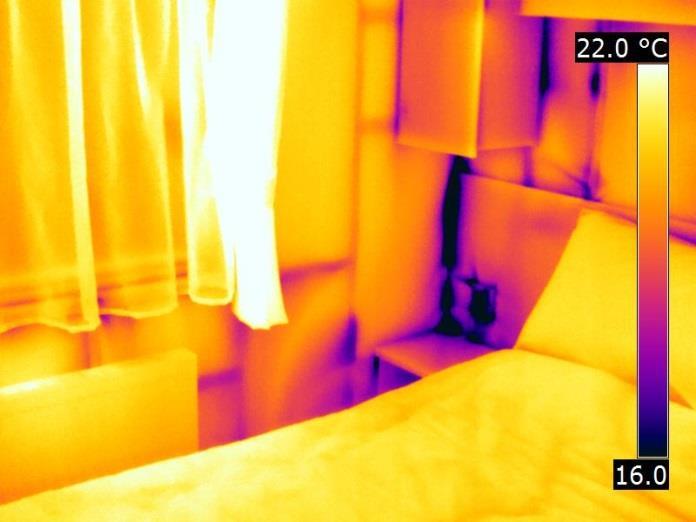
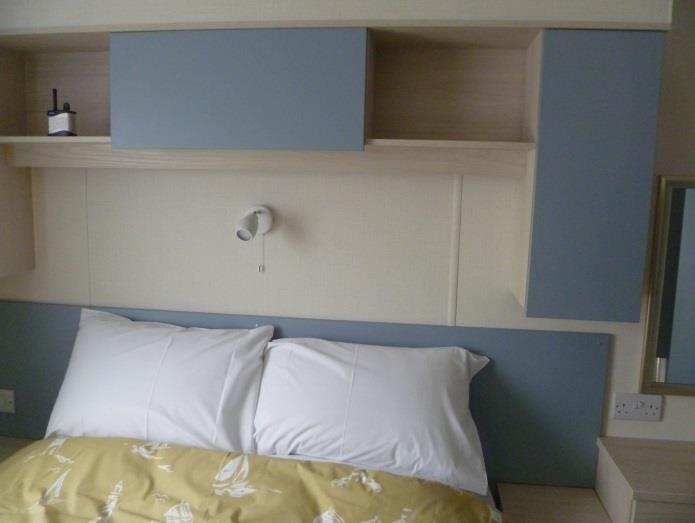
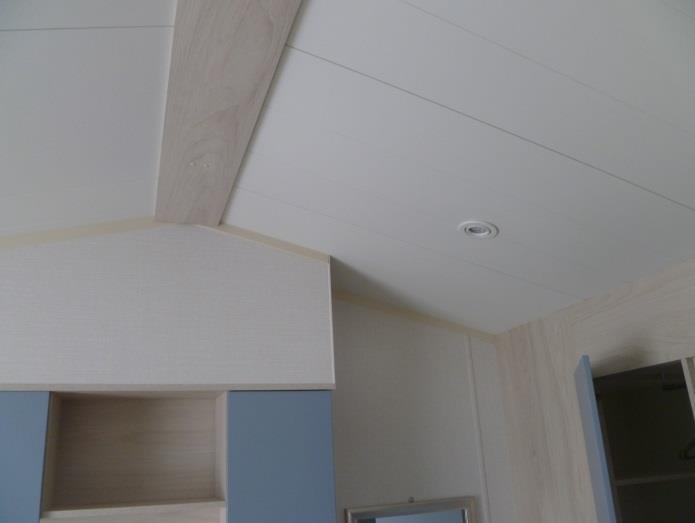
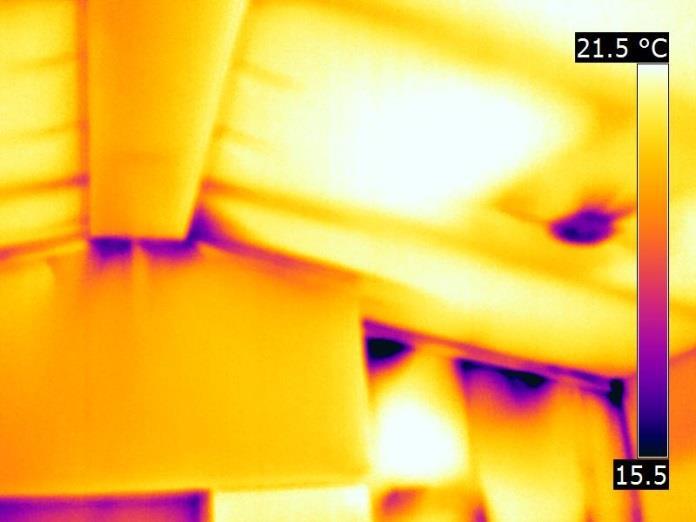
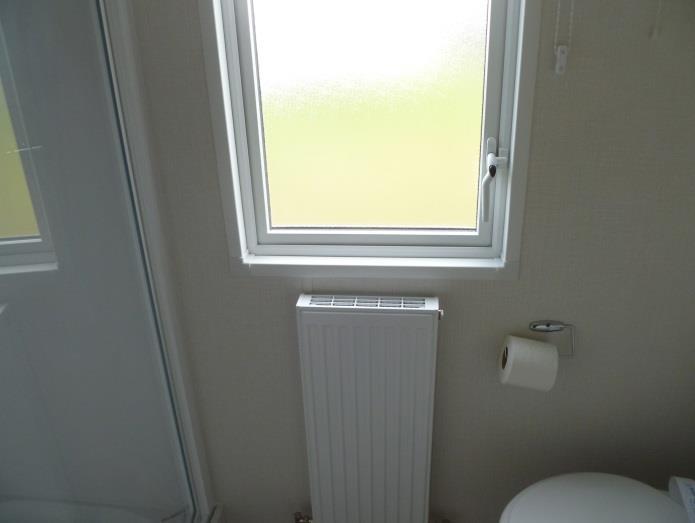
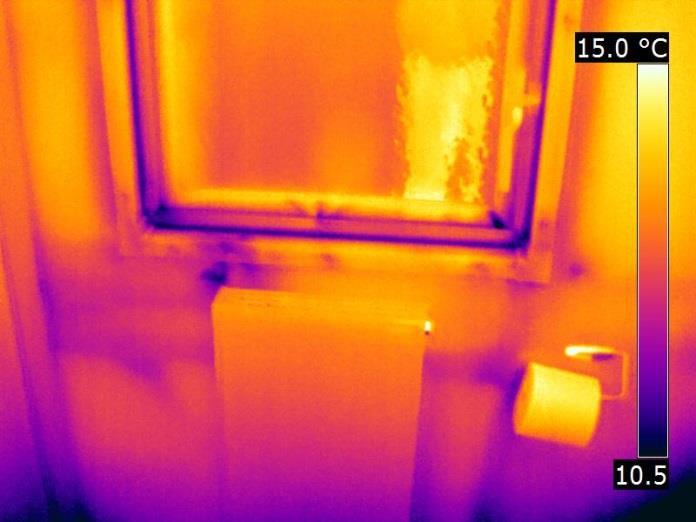
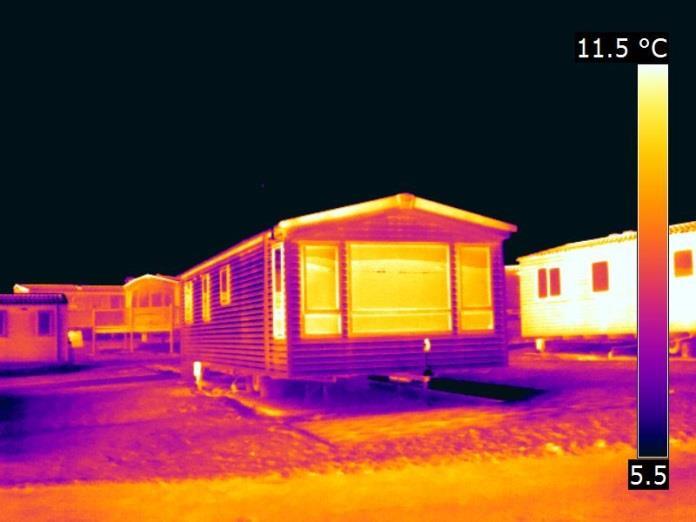
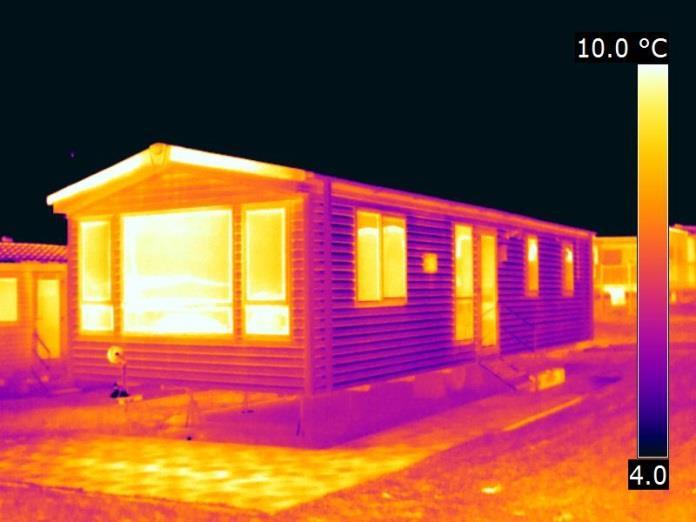
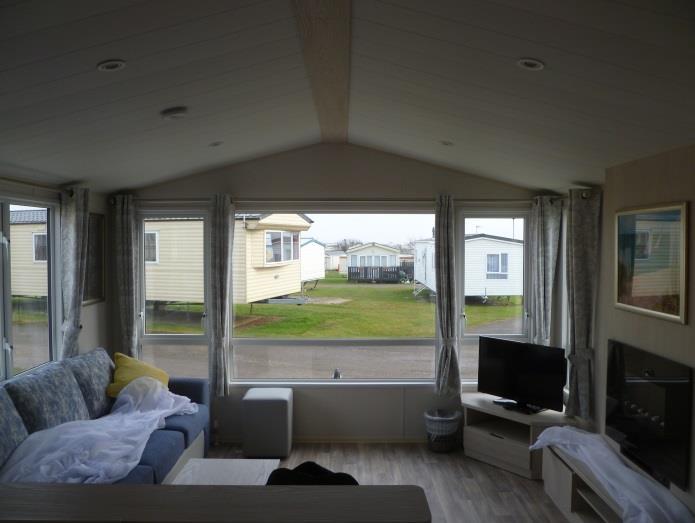
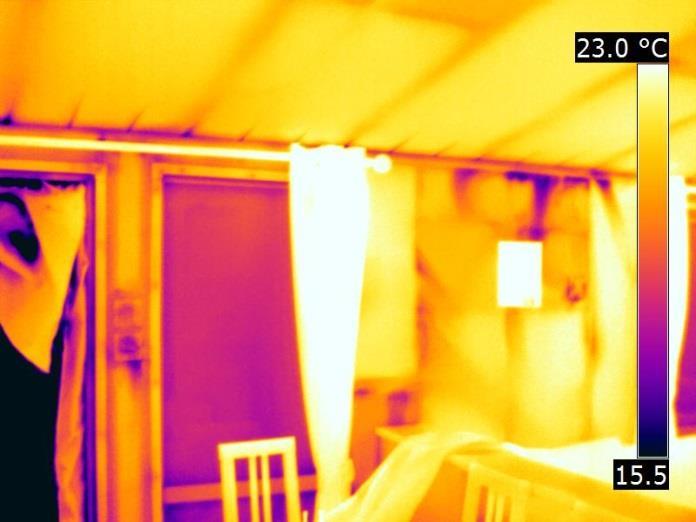
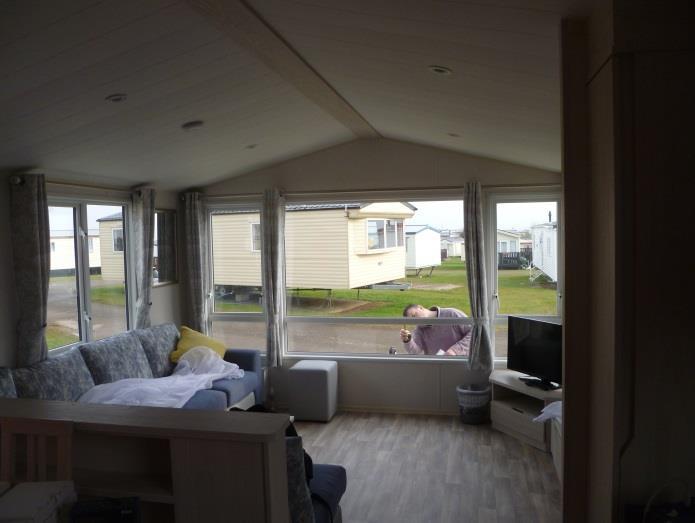
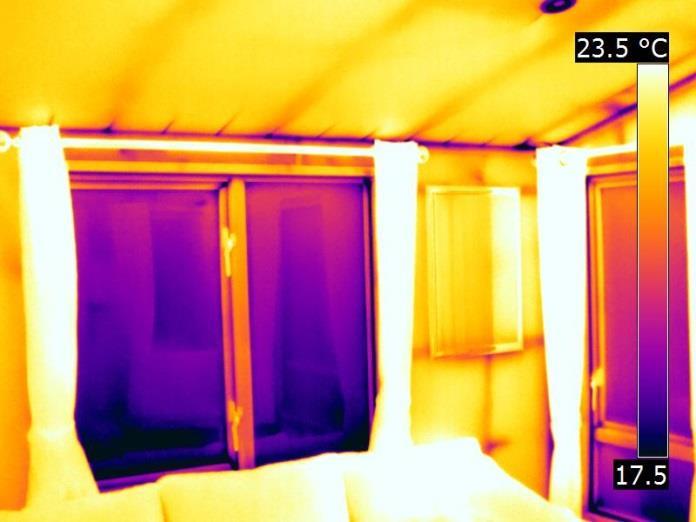
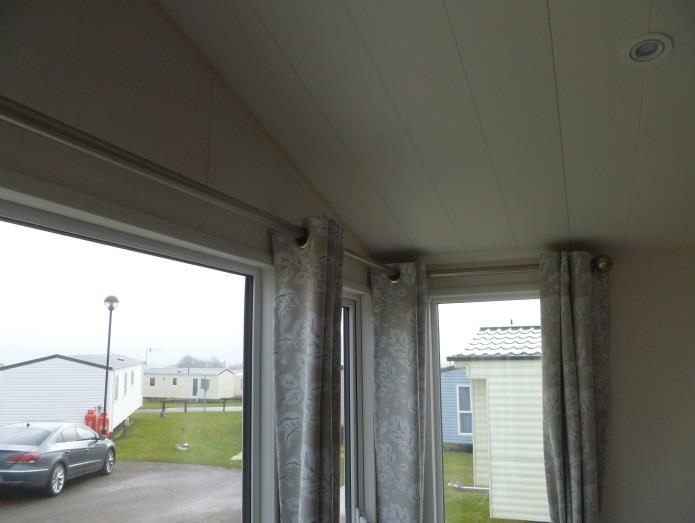
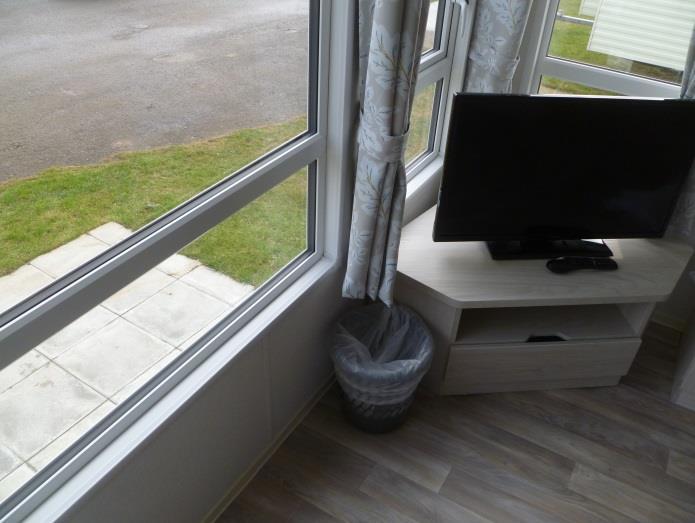
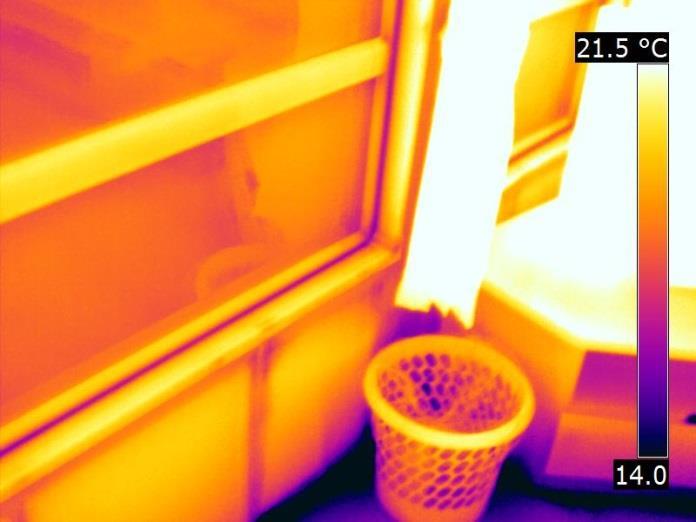
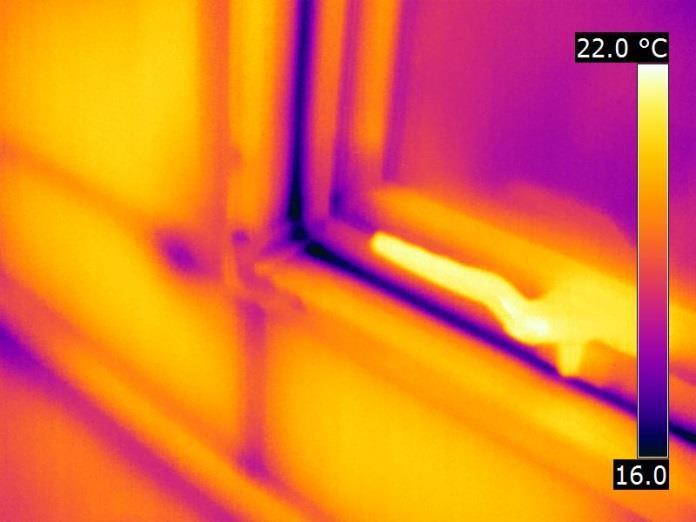
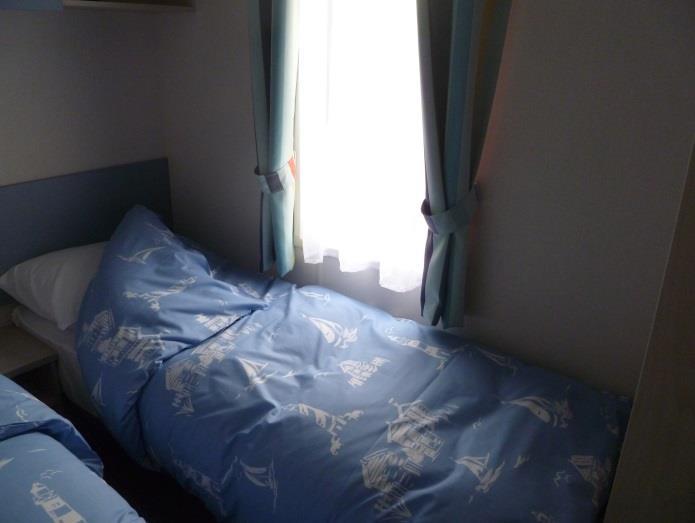
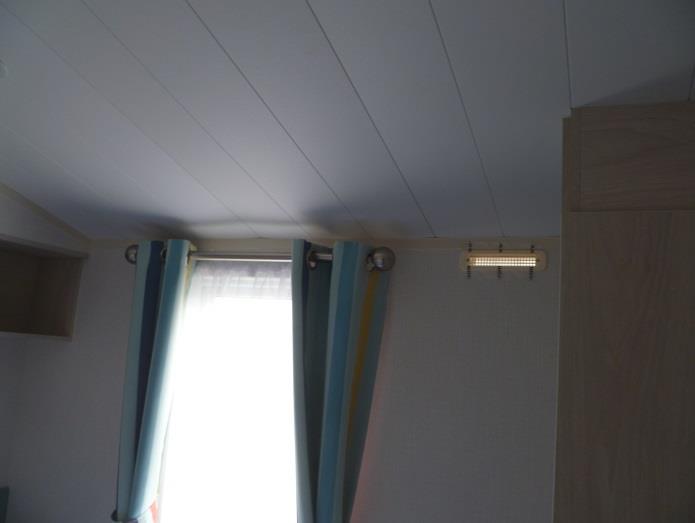
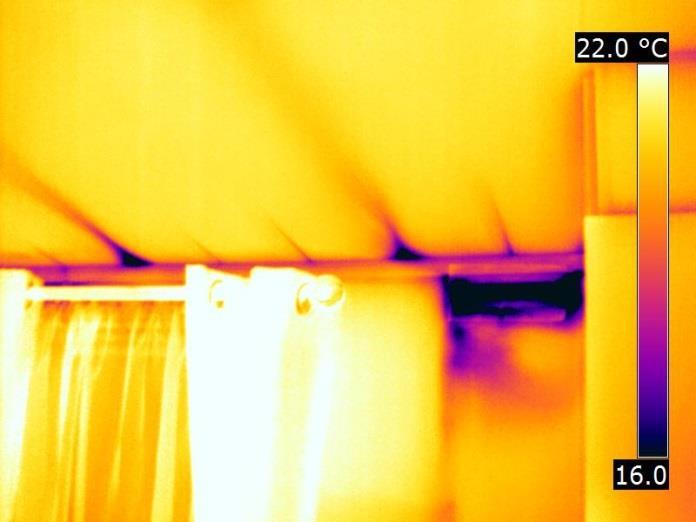
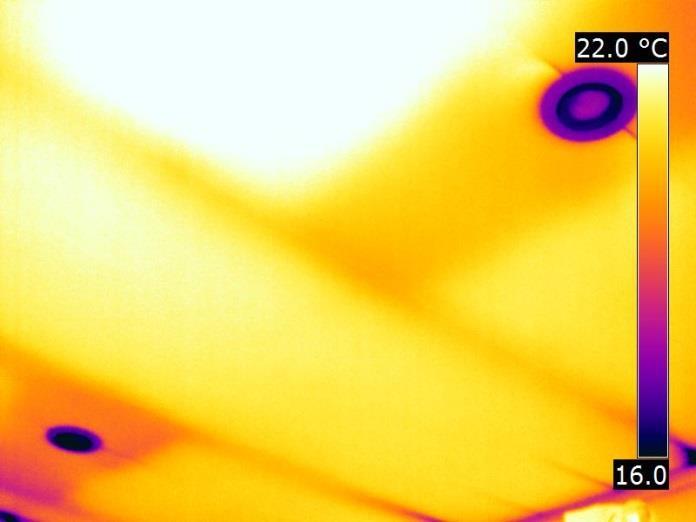
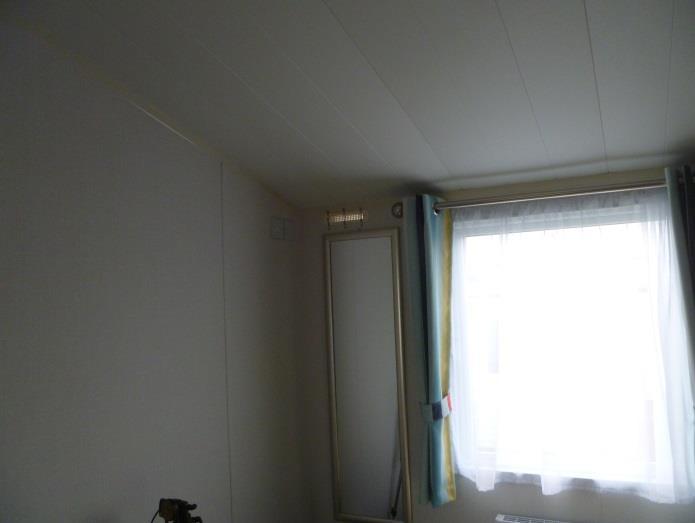
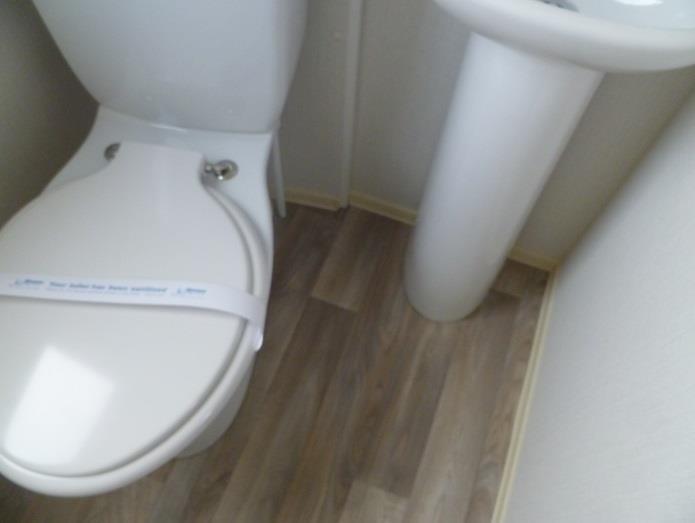
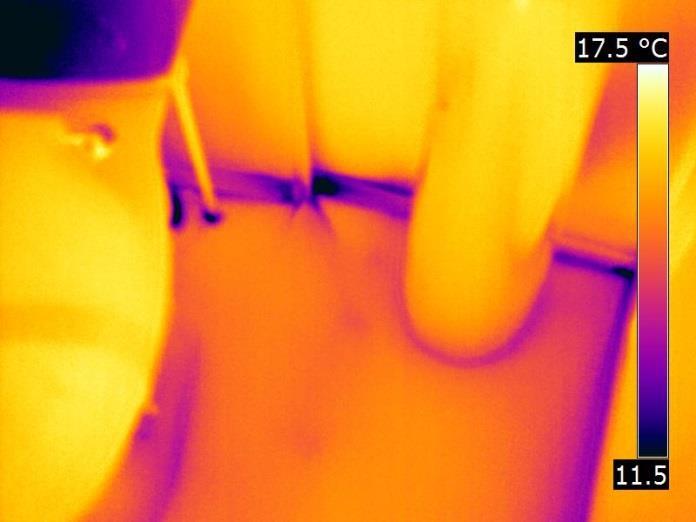
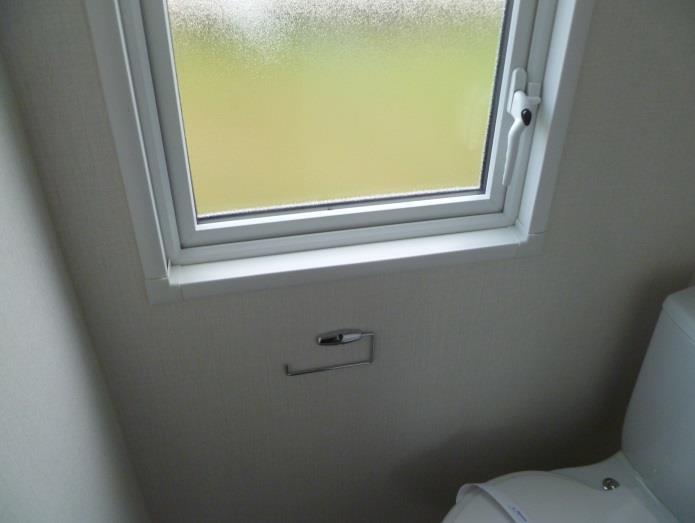
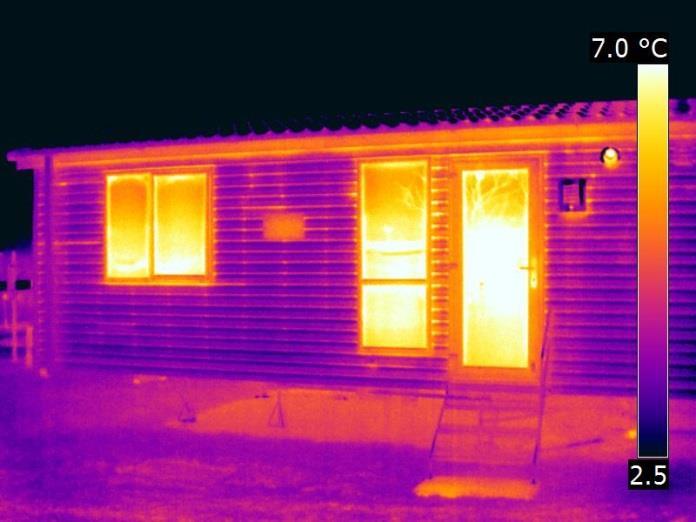
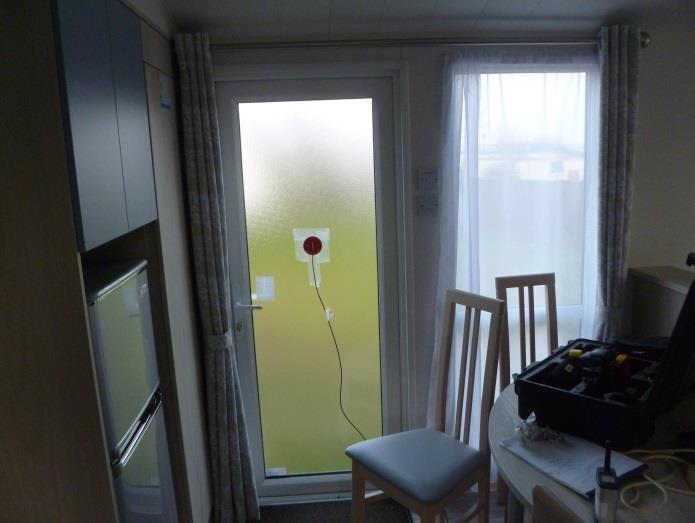
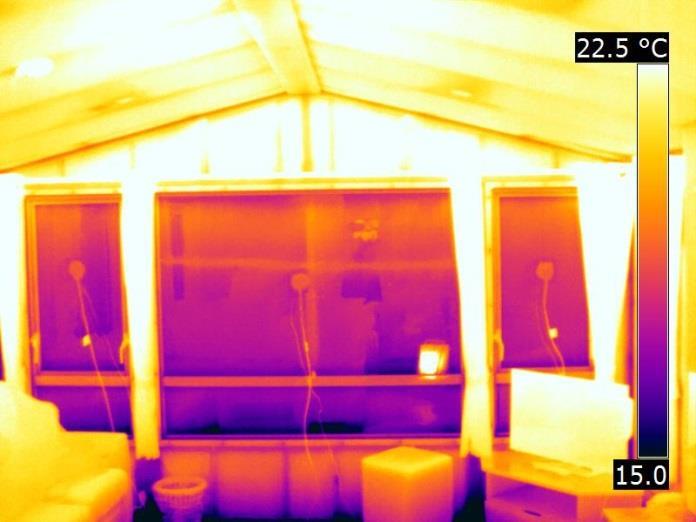
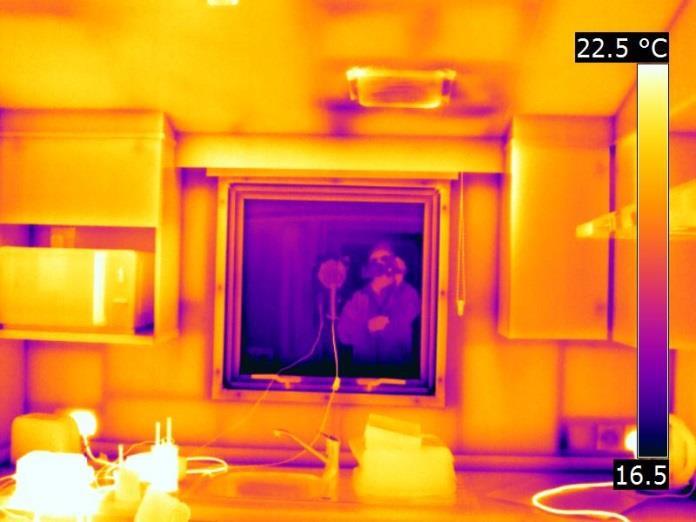
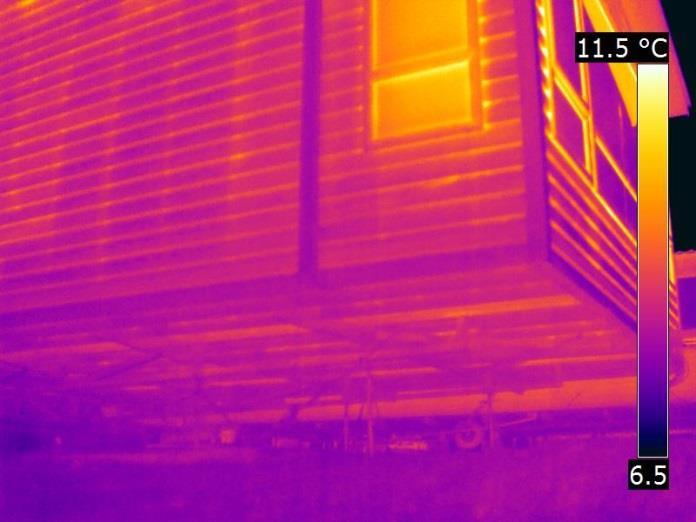
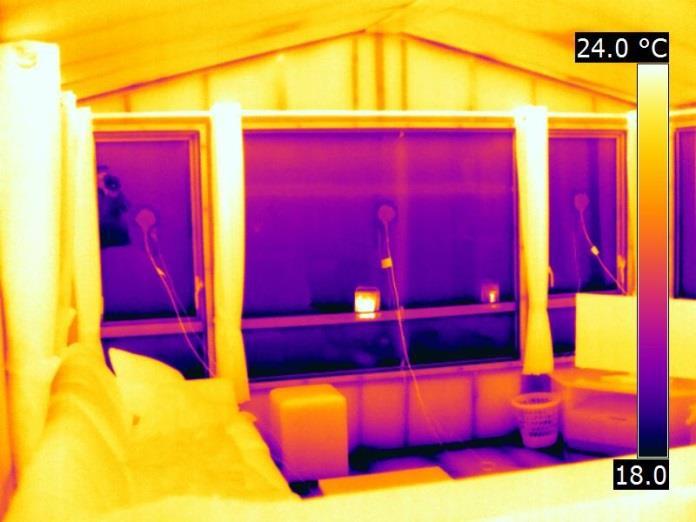
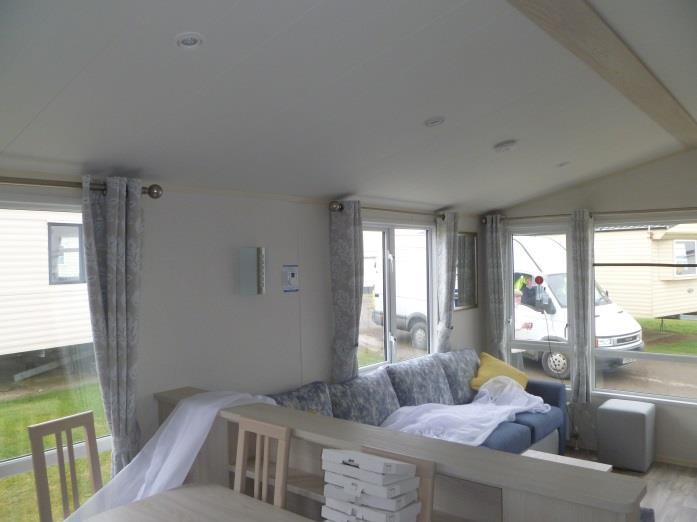
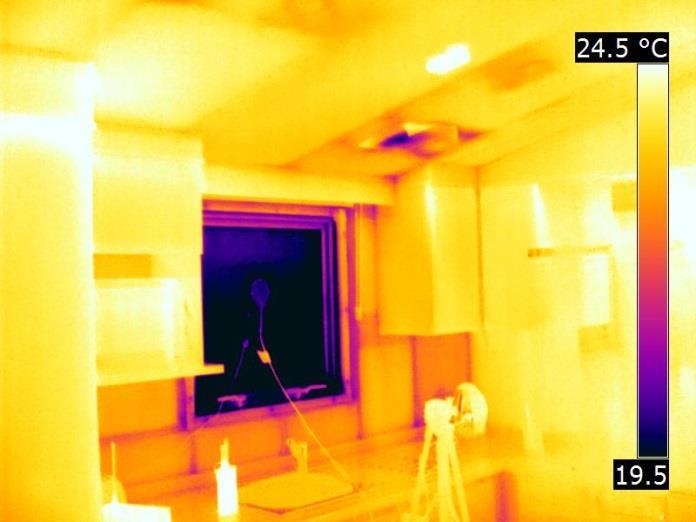
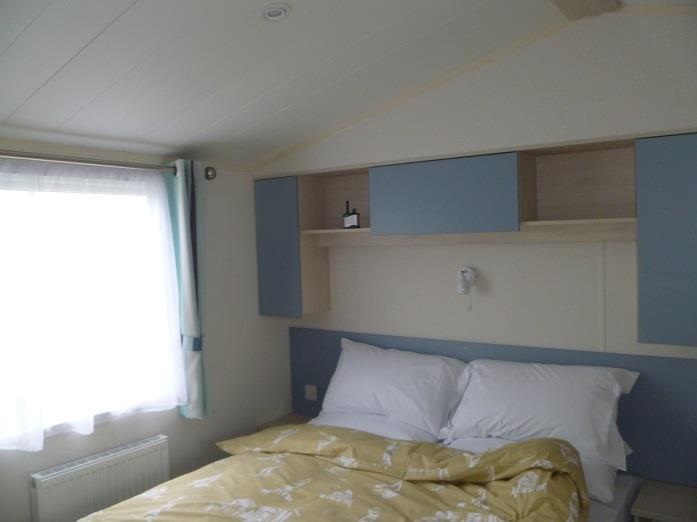
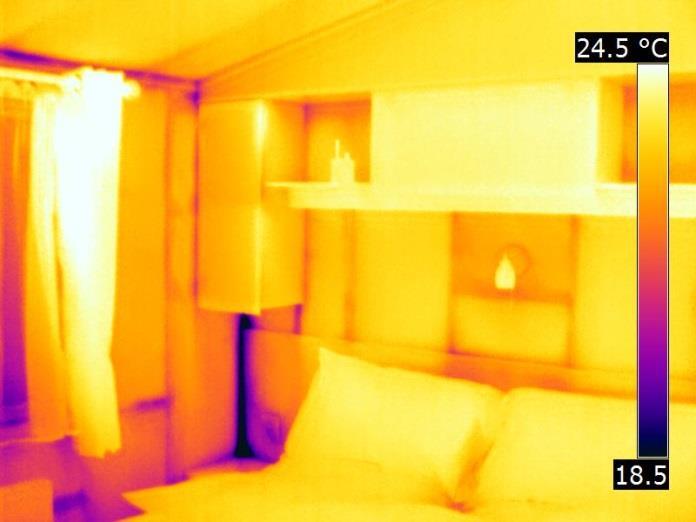
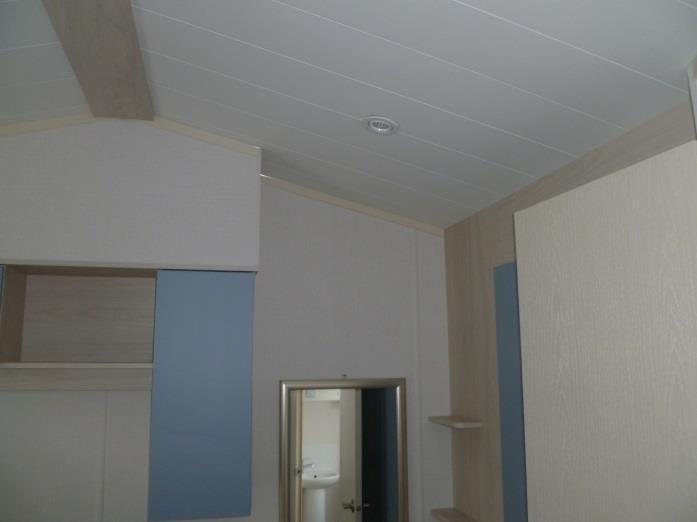
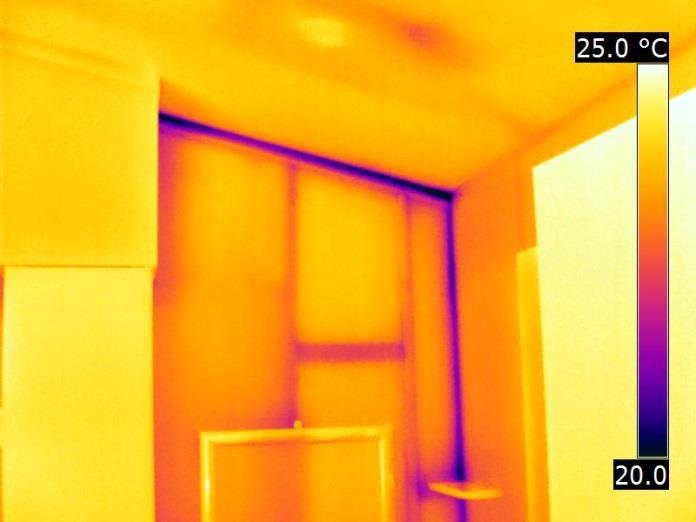
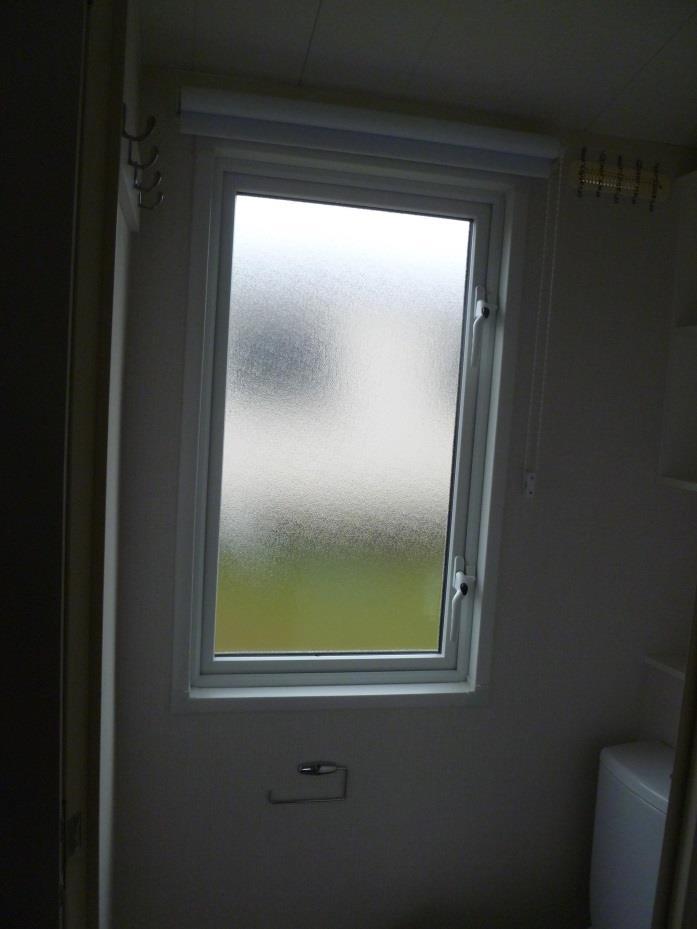
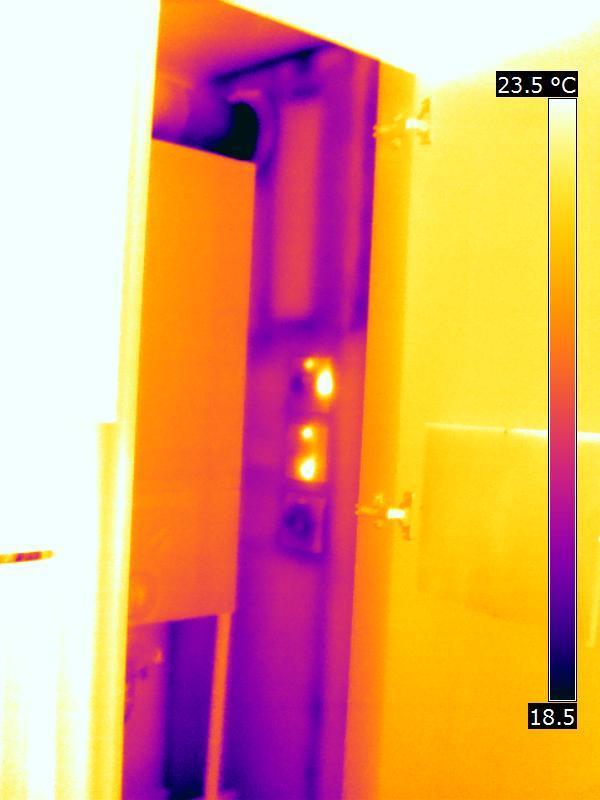
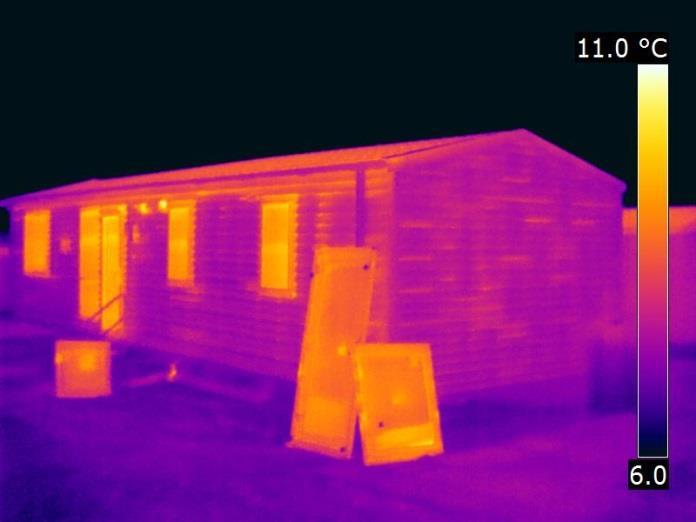
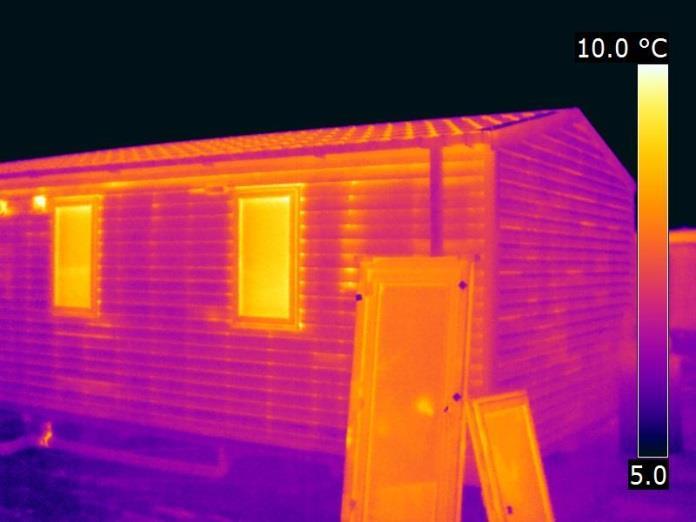
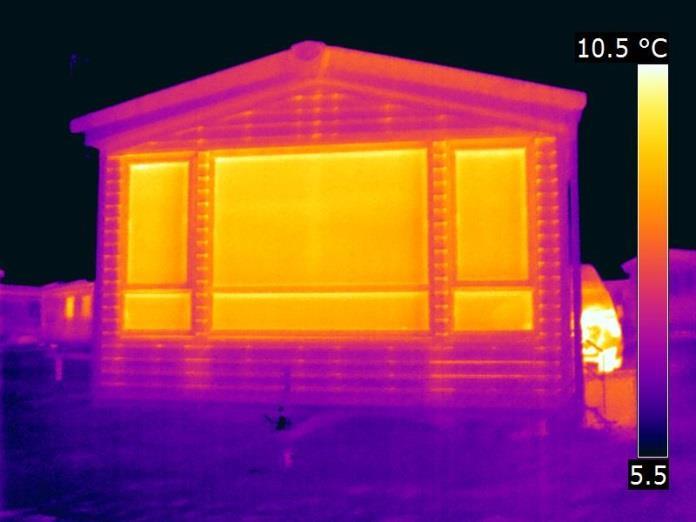
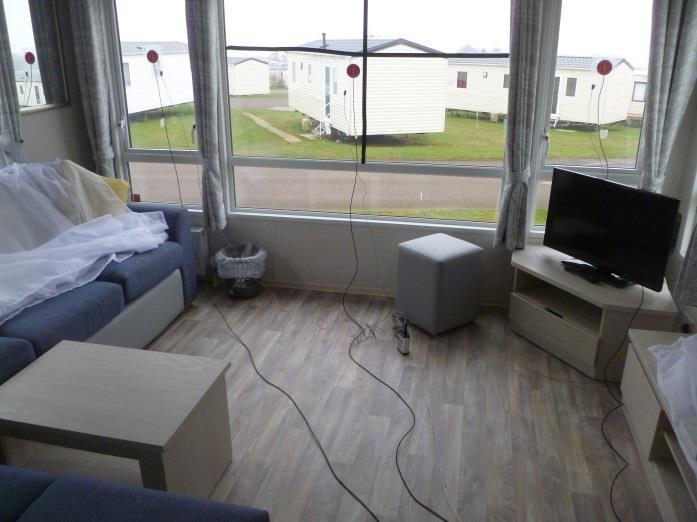
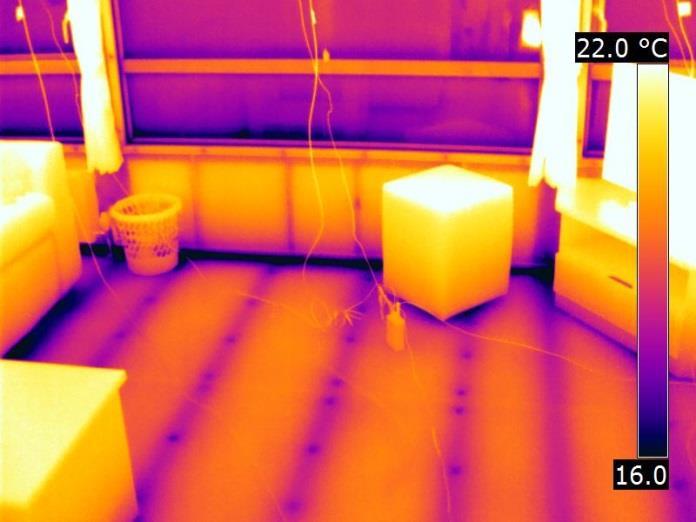
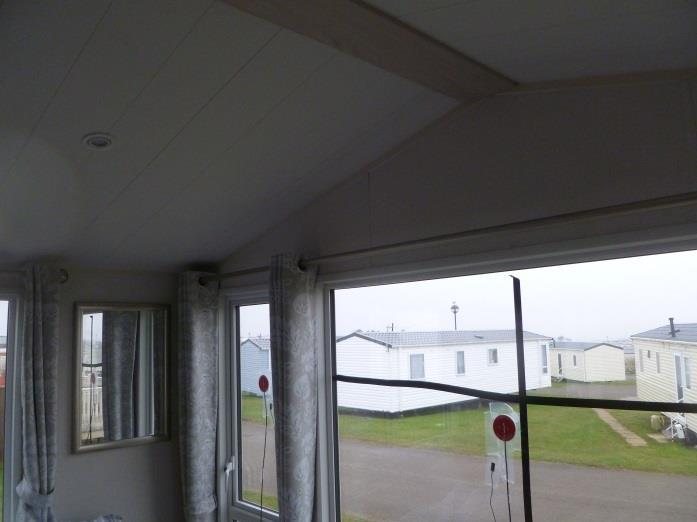
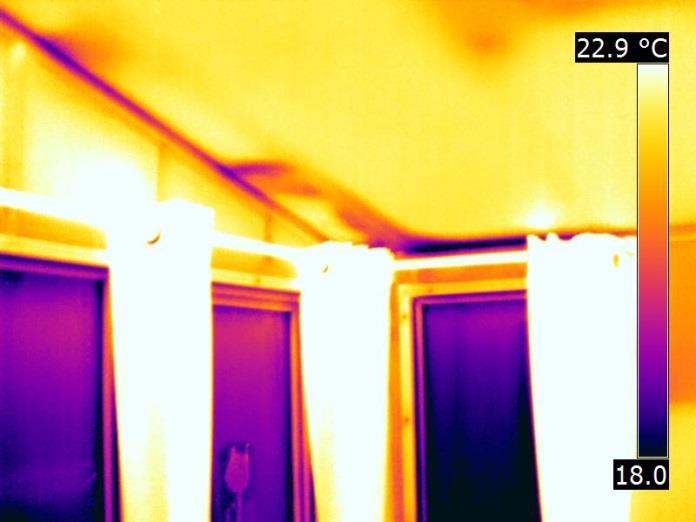
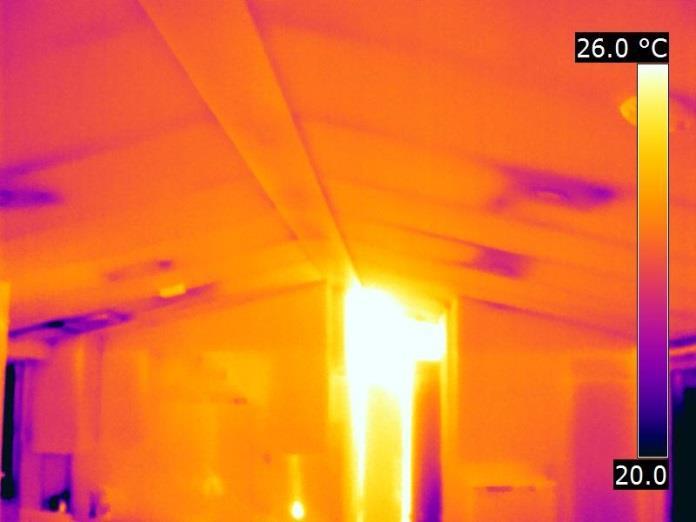
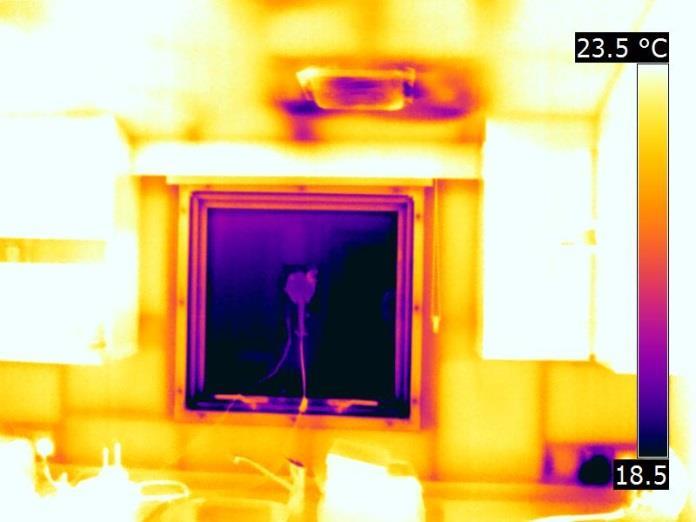
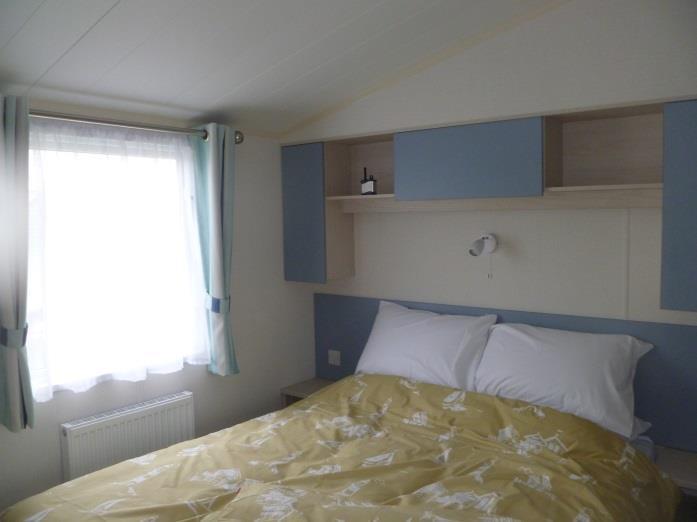
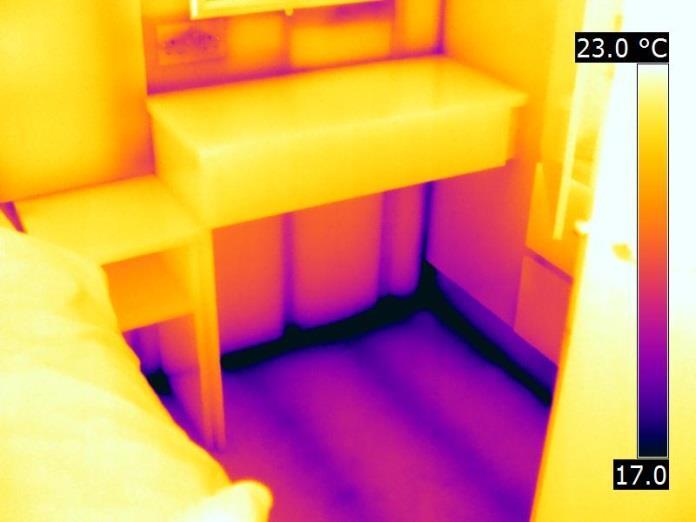
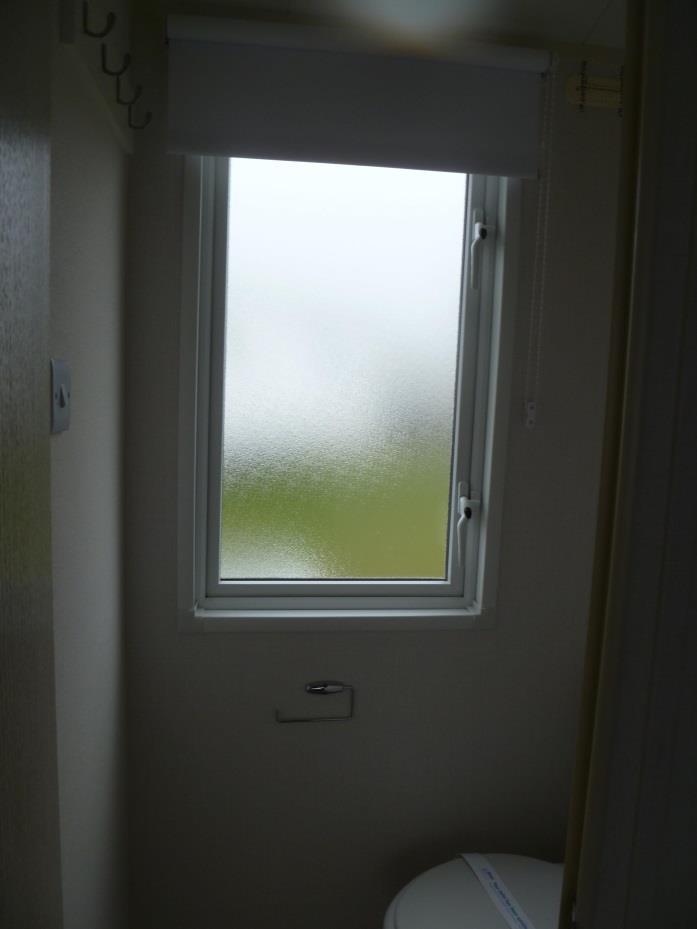
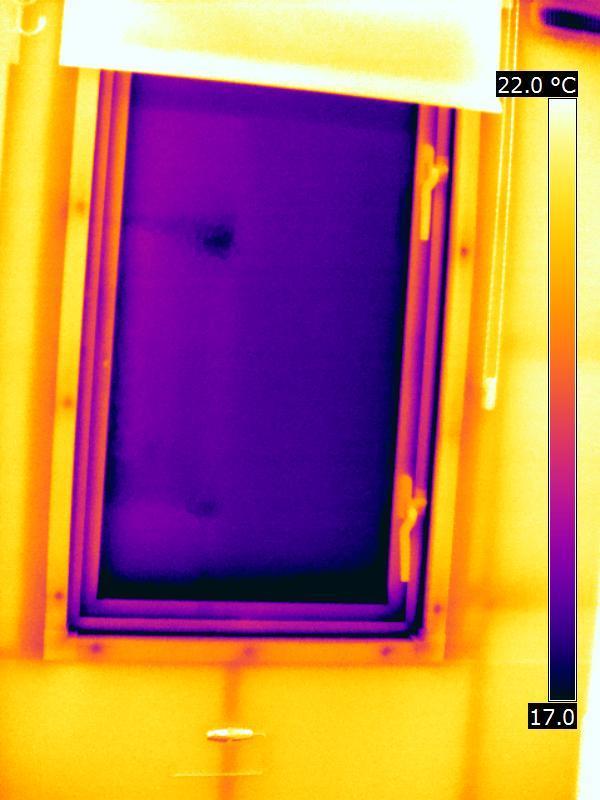
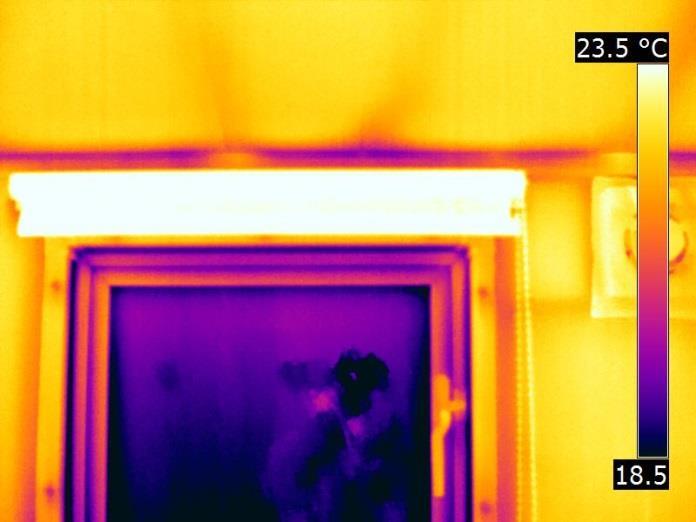
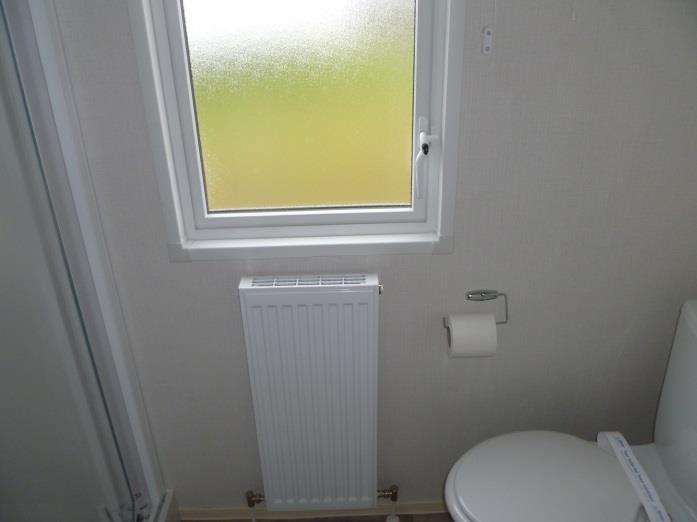
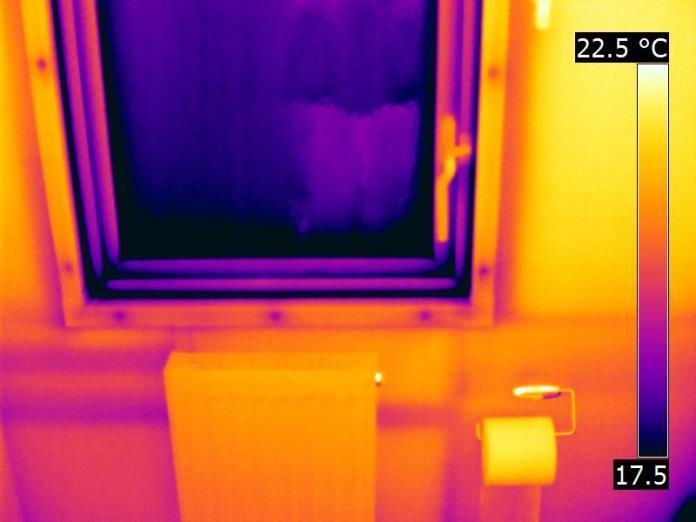
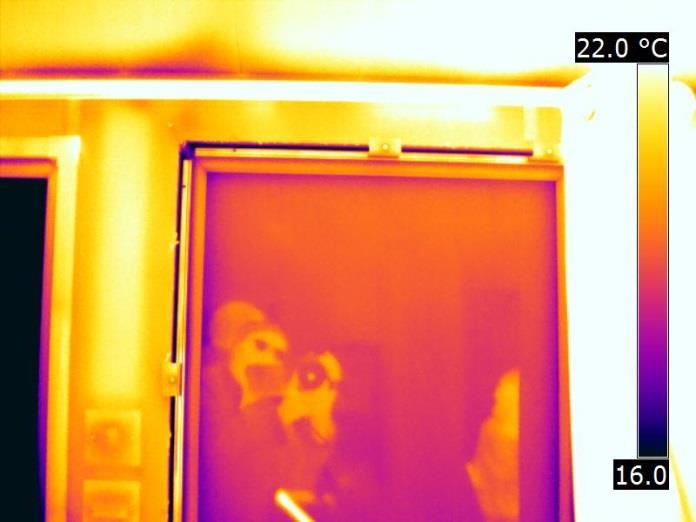
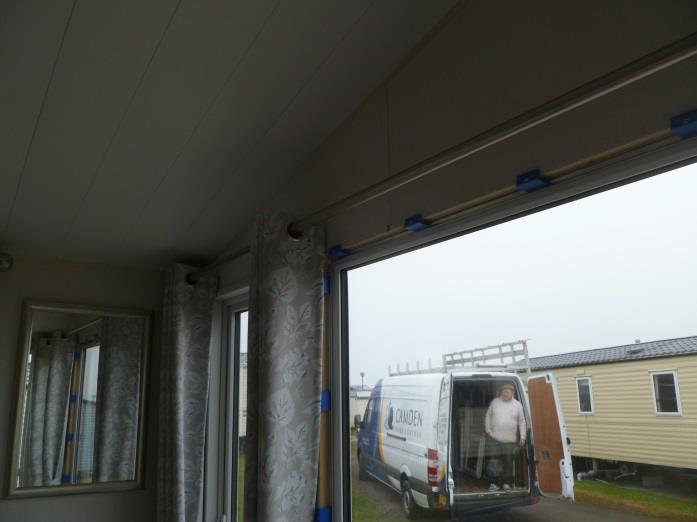
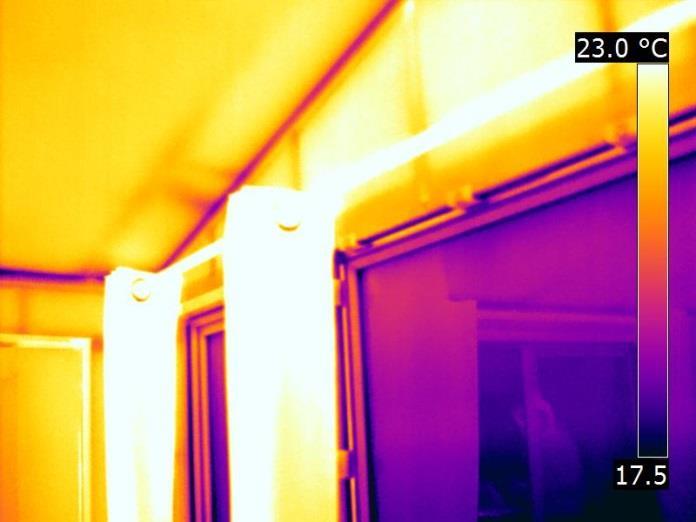
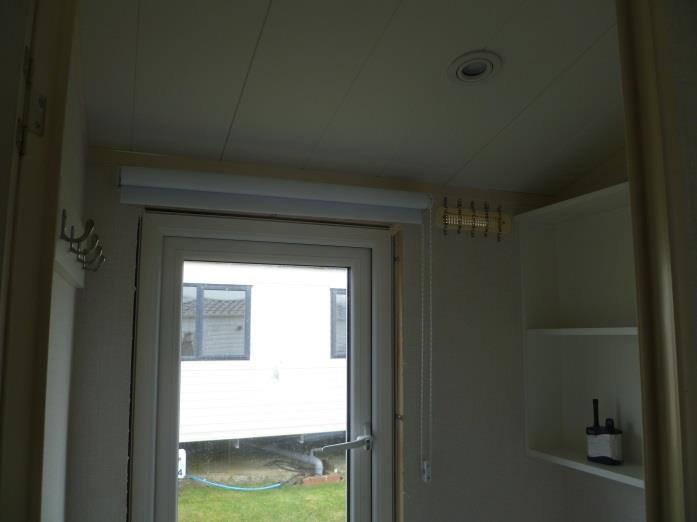
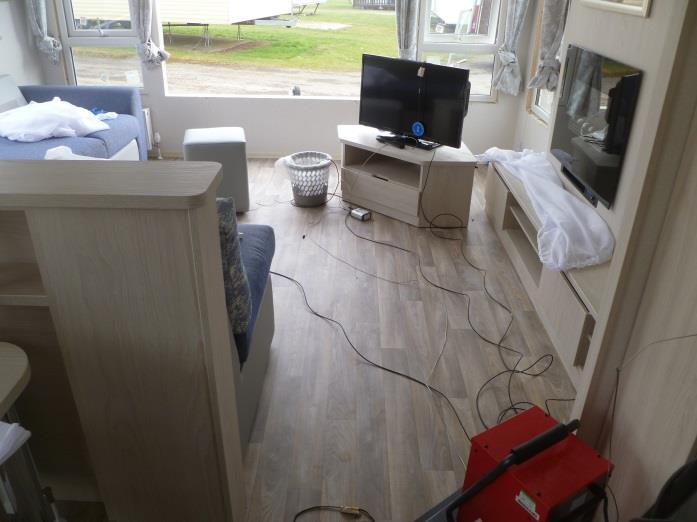
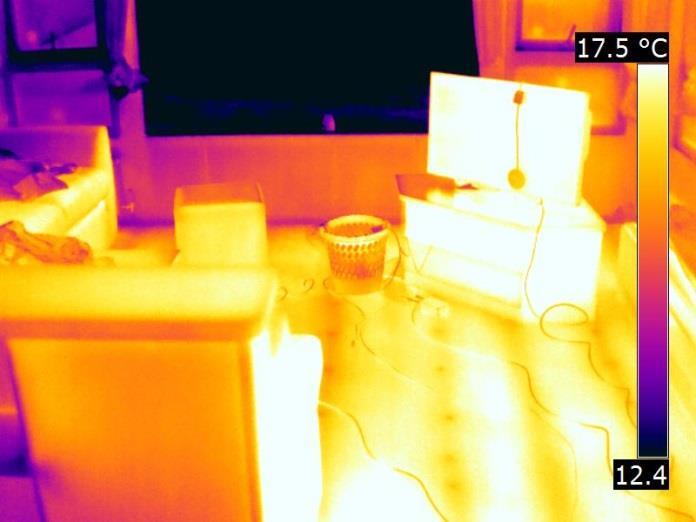
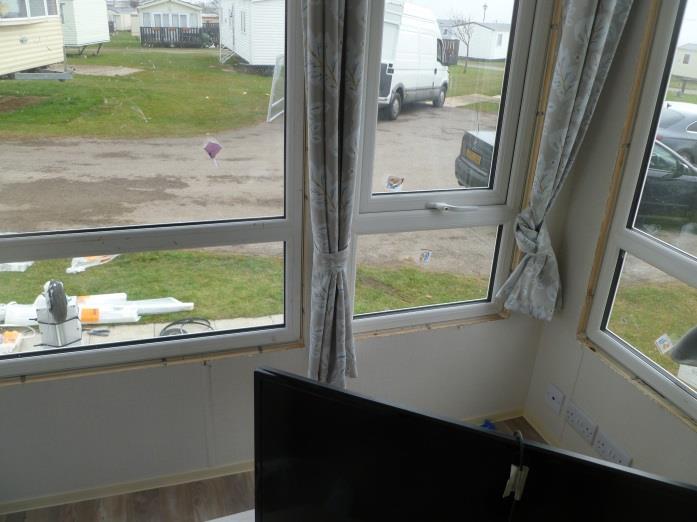
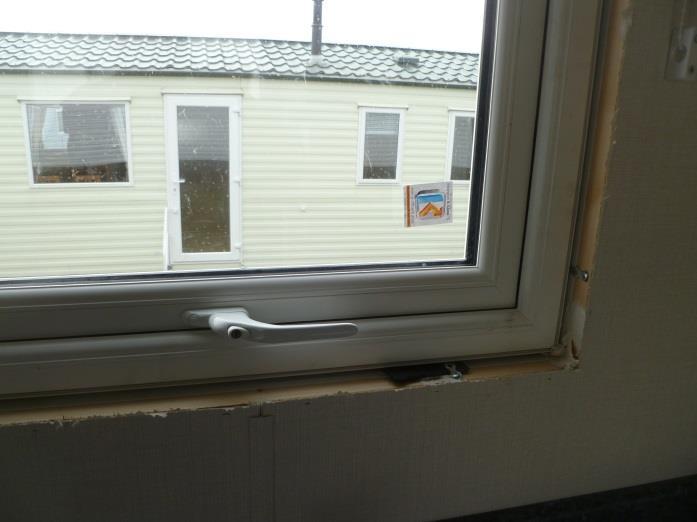
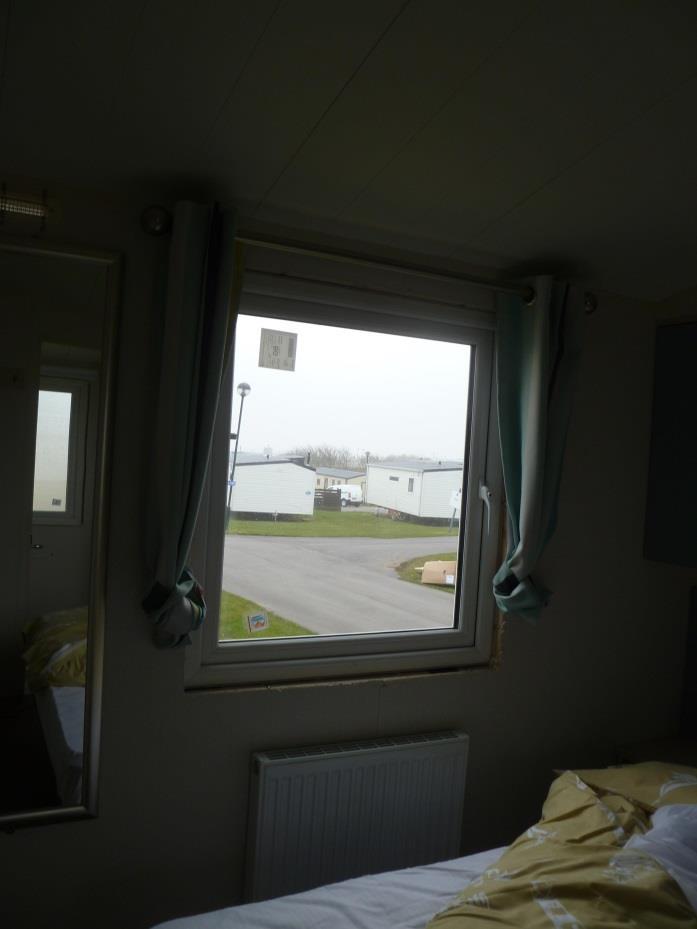
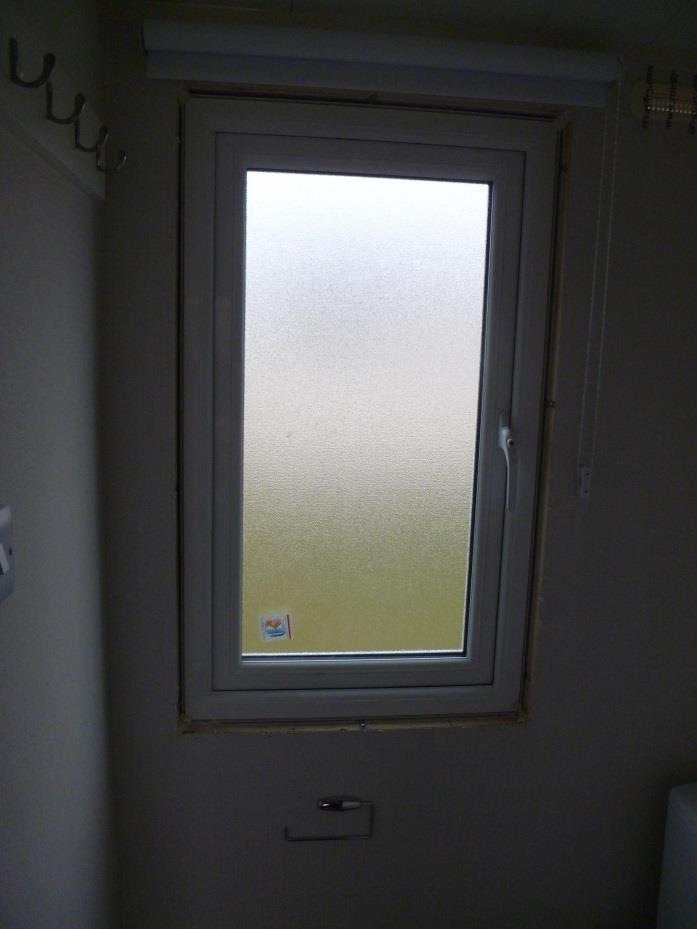
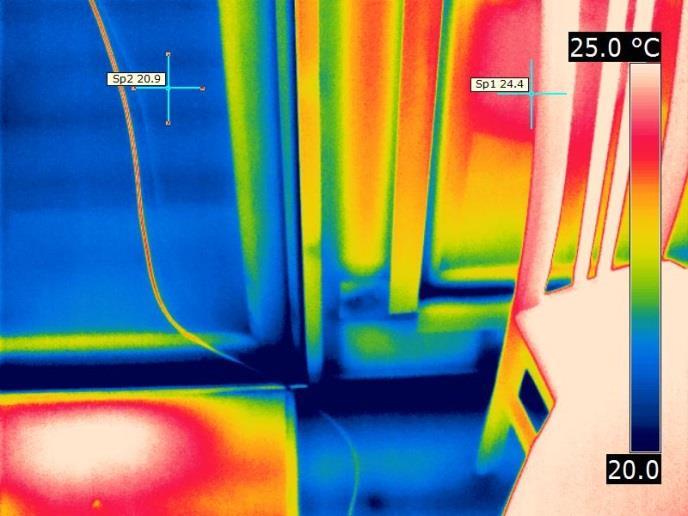
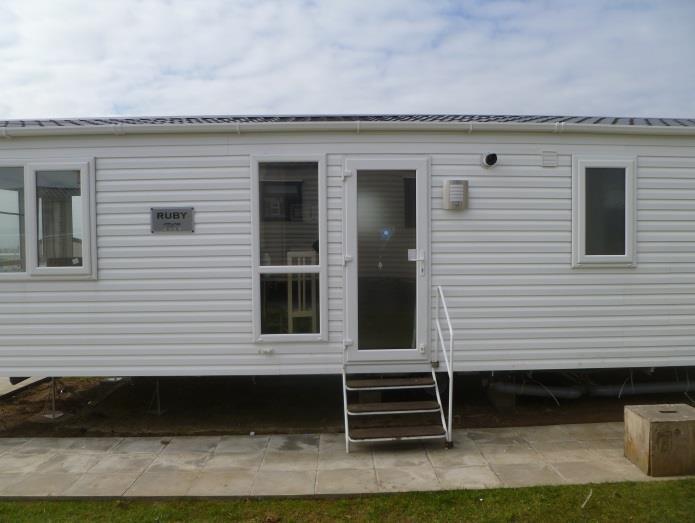
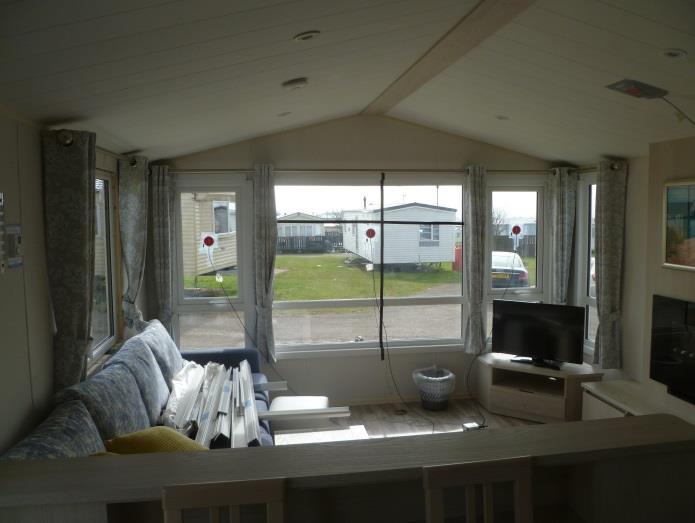
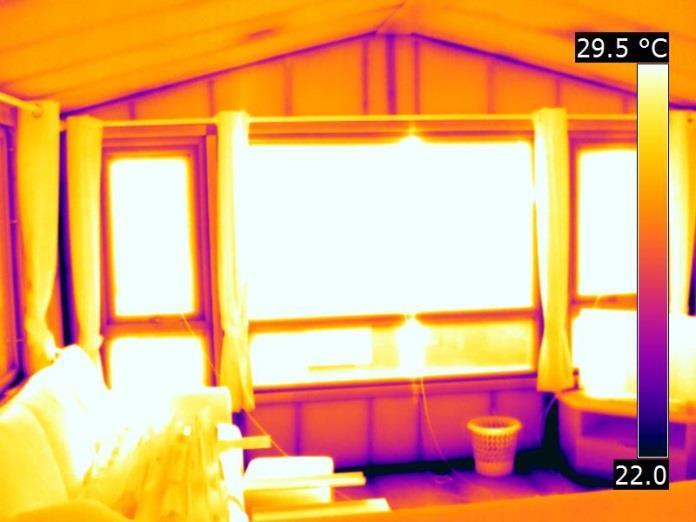
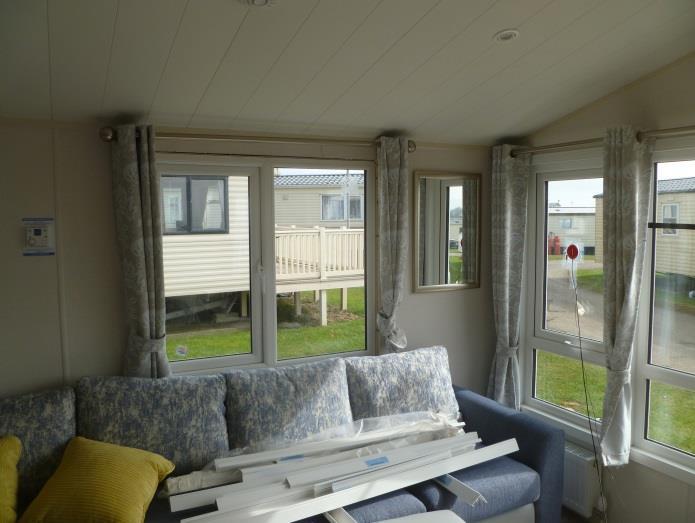
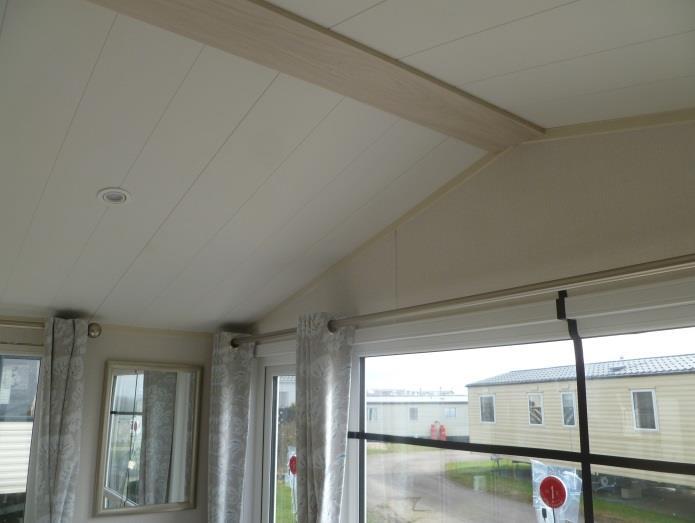
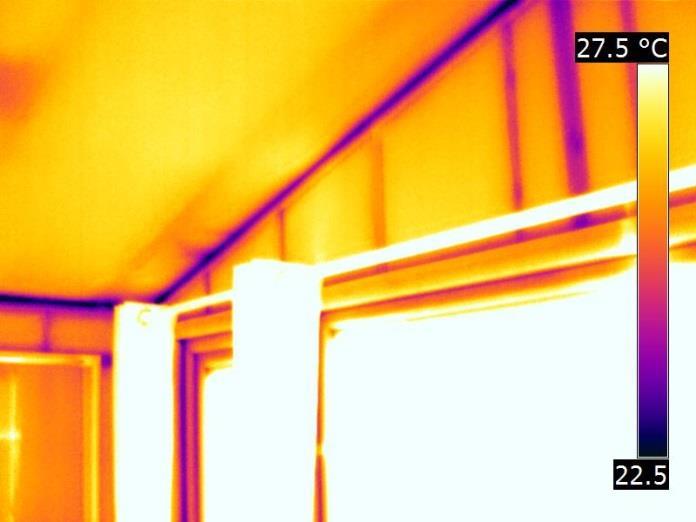
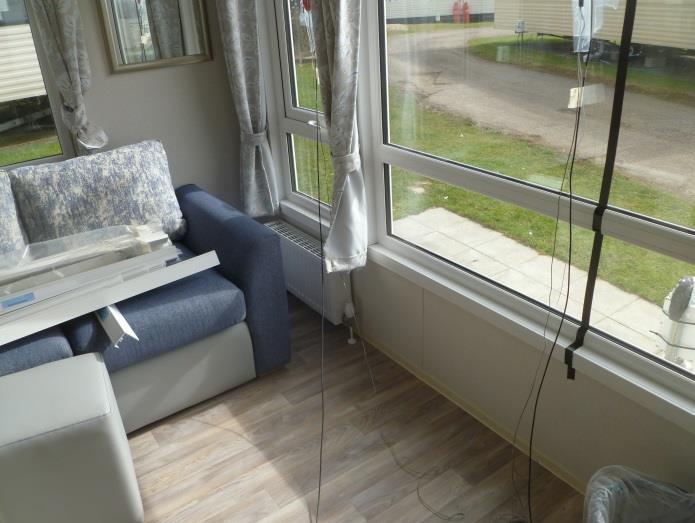
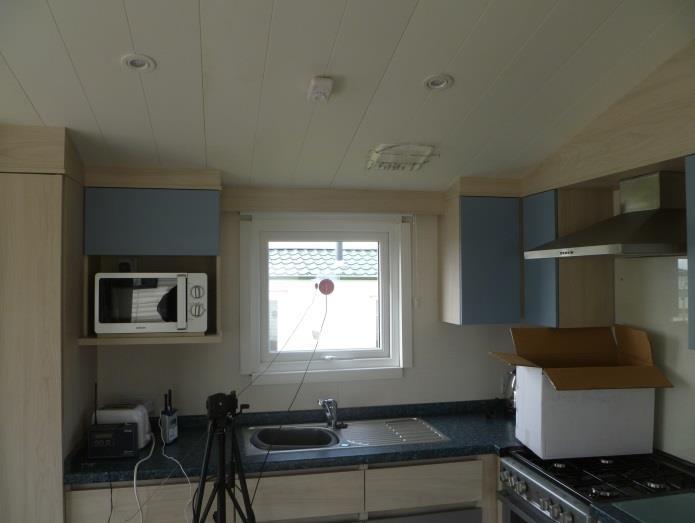
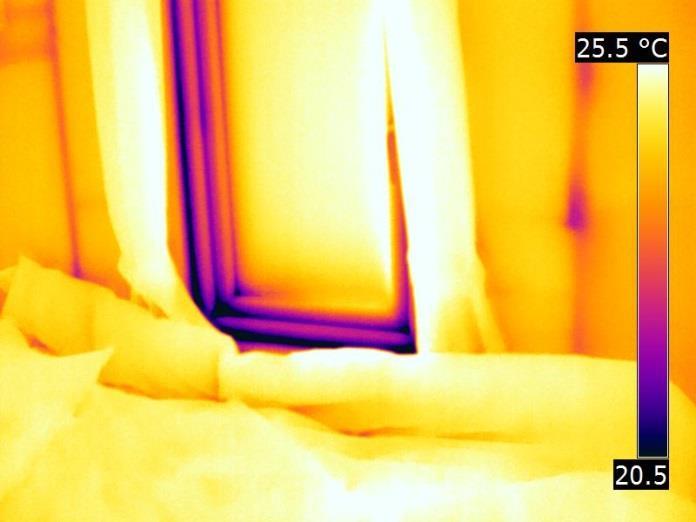
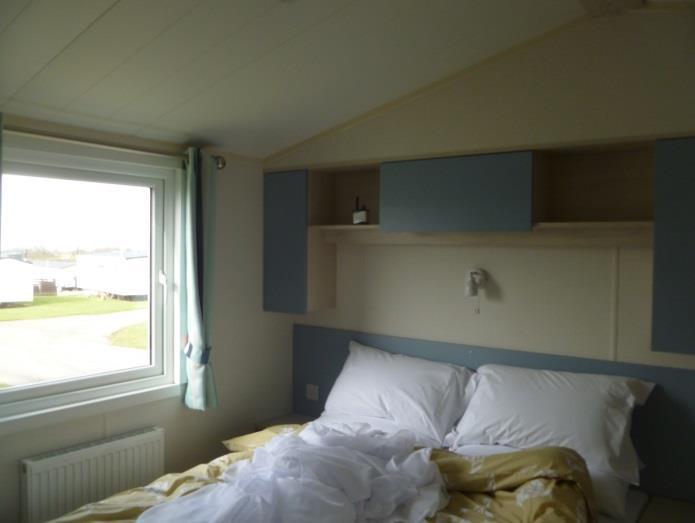
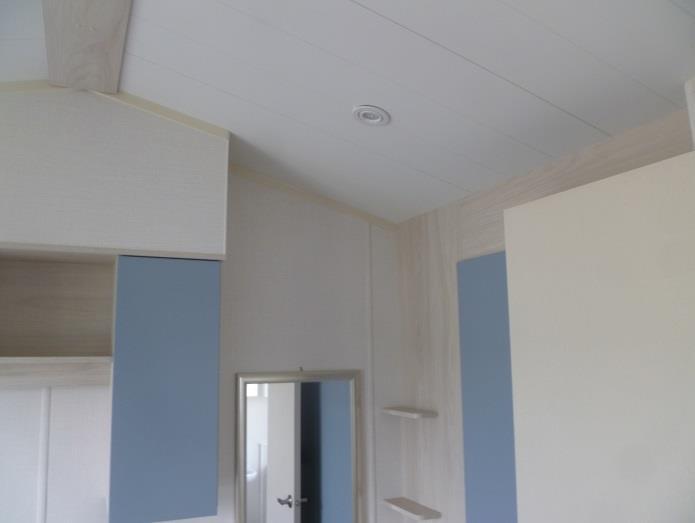
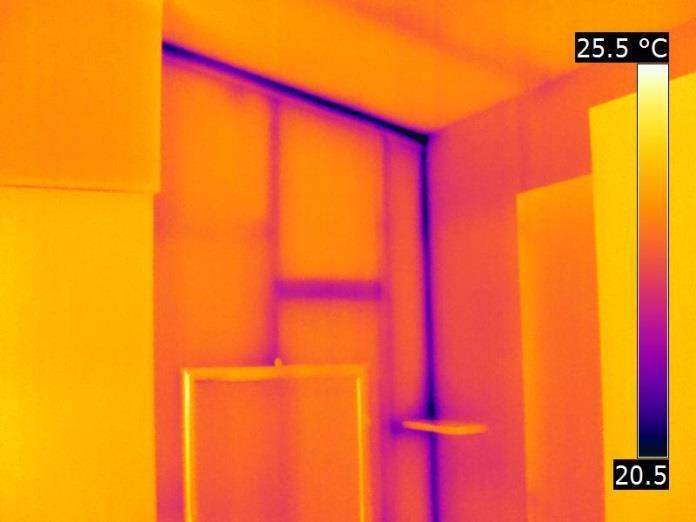
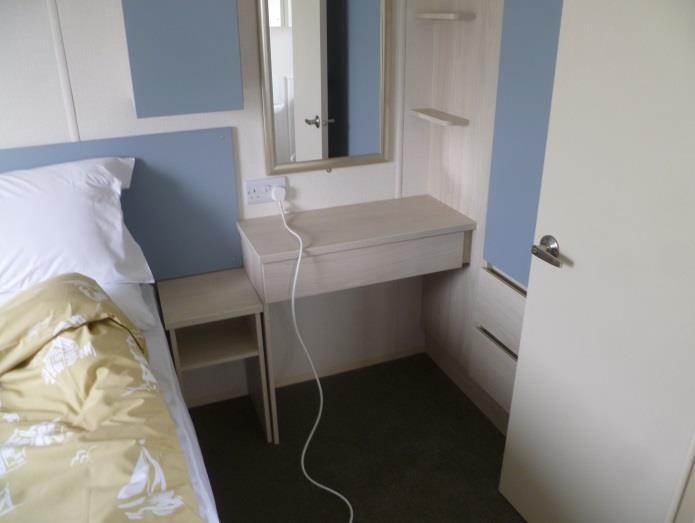
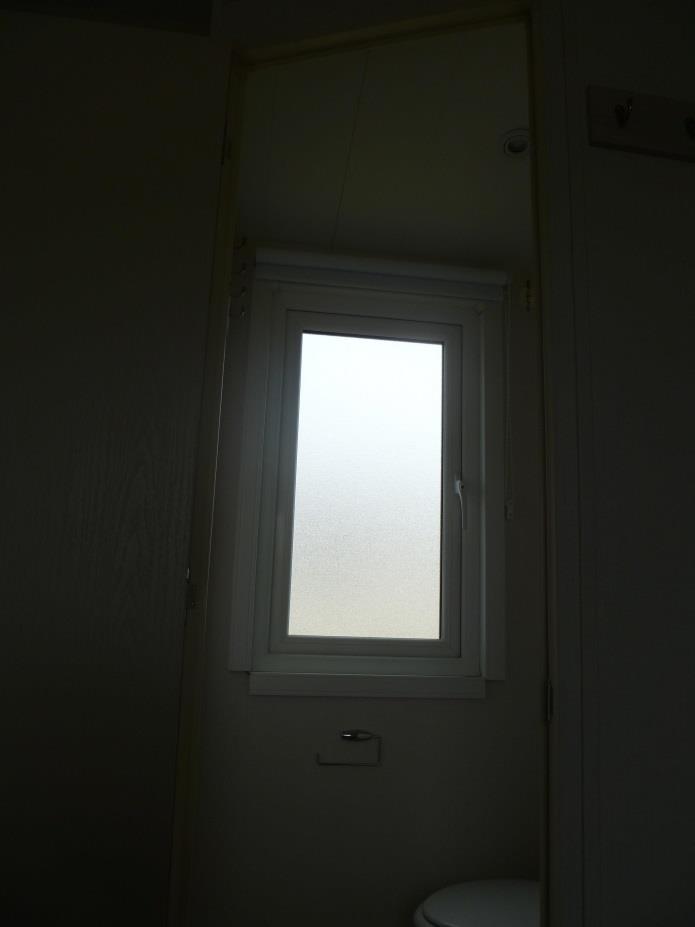
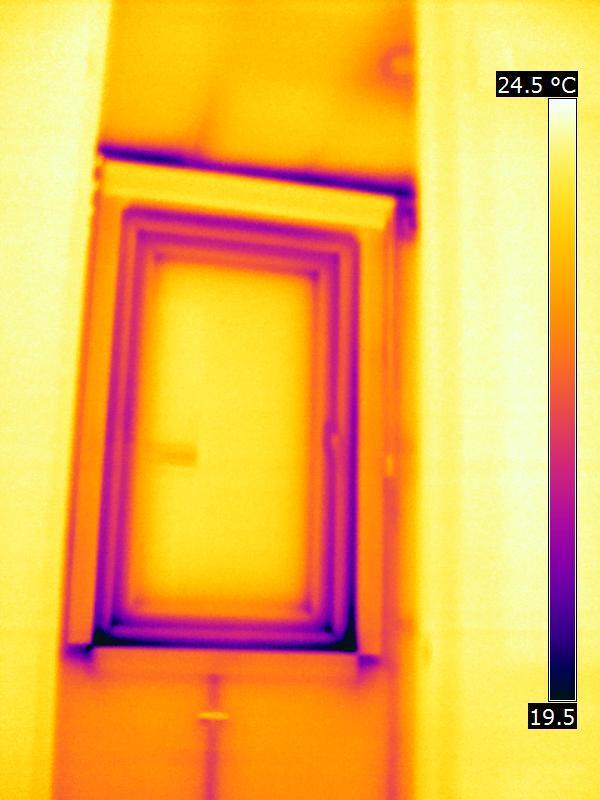
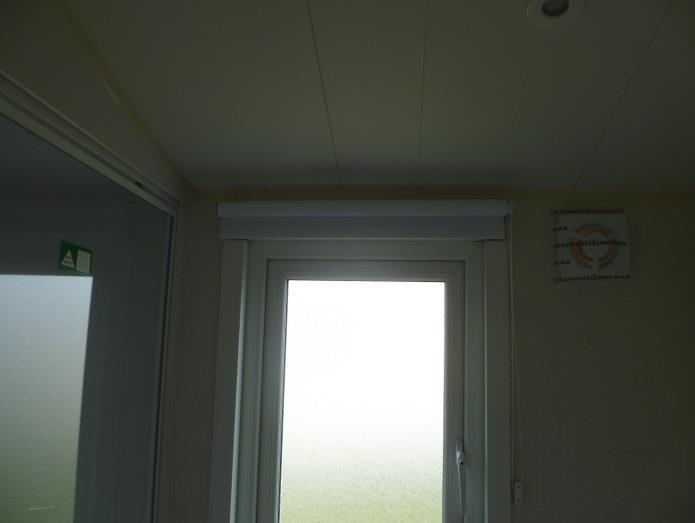
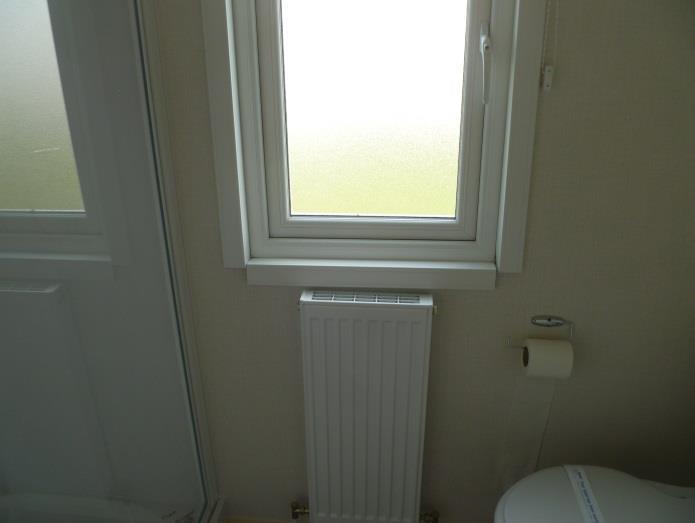
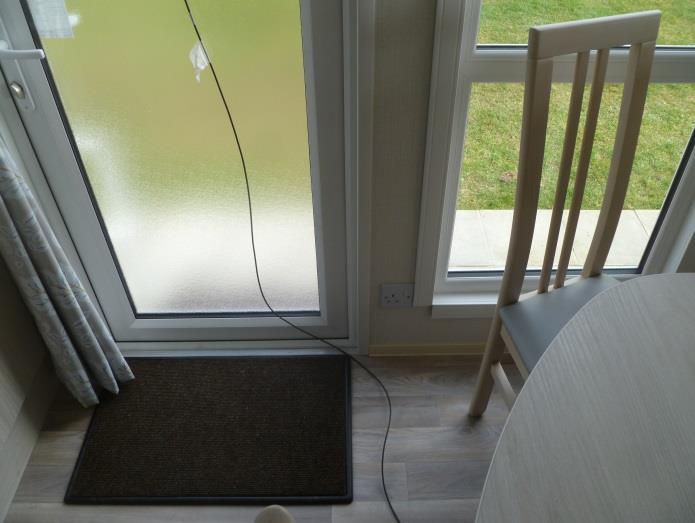
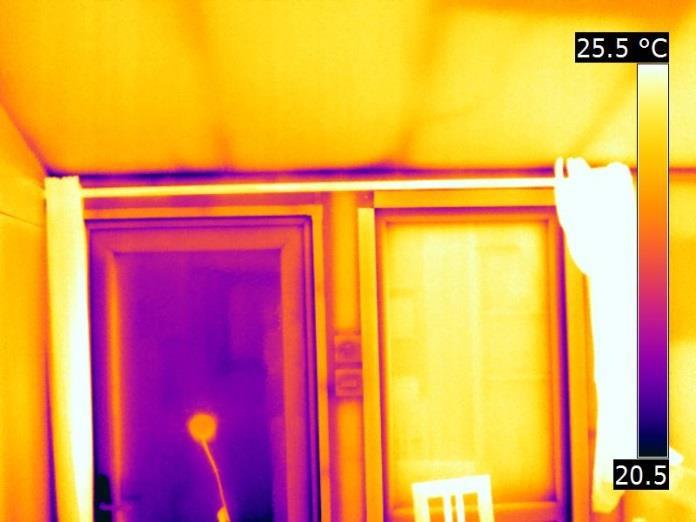
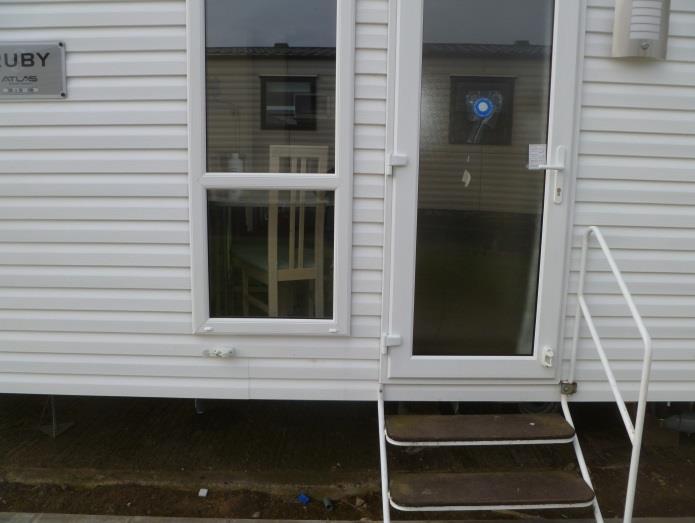
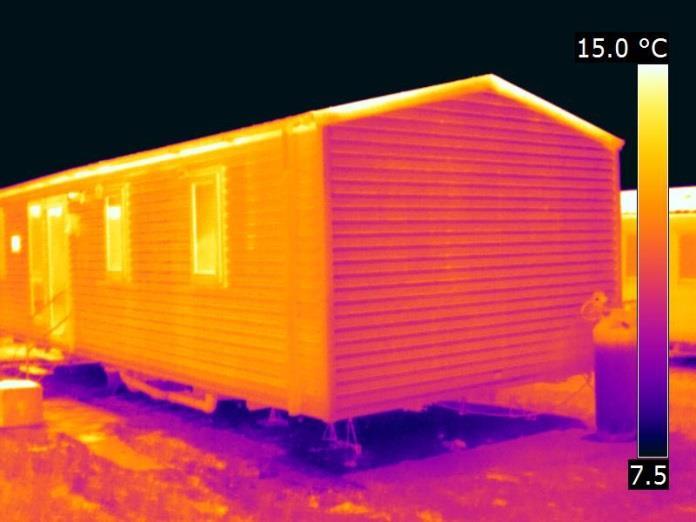
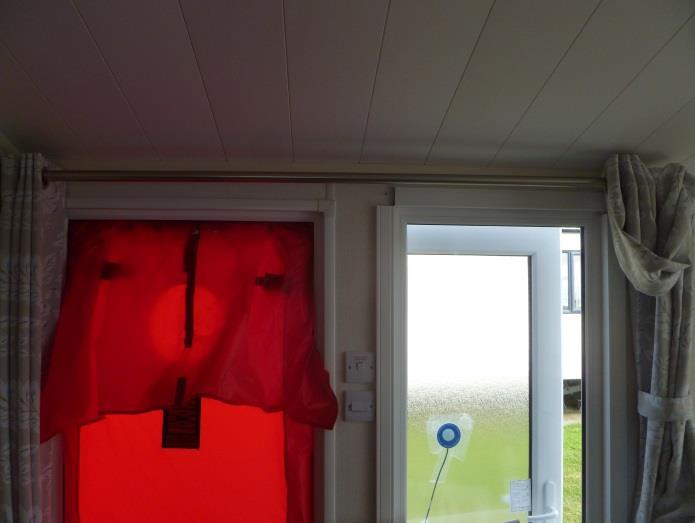
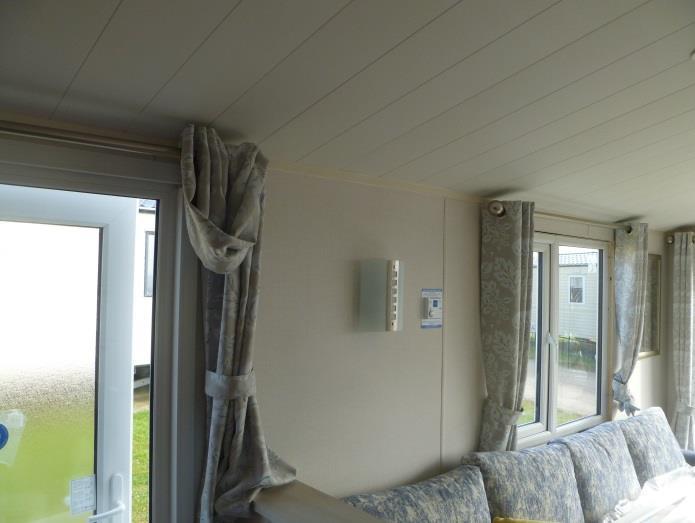
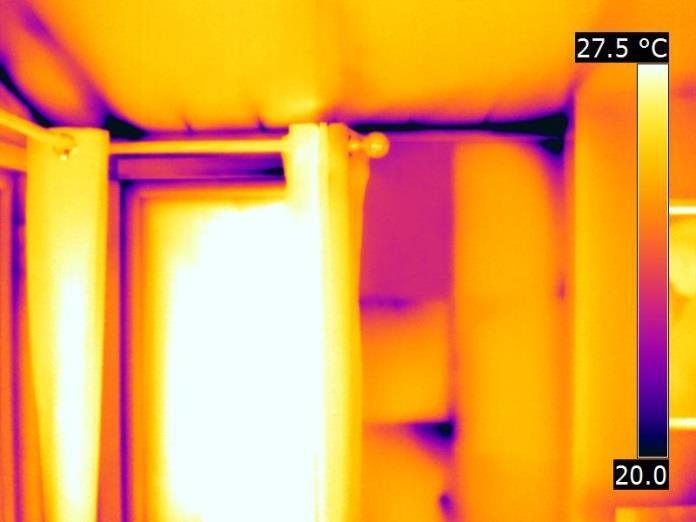
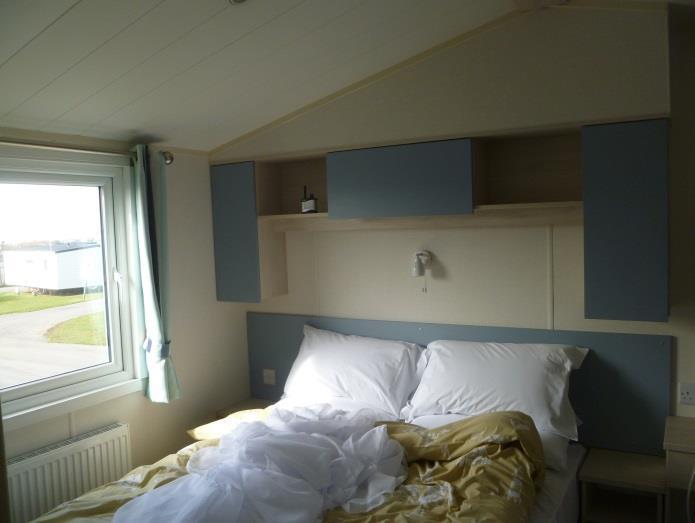
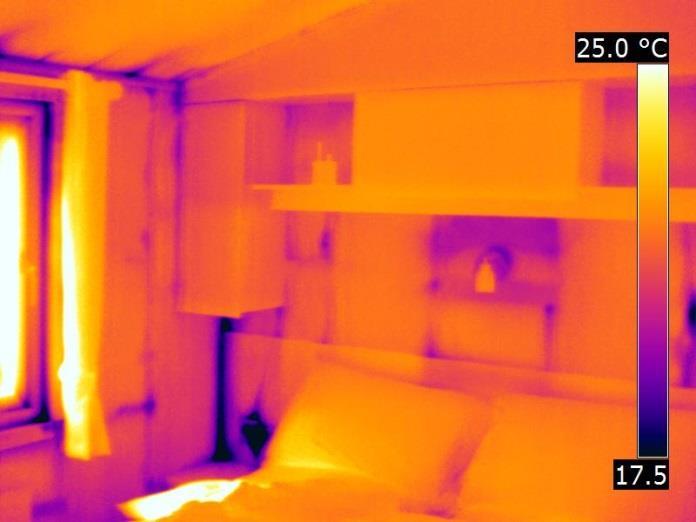
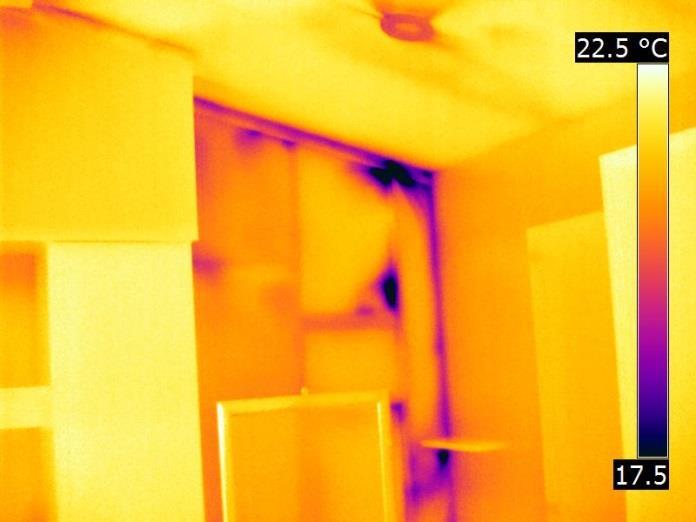
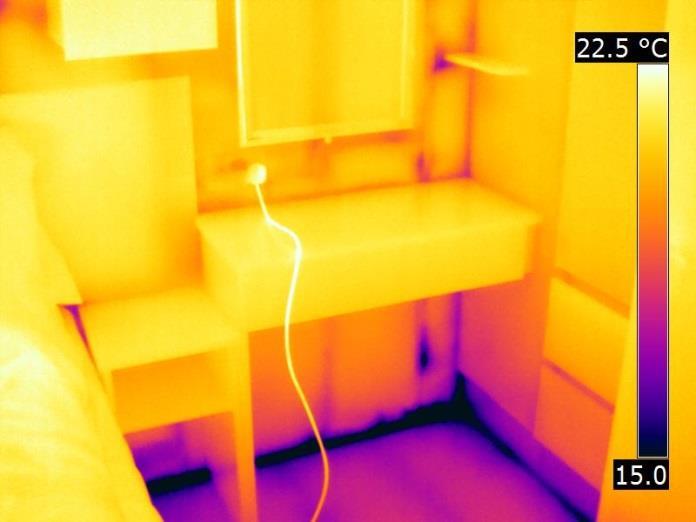
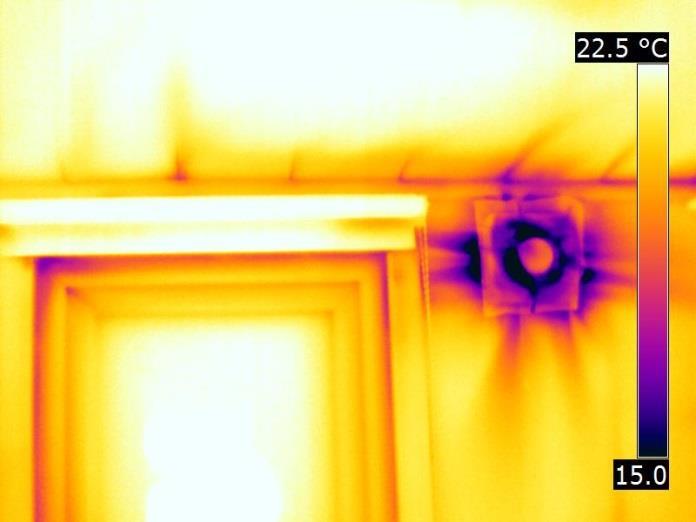
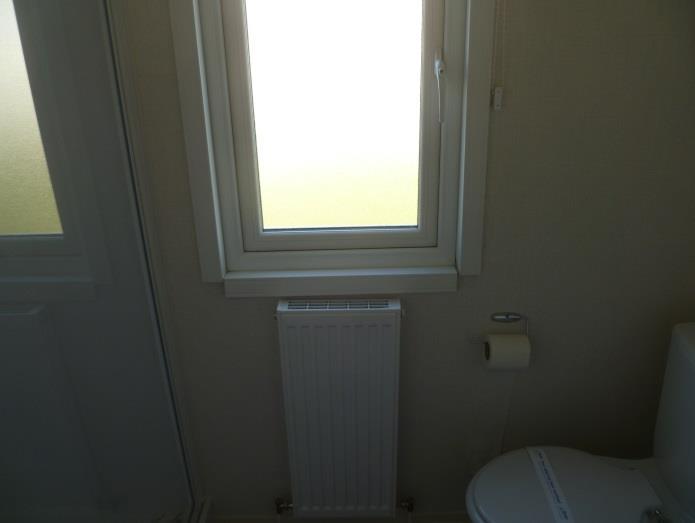
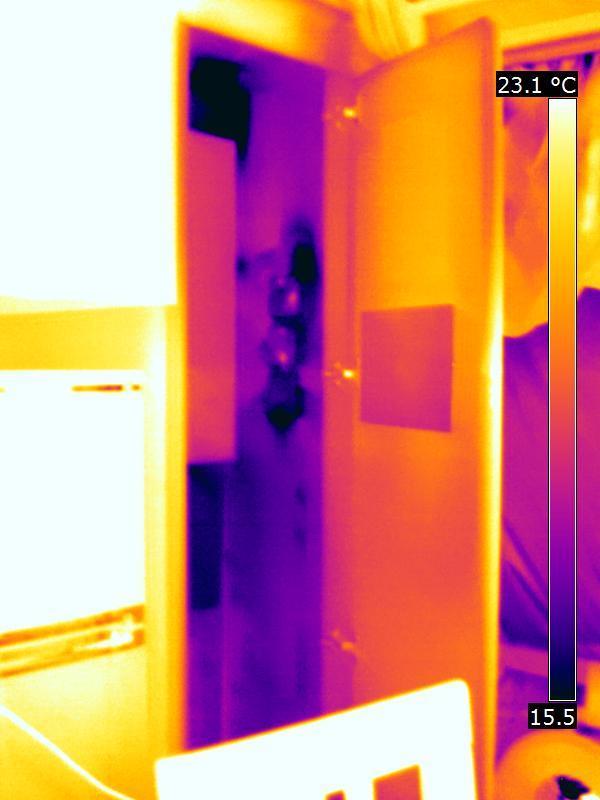
5 Figure 2: C05 Bathroom window original and replacement What is also noticeable in Figure 1 & Figure 2 is the surface temperature of the opaque elements and window frames. The window frames on the original windows are consistently cooler than the structural timber within the walls and ceiling. In contrast, the replacement frames display frame surface temperatures much closer to that of the areas of the plane elements with timber beneath. The difference between the original window performance and the replacement glazing can be seen most clearly on caravan C05, where the window adjacent to the door was replaced prior to the door being upgraded. Figure 3 displays some difference between the 2 types of glazing when viewed from the outside, although variations in atmospheric conditions and reflection prevent any accurate analysis. C10 18-Mar-2015 C05 20-Mar-2015 Figure 3: Doors and adjacent window showing difference in external surface temperature Figure 4 shows the same door and adjacent window in C05, but with the images captured from within the caravan. Taken immediately after the image in Figure 3, the internally captured thermal images in Figure 4 show around a 3.5 ⁰C difference in surface temperature between the original glazing in the door and that of the replacement glazing in the adjacent window. Leeds Sustainability Institute 5


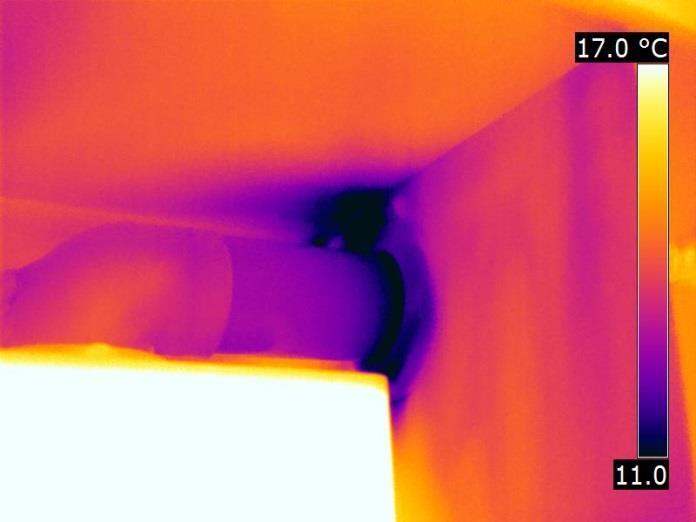
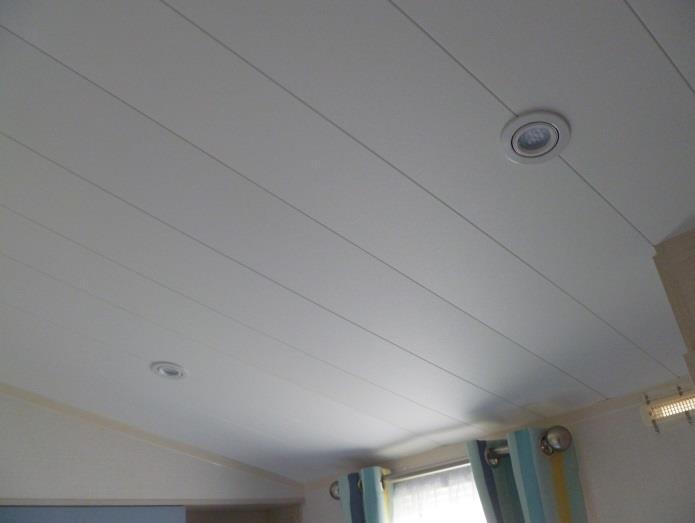
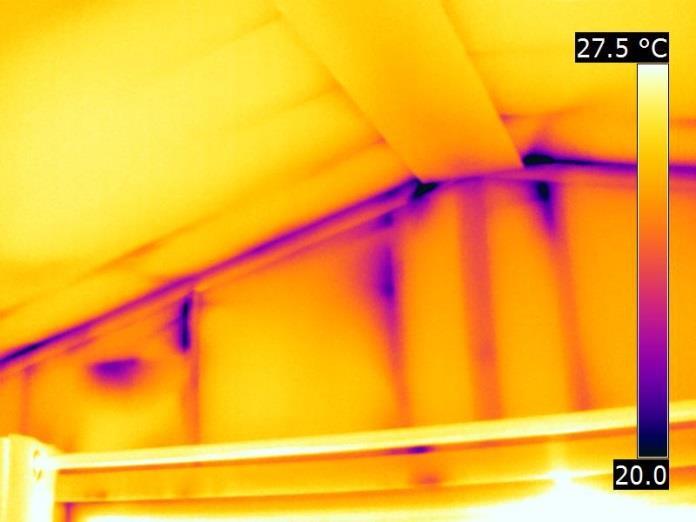
6 Figure 4: Internal images of C05 original door with adjacent window replaced 20-Mar-2015 The thermal imaging surveys conducted throughout the investigation also indicated numerous point and repeated thermal bridges around the entire envelopes of both caravans. Analysis of these thermal anomalies do not fall within the remit of this investigation, so are not expounded upon, but provide a substantial amount of information should a more in-depth study of the thermal performance of the caravans be conducted. All the thermal images taken during this investigation are presented in Appendices 2, 3 and 4. Leeds Sustainability Institute 6
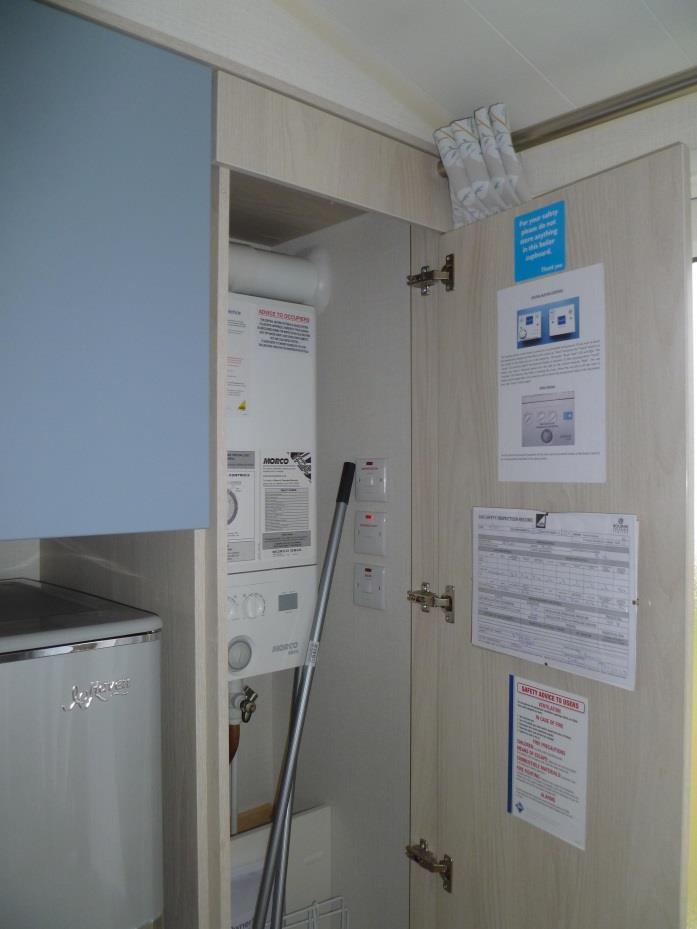
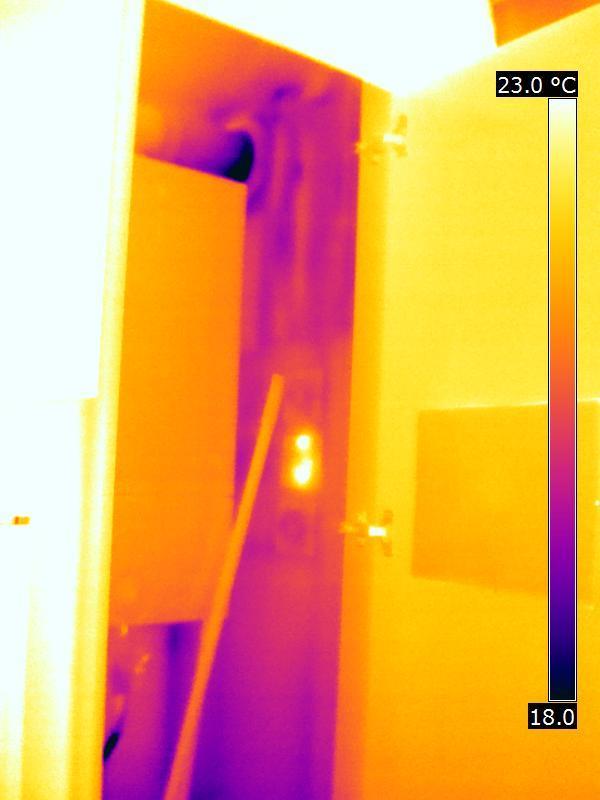
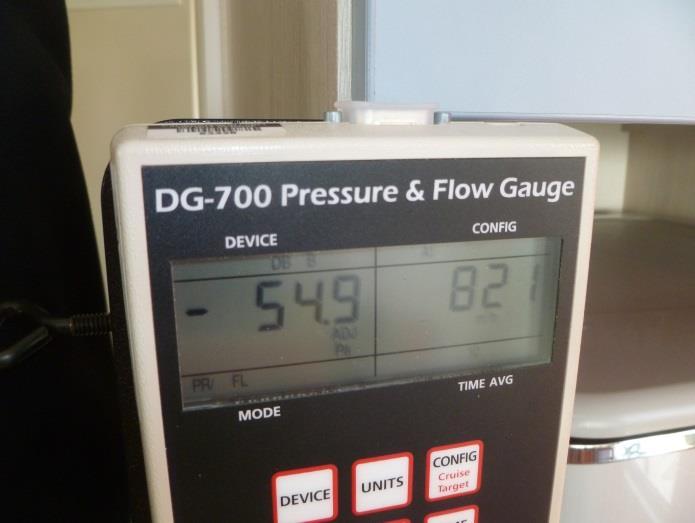
7 Airtightness Method Air tightness tests were performed on the caravans in accordance with the method outlined by the Airtightness Testing and Measurement Association (ATTMA) for the testing of building envelopes (ATTMA, 2010). The tests were undertaken using an Energy Conservatory Minneapolis 3 Blower Door with a DG700 dual-channel pressure gauge. For the purposes of the tests all accessible purpose-provided ventilation, in both caravans, was temporarily sealed; some inaccessible vents (such as below the boiler and a presumed similar outlet beneath the kitchen units) were not sealed. The results were obtained using depressurisation only (rather than the usual mean of pressurisation and depressurisation), due to the door lifters in the caravan door frames making placement of the blower door frame within the narrow caravan door frame difficult. Some air leakage detection was performed under depressurisation, utilising the thermal camera to identify cooler infiltrating air. Results Table 2 summarises the results of the air pressurisation tests performed on both caravans. Table 2: Airtightness test results Caravan Date Air Permeability Air Leakage Rate Correlation coefficient m 3 /(h.m 2 50 Pa ach 50 Pa r 2 C05 16-Mar C05 18-Mar C05 20-Mar C10 16-Mar The initial increase in air leakage following the fitting of the replacement windows in C05 was partly due to difficulties in re-fitting the window surrounds, resulting in a number of these being left unfinished. During the 3 rd test of C05, some of these surrounds had been re-fitted but many were still left unfinished. Air leakage paths In general, both vans achieved a reasonable standard of airtightness, better than the minimum standard of 10 m 3 /(h.m 2 50 Pa that is contained within Part L of the Building Regulations (NBS, 2013). Air leakage was detected around many junctions and penetrations, particularly those which were inaccessible or obscured from vision, with both vans displaying very similar patterns and points of air leakage. Table 3 shows just a few of the leakage paths detected and, as with the thermal imaging surveys, analysis of these do not fall within the remit of this investigation. However, they provide a substantial amount of information should a more in-depth study of the thermal performance of the caravans be conducted. All of the thermal images taken during this investigation under caravan depressurisation are presented in Appendices 2 and 4. Leeds Sustainability Institute 7


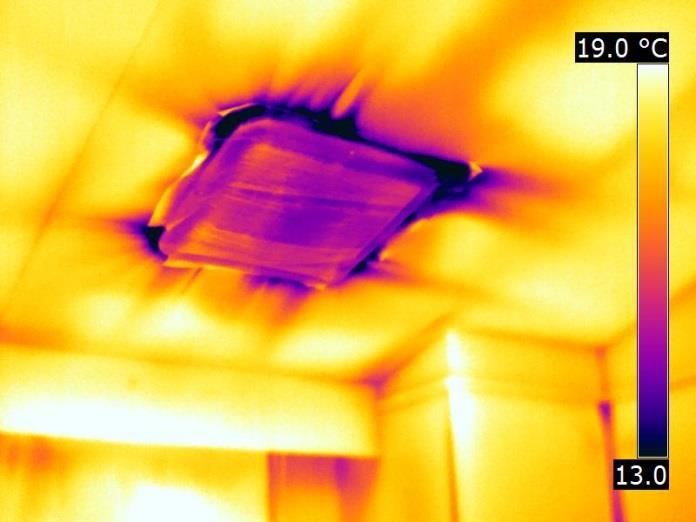
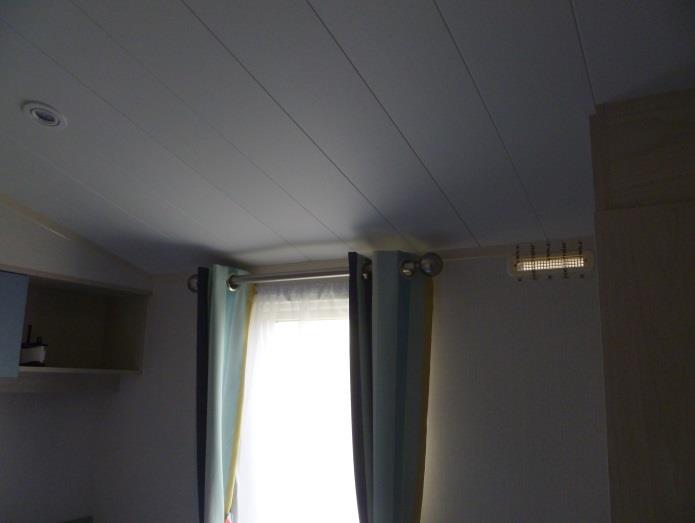
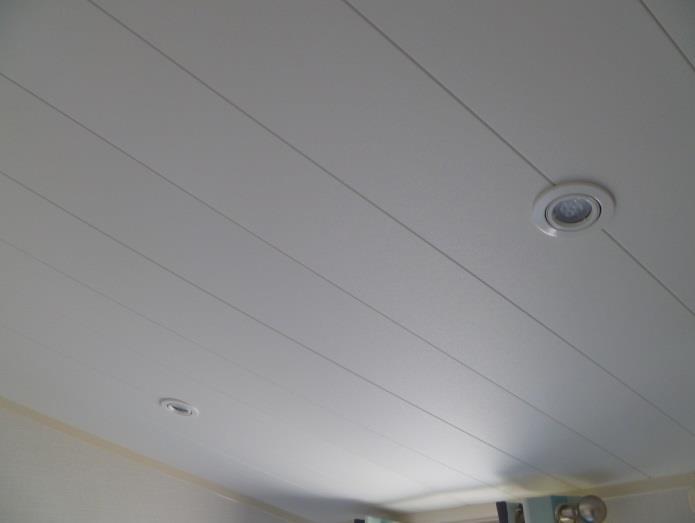
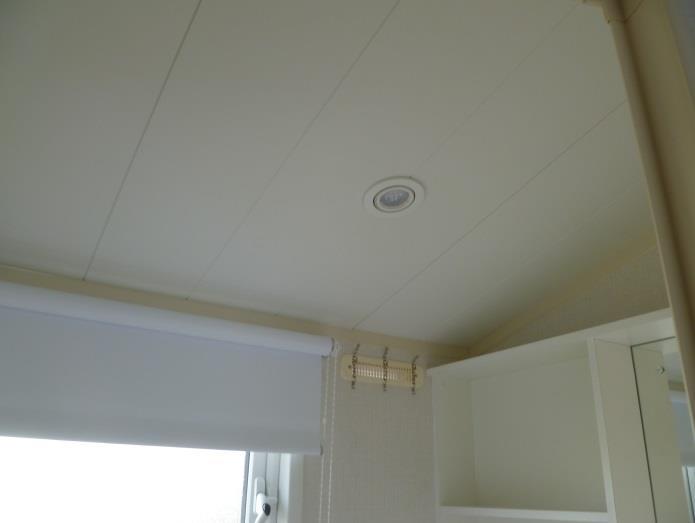
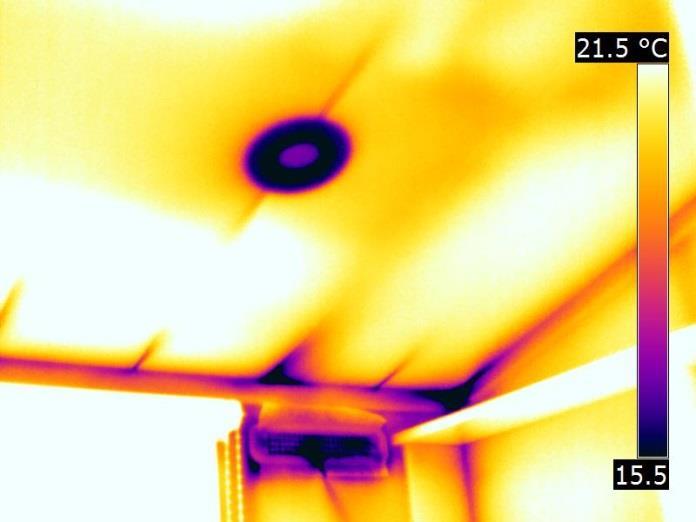
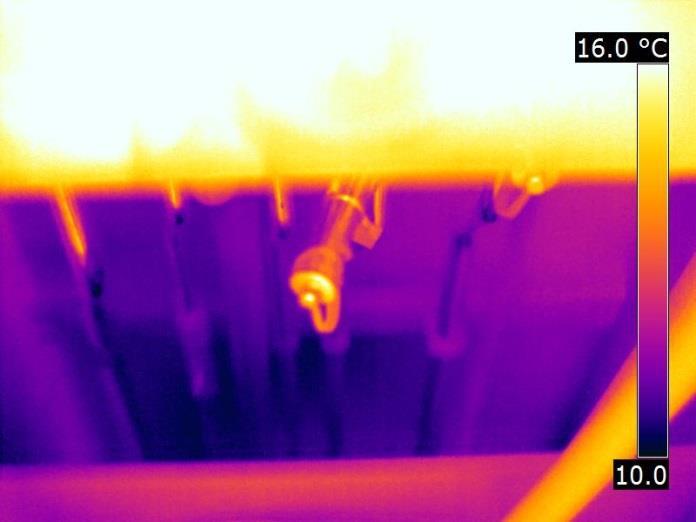
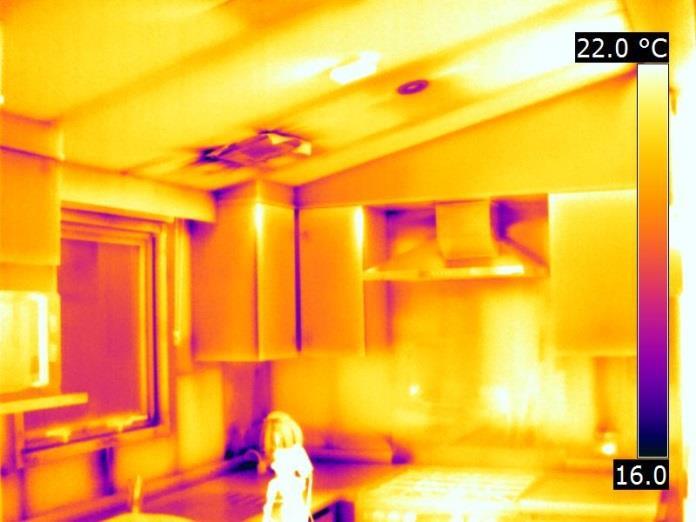
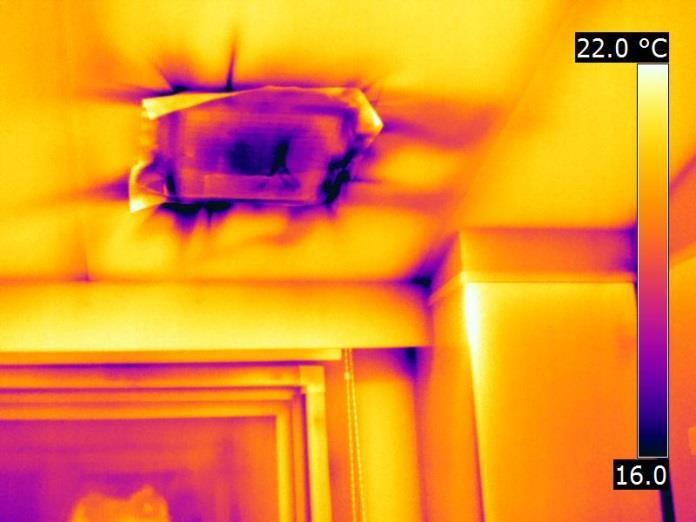
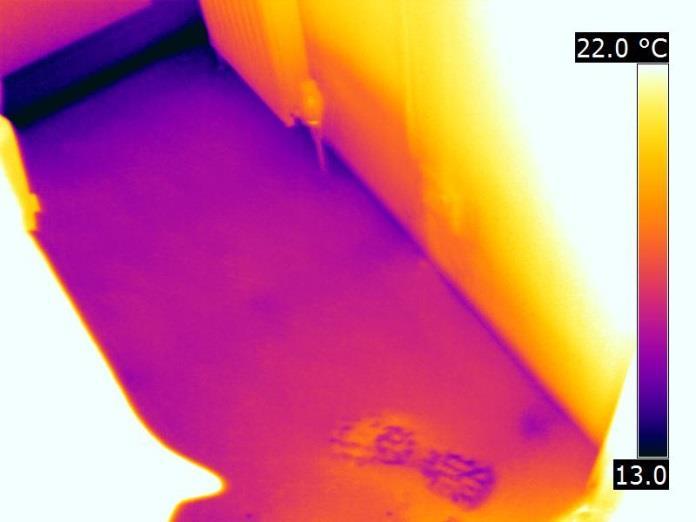
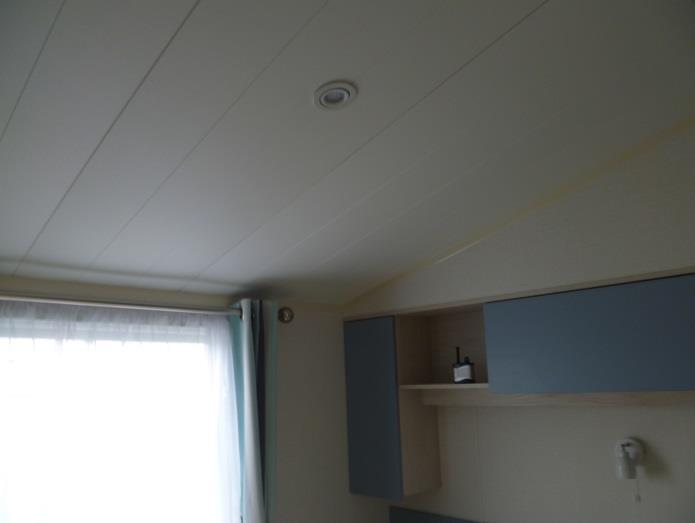
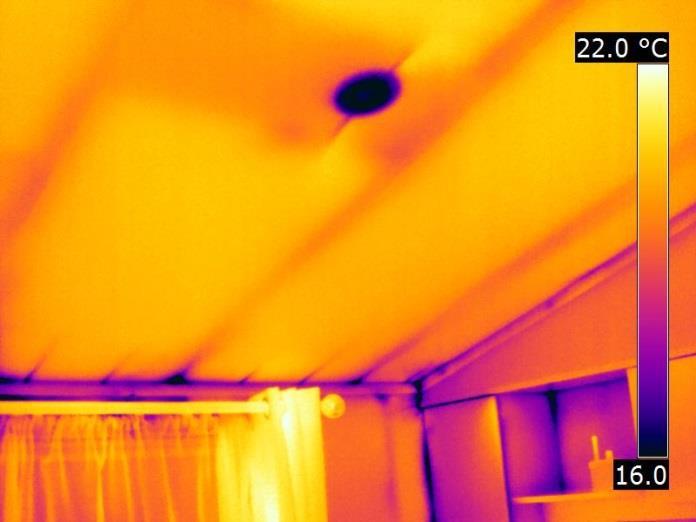
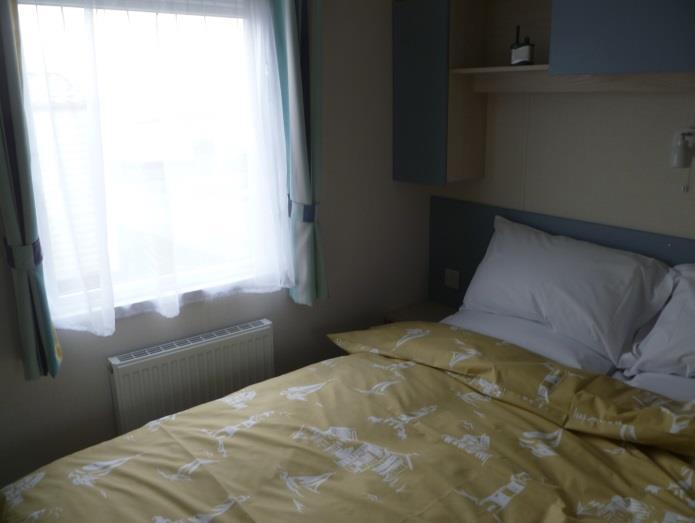
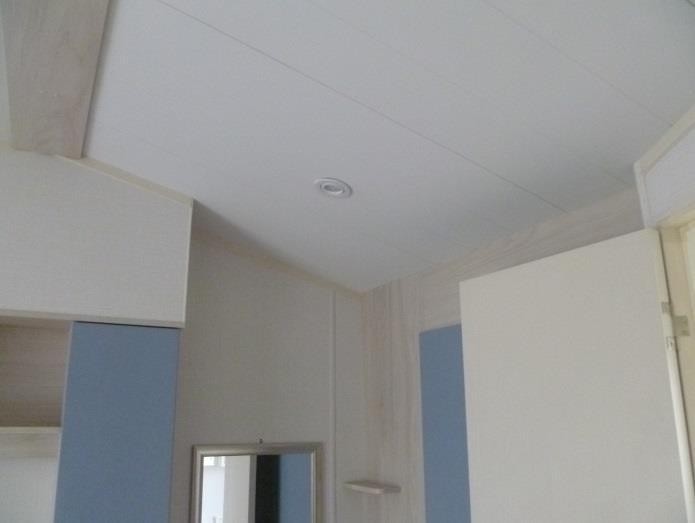
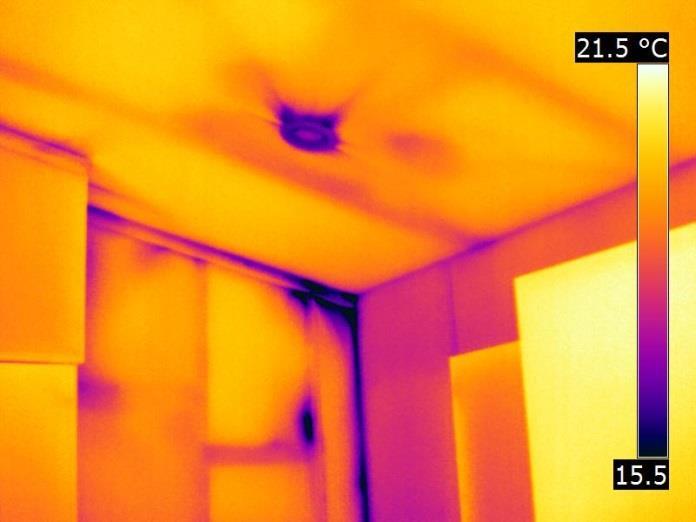
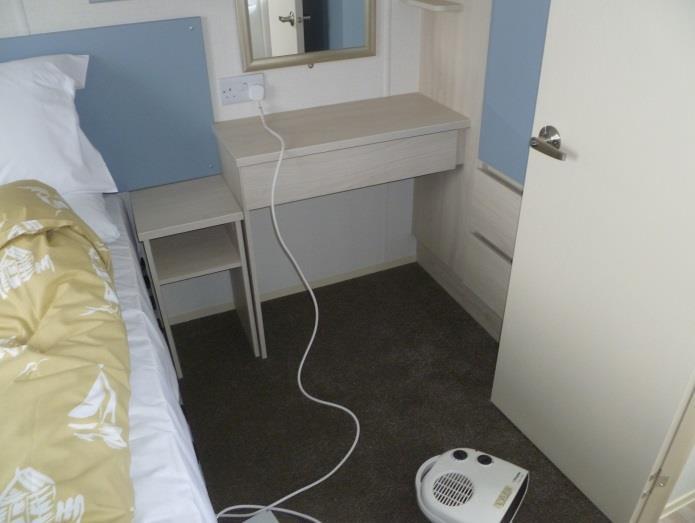
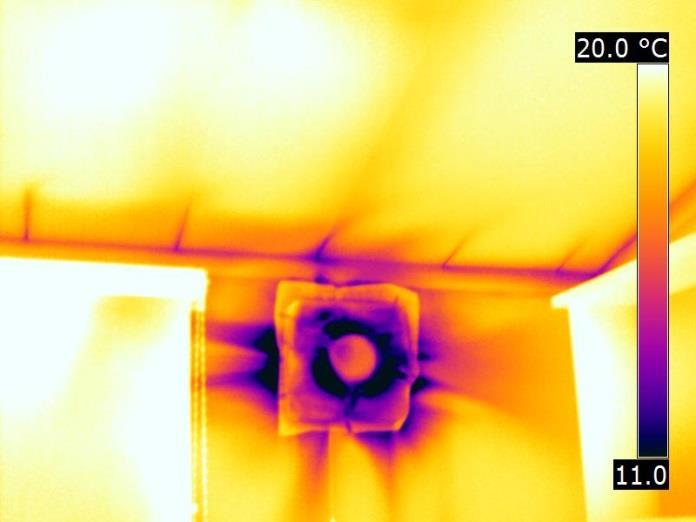
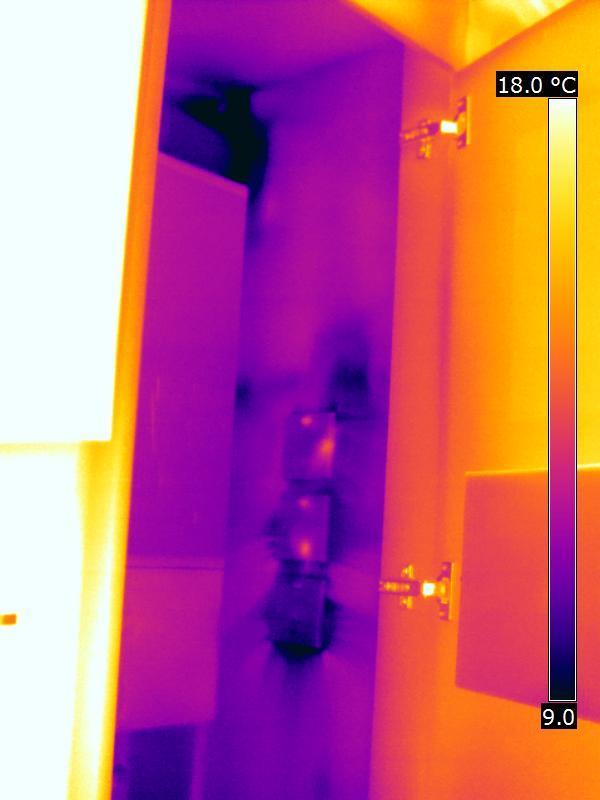
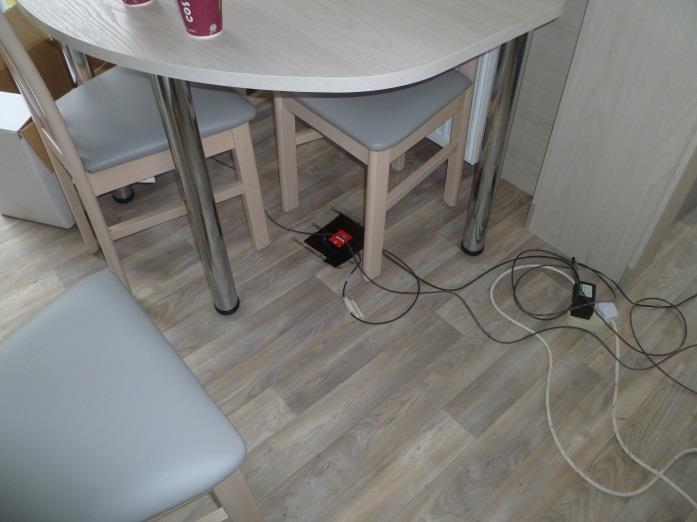
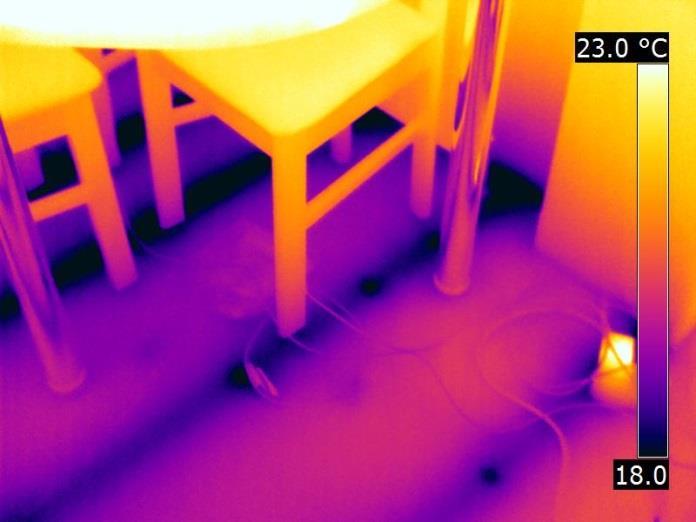
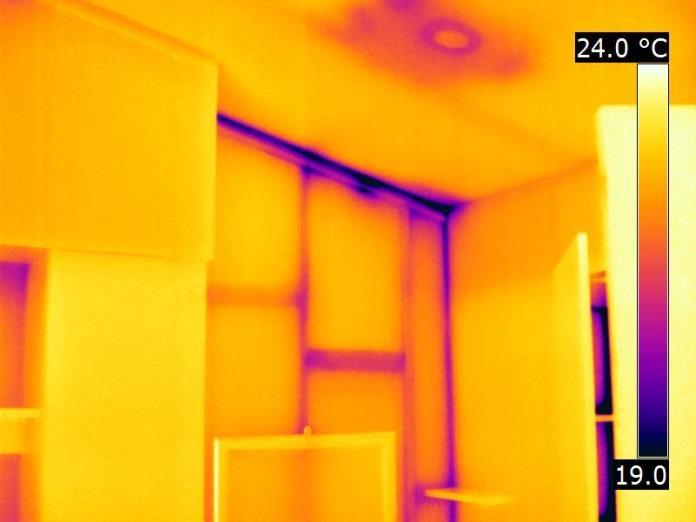
8 16-Mar-2015 C10 Lounge Infiltration detected at junctions and joints between panels and around the concealed lights in the ceiling. Table 3: Selected air leakage paths and brief descriptions 16-Mar-2015 C10 Kitchen Although the kitchen intermittent extract was temporarily sealed, the fan housing was not sealed around and leakage can be clearly observed. 16-Mar-2015 C10 Main Bedroom Cooler air was detected being drawn in at junctions and around electrical penetrations. Leeds Sustainability Institute 8


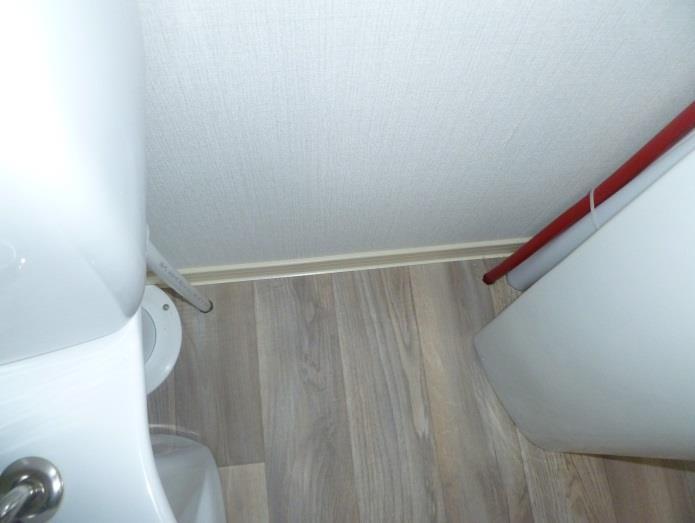
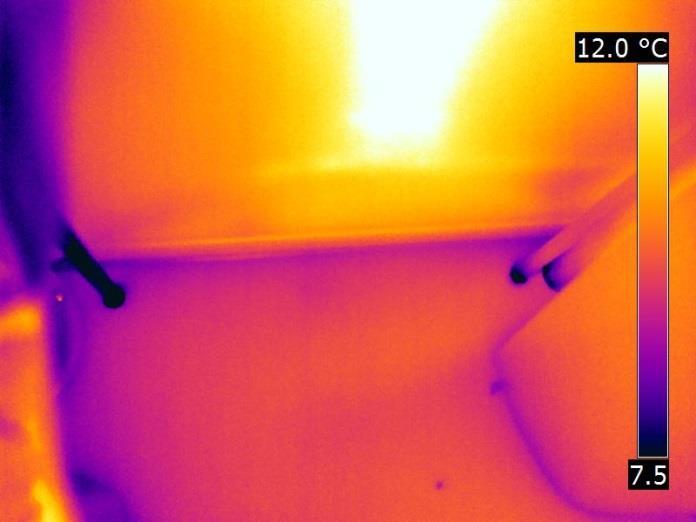
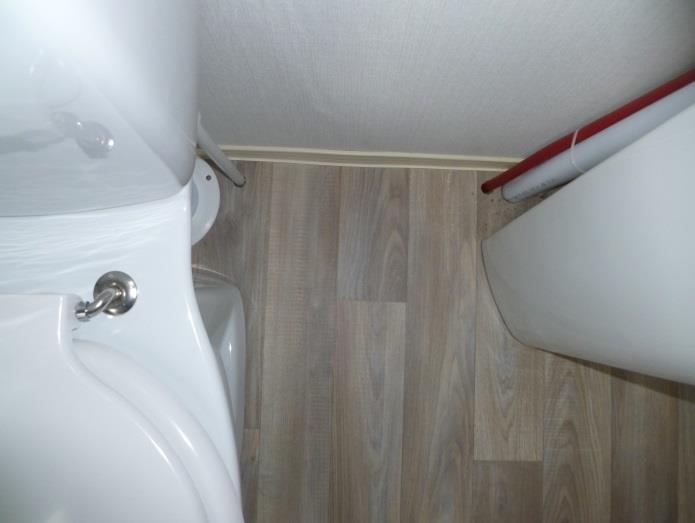
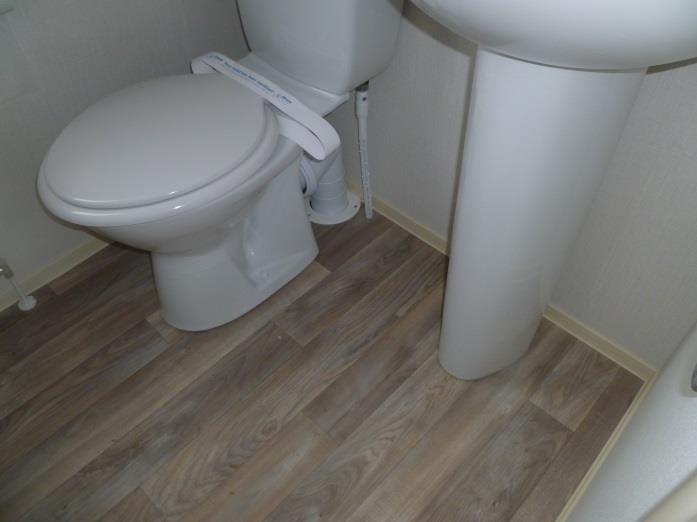
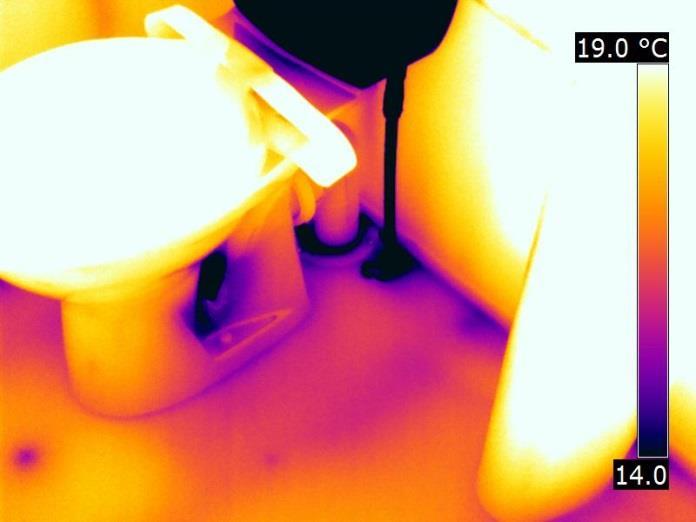
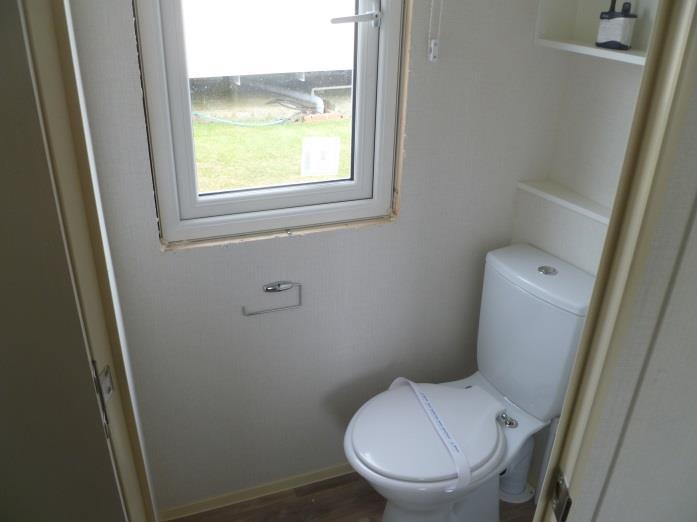
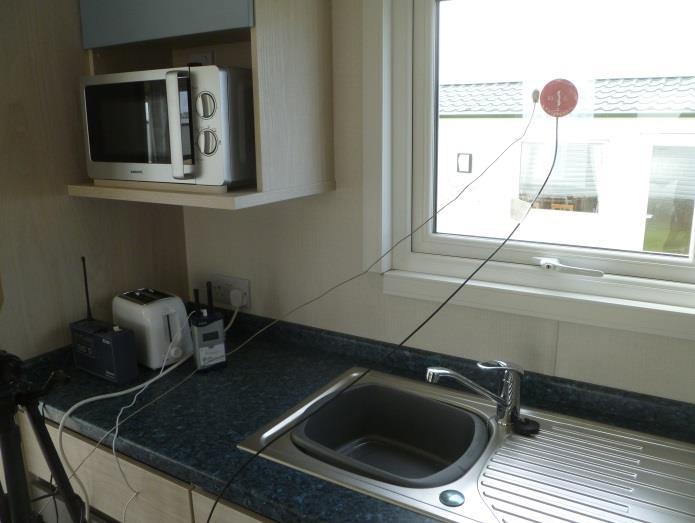
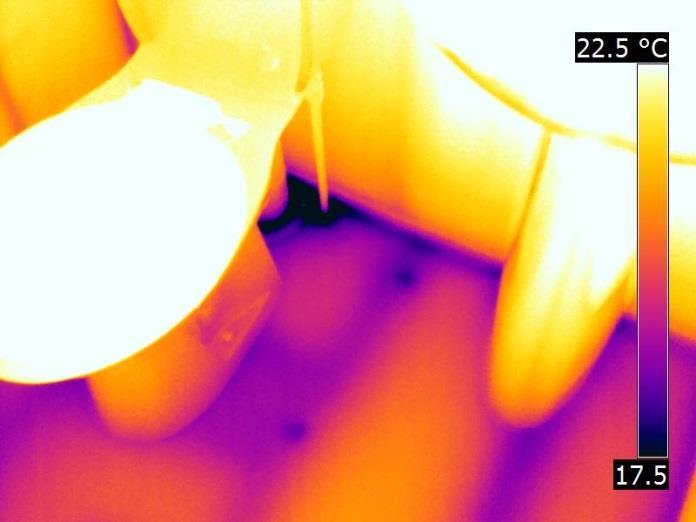
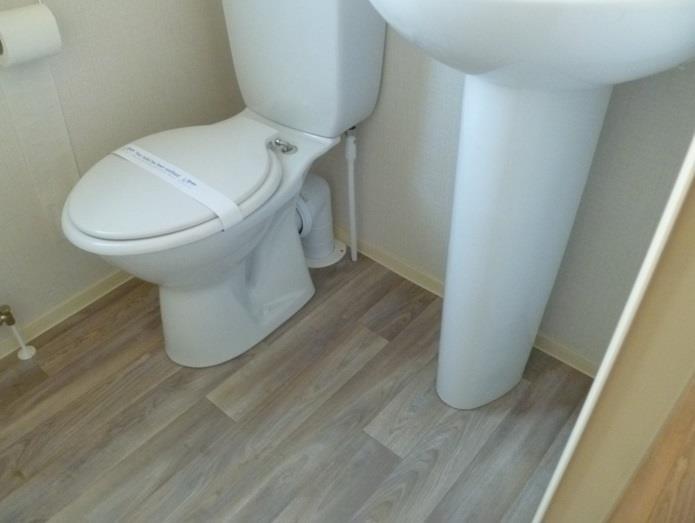
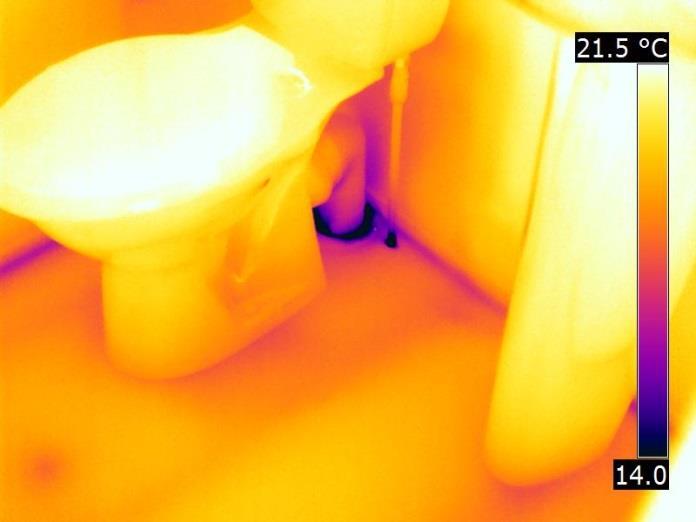
9 16-Mar-2015 C10 Bathroom Air leakage from the boxed-in services for the toilet was detected. 16-Mar-2015 C05 Kitchen Infiltration around the kitchen window was detected. 16-Mar-2015 C05 Kitchen Air leakage was detected around the sealed extract fan and around the window. Leeds Sustainability Institute 9


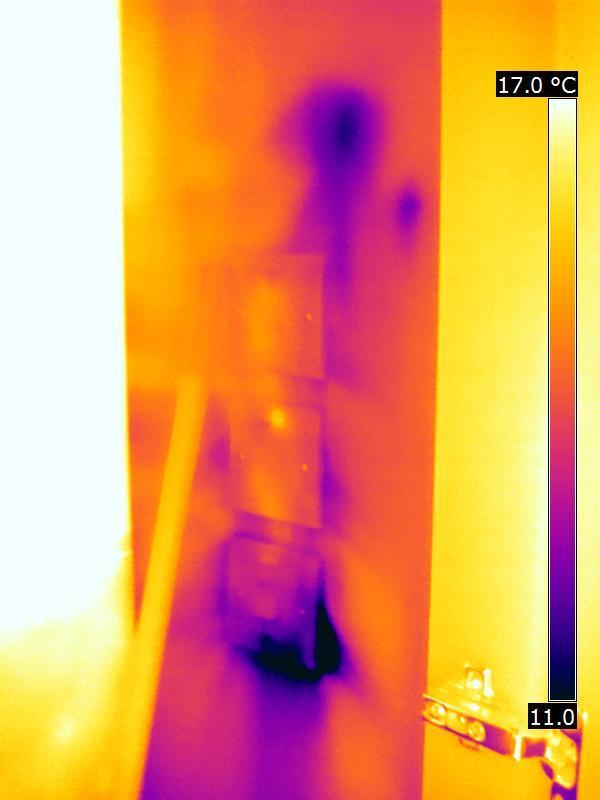
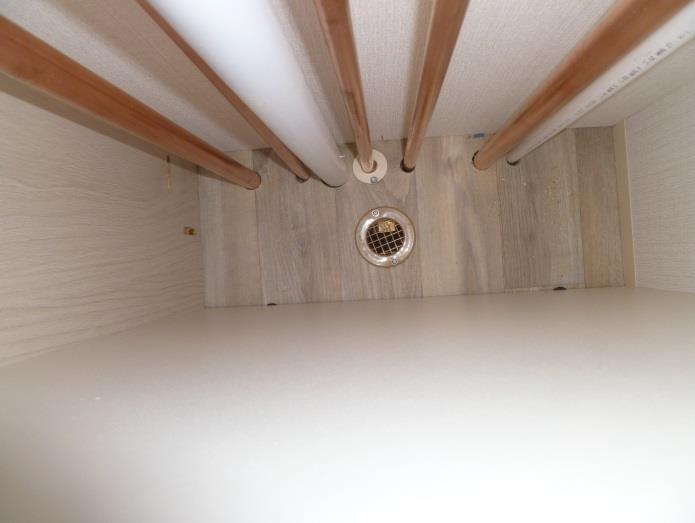
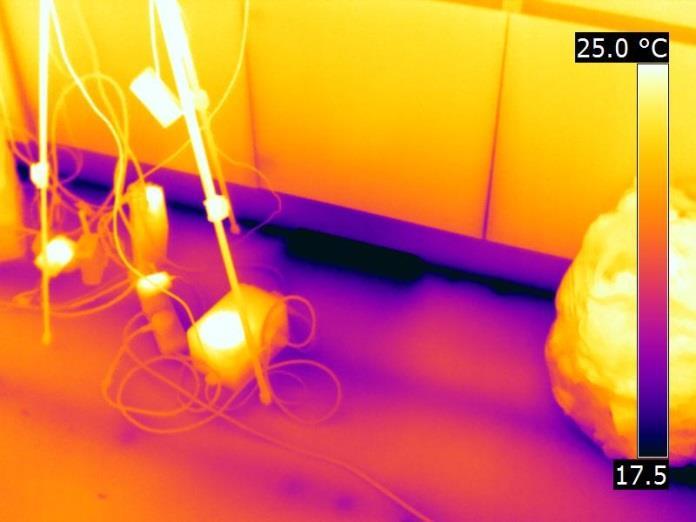
10 20-Mar-2015 C05 Lounge Air leakage was detected around electrical penetrations and at the wall/roof junction. One of the replacement window was also incorrectly sized and air leakage observed around the casement. This window was subsequently replaced with one that was correctly sized. 20-Mar-2015 C05 Kitchen Substantial airflow was detected emerging from beneath the kitchen units, suggesting that there was some drainage or ventilation opening beneath the units remaining unsealed. As access to this area was not possible, no temporary seals were placed in this location. 20-Mar-2015 C05 Small Bedroom The wall vent had been sealed temporarily on the inside, but external air appeared to be entering the wall cavity from the outside. 20-Mar-2015 C05 Main Bedroom Air leakage around the consumer unit emerged at warmer temperatures than directly infiltrating air due to a longer air leakage path. Leeds Sustainability Institute 10

.")
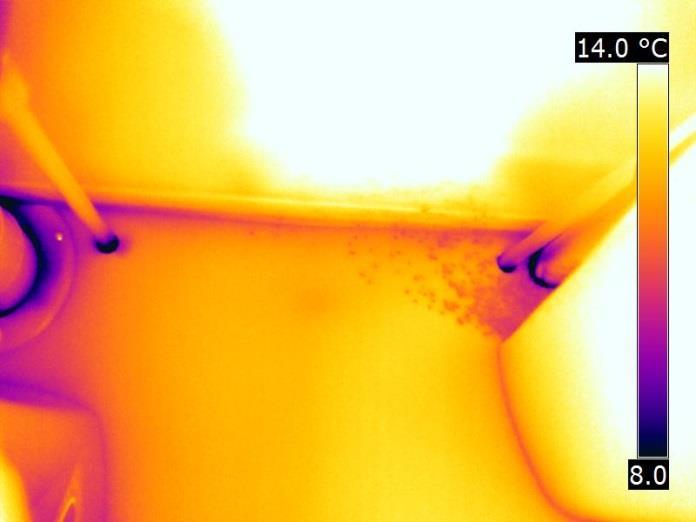
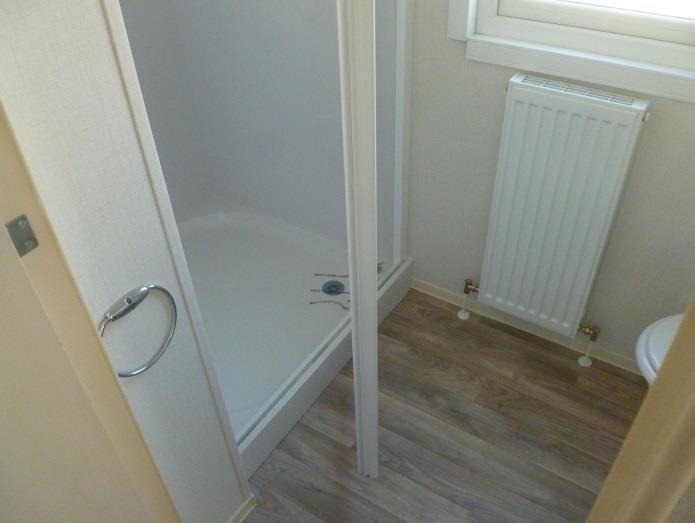
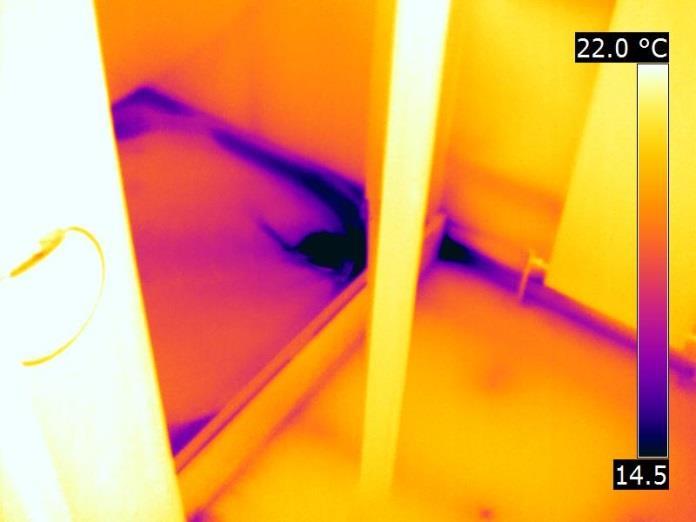
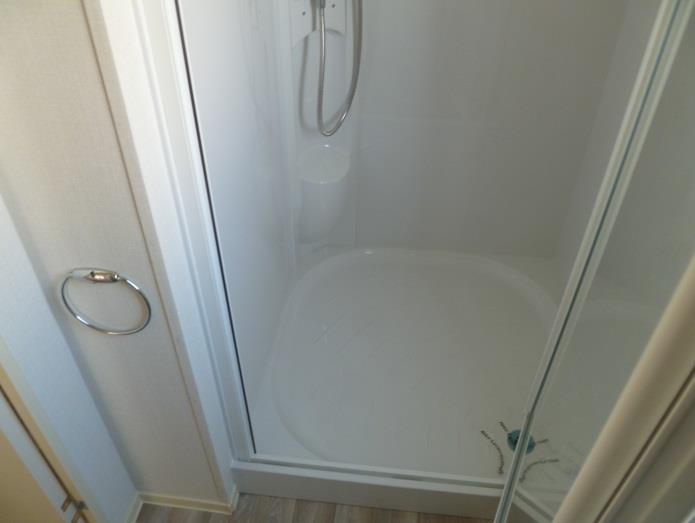
11 20-Mar-2015 C05 Bathroom Air leakage emerging from around the shower controls could be traced back down underneath the shower tray to the location where the waste pipe penetrated through the caravan floor. Actual ventilation rate Although pressurisation tests provide a value for air permeability or air leakage, the value obtained does not represent a real background ventilation rate, since under normal conditions the internal/external pressure differential will be far less than 50 Pa and in buildings is typically around 3 to 6 Pa (Modera et al., 2009). Furthermore, the blower-door test is a single measurement, whereas background ventilation varies with pressure, temperature and wind conditions, and so is most usefully quoted as an annual average figure. In dwellings, the air leakage rate can be approximated to the natural annual average background ventilation rate by simply dividing the air change rate measured at 50Pa (n50) by 20. This empirical procedure is commonly known as the n50/20 rule of thumb. The origin of this rule of thumb is usually attributed to Kronvall and Persily (cited by Sherman in 1987). As this rule of thumb was originally devised based upon a large number of results obtained in North American dwellings, the research team were sceptical whether this rule could equally be applied to caravans. In order to be able to determine whether the n50/20 rule of thumb is likely to be applicable to the test caravans, CO2 tracer gas decay measurements were undertaken in caravan C05 during test period 1. Instead of introducing CO2 artificially into the caravans using some type of CO2 dispersion device, as is usual in domestic properties, the measurements were undertaken following a period when the researchers had been working in the van for some time (during this period CO2 levels will have been elevated above the external background Leeds Sustainability Institute 11
12 level). The actual air change rate was then determined using the CO2 decay method described within Roulet and Foradini (2002). The results obtained using this method, illustrated by Figure 5 and Table 4, suggest that in the test caravans a figure of n/40 is more applicable to approximate the actual ventilation rate during the tests. This figure has also been used to determine the heat loss attributable to ventilation and has been used in subsequent energy calculations contained within this report (for instance, see Table 7). Figure 5: CO 2 decay curves for caravan CO5 stage 1 test Table 4: Comparison of ventilation rates obtained through pressurisation testing and CO 2 decay for C05 Approximated background ventilation rate (ach -1 ) Based on pressure test (n/20) Based on CO 2 decay Ventilation heat loss (W/K) Leeds Sustainability Institute 12
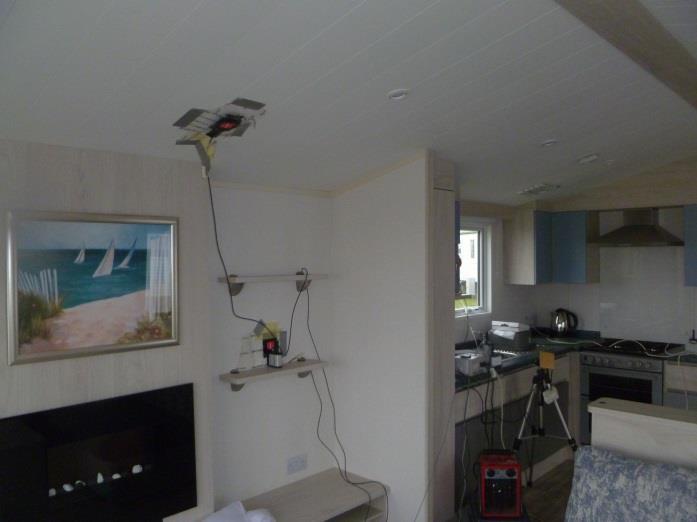
13 Coheating Tests Method A simplified version of a coheating test was used to obtain an estimate of the steady-state aggregate fabric and ventilation heat loss from a whole dwelling. The metric which quantifies this heat loss is the heat loss coefficient (HLC), which is the power input in Watts required to maintain a one Kelvin temperature difference between the internal and external environment (ΔT). The HLC is expressed in units W/K. A modified version of Leeds Beckett University s Coheating Test Method (Johnston et al., 2013) was used to measure the heat loss from the entire thermal envelope of caravans C05 and C10. The coheating test method was modified to account for the short time period that was available to the research team. Typically, coheating tests are undertaken during a time period of days. This enables the analysis procedure to more confidently account for thermal storage and release due to the building s thermal mass, external power input resulting from solar radiation, and the effect of wind speed. As the test caravans have low thermal mass it is reasonable to assume that a coheating test can be undertaken over a shorter time period than that of typical dwellings. However the shorter time period precludes an accurate estimation of the contribution of solar radiation to the heating power input to the caravan using multiple regression analysis. Thus, data used in the estimation of the HLC is from a time period thought not to be influenced by direct or previously stored solar radiation (22:00 05:59 inclusive). In addition, the data points used in a coheating regression analysis are usually the mean of a 24 hour time period. However, due to the limited test period and the fact that any thermal lag between a change in ΔT and resultant change in heating power is likely to be minimal (due to the low thermal mass of the caravans), coheating data was aggregated into hourly mean time intervals. Each caravan was heated using electric resistance point heaters controlled by thermostatic temperature controllers. The temperature controllers in both caravans were set to maintain an internal temperature of 22 o C. Power input to the heaters was measured as well as the internal and external temperature and net radiation. Data was recorded at one minute intervals throughout the entire testing period. Results Caravan C05 Test period 1 (original glazing) Figure 6 shows the hourly mean power and environmental conditions measured during test period 1 for caravan C05. The decrease in power input to the caravan observed in the first day of testing (16/03/15) is due to a reduction in power required to charge the thermal mass of the caravan following the commencement of heating (approximately 4 hours prior to the start of data logging); thus data from the first night of test period 1 (16/03/15) is excluded from the HLC analysis. The result is only one night of data available for the coheating analysis (17/03/15). The suppression of power input resulting from solar radiation and higher external temperatures is highly evident and justifies the use of overnight data in the coheating analysis. It can also be seen that overnight any Leeds Sustainability Institute 13

14 change in ΔT results in a change in power input during the same one hour time period; this indicates low thermal mass and suggests that the use of one hour aggregated data in the coheating analysis is both appropriate and acceptable. Figure 6: Caravan C05 power and environmental conditions measured during test period 1 (hourly means) Figure 7 illustrates the power input and environmental conditions during the coheating analysis of test period 1. It is evident that a gradual external temperature decrease results in a gradual increase in power input to the caravan to maintain the ΔT throughout the test period. Figure 7: Power and temperatures measured throughout coheating test 1 of caravan C5 Leeds Sustainability Institute 14
15 Figure 8 provides the coheating analysis of caravan C05 during test period 1. The coheating test produced an estimate of the HLC of (±0.5) W/K (slope of the regression line). The low thermal mass of the caravan is evident by the strong relationship between mean hourly power demand and ΔT (r 2 of 0.91). This relationship provides confidence that reasonable estimate of the HLC can be obtained over a short time period. Figure 8: Coheating test 1 analysis for caravan C5 (regression forced through origin) Test period 2 (replacement windows) Figure 9 shows the hourly mean power and environmental conditions measured during test period 2 of caravan C05. As the fabric of the caravan remained heated throughout the period of the window replacement on 18/03/15, charging of the thermal mass was complete prior to the first night coheating analysis period. As a result, two nights of coheating data were available for analysis (18 & 19/03/15). It can be seen in Figure 9 that power input into the caravan remained reasonably stable during the coheating analysis periods. There was a reduction in internal temperature in the daytime of 19/03/15 as minor alterations to the internal window trims of the caravan were made. A partial solar eclipse caused the temporary reduction in net radiation measured on the morning of 20/03/15. Leeds Sustainability Institute 15
16 Figure 9: Caravan C05 power and environmental conditions measured during test period 2 (hourly means) Figure 10 shows the coheating analysis for the two successive nights during test period 2. It can be seen that there is good consistency between the HLC measured on successive nights. The HLCs measured suggest that the minor alterations did not have a measureable difference on the thermal performance of the caravan. The cause of the outliers during night 1 corresponds with a reduction in wind speed during the final two hours of the test. Figure 10: Individual nights coheating test 2 analysis for caravan C05 (regression forced through origin) Leeds Sustainability Institute 16
17 To increase the power of the coheating test analysis, both nights data are included in the regression analysis to produce the HLC for test period 2; this is displayed in Figure 11. Figure 11: Coheating test 2 analysis for caravan C5 (regression forced through origin) Figure 11 provides the coheating analysis of caravan C05 during test period 2. It is clear that there is a strong relationship between the mean hourly power demand and ΔT (r 2 of 0.91). The coheating test produced an estimate of the HLC of (±0.3) W/K. This represents a reduction in HLC of 6.5 W/K (5.9%) from test period 1. As the airtightness of the caravan remained almost unchanged following test period 1, this reduction can primarily be attributed to the installation of the replacement windows. Test period 3 (replacement windows and door) Figure 12 shows the hourly mean power and environmental conditions measured during test period 3 of caravan C05. As the fabric of the caravan remained heated throughout the period of the door replacement on 20/03/15, charging of the thermal mass was complete prior to the first night coheating analysis period. As a result, four nights coheating data were available for analysis (20, 21, 22 & 23/03/15). Test period 3 was characterised by the greatest diurnal fluctuations in external temperature and the greatest changes in net radiation. The influence that these changes in external temperature and net radiation have on the power input to the caravan to maintain the ΔT can be clearly seen in Figure 12. Leeds Sustainability Institute 17
18 Figure 12: Caravan C05 power and environmental conditions measured during test period 3 (hourly means) Figure 13 shows the coheating analysis for the four successive nights during test period 3. It can be seen that there is poor consistency between the HLC measured across the test period. Figure 13: Individual nights coheating test 3 analysis for caravan C05 (regression forced through origin) Leeds Sustainability Institute 18
19 Figure 14 shows the relationship between nightly HLC estimates and mean wind speed measured 1 during the test period. The higher wind speed measured during night 1 and night 3 correlate with the higher HLCs measured and the poorer relationship between power input and ΔT measured (lower r 2 value). It is reasonable to assume that the many ventilation points through the caravan structure mean that it is susceptible to increased ventilation heat loss and wind-washing of the insulation during periods of high wind speeds. Figure 14: Wind speed vs. nightly HLC for caravan C05 during test period 3 Figure 15 shows the mean wind speed measured during each nightly coheating test period throughout the test programme. The wind speeds measured during night 1 and night 3 of test period 3 were in excess of the other two test periods. To ensure a more suitable comparison between previous test periods these nights have been excluded from the coheating analysis of test period 3. Figure 15: Mean wind speed during each nightly coheating test throughout the test programme 1 Wind speed data obtained from Weather Underground ( at RAF Topcliffe, North Yorkshire; 73 km WSW from test location. This location was the closest to the test site with trustworthy hourly wind speed measurements available. As this data is secondary, its veracity cannot be verified. In addition the distance from the location means that its suitability for use in analysis should be treated with caution. Leeds Sustainability Institute 19
20 Figure 16 provides the coheating analysis of caravan C05 during test period 3 using data obtained from night 2 and night 4 only. The coheating test produced an estimate of the HLC of 97.6 (±0.6) W/K. This represents a reduction in HLC of 11.1 W/K (11.4%) from test period 1. There is a high degree in confidence with the HLC estimate due to the very strong correlation between power input and ΔT (r 2 of 0.94). Unfortunately, it was not possible to measure change in airtightness that may have occurred following the installation of the new door. Assuming that the airtightness of C05 did not significantly change when the door was replaced, the reduction in HLC from test period 1 can primarily be attributed to the installation of the replacement windows and door. Figure 16: Coheating test 3 analysis for caravan C05 (regression forced through origin) Caravan C10 Due to a malfunction of the energy metering equipment in caravan C10, it was not possible to estimate a HLC for test period 1; the issue with the logging equipment was resolved prior to test period 2. Caravan C10 did not have any glazing replaced, thus the HLC estimate for test period 2 is for the caravan in its original condition. The coheating analysis for caravan C10 is provided in Figure 17. The coheating test produced an estimate of the HLC of 116 (±0.6) W/K. There is a reasonable degree in confidence with the HLC estimate due to the correlation between power input and ΔT (r 2 of 0.79). Leeds Sustainability Institute 20
21 Figure 17: Coheating test analysis for caravan C10 (regression forced through origin) Coheating test summary and conclusions Table 5 summarises the coheating test results from the test programme. The installation of replacement windows and door to caravan C05 resulted in a HLC reduction of 11.1W/K, which equates to 10.2%. As no significant change in airtightness was measured, the improvement is primarily attributed to an improvement in the fabric thermal performance of the caravan; this is supported by the in situ U-value measurements presented in the following section of this report. Table 5: Summary of coheating test results Caravan HLC (W/K) Original glazing Replacement windows Replacement windows & door C ± ± ± 0.6 C ± 0.6 n/a n/a The change in HLC is measured against a baseline HLC estimated with data from only one night; however there is a reasonably high degree of confidence that the HLC is reasonably accurate as successive test phases demonstrated good agreement between HLC estimates over differing nights (excluding nights of high wind speed). The coheating tests suggest that the caravans are highly susceptible to wind-washing and increased ventilation heat loss (even with all accessible purpose provided ventilation sealed). The limited data available meant that it was not possible to normalise the HLCs for wind speed. It is suggested that future testing of caravans should involve greater monitoring of wind conditions and be undertaken over a substantially longer time period. Due to the mobile nature of caravans it could be feasible to conduct fabric performance testing within a controlled environment. By undertaking fabric tests within a controlled environment it would allow faster, more accurate and more precise measurements of fabric heat loss to be obtained. Such testing could also be used to develop fabric integrity standards or a fabric performance labelling scheme for such caravans. Leeds Sustainability Institute 21
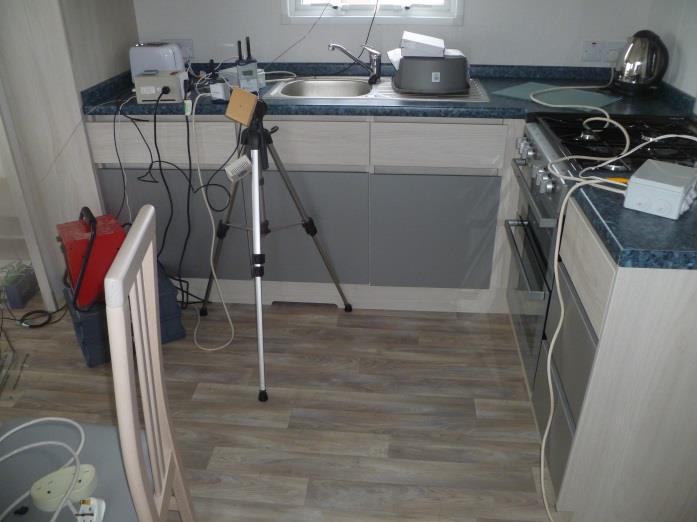
22 In situ U-value Measurement The primary purpose of the thermal performance measurements was to measure the change in fabric heat loss of caravan C05 resulting from the installation of replacement windows and door. To confidently ascribe any change in thermal performance of the caravan to a change in thermal performance of the windows and door, rather than due to a change in the thermal performance of any other thermal element, in situ U-value measurements of the caravan s thermal elements were undertaken. Method The thermal transmittance of a building element (U-value) is defined in ISO 7345 as the Heat flow rate in the steady-state divided by area and by the temperature difference between the surroundings on each side of a system (ISO, 1987, p.3). U-values are expressed in units W/m 2 K. ISO 9869 (ISO, 2014) describes the method in which in situ U-value measurements of thermal elements are typically undertaken. For a lightweight thermal element the minimum measurement period to comply with ISO 9869 is three successive nights where the U-value does not differ by more than ± 5%. Due to the short test duration, it was not possible to continue measurement until this condition was met; thus the values presented are not to the ISO 9869 standard. Despite this, other aspects relating to the measurement and analysis of the in situ U-values were undertaken in accordance with ISO To reduce the influence of solar radiation on the results and provide a valid comparison with the coheating tests, in situ U-values were calculated from measurements of heat flux density and ΔT obtained overnight (22:00 05:59 inclusive) using Equation 1 contained within ISO U = n j=1 q j n j=1(t ij T ej ) Equation 1 Where: U= in situ U-value (W/m 2 K) q = heat flux density (W/m 2 ) T (i) = internal air temperature (K) T (e) = external air temperature (K) The U-values presented are the mean of the U-values measured during each night of each test period. The error associated with each in situ U-value presented is considered to be ± 10%. In situ measurements of heat flux density, from which in situ U-values are derived, were obtained using Hukseflux HFP01 heat flux plates (HFPs) installed on the following thermal elements of each test caravan: Window glazing centre pane (4 no.) Door glazing centre pane External wall Roof Floor Leeds Sustainability Institute 22
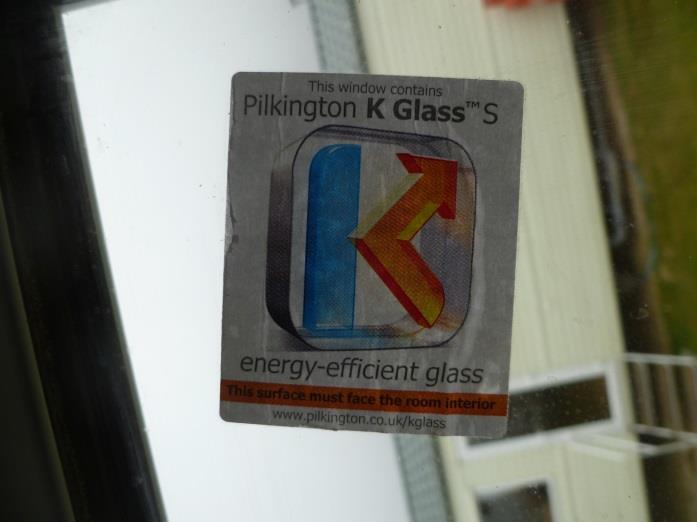
23 Results Table 6 provides a summary of the in situ U-value measurements obtained during each test period. Table 6: In situ U-values measured in each caravan during each test period Location Window 1 (centre pane) Window 2 (centre pane) Window 3 (centre pane) Window 4 (centre pane) Door (centre pane) Wall Roof Floor Caravan In situ U-value (W/m 2 K) Test 1 Test 2 Test 3 C C n/a C C n/a C C n/a C C n/a C C n/a C5 (stud) C n/a C C n/a C C n/a There was a high level of consistency between in situ glazing centre pane U-values measured across both caravans (mean 2.60 W/m 2 K, SD 0.06 W/m 2 K) in test period 1. The in situ U-values of nonglazed thermal elements in each caravan remained reasonably consistent across each of the test periods, this supports the assertion made in the coheating analysis that the reduction in HLC of caravan C05 is primarily due to the installation of replacement glazing and door. In addition, the mean in situ window centre pane U-value in caravan C05 reduced from 2.57 W/m 2 K to 1.37 W/m 2 K following the installation of the replacement windows. Figure 18 illustrates the reduction in mean in situ window centre pane U-value that was measured across the test periods. Leeds Sustainability Institute 23

24 Figure 18: Mean in situ window centre pane U-value for each caravan during the 3 test periods (windows only). Table 7 provides very approximate estimates of the total heat loss from the caravans for each stage of testing based on the values listed in Table 6 and a number of additional assumptions, not least that the elemental in situ U-values obtained were only based on single placements of heat flux sensors. Unfortunately, extending the heat flux measurement to provide fully representative samples of each individual thermal element in each caravan was beyond the scope of this project. The assumptions used in calculating the total heat loss are detailed below. The external wall U-value used is based on the assumption that the stud fraction is 10% of the overall external wall area. The window/door U-values used are based upon the measured centre-pane values. The values used for thermal bridging equate to the default values used with Part L of the Building Regulations for timber- frame housing. The heat loss due to ventilation has been calculated based upon the measured pressurisation test results of each caravan, rather than an actual ventilation rate over the test periods. The results obtained from undertaking the heat loss calculations are detailed within Table 7. In all of the tests, the total heat loss coefficient values listed in Table 7 show a reasonable and consistent correlation with the measured whole caravan heat loss detailed within Table 5. Both sets of results appear to verify the measurements made using the alternative technique. It should be noted that it is the general trend that is of importance here, rather than the estimated values. Leeds Sustainability Institute 24
25 Table 7: Approximate HLC based on in situ U-value measurement and estimates of thermal bridging and ventilation heat loss. Detail Area C10 C05 - Stage 1 C05 - Stage 2 C05 - Stage 3 Apparent Apparent Apparent Apparent U-value Heat Loss U-value Heat Loss U-value Heat Loss U-value Heat Loss m 2 W/m 2 K W/K W/m 2 K W/K W/m 2 K W/K W/m 2 K W/K Ground Floor Roof Walls Windows Door Total Thermal Bridging m W/mK W/mK W/mK W/mK Openings Junctions Total Ventilation Heat Loss ach ach ach ach Total (Heat Loss Coefficient) Conclusions The magnitude of the HLC reduction calculated from the in situ U-value measurements is comparable to that measured by the coheating tests. The in situ U-value measurements also support the findings obtained from the coheating tests, where the reduction in the measured HLC can be attributed to the installation of the replacement glazing and doors, rather than due to any change in thermal performance of the other thermal elements. The installation of the replacement windows in caravan C05 resulted in a reduction of mean in situ window centre pane U-value (for the 4 windows and door investigated) from 2.57 W/m 2 K to 1.37 W/m 2 K. Leeds Sustainability Institute 25
26 Summary This report has outlined the results of a number of fabric performance tests that were undertaken on two static caravans located at the Blue Dolphin Holiday Park, Filey, North Yorkshire. The tests were undertaken in order to assess the impact that the installation of upgraded replacement windows and doors would have on the in situ thermal performance of the caravans. Due to slight differences in the orientation of the two caravans, it is to be expected that there will be some natural variation between the measured fabric thermal performance of each caravan. The coheating test measurements indicate a small difference in fabric thermal performance between the caravans prior to any upgrade measures, with caravan C10 obtaining an HLC of 116 ± 0.6 W/K and caravan C10 obtaining an HLC of ± 0.5 W/K. This small difference in performance is also reflected in the pressurisation test results, with caravan C10 obtaining an air permeability of 5.52 m 3 /(h.m 2 50 Pa compared to 5.23 m 3 /(h.m 2 50 Pa for caravan C05. The observed difference in air permeability between the caravans will account for some of the observed difference in the coheating test results. Following replacement of the original windows and door installed in caravan C05 with higher performance glazing and door units, the heat loss coefficient of this caravan reduced to 97.6 ± 0.6 W/K. This equates to an absolute difference in heat loss coefficient of 11.1 W/K, representing a reduction in heat loss coefficient in excess of 10%. The results of the coheating tests also suggest that both caravans are highly susceptible to wind washing and increased ventilation heat loss (even when all of the accessible purpose provided ventilation openings are sealed). It is suggested that any future testing of caravans should involve greater monitoring of wind conditions and be undertaken over a substantially longer time period. Due to the mobile nature of caravans it could be feasible to conduct fabric performance testing within a controlled environment. By undertaking fabric tests within a controlled environment it would allow faster, more accurate and more precise measurements of fabric heat loss to be obtained and add to any evaluation of interventions (such as this investigation). Such testing could also be used to develop fabric integrity standards or a fabric performance labelling scheme for such caravans. A series of in situ heat flux density measurements was also undertaken on the caravans. These measurements revealed that there was a high level of consistency between in situ glazing centre pane U-values measured across both caravans in test period 1 (mean 2.60 W/m 2 K, SD 0.06 W/m 2 K), whilst the in situ U-values of the non-glazed thermal elements in each caravan remained reasonably consistent across each of the test periods. These results confirm that the reduction in the HLC of caravan C05 measured during the coheating tests is primarily due to the installation of the replacement glazing and door. In addition, the in situ heat flux density measurements undertaken in caravan C05 revealed a significant reduction in the mean in situ window centre pane U-value following the installation of the replacement windows. From test period 1 to test period 3, the centre pane U-value reduced by almost 50%, from 2.57 W/m 2 K to 1.37 W/m 2 K. Thermal imaging undertaken internally also revealed that the replacement window surfaces were noticeably warmer than the original windows. As moisture generation within the caravans will condense most rapidly on the coolest surfaces, this raised window surface temperature is likely to result in a reduction in formation of surface condensation on the glazing units. It is suspected that Leeds Sustainability Institute 26
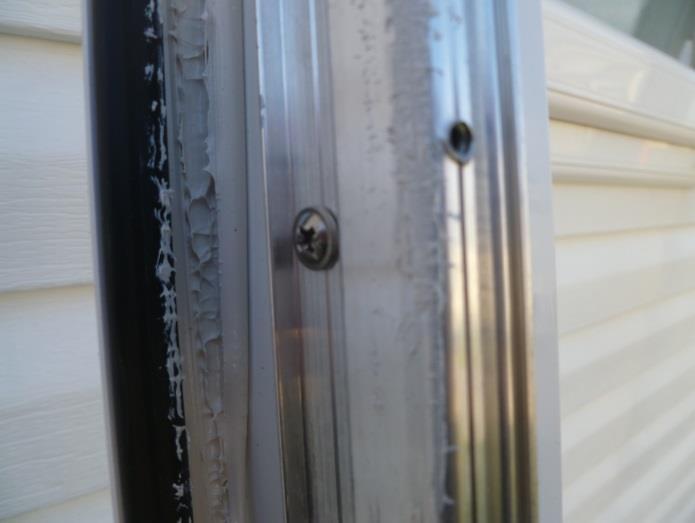
27 there is also a reduction in thermal bridging around the window frames, due to the removal of the aluminium strip around the perimeter of the original window frames. However, additional work would be required to be undertaken to confirm this. The results obtained from the in situ heat flux density measurements were also used to determine a whole van heat loss coefficient using an in situ U-value methodology. If this methodology is compared with the whole van in situ heat loss measurement method, comparable results are obtained. Leeds Sustainability Institute 27
28 Bibliography ATTMA (2010): Technical Standard L1: Measuring Air Permeability of Building Envelopes (Dwellings). The Airtightness Testing & Measurement Association, Northampton. ISO (2014) ISO 9869: Thermal insulation Building elements - In situ measurement of thermal resistance and thermal transmittance. Geneva, Switzerland, International Organization for Standardisation. ISO (1987) ISO 7345: Thermal insulation Physical quantities and definitions. Geneva, Switzerland, International Organization for Standardisation. Johnston, D., Miles-Shenton, D., Farmer, D., and Wingfield, J. (2013): Whole House Heat Loss Test Method (Coheating). June Leeds, UK, Centre for the Built Environment, Leeds Metropolitan University. Modera, M. P., Dickerhoff, D., Jansky, R. and Smith, B. (2009): Cited in ASHRAE Fundamentals. American Society of Heating, Refrigerating and Air-Conditioning Engineers, p Atlanta, NBS (2013): The Building Regulations 2010 Approved Document L1A: Conservation of fuel and power in new dwellings Edition. London, NBS. Roulet, C.-A. and Foradini, F. (2002): Simple and Cheap Air Change Rate Measurement Using CO 2 Concentration Decays. International Journal of Ventilation, Vol. 1, No. 1, pp Sherman, M. (1987): Estimation of Infiltration for Leakage and Climate Indicators. Energy and Buildings, 10, pp Leeds Sustainability Institute 28

29 Ln Q Ln Q Ln Q Ln Q Appendix 1 - Blower door spread sheets #VALUE! #VALUE! 6.6 #VALUE! #VALUE! 6.5 #VALUE! #VALUE! MINNEAPOLIS BLOWER DOOR DATA INPUT AND CALCULATION date: 16/03/2015 Version 16c 04 November test house address: C10 Blue Dolphin #VALUE! 6.2 company: Camden Group #VALUE! #VALUE! house type: Mobile home tester: DMS, DF test reference number: Filey1a Blow er Door & Gauge Used Model 3 w ith DG outdoor temp ( C) 9 C Note: ENSURE THAT FLOW SETTINGS ARE IN m3/h - When using the DG700 gauge indoor temp ( C) 16 C run baseline pressure adjustment for minimum 30s w ith fan sw itched on but not Ln ΔP outdoor humidity (%rh) 66 %RH rotating indoor humidity (%rh) 53 %RH PRESSURISATION outdoor barometric pressure mbar or hpa Calculated Outdoor Air Density 1.25 kg/m indoor barometric pressure mbar or hpa Calculated Indoor Air Density 1.22 kg/m temperature corr. fact. depress description of main construction details: 0.9 temperature corr. fact. press Static Van C10 - pre w indow upgrade 0.8 w ind speed (m/s): baseline pressure diff (Pa) (+/-) Pa house w idth: m 0.6 house depth: m 0.5 house height: 2.38 m floor area: m volume: 84 m envelope area including floor: m Pressure Difference for ELA 10 Pa RESULTS: 0.1 Q50 Mean Flow at 50Pa = m 3 /h 0.0 Mean Air Leakage at 50Pa = h Ln ΔP Mean Air Permeability at 50 Pa = m/h or m 3 h/m 2 Equivalent Leakage Area = m 2 at 10 Pa DEPRESSURISATION RING - O,A,B,C,D,E for BD3 0,1,2,3 for MEASURED FAN PRESSURE (Pa) MEASURED FLOW (m 3 /h) ADJUSTED FLOW (m 3 /h) FLOW RANGE OK FOR SELECTED RING? DuctBB Approx 65 Pa OK Adjusted Pressure (Pa) Ln delta P Ln Q Q50 Calculated Flow at 50Pa (m 3 /h) Permeability Depressurisation Only (m 3 /(h.m 2 )) Approx 57 Pa OK r Approx 49 Pa OK C env m 3 /h.pan Approx 41 Pa OK n Approx 33 Pa OK Approx 25 Pa OK C L (corrected) m 3 /h.pan Approx 20 Pa OK DEPRESSURISATION Air Leakage Depressurisation Only (h -1 ) Q Depressurisation Δ P PRESSURISATION RING - MEASURED FAN MEASURED ADJUSTED FLOW RANGE OK Adjusted Ln delta P Ln Q Q50 Calculated Permeability Air Leakage O,A,B,C,D,E PRESSURE (Pa) FLOW (m 3 /h) FLOW (m 3 /h) FOR SELECTED Pressure Flow at 50Pa Pressurisation Pressurisation for BD3 RING? (Pa) (m 3 /h) Only (m 3 /(h.m 2 )) Only (h -1 ) 0,1,2,3 for DuctBB Approx 65 Pa Approx 57 Pa r 2 Approx 49 Pa C env m 3 /h.pan Approx 41 Pa n Approx 33 Pa Approx 25 Pa C L (corrected) m 3 /h.pan Approx 20 Pa Pressurisation Q Δ P #VALUE! #VALUE! 6.4 MINNEAPOLIS BLOWER DOOR DATA INPUT AND CALCULATION date: 16/03/2015 Version 16c 04 November test house address: C5 Blue Dolphin 6.2 #VALUE! company: Camden Group #VALUE! #VALUE! 6.1 house type: Atlas Static Van 7 tester: DMS DF test reference number: outdoor temp ( C) 9.3 C indoor temp ( C) 19.1 C outdoor humidity (%rh) 66 %RH rotating indoor humidity (%rh) 51 %RH PRESSURISATION outdoor barometric pressure mbar or hpa Calculated Outdoor Air Density 1.25 kg/m indoor barometric pressure mbar or hpa Calculated Indoor Air Density 1.20 kg/m temperature corr. fact. depress description of main construction details: 0.9 temperature corr. fact. press Static Van C05 - pre w indow upgrade 0.8 w ind speed (m/s): baseline pressure diff (Pa) (+/-) Pa house w idth: m 0.6 house depth: m 0.5 house height: 2.38 m floor area: m volume: 84 m envelope area including floor: m Pressure Difference for ELA 10 Pa RESULTS: 0.1 Q50 Mean Flow at 50Pa = m 3 /h 0.0 Mean Air Leakage at 50Pa = h Ln ΔP Mean Air Permeability at 50 Pa = m/h or m 3 h/m 2 Equivalent Leakage Area = m 2 at 10 Pa DEPRESSURISATION RING - O,A,B,C,D,E for BD3 0,1,2,3 for MEASURED FAN PRESSURE (Pa) Blow er Door & Gauge Used Note: ENSURE THAT FLOW SETTINGS ARE IN m3/h - When using the DG700 gauge run baseline pressure adjustment for minimum 30s w ith fan sw itched on but not MEASURED FLOW (m 3 /h) ADJUSTED FLOW (m 3 /h) FLOW RANGE OK FOR SELECTED RING? Model 3 w ith DG700 DuctBB Approx 65 Pa OK Adjusted Pressure (Pa) Ln delta P Ln Q Q50 Calculated Flow at 50Pa (m 3 /h) Permeability Depressurisation Only (m 3 /(h.m 2 )) Approx 57 Pa OK r Approx 49 Pa OK C env m 3 /h.pan Approx 41 Pa OK n Approx 33 Pa OK Approx 25 Pa OK C L (corrected) m 3 /h.pan Approx 20 Pa OK DEPRESSURISATION Air Leakage Depressurisation Only (h -1 ) #VALUE! #VALUE! Ln ΔP Q Depressurisation Δ P #VALUE! #VALUE! PRESSURISATION RING - MEASURED FAN MEASURED ADJUSTED FLOW RANGE OK Adjusted Ln delta P Ln Q Q50 Calculated Permeability Air Leakage O,A,B,C,D,E PRESSURE (Pa) FLOW (m 3 /h) FLOW (m 3 /h) FOR SELECTED Pressure Flow at 50Pa Pressurisation Pressurisation for BD3 RING? (Pa) (m 3 /h) Only (m 3 /(h.m 2 )) Only (h -1 ) 0,1,2,3 for DuctBB Approx 65 Pa Approx 57 Pa r 2 Approx 49 Pa C env m 3 /h.pan Approx 41 Pa n Approx 33 Pa Approx 25 Pa C L (corrected) m 3 /h.pan Approx 20 Pa Pressurisation Q Δ P Leeds Sustainability Institute 29
30 Ln Q Ln Q Ln Q Ln Q 6.8 DEPRESSURISATION #VALUE! #VALUE! 6.6 #VALUE! #VALUE! MINNEAPOLIS BLOWER DOOR DATA INPUT AND CALCULATION date: 18/03/2015 Version 16c 04 November test house address: C5 Blue Dolphin #VALUE! 6.4 company: Camden Group #VALUE! #VALUE! house type: Atlas Static Van tester: DMS DF 0 test reference number: FileyC5(2) outdoor temp ( C) 6.9 C indoor temp ( C) 17.4 C outdoor humidity (%rh) 89.2 %RH rotating indoor humidity (%rh) 49.8 %RH PRESSURISATION outdoor barometric pressure mbar or hpa Calculated Outdoor Air Density 1.27 kg/m indoor barometric pressure mbar or hpa Calculated Indoor Air Density 1.22 kg/m temperature corr. fact. depress WARNING!! description of main construction details: 0.9 temperature corr. fact. press Extreme Test Static Van C05 - post w indow upgrade 0.8 w ind speed (m/s): 2.8 Conditions 0.7 baseline pressure diff (Pa) (+/-) Pa house w idth: m 0.6 house depth: m 0.5 house height: 2.38 m floor area: m volume: 84 m envelope area including floor: m Pressure Difference for ELA 10 Pa RESULTS: 0.1 Q50 Mean Flow at 50Pa = m 3 /h 0.0 Mean Air Leakage at 50Pa = h Ln ΔP Mean Air Permeability at 50 Pa = m/h or m 3 h/m 2 Equivalent Leakage Area = m 2 at 10 Pa DEPRESSURISATION RING - O,A,B,C,D,E for BD3 0,1,2,3 for MEASURED FAN PRESSURE (Pa) Blow er Door & Gauge Used Note: ENSURE THAT FLOW SETTINGS ARE IN m3/h - When using the DG700 gauge run baseline pressure adjustment for minimum 30s w ith fan sw itched on but not MEASURED FLOW (m 3 /h) ADJUSTED FLOW (m 3 /h) FLOW RANGE OK FOR SELECTED RING? Model 3 w ith DG700 DuctBB Approx 65 Pa OK Adjusted Pressure (Pa) Ln delta P Ln Q Q50 Calculated Flow at 50Pa (m 3 /h) Permeability Depressurisation Only (m 3 /(h.m 2 )) Approx 57 Pa OK r Approx 49 Pa OK C env m 3 /h.pan Approx 41 Pa OK n Approx 33 Pa OK Approx 25 Pa OK C L (corrected) m 3 /h.pan Approx 20 Pa OK Air Leakage Depressurisation Only (h -1 ) #VALUE! Ln ΔP Q Depressurisation Δ P #VALUE! PRESSURISATION RING - MEASURED FAN MEASURED ADJUSTED FLOW RANGE OK Adjusted Ln delta P Ln Q Q50 Calculated Permeability Air Leakage O,A,B,C,D,E PRESSURE (Pa) FLOW (m 3 /h) FLOW (m 3 /h) FOR SELECTED Pressure Flow at 50Pa Pressurisation Pressurisation for BD3 RING? (Pa) (m 3 /h) Only (m 3 /(h.m 2 )) Only (h -1 ) 0,1,2,3 for DuctBB Approx 65 Pa Approx 57 Pa r 2 Approx 49 Pa C env m 3 /h.pan Approx 41 Pa n Approx 33 Pa Approx 25 Pa C L (corrected) m 3 /h.pan Approx 20 Pa Pressurisation Q Δ P #VALUE! #VALUE! 6.4 MINNEAPOLIS BLOWER DOOR DATA INPUT AND CALCULATION date: 20/03/2015 Version 16c 04 November test house address: C5 Blue Dolphin 6.2 #VALUE! company: Camden Group #VALUE! #VALUE! 6.1 house type: Atlas Static Van 7 tester: DMS DF DJ test reference number: FileyC5(3) outdoor temp ( C) 10.9 C indoor temp ( C) 23.8 C outdoor humidity (%rh) 62.2 %RH rotating indoor humidity (%rh) 39 %RH PRESSURISATION outdoor barometric pressure mbar or hpa Calculated Outdoor Air Density 1.24 kg/m indoor barometric pressure mbar or hpa Calculated Indoor Air Density 1.19 kg/m temperature corr. fact. depress WARNING!! description of main construction details: 0.9 temperature corr. fact. press Extreme Test Static Van C05 - post w indow upgrade + trims 0.8 w ind speed (m/s): 2.4 Conditions 0.7 baseline pressure diff (Pa) (+/-) Pa house w idth: m 0.6 house depth: m 0.5 house height: 2.38 m floor area: m volume: 84 m envelope area including floor: m Pressure Difference for ELA 10 Pa RESULTS: 0.1 Q50 Mean Flow at 50Pa = m 3 /h 0.0 Mean Air Leakage at 50Pa = h Ln ΔP Mean Air Permeability at 50 Pa = m/h or m 3 h/m 2 Equivalent Leakage Area = m 2 at 10 Pa DEPRESSURISATION RING - O,A,B,C,D,E for BD3 0,1,2,3 for MEASURED FAN PRESSURE (Pa) Blow er Door & Gauge Used Note: ENSURE THAT FLOW SETTINGS ARE IN m3/h - When using the DG700 gauge run baseline pressure adjustment for minimum 30s w ith fan sw itched on but not MEASURED FLOW (m 3 /h) ADJUSTED FLOW (m 3 /h) FLOW RANGE OK FOR SELECTED RING? Model 3 w ith DG700 DuctBB Approx 65 Pa OK Adjusted Pressure (Pa) Ln delta P Ln Q Q50 Calculated Flow at 50Pa (m 3 /h) Permeability Depressurisation Only (m 3 /(h.m 2 )) Approx 57 Pa OK r Approx 49 Pa OK C env m 3 /h.pan Approx 41 Pa OK n Approx 33 Pa OK Approx 25 Pa OK C L (corrected) m 3 /h.pan Approx 20 Pa OK DEPRESSURISATION Air Leakage Depressurisation Only (h -1 ) #VALUE! #VALUE! Ln ΔP Q Depressurisation Δ P #VALUE! #VALUE! PRESSURISATION RING - MEASURED FAN MEASURED ADJUSTED FLOW RANGE OK Adjusted Ln delta P Ln Q Q50 Calculated Permeability Air Leakage O,A,B,C,D,E PRESSURE (Pa) FLOW (m 3 /h) FLOW (m 3 /h) FOR SELECTED Pressure Flow at 50Pa Pressurisation Pressurisation for BD3 RING? (Pa) (m 3 /h) Only (m 3 /(h.m 2 )) Only (h -1 ) 0,1,2,3 for DuctBB Approx 65 Pa Approx 57 Pa r 2 Approx 49 Pa C env m 3 /h.pan Approx 41 Pa n Approx 33 Pa Approx 25 Pa C L (corrected) m 3 /h.pan Approx 20 Pa Pressurisation Q Δ P Leeds Sustainability Institute 30
31 Appendix 2 - Images 16-Mar-2015 Camden Group: Researchers: Site Address: C10 Site Visit Images 16-Mar-2015 Dominic Miles-Shenton, David Farmer C05 & C10, Holly Bank Blue Dolphin Holiday Park Filey North Yorkshire YO14 9PU C05 Pressurisation Test Results (depressurisation only): Air Permeability Air Leakage Rate Correlation coefficient m 3 /(h.m 2 50 Pa ach -1 r 2 C C Leeds Sustainability Institute 31


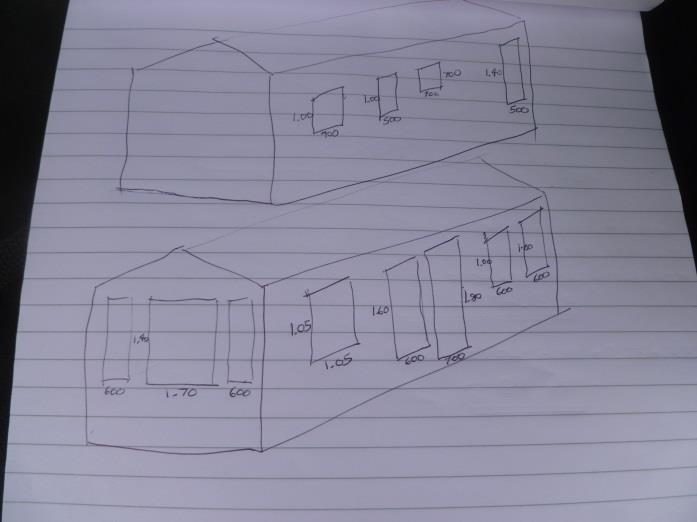
32 Images: C10 on arrival C10 internal dimensions and area/volume calculations C05 on arrival Leeds Sustainability Institute 32


33 C10 prior to pressurisation test C10 under depressurisation Leeds Sustainability Institute 33
34 Leeds Sustainability Institute 34
35 Leeds Sustainability Institute 35
36 Leeds Sustainability Institute 36
37 Leeds Sustainability Institute 37
38 Leeds Sustainability Institute 38
39 Leeds Sustainability Institute 39
40 Leeds Sustainability Institute 40

41 C05 prior to pressurisation test Leeds Sustainability Institute 41
42 Leeds Sustainability Institute 42
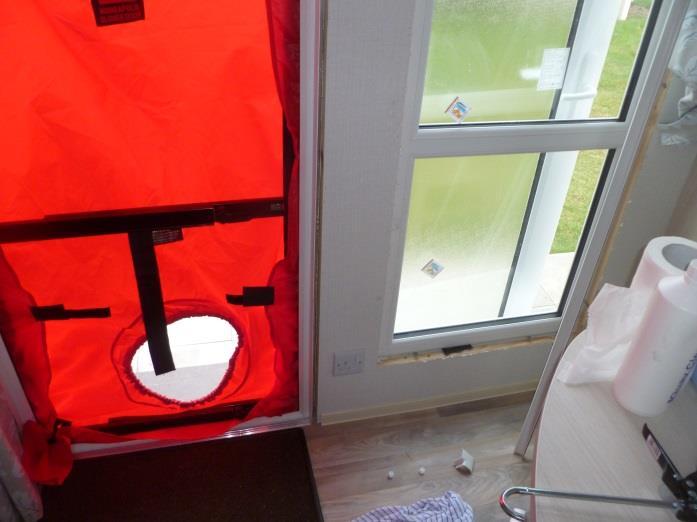
43 C05 under depressurisation Leeds Sustainability Institute 43

44 Leeds Sustainability Institute 44
45 Leeds Sustainability Institute 45
46 Leeds Sustainability Institute 46
47 Leeds Sustainability Institute 47
48 Leeds Sustainability Institute 48
49 Leeds Sustainability Institute 49

50 C10 Heated, following pressurisation test, with heat flux sensor placements Leeds Sustainability Institute 50
51 Leeds Sustainability Institute 51
52 Leeds Sustainability Institute 52


53 C05 Heat flux sensor placement Leeds Sustainability Institute 53
54 Appendix 3 - Images 18-Mar-2015 Camden Group: Researchers: Site Address: Site Visit Images 18-Mar-2015 Dominic Miles-Shenton, David Farmer C05 & C10, Holly Bank Blue Dolphin Holiday Park Filey North Yorkshire YO14 9PU Pressurisation Test Result 18-Mar-2015 (depressurisation only): Air Permeability Air Leakage Rate Correlation coefficient m 3 /(h.m 2 50 Pa ach -1 r 2 C Previous pressurisation Test Results 16-Mar-2015 (depressurisation only): Air Permeability Air Leakage Rate Correlation coefficient m 3 /(h.m 2 50 Pa ach -1 r 2 C C Leeds Sustainability Institute 54


55 Images: C05 on arrival Leeds Sustainability Institute 55
56 Leeds Sustainability Institute 56
57 Leeds Sustainability Institute 57
58 Leeds Sustainability Institute 58
59 Leeds Sustainability Institute 59

60 C10 on arrival Leeds Sustainability Institute 60
61 Leeds Sustainability Institute 61
62 Leeds Sustainability Institute 62
63 Leeds Sustainability Institute 63
64 Leeds Sustainability Institute 64

65 Leeds Sustainability Institute 65
66 Leeds Sustainability Institute 66
67 Leeds Sustainability Institute 67


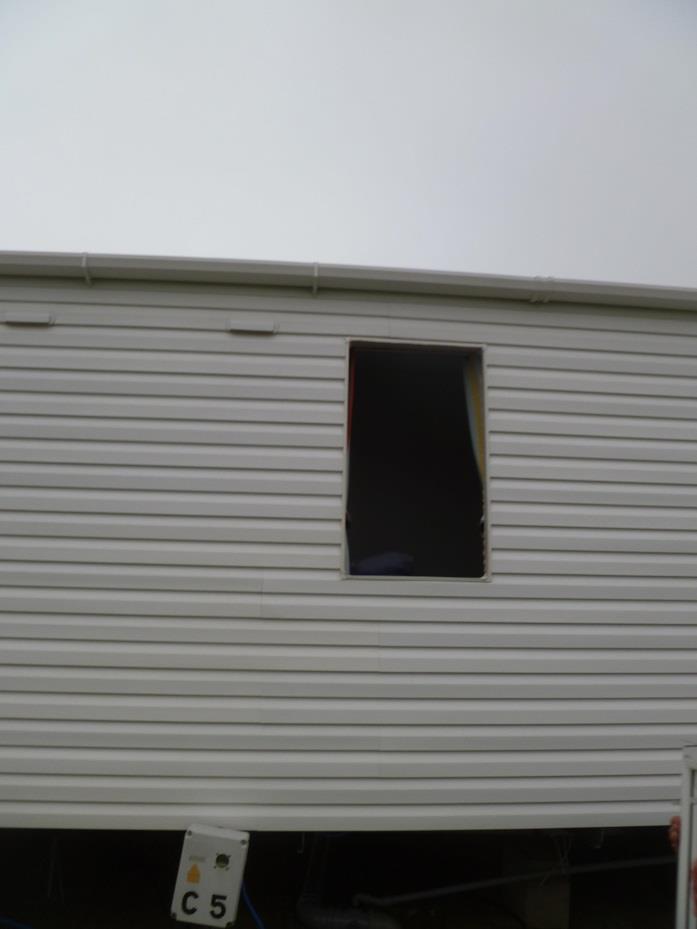
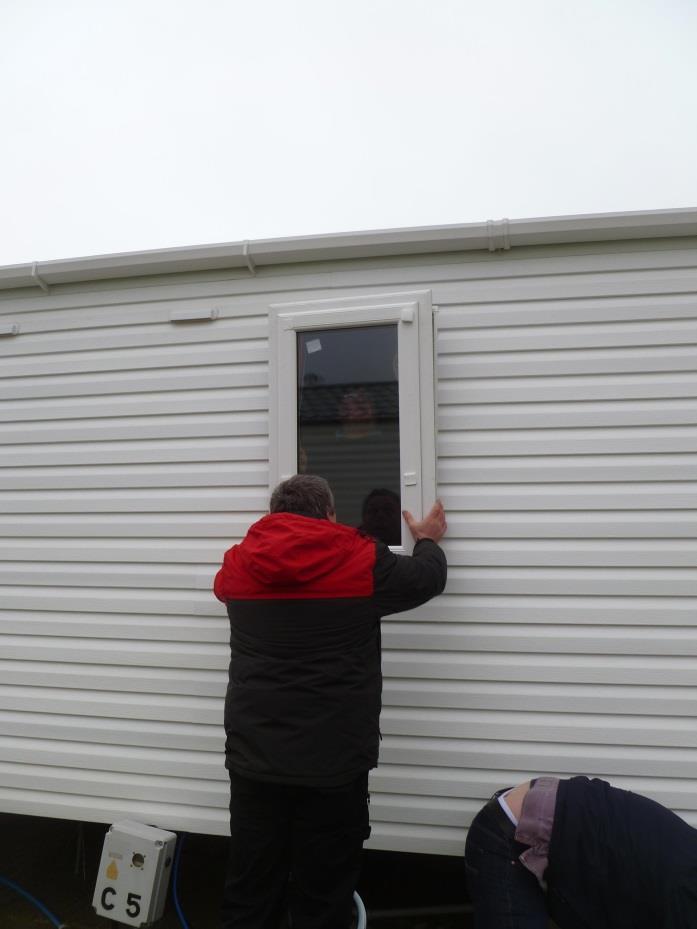
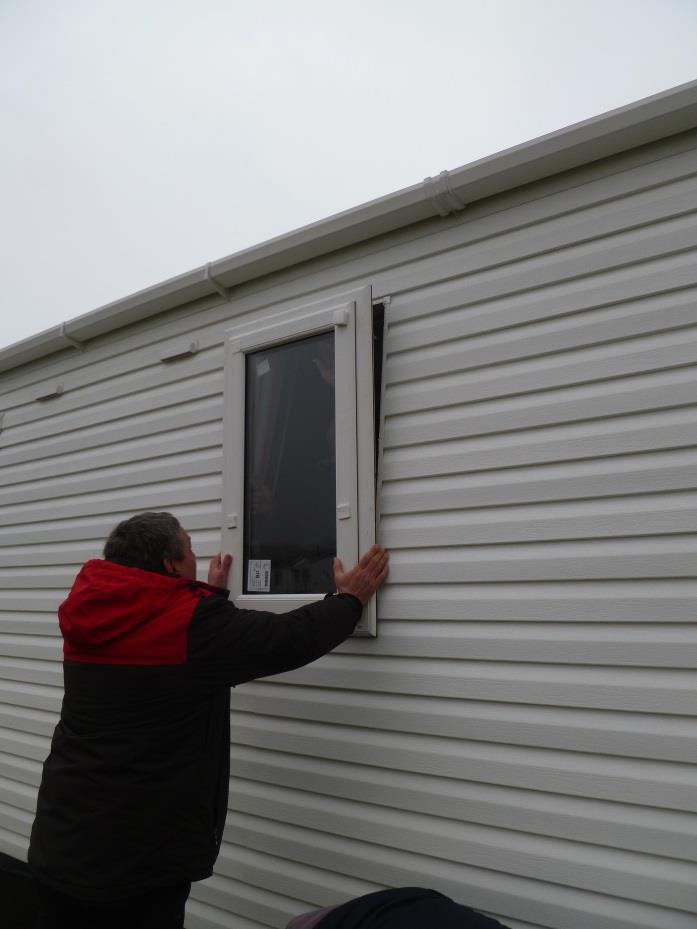
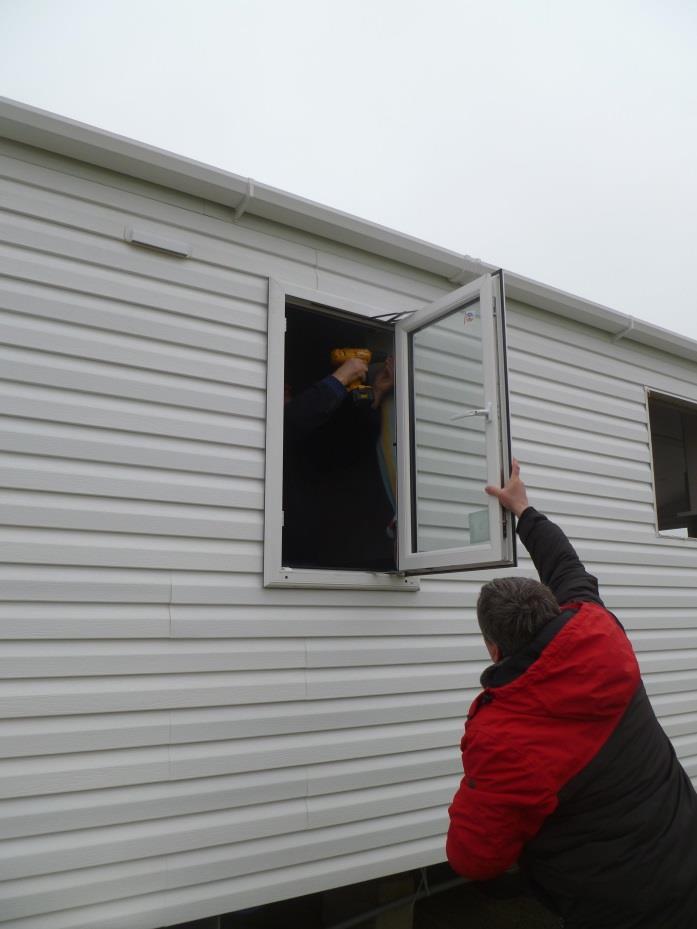
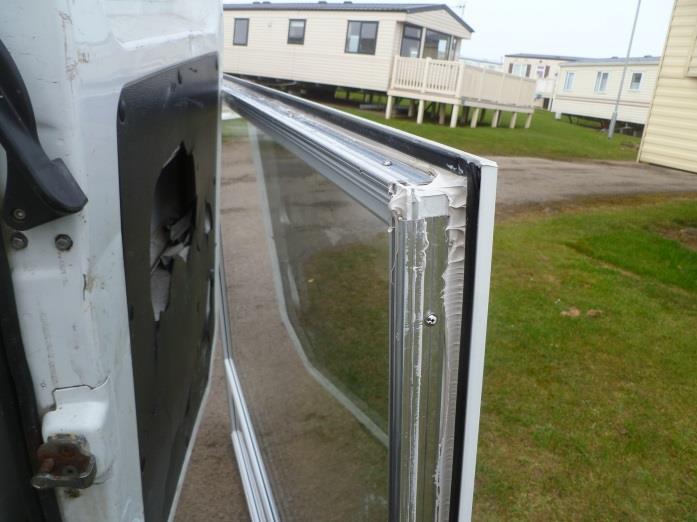
68 C05 window removal Leeds Sustainability Institute 68
69 Leeds Sustainability Institute 69

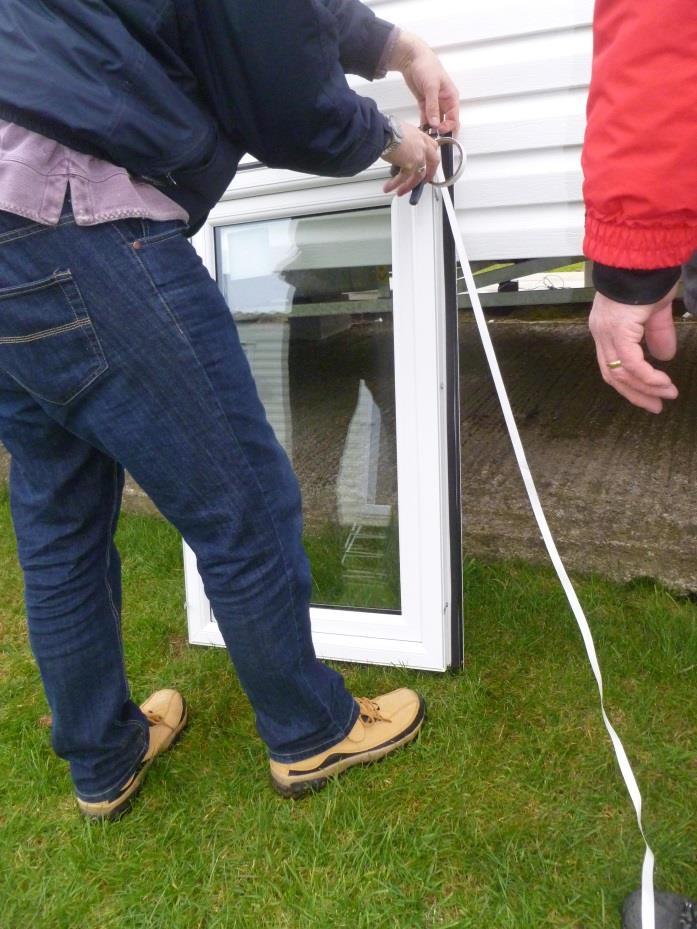
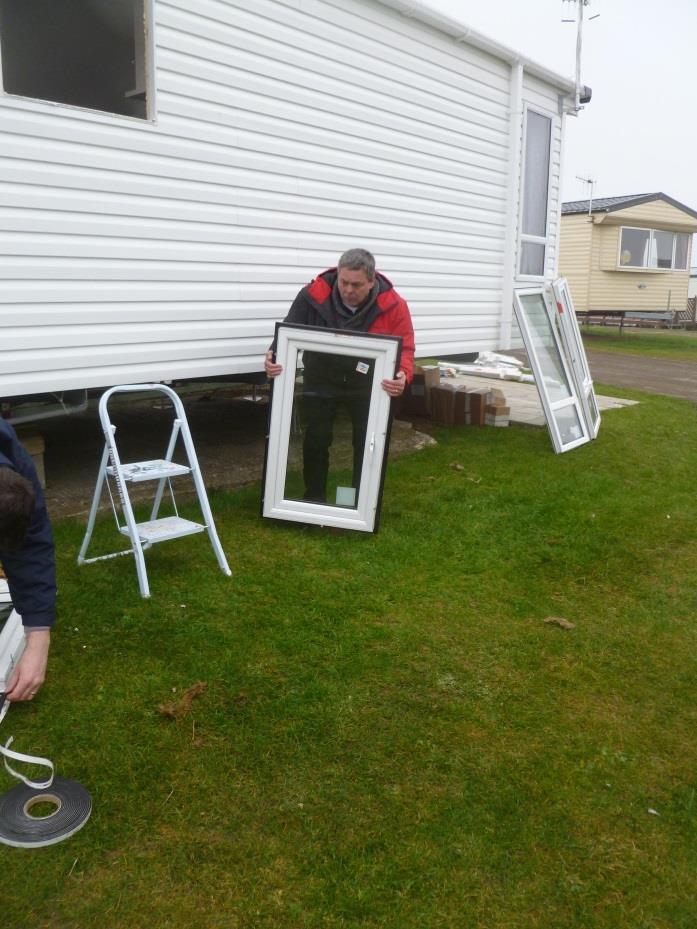
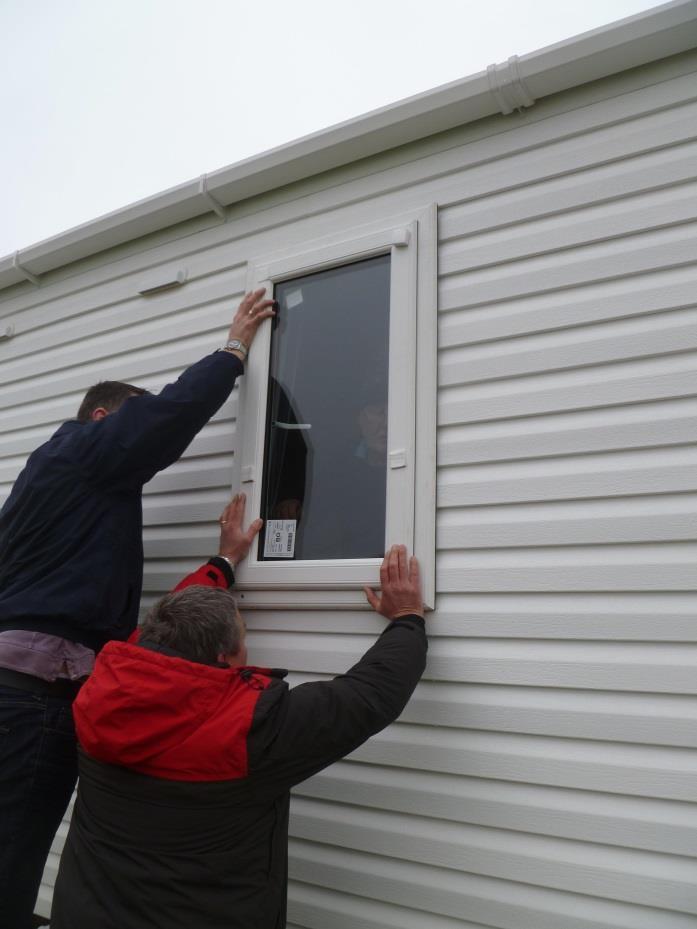
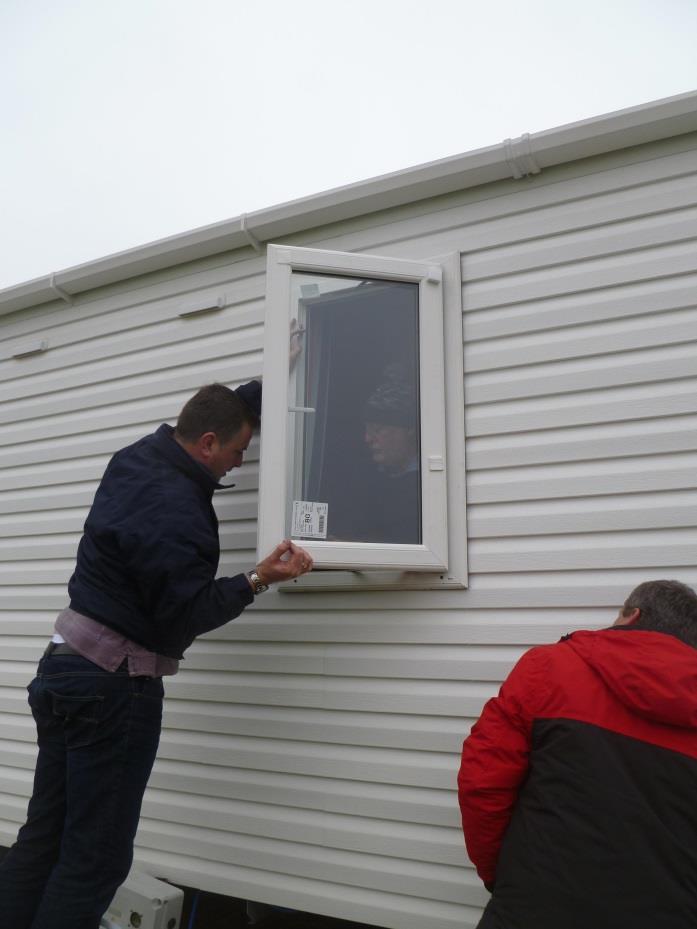
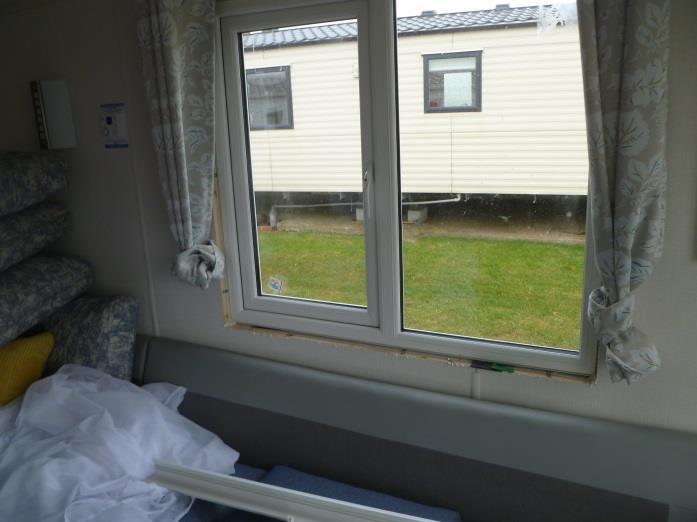
70 C05 window replacement Leeds Sustainability Institute 70
71 Leeds Sustainability Institute 71
72 Leeds Sustainability Institute 72
73 Leeds Sustainability Institute 73
74 Leeds Sustainability Institute 74

75 Leeds Sustainability Institute 75


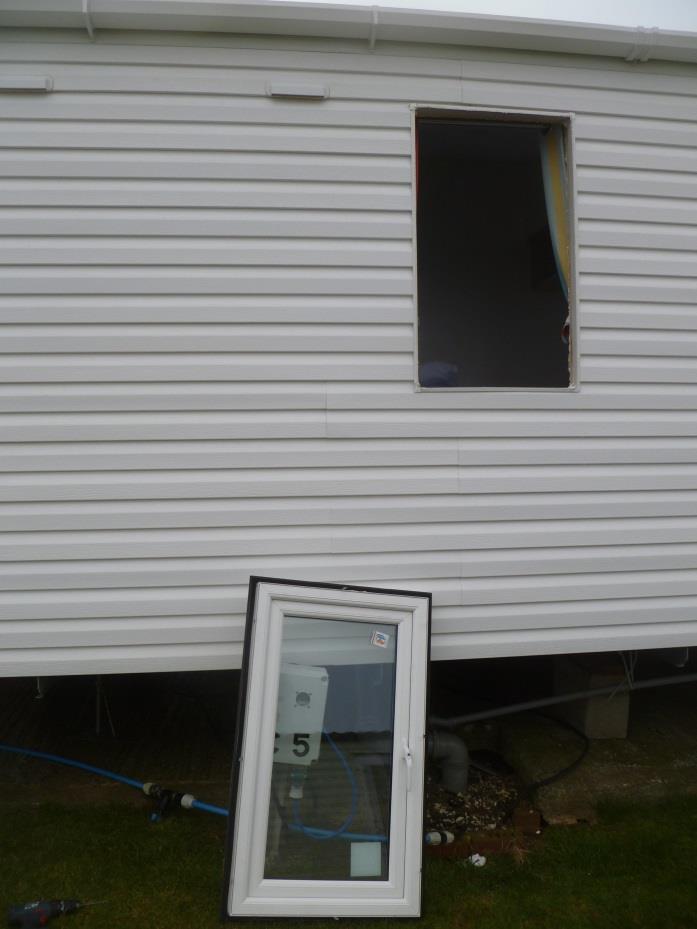
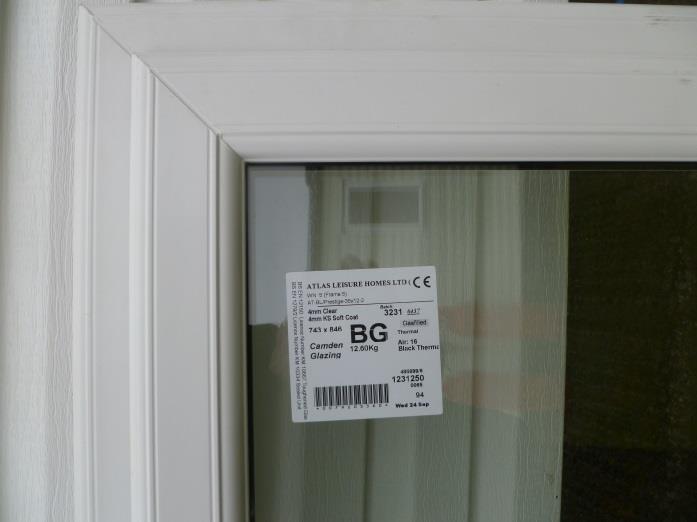
76 C05 removed window C05 pressure test Leeds Sustainability Institute 76
77 Leeds Sustainability Institute 77

78 Leeds Sustainability Institute 78
79 Appendix 4 - Images 20-Mar-2015 Camden Group: Researchers: Site Address: Site Visit Images 20-Mar-2015 Dominic Miles-Shenton, David Farmer, Prof. David Johnston C05 & C10, Holly Bank Blue Dolphin Holiday Park Filey North Yorkshire YO14 9PU Pressurisation Test Result 20-Mar-2015 (depressurisation only): Air Permeability Air Leakage Rate Correlation coefficient m 3 /(h.m 2 50 Pa ach -1 r 2 C Previous pressurisation Test Results (depressurisation only): Date Air Permeability Air Leakage Rate Correlation coefficient m 3 /(h.m 2 50 Pa ach -1 r 2 C05 16-Mar C05 18-Mar C10 16-Mar Leeds Sustainability Institute 79


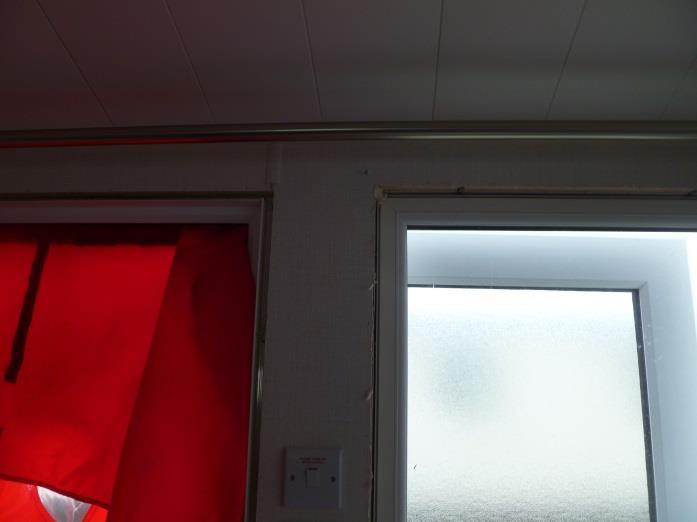
80 Direct comparison of the original door and a replacement window in C05: Leeds Sustainability Institute 80


81 Images: C05 on arrival Leeds Sustainability Institute 81
82 Leeds Sustainability Institute 82
83 Leeds Sustainability Institute 83
84 Leeds Sustainability Institute 84
85 Leeds Sustainability Institute 85
86 Leeds Sustainability Institute 86
87 Leeds Sustainability Institute 87
88 Leeds Sustainability Institute 88
89 C05 under depressurisation: Leeds Sustainability Institute 89
90 Leeds Sustainability Institute 90
91 Leeds Sustainability Institute 91
92 Leeds Sustainability Institute 92
93 Leeds Sustainability Institute 93
94 Leeds Sustainability Institute 94


95 C05 Door and mullion window replacement Leeds Sustainability Institute 95

96 Leeds Sustainability Institute 96
Stirley Barn Pressurisation Test Fri 13-Dec-2013
 Stirley Barn Pressurisation Test Fri 13-Dec-2013 Pressurisation test performed using a Minneapolis DuctBlaster. The only additional temporary sealing performed was around the blower door frame, where the
Air Pressure Test to EN13829:2000
 Air Pressure Test to EN13829:2000 16 Kilgarron Park Enniskerry Co. Wicklow 2014-03-04 Pre-Renovation Test Directors: G Ó Sé, J Uí Shé 1 Table of Contents Introduction... 3 Pressure Test Result Summary...
List of Appendices. Stamford Brook Deliverable 6: APPENDICES Web version - July 2007
 Stamford Brook Deliverale 6: APPENDICES We version - July 2007 List of Appendices Appendix 1: Pressurisation Test of Bryant Plot 116... 2 Appendix 2: Pressurisation Test of Bryant Plot 117... 9 Appendix
Air Leakage Detailing & Awareness Services
 Tel: 08456 808048 Mob: 07866 948200 www.aldas.co.uk Info@aldas.co.uk Report on the Repeat Air Permeability Testing of the Passivhaus Refurbishment of: 57 Portfield Street, Hereford 16 th July 2010 Address:
Report on Pre-improvement Air Leakage Testing, in compliance with ATTMA TSL1 (2010)
") 54 Melville Road Churchdown Gloucester GL3 2RG Mob: 07866 948200 Report on Pre-improvement Air Leakage Testing, in compliance with ATTMA TSL1 (2010) Result: Unsatisfactory Site address: 8 Benson Place,
54 Melville Road Churchdown Gloucester GL3 2RG Mob: 07866 948200 Report on Pre-improvement Air Leakage Testing, in compliance with ATTMA TSL1 (2010) Result: Unsatisfactory Site address: 8 Benson Place,
NSAI Agrément Approval Scheme for. Certified Air Tightness Tester Scheme Master Document
 NSAI Agrément Document Title Air Tightness Tester Page Page 1 of 10 Scheme NSAI Agrément Approval Scheme for Certified Master Document to I.S. EN ISO 9972:2015 - Thermal Performance of Buildings - Determination
Report on the Preliminary Air Leakage Testing of 8 Benson Place in Oxford, in compliance with ATTMA TSL1 (2010)
") Report on the Preliminary Air Leakage Testing of 8 Benson Place in Oxford, in compliance with ATTMA TSL1 (2010) Result: Satisfactory Site address: 8 Benson Place, Oxford, OX2 6QH Test Reference No.: ALDAS,
Report on the Preliminary Air Leakage Testing of 8 Benson Place in Oxford, in compliance with ATTMA TSL1 (2010) Result: Satisfactory Site address: 8 Benson Place, Oxford, OX2 6QH Test Reference No.: ALDAS,
Report on the Acceptance Air Leakage Testing of Rectory Cottage in Langattock, Powys, in compliance with ATTMA TSL1 (2010)
") Report on the Acceptance Air Leakage Testing of Rectory Cottage in Langattock, Powys, in compliance with ATTMA TSL1 (2010) Site address: Rectory Cottage, Langattock, Crickhowell, Powys NP8 1PH Test Reference
Report on the Acceptance Air Leakage Testing of Rectory Cottage in Langattock, Powys, in compliance with ATTMA TSL1 (2010) Site address: Rectory Cottage, Langattock, Crickhowell, Powys NP8 1PH Test Reference
TECHNICAL STANDARD L1. MEASURING AIR PERMEABILITY OF BUILDING ENVELOPES (DWELLINGS) October 2010 Issue
 October 2010 Issue") TECHNICAL STANDARD L1. MEASURING AIR PERMEABILITY OF BUILDING ENVELOPES (DWELLINGS) October 2010 Issue The Air Tightness Testing & Measurement Association c/o the British Institute of Non-Destructive Testing
TECHNICAL STANDARD L1. MEASURING AIR PERMEABILITY OF BUILDING ENVELOPES (DWELLINGS) October 2010 Issue The Air Tightness Testing & Measurement Association c/o the British Institute of Non-Destructive Testing
REPORT ON ENVELOPE AIR TIGHTNESS TESTING SPORTS HALL HMP LITTLEHEY CROW SPINNEY LANE PERRY HUNTINGDON PE28 0SR CLIENT: WATES CONSTRUCTION
 REPORT ON ENVELOPE AIR TIGHTNESS TESTING AT SPORTS HALL HMP LITTLEHEY CROW SPINNEY LANE PERRY HUNTINGDON PE28 0SR CLIENT: WATES CONSTRUCTION 2587 Name Position Signature Date Paul Cousins Acoustic Office
Overview ASTATT3. Carry out air tightness testing for single dwellings and other small buildings
 Overview This standard is for those who carry out air tightness and/or change rate testing of single dwellings and small up to a gross internal volume of 4000m³ inside the thermal line as defined by EN13829
Report on Air Leakage Testing, in compliance with ATTMA TSL1 (2010) Site address: Cropthorne Autonomous House, WL10 3LZ. Autonomous House, Evesham
 Site address: Cropthorne Autonomous House, WL10 3LZ. Autonomous House, Evesham") Report on Air Leakage Testing, in compliance with ATTMA TSL1 (2010) Result: Satisfactory The Gaia Group 12/1 Gayfield Street Edinburgh EH1 3NR T: 0131 557 9191 M: 07866 948200 M: 07984 805 163 sandy@gaiagroup.org
Report on Air Leakage Testing, in compliance with ATTMA TSL1 (2010) Result: Satisfactory The Gaia Group 12/1 Gayfield Street Edinburgh EH1 3NR T: 0131 557 9191 M: 07866 948200 M: 07984 805 163 sandy@gaiagroup.org
Overview ASTATT2. Prepare building for air tightness. testing
 Overview This standard is for those who carry out air tightness and/or change rate of buildings of any size or complexity. It covers those activities carried out to prepare the building for the conduct
Guidance on room integrity testing and its interpretation
 Guidance Note Guidance on room integrity testing and its interpretation Guidance on room integrity testing and its interpretation 1. SCOPE... 6 2. INTRODUCTION AND BACKGROUND... 6 2.1. DEVELOPMENT OF INTEGRITY
B. Diagnostic Equipment Information 01 Number of Manometers Used to Measure Home Pressurization Manometer Make. Manometer Serial Number
 STATE OF CALIFORNIA BUILDING LEAKAGE WORKSHEET CEC-CF2R-MCH-24-H (Revised 06/14) CERTIFICATE OF INSTALLATION Building Leakage Worksheet CALIFORNIA ENERGY COMMISSION Project Name: Enforcement Agency: Permit
CORESTA RECOMMENDED METHOD N 6
 CORESTA RECOMMENDED METHOD N 6 DETERMINATION OF VENTILATION DEFINITIONS AND MEASUREMENT PRINCIPLES (2015 Revision September 2016) 1. SCOPE This CORESTA Recommended Method specifies a method for the determination
ASTATT10 Carry out air tightness testing on large and complex, high rise and phased hand over zonal buildings
 Carry out air tightness testing on large and complex, high rise and phased Overview This standard is for those who carry out air tightness testing and inspection of large and complex buildings, high rise
Enclosure Sealing Webinar: Overview
 Enclosure Sealing Webinar: Overview Terry Brennan Camroden associates 315-336-7955 terry@camroden.com February 16, 2012 Why buildings? Buildings allow us to create a dry, Mediterranean climate in every
Controlling Cabin and Envelope Air Flows & Pressure Differentials
 Controlling Cabin and Envelope Air Flows & Pressure Differentials To control envelope moisture and related problems Douglas S. Walkinshaw and Keith F. Preston ECHO Air Inc www.indoorair.ca 1 This paper
APPLICATION OF AIRTIGHTNESS TO HEALTHCARE BUILDINGS
 APPLICATION OF AIRTIGHTNESS TO HEALTHCARE BUILDINGS William Booth *1, Tom Jones *1 Blanca Beato Arribas *1, 1 BSRIA Ltd Old Bracknell Lane West Bracknell Berkshire RG12 7AH UK ABSTRACT The thrust of airtightness
Results of Field Measurements and CONTAM Simulation. Building Science
 28 Building Science Corporation Tracer Gas Testing January 26 Results of Field Measurements and CONTAM Simulation Aaron Townsend Building Science Tracer gas test of a production Building America house
CONSIDERATION OF DENSITY VARIATIONS IN THE DESIGN OF A VENTILATION SYSTEM FOR ROAD TUNNELS
 - 56 - CONSIDERATION OF DENSITY VARIATIONS IN THE DESIGN OF A VENTILATION SYSTEM FOR ROAD TUNNELS Gloth O., Rudolf A. ILF Consulting Engineers Zürich, Switzerland ABSTRACT This article investigates the
Airtightness Testing in Large Buildings: NESEA 2016
 Airtightness Testing in Large Buildings: NESEA 2016 Dr John Straube, P.Eng. Associate Professor, University of Waterloo Principal, RDH Building Science This session: why would one invest in airtightness
ACCUMULATION OF HYDROGEN RELEASED INTO A VENTED ENCLOSURE - EXPERIMENTAL RESULTS
 ACCUMULATION OF HYDROGEN RELEASED INTO A VENTED ENCLOSURE - EXPERIMENTAL RESULTS Hooker, P. 1, Willoughby, D. 2, Hall, J. 3 and Hoyes, J. 4 1 Major Hazards Unit, HSL, Harpur Hill, Buxton, SK17 9JN, U.K,
B. Diagnostic Equipment Information 01 Number of Manometers Used to Measure Home Pressurization Manometer Make. Manometer Serial Number
 (Page 1 of 3) A. Building Air Leakage General Information 01 Test Procedure Used: 02 Indoor temperature during test (degreef) 03 Outdoor temperature during test (degreef) 04 Blower door location 05 Building
PLEA th Conference, Opportunities, Limits & Needs Towards an environmentally responsible architecture Lima, Perú 7-9 November 2012
 Natural Ventilation using Ventilation shafts Multiple Interconnected Openings in a Ventilation Shaft Reduce the Overall Height of the Shaft While Maintaining the Effectiveness of Natural Ventilation ABHAY
Evaluation of n-situ easurement ethods for ir ermeability of indows
 Evaluation of n-situ easurement ethods for ir ermeability of indows Christoph Geyer, Andreas Müller, Barbara Wehle, Martin Greiner, Pascal Urech Research and Development; Architecture, Wood and Civil Engineering
Assessing Permeation of Gas through Polyethylene Pipe
 Assessing Permeation of Gas through Polyethylene Pipe REPORTS Introduction Gas Distribution Networks (GDNs) regularly review the Shrinkage and Leakage model (SLM) to further enhance the reporting of Shrinkage
Detecting points of unintentional ventilation
 Detecting points of unintentional ventilation Jommi SUONKETO 1, Minna KORPI 1, Anu AALTONEN 1 1 Department of Civil Engineering, Tampere University of Technology, Finland, jommi.suonketo@tut.fi Abstract
01 18/11/2013 correction of the reference of the product 1 4 5
 The signed original report cancels all results and draft documents previously submitted. Each updated version of the report supersedes all previous ones. All void copies must be returned to CETIAT or destroyed.
OIL AND GAS INDUSTRY
 This case study discusses the sizing of a coalescer filter and demonstrates its fouling life cycle analysis using a Flownex model which implements two new pressure loss components: - A rated pressure loss
Fire safety of staircases in multi-storey buildings The results of measurements in Buildings and Simulations
 Fire safety of staircases in multi-storey buildings The results of measurements in Buildings and Simulations Grzegorz Kubicki, Ph.D. Department of Environmental Engineering, Warsaw University of Technology
Domestic Energy Fact File (2006): Owner occupied, Local authority, Private rented and Registered social landlord homes
: Owner occupied, Local authority, Private rented and Registered social landlord homes") Domestic Energy Fact File (2006): Owner occupied, Local authority, Private rented and Registered social landlord homes Domestic Energy Fact File (2006): Owner occupied, Local authority, Private rented
Domestic Energy Fact File (2006): Owner occupied, Local authority, Private rented and Registered social landlord homes Domestic Energy Fact File (2006): Owner occupied, Local authority, Private rented
Building air tightness
 MORE-CONENCT 2nd training module Building air tightness Duration: 4 hours Type: self-learning 2h and class room lectures 2 hours Dr.sc.ing. Anatolijs Borodiņecs Introduction Air-tightness became an actual
I.CHEM.E. SYMPOSIUM SERIES NO. 97 BUOYANCY-DRIVEN NATURAL VENTILATION OP ENCLOSED SPACES
 BUOYANCY-DRIVEN NATURAL VENTILATION OP ENCLOSED SPACES M. R. Marshall* and P. L. Stewart-Darling* A simple mathematical model for the buoyancy driven ventilation of an enclosed space, using a two-pipe
Duration: 4 hours Type: self-learning 2h and class room lectures 2 hours. Dr.sc.ing. Anatolijs Borodiņecs
 Duration: 4 hours Type: self-learning 2h and class room lectures 2 hours Dr.sc.ing. Anatolijs Borodiņecs Air-tightness became an actual issues since mid90ies. All new modern buildings as well as renovated
Postprint.
 http://www.diva-portal.org Postprint This is the accepted version of a paper presented at ASHRAE and AIVC IAQ 2016 Defining Indoor Air Quality: Policy, Standards and Best Practices, 12 14 September 2016,
IGUMA - IGU Design Limitations
 1/5 IGUMA - IGU Design Limitations Introduction Insulating Glass Units (IGU s) are being used more frequently in domestic and commercial buildings to provide improved insulation, comfort, condensation
2 FUSION FITTINGS FOR USE WITH POLYETHYLENE PRESSURE PIPES DESIGN FOR DYNAMIC STRESSES
 Industry Guidelines Part 2 FUSION FITTINGS FOR USE WITH POLYETHYLENE PRESSURE PIPES DESIGN FOR DYNAMIC STRESSES ISSUE 5.1 Ref: POP10B 15 MAR 2010 Disclaimer In formulating this guideline PIPA has relied
General Accreditation Guidance. User checks and maintenance of laboratory balances
 General Accreditation Guidance User checks and maintenance of laboratory balances January 2018 Copyright National Association of Testing Authorities, Australia 2010 All intellectual property rights in
ON INVESTIGATING INSTANTANEOUS WIND- DRIVEN INFILTRATION RATES USING CO 2 DECAY METHOD
 ON INVESTIGATING INSTANTANEOUS WIND- DRIVEN INFILTRATION RATES USING CO 2 DECAY METHOD Dimitrios Kraniotis*, Tormod Aurlien, Thomas K. Thiis Department of Mathematical Sciences and Technology, Norwegian
PREDICTING TEXTURE DEFICIENCY IN PAVEMENT MANAGEMENT PREDICTING TEXTURE DEFICIENCY IN PAVEMENT MANAGEMENT
 PREDICTING TEXTURE DEFICIENCY IN PAVEMENT MANAGEMENT Sean Rainsford Chris Parkman MWH NZ Ltd Transit New Zealand PREDICTING TEXTURE DEFICIENCY IN PAVEMENT MANAGEMENT Inadequate texture is one of the key
Reduction of Speed Limit at Approaches to Railway Level Crossings in WA. Main Roads WA. Presenter - Brian Kidd
 Australasian College of Road Safety Conference A Safe System: Making it Happen! Melbourne 1-2 September 2011 Reduction of Speed Limit at Approaches to Railway Level Crossings in WA Radalj T 1, Kidd B 1
Pre Feasibility Study Report Citiwater Cleveland Bay Purification Plant
 SOLAR POWER SPECIALISTS.Pure Power ACN 074 127 718 ABN 85 074 127 718 POWER MAGIC PTY LTD 245 INGHAM RD GARBUTT QLD 4814 Phone: 1800 068 977 Fax: 07 4725 2479 Email: FNQSOLAR@bigpond.com Pre Feasibility
Atmospheric Waves James Cayer, Wesley Rondinelli, Kayla Schuster. Abstract
 Atmospheric Waves James Cayer, Wesley Rondinelli, Kayla Schuster Abstract It is important for meteorologists to have an understanding of the synoptic scale waves that propagate thorough the atmosphere
What is the D-ifference in D-value?
 Volume 3, Number 3 September 2006 Garrett Krushefski Scientific & Technical Services Manager What is the D-ifference in D-value? Occasionally our Customer Service Department receives a request for biological
Influence of wind direction on noise emission and propagation from wind turbines
 Influence of wind direction on noise emission and propagation from wind turbines Tom Evans and Jonathan Cooper Resonate Acoustics, 97 Carrington Street, Adelaide, South Australia 5000 ABSTRACT Noise predictions
DEVELOPMENT AND TESTING OF AIR EXCHANGE RATE METHODS TO IMPROVE COST EFFECTIVENESS WHILE MAINTAINING ACCURACY
 DEVELOPMENT AND TESTING OF AIR EXCHANGE RATE METHODS TO IMPROVE COST EFFECTIVENESS WHILE MAINTAINING ACCURACY Prepared by: Joachim Eberharter (Joachim.Eberharter@tetratech.com) and James Elliot (Tetra
CHARACTERISTICS OF LEAK DETECTION BASED ON DIFERENTIAL PRESSURE MEASUREMENT
 CHARACTERISTICS OF LEAK DETECTION BASED ON DIFERENTIAL PRESSURE MEASUREMENT Harus L.G..*, Maolin CAI**, Kenji KAWASHIMA** and Toshiharu KAGAWA** * Graduate student of Mechano-Micro Engineering Dept., Tokyo
Impact of imperfect sealing on the flow measurement of natural gas by orifice plates
 Impact of imperfect sealing on the flow measurement of natural gas by orifice plates Rubens Silva Telles 1, Kazuto Kawakita 2 1 IPT Instituto de Pesquisas Tecnológicas, São Paulo, Brazil, rtelles@ipt.br
AVEMS & UNICLIMA joint Position paper on Regulation (EU) No.1253/2014 Paris, June 8 th
 No.1253/2014 Paris, June 8 th") AVEMS & UNICLIMA joint Position paper on Regulation (EU) No.1253/2014 Paris, June 8 th Considerations about hybrid and low pressure ventilation fans in the regulation 1253/2014 1) Definition of hybrid
AVEMS & UNICLIMA joint Position paper on Regulation (EU) No.1253/2014 Paris, June 8 th Considerations about hybrid and low pressure ventilation fans in the regulation 1253/2014 1) Definition of hybrid
Measurement of Representative Landfill Gas Migration Samples at Landfill Perimeters: A Case Study
 Measurement of Representative Landfill Migration Samples at Landfill Perimeters: A Case Study Breda M. Kiernan, PhD. National Centre for Sensor Research, Dublin City University Glasnevin Dublin 9 Ireland
What is Pressure? Residential Pressure Measurement
 What you will learn What is pressure? The importance of pressure in houses Get to know your pressure gauge Using a digital pressure gauge Pressure gauge tests on houses Pressure gauge troubleshooting What
Sizing of extraction ventilation system and air leakage calculations for SR99 tunnel fire scenarios
 Sizing of extraction ventilation system and air leakage calculations for SR99 tunnel fire scenarios Yunlong (Jason) Liu, PhD, PE HNTB Corporation Sean Cassady, FPE HNTB Corporation Abstract Extraction
Atmospheric Rossby Waves in Fall 2011: Analysis of Zonal Wind Speed and 500hPa Heights in the Northern and Southern Hemispheres
 Atmospheric Rossby Waves in Fall 211: Analysis of Zonal Wind Speed and 5hPa Heights in the Northern and Southern s Samuel Cook, Craig Eckstein, and Samantha Santeiu Department of Atmospheric and Geological
Measurement Device Deployment & Interpretation of Results. Topic 3 - Audio 33. Key Points
 Topic 3 - Audio 33 Short-Term Tests (2 days to 90 days) All exterior doors and windows need to be closed during the test. People can go in and out but not leave doors and windows propped open. No requirement
NUMERICAL INVESTIGATION OF THE FLOW BEHAVIOUR IN A MODERN TRAFFIC TUNNEL IN CASE OF FIRE INCIDENT
 - 277 - NUMERICAL INVESTIGATION OF THE FLOW BEHAVIOUR IN A MODERN TRAFFIC TUNNEL IN CASE OF FIRE INCIDENT Iseler J., Heiser W. EAS GmbH, Karlsruhe, Germany ABSTRACT A numerical study of the flow behaviour
AN INVESTIGATION OF LONGITUDINAL VENTILATION FOR SHORT ROAD TUNNELS WITH HIGH FIRE HRR
 - 9 - AN INVESTIGATION OF LONGITUDINAL VENTILATION FOR SHORT ROAD TUNNELS WITH HIGH FIRE HRR O Gorman S., Nuttall R., Purchase A. Parsons Brinckerhoff, Australia ABSTRACT Recent fire tests for tunnels
Ventilation of Small Multispan Greenhouse in Relation to the Window Openings Calculated with CFD
 Ventilation of Small Multispan Greenhouse in Relation to the Window Openings Calculated with CFD J.B. Campen Plant Research International Wageningen The Netherlands Keywords: greenhouse design, wind direction,
Copyright by Turbomachinery Laboratory, Texas A&M University
 Proceedings of the 2 nd Middle East Turbomachinery Symposium 17 20 March, 2013, Doha, Qatar Effectiveness of Windage Features on High Speed Couplings Steven Pennington Global Engineering Manager John Crane
To: The results of these surveys have been analysed and are summarised within this Technical Note.
 Technical Note Project: Histon Road / Milton Road, Cambridge Parking Surveys To: Andy Harrison Subject: Survey Report v1.6 From: Jonathan Barlow Date: 18 th February 2016 cc: Richard Jones / Dave Boddy
Outside Air Nonresidential HVAC Stakeholder Meeting #2 California Statewide Utility Codes and Standards Program
 1 Outside Air Nonresidential HVAC Stakeholder Meeting #2 California Statewide Utility Codes and Standards Program Jim Meacham, CTG Energetics Agenda 2 In Situ Testing Results Reduced Ventilation after
INTERACTION BETWEEN WIND-DRIVEN AND BUOYANCY-DRIVEN NATURAL VENTILATION Bo Wang, Foster and Partners, London, UK
 INTERACTION BETWEEN WIND-DRIVEN AND BUOYANCY-DRIVEN NATURAL VENTILATION Bo Wang, Foster and Partners, London, UK ABSTRACT Ventilation stacks are becoming increasingly common in the design of naturally
ICHEME SYMPOSIUM SERIES NO. 144
 EXPLOSION VENTING - THE PREDICTED EFFECTS OF INERTIA By Steve Cooper - Stuvex Safety Systems Limited Explosion venting is an established and well used method of primary explosion protection within industry.
OCTOBER 2017 ISSUE Page 1 of 7
 Field testing is performed on fully assembled pipelines for the purpose of determining pipeline acceptability. Following visual acceptance of joints and pipeline components, pressure pipelines in their
Validation of a Neutral Pressure Isolation Room
 Validation of a Neutral Pressure Isolation Room Andrew Fletcher, William Booth and Blanca Beato Arribas BSRIA Ltd., UK Corresponding email: Andrew.Fletcher@bsria.co.uk SUMMARY The principles behind a new
Instruction Manual. Pipe Friction Training Panel
 Instruction Manual HL 102 Pipe Friction Training Panel 100 90 80 70 60 50 40 30 20 10 HL 102 Instruction Manual This manual must be kept by the unit. Before operating the unit: - Read this manual. - All
Performance of Duct Leakage Measurement Techniques in Estimating Duct Efficiency: Comparison to Measured Results
 Performance of Duct Leakage Measurement Techniques in Estimating Duct Efficiency: Comparison to Measured Results Paul W. Francisco, Ecotope, Inc., Seattle, WA Larry Palmiter, Ecotope, Inc., Seattle, WA
GEOTHERMAL WELL COMPLETION TESTS
 GEOTHERMAL WELL COMPLETION TESTS Hagen Hole Geothermal Consultants NZ Ltd., Birkenhead, Auckland, New Zealand. ABSTRACT This paper reviews the measurements that are typically made in a well immediately
CENTER PIVOT EVALUATION AND DESIGN
 CENTER PIVOT EVALUATION AND DESIGN Dale F. Heermann Agricultural Engineer USDA-ARS 2150 Centre Avenue, Building D, Suite 320 Fort Collins, CO 80526 Voice -970-492-7410 Fax - 970-492-7408 Email - dale.heermann@ars.usda.gov
CHAPTER 3 RESULTS AND DISCUSSION
 CHAPTER 3 RESULTS AND DISCUSSION The research included the development and verification of the earlier apparatus, and the collection and validation of moisture diffusion data under both isothermal and
Evaluation of the optimum conditions for a local ventilation system in connection with the mine ventilation network
 Underground Mining Technology 2017 M Hudyma & Y Potvin (eds) 2017 Australian Centre for Geomechanics, Perth, ISBN 978-0-9924810-7-0 https://papers.acg.uwa.edu.au/p/1710_55_lee/ Evaluation of the optimum
PUBLISHED PROJECT REPORT PPR850. Optimisation of water flow depth for SCRIM. S Brittain, P Sanders and H Viner
 PUBLISHED PROJECT REPORT PPR850 Optimisation of water flow depth for SCRIM S Brittain, P Sanders and H Viner Report details Report prepared for: Project/customer reference: Copyright: Highways England,
C&G 2395 Exam Paper April Section A - All questions carry equal marks. Answer all three questions. Show all calculations.
 C&G 2395 Exam Paper April 2013 Section A - All questions carry equal marks. Answer all three questions. Show all calculations. Q.1 The electrical installation in a small food retail outlet is scheduled
Table of contents. I Drawings 33. A1 Design criteria 1 A1.1 Local thermal discomfort indices... 1
 Table of contents A1 Design criteria 1 A1.1 Local thermal discomfort indices........................... 1 A2 Experiment set-up 3 A2.1 Equipment....................................... 3 A2.2 Test cases.......................................
The Protection of Silos From Over. Pressurisation During Filling
 SHAPA Technical Bulletin No.11 The Protection of Silos From Over Pressurisation During Filling Page 1 of 8 August 2005 The Protection of Silos From Over Pressurisation During Filling By James Duggleby,
Technical Report. Comparison of Ventilation Standard Calibration Methods
 Physical Test Methods Sub-Group Technical Report Comparison of Ventilation Standard Calibration Methods May 2012 Author: Ian Tindall Cerulean Linford Wood East Milton Keynes, UK Sub-Group Coordinator Nils
This test shall be carried out on all vehicles equipped with open type traction batteries.
 5.4. Determination of hydrogen emissions page 1 RESS-6-15 5.4.1. This test shall be carried out on all vehicles equipped with open type traction batteries. 5.4.2. The test shall be conducted following
TRIP GENERATION RATES FOR SOUTH AFRICAN GOLF CLUBS AND ESTATES
 TRIP GENERATION RATES FOR SOUTH AFRICAN GOLF CLUBS AND ESTATES M M Withers and C J Bester Department of Civil Engineering University of Stellenbosch, Private Bag X1, Matieland, 7602 ABSTRACT There has
RESPONSIVE ROUNDABOUTS MYTH OR REALITY
 RESPONSIVE ROUNDABOUTS MYTH OR REALITY Andy Poole WSP UK Three White Rose Office Park Millshaw Park Lane Leeds LS11 0DL andy.poole@wspgroup.com Keywords: Traffic signals, optimisation, micro-simulation,
Micro Channel Recuperator for a Reverse Brayton Cycle Cryocooler
 Micro Channel Recuperator for a Reverse Brayton Cycle Cryocooler C. Becnel, J. Lagrone, and K. Kelly Mezzo Technologies Baton Rouge, LA USA 70806 ABSTRACT The Missile Defense Agency has supported a research
STANDARD PROCEDURE OF A TIGHTNESS TEST OF A SOLAR COLLECTOR BOX. (EUROSUN 2000 SOLAR CONGRESS)
") STANDARD PROCEDURE OF A TIGHTNESS TEST OF A SOLAR COLLECTOR BOX. (EUROSUN 2000 SOLAR CONGRESS) Ole Holck and Svend Svendsen Department of Buildings and Energy, Technical University of Denmark Building
STANDARD PROCEDURE OF A TIGHTNESS TEST OF A SOLAR COLLECTOR BOX. (EUROSUN 2000 SOLAR CONGRESS) Ole Holck and Svend Svendsen Department of Buildings and Energy, Technical University of Denmark Building
AIRFLOW GENERATION IN A TUNNEL USING A SACCARDO VENTILATION SYSTEM AGAINST THE BUOYANCY EFFECT PRODUCED BY A FIRE
 - 247 - AIRFLOW GENERATION IN A TUNNEL USING A SACCARDO VENTILATION SYSTEM AGAINST THE BUOYANCY EFFECT PRODUCED BY A FIRE J D Castro a, C W Pope a and R D Matthews b a Mott MacDonald Ltd, St Anne House,
Understanding Swimming Pool Ventilation. Presented by Tom Sands Mobile: CPD003/v03tcs2016
 Understanding Swimming Pool Ventilation Presented by Tom Sands Mobile: 07768 244555 Email: tom.sands@ves.co.uk CPD003/v03tcs2016 1 Learning Objectives At the end of the presentation you should have a broader
Soil water retention determination using the Wetlab facility at CSIRO, Davies Laboratory
 CSI RO AUST RALIA CSIRO LAN D and WATER Soil water retention determination using the Wetlab facility at CSIRO, Davies Laboratory E.J. Ford Technical Report 2/97 TECHNICAL REPORT 2/1997 CSIRO LAND AND WATER
Smoke and gas tightness of Hilti Firestop products
 Smoke and gas tightness Smoke and gas tightness of Hilti Firestop products The enclosed pages are taken from the Brochure Smoke and gas tightness Edition 2006 Please note the tables in this extract may
Domestic ventilation systems
 A BSRIA Guide www.bsria.co.uk A guide to measuring airflow rates EXPOSURE DRAFT In Association with ED46/2013 This publication has been printed on Nine Lives Silk recycled paper. The guidance given in
Monitoring Gas Pressure in Vacuum Insulation Panels
 Gas Pressure in VIP Monitoring Gas Pressure in Vacuum Insulation Panels Dr. Roland Caps, va-q-tec AG, Karl-Ferdinand-Braun-Str. 7, D-978 Würzburg, Germany, www.va-qtec.com, caps@va-q-tec.com, Hermann Beyrichen,
The Art of Natural Ventilation Balancing Heat and Air Flows?
 The Art of Natural Ventilation Balancing Heat and Air Flows? Rowan Williams Davis & Irwin (RWDI) Inc. Consulting in the Science of Buildings, Structures and Environment Duncan.Phillips@rwdi.com Acknowledgements
PAPER 12. CONTINUOUS MEASUREMENTS OF AIR INFILTRATION IN OCCUPlED DWELLINGS P.F. COLLET. Technological institute Denmark
 PAPER 12 CONTINUOUS MEASUREMENTS OF AIR INFILTRATION IN OCCUPlED DWELLINGS P.F. COLLET Technological institute Denmark Continuous measurements of air infiltration in occupied buildings The measurement
E. Agu, M. Kasperski Ruhr-University Bochum Department of Civil and Environmental Engineering Sciences
 EACWE 5 Florence, Italy 19 th 23 rd July 29 Flying Sphere image Museo Ideale L. Da Vinci Chasing gust fronts - wind measurements at the airport Munich, Germany E. Agu, M. Kasperski Ruhr-University Bochum
WP2 Fire test for toxicity of fire effluents
 Pagina 3 di 89 TRA SFEU VTT 22.6.2009 v.2 WP2 Fire test for toxicity of fire effluents Task 2.1.2 Development of small-scale test method for fire effluents Step 1: Use of modeling Plans according to DoW:
Read each slide, some slides have information to record on your organizer. Some slides have numbers that go with the question or red and underlined
 Read each slide, some slides have information to record on your organizer. Some slides have numbers that go with the question or red and underlined to use for answering the questions. Essential Question:
Conservation Limits and Management Targets
 Conservation Limits and Management Targets Setting conservation limits The use of conservation limits (CLs) in England and Wales (E&W) has developed in line with the requirement of ICES and NASCO to set
Practical Guide. By Steven T. Taylor, P.E., Member ASHRAE
 ractical Guide The following article was published in ASHRAE Journal, March 2003. Copyright 2003 American Society of Heating, Refrigerating and Air- Conditioning Engineers, Inc. It is presented for educational
Universities of Leeds, Sheffield and York
 promoting access to White Rose research papers Universities of Leeds, Sheffield and York http://eprints.whiterose.ac.uk/ White Rose Research Online URL for this paper: http://eprints.whiterose.ac.uk/7819/
Experimental Analysis of Inclined Narrow Plate-Fins Heat Sink under Natural Convection
 Experimental Analysis of Inclined Narrow Plate-Fins Heat Sink under Natural Convection A.A.WALUNJ 1, D.D.PALANDE 2 1,2 PG student, Mechanical Department, MCOERC, Nashik Abstract Steady state natural convection
Rapidmain Installation Guide
 Rapidmain Installation Guide Aluminium Compressed Air Pipe Work Installation Guide Trafalgar Court, Waterloo Ind Estate, Widnes Cheshire. UK. Ref: Rapidmain installation guide 4b Index 1. Rapidmain fittings:
Pressure release of insulating glass units (IGU)
") 2016 Page 1 of 12 ift Rosenheim (IGU) Research results, practical implementation and outlook 1 Introduction This technical contribution is based to a large extent on findings of the research project "Analyses
2016 Page 1 of 12 ift Rosenheim (IGU) Research results, practical implementation and outlook 1 Introduction This technical contribution is based to a large extent on findings of the research project "Analyses
Monitoring Surfing Quality below the Jordan River Generating Station (Year 2)
") Jordan River Project Water Use Plan Monitoring Surfing Quality below the Jordan River Generating Station (Year 2) Reference: JORMON#5 Monitoring Surfing Quality Below the Jordan River Generating Station
Jordan River Project Water Use Plan Monitoring Surfing Quality below the Jordan River Generating Station (Year 2) Reference: JORMON#5 Monitoring Surfing Quality Below the Jordan River Generating Station