Future Coasts Port Fairy Coastal Hazard Assessment
|
|
|
- Ashlie Marsh
- 5 years ago
- Views:
Transcription
1 Future Coasts Port Fairy Coastal Hazard Assessment WRL Technical Report 2012/21 April 2013 by F Flocard, J T Carley, D S Rayner, P F Rahman and I R Coghlan
2 Water Research Laboratory University of New South Wales School of Civil and Environmental Engineering Future Coasts Port Fairy Coastal Hazard Assessment WRL Technical Report 2012/21 April 2013 by F Flocard, J T Carley, D S Rayner, P F Rahman and I R Coghlan
3 Project Details Report Title Future Coasts Port Fairy Coastal Hazard Assessment Report Author(s) F Flocard, J T Carley, D S Rayner, P F Rahman and I R Coghlan Report No. 2012/21 Report Status Final Date of Issue April 2013 WRL Project No Project Manager Francois Flocard Client Name Moyne Shire Council Client Address PO Box 51 Port Fairy VIC 3284 Client Contact Oliver Moles Client Reference Document Status Version Reviewed By Approved By Date Issued 1A Draft J T Carley G P Smith 21/11/2012 Final Draft B M Miller B M Miller 17/12/2012 Final J T Carley B M Miller 19/04/2013 Water Research Laboratory 110 King Street, Manly Vale, NSW, 2093, Australia Tel: +61 (2) Fax: +61 (2) ABN: Quality System certified to AS/NZS ISO 9001:2008 Expertise, research and training for industry and government since 1959 This report was produced by the Water Research Laboratory, School of Civil and Environmental Engineering, University of New South Wales for use by the client in accordance with the terms of the contract. Information published in this report is available for release only with the permission of the Director, Water Research Laboratory and the client. It is the responsibility of the reader to verify the currency of the version number of this report. All subsequent releases will be made directly to the client. The Water Research Laboratory shall not assume any responsibility or liability whatsoever to any third party arising out of any use or reliance on the content of this report.
4 EXECUTIVE SUMMARY Overall Summary The following key points summarise this study: This is the first coastal hazard assessment which has considered coastline other than East Beach, encompassing the coastline from Cape Reamur to Cape Killarney (see Figure 1.1); The presence of existing rock seawalls indicates previous acknowledgement of coastal hazards; East Beach has been receding at 0.1 to 0.3 m/year over the past 150 years. While some of this recession can be attributed to the Moyne River training walls, a portion of this is likely to have occurred due to the prevailing wave climate and the planform of the bay. Without the training walls, the river mouth would meander and migrate over a large area; Opening of the Southwest Passage is unlikely to restore a full sand supply to East Beach sufficient to prevent or reverse the recession observed over the past 150 years; With the East Beach revetment remaining in place, approximately 30 buildings are vulnerable to the present day coastal erosion/recession hazard across the study area. Should the East Beach revetment fail, this increases to approximately 120; For the 2080 planning horizon with 0.8 m sea level rise, with the East Beach revetment remaining in place, approximately 90 buildings are vulnerable to the 2080 erosion/recession hazard across the study area. Should the East Beach revetment fail, this increases to approximately 200; A localised erosion hazard assessment study was performed for the undeveloped site located immediately next to the northern end of the rock revetment on East Beach. At present, the risk of dune breaching over the study area is low. For the 2080 planning horizon, the risk of a 400 m long breach of the dunes would be very high; Approximately 271 buildings are vulnerable to the present day inundation hazard, which would increase to 444 for the 2080 planning horizon; and With the coastal hazards identified, adaptation planning is needed. This can broadly be classified as Protect, Accommodate or Retreat. ES.1 Introduction This study is part of the Future Coasts Program, which is led by the Victorian Department of Sustainability and Environment (DSE) in partnership with the Department of Planning and Community Development (DPCD). The Future Coasts Port Fairy Coastal Hazard Assessment main objective was to provide Moyne Shire Council and other land and asset managers, with information which will assist in planning and establishing effective adaptive management options in response to present day coastal hazards and the projected impacts of climate change. Specifically this information will assist management agencies in strategic and business planning, infrastructure maintenance and replacement schedules, natural asset management and budgetary processes. ES.2 Data Compilation and Field Survey A substantial body of literature in the form of technical reports exists for the Port Fairy coastal area and was reviewed for this current study. However, most of the existing literature focused only on the East Beach coastline section, with a limited amount of work published for Griffiths Island and other beaches within the Moyne Shire. All relevant available literature addressing coastal processes, coastal protection works and coastal management within the Port Fairy area was reviewed. - i -
5 Formal site inspections were performed by WRL over the entire study area, which extended from Cape Reamur in the west to Cape Killarney in the east, inclusive of Griffiths Island (Figure 1.1), focusing on the visual assessment of the dune condition and condition of the coastal protection works. A geotechnical data acquisition campaign was performed on East Beach in order to assess bedrock depths, which will limit erosion and establish a more precise stratigraphy of the complete barrier system. Sand samples were collected from the intertidal zone at numerous locations over the whole study area in order to determine the particle size distributions which influence the erodibility of the sand. ES.3 Climate Change and Sea Level Rise Global sea level rise is the climate change variable most relevant to coastal management for which well accepted, quantified projections are available. Changes to atmospheric circulation, storm intensity and frequency are also of high importance to the coastal zone; however, wellaccepted quantification of likely changes is not available. The latest Intergovernmental Panel on Climate Change Report (IPCC, 2007a, b) provides numerous sea level rise scenarios for The sea level rise scenarios adopted for this project were specified by DSE and are at the upper end of IPCC scenarios (see Table ES.1). The maximum sea level rise scenario examined in this study, over the planning period to 2100, is 1.2 m. Table ES.1 Sea Level Rise Projections Adopted for this Study Planning Period (year) Sea Level Rise (m) ES.4 Coastal Processes The following coastal processes were considered within the constraints of available data and project resources for the Port Fairy Study area: Astronomical tides (predicted tides); Tidal anomalies, through barometric setup and wind setup; Ocean swell waves; Wave setup; Wave runup on beaches and overtopping; Longshore sand transport (littoral drift); Offshore sand transport (beach erosion caused by storm demand); and Influence of human activities. The coastal processes around the Port Fairy coastline are complex due to the influence of the Moyne River estuary, complex headland topography and the influence of human activities around the Moyne River estuary. A summary of the main coastal processes is provided below: The predominant wave climate is west to south-west with large average and extremes on exposed coast; Tide levels and associated storm surge are relatively small by Australian standards; East Beach and most of the smaller pocket beaches on the Western coastline are zeta planform, indicative of net littoral drift from west to east; Most of the pocket beaches on the Western coastline are protected from wave action by offshore rock platforms, resulting in relatively low erosion volumes caused by storm demand; - ii -
6 The unprotected section of East Beach has been receding at an underlying rate between 0.1 and 0.3 m/year, equivalent to 3,300 m 3 /year to 4,600 m 3 /year, measured over 150 years; The Moyne River training walls have disrupted the natural sediment transport pathway from the west; with substantial sediment accumulation on the southern mole; Sediment budget analysis indicates that East Beach could still be naturally receding in addition to the impacts of the training walls; and Analysis of the accumulated sand volumes indicate that the predominant sediment pathway is around the lighthouse headland on Griffiths Island. WRL s work has considered a wide range of variables and coastal processes across a study area ranging from Cape Reamur to Cape Killarney. Localised modelling of relevant coastal processes was performed to determine erosion and inundation hazards. As such, this report provides a higher level of information than previous coastal studies focusing solely on East Beach, and can be used for future planning and asset management purposes for East Beach and the entire Moyne Shire. ES.5 Coastal Erosion Hazard The following coastal erosion hazards were considered within the constraints of available data and project resources: Beach erosion and dune stability; Shoreline recession (long term change due to waves or sediment budget); Rocky cliff or bluff instability (a generic setback was adopted for the study area). The present day erosion hazard line was obtained by considering the erosion hazard due to storm demand and allowing for slope instability. The future hazard line (for the 2050, 2080 and 2100 planning horizon) was estimated by adding the underlying shoreline recession and the sea level rise induced shoreline recession. A large section of East Beach is backed by a rock revetment. Assuming the rock revetment will not fail during an extreme storm event, the present day and future planning horizons erosion hazard lines will coincide with the present rock revetment location. Storm demand was also calculated without the seawall in order to estimate the potential hazard should the seawall fail. Modelling showed that in this event, erosion will progress inland and potentially impact a large number of private properties and public assets. A localised erosion hazard assessment study was performed for the undeveloped site located immediately next to the northern end of the rock revetment on East Beach. At present, the risk of dune breaching over the study area is low. For the 2080 planning horizon, contingent on 0.80 m sea level rise eventuating, the risk of a 400 m long breach of the dunes between the ocean and Griffith Street, through to Belfast Lough, would be very high. ES.6 Coastal Inundation Hazard Coastal inundation hazards were assessed for the present day and the 2050, 2080 and 2100 planning horizons (with their associated sea level rise SLR). The inundation levels along the coast were characterised using two different methods. The first method is usually referred to as bathtub flood modelling. In this case, inundation levels are derived from the maximum coastal elevated water levels due to tide, storm surge local wave setup and sea level rise projection, and applied directly over inland areas. This method is - iii -
7 more simple and economical and can still be accurate if local wave conditions are considered. The bathtub method is usually conservative as it does not take into account the propagation of flood waters inland and considers the flood to be driven by an infinite volume of water. In some situations where wave runup and overtopping dominate inundation, the bathtub method may not be conservative. However, this method generally provides a good initial estimate of inundation level and extent; and was used over the whole Port Fairy study area. The second method used in this study is referred to as dynamic coastal inundation numerical modelling and was performed over the coastal area directly around the Port Fairy township. This method allowed the estimation of the possible inundation under combined ocean and catchment flooding. This specific coastal flood analysis considered dynamically both the coastal elevated water levels (i.e. sea level rise projections, storm surge and wave setup) and the wave runup overtopping of the foreshore and coastal structures. The modelling allowed consideration of the variation of the coastal and riverine water levels over the duration of the flood event as well as how would the flood waters propagate inland due to ground elevation or the obstacles. ES.7 Vulnerability Assessment of Private and Public Assets Figures showing potential inundation and erosion/recession have been derived from LIDAR surveys and the modelling undertaken, to indicate possible properties at risk. Indicative numbers of properties and public assets were provided as an order of magnitude estimate. Individual properties that may have been identified at possible risk need to have a detailed assessment undertaken, which (subject to triggers adopted) may be at the time of proposed redevelopment. Some properties are at risk from both hazards; however, for this study, hazards are treated separately, and may eventuate from different storm events. Coastal Erosion Hazard Indicative numbers of private properties and public assets at risk due to erosion/recession are shown in Table ES.2. Table ES.2 Indicative Numbers of Private Properties and Public Assets at Risk due to Erosion/Recession from Cape Reamur to Cape Killarney Scenario Asset Planning Horizon Present 2080 East Beach Rock Revetment In Place Private Properties Public Buildings 0 1 East Beach Rock Revetment Failure Private Properties Public Buildings 2 4 With the rock revetment in place on East Beach, the areas most impacted by the recession and erosion hazards for the 2080 planning horizon are located around Ocean Drive Beach and Pea Soup Beach. In the case of the East Beach rock revetment failure, a significant number of beachfront properties located along Griffith Street would likely be impacted. Coastal Inundation Hazard The presented inundation areas for the Port Fairy study area were derived from the combined analysis of the results of the bathtub inundation levels (incorporating astronomical tide, barometric setup and wave setup) and the dynamic coastal inundation numerical modelling - iv -
8 assessment for the coastal area of the Port Fairy township (estimating combined ocean and catchment flooding). Indicative numbers of private properties and public assets potentially at risk due to coastal inundation are shown in Table ES.3. Table ES.3 Indicative Numbers of Private Properties and Public Assets at Risk due to Coastal Inundation from Cape Reamur to Cape Killarney Asset Planning Horizon Present 2080 Private Properties Public Buildings The areas most impacted by the coastal inundation hazard at present are located along Ocean Drive, the Moyne River Channel and the south of the Belfast Lough. The inundation hazard along Ocean Drive is mainly the result of wave run up, with the potential risk of wave impact to buildings and hazard to the safety of people and vehicles. The inundation hazard along the Moyne River Channel and the south of the Belfast Lough is due to elevated water levels resulting from the tide, storm surge and catchment flooding. For the 2080 planning horizon, additional properties would most likely be impacted along Ocean Drive due to increased wave overtopping and south of the Belfast Lough due to riverine catchment influence. The occurrence of inundation may result in no damage, or range from nuisance flooding for some properties to major damage. The amount of damage is dependent upon the inundation level, floor level and construction materials and fittings. ES.8 Influence of Opening the Southwest Passage on Sediment Transport The main focus of this exercise was to assess the potential influence of opening the Southwest Passage causeway on sediment transport under coastal storm conditions (i.e. 50 or 100 year ARI coastal storm and coincident 10 or 20 year ARI riverine flood). The main results of this analysis show that with the passage open: Sediment transport was initiated in the Southwest Passage and the downstream section of the Moyne River towards the river entrance under the modelled storm conditions; Under such extreme environmental conditions, modelling results indicate that the Moyne River would be self-flushing. However, this was not demonstrated for ambient conditions; Under storm conditions, accumulated sand within the Southwest Passage could potentially be scoured to bedrock levels and mobilised towards the Moyne River channel and river entrance. Other general comments on reopening the Southwest Passage include: Increased wave climate, currents and water levels would reach the main channel, impacting navigation conditions; Probably increased sediment would enter the Moyne River main channel requiring additional dredging effort; Relatively minor contribution to East Beach sediment transport rate when compared to sand trapped by southern training wall on South Mole Beach; - v -
9 Extra sand washed in from the opened Southwest Passage would probably keep getting washed upstream under ambient conditions due to wave action and tidal asymmetry; Facilitating sediment transport to East Beach on a frequent basis (i.e. ambient conditions) may require the northern training wall to be removed. ES.9 Assumptions and Limitations Numerous assumptions and limitations are detailed in the body of this report. These relate primarily to uncertainty and inaccuracy of the input data used, and limitations in the assessment techniques arising from the complexity of the natural world. Furthermore, the scenarios involving climate change (primarily sea level rise) are dependent on the specific climate projection being realised. Nevertheless, the study was undertaken to the best current coastal engineering practice within the resources available to the project. The study was undertaken by highly experienced coastal engineers from WRL, drawing upon over 50 years of corporate experience in coastal hazard assessment, and underwent both internal and external peer review. - vi -
10 Contents Executive Summary i 1. Introduction Study Background Study Tasks Overview of Report 3 2. Data Compilation Literature Review Coastal Hazard Definition Studies Coastal Processes Studies and Coastline Management Studies Coastal Protection Works Studies Additional Information Aerial Photography and Photogrammetry Data Bathymetric and Topographic Data 7 3. Field Survey Overview Environmental Conditions during Inspections Western Coastline Cape Reamur Unnamed 7 (VIC 521) Unnamed 6 (VIC 520) Unnamed 5 (VIC 519) Unnamed 4 (VIC 518) Unnamed 3 (VIC 517) Unnamed 2 (VIC 516) Ocean Drive (VIC 515) Powling Street Pea Soup (VIC 515) South Beach (VIC 514) Griffiths Island The Southwest Passage, Puddeny Grounds Griffiths Island Beach South Mole Beach (i.e. Lighthouse Beach) East Beach Moyne River Training Walls to Apex Park Apex Park to Lydia Place Lydia Place to Richie Street Richie Street to Rock Revetment End From Potential Dune Breach to Night Soil Site From the Night Soil Site to Mills Reef Beach Access From Mills Reef to Reef Point Eastern Coastline Reef Point Killarney Beach Geological Survey Climate Change Overview of Key and Secondary Climate Change Variables Sea Level Rise 29 - vii -
11 4.3. Sea Level Rise Adopted in Australian States Sea Level Rise Adopted for this Study Quantification of Other Climate Change Variables Wind Climate Change Projections Wave Climate Coastal Processes Overview Adopted Modelling Scenarios for the Coastal Hazards Study Water Levels Ocean Swell Introduction Wave Buoy Data and Analysis Numerical Global Wave Models Extreme Value Analysis Results Wave Setup Wave Runup and Overtopping Beach Erosion and Shoreline Recession Introduction Short Term Storm Erosion Ongoing Underlying Recession Summary of Assessment of Ongoing Underlying Recession Human Activities Port Development Sand Accumulation around the Moyne River Entrance Moyne River Dredging East Beach Sediment Budget Analysis Previous Investigations Sediment Budget Analysis Summary of Coastal Processes in the Port Fairy Study Area Coastal Erosion Hazards Setbacks Introduction Short Term Storm Erosion (S1) Overview Profiles Water Levels Wave Heights Design Erosion Event and Storm Clustering SBEACH Model Results Zone of Reduced Foundation Capacity and Stable Foundation Zone (S2) Ongoing Underlying Recession (S3) Sea Level Rise Recession (S4) Bruun Rule Profile Closure Depth and Bruun Factor Calculations Coastal Erosion Hazard Lines Coastal Inundation Determination Overview Coastal Inundation Zones Wave Runup and Overtopping Dynamic Flood Modelling 79 - viii -
12 8.1. Introduction Review of the 2008 MIKE Flood Model Introduction MIKE Flood Model Calibration Mike Flood Model Run Verification Development of the 2012 MIKE Flood Model Extension of the Topography in the Coastal Area Extension and Modification of the Hydraulic Roughness Grid Design Flood Modelling Conditions Implementation of Dynamic Coastal Boundaries Design Flood Simulation Results Comparison with 2008 Model for Present Day Conditions Dynamic Flood Modelling Results Comparison of Bathtub and Dynamic Flood Modelling Results Influence of the Opening of the Southwest Passage on Sediment Transport Introduction Background Information Development Works Around the Southwest Passage Assessment of Sediment Volumes Around the Southwest Passage Previous Investigations Model Development and Assumptions Model Setup Design Modelling Conditions Methodology for Sediment Transport Characterisation Characterisation of Sediment Transport Summary of Effects Opening the Southwest Passage Review of Additional Coastal Hazards Windblown Sand Stormwater Erosion Seawater Intrusion into Groundwater Coastal Hazards Mapping and Vulnerability Assessment Risk Areas for Coastal Erosion and Recession Hazards Risk Areas for Coastal Inundation Assessment of Individual Beaches Cape Reamur Unnamed 7 Beach (VIC 521) Unnamed 6 Beach (VIC 520) Unnamed 5 Beach (VIC 519) Unnamed 4 Beach (VIC 518) Unnamed 3 Beach (VIC 517) Unnamed 2 Beach (VIC 516) Ocean Drive Beach and Powling Street Pea Soup Beach South Beach and Sandy Cove Area Griffiths Island Beach South Mole Beach and Southwest Passage East Beach (From Moyne River Training Walls to SLSC) East Beach (From SLSC to Rock Revetment End) East Beach (From Rock Revetment End to Reef Point) Reef Point ix -
13 Killarney Beach Coastal Risk Monitoring Options Monitoring and Maintenance of Onshore Coastal Structures Adaptation of Coastal Structures to Climate Change East Beach Rock Revetment Review of Existing Protection Recommended Immediate Actions Adaptation Strategies for Future Conditions East Beach Wooden Groynes Review of Existing Protection Recommended Immediate Actions Adaptation Strategies for Future Conditions Moyne River Moles Review of Existing Structures Recommended Immediate Actions Adaptation Strategies for Future Conditions Southwest Passage Breakwater and Puddeny Grounds Walls Review of Existing Structures Recommended Immediate Actions Adaptation Strategies for Future Conditions Further Recommendations for Monitoring Assumptions and Limitations Introduction Field Survey Sea Level Rise Water Levels and Wave Climate Beach Erosion and Recession Wave Runup and Overtopping Mapping of Coastal Hazard Lines Modelling and Mapping of Coastal Inundation Zones Vulnerability Assessment References 146 GLOSSARY FIGURES APPENDIX A: Wave Modelling APPENDIX B: Dune breach Investigation on East Beach APPENDIX C: Bathtub Flood Modelling Outputs APPENDIX D: Dynamic Flood Modelling Inputs - x -
14 List of Tables Table 1.1 Summary of Tasks Undertaken 2 Table 2.1 Summary of Aerial Photography and Photogrammetric Data (source DSE) 6 Table 2.2 Summary of Bathymetric and Topographic Data Sources 7 Table 3.1 Coastline Sub-sections Considered for the Study (Short, 2007) 8 Table 3.2 Median Sand Fraction Particle Sizes (60 μm to 2 mm) 9 Table 3.3 Predicted Tides during Site Inspections Port Fairy (source BoM) 9 Table 3.4 Recorded Winds during Site Inspections Port Fairy (source BoM) 10 Table 3.5 Bedrock Depth on East Beach 24 Table 4.1 Interaction Matrix of Climate Change Variables for Port Fairy (1/2) 27 Table 4.2 Interaction Matrix of Climate Change Variables for Port Fairy (2/2) 28 Table 4.3 Sea Level Rise Planning Benchmarks Summary 30 Table 4.4 Sea Level Rise Projections Adopted for this Study 31 Table 5.1 Modelling Scenarios Adopted for this Study 35 Table 5.2 Design Water Levels Tide + Storm Surge 36 Table 5.3 Summary of One Hour Exceedance Hs (Non-Directional Analysis) 39 Table 5.4 Summary of One Hour Exceedance Hs (Directional Analysis) 39 Table 5.5 Adopted One Hour Exceedance Wave Climate Conditions 40 Table 5.6 Underlying Recession Rates Based on Vegetation Line Analysis ( ) 43 Table 5.7 Underlying recession rates based on photogrammetry analysis ( ) 44 Table 5.8 Underlying Recession Rates Based on Long Term Analysis ( ) 44 Table 5.9 Adopted Underlying Recession Rates 45 Table 5.10 Estimation of Accumulated Sand Volumes (between and 2010) 49 Table 6.1 Bedrock Depths Used in SBEACH 55 Table 6.2 Design Storm Demands for 50 Year ARI Event 57 Table 6.3 Design Storm Demands for 100 Year ARI Event 58 Table 6.4 Width of Zone of Reduced Foundation Capacity at Each Coastline Sub-Section 59 Table 6.5 Calculated Bruun Factors for the Study Area 63 Table 6.6 Contour Levels for Frontal Dune Top at Each Coastline Sub-Section 64 Table 6.7 Allowances for S1 (50 year ARI), S2 and Present Day Associated Setbacks 65 Table 6.8 Allowances for S1 (100 year ARI), S2 and Present Day Associated Setbacks 66 Table 6.9 Allowances for Underlying and SLR Recession 67 Table 6.10 Horizontal Setbacks for Present Day, 2050, 2080 and 2100 Planning Periods 68 Table 7.1 Summary of Present Day Inundation levels (50 year ARI) 71 Table 7.2 Summary Inundation Levels for 2050, 2080 and 2100 Planning Horizons 72 Table 7.3 Limits for Tolerable Mean Wave Overtopping Discharges (EurOtop 2007) 73 Table 7.4 Present Day Predicted Wave Overtopping Discharge (50 year ARI) 74 Table 7.5 Future Predicted Wave Overtopping Discharge (SLR = 0.4 m; 100 year ARI) 75 Table 7.6 Future Predicted Wave Overtopping Discharge (SLR = 0.8 m; 100 year ARI) 76 Table 7.7 Future Predicted Wave Overtopping Discharge (SLR = 1.2 m; 100 year ARI) 77 Table 8.1 Comparison of Modelled Designed Water Levels (mahd) 81 Table 8.2 Adopted Roughness Values for the 2012 MIKE Flood Model 82 Table 8.3 Overview of Boundary Conditions 83 Table 8.4 Wave Overtopping Boundary Extents and Peak Discharges 85 Table 8.5 Comparison of Modelled Designed Water Depths (m) for 10 year ARI Flood Event 86 Table 8.6 Comparison of Maximum Water Levels (m AHD) in the Coastal Area 88 Table 8.7 Comparison of Maximum Water Levels between bathtub/dynamic flood modelling 92 Table 9.1 Estimation of Accumulated Sand Volumes ( ) 95 Table 9.2 Overview of Boundary Conditions 98 - xi -
15 Table 10.1 Potential Impacts of Climate Change on Groundwater Systems 106 Table 11.1 Indicative Assets Potentially Impacted by Erosion and Recession 108 Table 11.2 Indicative Assets Potentially Impacted by Coastal Inundation xii -
16 List of Figures Figure Location Plan Figure 1.2 Management Options Figure 3.1 Photographs of the Sieving Sediment Samples Figure 3.2 Sediment Sample Particle Size Distributions Figure Cape Reamur Site Inspection Figure Unnamed 7 (VIC 521) Site Inspection Figure Unnamed 6 (VIC 520) Site Inspection Figure Unnamed 5 (VIC 519) Site Inspection Figure Unnamed 4 (VIC 518) Site Inspection Figure Unnamed 3 (VIC 517) Site Inspection Figure Unnamed 2 (VIC 516) Site Inspection Figure Ocean Drive (VIC 515) Site Inspection Figure Powling Street Site Inspection Figure Pea Soup Beach Site Inspection (1/2) Figure Pea Soup Beach Site Inspection (2/2) Figure South Beach (VIC 514) Site Inspection Figure Southwest Passage Plan Figure Southwest Passage Site Inspection Figure Griffith Islands Beach Site Inspection Figure South Mole Site Inspection Figure East Beach Site Inspection - From the Moyne River Walls to Apex Park (1/2) Figure East Beach Site Inspection - From the Moyne River Walls to Apex Park (2/2) Figure East Beach Site Inspection From Apex Park to Lydia Place Figure East Beach Site Inspection From Lydia Place to Richie Street (1/2) Figure East Beach Site Inspection From Lydia Place to Richie Street (2/2) Figure East Beach Site Inspection From Richie Street to Rock Revetment End Figure East Beach Site Inspection From Dune Breach Site to Night Soil Site Figure East Beach Site Inspection From Night Soil Site to Mills Reef Figure East Beach Site Inspection From Mills Reef to Reef Point Figure Reef Point Site Inspection Figure Killarney Beach Site Inspection (1/2) Figure Killarney Beach Site Inspection (2/2) Figure Geological Survey Boreholes Locations Figure Geological Survey Sample Figure Components Elevated Water Levels Figure SWAN Model Results 100 year ARI SW Wave Direction Figure Wave Modelling Output Locations (Overview) Figure 5.4 Wave Modelling Output Locations (Western Coastline 1/2) Figure 5.5 Wave Modelling Output Locations (Western Coastline 2/2) Figure Wave Modelling Output Locations (Griffiths Island) Figure Wave Modelling Output Locations (East Beach) Figure Wave Modelling Output Locations (Eastern Coastline) Figure 5.9 Evolution of Zeta Planform Figure 5.10 Vegetation Lines Derived from Aerial Photography Figure 5.11 Available Photogrammetric Data on East Beach Figure 5.12 Shoreline Evolution between 1870 (Stanley) and 2010 Aerial Photography Figure 5.13 Historical Development (1/5) Figure 5.14 Historical Development (2/5) - xiii -
17 Figure 5.15 Historical Development (3/5) Figure 5.16 Historical Development (4/5) Figure 5.17 Historical Development (5/5) Figure 5.18 Overlay of 1854 Barrow Chart with 2010 Shoreline and Sand Deposition Areas Figure 5.19 Overlay of 1870 Stanley Chart with 2010 Shoreline and Sand Deposition Areas Figure Estimation of Coastal Hazard Lines Figure 6.2 Dune Stability Scheme Figure Subdivision of Unnamed 2 (VIC 516) Beach Based on Dune Crest Elevation Figure Example of Offshore Synthetic Storms Figure Example of SBEACH Input Output Figure Illustration of the Bruun rule Figure 6.7 Komar Geometric Model Used to Evaluate the Maximum Potential Erosion Figure MIKE Flood Model Schematisation Figure and 2012 MIKE Flood Model comparison 100 year ARI flood extent Figure and 2012 MIKE Flood Model comparison Water Levels Figure and 2012 MIKE Flood Model comparison Topography Extent Figure and 2012 MIKE Flood Model comparison Topography Extent Ocean Drive Figure and 2012 MIKE Flood Model comparison Topography Extent East Beach South Figure and 2012 MIKE Flood Model comparison Topography Extent East Beach North Figure MIKE Hydraulic Roughness Figure MIKE Hydraulic Roughness Figure 8.10 Ocean dynamic Water Levels Boundaries for Scenario 1 Figure MIKE Flood Model Wave Overtopping Entries 1/2 Figure MIKE Flood Model Wave Overtopping Entries 2/2 Figure Overtopping Discharges at East Beach Potential Dune Breach Site Figure Maximum Design Flood Extents Figure Maximum Design Flood Extents Ocean Drive Figure Maximum Design Flood Extents East Beach Figure Maximum Design Flood Extents Reef Point Figure Comparison of year ARI and 2012 Scenario 1 Figure Point Locations for 2012 Design Floods Comparison Figure 9.1 Local Modifications Applied to MIKE Topography Grid Figure 9.2 Depth Average Speed Scenario 6 Figure Depth Average Speed Scenario 7 Figure 9.4 Sediment Transport Zones Scenario 6 Figure Sediment Transport Zones Scenario 7 Figure 9.6 Difference in Averaged Speed with the removal of the Causeway (50 year ARI) Figure Difference in Averaged Speed with the removal of the Causeway (100 year ARI) Figure 11.1 Cape Reamur Coastal Erosion Hazard Lines Figure 11.2 Unnamed 6 & 7 Beaches (VIC 520 & VIC 521) Coastal Erosion Hazard Lines Figure 11.3 Unnamed 4 & 5 Beaches (VIC 518 & VIC 519) Coastal Erosion Hazard Lines Figure 11.4 Unnamed 3 (VIC 517) Coastal Erosion Hazard Lines Figure 11.5 Unnamed 2 (VIC 516) Coastal Erosion Hazard Lines Figure 11.6 Ocean Drive Coastal Erosion Hazard Lines Figure 11.7 Pea Soup Beach Coastal Erosion Hazard Lines Figure 11.8 South Beach Coastal Erosion Hazard Lines Figure 11.9 Griffiths Island Beach Coastal Erosion Hazard Lines Figure South Mole Beach Coastal Erosion Hazard Lines Figure East Beach Coastal Erosion Hazard Lines: Moyne River Training Walls to SLSC (Rock Revetment in Place) - xiv -
18 Figure East Beach Coastal Erosion Hazard Lines: SLSC to Rock Revetment End (Rock Revetment in Place) Figure East Beach Coastal Erosion Hazard Lines: Rock Revetment End to Night Soil Site Figure East Beach Coastal Erosion Hazard Lines: Night Soil Site to Old Municipal Tip Figure East Beach Coastal Erosion Hazard Lines: Old Municipal Tip to Reef Point Figure Reef Point Beach Coastal Erosion Hazard Lines Figure Cape Killarney Beach Coastal Erosion Hazard Lines Figure East Beach Coastal Erosion Hazard Lines: Moyne River Training Walls to SLSC (Rock Revetment Failure) Figure East Beach Coastal Erosion Hazard Lines: SLSC to Rock Revetment End (Rock Revetment Failure) Figure Cape Reamur Coastal Inundation Figure Unnamed 6 & 7 Beaches (VIC 521 & VIC 520) Coastal Inundation Figure Unnamed 4 & 5 Beaches (VIC 518 & VIC 519) Coastal Inundation Figure Unnamed 3 Beach (VIC 517) Coastal Inundation Figure Unnamed 2 Beach (VIC 516) Coastal Inundation Figure Ocean Drive Coastal Inundation Figure Pea Soup Beach Coastal Inundation Figure South Beach Coastal Inundation Figure Griffiths Island Beach Coastal Inundation Figure South Mole Beach Coastal Inundation Figure East Beach Coastal Inundation: Moyne River Training Walls to Port Fairy SLSC Figure East Beach Coastal Inundation: Port Fairy SLSC to Rock Revetment End Figure East Beach Coastal Inundation: Rock Revetment End to Night Soil Site Figure East Beach Coastal Inundation: Night Soil Site to Old Municipal Tip Figure East Beach Coastal Inundation: Old Municipal Tip to Reef Point Figure Reef Point Beach Coastal Inundation Figure Cape Killarney Beach Coastal Inundation Figure 12.1 Illustration of Adaptive Management Approach for Coastal Defence Structures Figure Conceptual Emergency Protection Terminal Revetment Cross-Section Figure 12.3 Overtopping of the Southwest Passage Causeway - xv -
19 1. Introduction 1.1. Study Background The Water Research Laboratory (WRL) of the University of New South Wales was engaged by the Moyne Shire Council (MSC) to undertake the study: Future Coasts Port Fairy Coastal Hazard Assessment. This study was part of the Future Coasts Program which is led by the Victorian Department of Sustainability and Environment (DSE) in partnership with the Department of Planning and Community Development (DPCD). Climate change projections forecast that sea levels are likely to rise over the coming century and potentially increase risks to coastal areas from storm surges, flooding and erosion. The main purpose of the Future Coasts Program is to assist Victoria in better understanding and planning for the risks associated with sea level rise and storm surge. Several priority locations along the coast, including Port Fairy, Bellarine Peninsula - Corio Bay, Western Port and Gippsland Lakes - 90 Mile Beach, were also identified by the Victorian Government for more detailed local coastal hazards assessments. The main goal of these local assessments was to test a range of methods to analyse the impacts of sea level rise as well as to provide practical information for planners and land and infrastructure managers to make decisions on a local scale. The Future Coasts Port Fairy Coastal Hazard Assessment main objective was to provide Moyne Shire Council and other land and asset managers, with information which will assist in planning for and managing the projected impacts of climate change, encompassing the coastline from Cape Reamur to Cape Killarney (Figure 1.1). Specifically this information will assist management agencies in strategic and business planning, infrastructure maintenance and replacement schedules, natural asset management and budgetary processes. Identification of coastal hazards allows to perform adaptation planning which can broadly be classified as Protect, Accommodate or Retreat (Figure 1.2). Retreat involves no effort to protect the land from the sea. Land and structures in highly vulnerable areas of the coastal zone are abandoned and inhabitants resettled elsewhere. The strategy of accommodation involves conservation of ecosystems in harmony with continued occupancy and use of vulnerable areas and adaptive management responses. Protection is generally focused on defence of vulnerable areas, population centres, economic activities, infrastructure and natural resources. It may involve hard and/or soft structural options. Selecting an adaptation option should be done on a project specific basis and ought to consider the circumstances of the threat, the vulnerability of the region, the tenure of the affected land and the capacity of the responsible authority (NCCOE, 2004). When planning new engineering activities, early allowance in design, development approvals and planning will significantly reduce the total cost to the community and provide sustainable and even enhanced environmental outcomes Study Tasks Port Fairy is located approximately 300 km west of Melbourne. The study area extends westward from Killarney Beach on the northern shoreline to the Moyne River entrance and eastward from the entrance on the southern shoreline to Cape Reamur. The area extends WRL Technical Report 2012/21 April 2013 FINAL 1
20 sufficiently inland from the coast to cover all extents that may be affected by coastal processes and extreme events between 2012 and Beaches along the Port Fairy coastline are distributed in four (4) main geographically distinct sections, as shown in Figure 1.1: Eastern Coastline (Reef Point to Cape Killarney); East Beach; Griffiths Island; and Western Coastline (Cape Reamur to South Beach). The present study was composed of the tasks summarised in Table 1.1. Table 1.1 Summary of Tasks Undertaken Task No. Brief Description 1 Coastal field survey of sandy beaches, existing seawalls and rocky foreshores. Inclusion of the survey output in the numerical and analytical modelling. Geotechnical survey to establish the stratigraphy of the East Beach barrier system. 2 Coastal hazards study including a description of the coastal processes and the nature and extent of risks from coastal hazards for the present day, 2050, 2080 and 2100 planning periods (incorporating sea level rise projections). 3a Definition of coastal risk hazard lines for present day conditions and the 2050, 2080 and 2100 planning periods (incorporating sea level rise projections). 3b Definition of coastal inundation levels incorporating sea level rise, wave setup and runup, and catchment flooding for a range of ARI events for the present day, 2050, 2080 and 2100 planning periods. 4 Dynamic coastal inundation modelling from coincidence of catchment and extreme sea events using Mike Flood. 5 Assessment of the opening of the Southwest Passage on sediment transport. 6 Assessment of the vulnerability of existing/public assets and infrastructure to sea level rise for the 2050, 2080 and 2100 planning periods (wave setup, wave run-up and catchment flooding included). 7 Recommendation/advice for coastal risk monitoring options to assess the coastal changes and the efficiency of existing coastal protection structures. WRL Technical Report 2012/21 April 2013 FINAL 2
21 1.3. Overview of Report Section 2 lists the relevant literature to this study as well providing a review of the datasets provided by MSC and DSE; Section 3 describes coastal site inspections undertaken along the Port Fairy study area as well as the results of the geotechnical survey performed on East Beach; Section 4 presents climate change considerations for this study, in accordance with the recommendations by the Victorian Coastal Hazard Guide (DSE, 2012); Section 5 describes and assesses the influence of relevant coastal processes with respect to coastal hazards; Section 6 presents the coastal erosion and recession hazard lines; Section 7 presents the coastal inundation zones and wave overtopping and runup; Section 8 presents the results of the dynamic coastal inundation numerical modelling study undertaken in the coastal area, assessing the combined effects of catchment and coastal inundation; Section 9 presents the results of an assessment of the likely impacts of opening the Southwest Passage on sediment transport; Section 10 provides a qualitative review of secondary coastal hazards within the Port Fairy study area; Section 11 lists the assets vulnerable to coastal risk; Section 12 provides coastal risk monitoring options of existing coastal protection structures to address the identified risks; and Section 13 describes the assumptions and limitations of the study. WRL Technical Report 2012/21 April 2013 FINAL 3
22 2. Data Compilation 2.1. Literature Review A substantial body of literature in the form of technical reports exists for the Port Fairy coastal area. However, most of the existing literature focused on the East Beach coastline section only, with a limited amount of work published for Griffiths Island. All relevant available literature addressing coastal processes, coastal protection works and coastal management within the Port Fairy area was reviewed. The most important literature in relation to the current studies is listed below Coastal Hazard Definition Studies A series of coastal hazard definition reports was prepared in relation to a proposed subdivision located north of the rock revetment on East Beach. The reports provided information on a specific section of East Beach (about 500 m long) with a focus on coastal erosion and coastal recession due to sediment loss and sea level rise. The reports reviewed for the current study are listed below: Carley (2008c), Expert Witness Statement by James Carley regarding Coastal Processes and Hazards for Proposed Subdivision at 228 Griffith Street, East Beach, Port Fairy, for Maddocks Lawyers acting for the Department of Sustainability and Environment (DSE); WBM (2006), East Beach Port Fairy Comparative Review of Coastal Process Studies, for DSE; CES (2006a), Port Fairy Shoreline Stability Study, for Marcson Pty Ltd; CES (2006b), Port Fairy Shoreline Stability Study Supplementary Information, for Marcson Pty Ltd; CES (2007), Port Fairy Shoreline Stability Study Supplementary Report, for Marcson Pty Ltd; and Environmental GeoSurveys (2005), Griffiths Street, Port Fairy Geomorphology & Coastal Processes in Relation to a Proposed Subdivision, for Paul Crowe Coastal Processes Studies and Coastline Management Studies The following reports were available: Aurecon (2010), East Beach Coastal Erosion Engineering and Feasibility Study Peer Review by Aurecon 2010, for DSE; BMT WBM (2007), Port Fairy East Beach Coastal Erosion Engineering & Feasibility Study, for MSC; and WBM Oceanics (1996), Coastal Study of East Beach Port Fairy, for MSC Coastal Protection Works Studies Hyder Consulting prepared the following report: Hyder (2011), Condition Assessment of Coastal Protection Assets, for DSE. WRL Technical Report 2012/21 April 2013 FINAL 4
23 This report was prepared for DSE, as part of the Future Coasts Program. It investigates and assesses the condition of the coastal protection assets along the Victorian coastline. In the Port Fairy area, the coastal protection assets investigated included the Moyne River training walls, the East Beach rock revetment and the timber groynes. The condition of each asset is briefly described and followed by a proposed remediation action. Reports previously referenced in Sections and also report, somewhat briefly, on the state of the coastal protection assets located on East Beach Additional Information Water Technology Pty Ltd assessed flooding within the Port Fairy township for both catchment and ocean (i.e. tidal) based flooding for the Glenelg Hopkins Catchment Management Authority (GHCMA). The reports assessed were: Water Technology (2008a), Port Fairy Regional Flood Study, for GHCMA; and Water Technology (2008b), Port Fairy Regional Flood Study - Addendum, for GHCMA. As part of the Future Coasts Program, CSIRO prepared a report for DSE providing data and information about the potential inundation extents of extreme sea levels under a range of sea level rise (SLR) scenarios. The report reference is: McInness (2009), The Effect of Climate Change on Extreme Sea Levels along Victoria s Coast, for DSE. WRL Technical Report 2012/21 April 2013 FINAL 5
24 2.2. Aerial Photography and Photogrammetry Data Aerial photography was provided for this study by the Department of Sustainability and Environment (DSE). Photogrammetry data for a 600 m long section of East Beach was provided by DSE and QASCO via Planning Panels Victoria. The analysis of aerial photography allowed the assessment of the movement of the edge of dune vegetation. The analysis of the photogrammetry data, where available, including profile plotting and volumetric analysis, allowed the determination of storm erosion demand, long term shoreline recession rates and the validation of these as assessed in previous reports. The data analysed is summarised for each beach in the study area in Table 2.1. Table 2.1 Summary of Aerial Photography and Photogrammetric Data (source DSE) Location (Figure 1.1) Aerial Photography (years) (1) Photogrammetry Cape Reamur None None Unnamed 7 (VIC 521) None None Unnamed 6 (VIC 520) None None Unnamed 5 (VIC 519) Partially covered None Unnamed 4 (VIC 518) 2003; 2010 None Unnamed 3 (VIC 517) 1948; 1970; 1986; 2003; 2010 None Unnamed 2 (VIC 516) 1948; 1970; 1986; 2003; 2010 None Pea Soup + Ocean Drive 1948; 1970; 1986; 2003; 2010 None South Beach 1948; 1970; 1986; 2003; 2010 None Griffiths Island 1948; 1970; 1986; 2003; 2010 None South Mole 1948; 1970; 1986; 2003; 2010 None East Beach 1948; 1970; 1986; 2003; ; 1969; 1977; 2002; 2007 Reef Point 2003; 2010 None Killarney Beach Partially covered None Notes: (1) Low resolution Google Earth images are available for all sites. This table refers specifically to higher resolution aerial photographs. Additionally, analysis of long term recession around East Beach was performed using historical navigation maps from 1854 (Nautical chart established by John Barrow in 1854, provided by MSC) and 1870 (Nautical chart established by Stanley in 1870, provided by MSC) in order to track the evolution of the shoreline over a longer time period. WRL Technical Report 2012/21 April 2013 FINAL 6
25 2.3. Bathymetric and Topographic Data Bathymetric and topographic sources are listed in Table 2.2. Note that Australian Height Datum (AHD) is approximately Mean Sea Level (MSL) for the study area. Table 2.2 Summary of Bathymetric and Topographic Data Sources Dataset Data Source Grid Reference System Datum Offshore Contours Geoscience Australia 9 arc second Bathy and Topo Grid ausbath_09_v4 GCS_WGS_1984 AHD DSE LIDAR 2007 Department of Sustainability and MGA Zone54 (topography) Environment (DSE) GDA94 AHD DSE LIDAR Department of Sustainability and MGA Zone (bathymetry) Environment (DSE) GDA94 AHD East Beach GPS_RTK MGA Zone54 Moyne Shire Council (MSC) Survey (2011) GDA94 AHD The East Beach Survey data from 2011 was made available for the study. This survey focused on East Beach and mainly reported the rock revetment toe and crest levels along East Beach, as well as dune toe levels every 70 m. However, limited information regarding the dune crest level was available in the final survey data. This additional information was used to verify the calculated storm demand values used for this study as well as the underlying erosion rates. It was also used to infer a present day front dune profile at multiple transect locations around the potential dune breaching study area located at the northern end of the rock revetment (refer to Appendix B). Section 2 Key Findings Most of the existing literature addressing coastal processes, coastal protection works and coastal management within the Port Fairy area focused on the East Beach coastline section only, with a limited amount of work published for Griffiths Island. Aerial photography was provided for this study by the Department of Sustainability and Environment (DSE) covering a period from 1948 to Photogrammetry data for a 600 m long section of East Beach was provided by DSE and QASCO via Planning Panels Victoria. The available bathymetric and topographic data consisted mainly in LIDAR data from Additional survey data was provided in the form of a GPS-RTK survey of East Beach. This survey reported the rock revetment toe and crest levels along East Beach, as well as dune toe levels. WRL Technical Report 2012/21 April 2013 FINAL 7
26 3. Field Survey 3.1. Overview Site inspections took place during the week of 2 5 April 2012 and were performed by Dr F Flocard and Mr J Carley of WRL in the company of Dr R Mibus (MSC). The site inspections focused on the visual assessment of the dune condition and condition of the coastal protection works. Coastal protection works were inspected with regards to their location, extent and engineering characterisation i.e. crest level, construction, present condition etc... The condition of coastal protection works not maintained by MSC or DSE was assessed at a cursory level only. The study area specifically includes the sub-sections of coastline itemised in Table 3.1 (with the Victorian sub-section class ID, coastline type, length and the general orientation as per Short, 2007). The area inspected comprises four geographical zones (refer to Figure 1.1): Western Coastline (South Beach to Cape Reamur); Griffiths Island; East Beach; and Eastern Coastline (Cape Killarney to Reef Point). Table 3.1 Coastline Sub-sections Considered for the Study (Short, 2007) Name Class ID Beach Type Length (m) Facing Direction Cape Reamur VIC 522 reflective 600 SE to SW Unnamed 7 (VIC 521) VIC 521 low tide terrace 200 SE Unnamed 6 (VIC 520) VIC 520 low tide terrace 600 S to SW Unnamed 5 (VIC 519) VIC 519 reflective / low tide terrace 600 SW Unnamed 4 (VIC 518) VIC 518 reflective 200 S Unnamed 3 (VIC 517) VIC 517 reflective 1000 SW Unnamed 2 (VIC 516) VIC 516 reflective 800 SW Pea Soup + Ocean Drive VIC 515 low tide terrace SE South Beach VIC 514 low tide terrace 500 SW Griffiths Island VIC 513 reflective 100 SE South Mole VIC 512 low tide terrace 200 NE East Beach VIC 511 low tide terrace / transverse bar and rip 5800 S to E Reef Point VIC 510 low tide terrace / transverse bar and rip 1700 SE Killarney Beach VIC 509 reflective / low tide terrace 1000 SE to SW Sediment samples were collected from the intertidal zone at Killarney Beach, East Beach (three locations), South Mole, Griffiths Island Beach, Southwest Passage, South Beach, Pea Soup, Unnamed Beach 2 (VIC 516) and Cape Reamur (two locations). Photographs of each dried sample are shown in Figure 3.1. The dried sediment samples were tested according to AS 1289 (2009) to determine the particle size distributions by mechanical sieving. The particle size distribution for each sample is shown in Figure 3.2. The median particle size (d 50 ) for the sand fraction of sediment (60 μm to 2 mm) varies between 180 and 370 μm as shown in Table 3.2. WRL Technical Report 2012/21 April 2013 FINAL 8
27 Table 3.2 Median Sand Fraction Particle Sizes (60 μm to 2 mm) Name d 50 (μm) d 50 (mm) Cape Reamur (West) Cape Reamur (East) Unnamed 2 (VIC 516) Pea Soup South Beach Southwest Passage (north of causeway) Griffiths Island Beach South Mole East Beach South East Beach Centre East Beach North Killarney Beach Generally the sediment from each of the beaches is characterised as fine to medium grained sand. However, it also important to note exceptions to this within the Port Fairy study area. The sediment from South Mole (i.e. Lighthouse Beach) has a relatively high fraction of fine sand (60 μm to 200 μm). Moderate shell content amounts were visible in the samples from Cape Reamur, East Beach North. Sediment from Pea Soup has a relatively higher fraction of shell content (0.5 to 1 mm) within the sample Environmental Conditions during Inspections Inspections of the coastline sub-sections were undertaken during the week of 2 7 April The predicted tides during the site inspections for Portland, with times adjusted for Port Fairy, are presented in Table 3.3 (BoM). Elevations are provided relative to tide datum (Chart Datum) and Australian Height Datum (AHD). Table 3.3 Predicted Tides during Site Inspections Port Fairy (source BoM) Date and Time Tidal Peak Elevation Elevation Type (AEST) (m CD) (m AHD) 02/04/ :56 Low /04/ :38 High /04/ :29 Low /04/ :10 High /04/ :39 Low /04/ :48 High /04/ :46 Low /04/ :23 High /04/ :40 Low /04/ :02 High /04/ :24 Low /04/ :20 High A review of the BoM data from the Cape de Couedic wave buoy indicates that the offshore significant wave height varied between 2.0 to 6.1 m during inspections, with a typical peak spectral wave period between 12.0 and 16.5 s. A review of the BoM data from the Cape Sorell wave buoy indicates that the offshore significant wave height varied between 2.7 to 4.9 m WRL Technical Report 2012/21 April 2013 FINAL 9
28 during inspections, with a typical peak spectral wave period between 12.0 and 16.0 s. These wave heights were mostly above the annual average value of 2.7 m for Cape de Couedic, and 3.0 m for Cape Sorell (Hemer et al., 2008). The winds measured during the inspections at Port Fairy are shown in Table 3.4. Except for the first day, winds were mostly light in the morning with light to moderate southerly sea breezes in the afternoons. Table 3.4 Recorded Winds during Site Inspections Port Fairy (source BoM) Date and Time Av Speed Drn (AEST) (km/hour) (TN) 02/04/ :00 13 NNE 02/04/ :00 20 NNW 03/04/ :00 7 NW 03/04/ :00 9 SW 04/04/ :00 9 N 04/04/ :00 9 S 05/04/ :00 11 NNE 05/04/ :00 9 S 3.3. Western Coastline West of Port Fairy, the coast runs due west for 8 km to Cape Reamur. Low basalt points and offshore reefs dominate the shore. In amongst the rocks are a number of embayments, containing seven crenulated, sandy beaches. All these beaches are dominated by the rocks and reefs and are backed by marram covered foredunes. At low tide, the reefs stop most waves from reaching the shore. A shallow lagoon lies between the beaches and the outer reefs, with patches of rocks and reefs in the lagoons. Urban development, consisting of detached houses, in the lee of the beaches stops west of Ocean Drive Beach. The Princes Highway parallels the coast 1 km inland. However, most of the land between the highway and the coast is private property and access is limited to walking along the shore Cape Reamur Cape Reamur beach is a narrow 600 m long high tide beach facing south-east to south-west (Figure 3.3). Access to the beach is very limited and only possible through private property. The beach ends in the west at Cape Reamur, a low, basalt point capped by un-vegetated, mobile dunes moving in from the west. The beach is protected from wave action by an outer reef and is fronted by basalt boulders. On the day of the inspection, a sand veneer was observed in between the boulders, indicating onshore sand transport at higher water levels. Cape Reamur is the only beach in the study area where the presence of limestone was observed on the beach face. The beach is relatively narrow and is backed by a highly vegetated dune, extending up to approximately 10 m AHD. A low scarp in the dune face was visible at the western end of the beach. At the time of inspection, the tide was low and the beach was fronted by a lagoon with almost no wave action. WRL Technical Report 2012/21 April 2013 FINAL 10
29 The eastern part of the beach appears to be narrower with more visible basalt boulders. Much of the dune system at Cape Reamur is intact and contains significant remnant coastal vegetation that provides habitat for numerous native bird and mammal species (MSC, 2001) Unnamed 7 (VIC 521) Unnamed beach 7, identified as VIC 521 (Short, 2007) is a very protected, 200 m long crenulate sandy beach deep inside an extensive shallow reef system (Figure 3.4), facing south-east to south. Access to the beach is limited and possible only through private property. At the time of the visit, the beach was fronted by a lagoon and almost completely sheltered from waves by the multiple outer reefs, as opposed to the exposed rocky shoreline west of the beach. The beach is backed by a wide dune with a typical elevation of 10 to 12 m AHD, which is moderately vegetated (marram). A 2 m high scarp, lightly covered with vegetation, is visible along most of the foredune face, becoming progressively higher towards the eastern end of the beach due to a higher exposure to southern swell events. The only development in the lee of the beach are two free standing buildings (private property) with typical ground elevations of 10 m AHD Unnamed 6 (VIC 520) Unnamed beach 6, identified as VIC 520 (Short, 2007) is a curving, crenulate 600 m long sandy beach facing south to south-west (Figure 3.5). The western end of the beach is very protected by a rock platform from wave attack. Parts of this western rock platform extend over the water level in the lagoon and are covered with light vegetation. The western end of the beach is backed by a low-lying foredune (3 m AHD), with a significant amount of windblown sand at the toe of the dune and few signs of erosion. There are several breaks in the dune to allow for private pedestrian beach access. At the time of the visit, almost no wave action was observable in the western part of the lagoon. When progressing towards the eastern end of the beach, the dune height increases progressively to a typical elevation of 7 to 9 m AHD. From the central part of the beach to its eastern end, a 2 to 3 metre high clear scarp was observed with remnant of vegetation still present indicating a recent erosion event. On the day of the inspection, broken waves were observed to reach the eastern part of the beach through the lagoon. The eastern end of the beach consists of a low, basalt point capped by light vegetation on a veneer of sand. The sole development in the lee of the eastern end of VIC 520 is an aquaculture facility, consisting of several free standing buildings, with typical ground elevations of 4.5 m AHD Unnamed 5 (VIC 519) Unnamed beach 5, identified as VIC 519 (Short, 2007) is 600 m long, relatively straight beach facing south-east (Figure 3.6). Access to the beach is limited and only possible through private property or walking along the shoreline. A 50 m wide partially trained creek entrance exists at the western end of the beach, in which an aquaculture facility (Southern Ocean Mariculture Pty Ltd), releases brine water through a culvert into the creek. Despite the presence of an outer reef, small to moderate wave action was WRL Technical Report 2012/21 April 2013 FINAL 11
30 observed at the time of the visit (high tide), with wave runup occasionally reaching the tow of the foredune. The western end of the beach is backed by a wide dune with a typical elevation of 5 to 7 m AHD. A 2 to 3 metre high scarp was observed along most of the beach length. The dune height tends to diminish locally towards the eastern end of the beach (3 m AHD). A series of low-lying basalt points are found at the eastern end of the beach, partially covered by a veneer of sand. An informal 4WD beach access through the dune was observed at the eastern end of the beach Unnamed 4 (VIC 518) Unnamed beach 4, identified as VIC 518 (Short, 2007) is a 100 m long pocket beach facing south (Figure 3.7). Access to the beach is limited and possible through private property or walking along the shoreline. This beach is very well protected from wave attack being in the lee of rock platform, with almost no waves reaching the shoreline at the time of the inspection. Several small fishing boats were found beached on the lightly vegetated foredune, confirming the very sheltered aspect of the beach. The beach is backed by a lightly vegetated 50 m wide dune with a typical elevation of 10 to 12 m AHD. There is no development in the lee of the dune. Basalt boulders can be seen protruding from the sand at both the eastern and western ends of the beach, indicating the possibility of a rock shelf located at a shallow depth below the beach sand. Analysis of aerial photography revealed the former existence of an informal 4WD access cutting through the dune which was not found on the day of the inspection Unnamed 3 (VIC 517) Unnamed beach 3, identified as VIC 517 (Short, 2007) is 1000 m long, relatively straight beach facing south-east to south, protruding slightly from the run of the coastline (Figure 3.8). The western half of the beach is very well protected from wave attack by an outer reef, consisting of basalt, running parallel to the shoreline. At the time of the visit (high tide), the reef could be seen piercing through the water and created a shallow lagoon. The western half of the beach is relatively narrow and backed by a dune with variable elevation. The dune is at its highest at the western end of the beach (8 m AHD) and its elevation gently decreases to about 2 to 3 m AHD when progressing eastwards. A clear scarp the length of the foredune face was observed. The presence of vegetation on the scarp and at the toe of the foredune was observed, indicating that the erosion was not the result of a recent storm event. The eastern half of the beach, facing south-east, is more exposed to wave action due to the absence of a similar high rock platform. The eastern part of the beach is backed by a dune ranging in elevation between 3 and 5 m AHD. Again, a clear and steep scarp was observed along the foredune face with windblown sand stacked at the toe and little presence of vegetation. Wave action was observed to be stronger on the eastern half of the beach, with occasional wave runup reaching the toe of the dune. There is no development in the lee of the dune. WRL Technical Report 2012/21 April 2013 FINAL 12
31 Unnamed 2 (VIC 516) Unnamed beach 2, identified as VIC 516 (Short, 2007) comprises three arching crenulate sandy beaches, over approximately 800 m, facing south-east to south (Figure 3.9). The eastern end of the beach is backed by a relatively high dune, with a crest elevation of approximately 10 to 12 m AHD, which shows a high degree of erosion. some of the erosion appears to be relatively recent, with a clear scarp about 4 to 5 m high. The centre part of the beach appears to be better sheltered from wave attack, with the presence of several basalt points dominating the low tide area. The centre part of the beach is backed by a relatively gradual vegetated dune, with private development in its lee at a typical ground elevation of 10 m AHD. There are several breaks in the dune to allow for private pedestrian beach access. Erosion of the dune backing the eastern beach of VIC 516 is more apparent, with a 1 to 2 m high scarp running along most of the unprotected foredune face. The site inspection revealed the presence of two rock revetments at the western and eastern ends of the eastern beach. No information was available on the design of these walls and construction details are unavailable. These two rock revetments are not maintained by the MSC or DSE, and will not be considered in the erosion hazard section of this study. The western rock revetment is in very poor condition, it is partially buried with a typical crest level of 3 m AHD and is approximately 60 m long. WRL estimated that the primary armour consists of basalt with a typical size of 1.0 m (2.7 tonnes) and appears to have been built without any filter layers or toe protection. This revetment s condition can be considered sub-standard with damage failure occurring in places. The eastern end rock revetment is also in poor condition, it is partially buried with a typical crest level of 3 m AHD and is approximately 80 m long. WRL estimated that the primary armour consists of basalt with a typical size of 0.5 to 1.0 m (0.5 to 2.7 tonnes) and appears to have been built without any filter layers or toe protection. The average slope of this revetment is about 1V:1.5H. This revetment s condition can be considered sub-standard with damage failure occurring in places. The ground levels for most properties within the eastern third of VIC 516 are above 8 m AHD. There are several breaks in the dune to allow for private pedestrian beach access, some of them crossing the rock revetments Ocean Drive (VIC 515) Ocean Drive, classified as the westernmost beach of VIC 515 (Short, 2007) is a 320 m long, low gradient reflective beach, facing south-east to south. It is fronted by continuous basalt reefs lying 100 to 200 m offshore. The beach consists of a relatively thin volume of sand perched on a basalt substrate estimated at +0 m AHD (Figure 3.10). At the time of the inspection, which coincided with low tide, the beach was completely protected from wave attack by the reef. The presence of a thick mattress of dry seaweed in some locations indicated, however, that waves did reach the beach at high tide or high elevated water levels. The beach is backed by a low-lying gently vegetated foredune on basalt rock at a typical crest elevation 3.5 m AHD, with a small scarp in some locations. Two concrete stormwater outlets are located at the western and the eastern ends of the beach and were in good condition and un-obstructed at the time of the visit. There are four breaks in the dune to allow for public pedestrian beach access and a car park also exists at the eastern end of the beach. The beach is backed by residential development (landward of Ocean Drive) with typical ground elevations of 3 to 4 m AHD. From discussions WRL Technical Report 2012/21 April 2013 FINAL 13
32 with members of the MSC and photographic records, overtopping of the low-lying dune and of Ocean Drive has occurred several times in the past during heavy storms Powling Street A pedestrian access to the shore exists at the intersection of Powling Street and Ocean Drive. This access does not lead to a beach per-se, but allows access to the western end of Pea Soup Beach and a coastal pedestrian track. The small track crosses low-lying well vegetated dune, consisting of a half a metre deep sand veneer perched on a basalt substrate. A large stormwater culvert outlet (800 mm diameter) is located just off the track (Figure 3.11). At the time of inspection, the outlet appeared to be in good condition, despite being slightly obstructed by seaweed. The invert is located at approximately 0.5m AHD and discharges into a natural creek bed on the basalt platform Pea Soup (VIC 515) Pea Soup, classified as the easternmost beach of VIC 515 (Short, 2007) is a 400 m long, low gradient beach, facing south to south-west. It is fronted by continuous basalt reefs lying 100 to 200 m offshore The sandy part of the beach is relatively wide (20 to 40 m) and is fronted by several basalt points (Figure 3.12 and Figure 3.13). At the time of the inspection, which coincided with low tide, the beach was completely protected from wave attack by the reef. There was almost no wave action in the lagoon fronting the beach. The eastern part of the beach is backed by a gently sloped dune with a crest elevation of 3 to 4 m AHD at the eastern end, which progressively rises and steepens to reach 9 m AHD high in the centre of the beach. The central part of the beach is backed by a highly vegetated steep dune with the presence of windblown sand at the toe. A relatively small scarp (less than one metre high) was observed in some locations. Pedestrian access to the beach is made possible by a wooden staircase in good condition at this location. A rock revetment is present over a distance of 80 m from the central part of the beach towards the east, fronting a dune with a typical crest elevation of 11 m AHD. According to DSE, the rock revetment is privately maintained and no information is available on its construction. This coastal asset appears to have been constructed in the 1980s (first present on the 1986 aerial photography). Being a privately managed asset, this rock revetment will not be considered in the erosion hazard section of this study. WRL estimates that the primary armour is basalt with a typical size of 0.5 to 1 m (approximately 0.5 to 2.7 tonnes). Determination of the crest elevation was made difficult due to vegetation, it appears to be at a minimum of 4 m AHD in the west, to over 6 m AHD in the centre. The average slope of the seawall had been estimated to be between 1V:1H to 1V:1.5H. It was not possible to determine the presence of filter layers, but larger basalt rocks (1.2 m size) at the toe seem to act as a rudimentary toe protection. The overall condition of the rock revetment is fair and it appears to be functioning well but previous damage has been reported. The unprotected eastern part of the beach is backed by highly eroded dune with a typical crest elevation between 5 and 7 m AHD. The dune appears to be particularly eroded directly east of WRL Technical Report 2012/21 April 2013 FINAL 14
33 the rock revetment, indicating a possible seawall end effect. A wooden ramp in good condition provides public pedestrian access at this end of the beach. The eastern end of the tip is flanked by a low basalt point. A car park is located in the lee of the eastern dune, with typical ground elevation of 5 m AHD. On the day of the inspection, only very limited amounts of windblown sand were visible in the car park South Beach (VIC 514) South Beach, identified as VIC 514 (Short, 2007) is a 600 m long, low gradient beach, facing south to south-west (Figure 3.14). It is fronted by continuous basalt reefs lying 100 to 200 m offshore. The beach was visited at both low and high tides and very small waves were noted to reach the eastern part of the beach on both occasions. The eastern part of the beach is flanked by two low-lying basalt points. The beach there is backed by a well vegetated dune with a typical crest elevation of 7 m AHD. A clear scarp of one to two metres high was observed at the toe of the dune along this eastern section, with the occasional presence of buried basalt boulders. This section of the beach can be accessed by a wooden staircase in good condition. A car park and public amenities are located directly in the lee of the dune at a ground elevation of 7 m AHD. From its centre to the western end, the beach is relatively wide (40 to 50 m) and is backed by a wide dune system, with typical crest elevations ranging from 9 to 12 m AHD. Some clear erosion in the dune was observed along the central section of the beach, with the dune scarp reaching a height of over 3 m. When progressing west towards the rocky headlands ending the beach, the dune appears to be less eroded and well vegetated. The wide dune system (between 50 and 100 m) is absent of any development and ends in the north on Ocean Drive. There are several breaks in the dune to allow for public pedestrian beach access Griffiths Island Griffiths Island is located immediately south of the mouth of the Moyne River entrance and is separated from the western section of the coastline by the Southwest Passage. Griffiths Island has been mapped since the 1920s as a single island but is formed from what were originally (circa 1950) Goat, Griffiths and Rabbit Islands. These three islands were initially separated but have been progressively joined together through the natural accumulation and deliberate placement of sand since the construction of the Moyne River training walls. The island is only accessible by a pedestrian footbridge. Griffiths Island has been recognised as a Coastal Reserve due to the presence of bird colonies as well as historical and archaeological sites (MSC, 2001) and is registered on the Victorian Heritage Register (VHR H1659) The Southwest Passage, Puddeny Grounds Griffiths Island was attached to the mainland with the construction of the Moyne River harbour moles and a second breakwater, to prevent water flowing around the back of the island and into the harbour (Figure 3.15). This channel is commonly referred to as the Southwest Passage, with typical bed levels ranging from 0 to -2 m AHD on the ocean side of the breakwater. At the time of the visit, which coincided with low tide; waves were almost completely stopped by the rock WRL Technical Report 2012/21 April 2013 FINAL 15
34 shelf located at the entrance of the passage and barely reached the breakwater but have been observed to propagate further at higher tides. This breakwater today provides pedestrian access from a car park to the island and is reported to have been constructed in its present configuration in It has an overall length of 40 m, with a crest elevation of +2 m AHD. WRL estimates that the primary armour is basalt with a typical size of 0.5 to 1.0 m (approximately 0.1 to 2.7 tonnes). The average slope of the breakwater had been estimated to be between 1V:2H to 1V:3H. It was not possible to determine the presence of filter layers. The overall condition of the rock revetment and of the concrete cap located on its crest is good and it appears to be functioning well. It has been observed that leaching of sand from the ocean side into the river takes place through the breakwater. This results in the presence of a substantial volume of sand in the river immediately north of the breakwater, as the bottom depth is estimated today at 0 m AHD, whereas this location was reported on historical nautical maps to a be a deep rock trench (Dr Mibus, pers. comm.; WBM, 1996) before closure of the passage. Dredging was reported to previously take place in this location until the late 1990s after which it was only performed in the main channel of the Moyne River. The sand was reported to be placed intermittently in the Puddeny Grounds until the early 1990s, after which it has been solely placed on the southern end of East Beach. The area enclosed between the training walls and the west coast of Griffiths Island, as shown on Figure 3.16, is known as Puddeny Grounds. It mainly consists of a large flat and sandy area, which gets flooded at high tides and during large wave events. A former quarry can be observed in the south-west corner of the Puddeny Grounds, in the location that was previously referred to as Goat Island. Part of the sand dredged from the river side of the Southwest Passage was placed there up until the early 1990s. The training walls on the north side of Puddeny Grounds consist of grouted basalt. They were in relatively good condition at the time of the visit, with no significant sign of damage except for a 10 m long section close to the island shore where significant erosion of the wall was observed. If no action is taken this damage could become a hazard to pedestrian safety with the undermining of the concrete cap which acts as a public walkway. South of the breakwater, the training walls on the Griffiths Island side have been fitted with a concrete cap, made of two metre long concrete slabs. The overall condition of the basalt part of the wall is good; however, the concrete capping is severely damaged, with multiple concrete slabs broken or missing. This could potentially represent a safety hazard as the wall is used by pedestrians to access the south of Griffiths Island. A second pedestrian access to Griffiths Island crosses Puddeny Grounds in the lee of the training walls. This coastal asset consists also of a basalt rock revetment fitted with a concrete cap on its crest. The typical rock size on the revetment is estimated to be between 0.5 and 1 m (approximately 0.5 to 2.7 tonnes) and its crest has a typical elevation of 0.5 m AHD. The footbridge is equipped in several locations with box culverts to help water drainage from the northern part of Puddeny Grounds. The overall condition of this asset is fair, with some rock displaced in multiple locations as well as localised undermining of the concrete capping. However, this coastal asset appears to be functioning well due to the very mild wave conditions it is subjected to most of the time. WRL Technical Report 2012/21 April 2013 FINAL 16
35 Griffiths Island Beach Griffiths Island Beach, identified as VIC 513 (Short, 2007), is a 400 m long, low gradient protruding beach, facing southeast. It is fronted by continuous basalt reefs lying 100 to 200 m offshore. The beach lies on the south-east side of Griffiths Island. The remnants of two old rock groynes, perpendicular to the beach alignment can be found in the northern section of the beach, as well as an old basalt rock quarry (Figure 3.17). At the time of the inspection, which coincided with low tide, the beach was well protected from wave action, as most waves were breaking over the reef and the beach was fronted by a calm lagoon. From its northern end to the centre (past the second rock groyne), the beach is relatively wide (40 to 50 m) and is backed by a wide dune system, with typical crest elevations ranging from 12 to 15 m AHD. The dune along this section is well vegetated with the dune scarp reaching a height of about 1 to 2 m. When progressing south towards the rocky headlands ending the beach, the dune appears to be more eroded and less vegetated. The beach appears to be narrower in the southern section, at about 20 m width. There are several breaks in the dune to allow for public pedestrian beach access. The rocky headlands located at the southern end of the beach are crossed by a concrete pipe, which is the property of Wannon Water, and leads to an outfall about 100 m offshore from Griffiths Island South Mole Beach (i.e. Lighthouse Beach) South Mole Beach, identified as VIC 512 (Short, 2007) and also known as Lighthouse Beach, is a 200 m long, low gradient beach, facing north-east. The beach lies on the north side of Griffiths Island and has formed during the past century, since the construction around 1870 of the training walls at the mouth of the Moyne River at the northern end of the beach (Figure 3.18). At the time of the inspection, which coincided with low tide, the beach was well protected from wave action by the island, with near shore waves averaging about 0.2 m or less. South Mole beach is backed by a low-lying and well vegetated dune, with a typical elevation of 2 m AHD. No breaks were observed in the dune system at the back of the beach as the area in the lee is a nature reserve due to bird nesting and pedestrian access is highly restricted. Limited erosion in the dune was observed along the central section of the beach, with the dune scarp reaching a height of about 3 m. Some accretion of wind-blown sand at the toe of the dune was also noted on the eastern part of the beach, due to south-east winds. The Moyne River training walls extend about 200 m offshore from the beach and are made of basalt with additional concrete grouting. The wall on South Mole Beach was in relatively good condition at the time of the visit, with no significant signs of damage except for a 20 m long section near the MSL mark, where large basalt blocks had been dislodged from their original position. If no action is taken, this damage could become a hazard to pedestrian safety as the walls are capped by a 2 m wide concrete cap, which acts as a public causeway. A few basalt rocks are exposed on the beach in the vicinity of the training walls and are the remnant of an historic buried breakwater. It has been also reported by the Port Authority (Max Dumnesy, pers. comm.) that leaching of sand from South Mole Beach into the river takes place underneath and through the training walls, resulting in the presence of localised sand fans at the bottom of the river bed. Sand WRL Technical Report 2012/21 April 2013 FINAL 17
36 dredging regularly takes place in this location to maintain navigable depth within the river. The sand is reported to have been placed on the southern end of East Beach since the mid-1990s East Beach East Beach is 5.8 km long, extending in a broad arc from Reef Point in the east, where it faces south, to the North Mole or harbour entrance wall in the south, where it faces east. In the north-east section, the beach is backed by a dune which reaches typical elevations of 5 to 10 m AHD. Given the significant length of the beach and the diversity of the environment encountered along the beach foreshore and development in its lee, it was decided to break up the site visit report into nine sub-sections, starting from the southern of the beach and progressing towards its north-eastern end, in the direction of Reef Point Moyne River Training Walls to Apex Park The southern end of East Beach is flanked by the Moyne River training walls (moles) (Figure 3.19). These walls were initially built in the 1870s and are made of basalt with localised concrete facing. The training wall on the East Beach side is typically 3 m wide at its crest with an approximate height of 1.6 m above MSL. The training walls appear in fair condition overall, with minor localised damage where rocks have been dislodged and facing concrete is cracked or spalled. Sand dredging of the Moyne River is performed by the Port Authority using a dredge barge. Dredge pipes are visible from the wall and can be seen crossing the training walls in two locations, in order to allow dredged sand to be deposited near the southern end of East Beach. An old basalt breakwater can be seen where the eastern Moyne River training wall joins with East Beach. This old breakwater was built in the 1910s to protect Battery Hill from erosion but was outflanked over the course of time. This breakwater is in very poor condition and runs parallel to East Beach for approximately 240 m (Figure 3.19). A 150 m long section remains accessible and extends above the high tide water level, while the last 80 m has been severely eroded and is mainly below mean sea level. Despite the poor condition of the breakwater and water seeping through the rocks, the southern end of East Beach appears well nourished in terms of sand, with signs of recent erosion. The site inspection revealed the presence of rocks buried into the sand scarp located at the lee of the beach, the purpose of which would have likely been to act as erosion protection. The foreshore in the lee of the old breakwater appears to be well vegetated, with the presence of marram grass as well as relatively large bushes and trees very close to the high water mark, indicating limited beach erosion over this 200 m long section. A rudimentary concrete boat ramp access is located towards the southern end of the beach and is accessible from Battery Lane (Figure 3.20). A small car park is located in the lee of the beach access with an average elevation of 3.5 m AHD. The East Beach rock revetment can be observed to begin about 50 m south of the boat ramp access. This structure has been constructed progressively over time, starting in the 1950s, predominantly by the placement of rock directly on the dune face at the back of the beach. The visible part of the construction appears to have been undertaken without considering contemporary coastal engineering design principles, such as the use of filter layers, secondary armour and toe protection. While the overall dimensions of the rock revetment vary greatly across East Beach, the structure mainly consists of one or two rows of rocks placed on the WRL Technical Report 2012/21 April 2013 FINAL 18
37 beach, with typical rock sizes ranging from 0.3 to 0.7 m (approximately 0.1 to 1.0 tonnes), resulting in typical crest elevation levels ranging from 0.5 to 1.5 m AHD. While the southern end of the beach is typically subjected to a milder wave climate than the north-east part, slumping, as well as rock displacement can be observed in multiple locations, indicating that the rock size and/or design may not be suitable. It was also noted that the rock revetment was cut in multiple locations by private beach access from the properties located on Griffiths Street, which could increase the risk for localised breaching points during a coastal storm. The ground levels for most properties along this southern section of East Beach are above 4.5 m AHD. The crest height of the structure is not sufficient to prevent overtopping over the majority of this section as erosion of the lee and the vegetation shows overtopping to be frequent Apex Park to Lydia Place The exposed extent of the rock revetment can be observed to be discontinuous over a length of approximately 40 m in the vicinity of the public beach access from Apex Park (Roger Place). The beach access consists of a wooden ramp/stairs from the car park and public amenities located directly in the lee of the dune at a ground elevation of 7 m AHD (Figure 3.21). While the wooden ramp appears to be in fair condition overall, localised erosion is apparent over the lower section and may result in an increased risk of undermining in the future. About 20 m west from the ramp, the dune system can be observed to have significantly eroded, with a steep scarp about 10 m wide extending deeper into backshore, in comparison to the surroundings. This localised erosion could potentially cause a risk of undermining to the stability of the car park located in the lee of the dune. Progressing north from the Apex Park access, the rock revetment was observed to be in poor condition. It was observed to be outflanked in multiple locations with the dune scarp as far as 2 m behind the rocks. Rock displacement was observed in multiple locations as well, indicating that the rock size and/or design may not be suitable, and that the rock revetment may no longer be able to provide protection from wave action. On this beach section, the rock revetment generally consists of one or two layers of rocks, with typical crest elevation levels ranging from 0.5 to 1.5 m AHD. The ground levels for most properties along this section of East Beach are above 6.0 m AHD. The remnants of four wooden groynes, initially build in the 1970s can be observed at the southern end on the beach. The groynes are approximately 30 m in length and spaced approximately 90 m apart. All four structures were found to be heavily damaged from weathering rot and fastener corrosion, with numerous timber piles missing. Multiple openings have been purposely formed in all four groynes to facilitate public access along the beach, but possibly further limiting their ongoing effectiveness to trap longshore sand. Due to their overall poor condition, these structures present a public safety risk. The size and the condition of the rock revetment can be observed to change past the northern groyne. The structure appears to be composed of multiple layers of rock, with size ranging from 0.5 to 1 m in size (approximately 0.5 to 2.7 tonnes). The rock revetment appears to be functioning well and subjected to limited overtopping, as grass can be observed on its crest. The typical crest elevation ranges from 4 to 6 m AHD. Significantly larger rocks, with an average size of about 1 m (2.7 tonnes) can be observed to have been placed in front of the rock revetment, most probably to offer increased protection from wave action at high water levels. WRL was informed by MSC that these larger rocks may have been installed in the 1990s, whereas the original rock revetment is reported to have been built as early as WRL Technical Report 2012/21 April 2013 FINAL 19
38 Lydia Place to Richie Street No significant change of the rock revetment was observed between Lydia Place and the boat ramp of Surf Live Saving Club (SLSC). The typical crest elevation remained within a 4 to 6 m AHD range, with limited evidence of regular overtopping of the crest apparent. The ground levels for most properties along this section of East Beach are above 6.0 m AHD. Localised slumping of the structure was observed in one location over a length of 3 to 5 m. Despite the fact that the structure cannot be considered to comply with contemporary coastal engineering design principles, the rock revetment appears to be functioning well. Port Fairy Surf Life Saving Club is located at the end of Hughes Avenue (see Figure 3.22). The building is located at a typical ground elevation of 4 m AHD and is fronted by a concrete boat ramp which extends down to the beach. The ramp has batter slopes on both sides, armoured with basalt rock. The ramp is in good condition, without any noticeable cracks in its surface. The rock protection on both sides seems to have been recently overtopped due to wave run up, as some rock seems to have been displaced and the grass locally eroded. A concrete ramp providing pedestrian access to the beach is located 10 m north of the boat ramp and crosses the rock revetment over a 20 m width. Its exposed side is protected by basalt with concrete facing. The concrete ramp and the rock protection both appear to be in good condition overall, with minor localised damaged where facing concrete is cracked and spalled. The rock revetment fronts a 200 m long sloped grass area, with a concrete pathway located on its crest, at a typical elevation of 3.5 to 4 m AHD. Despite the fact that the structure cannot be considered to comply with contemporary coastal engineering design principles, the rock revetment appears to be functioning well. The grass area fronts a car park and a public amenities building, all located at a typical ground elevation of 7 m AHD. Pedestrian access to the beach is also made possible by a wooden staircase in good condition, which does not interrupt the rock revetment. A third concrete ramp, which can be used for boat access, is located at the level of the public amenities building and crosses the rock revetment. The exposed side of the ramp is protected by basalt with concrete facing. The concrete ramp and the rock protection both appear in good condition overall, with minor localised damage where concrete is cracked and spalled. Half a dozen large rocks, with an average size of 1 m (2.7 tonnes) were observed to be precariously positioned on the rock revetment around this access ramp, about 0.5 to 1 m above beach level, and could potentially pose a safety risk during storms (Figure 3.22h and Figure 3.23a). From the northern end of the SLSC car park to Ritchie Street, the rock revetment was observed to be composed of multiple layers of rock, with size ranging from 0.3 to 1 m (approximately 0.1 to 2.7 tonnes), and occasionally larger rocks positioned near the toe (Figure 3.23). While the typical crest elevation level of the structure was estimated by WRL to be around 4 to 5 m AHD, the presence of a thick vegetation layer made this difficult to estimate in some places. The presence of vegetation on the wall indicates that there is limited wave run up and overtopping along this section of the beach. The rock revetment fronts Beach Street over 700 m with a typical ground elevation of 7 m AHD. Public access to the beach at the southern end of Beach Street is provided by a concrete ramp. Overall, the ramp is in fair condition with localised cracking and spalling of the grouting; the last concrete steps near the bottom of the ramp have been subject to erosion and could be at risk of undermining. Public access to the beach at the northern end of Beach Street is provided by a set of wooden stairs which appeared in good condition overall. WRL Technical Report 2012/21 April 2013 FINAL 20
39 Richie Street to Rock Revetment End WRL was informed by MSC that this section of the rock revetment had been gradually extended and modified over three decades. The condition of the rock revetment was observed to deteriorate when progressing towards the northern end. Except for the last 40 m, the structure appears to typically consist of multiple layers of rock armour with size ranging from 0.3 to 1 m in size (approximately 0.1 to 2.7 tonnes), at slopes varying from 1:1.5 to 1:1.3. Significantly larger rocks, with an average size of about 1 m (2.7 tonnes) can be observed to have been placed in front of the rock revetment, to increase protection from wave action at high water levels (Figure 3.24). The typical crest elevation of the structure ranged from 2.5 to 3.5 m AHD and the ground levels for most properties along this section of East Beach are above 6.0 m AHD. The presence of a vertical scarp was observed in multiple locations, indicating overtopping of the structure and erosion of the vegetated dune. Rock displacement was observed in multiple locations as well, indicating that the rock size and/or design may not be suitable, and that the rock revetment may no longer be able to provide protection from wave action. It was also noted that the rock revetment was cut in multiple locations by private beach access from the properties located on Griffiths Street. Public access to the beach from Connolly Street is provided by a set of wooden stairs which appeared in good condition overall. The shoreline was observed to have pronounced erosion/recession over the last 50 m at the end of the rock revetment, as well as immediately adjacent to it, due to seawall end effects. The extent of this localised erosion zone could be explained by the progressive extension of the rock revetment fronting the last properties. The overall condition of the rock revetment across the last 50 m was considered sub-standard, with inadequate crest height in several places (Figures 3.24g and 3.24h). Additional rock protection appears to have been placed recently at the rock revetment end but does not appear constructed to contemporary coastal engineering practice. Rock displacement can be observed in multiple places due to storm wave action. The northern end of the rock revetment is almost completely outflanked with visible erosion of the dune located immediately behind. Typical ground level for the last properties in the lee of the rock revetment is about 6 to 7 m AHD From Potential Dune Breach to Night Soil Site The dune located immediately adjacent to the end of the rock revetment is relatively steep with a crest level of approximately 8 to 10 m AHD, with the presence of a localised low point of 5 m AHD (Figure 3.25) possibly due to pedestrian action and/or previous sand extraction. Over the first 60 m north of the end of the rock revetment, the front dune is backed by a relatively low-lying vegetated area, with typical ground elevation of 2 to 3 m AHD, which in turns is backed by a secondary dune system with crest levels of 6 to 7 m AHD. This localised depression may have been caused by wind action. No sand mining has been reported to have taken place at this location, but this cannot be excluded as a cause. Progressing north, the two dunes progressively merge together, resulting in a dune system about 60 to 70 m wide at the Night Soil site. The foredune has a cover of marram grass and some woody shrubs. The dune front can be observed to have been eroding/receding over the whole extent of the study area with a clear and steep scarp extending from the beach level (1 to 2 m AHD) to the dune crest with typical elevation levels between 8 to 12 m AHD. WRL Technical Report 2012/21 April 2013 FINAL 21
40 The site referred to as the Night Soil or Night Depot is found about 500 m north from the rock revetment end. This site has been used in the past as a landfill. The ongoing dune erosion, due to the combined action of storm and underlying recession, was observed to be uncovering the landfill, resulting in the release of contaminants and debris into the coastal environment (Figure 3.25f) with consequent safety, environmental and aesthetic impacts. The site is currently closed off to the public with the noted presence of fencing on the previous road access from Griffiths Street. Temporary fencing has also been installed on the crest of the dune as well as on the beach in order to limit public intrusion From the Night Soil Site to Mills Reef Beach Access The dune located immediately adjacent to the Night Soil site is relatively steep with a crest level of approximately 8 to 10 m AHD. Over the first 200 m north of the Night Soil site, an intermittent vertical scarp of about 2 to 3 m height could be observed. The front dune was observed to be relatively lower, with typical crest elevation of 5 to 7 m AHD and fronted by a less marked eroded scarp. A site about 300 m south from the Mills Reef car access road was used as a landfill until the 1970s and is commonly referred to as the Old Municipal Tip. The ongoing dune erosion, due to the combined action of storm and underlying recession, was also observed to be uncovering some of the landfill as can be observed on the dune scarp (Figure 3.26c). The amount of debris visible was less prevalent than at the Night Soil site, as the main landfill site is located further inland. There are a couple of breaks in the dune to allow for public pedestrian beach access from the Mills Reef car park. Pedestrian access had been previously equipped with a board and chain pathway which was observed to be currently in poor condition due to undermining of the dune From Mills Reef to Reef Point Progressing north from Mills Reef car park, the beach is low gradient and faces south (Figure 3.27). The dune height is approximately 5 m AHD in this part of the East Beach with no apparent crossing. The dune is moderately vegetated (although highly variable) along its length, with an intermittent scarp of about 1 m height. The northern end of the beach is backed by the Port Fairy Golf Club. Accumulation of windblown sand along the northern section of the dune was observed in multiple locations. Closer to the northern end, the beach is fronted by offshore reefs, with additional rocks and reef on the beach. There is a continuous, shallow bar along the beach with rips forming against some of the rocks Eastern Coastline Reef Point Reef Point is a 1700 m long beach with a low gradient, facing south-east (Figure 3.28). There are several breaks in the dune to allow for public pedestrian beach access, mostly located towards the eastern end of the beach. A car park is located in the lee of the dune, close to the centre of the beach. The dune height is approximately 5 m AHD in the eastern part of the beach, and relatively steep (over 45 ). The dune is moderately vegetated (although highly variable) along its length, with an intermittent scarp of about 1 m height. The southern end of the beach is backed by the Port Fairy Golf Club, with a relatively lower dune height, of less than WRL Technical Report 2012/21 April 2013 FINAL 22
41 3 m AHD. A sand fence, made of plastic scaffold mesh and pine poles, installed in December 2010, fronts 350 m of this low-lying foredune. Accumulation of windblown sand along the eastern part of the sand fence shows the system to be performing its intended function. However, the scaffold mesh is now missing along the western part of the fence, probably due to the action of high wave runup, with the presence of clear scarp (approximately one metre high) in the foredune. Reef Point Beach is fronted by continuous offshore reefs, with additional rocks and reef on the beach. There is a continuous, shallow bar along the beach with rips forming against some of the rocks Killarney Beach Killarney Beach is a 1000 m long beach with a low gradient, facing south-west to south-east (Figures 3.29 and 3.30). A well vegetated and relatively steep and stabilised dune exists in the centre of the beach with a crest level of approximately 6 m AHD. The dune crest decreases to 4 m AHD at the eastern and western ends, where a clear scarp can be observed. Windblown sand accretion was noted at the foot of the dune scarp at the eastern end of the beach. There are several breaks in the dune to allow for public pedestrian beach access. There are two car parks, located at the eastern and western ends of the beach. A boat launching area is present at the western car park, with a beach access consisting of concrete slabs. At the time of the inspection, erosion was noted at the toe of the beach ramp. It was also possible to note the presence of a crude rock wall buried in the dune scarp, which may had been installed before the concrete boat ramp, as well as what appeared to be the remnants of an old wooden groyne. The western end of the beach is backed by a protected mixed dune and wetland system (Lower Merri River wetlands), part of the Belfast Lough Reserve. Development in the lee of Killarney Beach consists of a caravan park at the western end (Killarney Beach Camping Reserve, over 70 sites), several freestanding buildings as well as a sporting oval, with a ground level of approximately 3 m AHD. The beach is protected by continuous offshore reefs which result in a generally low near shore wave climate Geological Survey An existing key knowledge gap is the limited information regarding the stratigraphy of the East Beach barrier system, as noted in the Background Data Assimilation and Gap Analysis (Water Technology, 2011). This is important because high bedrock levels would limit future erosion/recession. WRL supervised a geotechnical data acquisition campaign from the 5 th to 6 th April 2012, with the drilling of 21 shallow borehole survey wells, to assess bedrock depths and establish a precise stratigraphy of the complete barrier system (Figure 3.31) The geotechnical drilling work was performed by NUMAC (subcontractor to WRL). The boreholes were drilled up to a maximum depth of 10 m or until reaching the bedrock depths. The knowledge of the presence and location of shallow underlying bedrock, as well as the present thickness of unconsolidated sediments will allow WRL to perform more precise erosion modelling and adequately determine the setbacks over the 100 years planning horizon for the study. Bedrock was found 2.7 to 6.0 m below beach level in the southern part of East Beach with the estimated bedrock levels shown in Table 3.5. Bedrock depth was found to increase progressively in the direction of Port Fairy Surf Life Saving Club (SLSC). The bedrock was not found (i.e. was located deeper than 10 m) from the northern end of the East Beach rock wall to the northern end of the geotechnical survey (Mills Reef Beach access). An estimation of the elevation of the WRL Technical Report 2012/21 April 2013 FINAL 23
42 bedrock expressed in m AHD was calculated by using the beach surface elevation derived from the 2007 LIDAR survey at the different borehole locations. The drilling at Borehole#2 was performed in multiple locations in a radius of about 5 m in order to ensure that the drilling rig was not hitting an isolated boulder. The four holes all showed the presence of basalt (i.e. refusal of the auger-drill) in between -2.5 and -3 m below beach surface. The last borehole was performed with a sampling tube and allowed a core sample to be brought back to the surface, showing the presence of thin layer of compacted shells above weathered basalt (Figure 3.32). Table 3.5 Bedrock Depth on East Beach Borehole Coordinates Depth below Elevation Location # ( WGS 84) beach surface (m) (m AHD) (1) 1 ( , ) Seaward of 10 Griffith Street 2 ( , ) Seaward of 42 Griffith Street 3 ( , ) Seaward of 56 Griffith Street 4 ( , ) Seaward of 70 Griffith Street 5 ( , ) Seaward of 80 Griffith Street 6 ( , ) Seaward of Lydia Place 7 ( , ) Seaward of Moyne Court 8 ( , ) Seaward of Hughes Avenue car park 9 ( , ) Seaward of 121 Beach Street 10 ( , ) Seaward of Richie Street 11 ( , ) <-10 <-8.5 Mills Reef beach access 12 ( , ) <-10 < m west of Mills Reef beach access 13 ( , ) <-10 < m west of Mills Reef beach access 14 ( , ) <-10 <-8.5 Seaward of Old Municipal Tip site 15 ( , ) <-10 <-8.5 Seaward of Old Municipal Tip site 16 ( , ) <-10 <-8.5 Seaward of Old Municipal Tip site 17 ( , ) <-10 <-8.5 Seaward of Night Soil site 18 ( , ) <-10 <-8.5 Seaward of Night Soil site 19 ( , ) <-10 <-8.5 Seaward of Night Soil site 20 ( , ) <-10 < m north of rock wall end 21 ( , ) <-10 < m north of rock wall end Notes: (1) The estimation of bedrock elevation in m AHD is based on ground levels derived from the 2007 LIDAR and given with a precision of half a meter. Along the southern section of East Beach, the location of the bedrock basalt shelf at depths between -2 and -5 m AHD is consistent with the results of a previous geological survey campaign performed in the Moyne River, in the vicinity of the Marina in the early 2000s. Drilling in multiple locations found the top of the basalt layer at depth around -4 to -6 m AHD (Max Dumnesy, pers. comm.), and in some locations with a thin cap of weathered calcarenite or basalt. The findings of this extensive survey on East Beach also corroborate well with the conclusions of the study by Environmental GeoSurveys (2005), which did not find any consolidated calcarenite or basalt in the central part of East Beach during their pit surveys (Boreholes 17 to 21). WRL Technical Report 2012/21 April 2013 FINAL 24
43 Section 3 Key Findings Site inspections were performed for each of the beaches within the Port Fairy study area. These site inspections focused on the visual assessment of the dune condition and condition of the coastal protection works. Coastal protection works were inspected with regard to their location, extent and engineering characterisation i.e. crest level, construction, present condition etc. The condition of coastal protection works not maintained by MSC or DSE was assessed at a cursory level only. Analysis of collected sediment samples showed the sediment from the beaches is characterised as fine to medium grained sand with moderate shell content. A geotechnical data acquisition campaign was performed on East Beach in order to assess bedrock depths. Bedrock was found 2.7 to 6.0 m below beach level in the southern part of East Beach. Bedrock was not found (i.e. was located deeper than 10 m) from the northern end of the East Beach rock wall to the northern end of the geotechnical survey (Mills Reef Beach access) so would not limit erosion in these areas. WRL Technical Report 2012/21 April 2013 FINAL 25
44 4. Climate Change 4.1. Overview of Key and Secondary Climate Change Variables Engineers Australia (2012a) lists six key environmental variables applicable to coastal engineering, namely: 1. Mean Sea Level; 2. Ocean Currents and Temperature; 3. Wind Climate; 4. Wave Climate; 5. Rainfall/Runoff; 6. Air temperature. A growing body of research has found that ocean acidification (ph lowering) may be occurring, and this could be considered an additional key variable. Engineers Australia (2012a) also lists 13 secondary effects applicable to coastal engineering, namely: 1. Local Sea Level; 2. Local Currents; 3. Local Winds; 4. Local Waves; 5. Effects on Structures; 6. Groundwater; 7. Coastal Flooding; 8. Beach Response; 9. Foreshore Stability; 10. Sediment Transport; 11. Hydraulics of Estuaries; 12. Quality of Coastal Waters; 13. Ecology. The recommended methodology is to consider the relative likely importance of the considered key environmental variable when subject to climate change and then consider the possible secondary effect arising. The key environmental variable and secondary effects can be combined into a matrix for project assessment as shown in Table 4.1 and Table 4.2. Detailed assessment where indicated in Table 4.1 is presented in Sections 4 to 10. It should be noted that there is high uncertainty in the quantification (or no quantification) of many of the variables or their change. Therefore, the use of a high ARI event (e.g. 100 year) and factors of safety (such as freeboard) need to be introduced to manage the risk of uncertainty. WRL Technical Report 2012/21 April 2013 FINAL 26


45 Table 4.1 Interaction Matrix of Climate Change Variables for Port Fairy (1/2)) WRL Technical Report 2012/21 April 2013 FINAL 27


46 Table 4.2 Interaction Matrix of Climate Change Variables for Port Fairy (2/2)) WRL Technical Report 2012/21 April 2013 FINAL 28
47 4.2. Sea Level Rise The Intergovernmental Panel on Climate Change (IPCC) have produced major reports in 1990, 1996, 2001 and Hence, the 2007 report is known as the Fourth Assessment Report (AR4). The latest IPCC Summary for Policymakers Report (IPCC, 2007a) and Working Group 1 Report (IPCC, 2007b) provide numerous global average sea level rise scenarios for 2095 (relative to the baseline of ) in the range of 0.18 to 0.79 m. The central estimate is that the global average sea level will rise by about 0.55 m by the year 2100, with a range of uncertainty of 0.20 to 0.85 m. More recent works (Rahmstorf, 2007; Vellinga, 2008) have reviewed the high-end estimation for SLR around 2100 to be 0.55 to 1.2 m. Regional and local changes in average sea level will vary from this global average. For planning purposes, most Australian governments (federal and state/territory) have adopted formal sea level rise allowances between 0.8 and 1.1 m on 1990 sea levels for the year An increase in mean sea level will exacerbate the impact of the coastal hazards studied in this study area. Sea level rise will result in higher water levels on the open coastline which will correspond to an increased rate of shoreline recession. Increased still water levels will also allow land in the lee of low-crested dunes or barriers to be episodically inundated due to wave run-up and overtopping. The threat from tidal inundation around lower-lying estuarine foreshores will be significantly increased with sea level rise. The stability of coastal watercourse entrances will also be changed due to alterations to the dynamics of berm heights and break out conditions. Under sea level rise projections, rock platforms currently protecting the base of coastal cliffs may be submerged on a permanent or temporary basis resulting in undermining of cliff stability due to wave attack (DECC, 2010). Throughout the study area, numerous rock platforms and reefs reduce the wave height at the shore. This protection would be reduced with sea level rise. For existing coastal structures, sea level rise will reduce freeboards, increase wave overtopping (frequency and magnitude) and, at depth-limited locations, expose structural elements to larger forces. Where a long term, site specific water level record exists (such as a nearby tidal gauge), the frequency of high storm surge water levels (tide plus anomaly) up to the length of the data record is readily calculated. For example, if the record length is 35 years, average recurrence intervals (ARI) of up to 35 years may be determined. However, to estimate more infrequent, extreme water levels such as a 100 year ARI, a suitable probability density function (a theoretical statistical distribution which closely fits the historic natural values) is required for extrapolation. While the use of these functions to estimate extreme water levels and other variables such as wind and waves is well established, limitations in their application do exist. The uncertainty in extrapolated water level estimates increases with average recurrence interval and care must be exercised when selecting the most appropriate fit as many different theoretical distributions exist. The data used within extreme value analysis is also assumed to be statistically stable, i.e. long term change (such as sea level rise) is negligible. To adjust present day extreme value estimates to account for climate change, the modal value or slope of the distribution or a combination of both may be used (NCCOE, 2012a). In practical terms for water levels, this means shifting the theoretical distribution by a magnitude equivalent to sea level rise. As such, the frequency of present day rare events will increase under climate change, i.e. in some cases the present day 100 year ARI water level may occur approximately several times a week in 2100 with sea level rise. WRL Technical Report 2012/21 April 2013 FINAL 29
48 4.3. Sea Level Rise Adopted in Australian States A list of sea level rise values adopted in various State policies, or as accepted practice, is shown in Table 4.3. This list is not exhaustive. It is subject to revision and there may be additional State policies or legislation which contradict or supersede those shown. All are broadly based on various interpretations or scenarios from recent IPCC projections. The values adopted for this project are broadly consistent with those used in other States, although some States only specify mid range rather than high range scenarios, as these represent the best estimate. Local Governments are responsible for the protection of the community against any threat to its safety and welfare: Local government provides for the health, safety and welfare of its community and if a council cannot show that it has taken preventative action against any threat to the health, safety and welfare of its community, it faces the possibility of liability costs costs which can be reduced if a council identifies the threats to its community and implements appropriate strategies to prevent these threats (LGAT, 2004). Therefore, these responsibilities create a number of challenges for the Local Governments in the context of climate change. As explained by Smith et al. (2008), Local Governments are responsible for identifying potential natural hazards, including those associated with climatic events, within their jurisdiction. This responsibility is now complicated as the Local Governments have not only to consider historical climate variability but future climate change as well, and the inherent uncertainty in regard to rate or magnitude of change. To this effect, national and state sea level rise planning benchmarks have now been adopted, or are still under consideration, throughout Australia, in order to assist local councils in coastal hazard assessments. These benchmark values, defined as an increase above 1990 mean sea levels, are provided in Table 4.3. Table 4.3 Sea Level Rise Planning Benchmarks Summary Government 2050 Benchmark 2100 Benchmark Source Commonwealth m (DCC, 2009) NSW (1) 0.4 m 0.9 m (DECC, 2010) Victoria - No less than 0.8 m (VCS, 2008; DSE, 2012) Queensland 0.3 m 0.8 m (DERM, 2011) Tasmania There are currently no benchmarks in place. (2) South Australia 0.3 m 1.0 m From 1991 policy on coast protection and coastal development (under review) Northern Territory There are currently no benchmarks in place Western Australia m (DTCI, 2011) Notes: (1) This benchmark was repealed by the NSW government in (2) Values from VIC and NSW are generally used in practice. WRL Technical Report 2012/21 April 2013 FINAL 30
49 4.4. Sea Level Rise Adopted for this Study The sea level rise projections over the 2100 planning period adopted in this study were provided by the MSC and DSE and consistent with the recommendations of the Victorian Coastal Hazard Guide (DSE, 2012) and more recent CSIRO work for the Victorian coastline (McInness, 2009). The sea level rise projections adopted for this study were selected after discussion with the Project Team and the Technical Review Panel and are shown in Table 4.4. Table 4.4 Sea Level Rise Projections Adopted for this Study Planning Period Sea Level Rise (1) (year) (m) Notes: (1) increase above 1990 Mean Sea Level. Indicative modelling performed in the early stage of this study showed that a 0.2 m sea level rise produced similar impacts to the Present Day scenario (i.e. 0 m sea level rise). Therefore, it was decided after discussion with the Project Team and the Technical Review Panel to use a minimum sea level rise projection of 0.4 m over the 2050 planning period. While the Victorian Coastal Hazard Guide (DSE, 2012) recommends a minimum sea level rise benchmark of 0.8 m by 2100, more recent sea level rise studies (Rahmstorf, 2007; Vellinga, 2008) have reviewed the high-end estimation for SLR around 2100 to be 1.2 m. Therefore, it was decided after discussion with the Project Team and the Technical Review Panel to associate a 0.8 m sea level with the 2080 planning period and a 1.2 m sea level rise value 0.8 m with the 2100 planning period. This decision allows investigating the consequences on coastal flooding of sea level rise higher than the current Victorian benchmark of 0.8 m and provide valuable information in relation to risks and impacts associated with different SLR. Finally, it should be noted that the association of a specific sea level rise value with a planning period has no influence on the potential extent of the inundation mapping. Therefore. it is possible for planning purposes to use the coastal inundation mapping results of the 0.8 m sea level rise scenario for a 2100 planning period. These sea level rise benchmarks were established considering the most recent international (Intergovernmental Panel on Climate Change, IPCC, 2007a) and national (McInnes, 2007) projections. A revision may occur following the release of the next IPCC report in Quantification of Other Climate Change Variables Wind Climate Change Projections At present, projections for wind and wave changes are not as well accepted as those developed for mean sea level increases. Climate change may have a direct influence on the frequency, magnitude and direction of local winds from storms. Any changes to wind climate will have a direct effect on structural wind loadings but also a secondary effect on the distribution of the wave-energy flux presently shaping the coastline. WRL Technical Report 2012/21 April 2013 FINAL 31
50 CSIRO (2007) stated that for 2030: A consequence of global warming is for the westerlies which are associated with the southern hemisphere storm track to strengthen but contract further polewards.... in the south-east of the continent where increases in wind speed occur over southern Victoria, Tasmania and Bass Strait (-2% to +7.5% with a best estimate change of +2% to +5%). Preliminary projections indicate that trade winds may be weaker and that the westerly wind stream may move further south (CSIRO, 2007). The potential effect of climate change on wind speed and storm surges along the Victorian coast has been reviewed in the CSIRO study (2009) and reported that storm surge heights in Bass Strait responded linearly to changes in wind speed. Changes to the local winds will also have a direct effect on sand dune mobility and direction. Also, any increase in extreme wind speeds will result in increased storm surge at the shoreline leading to higher wave run-up and overtopping. While wind loads on structures are proportional to wind speed squared, it should be noted that storm surge and extreme wave heights are a linear function of wind speed, and are therefore less sensitive to potential changes in wind speed associated with climate change Wave Climate Again, it should be emphasised that the scientific understanding of the projected changes to storminess, and hence wave climate, are still developing (DECCW, 2010). Young et al. (2011) considered observations of significant wave height from remote sensed altimetry and found a weak global trend of increasing mean wave height and a stronger increasing trend at the 90 th and 99 th percentile. However, Shand et al. (2011a) found that there was no significant change in wave conditions for the present duration of reliable wave buoy records around Australia. Regardless, it is reasonable to expect that any alterations to storminess (magnitude, frequency and direction) due to climate change will in turn induce alterations in beach erosion patterns and changes in mean wave direction may change the planform alignment of beaches. Also, any increase in extreme wave heights will also result in increased wave setup at the shoreline leading to higher wave run-up and overtopping in extreme events. While changes to deep water wave climate will be critical for nearshore engineering activities, depth-limited wave climate in inshore regions will increase as a result of mean sea level rise. This will expose existing coastal structures in these regions to more energetic wave conditions. WRL Technical Report 2012/21 April 2013 FINAL 32
51 Section 4 Key Findings The sea level rise projections over the 2100 planning period adopted in this study were provided by the MSC and DSE and consistent with the recommendations of the Victorian Coastal Hazard Guide (DSE, 2012) and more recent CSIRO work for the Victorian coastline Planning Period Sea Level Rise (1) (year) (m) Notes: (1) increase above 1990 Mean Sea Level. Indicative modelling performed in the early stage of this study showed that a 0.2 m sea level rise produced similar impacts to the Present Day scenario (i.e. 0 m sea level rise) so was not modelled in detail. This decision allowed investigating the consequences on coastal flooding of sea level rise higher than the current Victorian benchmark of 0.8 m and provides valuable information in relation to risks and impacts associated with different SLR. Because most inundation modelling was not coupled to future recession, the association of a specific sea level rise value with a planning period has no influence on the potential extent of the inundation mapping. Therefore. it is possible for planning purposes to use the coastal inundation mapping results of the 0.8 m sea level rise scenario for a 2100 planning period. WRL Technical Report 2012/21 April 2013 FINAL 33
52 5. Coastal Processes 5.1. Overview Prior to assessing the coastal hazards, it was necessary to understand the coastal processes relevant to the study area. Coastal hazards are a direct consequence of coastal processes, which may affect the built environment and the safety of people. The coastal processes listed below are most relevant for this investigation and are assessed in the following sections. Water levels; Swells and local wind waves; Wave setup; Wave runup and overtopping; Beach erosion and long-term shoreline recession; Human activities. The information presented in the following sections was acquired from the review of previous coastal processes reports, as well as from research, analysis and modelling undertaken specifically for this study Adopted Modelling Scenarios for the Coastal Hazards Study Assessment of coastal erosion, shoreline recession, storm surge inundation and combined storm surge inundation plus catchment flooding was carried out for present day conditions and a set of future modelling scenarios. The scenarios include a combination of environmental conditions for a range of average recurrence interval (ARI) extreme events in the combinations set out in Table 5.1. The likelihood of the coastal conditions and catchment flooding were defined using ARI. Table 5.1 shows the four (4) different scenarios that were defined for the Future Coasts Port Fairy Coastal Hazard Assessment, with associated defined likelihoods for the present and 2050, 2080 and 2100 planning periods. This table suggests that the combination of events characterised by a 50 year ARI coastal storm (storm surge and wave event) combining with a Mean High Water Spring tide (MHWS) and 10 year ARI catchment event can be classed as likely to occur currently, but will become virtually certain in 2050 as increased sea levels increase the frequency of the impacts of this type of event occurring. WRL Technical Report 2012/21 April 2013 FINAL 34
53 Table 5.1 Modelling Scenarios Adopted for this Study Combination of Environmental Conditions SLR (1) (m) Tide Coastal storm (year ARI) Catchment Likelihood of Modelled Scenario over Specific Planning Period Flow Current (year ARI) (2) 0 MHWS Likely Virtually Certain 0.4 MHWS Unlikely About as likely as not Likely Virtually Certain 0.8 MHWS Exceptionally Unlikely About as likely as not 1.2 MWHS Unlikely Notes: (1) Increase above 1990 Mean Sea Level. (2) The impact on flooding of combined extreme coastal and catchment events was investigated in Section 8. The use of 100 year ARI events for storm erosion is consistent with flood planning. While the use of ARI is easier to conceptualise, in reality, a 100 year ARI event has a 1% chance of occurring (or being exceeded) each year (1% AEP). There is no element of timing for extreme storm events. The 100 year ARI (1% AEP) event could occur at any time, however, for Port Fairy it is more likely to occur during winter months due to increased storminess. Mean sea level is being monitored within national and international programs. Projections regarding sea level rise are released by the IPCC at intervals of five (5) to seven (7) years. Current IPCC projections and global measurements indicate that sea level rise is presently in the range of 1 to 3 mm/year and may increase to approximately 10 mm/year. Under these scenarios, the findings of this WRL report should be reviewed and compared with changes to measured and projected sea level within the IPCC revision cycle and/or approximately every decade. Measured or projected sea level in excess of that used in this WRL report would increase the estimated risk and should be a trigger for a revised/updated study. Conversely, measured or projected sea level less than that used in this WRL report would delay the realisation of future hazards presented by WRL Water Levels Coastal inundation is caused by elevated water levels coupled to extreme waves impacting the coast. Elevated water levels consist of (predictable) tides, which are forced by the sun, moon and planets (astronomical tides), and a tidal anomaly. Tidal anomalies primarily result from factors such as wind setup (or setdown) and barometric effects, which are often combined as WRL Technical Report 2012/21 April 2013 FINAL 35
54 storm surge. Water levels within the surf zone are also subject to wave setup and wave runup. Figure 5.1 diagrammatically represents the different components contributing to coastal inundation. The CSIRO (McInness, 2009) have undertaken and reported on storm surge modelling along the Victorian Coast for DSE as part of the Future Coasts Program. The CSIRO report presents predicted extreme sea levels under a number of different average recurrence intervals (ARI) and climate change scenarios. The design elevated water levels for the range of average recurrence intervals (ARI) considered in this investigation are presented in Table 5.2, using the results from the CSIRO on extreme sea levels along Victoria s coast (McInness, 2009). Table 5.2 Design Water Levels Tide + Storm Surge Average Recurrence MHWS Storm Surge Height Water Level Excl. Wave Setup and Runup Interval ARI (year) (m AHD) (m AHD) (m AHD) ± ± ± ± ± ± ± ±0.05 While these design water levels incorporate allowance for tides, barometric setup and wind setup (i.e. storm surge), wave setup and wave runup are excluded and need to be accurately determined through data and/or modelling. Wave setup and runup are intrinsically dependent on nearshore wave conditions and foreshore geometry. Wave setup and runup were calculated separately for individual locations along the Port Fairy coastline and are detailed in Sections 5.5 and 5.6. The design water levels used for this study were based on a combination of Mean High Water Spring (MHWS) water elevation and the associated storm surge return height level (50 and 100 ARI), as well as the different SLR values detailed in Table 4.4, and adopted over the 2100 planning period Ocean Swell Introduction The Port Fairy coastline is subject to waves originating from offshore storms from the Southern Ocean (swell) and produced locally (wind waves) within the nearshore coastal zone. Swell waves reaching the coast may be modified by the processes of refraction, diffraction, wave-wave interaction and dissipation by bed friction and wave breaking. Locally generated waves undergo generation processes as well as the aforementioned propagation and dissipation processes. The model SWAN (Simulating WAves Nearshore Delft Hydraulics, version 40.85) was used to quantify the change in wave conditions from a deep-water boundary into the Port Fairy study area coastline. Detailed information on the wave modelling is presented in Appendix A. Model scenarios corresponding to 50 and 100 year ARI events from all directions between east clockwise to west in 12.5 bins were simulated. Figure 5.2 shows contours of predicted significant wave heights locally generated by a 100 year ARI south-westerly swell. WRL Technical Report 2012/21 April 2013 FINAL 36
55 The following sections provide the reader with information regarding the methodology used to derive offshore wave conditions used to drive the SWAN model Wave Buoy Data and Analysis The best available data source for wave data is wave buoys. The closest known wave buoys to the site are: Off Port Campbell, VIC, approximately 60 km to the east, operated for approximately 1 year by Sustainability Victoria; Off Cape Bridgewater, VIC, approximately 90 km to the west, operated for approximately 1 year by Sustainability Victoria. These buoys are directional and provided valuable information (H s, H max, T p, D p ) about the local wave transformation processes along this particular section of the coastline. Presently, they are not able to provide long term data. Two additional buoys, which have been deployed for longer periods are: Off Cape du Couedic, Kangaroo Island, SA, approximately 500 km to the west, operated for approximately 9 years by the Bureau of Meteorology; Off Cape Sorell, TAS, approximately 500 km to the south-east, operated for approximately 7 years by CSIRO and a further 12 years by the Bureau of Meteorology, giving a total of 19 years of data. Both these buoys are non-directional. Although these wave buoys are somewhat remote from Port Fairy, Hemer et al. (2008) found that for large storm events in the Southern Ocean, there was often a relationship between waves recorded at Cape Sorell and Cape du Couedic. Recent work by WRL (Coghlan, 2008) compared the wave records for Cape du Couedic, Cape Sorell and a short term (3 month) wave instrument deployment off Portland, Victoria, and found a good correlation between all three. Analysis of the available data from the four buoys was performed to derive offshore extreme wave data as well as to verify the accuracy of the data provided by numerical global wave models, which were then used to supplement the measured data Numerical Global Wave Models Major numerical global wave models include ERA-40, and WW3. As stated above, wave buoy data is considered the most reliable source of wave information, but these models also provide wave direction, whereas many wave buoys are non-directional. Furthermore, some of these models provide continuous information for the last 50 years and do not have data gaps. ERA-40 The ERA-40 dataset originates from the ECMWF (European Centre for Medium Range Weather Forecasting) and was generated by reanalysing meteorological variables over the entire globe between September 1957 and August Wave variables were derived from a coupled WRL Technical Report 2012/21 April 2013 FINAL 37
56 atmospheric wave model and averaged over 1.5º x 1.5º latitude-longitude grids cells at a temporal resolution of 6 hours (0h, 6h, 12h and 18h GMT/UT). A subset of the complete ERA-40 dataset (including significant wave height, mean period and mean direction) is freely available from the ECMWF at the same 6-hourly time-step, but at a coarser spatial resolution of 2.5º x 2.5º. WW3 The WAVEWATCH III global wave model originates from the US National Centre for Environmental Protection (NCEP), the US National Oceanic and Atmospheric Administration (NOAA) and the US Navy Fleet Numerical Meteorology and Oceanography Forecast Centre. The WW3 dataset commenced in The WW3 model runs at resolutions as small as 0.5º x 0.5º, but only outside the surf zone. WW3 is a third generation wave model developed at NOAA/NCEP in the spirit of the WAM model. It is a further development of the model WAVEWATCH I, as developed at Delft University of Technology and WAVEWATCH II, developed at NASA, Goddard Space Flight Centre. Recent work by WRL (Flocard, 2011) compared the output of the WW3 model with the data obtained from a mid-term (9 months) wave instrument deployment off Port Fairy, and found a good correlation between the two. Data sets from both global wave models were extracted at the closest model output point to the Port Fairy shoreline and used to derive the offshore directional extreme wave climate Extreme Value Analysis Large, low probability wave events are generally defined in terms of an average recurrence interval (ARI). The commonly used approach to derive extreme wave height for a particular ARI is to fit a theoretical distribution to historical storm wave data. If the record is of insufficient length to provide the event magnitude for the ARI of interest, the distribution is extrapolated. Calculation of extreme wave height was performed using the methodology recommended by You (2007) and Shand et al. (2010). The raw wave data was first analysed to obtain statistically independent storm wave heights. The buoy data analysis provided reliable non-directional data based on relatively long time intervals, while the analysis of data extracted from the global wave models provided directional perspective as it could be split into four directional ensembles (i.e. East to South; South-South-West; South-West and West-South-West to West). The FT-I (Gumbel) distribution was used to fit the data and estimate the wave height for the required ARI, as recommended by You (2007) and Goda (1988) Results The 1 hour exceedance H s for all buoys and both global wave models for average recurrence intervals of between 1 and 100 years is summarised for the 1, 10, 50 and 100 year ARI in Table 5.3. WRL Technical Report 2012/21 April 2013 FINAL 38
57 Table 5.3 Summary of One Hour Exceedance Hs (Non-Directional Analysis) Data Source Duration of data set (year) H s (m) 1 year ARI 10 year ARI 50 year ARI 100 year ARI Cape Sorell Buoy Cape du Couedic Buoy Average Buoys Cape Bridgewater Buoy Port Campbell Buoy NWW3 Model ERA-40 Model Average Models Given the location of Port Fairy approximately half way between Cape Sorell and Cape du Couedic, in the absence of local measurements, an average of the two buoys is suggested for deep water waves offshore from Port Fairy. The obtained average of these two long term deployed buoys is very close to the values obtained by averaging the outputs of the two global wave models, which contain directional data. As explained in the previous section, a directional extreme wave analysis was then performed on four distinct data sets obtained from each of the global model outputs and classified according to the peak wave direction. The 1 hour exceedance H s for the directional global wave model outputs for average recurrence intervals of between 1 and 100 years is summarised for the 1, 10, 50 and 100 year ARI in Table 5.4. Table 5.4 Summary of One Hour Exceedance Hs (Directional Analysis) Data Source & Direction Bin Direction ( TN) H s (m) 1 year ARI 10 year ARI 50 year ARI 100 year ARI NWW3 Model East to South South-South-West South-West West-South-West to West ERA-40 Model East to South South-South-West South-West West-South-West to West WRL Technical Report 2012/21 April 2013 FINAL 39
58 It should be noted that Hemer et al. (2007) have reported that ERA-40 did underestimate peak wave conditions due to synthetic biases and trends resulting from altimeter data. On the other hand previous comparisons of extreme sea states between buoy data and NWW3 data have indicated the NWW3 data resulted in more extreme sea states (Abadie et al., 2006; Hemer et al., 2007). A possible explanation of this trend is due to the fact that NWW3 records are usually provided at greater depths than the buoys depths, resulting WW3 statistics are more energetic than the buoy derived values. Nonetheless, the results of this analysis allowed to establish offshore wave conditions, similar to the conditions derived from the buoy records, ranging from east to west swell directions, in 22.5º increments, as described in Table 5.5. Table 5.5 Adopted One Hour Exceedance Wave Climate Conditions Direction Bin Direction ( TN) H s (m) 1 year ARI 10 year ARI 50 year ARI 100y ear ARI E ESE SE SSE S SSW SW WSW W The results of the SWAN modelling, presented in Appendix A, performed to quantify the change in wave conditions from the deep-water into the Port Fairy study area coastline showed that: The predominant wave climate is west to south-west with large average and extremes on exposed coast; The most extreme wave climate in East Beach embayment was found to be originating from the southeast, due to sheltering effect from Griffiths Island on the south-west swell, and confirmed by a desktop diffraction analysis Wave Setup Wave setup is defined as the local quasi-steady increase in water level inside a surf zone due to transfer of wave momentum. The numerical surf zone model of Dally, Dean and Dalrymple (1984) was implemented using SWAN wave modelling output to calculate local wave setup at twenty representative locations along the coastline of the study area (see Figures 5.3 to 5.8) Wave Runup and Overtopping The majority of beaches within the Port Fairy study area are backed by sand dunes or seawalls. During storm events, waves frequently impact these features backing the beach and overtopping of the crests occurs in the form of bores of water being discharged inland or splashes of water being projected upwards and eventually transported inland by onshore winds. Wave overtopping can cause damage to the seawall crest and to beachfront structures. WRL Technical Report 2012/21 April 2013 FINAL 40
59 Overtopping also constitutes a direct hazard to pedestrians and vehicles in the proximity of the seawall during storm events. Wave runup is defined as the extreme level the water reached on a structure slope by wave action. Unlike wave setup, wave runup is a highly fluctuating and dynamic phenomenon and it is commonly described using the runup parameter R2% which is the runup level exceeded by 2% of the waves. Wave overtopping depends on the: hydraulic parameters such as water level, wave height and period; and structural parameters such as the seawall construction (sandstone masonry, precast concrete blocks, rock revetments etc.), slope of the seawall or the dune and crest levels. Wave overtopping was calculated for twenty representative locations along the Port Fairy coastline based on: the extreme water levels incorporating storm surge and wave setup; the nearshore wave parameters (significant wave height and peak wave period) as derived from SWAN numerical wave modelling; and the seawall structural features (crest level, slope etc.) as derived from the field survey. The representative locations were chosen taking into consideration the local wave and water level conditions and the dune or seawall characteristics. Wave overtopping was calculated for the 50 and 100 year ARI storm events for present day conditions and for the required future SLR scenarios. Wave overtopping was reported as the volume of water discharged above the crest level on average over the duration of the storm, and expressed in L/s per m. In this form, wave overtopping could be related to published tolerable rates (CEM, 2006, EurOtop, 2007) with regard to structural and people safety Beach Erosion and Shoreline Recession Introduction For the purposes of this study, the coastal hazard components can be described as follows: Short Term Storm Erosion refers to the short-term response of a beach to changing wave and water level conditions during ocean storms. This response is generally manifested in a storm bite from the sub-aerial beach moving offshore during the storm; and Shoreline Recession refers to the long-term trend of a shoreline to move landwards in response to a net loss in the sediment budget over time (Ongoing Underlying Recession). Shoreline recession is also predicted to result from sea level rise (Sea Level Recession). It is important to differentiate the processes of erosion and recession as they occur on very different time-scales. For instance, the dune retreat which can be observed in recent times on East Beach is the result of the combination of these two processes. As explained in Sections WRL Technical Report 2012/21 April 2013 FINAL 41
60 5.7.3 and 5.9, it is clear that the evolution of East Beach is influenced by long-term recession due to natural coastal processes and the effects of human activities at the river entrance. However, the total retreat of the dune system is also influenced by storm demands of recent coastal storms, such as the storms in June and July 2011, with offshore wave conditions evaluated as 40 year ARI events (Carley, 2011; Shand, 2011b). The resulting setbacks from Short Term Storm Erosion and Sea Level Rise erosion are presented in detail in Section 6. The analysis of Ongoing Underlying Recession and the different methods used to derive the evolution rates at the different locations within the study area are presented in Section Short Term Storm Erosion Beach erosion is defined as the erosion of the beach above mean sea level by a single extreme storm event or from several storm events in close succession. The amount of sand (above 0 m AHD) transported offshore by wave action is referred to as storm demand and expressed as a volume of sand per metre length of beach (m 3 /m). This can be converted to a horizontal storm bite which is easier to visualise. Around the Port Fairy coastline, storm demand varies depending on several factors such as: exposure of the beach; protection by offshore reefs and rock shelves; nature of the coastline; wave conditions (i.e. wave height, period and direction relative to the beach alignment); water levels; steepness of the profile offshore from the beach; and sand grain size and the state of the beach prior to the storm. Design storm demands for the beaches of the Port Fairy study area were assessed through SBEACH numerical modelling (Carley and Cox, 2003). These are presented for each beach in Section Ongoing Underlying Recession Ongoing underlying recession is the progressive onshore shift of the long term average land-sea boundary which may result from sediment loss. It is expressed in terms of change over years in volume of sand within the beach fronting the seawalls (m 3 /m/year) and/or corresponding landward shoreline movement (m/year). It should be noted that the shape of East Beach and most of the smaller pocket beaches on the Western Coast is termed crenulated or zeta planform. The asymmetry indicates a net littoral drift from west to east, which is consistent with the predominant west to south-west wave climate (see Figure 5.9). Recession rates due to sediment loss around the Port Fairy coastline were mostly derived through the analysis of long term changes in the location of the vegetation line using the available aerial photography. These analyses were generally undertaken using the long term linear trend in all available data, not just the difference between the start and finish date (except WRL Technical Report 2012/21 April 2013 FINAL 42
61 for the 1870 to 2010 analysis). The use of long term average over multiple dates helps to filter out the effects of short term storm erosion. An analysis was performed by assessing the horizontal movement of the vegetation line between the 1948, 1970, 1986 and 2010 aerial photography plates (see Figure 5.10). The 2003 aerial photography could not be used as the resolution was significantly lower and ortho-rectification of the provided photography seemed to be problematic. Evan and Hanslow (1996) estimated the following accuracy for aerial photography in NSW: Pre-1960 ± 1 to 1.5 m horizontal; Post-1960 ± 0.5 m horizontal. Table 5.6 Underlying Recession Rates Based on Vegetation Line Analysis ( ) Representative Profile Location Underlying recession (1) (m/year) Cape Reamur na (3) Unnamed 7 (VIC 521) na (3) Unnamed 6 (VIC 520) na (3) Unnamed 5 (VIC 519) na (3) Unnamed 4 (VIC 518) na (3) Unnamed 3 (VIC 517) 0.02 Unnamed 2 (VIC 516) 0.03 Ocean Drive 0.00 Pea Soup 0.02 South Beach 0.04 Griffiths Island Beach 0.06 South Mole 0 East Beach South 0.00 East Beach SLSC 0.00 East Beach Dune Breach (2) 0.35 East Beach Night Soil Site (2) 0.10 East Beach Old Municipal Tip 0.10 East Beach North 0.00 Reef Point 0.18 Killarney Beach na (3) Notes: (1) For beaches accreting, recession was conservatively considered to be nil. (2) The analysis was only performed on the 1970, 1986 and 2010 aerial photography plates. (3) No recession rate could be calculated due to the lack of available data. A more precise analysis was performed over a 600 m stretch of East Beach (see Figure 5.11), immediately north of the northern end of the rock revetment, based on the photogrammetric analysis (Carley, 2008c). Carley reported that the vertical accuracy for the photogrammetry was lower for the 1948, 1969 and 1977 data (± 1 m). The horizontal movement of the +4 and +6 m AHD contours were tracked over the years 1969, 1977, 2002 and It was found that the horizontal movement was generally similar for both +4 and +6 m AHD contours. The recession WRL Technical Report 2012/21 April 2013 FINAL 43
62 was greatest at the southern part of the study area (100 m and 200 m transects), grading to a negligible change at the northern end (400 m and 500 m transects). The higher rate of recession at the southern end is likely to be due to end effects from the seawall. The average rate of recession over the 600 m stretch of study area was 0.10 m/year (recession) over the 38 years. Table 5.7 Underlying recession rates based on photogrammetry analysis ( ) Representative Profile Location Underlying recession (1) (m/year) East Beach East Beach Night Soil Site 0.05 East Beach Dune Breach 0.25 Additionally, a quantification of longer term change was performed by comparing the evolution of the shoreline location extracted from the chart of Stanley (1870) with the vegetation line obtained from analysis of the 2010 aerial photography (Figure 5.12). This analysis was performed only on East Beach. This exercise indicated that shoreline recession over the period from 1870 until 2010, was approximately 60 m at the northern end of the rock revetment and reduced northward to 25 m at the Night Soil and the Old Municipal Tip sites. The shoreline evolution at the northern end of East Beach varied from 10 m recession to none. The analysis of recession rates along the southern section East Beach was complicated by the progressive construction of the rock revetment since the 1960s and the basalt breakwater at the southern end in the 1920s. Based on the assumption that the rock revetment position is representative of the shoreline position in 1960, it was possible to estimate the recession at the Port Fairy SLSC and the East Beach South transect locations. The associated recession rates are given in Table 5.8. Table 5.8 Underlying Recession Rates Based on Long Term Analysis ( ) Representative Location Underlying recession (1) (m/year) East Beach East Beach South East Beach SLSC 0.35 East Beach Dune Breach 0.42 East Beach Night Soil Site 0.18 East Beach Old Municipal Tip 0.18 East Beach North 0.10 The recession values obtained from this long term analysis are relatively similar to the one obtained from the vegetation line analysis. It should be noted that the geo-rectification of the Stanley Map was mostly performed by using available control points located within the Port Fairy township. This implies that error in the 1870 shoreline position would potentially increase with distance from the Port Fairy township, such as for the northern end of East Beach. The recession rates are further complicated by the construction of the training walls in the 1870s and 1880s and the rock revetment on the southern part of the beach from the 1960s. These WRL Technical Report 2012/21 April 2013 FINAL 44
63 structures can be expected to have altered the rates of shoreline change both updrift and downdrift of the structures. A detailed erosion/recession analysis of this stretch of East Beach was performed as part of an additional task in order to assess the risk of dune breaching and is provided in Appendix C Summary of Assessment of Ongoing Underlying Recession There is considerable uncertainty in projecting ongoing underlying recession forwards for 100 years, because it is not certain that past trends will continue. Nevertheless, in the absence of any definitive guidance on changes to long term trends, extrapolation into the future is the only defensible option. Using the available data and range of different methods, measurements of long term coastal change were analysed in Section 5.7, and extrapolated for a nominal 100 year planning period. The adopted recession rate for this study, based on the results of the different methods and taking a conservative approach, are provided in Table 5.9. Table 5.9 Adopted Underlying Recession Rates Representative Profile Location Underlying recession (1) (m/year) Cape Reamur na (2) Unnamed 7 (VIC 521) na (2) Unnamed 6 (VIC 520) na (2) Unnamed 5 (VIC 519) na (2) Unnamed 4 (VIC 518) na (2) Unnamed 3 (VIC 517) 0.05 Unnamed 2 (VIC 516) 0.05 Ocean Drive 0.00 Pea Soup 0.05 South Beach 0.05 Griffiths Island Beach 0.05 South Mole 0.00 East Beach South 0.00 East Beach SLSC 0.00 East Beach Dune Breach 0.35 East Beach Night Soil Site 0.10 East Beach Old Municipal Tip 0.10 East Beach North 0.00 Reef Point 0.20 Killarney Beach na (2) Notes: (1) For beaches accreting, recession was conservatively considered nil. (2) No recession rate could be calculated due to the lack of available data. Very minor recession rates were found for beaches on the western coastline on the open ocean. On East Beach, no recession rate was applied over the stretch of coastline presently protected by the rock revetment as it was considered that this coastal protection would be maintained. Minor recession rates were observed at the northern end of East Beach. Higher recession rates were observed in the vicinity of the northern end of the rock revetment due to seawall effects. The projected recession would not eventuate if protection works were undertaken, such as if a WRL Technical Report 2012/21 April 2013 FINAL 45
64 properly engineered rock revetment was extended northward, or if a major sand nourishment and/or groyne construction was undertaken. It should be noted that a northward extension of the rock revetment would result in end effects being transferred to the new northern extent of the rock revetment. The long term recession rates for East Beach presented in Table 5.8 are consistent with the rates presented in previous assessments by Rosengren (Environmental GeoSurveys, 2005) and Carley (2008c). Over the very long term ( ), Rosengren suggested 20 to 40 m recession based on comparison of imagery/maps, which translates to recession rates of 0.15 to 0.29 m/year. Carley found similar recession rates over this period ( ) and slightly higher rates of 0.23 to 0.31 m/year over the period Human Activities The aim of this section is to establish a brief history of the development of the port facilities at Port Fairy and identify some of the possible causes of the erosion/recession problems on East Beach Port Development The purpose of this section was to establish a chronology of the development and maintenance of the port of Port Fairy as well as of the various coastal protection works on East beach. The authors would like to thank Mr Marten Syme and Mr Max Dumnesy for their invaluable contributions on the history of Port Fairy. The Aboriginal people have been living in south-eastern Australia for at least 40,000 years and in the Port Fairy area about 10,000 years (MSC, 2004). Port Fairy is part of the traditional landscape of two Aboriginal clans of the Dhauward wurrung (Gundidjmara) Language Area. This tribe extended from the Glenelg River in the west to the Hopkins River in the east. These two clans, Mallun gundidj and Pyipgil gundidj occupied the Port Fairy Township and Griffiths Island areas and were Peekwoorroong speakers. The first Europeans that the Peekwoorroong met were probably whalers and sealers who seasonally frequented the coast. Sealers had been on the coast as early as 1810 and were soon joined by whalers (MSC, 2004). Port Fairy was established as a whaling station in the early 1800s and operated until the 1850s, after which the activity was reported to decline. James Atkinson, who had purchased the freehold of the three islands (Goat, Griffiths and Rabbit Islands), arranged in 1847 for the construction of a basalt breakwater between the northern coastline of Griffiths and Rabbit Islands, along the river channel. This protection work was however destroyed during a storm before its completion. The Victorian Colonial Government purchased the islands from Atkinson around 1858 and arranged for the erection of a lighthouse on the eastern coast of Griffiths Island (Rabbit Island at the time), completed in A new breakwater, joining Griffiths and Rabbit Islands on the Moyne River side, was constructed from quarried basalt rocks during the same period. The construction of this breakwater is believed to have progressively led to a build-up of sediment in between the two islands, a change which was accelerated by depositing the spoil from the dredging of the Moyne River. Following a first survey of the port in 1853 by John Barrow, it was proposed by Moriarty (Engineer of NSW) that training walls be built on the Moyne River in order to improve navigation conditions. The construction of the walls did not begin until 1869, with initial work localised around Goat Island and extending into the bay. Additional work also consisted of removing a WRL Technical Report 2012/21 April 2013 FINAL 46
65 limestone and rock reef from the river bed as well as dredging through a sand bar at the mouth of the river. It is reported that most of the basalt rock used for the construction of the training wall came from quarries located on Griffiths Island. Transportation of the quarried rock and dredge spoils from the mainland to the island was facilitated by the construction of a wooden bridge and viaduct around 1869 (see Figure 5.13). In 1878, Sir John Coode (Chief Engineer of the British Admiralty) proposed modifications to the design of the entrance works consisting of deepening and widening of the river channel and the swing basin near the entrance. Another major modification was to change the alignment of the walls on the southern side of the river, in the vicinity of Goat Island, in order to improve the merging of the currents from the Southwest Passage into the Moyne River, as well as to facilitate the flushing of the river silt into the bay. The new alignment of the walls led to the establishment of the low lying area referred to as Puddeny Grounds. Following a subsequent visit of Coode in 1886, it was decided to extend the training walls further into the bay as well as to change their alignment. It is reported that Coode s recommended alignment of the walls was never respected, and that the final construction led to the walls pointing almost 20 degrees south from Coode s recommended design. Coode also recommended partially closing the Southwest Passage with the installation of sluice gates which would improve navigation by reducing wave-induced currents. While the extension work of the training walls was reported to take place as early as in 1888, it would appear that no work concerning the closure of the Southwest Passage was undertaken until the early 1910s, with a first mention of the Southwest Passage being sealed off from the river by a causeway in It is believed that the main reason for the closure of the Southwest Passage was due to the running aground in 1909 of the Eumeralla steamer, caused by the surging currents of the passage. Additional work on the Southwest Passage causeway and the Puddeny Grounds was reported in 1914 to prevent sand migration through the walls in the river. (see Figures 5.14 and 5.15). Erosion/recession on East Beach foreshore appeared to be already problematic before the closing of the Southwest Passage, as extensive erosion near Battery Hill was reported as early as 1881 and again As a result, the building of a basalt breakwater extending from the northern training wall, was recommended by the Ports and Harbours in The 250 m long breakwater was reported to be completed by Severe erosion events are reported to have occurred in the 1920s and 1930s. Photographs of East Beach in the 1920s and 1930s are provided on Figure East Beach was found to temporarily accrete after the Southwest Passage was partially opened in 1946, with an accidental breach of about 3 to 4 m width. However, due to the persistent problem of the river silting up as well as access to Griffiths Island, the Southwest Passage was sealed off once more by The causeway joining Griffiths Island to the mainland was rebuilt in its current design in 1969 to protect the crossing of a sewerage outfall pipe. It is important to note, that numerous public petitions were signed in the 1950s to keep the passage open in the belief that this would improve both the erosion/recession problem on East Beach and have potential benefits for fishing. The building of the rock revetment on East Beach began in 1953 around Bourne Avenue with the placement of about 100 tons of stone by the Port Authority and continued further south, near Battery Hill in 1954 (600 tons of rock). While some localised work was performed along East WRL Technical Report 2012/21 April 2013 FINAL 47
66 Beach, the next major work on East Beach began in 1962 and continued until the 1970s with the placement of over 2000 tons of rock placed on the beach. The wall was progressively extended north until the 1980s and locally reinforced with larger basalt rocks. Extensive work was performed in 1993 on the foreshore of the SLSC, with placement of additional rock on the seawall and levelling of the dune in its lee (see Figure 5.17). Further south from the SLSC, four wooden groynes were installed on East Beach in 1970 along a 300 m stretch between Roger Place and Lydia Place (see Figure 5.17). While they were reported to function well in the early 1980s, no maintenance work was performed on these assets and they now stand in poor condition Sand Accumulation around the Moyne River Entrance As explained in Section 5.8.1, both Griffiths Island and East Beach have experienced considerable changes since the development of the Port Fairy township from 1850 and the building of the Moyne River training walls, as well as the closure of the Southwest Passage. The construction of the training walls most likely had an influence on overall sediment transport along East Beach and around Griffiths Island. This section reports on the outcomes of a volumetric analysis of the sand accumulation in the Moyne Rover entrance. The analysis compared the 1854 Barrow Chart (see Figure 5.18), the 1870 Stanley Chart (see Figure 5.19), available aerial photography and 2007 LIDAR data. The earliest recorded important modification to the shoreline configuration was the joining of Griffiths and Rabbit Islands, as early as 1870, as can be observed on Stanley Chart. As mentioned in the chronology of the port development, it is believed that a significant proportion of the sediment in the location that was originally the channel in between Rabbit Island and Griffiths Island, is the result of the placement of the dredge spoils from the Moyne River channel. Estimation of the total volume of accumulated sand on Griffiths Island is a complex exercise due to the limited available information concerning this precise area and the potential combined influence of offshore sediment transport and the early placement of dredge spoils. The area previously located between Griffiths and Rabbit Island is approximately 12,000 m 2 and, based on average sand depth of 3 m, contains 36,000 m 3 of sand. The analysis of the historical nautical charts and aerial photography revealed that the construction of the Moyne River training walls caused considerable sediment build up on South Mole Beach from the 1850s. This is mainly due to the blocking effect of the walls on the longshore sediment transport around Griffiths Island, resulting in a potential net loss in sediment transport along East Beach. South Mole Beach has been estimated to have increased in area by 90,000 m 2 and, based on an average sand depth of 3 m, contains 270,000 m 3. A result of the construction of the training walls in the Southwest Passage has been the enclosure of an area west of Griffiths Island, referred to as Puddeny Grounds. Records show that sand has progressively accumulated here due to the combined influence of wind, seepage below and through the walls, as well as the deposition of dredge materials. The area of Puddeny Grounds is approximately 45,000 m 2 and, based on average sand depth of 2 m, contains 90,000 m 3 of sand. WRL Technical Report 2012/21 April 2013 FINAL 48
67 The area within the Southwest Passage, on either side of the causeway, has not been dredged in recent years. Based on the analysis of the nautical charts and 2007 LIDAR, it has been estimated that approximately 60,000 m 3 of sand has accumulated here over the years. The area nowadays referred to as Sandy Cove Reserve was once a shallow inlet, probably subjected to tidal flooding, connecting the Moyne River mouth and the ocean. Extensive works in the 1980s resulted in the area being filled and Ocean Drive constructed as a sealed road. The area of the previous Sandy Cove inlet is approximately 150,000 m 2 and, based on an average sand depth of 1.5 m, contains 230,000 m 3 of sand. Analysis of the charts and aerial photography shows that the area around Battery Hill on the northern side of the Moyne River has considerably evolved across the years. Extensive works were reported at the turn of the twentieth century to prevent erosion, resulting in the construction of the breakwater. It was, however, not possible to estimate the total volume of accumulated sand due to the combined effects of civil works and coastal erosion. Table 5.10 Estimation of Accumulated Sand Volumes (between and 2010) Location Area (m 2 ) Volume (m 3 ) Between Griffiths and Rabbit Island 12,000 36,000 South Mole Beach 90, ,000 Puddeny Grounds 45,000 90,000 Southwest Passage - 60,000 Sandy Cove 150, ,000 TOTAL 686,000 The total volume of accumulated sand around the Moyne River entrance has been estimated at 700,000 m 3 or 500,000 m 3 if Sandy Cove is not considered. These volumes of accumulated sand are consistent with the volumes presented in WBM (1996 and 2007). It is likely that most of this sand would have naturally been supplied to East Beach in the absence of the Moyne River training walls and can be considered to have been lost from the East Beach system. The associated loss in yearly sand transport rate to East Beach, averaged over the 150 years period, is estimated to range from 3,300 m 3 /year to 4,600 m 3 /year Moyne River Dredging Dredging of the river is reported to have been undertaken as early as the 1870s and continues to be required throughout much of the year so that navigable depths are maintained. The main sources of sand building up within the Moyne River are the following: Sand entering through the river entrance; Sand seeping through causeway closing the Southwest Passage; Sand seeping through the training walls along Griffiths Island, South Mole Beach and Battery Hill; Windblown sand from Griffiths Island. WRL Technical Report 2012/21 April 2013 FINAL 49
68 Dredging is nowadays usually undertaken 6 months of the year along the river entrance and previously in the Southwest Passage. While no detailed report exists, it was estimated by the Port Authority that 30,000 to 50,000 m 3 of sand are dredged from the river each year, mostly from sand bars near South Mole Beach (BMT WBM, 2007). It should be noted that these numbers are only estimates and no exact volumes were available at the time of the study. Historically, this sand has been predominantly placed at the southern end of East Beach. While sand dredged from the river side of the Southwest Passage was initially placed within the Puddeny Grounds, this practice was stopped in the early 1990s and the dredged sand is now placed at the southern end of East Beach East Beach Sediment Budget Analysis Previous Investigations Coastal Engineering Solutions (CES, 2006) performed extensive modelling of the longshore sediment along East Beach. The modelling was undertaken for a period of 7.5 years at three locations (i.e. Port Fairy SLSC, near the Night Soil site and near the Old Municipal Tip). The yearly gross volume of sand transport was observed to vary greatly between the different locations, ranging from 43,000 m 3 /year at Port Fairy SLSC to 132,000 m 3 /year eastwards near the Old Municipal Tip. The net yearly movement of sand was found to be constant along East Beach and estimated at 20,000 m 3 /year eastwards. BMT WBM completed sand transport modelling of the East Beach embayment and of the offshore areas using the RMA10S software (BMT WBM, 2007). This software primarily calculates sediment transport due to currents rather than waves. The main conclusions from the modelling were that there was a net drift of sand towards the north east of East Beach. The modelling showed that the predominant pathway for the sand supply into East Beach was around the lighthouse headland on Griffiths Island, with the Southwest Passage being only a secondary pathway. The sand supply on East Beach was found to be partially obstructed by the training walls on South Mole Beach and by the Moyne River. In their peer review of the 2007 BMT WBM coastal erosion study of East Beach, Aurecon (2010) assessed the sediment losses along East Beach to range from 3,500 m 3 /year to 7,900 m 3 /year. The lower end of this range was reported to be consistent with the accretion rate observed on Lighthouse Beach, while the higher end of the range suggested a potential background recession of 0.05 to 0.1 m/year in addition to the training wall induced recession Sediment Budget Analysis Based on the results of the long term recession analysis in Section 5.7.3, the recession rates along East Beach were estimated to be at 0.1 and 0.4 m/year over the 1870 to 2010 period. By assuming that the bulk of the recession is currently occurring between the northern end of the rock revetment up to the Mills Reef beach access, an overall length of approximately 3 km, the total sand volume losses are estimated to be of the order of 2,100 m 3 /year to 8,400 m 3 /year. A comparison of these volumetric recession rates with the potential loss in sediment transport due to the sediment accumulation at the Moyne River entrance, indicates a deficit of up to 5,000 m 3 /year in sand supply on East Beach. This implies that underlying recession of up to WRL Technical Report 2012/21 April 2013 FINAL 50
69 0.20 m/year is currently occurring at East Beach and that the shoreline evolution is potentially not only the result of the construction of the Moyne River training walls. Such underlying recession can be explained by the fact that the shape of East Beach Port Fairy Beach is termed a crenulate or zeta planform. The asymmetry indicates a net littoral drift from west to east, which is consistent with the predominant west to south-west wave climate. The qualitative long term evolution of a zeta planform is shown in Figure 5.9. The maximum indentation of the East Beach embayment between the two main coastal control points of the lighthouse point on Griffith Island and Reef Point is about 1.7 km. If the bay is assumed to have formed over the past 6000 years, this gives a recession rate of 0.28 m/year. This is somewhat speculative, but appears consistent with the estimate established from the volumetric recession rates. It is not possible to further assess the validity of the previously estimated net sediment transport rates along East Beach in the absence of reliable sand dredging data Summary of Coastal Processes in the Port Fairy Study Area The following coastal processes were considered within the constraints of available data and project resources for the Port Fairy Study area: Astronomical tides (predicted tides); Tidal anomalies, through barometric setup and wind setup; Ocean swell waves; Wave setup; Wave runup on beaches and overtopping; Longshore sand transport (littoral drift); Offshore sand transport (beach erosion caused by storm demand); Influence of human activities. The coastal processes around the Port Fairy coastline are complex due to the influence of the Moyne River estuary, a complex headland topography and the influence of human activities around the Moyne River estuary. A summary of the main coastal process is provided below: The predominant wave climate is west to south-west with large average and extremes on exposed coast; The most extreme wave climate in East Beach embayment was found to be originating from the southeast, due to sheltering effect from Griffiths Island on the south-west swell; Tide levels and associated storm surge are relatively small by Australian standards; East Beach and most of the smaller pocket beaches on the Western coastline are zeta planform, indicative of net littoral drift from west to east; Most of the pocket beaches on the Western coastline are protected from wave action by offshore rock platforms; This resulting in relatively low erosion volumes caused by storm demand; The un-protected section of East Beach is receding at an underlying rate between 0.1 and 0.3 m/year over 150 years; Sediment budget analysis indicate that East Beach could still be naturally receding in addition to the impacts of the training walls; WRL Technical Report 2012/21 April 2013 FINAL 51
70 The Moyne river training walls have disrupted the natural sediment transport pathway from the west; with substantial sediment accumulation on the southern mole; Analysis of the accumulated sand volumes indicate that the predominant sediment pathway is around the lighthouse headland on Griffiths Island. Section 5 Key Findings The predominant wave climate is west to south-west with large average and extremes on the exposed coast; Tide levels and associated storm surge are relatively small by Australian standards; East Beach and most of the smaller pocket beaches on the Western coastline are zeta planform, indicative of net littoral drift from west to east; Most of the pocket beaches on the Western coastline are protected from wave action by offshore rock platforms, resulting in relatively low erosion volumes caused by storm demand; The unprotected section of East Beach has been receding at an underlying rate between 0.1 and 0.3 m/year, equivalent to 3,300 m 3 /year to 4,600 m 3 /year, measured over 150 years; The Moyne River training walls have disrupted the natural sediment transport pathway from the west; with substantial sediment accumulation on the southern mole; Sediment budget analysis indicates that East Beach could still be naturally receding in addition to the impacts of the training walls; and Analysis of the accumulated sand volumes indicates that the predominant sediment pathway is around the lighthouse headland on Griffiths Island. WRL Technical Report 2012/21 April 2013 FINAL 52
71 6. Coastal Erosion Hazards Setbacks 6.1. Introduction In accordance with the recommendations within the Victorian Coastal Hazard Guide (DSE, 2012), coastal hazard lines were identified for the present condition and for the 2050, 2080 and 2100 planning horizons including sea level rise projections (0.4 m for 2050, 0.8 m for 2080 and 1.2 m for 2100 respectively). Figure 6.1 presents the method for estimation of the present day and future position of the coastal hazard lines diagrammatically for the sandy beaches investigated in the present study. The landward limit of the coastline hazard zone corresponds to the estimated position of the backshore erosion scarp for the subject planning period. The present day hazard line position was obtained considering the erosion hazard due to storm demand and allowing for slope instability. The future hazard line (for the 2050, 2080 and 2100 planning horizon) was estimated by adding the underlying shoreline recession and the sea level rise induced shoreline recession. As shown in Figure 6.1, four key components of coastal setback were defined in this study and incorporated into the hazard line, namely: S1: Allowance for short term storm erosion (storm demand); S2: Allowance for dune stability (Zone of Reduced Foundation Capacity ZRFC as defined by Nielsen et al., 1992); S3: Allowance for ongoing underlying recession; and S4: Allowance for recession due to future sea level rise. The total design setback (S) for three planning horizons comprises: Present day: S = S1 + S2; 2050: S = S1 + S2 + S3(2050) + S4(2050); 2080: S = S1 + S2 + S3(2080) + S4(2080); and 2100: S = S1 + S2 + S3(2100) + S4(2100). A large section of East Beach is backed by a seawall. Assuming the seawall will not fail during an extreme storm event, the erosion hazard lines will coincide with the present seawall location. Storm demand was also calculated at two locations (East Beach SLSC and East Beach South) without the seawall in order to estimate the potential hazard should the seawall fail. As noted in Section 3.3, while rock revetments were observed to be present on Pea Soup Beach and VIC 516 beach, they were not considered to be present during the determination of the coastal erosion hazard lines, as these assets are not maintained by the MSC or DSE. Stormwater erosion is a relatively minor hazard in Port Fairy. There are no large conveyance structures discharging directly onto sandy beaches. There are several mid sized discharge structures on Ocean Drive Beach and near Pauling Street (Figures 3.10 and 3.11), however, the additional erosion resulting from these is minor as they extend into the water and/or the shoreline is generally rocky. Water quality from discharged stormwater is likely to be a hazard, but is beyond the scope of this study. WRL Technical Report 2012/21 April 2013 FINAL 53
72 It is recognized that the coastline around the Port Fairy study area can be subdivided into two distinct sub-groups: sandy beach systems, and bluffs and cliffs comprising rock or other consolidated material. Rocky cliff instability and potential geotechnical hazards were not considered in this study as these would involve a geotechnical and geological assessment, which was beyond the present scope of works. The stretches of coastline consisting of rocky cliffs were highlighted in the coastal hazard mapping in order to clearly indicated coastal zone requiring further specific geotechnical investigation. The landward extent of the highlighted zone for rocky cliff shoreline was based by recommended setbacks values for the Victorian coastline (Carley and Cox, 2008) 6.2. Short Term Storm Erosion (S1) Overview Beach erosion relates to the erosion of the beach by a single extreme storm event or from several storm events in close succession (see Section 5.7.2). Design storm demands for the beaches of the Port Fairy study area were assessed by SBEACH numerical modelling (Carley and Cox, 2003) Profiles SBEACH was applied to the beach profiles obtained from the LIDAR 2007 data at the transect locations provided in Figures 5.3 to 5.8. While these profiles provide a snapshot of the beach profile, the profile would in fact be changing in time. Ideally, the model would be calibrated and verified against field measurements of erosion in the study area. However, these were not available. Nevertheless, WRL has successfully utilised SBEACH at numerous locations the model considers all the main physical processes relevant to storm erosion. SBEACH has been verified extensively for measured storm erosion on the Australian east coast, including at Warilla, Narrabeen and Wamberal (Carley, 1992), and at the Gold Coast (Carley et al., 1998). The influence of underlying bedrock on erosion estimates was accounted for by including a hard bottom in SBEACH (Figure 6.5). The position of this hard bottom relative to present ground levels was determined using the geotechnical survey of East Beach (see Section 3.7) and the analysis of 2010 aerial photography and LIDAR data for other locations. Conservatively, a shore wave normal direction was considered when implementing the SBEACH model. WRL Technical Report 2012/21 April 2013 FINAL 54
73 Table 6.1 Bedrock Depths Used in SBEACH Representative Profile Location Bedrock Depth (m AHD) Source Western Coastline Cape Reamur 0 Unnamed 7 (VIC 521) 0 Unnamed 6 (VIC 520) 0 Unnamed 5 (VIC 519) 0 Unnamed 4 (VIC 518) 0 Unnamed 3 (VIC 517) 0 Unnamed 2 (VIC 516) 0 Ocean Drive 1 Pea Soup 0 South Beach -1 Site/LIDAR estimate Griffiths Island Griffiths Island Beach 0 Site/LIDAR South Mole -3 estimate East Beach East Beach South -5 East Beach SLSC -5.5 East Beach Dune Breach -8.5 East Beach Night Soil Site -8.5 East Beach Old Municipal Tip -8.5 East Beach North -4 Geological Survey Eastern Coastline Reef Point -5 Site/LIDAR Killarney Beach -2.5 estimate Water Levels For storm erosion modelling purposes, a Mean High Water Spring (MHWS) tide time series was assumed, to which a tidal anomaly was added, such that the peak water level corresponded to the ARI of the storm (1.03 m AHD for 50 year ARI, 1.02 m AHD for 100 year ARI). For modelling purposes a symmetrical shape of the anomaly was assumed, with the peak in predicted tide and tidal anomaly assumed to coincide with the peak wave height of the storm. These assumptions are somewhat conservative but not unreasonable since intense low pressure systems are responsible for large waves, strong winds and storm surge. The assumptions could be revised with additional data and joint probability analyses Wave Heights The peak significant wave height for each location is shown in Appendix A Table A-10. Duration and temporal characteristics of the design storms used in SBEACH were based on the results of the analysis by Shand et al., (2011a) for the Cape Sorell and Cape du Couedic buoys. Synthetics storms for the 50 year ARI and for the 100 year ARI events were created for each of the offshore wave climate conditions given in Table 5.5 and propagated to the nearshore using the SWAN model, at each of the transects locations. Examples of the offshore synthetic storms for two of the directions used in SWAN are provided in Figure 6.4. As described below, two 100 year ARI storm events were run back to back to determine a design erosion volume. Conservatively, a shore wave normal direction was considered when implementing the SBEACH model. WRL Technical Report 2012/21 April 2013 FINAL 55
74 Design Erosion Event and Storm Clustering Carley and Cox (2003) found that SBEACH could model recorded erosion events for which data was available, but when a rational 100 year ARI (1% AEP) design storm was applied, the predicted erosion volumes were less than reported values (for which reliable wave data was not available (Gordon, 1987; Thom and Hall, 1991). Further investigation indicated that this was due to sequences (clusters) of storms causing major erosion rather than a single storm. Storm clustering has a significant impact on both the interpretation of the ARI of storm waves, but more importantly on the cumulative impact upon beaches, dunes and estuarine inlets. The relationship between the ARI of storm characteristics to the ARI of physical storm impacts is likely to be statistically heterogeneous between individual and clustered storm events. The ARI magnitude of the first storm in a sequence of storms preconditions the sediment storage on the beach and shoreface for the impact of the subsequent storms. When extreme storm sequences occur within short time-scales of a few weeks to a month, beach and upper shoreface recovery to initial storm erosion is minimal. Hence, a 1 in 10 year ARI storm may produce a 1 in 100 year ARI beach erosion if preceded by an equivalent or more extreme storm. Storm clusters that occur over a longer time-scale such as a season may have a less extreme physical impact since there is time for the shoreface to reach an equilibrium with the persistent storm wave energy. Additional studies of clustering could be undertaken, but are not part of this study and no analysed data is readily available to feed into erosion modelling. There have been some attempts at other locations to determine appropriate design storm clusters (Gold Coast and Sydney), but these are not applicable for Port Fairy. This same issue led the WA Government (2003) to specify that three back to back design storms (nominally 100 year ARI, 1% AEP) be run through SBEACH (or similar models) to determine the storm erosion component setback for coastal planning, with a default value of 40 m for this component. Within the realms of the modelling undertaken and the paucity of historical data, there are three suggested options to define the design erosion event from storms: A single 50 or 100 year ARI storm event; 2 x 50 or 100 year ARI events (less erosion than a doubling of single storm due to asymptotic behaviour); 3 x 50 or 100 year ARI events (WA, 2003 policy). Based on the experience of this report s authors, their engineering judgement, and consultation with Port Fairy s Technical Review Panel for this project, it was elected to model design erosion volumes using 2 x 50/100 year ARI storm events. This is a balanced position, between the use of a single storm and three storms. Subject to the assumption made on storm clustering, the actual ARI of two closely spaced 100 year ARI storms could range from 200 to 100,000 years. However, the purpose of using two closely spaced 50/100 year ARI storms in SBEACH modelling is to model a sequence of lesser storms which have been observed to cause design erosion volumes on well monitored beaches (e.g. Gordon, 1987; Thom and Hall, 1991), while still properly considering the wave exposure of each beach. WRL Technical Report 2012/21 April 2013 FINAL 56
75 SBEACH Model Results An example of model input and output is shown in Figure 6.5. The results are presented for each beach in Table 6.2 and Table 6.3 for the 50 and 100 year ARI events respectively. Table 6.2 Design Storm Demands for 50 Year ARI Event Representative Profile Location Volume of Storm Demand (m 3 /m) SBEACH Modelling 1 50 year 2 50 year 3 50 year ARI Event ARI Event ARI Event Adopted 50 year ARI Storm Erosion Cape Reamur Unnamed 7 (VIC 521) Unnamed 6 (VIC 520) Unnamed 5 (VIC 519) Unnamed 4 (VIC 518) Unnamed 3 (VIC 517) Unnamed 2 (VIC 516) Ocean Drive Pea Soup South Beach Griffiths Island Beach South Mole East Beach South (1) East Beach SLSC (1) East Beach Dune Breach East Beach Night Soil Site East Beach Old Municipal Tip East Beach North Reef Point Killarney Beach Notes: (1) Storm demand was calculated without the presence of the existing rock revetment backing the beach. WRL Technical Report 2012/21 April 2013 FINAL 57
76 Table 6.3 Design Storm Demands for 100 Year ARI Event Representative Profile Location year ARI Event Volume of Storm Demand (m 3 /m) SBEACH Modelling year ARI Event year ARI Event Adopted 100 year ARI Storm Erosion Cape Reamur Unnamed 7 (VIC 521) Unnamed 6 (VIC 520) Unnamed 5 (VIC 519) Unnamed 4 (VIC 518) Unnamed 3 (VIC 517) Unnamed 2 (VIC 516) Ocean Drive Pea Soup South Beach Griffiths Island Beach South Mole East Beach South (1) East Beach SLSC (1) East Beach Dune Breach East Beach Night Soil Site East Beach Old Municipal Tip East Beach North Reef Point Killarney Beach Notes: (1) Storm demand was calculated without the presence of the existing rock revetment backing the beach. The erosion volumes shown in Table 6.2 and Table 6.3 are low by Australian open coast standards (Gordon, 1987; NSW Government, 1990; Carley and Cox, 2003; Mariani et al., 2012). Mariani et al. (2012) assessed numerically storm erosion volumes on open coast, sandy beaches along the Australian coastline. Their suggested design storm erosion volumes for beaches on the open coastline between Port Campbell and Portland was of 200 m 3 /m and 150 m 3 /m for the coastline from Lonsdale to Lorne Coast. The lower volumes and variability across the study area may be due to the following factors: The protection from wave action offered by offshore rock platforms on the open-coast, which act as natural submerged breakwaters during coastal storms; The relatively smaller wave conditions reaching East Beach and other beaches facing towards the east in comparison to beaches exposed to more energetic south-west swell; The small tidal range and low extreme storm surge level compared with other locations; The large store of sand high in the dune which feeds the eroding base; The low gradient surf zone with fine grained sand (for volumes less than 50 m 3 /m). The volumes calculated for the East Beach sites near the end of the rock revetment are larger than the estimates of CES (2006) and Carley (2008), which were around 30 m 3 /m. This WRL Technical Report 2012/21 April 2013 FINAL 58
77 difference may be explained by the more precise surf zone bathymetry used in the present study as well as the more complex wave transformation modelling providing an improved estimate. It should also be noted that for some locations modelled in SBEACH, the 50 year ARI conditions ended with slightly larger storm demands than the 100 year ARI conditions (i.e. Cape Reamur, East Beach Old Municipal Tip, Reef Point). This result can be explained by the offshore rock platform acting as a natural breakwater triggering wave breaking for the 100 year ARI conditions. A conservative approach was adopted for these specific cases, with the storm demand of the 50 year ARI conditions kept for the 100 year ARI conditions Zone of Reduced Foundation Capacity and Stable Foundation Zone (S2) The Zone of Reduced Foundation Capacity hazard for each studied site was calculated by the method of Nielsen, Lord and Poulos (1992). This method delineates a Stable Foundation Zone and a Zone of Reduced Foundation Capacity as shown in Figure 6.2. In this method, buildings constructed seaward of the Stable Foundation Zone (SFZ) need to be constructed on piles due to the reduced bearing capacity in the Zone of Reduced Foundation Capacity (ZRFC). The indicative width of the Zone of Reduced Foundation Capacity (S2 ZRFC) is provided for a range of ground levels in Table 6.4. Table 6.4 Width of Zone of Reduced Foundation Capacity at Each Coastline Sub-Section Representative Profile Location Dune Crest Level (m AHD) Width of ZRFC at Surface (m) Cape Reamur Unnamed 7 (VIC 521) Unnamed 6 (VIC 520) Unnamed 5 (VIC 519) Unnamed 4 (VIC 518) Unnamed 3 (VIC 517) Unnamed 2 (VIC 516) West (1) Unnamed 2 (VIC 516) East (1) Ocean Drive Pea Soup South Beach Griffiths Island Beach South Mole East Beach South East Beach SLSC East Beach Dune Breach East Beach Night Soil Site East Beach Old Municipal Tip East Beach North Reef Point Killarney Beach Notes: (1) Due to the difference in the crest elevation of the dune system in the lee of the beach, ZRFC width at VIC 516 was calculated for two specific beach sections; East refers to the beach section backed with development, West refers to the beach section with no development (see Figure 6.3). WRL Technical Report 2012/21 April 2013 FINAL 59
78 Note that a more detailed site specific geotechnical study, which may include soil testing, may determine a different value for the setback associated with the ZRFC than the generic values used in this report Ongoing Underlying Recession (S3) Ongoing underlying recession is the progressive onshore shift of the long term average land-sea boundary which may result from sediment loss. It is expressed in terms of change over years in volume of sand within the beach fronting the seawalls (m 3 /m/year) and/or corresponding landward shoreline movement (m/year). This component of the coastal erosion was developed in Section 5.7. Recession rates due to sediment loss around the Port Fairy coastline were mostly derived through the analysis of long term changes in the location of the vegetation line using the available aerial photography, photogrammetry analysis and analysis of long term shoreline evolution using historical charts. The adopted recession rates for this study are given in Table 5.9. The resulting horizontal setbacks due to underlying recession (S3) were calculated for each beach and for the different planning periods. No discounting of ongoing underlying recession (S3) due to sea level rise recession (S4) has been performed over the monitoring period Sea Level Rise Recession (S4) Bruun Rule The most widely known model for beach response is that of Bruun (1962). The Bruun model (as separately defined from the Bruun Rule) assumes that as sea level rises, the equilibrium profile is moved upward and landward conserving mass and the original beach shape (Figure 6.6). This occurs by the following assumptions (SCOR, 1991): 1. The upper beach is eroded due to the landward translation of the profile; 2. The material eroded from the upper beach is transported immediately offshore and deposited, such that the volume eroded is equal to the volume deposited and, 3. The rise in the nearshore bed as a result of this deposition is equal to the rise in sea level. This rule is based on the concept that the existing beach profile is in equilibrium with the incident wave climate and existing average water level. It is a simple concept, which assumes that the beach system is two-dimensional and that there is no interference with the equilibrium profile by headlands and offshore reefs. The Bruun rule is typically expressed as: SLR* X R h d c where R is horizontal recession (m); SLR is sea level rise (m); X is the horizontal distance between h and d c ; h is active dune/berm height (m); d c is profile closure depth (m, expressed as a positive number). WRL Technical Report 2012/21 April 2013 FINAL 60
79 This is frequently simplified to R BF * SLR where R is horizontal recession (m); BF is the Bruun Factor, being a function of X, h and d c. As the rule is governed by simple, two-dimensional conservation of mass principles it is limit in its application by a number of aspects: 1. The rule assumes that there is an offshore limit of sediment exchange or a closure depth, beyond which the seabed does not rise with sea level. 2. The rule assumes no offshore or onshore losses. 3. The rule assumes instantaneous profile response following sea level change. 4. The rule assumes an equilibrium beach profile where the beach may fluctuate under seasonal and storm-influences but returns to a statistically average profile (i.e. the profile is not undergoing long-term steepening or flattening). This being stated, the precise configuration of the profile is irrelevant, provided it is maintained as water level changes (SCOR, 1991). 5. The rule does not accommodate variations in sediment properties across the profile or profile control by hard structures such as substrate geology or adjacent headlands or engineered structures. The next section briefly describes a number of shoreline response models in use in Australia before describing the model adopted for this study, the methodology employed and the model results. Readers are referred to SCOR (1991) and Ranasinghe et al. (2007) for more complete reviews of available methods Profile Closure Depth and Bruun Factor Calculations For a given sea level rise and profile, the only contentious variable in the Bruun rule is the closure depth (d c ) for which various formulations and methods exist. The method of Hallermeier (1978, 1981, 1983) is one of the most widely accepted for defining closure depths, as it is based on site specific physical characteristics and processes. Hallermeier (1983) defined three profile zones, namely the littoral zone, buffer zone and offshore zone, and surmised that the actual closure depth falls somewhere between the seaward limit of the littoral zone (d inner ) and the offshore zone (d i ). Hallermeier suggests that the inner closure depth, d inner, is a function of sediment characteristics and local wave climate: d inner 2.28H 68.5( H / gt 2 2 s, t s, t s Where d inner is the closure depth below mean low water spring, H s,t is non-breaking significant wave height exceeded for 12 hours in a defined time period, nominally one year, and T s is the associated period. In the experience of WRL, where field data is not available, the most commonly used parameter for closure depth for application of the Bruun Rule in Australia is the seaward limit of the littoral zone d inner by Hallermeier (1981, 1983). ) Birkemeier (1985), based on the analysis of numerous beach profiles, evaluated Hallermeier s relationship and found a more appropriate relationship for his field data expressed as: WRL Technical Report 2012/21 April 2013 FINAL 61
80 d inner 1.75H 57.9( H / gt 2 2 s, t s, t s ) The Komar Geometric Model of Foredune Erosion (1997) was developed primarily for determining storm erosion during periods of elevated water level on the United States West Coast. However, the model is often also quoted with respect to assessing longer-term shoreline response to sea level rise. The general rule is similar to the Bruun Rule in that it is a twodimensional, geometric translation model which conserves mass. DE max ( WL H J ) BL tan Where WL-H J is the elevation of water level (WL) above the dune toe level (H J ), BL is the potential lowering of the profile due to storm erosion and tanθ is the slope of the beach face (Figure 6.7). This equation essentially reduces to the Bruun rule except the beach face slope is adopted rather than the slope to profile closure. An additional method was investigated to determine the Bruun Factor based on the seaward extent of the sediment obtained from the combined analysis of the 2010 aerial photography and bathymetry levels from the LIDAR. For this method, referred to as Sand Extent, the closure depth was taken as the depth of the outer boundary of the beach relative to MSL. The use of the Komar s method and analysis of the Sand Extent method allowed to take in account the potential influence of rock platform in the calculations for adopting an appropriate Bruun Factor. After discussion with the Project Team and the Technical Review Panel and based on the nature of the local coastline and bathymetry, a unique Bruun Factor value was adopted for each of the considered location. The calculated closure depths and associated Bruun Factor by the various methods are shown in Table 6.5. WRL Technical Report 2012/21 April 2013 FINAL 62
81 Table 6.5 Calculated Bruun Factors for the Study Area Calculated BF (-) BF Representative Adopted Profile Location Hallermeier Sand Birkemeier (-) Inner Komar Extent Cape Reamur Unnamed 7 (VIC 521) Unnamed 6 (VIC 520) Unnamed 5 (VIC 519) Unnamed 4 (VIC 518) Unnamed 3 (VIC 517) Unnamed 2 (VIC 516) Ocean Drive Pea Soup South Beach Griffiths Island Beach South Mole (2) East Beach South (2) East Beach SLSC (2) East Beach Dune Breach (2) East Beach Night Soil Site (2) East Beach Old Municipal Tip (2) East Beach North (2) Reef Point (1) Killarney Beach (1) Notes: (1) Due to significant differences in values obtained between the different methods, the results from Komar (1997) were adopted, as they are more suitable for the local bathymetry (offshore reef and rock platform). (2) A unique BF value was chosen for all locations on East Beach and South Mole Beach as this is consistent with the fact that an embayment is characterised by a unique Bruun Factor value Coastal Erosion Hazard Lines In order to calculate setback distances, contour levels were first established based on the elevation of the upper section of the frontal dune at each beach. These contours were calculated from the 2007 LIDAR topographic dataset obtained from DSE as presented in Table 6.6. Where appropriate, the +6 m AHD contour was used as a reference as it was considered to represent the coastal alignment reasonably. The crest of the rock revetment was used as the reference contour on the southern half of East Beach. For low-lying dune systems the +2 m AHD contour was used. The Storm Demand volumes (S1) were converted to horizontal distance setbacks hazard for each studied site using the method of Nielsen, Lord and Poulos (1992). WRL Technical Report 2012/21 April 2013 FINAL 63
82 Table 6.6 Contour Levels for Frontal Dune Top at Each Coastline Sub-Section Representative Profile Location 2007 Contour Level Used for Relative Setbacks (m AHD) Cape Reamur 6 Unnamed 7 (VIC 521) 6 Unnamed 6 (VIC 520) 6 Unnamed 5 (VIC 519) 6 Unnamed 4 (VIC 518) 6 Unnamed 3 (VIC 517) 6 Unnamed 2 (VIC 516) 2 Ocean Drive 6 Pea Soup 6 South Beach 2 Griffiths Island Beach 2 South Mole l East Beach South Rockwall East Beach SLSC Rockwall East Beach Dune Breach 6 East Beach Night Soil Site 6 East Beach Old Municipal Tip 6 East Beach North 6 Reef Point 2 Killarney Beach 2 The allowances for short term storm erosion and dune stability (S1 and S2) are shown in Table 6.7 for the 50 year ARI and Table 6.8 for 100 year ARI events respectively. The Tables also summarise the present day horizontal setback distances from the 2007 contour levels for these two different ARI events. WRL Technical Report 2012/21 April 2013 FINAL 64
83 Table 6.7 Allowances for S1 (50 year ARI), S2 and Present Day Associated Setbacks S1 S2 S =S1 + S2 Average Equivalent Width Representative Profile ground horizontal Present day Storm of ZRFC Location level distance horizontal Demand at behind relative to setback (m 3 /m) surface beach 2007 contour (m) (m) (m AHD) (m) Cape Reamur Unnamed 7 (VIC 521) Unnamed 6 (VIC 520) Unnamed 5 (VIC 519) Unnamed 4 (VIC 518) Unnamed 3 (VIC 517) Unnamed 2 (VIC 516) West (1) Unnamed 2 (VIC 516) East (1) Ocean Drive Pea Soup South Beach Griffiths Island Beach South Mole East Beach South (2) East Beach SLSC (2) East Beach Dune Breach East Beach Night Soil Site East Beach Old Municipal Tip East Beach North Reef Point Killarney Beach Notes: (1) Due to the difference in the crest elevation of the dune system in the lee of the beach, ZRFC width at VIC 516 was calculated for two specific beach sections; East refers to the beach section backed by development, West refers to the beach section with no development (see Figure 6.3). (2) Storm demand was calculated without the presence of the existing rock revetment backing the beach. WRL Technical Report 2012/21 April 2013 FINAL 65
84 Table 6.8 Allowances for S1 (100 year ARI), S2 and Present Day Associated Setbacks S1 S2 S =S1 + S2 Average Equivalent Width Representative Profile ground horizontal Present day Storm of ZRFC Location level distance horizontal Demand at behind relative to setback (m 3 /m) surface beach 2007 contour (m) (m) (m AHD) (m) Cape Reamur Unnamed 7 (VIC 521) Unnamed 6 (VIC 520) Unnamed 5 (VIC 519) Unnamed 4 (VIC 518) Unnamed 3 (VIC 517) Unnamed 2 (VIC 516) West (1) Unnamed 2 (VIC 516) East (1) Ocean Drive Pea Soup South Beach Griffiths Island Beach South Mole East Beach South (2) East Beach SLSC (2) East Beach Dune Breach East Beach Night Soil Site East Beach Old Municipal Tip East Beach North Reef Point Killarney Beach Notes: (1) Due to the difference in the crest elevation of the dune system in the lee of the beach, ZRFC width at VIC 516 was calculated for two specific beach sections; East refers to the beach section backed by development, West refers to the beach section with no development (see Figure 6.3). (2) Storm demand was calculated without the presence of the existing rock revetment backing the beach. WRL Technical Report 2012/21 April 2013 FINAL 66
85 The allowances for ongoing underlying (S3) and SLR (S4) recession for the 2050, 2080 and 2100 planning horizon are described in Table 6.9. Table 6.9 Allowances for Underlying and SLR Recession S3 S4 Representative Profile Location Underlying recession (1) (m/year) 2050 (m) 2080 (m) 2100 (m) BF Adopted (-) 2050 (m) 2080 (m) Cape Reamur na (2) na na na Unnamed 7 (VIC 521) na (2) na na na Unnamed 6 (VIC 520) na (2) na na na Unnamed 5 (VIC 519) na (2) na na na Unnamed 4 (VIC 518) na (2) na na na Unnamed 3 (VIC 517) Unnamed 2 (VIC 516) West Unnamed 2 (VIC 516) East Ocean Drive Pea Soup South Beach Griffiths Island Beach South Mole East Beach South na na na na East Beach SLSC na na na na East Beach Dune Breach East Beach Night Soil Site East Beach Old Municipal Tip East Beach North Reef Point Killarney Beach na (2) na na na Notes: (1) For beaches accreting, recession was conservatively considered nil. (2) No recession rate could be calculated due to the lack of available data (m) WRL Technical Report 2012/21 April 2013 FINAL 67
86 Table 6.10 summarises the present day, 2050, 2080 and 2100 horizontal setback distances from the 2007 (relative to LIDAR topographic data set obtained from DSE) contour levels. Table 6.10 Horizontal Setbacks for Present Day, 2050, 2080 and 2100 Planning Periods Representative Profile Location S (1) = S1+S2 Present Day (m) 2050 (m) S (1) = S1+S2+S3+S (m) 2100 (m) Cape Reamur Unnamed 7 (VIC 521) Unnamed 6 (VIC 520) Unnamed 5 (VIC 519) Unnamed 4 (VIC 518) Unnamed 3 (VIC 517) Unnamed 2 (VIC 516) West Unnamed 2 (VIC 516) East Ocean Drive Pea Soup South Beach Griffiths Island Beach South Mole East Beach South East Beach SLSC East Beach Dune Breach East Beach Night Soil Site East Beach Old Municipal Tip East Beach North Reef Point Killarney Beach Notes: (1) Horizontal distance is relative to 2007 LIDAR contour levels. Coastal erosion hazard lines for sandy beaches in the Port Fairy study area are shown for each sub-section in Section 11 (Coastal Hazards Mapping and Vulnerability Assessment) on Figures 11.1 to Both the scenarios, namely with rock revetment in place and rock revetment failure, were considered on the southern section of East Beach. The risk of salient loss on erosion hazard is highlighted at Cape Reamur (Figure 11.1), Unnamed 4 (VIC 518) beach (Figures 11.3 and 11.4) and Reef Point (Figures and 11.16). A salient is a localised sediment accretion, typically in the lee of an offshore structure such as a reef, island or breakwater, whereby the sediment build-up does not connect sub-aerially to the structure. While the extent and position of a salient can fluctuate according to tides, storms and seasonal variations in wave climate, future sea level rise is likely to have a greater impact on the shoreline alignment in the lee of the offshore structure. Future higher water levels could reduce the protective nature of the offshore feature causing the loss of the coastal area composing the salient. The well-established methods that are currently used to predict shoreline response to emergent structures, such as breakwaters (e.g., empirical relationships, desktop numerical models) are not suitable to investigate shoreline response to increased submergence of offshore reefs. Furthermore, the traditional methods used to estimate recession and erosion, such as the Bruun Rule or storm bite calculations, may underestimate the recession involved in salient loss. The areas highlighting the risk of salient loss were obtained by using the overall surrounding WRL Technical Report 2012/21 April 2013 FINAL 68
87 beach alignment, as this would likely be the natural position to which the shoreline would revert in the eventuality of salient loss. The risk of watercourse entrance instability has been highlighted at the western end of Unnamed 5 Beach (VIC 519) (Figure 6.10). The stretches of coastline dominated by rocky cliffs were highlighted in the coastal hazard mapping in order to clearly indicate coastal zone requiring further specific geotechnical investigation. A total setback value of 50 m was used throughout the study area based on the recommended values by Carley and Cox (2008) for Victorian coastal land. This setback distance comprised an allowance for erosion of cliff/rocks (0.04 m/year from Gill (1973)) and an allowance for slope stability using values recommended by the Australian Geomechanics Society (AGS, 2007). Due to the lack of warning for landslides, and the potentially severe consequences of failure, it is recommended that professional advice from a Geotechnical Engineer be sought where existing development exists on rocky coasts within the default setbacks setback zones. It should be noted that the presence of private seawalls at Pea Soup Beach and Unnamed 2 Beach (VIC 516) have been ignored as these coastal protection works are not maintained by MSC or DSE. In the event of rock revetment failure on East Beach, erosion will progress inland and allowances for this scenario were calculated and shown on Figures and Note that the erosion calculated adjacent to the northern end of the rock revetment included the influence of seawall end effects based on the current location of the rock revetment. Erosion would change should the rock revetment be extended further north. Section 6 Key Findings The following coastal erosion hazards were considered within the constraints of available data and project resources: - Beach erosion and dune stability; - Shoreline recession (long term change due to waves, sea level or sediment budget); - Rocky cliff or bluff instability (a generic setback was adopted for the study area). Four key components of coastal setback were defined in this study and incorporated into the hazard line, namely: - S1: Allowance for short term storm erosion (storm demand); - S2: Allowance for dune stability (Zone of Reduced Foundation Capacity); - S3: Allowance for ongoing underlying recession; and - S4: Allowance for recession due to future sea level rise. Modelling was performed with and without with the present rock revetment on East Beach. This showed that in the event of revetment failure, erosion will progress inland and potentially impact a large number of private properties and public assets. WRL Technical Report 2012/21 April 2013 FINAL 69
88 7. Coastal Inundation Determination 7.1. Overview Coastal inundation is the flooding of coastal areas by ocean waters. The inundation is due to elevated water levels coupled with extreme waves impacting the coast. Consequently, inundation levels along the coast are characterised by two components: A quasi-static component, which includes the effects of elevated water levels due to tide, storm surge and wave setup; and A dynamic component, which includes the effects of wave runup and wave overtopping caused by the direct impact of waves on the coastal structures. The bathtub inundation level is the most representative inundation level for areas located away from direct impact of the overtopping waves (generally those properties which are not in the front row facing the water) and based on the quasi-static component of the water levels. Wave runup and overtopping are a predictor of the wave impacts beachfront structures are likely to suffer during extreme storm events Coastal Inundation Zones Design water levels incorporating tide and storm surge were presented in Section 5.3 and derived from the CSIRO study on extreme water levels along the Victorian coast Guide (CSIRO, 2010). Wave setup varies along the Port Fairy beaches as it is intrinsically dependent on the wave conditions at each beach. For instance, East Beach will present a lower wave setup during west to south-west storms compared to the ocean beaches due to the typically lower incident wave conditions. Wave setup was calculated by implementing the Dean, Dally and Darlymple surf zone model (1984) locally at every representative location within the Port Fairy coastline using the nearshore wave modelling outputs as described in Section 5.5. Bathtub inundation levels were then derived by adding the calculated wave setup to the design water levels. The peak inundation events would persist for approximately 2 hours with the peak of the tide, however, subjected to topography, substantial ponding my remain in some areas after the peak. Predicted inundation levels incorporating astronomical tide, barometric setup, and wave setup for present day conditions are presented in Table 7.1. WRL Technical Report 2012/21 April 2013 FINAL 70
89 Table 7.1 Summary of Present Day Inundation levels (50 year ARI) Representative Profile Location Still water level (excluding wave setup) (m AHD) Wave setup (m) Present Inundation Level (m AHD) SWL SWL + Eastern Coastline East Beach Griffiths Island Killarney Beach Reef Point East Beach North East Beach Old Municipal Tip East Beach Night Soil East Beach Dune Breach East Beach SLSC East Beach South South Mole Griffiths Island Beach Western Coastline South Beach Pea Soup Ocean Drive Unnamed 2 (VIC 516) Unnamed 3 (VIC 517) Unnamed 4 (VIC 518) Unnamed 5 (VIC 519) Unnamed 6 (VIC 520) Unnamed 7 (VIC 521) Cape Reamur Notes: (1) These inundation levels are excluding wave runup and overtopping. WRL Technical Report 2012/21 April 2013 FINAL 71
90 Inundation levels for the different future SLR scenarios are presented in Table 7.2. Based on these inundation levels, mapping of inundation was undertaken using the 2007 LIDAR topographic data (provided by DSE) and GIS modelling. Inundation zones along the Port Fairy coastline for the 50 year ARI present day and 100 year ARI for the 2050, 2080 and 2100 planning horizon are shown in Appendix C, based on bathtub inundation levels incorporating astronomical tide, barometric setup, and wave setup. Table 7.2 Summary Inundation Levels for 2050, 2080 and 2100 Planning Horizons Eastern Coastline Representative Profile Location Wave setup (m) Future Inundation Levels (m AHD) (2) SLR = 0.4 m SLR = 0.8 m SLR = 1.2 m 100 year ARI Event 100 year ARI Event 100 year ARI Event Killarney Beach (1) (1) Reef Point (1) (1) East Beach East Beach North East Beach Old Municipal Tip East Beach Night Soil East Beach Dune Breach East Beach SLSC East Beach South Griffiths Island South Mole Griffiths Island Beach Western Coastline South Beach Pea Soup Ocean Drive Unnamed 2 (VIC 516) Unnamed 3 (VIC 517) Unnamed 4 (VIC 518) (1) (1) Unnamed 5 (VIC 519) (1) (1) Unnamed 6 (VIC 520) (1) (1) Unnamed 7 (VIC 521) (1) (1) Cape Reamur (1) (1) Notes: (1) After discussion with the Project Team and based on the amount and quality of available data, it was decided to create two distinct categories of coastline sub-sections. Determination of the coastal hazard and inundation zones was assessed for all three sea-level rise (SLR) scenarios on the coastline sub-sections between East Beach North and Unnamed 3 (VIC 516); while the remaining coastlines sub-sections were only studied for the present day and 0.8 m SLR scenarios only. (2) These inundation levels are excluding wave runup and overtopping. WRL Technical Report 2012/21 April 2013 FINAL 72
91 7.3. Wave Runup and Overtopping The majority of sandy beaches within the Port Fairy study area are backed by sand dunes, with the exception of a long section of East Beach, backed by a sloped rock revetment. For the beaches backed by a dune, wave runup was quantified using the method of Mase (1989) and expressed as run up levels in m AHD. For wave runup on beaches, the R2% values is the most commonly used, which is the runup exceeded by 2% of the waves. That is, two waves out of 100 will exceed the runup limit quoted. Wave runup at the rock revetment present on East Beach was quantified using best practice empirical prediction methods based on the most current published literature (EurOtop, 2007). Overtopping was quantified in terms of volume of water being discharged above the dune or rock revetment crest and expressed in L/s per metre length of crest. Wave overtopping was quantified for each structure taking into account the following factors: Structural characteristics of the rock revetment (construction type, crest level, slope etc.) or dune characteristics derived from the site inspection and the 2007 LIDAR; Nearshore wave conditions i.e. wave height and period as derived from the wave modelling exercise; and Elevated water levels calculated at each representative location incorporating tides, storm surge and wave setup. The estimated overtopping rates refer to the zone immediately behind the structure crest and can be related to the published tolerable rates (CEM, 2006, EurOtop, 2007) in regards to structure and safety of people. The range of mean tolerable overtopping rates for hazards relevant to the study area are presented in Table 7.3 (EurOtop, 2007). Crest levels are given as a range of values for the majority of locations in order to better assess the potential overtopping rates at low points along the dune or rock revetment crest. Table 7.3 Limits for Tolerable Mean Wave Overtopping Discharges (EurOtop 2007) Hazard type Code for Asset at Risk Mean Overtopping Discharge Limit (L/s per m) Aware pedestrian and or trained staff expecting P 0.1 to 10 to get wet Damage to grassed promenade behind seawall GP 50 Damage to paved promenade behind seawall PP 200 Structural damage to seawall crest S 200 Structural damage to building B 1 (1) Notes: (1) this limit relates to the effective overtopping defined at the building. It should be noted that all wave runup calculations implicitly include wave setup. The wave setup value listed in Section 7.2 is the most representative inundation level for areas located away from the foreshore, such as the properties which are not in the front row facing the ocean. The wave runup value is a predictor of rock revetment or dune overtopping and wave WRL Technical Report 2012/21 April 2013 FINAL 73
92 impact on beach structures. Therefore, if the dune crest is maintained above the wave runup level, is continuous, and contains sufficient sand buffer, the seaward water level (wave setup level) will not extend to the landward side of the dunes. The wave runup and overtopping calculations were performed based on the 2007 LIDAR dune or rock revetment wall levels. Should the rock revetment or dune be allowed to fail or breach then these values may increase. Wave runup levels and associated overtopping rates are provided for the present day, 2050, 2080 and 2100 planning period in Table 7.4 to Table 7.7. Table 7.4 Present Day Predicted Wave Overtopping Discharge (50 year ARI) Representative Profile Location Feature at the back of the beach Crest Level (1) Wave Runup (R2%) Mean Overtopping Discharge (2) Asset at Risk (3) (m AHD) (m AHD) (L/s per m) - Eastern Coastline East Beach Griffiths Island Killarney Beach Dune 6 (4-8) Reef Point Dune 5 ( (0-1) P 7.1) East Beach North Dune 8 (6 10) East Beach Old Municipal Dune 9 (6.5 10) 3.6 Tip 0 East Beach Night Soil Site Dune 8 (6 10) East Beach Dune Breach Dune 8 (7-15) East Beach SLSC Sloping Rocks - Grass 0-1 P East Beach South Dune- 5 (3.5 7) 2.3 Sloping 0 Rocks South Mole Dune Griffiths Island Beach Dune 6.5 (3-9) (0-2) P, B South Beach Dune 12 (7-14) Pea Soup Dune- 7 (5 12) 4.7 Sloping 0 (0-1) P Rocks Ocean Drive Dune 3.5 ( ) 6 (2-9) P, B Unnamed 2 (VIC516) Dune- 9 (6.5 11) 5.2 Western Sloping Coastline Rocks 0 P Unnamed 3 (VIC517) Dune 10 (4 12) (0-1) P Unnamed 4 (VIC518) Dune Unnamed 5 (VIC519) Dune Unnamed 6 (VIC520) Dune Unnamed 7 (VIC521) Dune Cape Reamur Dune Notes: (1) For a majority of locations, the dune crest height values are provided as a mean value followed by the minimum and maximum crest values around the transect used to represent this location. (2) For a majority of locations, the overtopping discharges values are provided as a main value and two extreme values, associated with the crest levels defined in (1). (3) Refer to Table 7.3 for asset classification. WRL Technical Report 2012/21 April 2013 FINAL 74
93 Table 7.5 Future Predicted Wave Overtopping Discharge (SLR = 0.4 m; 100 year ARI) Representative Profile Location Feature at the back of the beach Crest Level (2) Wave Runup (R 2%) Mean Overtopping Discharge Asset at Risk (3) (m AHD) (m AHD) (L/s per m) - Eastern Coastline East Beach Griffiths Island Killarney Beach Dune 6 (4-8) - - Reef Point Dune 5 ( ) (0-4) P East Beach North Dune 8 (6 10) East Beach Old Municipal Dune 9 (6.5 10) 4.1 Tip 0 East Beach Night Soil Dune 8 (6 10) East Beach Dune Breach Dune 8 (7-15) East Beach SLSC Sloping Rocks - Grass 0-14 P, B East Beach South Dune- 5 (3.5 7) 2.9 Sloping 0 Rocks South Mole Dune Griffiths Island Beach Dune 6.5 (3-9) (0-7.5) P South Beach Dune 12 (7-14) Pea Soup Dune- 7 (5 12) 5.4 Sloping 0 (0-1) P Rocks 3.5 (3.3 Ocean Drive Dune 3.5) P, B 3.5( ) 3-10 P Western Unnamed 2 (VIC516) Dune- 9 (6.5 11) 5.8 Coastline Sloping Rocks 0 Unnamed 3 (VIC517) Dune 10 (4 12) (0-1) P Unnamed 4 (VIC518) Dune Unnamed 5 (VIC519) Dune Unnamed 6 (VIC520) Dune Unnamed 7 (VIC521) Dune Cape Reamur Dune Notes: (1) For a majority of locations, the dune crest height values are provided as a mean value followed by the minimum and maximum crest values around the transect used to represent this location. (2) For a majority of locations, the overtopping discharges values are provided as a main value and two extreme values, associated with the crest levels defined in (1). (3) Refer to Table 7.3 for asset classification. WRL Technical Report 2012/21 April 2013 FINAL 75
94 Table 7.6 Future Predicted Wave Overtopping Discharge (SLR = 0.8 m; 100 year ARI) Representative Profile Location Feature at the back of the beach Crest Level (2) Wave Runup (R 2%) Mean Overtopping Discharge Asset at Risk (3) (m AHD) (m AHD) (L/s per m) - Eastern Coastline East Beach Griffiths Island Killarney Beach Dune 6 (4-8) (0-1) 5( ) P Reef Point Dune 5(5-7.1) 0 East Beach North Dune 8 (6 10) East Beach Old 9 (6.5 10) Dune Municipal Tip East Beach Night Soil Dune 8 (6 10) East Beach Dune Breach Dune 8 (7-15) Sloping P, B East Beach SLSC Rocks P, B Grass P East Beach South Dune- 5 (3.5 7) 3.3 Sloping Rocks 0 P South Mole Dune P 6.5 (3-4) 3-18 P Griffiths Island Beach Dune (4.5-9) 0-3 P South Beach Dune 12 (7-14) Pea Soup Dune- 7 (5 12) 5.9 Sloping Rocks 0 (0-1) P Ocean Drive Dune 3.5 ( ) P, B ( ) P, B Unnamed 2 (VIC516) Dune- 9 (6.5 11) 6.4 Western Sloping Coastline Rocks 0 P Unnamed 3 (VIC517) Dune 10 (4 12) (0-3) P Unnamed 4 (VIC518) Dune Unnamed 5 (VIC519) Dune Unnamed 6 (VIC520) Dune Unnamed 7 (VIC521) Dune Cape Reamur Dune Notes: (1) For a majority of locations, the dune crest height values are provided as a mean value followed by the minimum and maximum crest values around the transect used to represent this location. (2) For a majority of locations, the overtopping discharges values are provided as a main value and two extreme values, associated with the crest levels defined in (1). (3) Refer to Table 7.3 for asset classification. WRL Technical Report 2012/21 April 2013 FINAL 76
95 Table 7.7 Future Predicted Wave Overtopping Discharge (SLR = 1.2 m; 100 year ARI) Representative Profile Location Feature at the back of the beach Crest Level (2) Wave Runup (R 2%) Mean Overtopping Discharge Asset at Risk (3) (m AHD) (m AHD) (L/s per m) - Eastern Coastline East Beach Griffiths Island Killarney Beach Dune 6 (4-8) ( ) 1-26 P, GP Reef Point Dune 4.6 5(5-7.1) 0-1 P East Beach North Dune 8 (6 10) East Beach Old Municipal Dune 9 (6.5 10) 5.0 Tip 0 East Beach Night Soil Dune 8 (6 10) East Beach Dune Breach Dune 8 (7-15) East Beach SLSC P, GP, B Sloping P, GP, B Rocks - Grass P East Beach South Dune- 5 (3.5 7) 3.7 P Sloping 0 (0-1) Rocks South Mole Dune P Griffiths Island Beach Dune 6.5 (3-4) P, GP 6.5 (4.5-9) 0-10 P South Beach Dune 12 (7-14) P Pea Soup Dune- 7 (5 12) 6.5 P Sloping Rocks 0 (0-4) Ocean Drive Dune 3.5 ( ) P, GP, B ( ) P, GP, B Unnamed 2 (VIC516) Dune- 9 (6.5 11) 6.9 P Western Sloping 0 (0-1) Coastline Rocks Unnamed 3 (VIC517) Dune 10 (4 12) (0-11) P Unnamed 4 (VIC518) Dune Unnamed 5 (VIC519) Dune Unnamed 6 (VIC520) Dune Unnamed 7 (VIC521) Dune 13 - Cape Reamur Dune Notes: (1) For a majority of locations, the dune crest height values are provided as a mean value followed by the minimum and maximum crest values around the transect used to represent this location. (2) For a majority of locations, the overtopping discharges values are provided as a main value and two extreme values, associated with the crest levels defined in (1). (3) Refer to Table 7.3 for asset classification. For the present day planning horizon, Ocean Drive Beach was predicted to be the most heavily overtopped (about 6 L/s/m) for the present day 50 year ARI storm event. Based on FEMA guidelines (FEMA, 2000), the resulting overtopping bores were predicted to travel inland distances of the order of 12 m. Considering that the properties behind Ocean Drive Beach are located at an average setback distance of 15 m, it is expected that buildings around Ocean Drive Beach could be impacted by present day wave overtopping starting from the 1 in 50 year ARI event. This would only increase for 2050, 2080 and 2100 planning horizons. Based on the WRL Technical Report 2012/21 April 2013 FINAL 77
96 tolerable limits presented in Table 7.3, wave overtopping at this location is likely to be a hazard for pedestrian and traffic safety as well as the integrity of buildings. It should also be noted that the rock revetment on East Beach, based on average crest height of 3.5 m AHD, would be expected to be overtopped in the 2050 planning period. The calculated wave runup levels and overtopping rates indicate that grassed promenades and/or gardens behind the rock revetment could sustain damage. Overtopping at low points along the rock revetment, such as pedestrian accesses and concrete ramps would be a hazard for pedestrian safety by the 2050 planning horizon. Section 7 Key Findings Coastal inundation mapping was performed over the entire study area based on bathtub inundation levels (Appendix C); The inundation water levels (including storm surge and wave setup) were calculated for each of the coastal subsections for the four (4) different scenarios; Bathtub inundation level is the most representative inundation level for areas located away from direct impact of the overtopping waves (generally those properties which are not in the front row facing the water); Wave runup levels and associated overtopping rates were calculated for each of the coastal subsections for the four (4) different scenarios; Overtopping rates refer to the zone immediately behind the structure or the dune crest and were evaluated in regard to the safety of people and built assets. WRL Technical Report 2012/21 April 2013 FINAL 78
97 8. Dynamic Flood Modelling 8.1. Introduction Section 8 presents the results of the dynamic coastal inundation numerical modelling assessment for the coastal area of the Port Fairy township undertaken to estimate the possible inundation under combined ocean and catchment flooding. While the inundation assessment performed in Section 7 considered only static elevated water levels (i.e. sea level rise projections, storm surge and wave setup), the coastal flood analysis in Section 8 considers dynamically both the elevated water levels (i.e. sea level rise projections, storm surge and wave setup) and the wave runup overtopping of the foreshore and coastal structures. The modelling of the combined effects of riverine and oceanic flooding within the study area was achieved by modifying the existing 2008 MIKE flood model with the implementation of updated dynamic ocean boundaries. These downstream boundaries (along the coastline) were comprised of time series of elevated water levels at the Moyne River entrance and the Southwest Passage, and wave overtopping rates at identified high risk locations along the coastline. The locations of the adjusted model boundary locations are highlighted on Figure 8.1. The coastal area covered in this dynamic inundation assessment extends from the northern end of East Beach to VIC 516 Beach in the west. The inundation modelling is further described in Sections Section 8.2 describes the 2008 Water Technology MIKE Flood model, as it confirms that WRL was able to reproduce the 2008 results for one flood event (100 year ARI) and highlights the limitations of the 2008 MIKE Flood model in relation to dynamic coastal inundation modelling. Section 8.3 presents the updated 2012 MIKE Flood model, which was used to assess the combined effects of riverine and oceanic flooding for the coastal area of the Port Fairy township. Section 8.3 also provides a rationale for the adopted combination of riverine and coastal boundary conditions. Section 8.4 provides a description of the predicted flooding behaviour for the various modelled flood scenarios for a number of key locations in this study area Review of the 2008 MIKE Flood Model Introduction The 2008 Port Fairy Regional Mike Flood model (Water Technology, 2008) has been previously used for the 2008 Port Fairy Regional Flood Study for the Glenelg Hopkins Catchment Management Authority (GHCMA). The model has been compiled as a 1D/2D hybrid model using MIKE Flood software version The two-dimensional (2D) model component was configured to represent the overbank floodplain flows, while the coupled one-dimensional (1D) model was utilised to explicitly model waterway channels (in bank) flows, bridge and culvert crossings within the study area. The two-dimensional hydraulic model was based on a 10 m resolution topographic grid derived from a merge of aerial laser survey data, bathymetric data and field survey. Bridge and culvert crossings within the study area were modelled as one-dimensional structures and dynamically coupled with the two-dimensional model (see Figure 8.1 for bridge and culvert locations). Headloss through the structures and the associated influence on flood levels was therefore explicitly accounted for within the model. WRL Technical Report 2012/21 April 2013 FINAL 79
98 The model development approach has been to represent the floodplain along the main flow channels (Moyne River, Murray Brooke, Reedy Creek and Holcombe s Drain) and tributaries. The influence of obstacles to flow, such as buildings, on overland flows was partially accounted for by applying a specific hydraulic roughness coefficient under the footprint of these obstacles. This approach has the advantage of providing model inundation maps with potential inundation inside building footprints and enable estimation of properties flooded above or below floor level. Upstream inflows to the model were via predicted design flow rainfall runoff hydrographs developed using a RORB catchment model and applied to the two-dimensional model in the locations of the main flow channels (see Figure 8.1). The ocean boundaries, located at the Moyne River mouth and at the South West Passage entrance, were held at a prescribed constant elevation sea level condition MIKE Flood Model Calibration The 2008 MIKE Flood model was calibrated to three historical flood events (March 1946, August 1978, August 2001). However, due to limited historical data, the model calibration relied heavily on matching anecdotal flood behaviour. It is reported that the model exhibited reasonably good agreement with the pattern and extent of historical inundation observed for floods ranging from approximately the 30% AEP up to approximately the 0.5% AEP flood. Additional calibrations of the model s key hydraulic characteristics were performed through the verification of the model s ability to reproduce observed tidal and meteorological water level variations in the port and the estuary using recorded data from two pressure sensors deployed on the Port Fairy Breakwater and in the Belfast Lough. The Moyne River channel capacity, upstream of the Belfast Lough, was calibrated against qualitative flooding observations undertaken by GHCMA, in order to reproduce a minor local inundation of the floodplain. This exercise also allowed calibration of the Moyne River channel roughness, which required a differentiation between the roughness within the Belfast Lough (Manning s n = 0.033) and the Moyne River channel (Manning s n = 0.025) Mike Flood Model Run Verification WRL successfully re-simulated the provided 2008 MIKE Flood model results after some minor adjustments to files due to a recent change in MIKE software file standards. The comparison test by WRL was performed using MIKE Flood V2011 Service Pack 4, the latest version of the MIKE Flood software. This model is referred to in this report as the 2012 Mike Flood Model, whereas the available result files from the 2008 study are referred to as the 2008 Mike Flood model. A comparison of the modelled flood extent (Figure 8.2) and maximum water levels available for the 2008 Mike Flood model (Figure 8.3) for the 100 year ARI catchment flood event with the 2012 Mike Flood model results is provided in Table 8.1. WRL Technical Report 2012/21 April 2013 FINAL 80
99 Table 8.1 Comparison of Modelled Designed Water Levels (mahd) Location (refer to Figure 8.3) WL (mahd) (Water Technology, 2008) WL (mahd) (WRL, 2012) WL difference (m) Analysis of the flood extent shows that the 2012 Mike Flood Model generally reproduced the flood extent and peak flood levels reported in the 2008 Flood Study to an acceptable level. The exact coordinates of the 15 key locations for comparison from the 2008 Flood Study were not provided and based on an orthorectified image for this exercise. The majority of the locations exhibited a water level difference of 0.05 m or less. WRL believes that the differences between the 2008 and 2012 modelled water levels are largely due to a difference in the exact location of the water level measurement and is of no significance for the purpose of this verification Development of the 2012 MIKE Flood Model As mentioned in Section 8.1, the 2008 MIKE Flood model required adjustment in order to enable the combined influences of catchment and coastal flooding within the Port Fairy study area to be assessed Extension of the Topography in the Coastal Area The extent of the 2008 MIKE Flood model in the coastal area was mainly derived from an initial estimation of the catchment runoff Probable Maximum Flood (PMF) extent. This resulted in some of the coastal areas required for assessment of ocean events being left out of the 2008 WRL Technical Report 2012/21 April 2013 FINAL 81
100 MIKE Flood topographic grid. An overview of the additional areas required for coastal analysis is presented in Figure 8.4. In order to accurately propagate the coastal inundation resulting from overtopping waves, WRL extended the existing topography grid in the required coastal areas, using the 2007 LIDAR data provided by DSE. These topography extensions are presented in Figures 8.5 to Extension and Modification of the Hydraulic Roughness Grid The 2008 MIKE flood model (Figure 8.8) used a map of model roughness coefficients to account for the influence of various land uses on the flood plain including built infrastructures such as buildings by assigning a specific roughness to each land use. In particular, each building foot print within the PMF area was modelled individually. This information did not however cover the coastal area and needed to be expanded for the dynamic modelling task. WRL modified the hydraulic roughness map at a street block scale to take into account the influence of urban development on water flow (Figure 8.9). The hydraulic roughness implemented in the 2012 MIKE Flood Model for the street block areas was verified against values found in flood modelling literature. Table 8.2 provides a summary of the adopted values throughout the 2012 Mike Flood model. Table 8.2 Adopted Roughness Values for the 2012 MIKE Flood Model Description Adopted Manning s n Buildings blocks 0.15 Roads Upstream Moyne River Channel Belfast Lough Moyne River section with piers Downstream Moyne River Remaining areas (lightly vegetated, pastures) The 2008 and 2012 MIKE Flood roughness maps are presented in Figure 8.8 and Figure Design Flood Modelling Conditions Dynamic flood modelling was considered for four (4) different scenarios combining terrestrial and coastal flood events of different ARI as presented in Table 8.3. The boundary conditions for the terrestrial riverine inflows for the 10 and 20 year ARI events were unchanged from the previous modelling undertaken for the 2008 Port Fairy Regional Flood Study. The coastal boundary conditions were based on 50 and 100 year ARI coastal storm events and the sea level rise predictions for the present day, 2050 and 2080 planning periods as detailed in Sections 5.3 and 5.4. The wave overtopping rates calculated for the coastal boundary conditions factored the influence of present day and future erosion/recession on the coastline levels. An WRL Technical Report 2012/21 April 2013 FINAL 82
101 additional scenario, referred to as Scenario 5, investigated the potential influence of an extended dune breach in the area immediately north of the end of the rock revetment on East Beach. The characterisation of the extent of this specific potential dune breach event was based on the results of the study presented in Appendix B. The ocean boundary conditions are discussed more in detail in Section Table 8.3 Overview of Boundary Conditions Riverine Ocean Planning Period Comments Scenario # Boundary Conditions Boundary Conditions & SLR 1 10 year ARI 50 year ARI Present Day 0 m SLR 2 10 year ARI 100 year ARI m SLR 3 20 year ARI 100 year ARI 2080 Dune breach extent (180 m) next to 0.8 m SLR East Beach rock revetment end 5 20 year ARI 100 year ARI 2080 Extended dune breach (385 m) next 0.8 m SLR to East Beach rock revetment end Note: WRL in agreement with MSC and DSC did not perform Scenario 4 due to its similarity to Scenario 1. Note that the flood modelling assumed coincidence of peak riverine flood flows and coastal storm surge heights. While this assumption is considered conservative, a lack of historical information limits the ability to assess the probability of joint occurrence of ocean and catchment events. In the absence of further information this conservative approach was adopted. Flooding in coastal catchments can sometimes result from the combination of both runoff generated by an extreme rainfall event and elevated water levels due storm surge, as these flood-producing processes are often the result of common meteorological conditions. The results of the study Interaction of Coastal Processes and Sever Weather Events (Draft) (Engineers Australia, 2012d), for three (3) sites (Sydney, Brisbane, Mackay) around Australia showed that there was statistically significant dependence between extreme rainfall and storm surge at all three sites. However, the joint dependence of riverine and coastal flooding regionally around the Australian coastline is still an active research area and has not yet been assessed for the Victorian coast. In the absence of more precise guidelines for coastal flooding, it should be noted that the modelled scenarios are consistent with the best practice guidelines for floodplain management recommended in Floodplain Management in Australia: Best Practice Principles and Guidelines (SCARM, 2000). Thus, if an extreme rainfall situation is adopted for analysis (e.g. 1% AEP rainfalls), a considerable less extreme accompanying storm surge situation is typically selected (e.g. 10% AEP storm surge) and vice versa. (SCARM, 2000). Note that it is standard engineering practice in Australia to use the 100 year ARI event for design of permanent coastal structures (Pilgrim, 1987). The USA Federal Emergency Agency Management Authority (FEMA) in its Coastal Construction Manual (FEMA, 2000) also recommends a 100 year design event for a coastal residential building. WRL Technical Report 2012/21 April 2013 FINAL 83
102 Inundation from coastal processes alone is likely to be at peak levels for durations of up to only two hours due to tidal water level fluctuations. Coastal inundation resulting from combined catchment and coastal flooding can potentially persist for longer periods, due to the more random nature of hydrological processes and individual catchment response Implementation of Dynamic Coastal Boundaries Two types of downstream boundaries (along the coastline) were implemented in the 2012 Mike Flood model to simulate model dynamic coast flooding. o Dynamic water levels at the Moyne river entrance and in the Southwest Passage The first boundary type was the implementation of dynamic water levels at the Moyne River entrance and within the Southwest Passage. The ocean boundary at the Moyne Rive entrance was created by using a Mean High Water Spring (MHWS) tide time series as a base, to which a tidal anomaly was added such that the peak water level corresponded to the ARI of the storm (1.03 m AHD for 100 year ARI) as can be observed on Figure For modelling purposes a symmetrical shape of the anomaly was assumed, with the peak in predicted tide and tidal anomaly assumed to coincide with the peak wave height of the storm. These assumptions are somewhat conservative but not unreasonable since intense low pressure systems are responsible for large waves, strong winds and storm surge. The assumptions could be revised with additional data and joint probability analyses. No wave set-up was considered at the Moyne River entrance due to limited depth-limited wave breaking. The appropriate SLR water level offset was added to the resulting water level time series for each considered future flood scenario. Dynamic water levels were also implemented at the southern entrance of the Southwest Passage and included the influence of wave setup within this narrow and shallow channel. The dynamic water levels for the Southwest Passage were generated using the water levels time series used for the Moyne River entrance in combination with the 50 or 100 year ARI near shore wave conditions propagated within the passage. The resulting water levels in the Southwest Passage were found to be on average 1 m to 1.5 m higher than the ocean levels due to wave setup, as can be observed on Figure The resulting water level time series adopted for all considered scenarios are provided in Appendix C. o Wave overtopping along the Port Fairy coastline The purpose of the second type of dynamic coastal boundary implemented in the 2012 MIKE Flood model was to assess the influence of water overtopping on inundation due to wave runup on ocean beaches in the coastal area. The effects of wave runup overtopping the foreshore and sections of East Beach rock revetment were considered. Inundation caused by wave runup was assessed by first calculating overtopping volumes at nominated high risk locations along the coastline using the recognised best practice methods described in the EurOtop Overtopping Manual (2007) and the Coastal Engineering Manual (2003). These overtopping volumes were then implemented as flow time series boundaries at the appropriate locations in the 2012 MIKE Flood model WRL Technical Report 2012/21 April 2013 FINAL 84
103 Based on the results of the coastal erosion study in Section 6, local inflow boundaries were implemented in the extended 2012 MIKE Flood model topographic grid at locations identified as at risk of wave overtopping due to wave runup. The extents of these flow entries were dependent on the considered planning period (i.e. Present day, 2050 or 2080), taking into account the impact of erosion/recession on the coastline, and are presented in Table 8.4. The locations of these specific zones vulnerable to wave runup and overtopping are shown in Figures 8.11 and Table 8.4 Wave Overtopping Boundary Extents and Peak Discharges Location Ocean Drive West Ocean Drive East Feature at the back of the beach Scenario 1 Scenario 2 Scenario 3/5 (50 year ARI; Present (100 year ARI; (100 year ARI; Day; 0 m SLR) 2050; 0.4 m SLR) 2080; 0.8 m SLR) Breach Peak Breach Peak Extent Overtopping Extent Overtopping (m) Discharge (m) Discharge Breach Peak Extent Overtopping (m) Discharge (m 3 /s) (m 3 /s) (m 3 /s) Dune Dune Pea Soup Dune South Beach Dune The Passage Dune East Beach South East Beach Apex Park East Beach SLSC East Beach Bourne Ave Sloping Rocks Sloping Rocks Sloping Rocks Sloping Rocks East Beach Dune Breach Dune East Beach Dune Breach Extended Dune Reef Point Dune The dynamic overtopping flow rates were calculated using a methodology similar to the one presented in Section 7.3. For the beaches backed by a dune, wave runup was quantified using the method of Mase (1989), whereas wave runup on East Beach rock revetment was quantified using best practice empirical, prediction methods based on the most current published literature (EurOtop, 2007). The elevated water level time series used to calculate wave runup at each representative location incorporated tides, storm surge and wave setup based on nearshore wave conditions, i.e. wave height and period as derived from the wave modelling exercise. WRL Technical Report 2012/21 April 2013 FINAL 85
104 Overtopping was first quantified in terms of volume of water being discharged above the dune or rock revetment crest and expressed in m 3 /s per metre length of crest. This unit crest length rate was then multiplied with the appropriate length extent based on the analysis of the eroded crest level and used as a dynamic boundary condition for the 2012 MIKE Flood model. This resulted in discharge rates for each considered scenario due to the combined influence of erosion/recession and sea level rise, as illustrated on Figure 8.13 for the flow entry located at the potential dune breaching site next to the northern end of the rock revetment on East Beach. The resulting water discharge rate time series due to wave overtopping for all considered scenarios are provided in Appendix C Design Flood Simulation Results Maximum design flood extent results from all design simulations are presented in Figures 8.14 to Comparison with 2008 Model for Present Day Conditions A comparison of the maximum flood extent for Scenario 1 with the results of the 2008 Port Fairy Regional Flood Study is provided on Figure The effects of the dynamic ocean water levels applied at the Moyne River entrance and the Southwest Passage are variable, but a large increase in level can be observed in the Sandy Cove area. Under Scenario 1 conditions, it should be noted that the Southwest Passage causeway is overtopped as well as sections of the Ocean Drive road near The Passage car park. Such coastal flood behaviour has been reported in the past by MSC (see Figure 12.3), which suggests that the 2012 MIKE flood model provides an improved estimate of overall flood risk in this specific area of Port Fairy. A comparison of maximum water depths for Scenario 1 with the results of the year ARI flood is provided at the key locations (Figure 8.3) in the coastal area (i.e. Points 9 to 15) in Table 8.5. Table 8.5 Comparison of Modelled Designed Water Depths (m) for 10 year ARI Flood Event Location (refer to Figure 8.3) WL (m) (WRL, 2012) WL (m) (Water Technology, 2008) WL difference (m) This comparison highlights that the modelled water levels are relatively higher within the lower part of the Moyne River channel (Points 13, 14 and 15) when using dynamic coastal boundaries. This trend can be in part explained by the influence of the elevated water levels modelled within WRL Technical Report 2012/21 April 2013 FINAL 86
105 the Southwest Passage due to wave setup. On the other hand, it should be noted that the overall water levels are slightly lower in the Belfast Lough, which is likely caused by the timing differences between the riverine peak flows and tidal peak water levels in this area. The other significant difference in the overall flood extent is due to the inclusion in the 2012 MIKE Flood model of coastal inundation caused by wave runup at the western end of Ocean Drive. Under present day water level conditions (i.e. no SLR) and a 50 year ARI coastal storm event (Scenario 1), it has been estimated that about 400 m of coastline could potentially be subjected to wave overtopping. The relatively high flow rates, close to 4 L/s/m, indicate the possibility of damage to beachfront houses based on the EurOtop classification (see Table 7.3). Under the assumption of no infiltration, the flooding could extend inland in the lower undeveloped zones located behind the western end of Ocean Drive and around the developed lower sections of Powling Street Dynamic Flood Modelling Results The flood extent analysis for Scenario 1 shows that flood flows are mostly contained within the Moyne River channel and have localised impact on development along the port. North of Gipps Street Bridge, the flooding within the Belfast Lough extends on the northern side of Gipps Street and impacts developments along Ritchie Street. The flood extent around the eastern part of the Belfast Lough is relatively well contained, with the potential for localised and limited breaching of Skenes Road near the Port Fairy Golf Course. Further analysis of the different design modelled floods with dynamic coastal boundaries was performed by selecting additional locations within the coastal area (see Figure 8.19). A brief description of the predicted flood behaviour over the range of the design dynamic flood scenarios is provided for these locations. An overview of maximum water levels all modelled scenarios is provided at the key locations (Figure 8.19) in the coastal area in Table 8.6. Comments are given on the predicted water depths at the different key locations, based on the recommended maximum water depth stability criteria for adult pedestrian (0.8 m) and cars (0.3 m to 0.5 m) provided in the Australian Rainfall and Runoff Revision (Engineers Australia, 2010a and 2010b). WRL Technical Report 2012/21 April 2013 FINAL 87


106 Table 8.6 Comparison of Maximum Water Levels (m AHD) in the Coastal Area WRL Technical Report 2012/21 April 2013 FINAL 88
107 The flood extent is relatively marginal for the floodplain area located at the back of VIC 516 beach (Figure 8.15) for the present day planning period (Scenario 1) and the wave overtopping in the western part of Ocean Drive. Under the modelled future SLR scenarios 2, 3 and 5 (0.4 m SLR and 0.8 m SLR), the flood extent increases due to the influence of wave overtopping on Ocean Drive and results in predicted water levels breaching the two access roads (Points A and B). For Scenario 2, the predicted water depths on Thistle Place road are less than 0.3 m but increase to maximum water depths of 0.5 m to 0.7 m for Scenarios 3 and 5, potentially limiting the access from/to the properties located on the beachfront. The flood levels at the western end of Ocean Drive (Figure 8.15) are predicted to be lower than 0.2 m near Anna Catherine Drive (Point C) for the present day planning period. Due to the increase in wave overtopping volumes associated with potential future sea level rise and breaching of the dune system, the maximum predicted water depths in this area of the township could reach 0.5 m for Scenarios 3 and 5 (0.8 m SLR) and result in potential damage to properties. The predicted flood extent in the lee of the central part of Ocean Drive (Points D and E, see Figure 8.15) stays relatively contained in the low areas located between Powling Street and Mills Crescent for Scenario 1 (no SLR), with predicted water depths lower than 0.1 m. For Scenario 2 (0.4 m SLR), the lower parts of Powling Street and Mills Court are predicted to be flooded with maximum water depths of 0.3 m, increasing to 0.4 m for Scenarios 3 and 5 (0.8 m SLR), indicating potential flood hazards for vehicles. Due to the increase in wave overtopping volumes associated with potential future sea level rise and additional breaching of the dune system, the flood extent is predicted to gradually progress east of Mills Court and reach the Russell Clark Reserve and Southcombe Park (Point F) for Scenarios 2, 3 and 5 (Figure 8.15). The eastwards progression of the flood caused by wave overtopping is mainly the result of the topography, with ground levels dropping from 2.3 m AHD near Mills Court (Point E) to 1.3 m AHD at the Southcombe Caravan Park, and additional dune breaching locations (South Beach) under future elevated water levels. The resulting maximum water depths are predicted to reach up to 1 m for Scenario 3 (0.8m SLR), indicating serious impact to development in this low area of the township as well as hazard to the safety of people and vehicles. The lower section (1.3 m AHD) of Ocean Drive near the Southwest Passage (Point G) is predicted to be impacted by coastal flooding for all modelled scenarios (Figure 8.15). The predicted water levels of 1.5 m AHD (equivalent to a water depth of 0.2 m) for the present day planning period indicate potential flood hazards for vehicles on this road. These water levels are predicted to increase by 0.6 m for Scenario 2 (0.4 m SLR) and 1.1 m for Scenarios 3 and 5 (0.8 m SLR). It should be noted that the flooding in this area results from the combined effects of increased wave setup within the Southwest Passage breaching the western side of the channel and also significant wave overtopping in the vicinity of The Passage car park. The Southwest Passage causeway (average elevation of 2.1 m AHD at Point H) is predicted to be overtopped for all modelled scenarios due to the additional influence of wave setup on the elevated water levels in the Southwest Passage channel (Figure 8.15). The predicted water levels on the causeway are about 2.3 m AHD for the present day planning period, indication moderate overtopping. Such water levels would likely overtop the training walls separating the passage from the Puddeny Grounds. The water levels are predicted to increase by 0.2 m (2.4 m AHD) for Scenario 2 (0.4 m SLR) and by 0.4 m (2.6 m AHD) for Scenarios 3 and 5. The WRL Technical Report 2012/21 April 2013 FINAL 89
108 difference between the SLR levels and the resulting flood levels in this area can be explained by the fact that part of the flood is predicted to breach the western bank of the channel, south of the causeway, limiting the flows reaching this coastal structure. Flood flows are mostly contained within the Moyne River channel between Martin s Point and Gipps Street Bridge for all design conditions (Figure 8.16). However, flooding is observed for the areas on the western bank, located between the Moyne River and Gipps Street for the planning period. Near the marina footbridge (Point J), water levels in the river are predicted to reach 1.33 m AHD for the planning period, with limited impact to properties on the river banks. The water levels in the river are predicted to increase to 1.93 m AHD for Scenario 2, and 2.57 m AHD for Scenarios 3 and 5. The predicted flood levels for Scenarios 3 and 5 would result in water depths close to 1 m on the western banks of the river and an could impact greatly the properties south of the marina footbridge. On the other bank, localised flooding is predicted on the southern part of Griffith Street. Buildings currently at risk of inundation are mainly located next to the Port Fairy Harbour and Marina. The water levels are predicted to reach 2.58 m for AHD for Scenarios 3 and 5 (0.8 m SLR), resulting in maximum water depths of 0.3 m on sections of Gipps Street near Apex Park, indicating potential flood hazards for vehicles. The increased encroachment of flood waters in the western part of the Belfast Lough is predicted to impact existing development in the areas located between Regent Street and Osmond Lane (Figure 8.16). Water depths on Osmonds Lane are predicted to stay below 2 m AHD for the planning period, with limited flood impact to properties on Marine Court. The increased flood levels in this area are predicted to result in maximum water depths of about 0.2 m around Marine Court, increasing to 0.8 m AHD for Scenarios 3 and 5, indicating potential flood hazards for vehicles as well as damage to existing properties. Gipps Street Bridge (Point K) is not predicted to be completely overtopped before the 2080 planning horizon (Scenarios 3 and 5, 0.8m SLR), with a maximum water depth of 0.1m over the bridge but reaching depths of 0.4 m on the lower side of the bridge near Gipps Street Corner (Figure 8.16). The water levels on the lower sections of the road immediately west of the bridge (Griffith Street) are predicted to reach 2.6 m AHD (0.5 m water depth) indicating potential flood hazards for vehicles. The flood extent on the western side of the Belfast Lough is not predicted to breach Regent Street (Point I), thereby limiting the flood impact in the southern parts of the Port Fairy township (Figure 8.16). The flood extent on the eastern side of the Belfast Lough is observed to be relatively contained for present day conditions (Figure 8.16). Limited flooding is observed west of Griffiths Street, with water levels of 1.5 m AHD on Bourne Avenue in the present planning period. However, water levels increase more significantly in the 2050 planning period (Scenario 2, 0.4 m SLR) with potential impact to existing development, with predicted water depths of 0.5 m on the lower section of Bourne Avenue, indicating potential hazard to existing properties. This would result as well in potential flooding of Griffith Street (Point L), with water levels above 1.9 m AHD resulting in maximum water depths of 0.1 m of the road. Due to the combined influence of increased sea level rise, additional locations subjected to wave overtopping (SLSC, Bourne Avenue) and an increase in ARI for the catchment flood (20 year ARI), the water levels are predicted to reach 2.6 m AHD for the Scenarios 3 and 5. This would result in Griffith Street and large sections of Skenes Road being overtopped, with water depths higher than 0.7 m, with potential consequences for evacuation of properties in these areas due to pedestrian and traffic hazard. WRL Technical Report 2012/21 April 2013 FINAL 90
109 Further north along Griffith Street (Figures 8.16 and 8.17), the flood extent on the eastern side of the Belfast Lough is predicted to cause limited overtopping of Griffiths Street (Point M) with water levels of 1.58 m AHD resulting in water depth lower than 0.04 m for the present planning period (Scenario 1). The water levels are predicted to increase by 0.4 m for Scenario 2 (1.99 m AHD) due to the main influence of the 0.41 m SLR, and indicate potential flood hazards for vehicles. Due to the combined influences of an increase intensity for the catchment flood (20 year ARI), the increased extent of the dune breach and higher sea level rise, the water levels are predicted to increase by 1.04 m for Scenarios 3 and 5 (2.62 m AHD), resulting in water depth of 1.0 m on sections of the road, with potential consequences for evacuation of properties in these areas. Limited influence of the extended dune breach (Scenario 5) on the overall flood extent and water levels (increase by 0.01m in water depths), in comparison to Scenario 3, was observed along Griffith Street and Skenes Road, due to the effect of riverine flooding within the Belfast Lough (Figures 8.16 and 8.17). It should however, be noted that the overtopping of Griffith Street was observed to take place approximately 4 hours earlier in Scenario 5 than in Scenario 3, due to the increased water flow influx associated with the larger dune breaching area. North of the Port Fairy township, on Skenes Road (Point N), overtopping of the road is predicted in the 2050 planning period (Scenario 2, 0.4 m SLR) with water levels of 2.01 m AHD increasing to 2.63 m AHD for Scenarios 3 and 5 (Figure 8.17). This would result in predicted water depths of 0.2 m on the road, indicating potential hazard for vehicles, increasing to 0.8 m for Scenarios 3 and 5. Water levels of 1.61 m AHD are predicted near the Port Fairy Golf Club (Point O), resulting in water depths of 0.1 m on the car park and Skenes Road(Figure 8.17). The predicted water levels would increase to 2.01 m AHD in the 2050 planning period (Scenario 2, 0.4 m SLR) and to 2.63 m AHD for Scenarios 3 and 5 (0.8 m SLR). This increase of 0.6 m in water levels between Scenario 2 and the Scenarios 3 and 5 can be explained by the combined influence of higher sea level rise (from 0.4 m to 0.8 m) and increased intensity in catchment flood (from 10 to 20 year ARI). This could be expected as the catchment flood can be expected to have a higher influence on overall flood behaviour this far from the river entrance, and confirmed by the 0.4 m modelled increase in water levels at the Port Fairy Golf Club (Point O) between Scenario 1 and Scenario 2, which had identical riverine flooding conditions and a 0.4 m SLR increase Comparison of Bathtub and Dynamic Flood Modelling Results A comparison between the water levels obtained in Section 7 with the results of the dynamic flood modelling was performed at the different key locations depicted on Figure Table 8.7 provides a comparison between both methods for Scenario 1 (50 year ARI coastal storm, No SLR) and Scenario 3 (100 year ARI, SLR=0.8 m). As expected, this exercise showed that bathtub flood modelling provided a conservative estimate in areas not directly impacted by direct wave overtopping. WRL Technical Report 2012/21 April 2013 FINAL 91


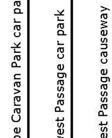


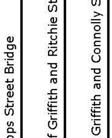


110 Table 8.7 Comparison of Maximum Water Levels between bathtub/dynamic flood modelling WRL Technical Report 2012/21 April 2013 FINAL 92
111 For the present day planning period, the greatest difference in modelled maximum water levels is observed on the car park next to the Southwest passage, where bathtub levels are 0.7 m higher. This can be explained by the fact that the flood is predicted to breach the western bank of the channel, south of the causeway, limiting the flows reaching this coastal structure, as well as the influence of lower water levels within the Moyne River Channel in comparison with the water levels in the Southwest Passage. The water levels predicted by the dynamic flood model for the floodplain area located at the back of VIC 516 beach (Points A and B) are 0.5 m lower than the bathtub levels, due to the limited effect of propagated wave overtopping in the western part of Ocean Drive. This difference increase to 0.8 m for the 2080 m planning period (0.8 m SLR). The influence of wave overtopping in the coastal areas of Ocean Drive (Points C and D) result in higher water levels due to the peak wave run up values resulting in a breach of the dune crest in this low-lying part of the coast for the present day conditions. On the other hand, for the 2080 planning period, the maximum water levels predicted using dynamic flood modelling along the most of the oceanic coastline along Ocean Drive are significantly lower (0.4 m to 0.8 m) than the bathtub results, as breaching of the dune and resulting wave overtopping is only intermittent and mainly associated with the tidal cycle. The water levels predicted by the bathtub modelling are only marginally higher for the other key locations, as the flood water levels are mainly driven by Moyne River and the Belfast Lough, which are tidal-dominated environments. Section 8 Key Findings Dynamic coastal inundation numerical modelling assessment for the coastal area of the Port Fairy township was undertaken to estimate the possible inundation under combined ocean and catchment flooding; Modelling was undertaken to best contemporary practice and assumed coincidence of coastal storm surge heights and catchment peak flood flows; The coastal areas most impacted by wave overtopping were located around Ocean Drive and the Southwest Passage; Under present day conditions (Scenario 1), flood flows are mostly contained within the Moyne River channel and have localised impact on development along the port; Under future modelling conditions (Scenarios 2, 3 and 5), inundation due to wave overtopping could potentially impact the Russell Clark Reserve and Southcombe Park; Modelling of dune breaching on East Beach was observed to have limited influence on flooding extent as flood levels are mainly driven by the Moyne River and the Belfast Lough. WRL Technical Report 2012/21 April 2013 FINAL 93
112 9. Influence of the Opening of the Southwest Passage on Sediment Transport 9.1. Introduction Section 9 presents the results of an analysis of sediment transport potential within the Moyne River entrance and Southwest Passage. The main focus of this exercise was to assess the potential influence of opening of the Southwest Passage causeway on sediment transport under coastal storm conditions. This task was completed using the MIKE Flood model used for dynamic coastal inundation numerical modelling, presented in Section 8. The existing MIKE Flood model topography grid was modified to represent removal of the Southwest Passage causeway. Modelling assessed two different ocean boundary condition scenarios, provided by the MSC and DSE. The hydraulic analysis provided maps of flow speed and direction, which combined with knowledge of the local sediment properties, enabled the determination of shear properties and inferred characterisation of possible sediment transport during the modelled flood events Background Information A detailed review of the Port Fairy and the Moyne River works since the 1850s is provided in Section The purpose of the following section is to establish a more specific chronology of the different occasions when the Southwest Passage has been opened and sealed off. This section also provides the results of an initial assessment of sand volumes present within the Southwest Passage and the downstream sections of the Moyne River channel, using the 2007 LIDAR data and historical nautical charts Development Works Around the Southwest Passage The construction of the Moyne River training walls is reported to have begun about 1869, with initial work localised around Goat Island and extending into the bay. Additional work also consisted of removing limestone and rock reef from the river bed as well as dredging through a sand bar at the mouth of the river. Dredging is reported to have continued since that time, both in the Moyne River Channel and in the Southwest Passage. Following a visit of Sir John Coode (Chief Engineer of the British Admiralty) in 1886, it was recommended that the Southwest Passage be partially closed with the installation of sluice gates in order to improve navigation by reducing wave-induced currents. However no work concerning the closure of the Southwest Passage was undertaken until the early 1910s, with a first mention of the Southwest Passage being sealed off from the river by a causeway in It is believed that the main reason for the closure of the Southwest Passage in 1909 was the running aground of the Eumeralla steamer caused by surging currents. Erosion/recession on East Beach foreshore appeared to be already problematic before the closing of the Southwest Passage, as extensive erosion near Battery Hill was reported as early as 1881 and again in East Beach was found to temporarily accrete after the Southwest Passage was partially opened in 1946, with an accidental breach of about 3 to 4 m wide. However, due to the persistent problem of the river silting up as well as access to Griffiths Island, the Southwest Passage was sealed off once more by The causeway joining Griffiths Island to WRL Technical Report 2012/21 April 2013 FINAL 94
113 the mainland was rebuilt in its current design in 1969 to protect the crossing of a sewerage outfall pipe. It is important to note, that numerous public petitions were signed in the 1950s to keep the Passage open in the belief that this would improve both the erosion/recession problem on East Beach and have potential benefits for fishing Assessment of Sediment Volumes Around the Southwest Passage A volumetric analysis of the sand accumulation in the Moyne Rover entrance was performed by comparing the 1854 Barrow Chart (see Figure 5.18), the 1870 Stanley Chart (see Figure 5.19), available aerial photography and 2007 LIDAR data. The area within the Southwest Passage, on either side of the causeway, has not been dredged in recent years. Based on the analysis of the 1854 and 1870 nautical charts and the 2007 LIDAR, it has been estimated that approximately 60,000 m 3 of sand has accumulated in the Southwest Passage over the years since the 1870s. Table 9.1 Estimation of Accumulated Sand Volumes ( ) Location Area (m 2 ) Volume (m 3 ) Southwest Passage (Ocean Side) Southwest Passage (Moyne River Side) 18,000 36,000 7,500 24,000 Moyne River Channel (Gipps Street Bridge to Moyne River Entrance) 100, ,000 An additional volumetric estimation of sediment deposited within the Moyne River channel between Gipps Street Bridge and the river entrance has been performed. An average sediment thickness was derived from the average channel depth (between -2.5 and -3.5 m AHD) obtained from the 2010 LIDAR bathymetric data and from the known bedrock levels in the Moyne River. The bedrock levels were obtained from a previous geological survey campaign performed in the vicinity of the Marina in the early 2000s. Drilling in multiple locations found the top of the basalt layer at depths around -4 to -6 m AHD (Max Dumnesy, pers. comm.). It has been estimated that approximately 200,000 m 3 of sand is nowadays present in this area of the Moyne River channel. It should be noted that this volume is an estimation and that it could vary significantly due to the sand dredging undertaken in the river. Dredging is nowadays typically performed six (6) months a year along the river entrance and previously in the Southwest Passage. While no detailed report exists, it was estimated by the Port Authority that 30,000 to 50,000 m 3 of sand are dredged from the river each year, mostly from sand bars near South Mole Beach (WBM, 2007). It should be noted that these numbers are only estimates and no exact volumes were available at the time of the study. Based on an time interval of 140 years (1870 to 2010), the accumulated sand volume in the Southwest Passage indicated a potential 500 m 3 /year sediment transport rate towards the Moyne River channel, which could have under specific flow conditions and in the absence of the WRL Technical Report 2012/21 April 2013 FINAL 95
114 causeway, reached the East Beach embayment. It should be noted that the potential sediment transport rate in the Southwest Passage is nearly five times smaller than the transport rate (2500 m 3 /year) derived from the accumulated sand at South Mole Beach (approximately 300,000 m 3 ). This indicates that long term sand supply in the Southwest Passage from offshore can be considered as minor in comparison to the sand supply past the headland Griffiths Island which is currently trapped by the southern training wall on South Mole Beach (i.e. Lighthouse Beach). However, it is important to take in account that in the absence of any humandevelopment, part of the sand supply around Griffiths Island would have probably been unavailable to East Beach as it would have naturally travelled upstream under ambient conditions due to Lagrangian drift and ebb-tidal asymmetry in the Moyne river delta Previous Investigations WBM (1996) investigated the potential benefits from an opening of the Southwest Passage on sediment transport towards East Beach. The reported modelling was performed under 35 knot wind conditions for both southwest and south east directions and did not include wave forcing. WBM indicated a potential for a strong current and associated sand transport through the Southwest Passage if it were open for the southwest wind case. Review of this report indicates that the opposite current and associated sediment transport from the Moyne River mouth to the Southwest Passage has the potential to occur for the southeast wind case. WBM also indicates that the opening of the Southwest Passage could potentially have impacts on navigation and dredging requirements in the Moyne River. Additional investigation of the opening of the southwest Passage on the erosion on East Beach was performed by WBM (2007) in the Port Fairy East beach Coastal Erosion Engineering and Feasibility Study. The effects of the opening of the Southwest Passage were assessed in a preliminary manner by modelling the combined influence of southwest waves and southwest wind on the flow within the Moyne River channel. The results discussed in the report were obtained for 3 m waves and 30 knot winds, which were described as relatively severe but reasonably common prevailing conditions. WBM reported that under such environmental conditions, the current along the downstream part of the river channel may be continuously seawards with sufficient strength to carry sand out of the river. That is, in such circumstances, the river may be self-flushing and any sand deposited in the channel would tend to be forced out through the mouth. It was highlighted that this effect was unlikely to occur under southwest and southeast typical wave conditions. In its peer-review of the 2007 study by WBM, Aurecon (2010) commented that the wave and wind conditions used for the sediment transport modelling exercise could not be considered as common and that typical wave and wind conditions could potentially not induce sufficient outflowing current, resulting in additional sediment deposition in the entrance channel between the training walls. It also reported that comments from Harold Dempsey (ex. Moyne Shire Engineer) suggest that when the passage was partially opened in the late 90 s and early 50 s sand that migrated through the Passage was not carried through the entrance channel. This tendency of sediment to get washed upstream is not uncommon in untrained estuary environments, due to the combined influence of Lagrangian drift caused by the waves at the river entrance and tidal asymmetry. Aurecon s conclusion regarding the potential benefits from the opening of the Southwest Passage on the erosion problem on East Beach, is that it is unlikely to provide the benefits thought. Based on the analysis of an offshore wave monitoring instrument (Flocard, 2012), WRL has estimated the average significant wave height on the western coastline of the Port Fairy study WRL Technical Report 2012/21 April 2013 FINAL 96
115 area, located 1 km offshore of VIC 519 beach, to be 1.9 m. Professor Andy Short, one of Australia s most esteemed coastal scientists (Short, 2007), estimated the average significant wave height to be 0.5 m at the southern end of East Beach and 1.7 m at Reef Point. It should also be noted that these wind conditions cannot be considered as typical as the long term average wind speeds measured at the closest meteorological station (Port Fairy AWS, BOM, are estimated at around knots Model Development and Assumptions For this exercise, WRL used the MIKE Flood model developed for the dynamic coastal flooding assessment exercise and presented in Section 8. Previously calibrated riverine flow boundaries (Water Technology, 2008) and ocean model boundaries calculated for this study were used to drive the MIKE Flood model and allowed to perform an indicative assessment of the influence of opening the Southwest Passage on sediment transport, for the two modelled scenarios. This section first details the modelling process including initial set-up and a brief description of the scenarios tested. The remainder of this section details the MIKE Flood outputs and the applied methodology used to infer sediment transport rates Model Setup A detailed description of the MIKE Flood model used for this specific exercise can be found in Section 8. The model s main features of interest in the Southwest Passage area for this exercise were the following: Dynamic tidal water level boundary at the Moyne River entrance including astronomical tide, storm setup and sea level rise; and Dynamic tidal water level boundary at the Southwest Passage ocean entrance including astronomical tide, storm setup, sea level rise and wave setup. The only modification performed on the MIKE Flood model used in Section 8 was the removal of the Southwest Passage causeway. This was implemented in the model by adjusting the elevation of the grid cells representing the causeway to elevation levels of the adjacent grid cells in the Passage (Figure 9.1). This modification was performed under the assumption that the removal of the causeway would be performed independently of sand dredging in the Passage, resulting in the modified cells elevation based on the bed levels including accreted sand on top of underlying bedrock Design Modelling Conditions Sediment transport modelling was considered for two (2) different scenarios combining terrestrial and coastal flood events of different ARI as presented in Table 9.2. WRL Technical Report 2012/21 April 2013 FINAL 97
116 Table 9.2 Overview of Boundary Conditions Scenario # Riverine Ocean Boundary Boundary Conditions Conditions Planning Period & SLR Comments 6 10 year ARI 50 year ARI Present Day 0 m SLR Southwest Passage causeway removed from MIKE topographic grid 7 20 year ARI 100 year ARI m SLR Southwest Passage Causeway removed from MIKE topographic grid The boundary conditions for the terrestrial riverine inflows for the 10 and 20 year ARI events were unchanged from the previous modelling undertaken for the 2008 Port Fairy Regional Flood Study. The coastal boundary conditions were based on 50 and 100 year ARI coastal storm events and the sea level rise predictions for the present day and 2080 planning period detailed in Sections 5.3 and 5.4. The first boundary type was the implementation of dynamic water levels at the Moyne River entrance and within the Southwest Passage. The ocean boundary at the Moyne Rive entrance was created by using a Mean High Water Spring (MHWS) tide time series as a base, to which a tidal anomaly was added such that the peak water level corresponded to the ARI of the storm (1.03 m AHD for 100 year ARI) as can be observed on Figure Dynamic water levels were also implemented at the southern entrance of the Southwest Passage and included the influence of wave setup within this narrow and shallow channel. The dynamic water levels for the Southwest Passage were generated using the water levels time series used for the Moyne River entrance in combination with the 50 or 100 year ARI near shore wave conditions propagated within the passage. The resulting water levels in the Southwest Passage were found to be on average 1 m to 1.5 m higher than the ocean levels due to wave setup, as can be observed on Figure The resulting water level time series adopted for all considered scenarios are provided in Appendix C. This significant difference in water levels between the ocean side of the Southwest Passage and the Moyne River channel has been observed during coastal storms in the last decade and can be corroborated through anecdotal evidence (Figure 12.3). Under existing conditions, with the Southwest Passage causeway in place, this water level difference during storm conditions can be expected to result in overtopping of the causeway and the surrounding training walls, but only to induce limited flow from the ocean side of the passage towards the river channel. On the other hand, the water level difference caused by the oceanic wave setup can be expected to induce flow velocities from the Southwest Passage towards the Moyne River channel in absence of the causeway. This increase in flow velocities within the passage can be expected to induce sediment transport within the Southwest Passage. During the modelled catchment flooding conditions, the opening of the Southwest Passage causeway is predicted to result in an WRL Technical Report 2012/21 April 2013 FINAL 98
117 increased flow rate within the downstream section of the Moyne River channel and to increase the potential for sediment transport towards the river entrance Methodology for Sediment Transport Characterisation The hydraulic analysis performed using the MIKE Flood model provided grids of flow speed and direction. Based on the results of the sediment distribution analysis presented in Section 3.1, the sediment deposited within the Southwest Passage and the Moyne River channel was characterised by a median particle size (d 50 ) 0.2 mm. Using Shield s diagram for particle motion, and the average particle diameter (i.e. d 50 ) of 0.20 mm, critical shear stresses above which particle transport is initiated were calculated for the median sediment particles. The analysis involved generating maps of modelled depth averaged velocities for each scenario to compute shear velocities. The underlying analysis relates to a turbulent boundary layer where the velocity distribution can be considered to be approximately logarithmic and related to a shearing velocity. A boundary layer approximation (Chow, 1959) was used to assess the shear stress, which can be expressed as follows: Where: = Friction Velocity = Average Velocity = Von Karman Constant, taken as 0.4 (Chow 1959) = Height Boundary roughness Note that a boundary roughness of 0.5 mm was chosen for the exercise, in order to account for the effect of large particles on flow resistance, based on (Leopold et al., 1964; Limerinos,1970). It was determined that velocities greater than 0.5 m/s are sufficient to generate particle transport within the Southwest Passage. This allowed the identification of areas where sediments were potentially mobilised during the modelled flood event. The net direction of sediment transport was assessed by inferring the net direction of flow over the model runtime. This was performed by post processing depth averaged speed in the x and y planar directions from the MIKE Flood model results to generate maps of sediment transport direction Characterisation of Sediment Transport The sediment composition in the Southwest Passage and the Moyne River channel is dominated by fine to medium grained marine sands. WRL Technical Report 2012/21 April 2013 FINAL 99
118 Figure 9.2 and 9.3 provide the average velocity over the entire duration of the flood event for the two modelled scenarios. It can be observed that in both cases, the highest velocities experienced during the flood event are most prevalent at the junction of the Southwest Passage and the Moyne River channel and near the river entrance. The velocities experienced during both flood events are sufficient to generate sediment transport (see Figures 9.4 and 9.5). As such, sand particles are likely to be in suspension throughout the flood events for much of the Moyne River channel downstream of Gipps Street Bridge as well as within the Southwest Passage. The velocities experienced during Scenario 6 (50 year ARI coastal flood, 10 year catchment flood, no SLR) were assessed to be sufficient to generate sediment transport, as they exceed the 0.5 m/s threshold for over 90% of the duration of the flood within the Southwest Passage and over 50% of the duration of the flood within downstream section of the Moyne River channel. The velocities experienced during Scenario 7 (100 year ARI coastal flood, 20 year catchment flood, 0.8 m SLR) were assessed to be sufficient to generate sediment transport, as they exceed the 0.5 m/s threshold for over 95% of the duration of the flood within the Southwest Passage and over 85% of the duration of the flood within downstream section of the Moyne River channel. An analysis of the mean transport direction for both modelled scenarios showed that the sediment particles are likely to be transported downstream towards the river entrance during the modelled storm events. A comparison of the average depth velocity was performed for the case with the causeway in place (using the results of the flood modelling performed in Section 8) and for the case where it was removed. This comparison was performed for each design modelled conditions (i.e. 50 or 100 year coastal storm conditions respectively associated with a 10 or 20 year ARI catchment flood) and is presented in Figures 9.6 and 9.7. An average increase of 1.0 to 1.3 m/s was predicted in the Southwest Passage north of the causeway, reducing to 0.3 to 0.5 m/s in the downstream section of the Moyne River channel for the 50 year ARI coastal storm conditions with no SLR (comparison between Scenario 6 and Scenario 1). An average increase of 0.7 to 1 m/s was predicted in the Southwest Passage north of the causeway, reducing to 0.4 to 0.7 m/s in the downstream section of the Moyne River channel for the 100 year ARI coastal storm conditions with a 0.8 m SLR (comparison between Scenario 7 and Scenario 3). The increase in flow velocities when removing the causeway under a 0.8 m SLR scenario is observed to be less marked than for conditions with no SLR, as significant overtopping is expected to occur even with the causeway in place, and resulting in a flow rate from the Southwest Passage towards the Moyne River channel. An assessment was made of the potential scouring that could occur during a flood in the Southwest Passage to determine the potential extent to which the accumulated sand could be flushed into the river channel. A range of assumptions were made for these calculations. Firstly, the width of the passage was assumed to be a fixed distance between Martin s Point s training wall and the Puddeny Grounds training wall. Secondly, it was assumed that the majority of the floodwater would be conveyed via the Southwest Passage channel, with limited influence of the overtopping taking place in Puddeny Grounds. Thirdly, the depth of the bedrock was set at 3 m below the water level (and approximately 2 m below the sand bed). Finally, it was assumed that once sand was removed from the site no sand was available for infill. Based on the above assumptions, and using the 50 year average recurrence interval (ARI) coastal flooding event in combination with the 10 year ARI catchment event (Scenario 6), it was determined that the Southwest Passage has the potential to scour down to the bedrock levels. Indeed, even with the increased cross-sectional area provided by the scoured section, discharge velocities would be greater than 0.5 m/s during the 50 year ARI flooding event. WRL Technical Report 2012/21 April 2013 FINAL 100
119 9.5. Summary of Effects Opening the Southwest Passage The main focus of this exercise was to assess the potential influence of opening of the Southwest Passage causeway on sediment transport under coastal storm conditions. An analysis of the long term accumulated sand volumes in the Southwest Passage and on South Mole Beach shows that the benefit in term of sediment transport rate to East Beach resulting from the opening of the Southwest Passage (500 m 3 /year) can be considered as minor compared to the loss in sediment transport rate (2,500 m 3 /year) trapped by the training walls, which could potentially reach East Beach. The main results of this analysis show that: Sediment transport was initiated in the Southwest Passage and the downstream section of the Moyne River towards the river entrance under the modelled storm conditions. Under such extreme environmental conditions (i.e. 50/100 year ARI coastal storm and 10/20 year ARI riverine flood), modelling results indicate that the Moyne River would be self-flushing for a sediment characterised by a median particle size (d 50 ) 0.2 mm; and Under these conditions, accumulated sand within the Southwest Passage could potentially be scoured to bedrock levels and mobilised towards the Moyne River channel and river entrance. Increased scour within the downstream section of the Moyne River channel could also undermine the moles and training walls. The modelling exercise was only able to assess the potential for sediment transport within the Moyne River channel and could not provide any indication of sediment transport within East Beach embayment. While the present analysis indicates the potential for sediment transport from the Southwest Passage and the Moyne River channel towards East Beach during a storm event, the net volume of mobilised sand exiting through the river entrance during typical wave and riverine conditions was not investigated. It has been reported (Aurecon, 2010) that some of sediment from the passage migrated upstream under ambient conditions when the causeway was previously removed. Another potential consequence of the predicted sediment transport behaviour would probably be an increased accumulation of sediment in the downstream section of the Moyne River channel, requiring additional dredging effort in order to maintain navigable depths. Another major requirement for optimising the sediment pathway from the Southwest Passage to the southern end of East Beach would involve removing the north mole along the downstream section of the Moyne River. It should also be noted that the opening of the Southwest Passage is likely to have an impact on navigation conditions caused by a potential increase in surging currents within the downstream section of the Moyne River, and could increase the risk of navigation hazards. The consequences of the opening of the passage on sediment transport to East Beach can be summarised as follows: Increased wave climate, currents and water levels in the main channel, impacting navigation conditions; Probably increased sediment into Moyne River main channel requiring additional dredging effort; Relatively minor contribution to East Beach sediment transport rate when compared to sand trapped by southern training wall on South Mole Beach; WRL Technical Report 2012/21 April 2013 FINAL 101
120 Extra sand washed in from the opened passage will probably keep getting washed upstream under ambient conditions due to Lagrangian drift and tidal asymmetry; and Facilitating sediment transport to East Beach on a frequent basis (i.e. ambient conditions) would require the northern training wall to be removed. Additional modelling for ambient coastal and riverine conditions and/or sediment tracer studies would be needed to further assess the influence of the opening of the Southwest Passage on sediment transport and increase the certainty of the above postulations. The opening of the Southwest Passage would require the additional consideration of the following works: Modification of the Wannon Water sewage outfall currently located underneath the causeway; Design and construction of a permanent crossing over the Southwest Passage to provide pedestrian and vehicle access to Griffiths Island; and Raising of the crest of the Puddeny Grounds training walls to ensure pedestrian safety due to increased water levels caused by additional wave setup in the Southwest Passage. DSE has advised that the Department of Transport would require a full cost-benefit analysis of any work, which would have the potential to impact upon the functioning of the port of Port Fairy. WRL Technical Report 2012/21 April 2013 FINAL 102
121 Section 9 Key Findings If the Southwest Passage was opened: Sediment transport was initiated in the Southwest Passage and the downstream section of the Moyne River towards the river entrance under the modelled storm conditions; Under such extreme environmental conditions, modelling results indicate that the Moyne River would be self-flushing. However, this was not demonstrated for ambient conditions; Under storm conditions, accumulated sand within the Southwest Passage could potentially be scoured to bedrock levels and mobilised towards the Moyne River channel and river entrance; Increased wave climate, currents and water levels would reach the main channel, impacting navigation conditions; Increased sediment would probably enter the Moyne River main channel requiring additional dredging effort; The contribution to East Beach sediment transport is relatively minor when compared to sand trapped by southern training wall on South Mole Beach; Extra sand washed in from the opened Southwest Passage would probably keep getting washed upstream under ambient conditions due to wave action and/or tidal asymmetry. WRL Technical Report 2012/21 April 2013 FINAL 103
122 10. Review of Additional Coastal Hazards Windblown Sand Site visits and analysis of aerial photos indicate that there are no substantial hazards due to windblown sand (aeolian drift) in Port Fairy study area. A quantity of windblown sand will reach the built environment during strong winds, but as all dunes are vegetated, this quantity is anticipated to be minor and mobile dunes are not expected to threaten the built environment. The exception is some beach access points where pedestrian traffic has removed vegetation, lowered the sand levels and has formed a potential dune breach point. For a typical Port Fairy median sand grain size of 0.15 mm to 0.31 mm, sand movement is initiated for the following velocities referenced to an anemometer elevation of 10 m (CEM, 2002): Dry sand ~5.5 to 6.5 m/s (~11 to 13 knots, 20 to 23 km/hour) Wet sand ~10.5 to 11.5 m/s (~21 to 23 knots, 38 to 41 km/hour) Note that much higher wind speeds are required to mobilise wet sand compared to dry sand. Sand can become wet through waves and tide, or through precipitation. Therefore, reduced rainfall due to climate change has the potential to increase windblown sand volumes. The modelling of this is beyond the scope of this study. Note that a future adaptive response may require dunes to be raised, in which case detailed vegetation management plans and dune designs would need to be prepared. Works for dune reconstruction may need to involve detailed studies of aeolian mobilisation during the revegetation phase. Future climate change may alter the range of viable dune vegetation species Stormwater Erosion Stormwater erosion is a relatively minor hazard in Port Fairy as there are no large conveyance structures discharging directly onto sandy beaches. There are several mid-sized discharge structures on Ocean Drive Beach. However, the additional erosion resulting from these is minor and limited to within several metres of the structure as they are located on a mainly rocky platforms. The discharge pipes in the Southwest Passage extend into the water and the shoreline is generally rocky. The design of future stormwater outfalls needs to consider coastal processes, such as: The effect of elevated ocean water levels on the hydraulic performance of the system; and Local erosion caused by stormwater discharge and/or wave scour around the outfall. Water quality from discharged stormwater is likely to be a hazard, but is beyond the scope of this study to consider this issue. WRL Technical Report 2012/21 April 2013 FINAL 104
123 10.3. Seawater Intrusion into Groundwater Saline intrusion is one of several impacts on groundwater systems that may be associated with sea-level rise and climate change in the Port Fairy study area. Climate change could impact on both groundwater quantity and quality. Sea-level rise that contributes to saline intrusion or inundation is likely the most direct impact of climate change for coastal aquifer systems, particularly for shallow sandy aquifers. As noted in Section 4.1 of this report, the NCCOE (20012a) lists groundwater as one of 13 secondary process variables applicable to coastal engineering. In broad terms, sea-level rise and climate change can impact on groundwater equilibrium in a number of ways as follows (Crosbie, 2007; Ghassemi et al., 1991): Change in recharge e.g. rainfall, land use, river stage; Change in discharge e.g. demand for extraction, river stage; Change in storage e.g. sea-level rise, change in recharge or extraction. Table 10.1 summarises a range of other climate related processes and potential secondary impacts that could also occur. On the basis of very limited data, it is considered that seawater intrusion, seawater flooding and inundation could be relevant to the Port Fairy area. The relevance of other potential impacts of climate change on groundwater systems in the Port Fairy area cannot currently be quantified but may include flooding of bore heads, changing recharge and discharge patterns and associated risks to groundwater dependent ecosystems. There is also a possibility that subsidence of the land surface could occur as a secondary impact of changing groundwater balance. WRL Technical Report 2012/21 April 2013 FINAL 105
124 Table 10.1 Potential Impacts of Climate Change on Groundwater Systems Potential Impact Examples and Comments Possible Relevance to Port Fairy Area Raised water table causing inundation of septic systems Denmark (Andersen et al., 2003, 2006, 2007) High Seawater intrusion and lateral migration of the fresh-saline interface Seawater flooding and inundation of unconfined aquifers Flooding and saline contamination of bore heads Changing recharge in the aquifer catchment due to variable rainfall and evapotranspiration Increased groundwater extraction and decreased groundwater levels Changing discharge patterns that may impact on surface waters and groundwater dependent ecosystems Subsidence of land surface Saline intrusion reflects a change in groundwater balance in the catchment. E.g. Burdekin Delta (Narayan et al., 2003) Denmark (Andersen et al., 2003, 2006, 2007) Tsunami affected areas, New Orleans (Carlson et al., 2007) May be increased or decreased recharge depending on actual climatic variability (Mudd et al. 2006; Crosbie 2007) May occur if alternative water sources to drinking water are encouraged and groundwater usage is not capped (Commander, 2000; Yesertnener, 2003) Spring flow and baseflow in rivers and stream could increase or decrease (UKWIR, 2007) Secondary effect that may be related to increased groundwater extraction in areas with compressible sediments (Sun et al., 1999) High High Moderate Moderate Unknown Unknown Unknown In many coastal areas such as Port Fairy, the development and management of fresh groundwater resources are seriously constrained by the presence of seawater intrusion (Pittock, 2004). Seawater intrusion is a natural phenomenon that occurs as a consequence of the density contrast between fresh and saline groundwater. If conditions remain unperturbed, the saline water body will remain stationary unless it moves under tidal influences. However, when there is sea level change, pumping of freshwater, or changing recharge conditions, the saline body will gradually move until a new equilibrium condition is achieved (Ghassemi et al., 1996). Sustainable yield estimates for coastal aquifer systems need to account for possible seawater intrusion, which may limit increased usage of groundwater in some systems. If the sea level rises to higher predicted values (Section 4) over the next century, this would significantly increase intrusion of seawater into coastal aquifers. Recommendations for Monitoring and Investigation The key recommendation is to establish a network of groundwater bores in East Beach and around Ocean Drive which are instrumented to measure groundwater levels (to AHD) and salinity both average and extremes. As there are existing bores in the area, coordination of the data being collected needs to be undertaken in light of the recommendations in this study. Analysis of this data then needs to be undertaken. There are a number of recommendations for a more detailed assessment of possible sea level rise and climate change impacts on local groundwater systems which may not be the responsibility of Council. Priority desktop assessments are recommended that include the following tasks: Assessment of groundwater usage to determine current dependencies and strategic water supplies for future use; WRL Technical Report 2012/21 April 2013 FINAL 106
125 Mapping of groundwater bore locations and stratigraphic relationships to identify the most vulnerable bores in unconfined sandy aquifers; Mapping the projected areas over aquifer systems that may be impacted under various scenarios of sea-level rise and storm events. Baseline conditions for the saline-freshwater interface for important groundwater supply areas should be established. This work would involve installation of a transect of nested monitoring piezometers perpendicular to the shoreline and monitoring of groundwater levels and salinity. New and existing groundwater bores close to the coastline should be sampled for electrical conductivity (EC), ph, and major ions to establish baseline conditions. An assessment of cation concentrations would also enable an assessment of how the saline-fresh interface has been moving in the past. Increased groundwater management may be required in the future should groundwater extraction increase. Groundwater status reports at that time should consider groundwatersurface connectivity, recharge patterns, groundwater-dependent ecosystems and the potential for subsidence associated with groundwater extraction that may exacerbate the impacts of sealevel rise in coastal areas. Section 10 Key Findings No substantial hazards due to windblown sand (aeolian drift) in the Port Fairy study area have been identified; Future adaptive response may require dunes to be raised, in which case detailed vegetation management plans and dune designs would need to be prepared; Stormwater erosion was identified as a relatively minor hazard in Port Fairy as there are no large conveyance structures discharging directly onto sandy beaches; Water quality from discharged stormwater is currently the highest priority hazard associated with the stormwater network in the coastal area; Saline intrusion is one of several impacts on groundwater systems that may be associated with sea-level rise and climate change in the Port Fairy study area; Increased groundwater management may be required in the future in response to increased extraction or decreased supply. WRL Technical Report 2012/21 April 2013 FINAL 107
126 11. Coastal Hazards Mapping and Vulnerability Assessment Risk Areas for Coastal Erosion and Recession Hazards The erosion and recession hazard lines were estimated using the methodology presented in Section 6. Predicted coastal erosion hazard lines for sandy beaches in the Port Fairy study area are shown in Figures 11.1 to for each area for a 50 year ARI (2% AEP) erosion event with present day conditions and also for a 100 year ARI (1% AEP) erosion event with the 2050, 2080 and 2100 planning horizons. Both the scenarios, namely with rock revetment in place and rock revetment failure, were considered on the southern section of East Beach. Detailed assessment for individual properties may generate slightly different hazard line locations. The stretches of coastline dominated by rocky cliffs were highlighted in the coastal hazard mapping in order to clearly indicate coastal zone requiring further specific geotechnical investigation. Due to the lack of warning for landslides, and the potentially severe consequences of failure, it is recommended that professional advice from a Geotechnical Engineer be sought where existing development exists on rocky coasts within the default setbacks setback zones. An estimate of the number of private properties (defined by the allotment extent on provided cadastral boundaries) and public assets affected by the erosion and recession hazard lines is shown in Table This is an approximate estimate only, and does not consider building type or any specific protection works. A property is considered potentially affected by erosion if the erosion hazard line is within or intersects the property boundaries (and not necessarily the house or building). These assets would only be damaged or lost if the sea level rise and coastal change projections in this report eventuate and if adaptation was not undertaken or emergency action was not taken. Roads and other infrastructure such as sewer and stormwater lines, water mains and pumping stations, coastal reserves were also considered in the assessment. Table 11.1 Indicative Assets Potentially Impacted by Erosion and Recession Area Asset Planning Horizon Present Private Properties Public Buildings Sealed Road no - no - Unsealed Road no - no - Cape Reamur Sealed Car Park no - no - Unsealed Car Park no - no - (Figure 11.1) Parks/Reserves no - no - Beach Access Water Mains no - no - Sewer Mains no - no - Stormwater Lines no - no - WRL Technical Report 2012/21 April 2013 FINAL 108
127 Area Asset Planning Horizon Present Private Properties Public Buildings Sealed Road Unsealed Road yes - yes - Unnamed 7 Sealed Car Park no - no - (VIC 521) Unsealed Car Park no - no - (Figure 11.2) Parks/Reserves no - no - Beach Access no - no - Water Mains no - no - Sewer Mains no - no - Stormwater Lines no - no - Unnamed 6 (VIC 520) (Figure 11.2) Private Properties Public Buildings Sealed Road no - no - Unsealed Road yes - yes - Sealed Car Park no - no - Unsealed Car Park no - no - Parks/Reserves no - no - Beach Access no - no - Water Mains no - no - Sewer Mains no - no - Stormwater Lines no - no - Unnamed 5 (VIC 519) (Figure 11.3) Private Properties Public Buildings Sealed Road Unsealed Road yes - yes - Sealed Car Park no - no - Unsealed Car Park no - no - Parks/Reserves no - no - Beach Access no - no - Water Mains no - no - Sewer Mains no - no - Stormwater Lines no - no - WRL Technical Report 2012/21 April 2013 FINAL 109
128 Area Asset Planning Horizon Present Private Properties Public Buildings Sealed Road Unsealed Road yes - yes - Unnamed 4 Sealed Car Park no - no - (VIC 518) Unsealed Car Park no - no - (Figure 11.3) Parks/Reserves no - no - Beach Access no - no - Water Mains no - no - Sewer Mains no - no - Stormwater Lines no - no - Unnamed 3 (VIC 517) (Figure 11.4) Private Properties Public Buildings Sealed Road no no no no Unsealed Road yes yes yes yes Sealed Car Park no no no no Unsealed Car Park no no no no Parks/Reserves no no no no Beach Access no no no no Water Mains no no no no Sewer Mains no no no no Stormwater Lines no no no no Unnamed 2 (VIC 516) (Figure 11.5) Private Properties Public Buildings Sealed Road yes yes yes yes Unsealed Road no no no no Sealed Car Park no no no no Unsealed Car Park no no no no Parks/Reserves no no no no Beach Access no no no no Water Mains no no no no Sewer Mains no no no no Stormwater Lines no no no no WRL Technical Report 2012/21 April 2013 FINAL 110
129 Area Asset Planning Horizon Present Private Properties Public Buildings Sealed Road yes yes yes yes Unsealed Road no no no no Ocean Drive Beach Sealed Car Park yes yes yes yes (incl. Powling St) Unsealed Car Park yes yes yes yes (Figure 11.6) Parks/Reserves yes yes yes yes Beach Access Water Mains no yes yes yes Sewer Mains no yes yes yes Stormwater Lines yes yes yes yes Pea Soup Beach (Figure 11.7) Private Properties Public Buildings Sealed Road no yes yes yes Unsealed Road no no no no Sealed Car Park no yes yes yes Unsealed Car Park yes yes yes yes Parks/Reserves yes yes yes yes Beach Access Water Mains yes yes yes yes Sewer Mains no yes yes yes Stormwater Lines yes yes yes yes South Beach (Figure 11.8) Private Properties Public Buildings Sealed Road yes yes yes yes Unsealed Road no no no no Sealed Car Park yes yes yes yes Unsealed Car Park no no no no Parks/Reserves yes yes yes yes Beach Access Water Mains yes yes yes yes Sewer Mains no yes yes yes Stormwater Lines no no no no WRL Technical Report 2012/21 April 2013 FINAL 111
130 Area Asset Planning Horizon Present Private Properties Public Buildings Sealed Road no no no no Unsealed Road no no no no Griffiths Island Sealed Car Park no no no no Beach Unsealed Car Park no no no no (Figure 11.9) Parks/Reserves yes yes yes yes Beach Access no no no no Water Mains no no no no Sewer Mains no no no no Stormwater Lines no no no no South Mole Beach (Figure 11.10) Private Properties Public Buildings Sealed Road no no no no Unsealed Road no no no no Sealed Car Park no no no no Unsealed Car Park no no no no Parks/Reserves yes yes yes yes Beach Access no no no no Water Mains no no no no Sewer Mains no no no no Stormwater Lines no no no no East Beach (from Moyne River walls to SLSC) ROCK REVETMENT IN PLACE (Figure 11.11) Private Properties Public Buildings Sealed Road no no no no Unsealed Road no no no no Sealed Car Park no no no no Unsealed Car Park no no no no Parks/Reserves no no no no Beach Access Water Mains no no no no Sewer Mains no no no no Stormwater Lines no no no no East Beach (from Moyne River walls to SLSC) ROCK REVETMENT FAILURE (Figure 11.18) Private Properties Public Buildings Sealed Road yes yes yes yes Unsealed Road yes yes yes yes Sealed Car Park yes yes yes yes Unsealed Car Park yes yes yes yes Parks/Reserves no no yes yes Beach Access Water Mains yes yes yes yes Sewer Mains no yes yes yes Stormwater Lines no no no no WRL Technical Report 2012/21 April 2013 FINAL 112
131 Area Asset Planning Horizon Present Private Properties Public Buildings East Beach (from Sealed Road no no no no SLSC to Rock Unsealed Road no no no no Revetment End) Sealed Car Park no no no no Unsealed Car Park no no no no ROCK REVETMENT Parks/Reserves no no no no IN PLACE Beach Access (Figure 11.12) Water Mains no no no no Sewer Mains no no no no Stormwater Lines no no no no East Beach (from SLSC to Rock Revetment End) ROCK REVETMENT FAILURE (Figure 11.19) Private Properties Public Buildings Sealed Road yes yes yes yes Unsealed Road no no no no Sealed Car Park yes yes yes yes Unsealed Car Park no no no no Parks/Reserves yes yes yes yes Beach Access Water Mains yes yes yes yes Sewer Mains yes yes yes yes Stormwater Lines yes yes yes yes East Beach (from Rock Revetment End to Reef Point) (Figures ) Private Properties Public Buildings Sealed Road no no no yes Unsealed Road yes yes yes yes Sealed Car Park no no no no Unsealed Car Park yes yes yes yes Parks/Reserves yes yes yes yes Beach Access Water Mains no no no no Sewer Mains no no no no Stormwater Lines no no no no WRL Technical Report 2012/21 April 2013 FINAL 113
132 Area Asset Planning Horizon Present Private Properties Public Buildings Sealed Road no - no - Unsealed Road yes - yes - Sealed Car Park no - no - Reef Point Unsealed Car Park no - no - (Figure 11.16) Parks/Reserves yes - yes - Beach Access Water Mains no - no - Sewer Mains no - no - Stormwater Lines no - no - Killarney Beach (Figure 11.17) Private Properties Public Buildings Sealed Road yes - yes - Unsealed Road yes - yes - Sealed Car Park yes - yes - Unsealed Car Park yes - yes - Parks/Reserves yes - yes - Beach Access Water Mains no - no - Sewer Mains no - no - Stormwater Lines no - no Risk Areas for Coastal Inundation Areas subject to inundation under 50 year ARI (2% AEP) conditions for present day and 100 year ARI (1% AEP) for the 2050, 2080 and 2100 planning horizons are shown in Figures to The presented inundation areas for the Port Fairy study area were derived from the combined analysis of the results of the bathtub inundation levels (incorporating astronomical tide, barometric setup and wave setup) and the dynamic coastal inundation numerical modelling assessment for the coastal area of the Port Fairy township (estimating combined ocean and catchment flooding). As explained in Section 7, the inundation levels obtained using bathtub inundation modelling were derived from the maximum coastal elevated water levels due to tide, storm surge wave setup and sea level rise projection, and applied directly over inland areas. While this method is usually conservative as it does not take into account the propagation of flood waters inland and consider the flood to be driven by an infinite volume of water, it does allow an initial estimate of inundation level and extent and was used over the whole Port Fairy study area (i.e. from Cape Reamur to Cape Killarney). The second method used in this study is referred to as dynamic coastal inundation numerical modelling and was presented in details in Section 8. This method allowed the estimation of the possible inundation under combined ocean and catchment flooding, through hydrodynamic WRL Technical Report 2012/21 April 2013 FINAL 114
133 modelling of the Moyne River and the Belfast Lough. This specific coastal flood analysis considered dynamically both the coastal elevated water levels (i.e. sea level rise projections, storm surge and wave setup) and the wave runup overtopping of the foreshore and coastal structures. The modelling allowed consideration of the variation of the coastal and riverine water levels over the duration of the flood event, as well as how the flood waters would propagate inland due to ground elevation or obstacles. This modelling exercise was only performed over the coastal area directly around the Port Fairy township (i.e. western end of Ocean Drive to eastern end of East Beach, due to modelling limitations. After preliminary presentation of the results for bathtub and dynamic modelling and discussion with MSC, DSE and GHCMA, it was agreed WRL would provide a unique set of inundation mapping for this report. This mapping output was based on information derived from both inundation methods, taking into consideration the geographic coverage extent, planning period investigated, potential influence of stormwater network and qualities of each inundation modelling method. Inundation mapping for the coastline sub-section between Cape Reamur and Unnamed 3 Beach (VIC 516) was solely derived from bathtub modelling, as this area was not covered by the MIKE Flood model. Inundation mapping for the coastline sub-section between Ocean Drive Beach (VIC515) and the eastern end of East Beach was based on the results from the dynamic modelling in order to take into account the influence of coincident catchment flooding along the Moyne River and the Belfast Lough. Potential connectivity through the stormwater network was taken into consideration locally around Powling Street, Southcombe Park and the Russell Clarke Reserve, with limited inclusion of the bathtub modelling outputs. Inundation mapping for the coastline sub-section between Reef Point Beach and Cape Killarney was solely derived from bathtub modelling, as this area was not covered by the MIKE Flood model. Finally, inundation mapping for the whole Port Fairy study area for the 2100 planning period (0.8 m SLR) was solely derived from bathtub modelling, as this scenario was not investigated by the dynamic coastal inundation numerical modelling exercise. The inundation areas were mapped based on ground elevation (the bare earth 2007 LIDAR layer) and do not consider flow paths and velocities. The potential for inundation does not necessarily preclude new development, but such inundation potential should be considered in the design of buildings and infrastructure, and in emergency planning. The peak of inundation events would persist for approximately two (2) hours with the peak of the tide. However, subject to topography, substantial ponding may remain in some areas well after the storm level peak. An estimate of the number of private properties (defined by the allotment extent on provided cadastral boundaries) and public assets potentially affected by the coastal inundation is shown in Table This is an approximate estimate only, and does not consider building type or any specific protection works. A property is considered potentially affected by inundation if the inundation extent is within or intersects the property boundaries (and not necessarily the house or building). WRL Technical Report 2012/21 April 2013 FINAL 115
134 Table 11.2 Indicative Assets Potentially Impacted by Coastal Inundation Area Asset Planning Horizon Present Private Properties Public Buildings Sealed Road no - no - Unsealed Road no - no - Cape Reamur (Figure 11.20) Sealed Car Park Parks/Reserves no no - - no no - - Unsealed Car Park Beach Access no no Water Mains no - no - Sewer Mains no - no - Stormwater Lines no - no - Coastal protection work Not applicable Unnamed 7 (VIC 521) (Figure 11.21) Private Properties Public Buildings Sealed Road no - no - Unsealed Road no - no - Sealed Car Park no - no - Unsealed Car Park no - no - Parks/Reserves no - no - Beach Access Water Mains no - no - Sewer Mains no - no - Stormwater Lines no - no - Coastal protection work Not applicable WRL Technical Report 2012/21 April 2013 FINAL 116
135 Area Asset Planning Horizon Present Private Properties Public Buildings Sealed Road no - no - Unsealed Road yes - yes - Unnamed 6 Sealed Car Park no - no - (VIC 520) Unsealed Car Park no - no - Parks/Reserves no - no - (Figure 11.21) Beach Access Water Mains no - no - Sewer Mains no - no - Stormwater Lines no - no - Coastal protection work Not applicable Unnamed 5 (VIC 519) (Figure 11.22) Private Properties Public Buildings Sealed Road no - no - Unsealed Road no - no - Sealed Car Park no - no - Unsealed Car Park no - no - Parks/Reserves no - no - Beach Access Water Mains no - no - Sewer Mains no - no - Stormwater Lines no - no - Coastal protection work Not applicable Unnamed 4 (VIC 518) (Figure 11.22) Private Properties Public Buildings Sealed Road no - no - Unsealed Road no - yes - Sealed Car Park no - no - Unsealed Car Park no - no - Parks/Reserves no - no - Beach Access Water Mains no - no - Sewer Mains no - no - Stormwater Lines no - no - Coastal protection work Not applicable WRL Technical Report 2012/21 April 2013 FINAL 117
136 Area Asset Planning Horizon Present Private Properties Public Buildings Sealed Road no no no no Unsealed Road yes yes yes yes Unnamed 3 Sealed Car Park no no no no (VIC 517) Unsealed Car Park no no no no Parks/Reserves no no no no (Figure 11.23) Beach Access Water Mains no no no no Sewer Mains no no no no Stormwater Lines no no no no Coastal protection work Not applicable Unnamed 2 (VIC 516) (Figure 11.24) Private Properties Public Buildings Sealed Road yes yes yes yes Unsealed Road no no no no Sealed Car Park no no no no Unsealed Car Park no no no no Parks/Reserves no no no no Beach Access no no no no Water Mains no no no no Sewer Mains no no no no Stormwater Lines no no no no Coastal protection work Not applicable Ocean Drive Beach (incl. Powling St) (Figure 11.25) Private Properties Public Buildings Sealed Road yes yes yes yes Unsealed Road no no no no Sealed Car Park no no no no Unsealed Car Park no yes yes yes Parks/Reserves yes yes yes yes Beach Access Water Mains yes yes yes yes Sewer Mains yes yes yes yes Stormwater Lines yes yes yes yes Coastal protection work Not applicable WRL Technical Report 2012/21 April 2013 FINAL 118
137 Area Asset Planning Horizon Present Private Properties Public Buildings Sealed Road yes yes yes yes Unsealed Road no no no no Pea Soup Beach (Figure 11.26) Sealed Car Park Parks/Reserves no yes no yes no yes no yes Unsealed Car Park Beach Access no 3 no 3 no 3 no 3 Water Mains no no no yes Sewer Mains no no no yes Stormwater Lines no no no yes Coastal protection work Not applicable South Beach (Figure 11.27) Private Properties Public Buildings Sealed Road no no no yes Unsealed Road no no no no Sealed Car Park no no no no Unsealed Car Park no no no no Parks/Reserves yes yes yes yes Beach Access Water Mains no no yes yes Sewer Mains no no yes yes Stormwater Lines no no yes yes Coastal protection work Not applicable Griffiths Island Beach (Figure 11.28) Private Properties Public Buildings Sealed Road no no no no Unsealed Road no no no no Sealed Car Park no no no no Unsealed Car Park no no no no Parks/Reserves yes yes yes yes Beach Access Water Mains no no no no Sewer Mains yes yes yes yes Stormwater Lines no no no no Coastal protection work yes yes yes yes WRL Technical Report 2012/21 April 2013 FINAL 119
138 Area Asset Planning Horizon Present Private Properties Public Buildings Sealed Road yes yes yes yes Unsealed Road no no no no South Mole Beach Sealed Car Park yes yes yes yes and Southwest Unsealed Car Park no no no no Passage causeway Parks/Reserves yes yes yes yes (Figure 11.29) Beach Access Water Mains no no no no Sewer Mains no no no no Stormwater Lines no no no no Coastal protection work yes yes yes yes East Beach (from Moyne River walls to SLSC) (Figure 11.30) Private Properties Public Buildings Sealed Road yes yes yes yes Unsealed Road yes yes yes yes Sealed Car Park yes yes yes yes Unsealed Car Park yes yes yes yes Parks/Reserves yes yes yes yes Beach Access Water Mains yes yes yes yes Sewer Mains yes yes yes yes Stormwater Lines yes yes yes yes Coastal protection work yes yes yes yes East Beach (from SLSC to Rock Revetment End) (Figure 11.31) Private Properties Public Buildings Sealed Road yes yes yes yes Unsealed Road no no no no Sealed Car Park no no no yes Unsealed Car Park no no no no Parks/Reserves yes yes yes yes Beach Access yes yes yes yes Water Mains yes yes yes yes Sewer Mains yes yes yes yes Stormwater Lines yes yes yes yes Coastal protection work yes yes yes yes WRL Technical Report 2012/21 April 2013 FINAL 120
139 Area Asset Planning Horizon Present Private Properties Public Buildings Sealed Road yes yes yes yes Unsealed Road yes yes yes yes East Beach (from Sealed Car Park no no no no Rock Revetment Unsealed Car Park no no no no End to Reef Point) Parks/Reserves yes yes yes yes (Figure ) Beach Access no no no no Water Mains no no no no Sewer Mains no no no no Stormwater Lines no no no no Coastal protection work no no no no Reef Point (Figure 11.35) Private Properties Public Buildings Sealed Road no - no - Unsealed Road yes - yes - Sealed Car Park no - no - Unsealed Car Park no - no - Parks/Reserves yes - yes - Beach Access Water Mains no - no - Sewer Mains no - no - Stormwater Lines no - no - Coastal protection work yes - yes - Killarney Beach (Figure 11.36) Private Properties Public Buildings Sealed Road yes - yes - Unsealed Road yes - yes - Sealed Car Park yes - yes - Unsealed Car Park yes - yes - Parks/Reserves yes - yes - Beach Access Water Mains no - no - Sewer Mains no - no - Stormwater Lines no - no - Coastal protection work Not Applicable WRL Technical Report 2012/21 April 2013 FINAL 121
140 11.3. Assessment of Individual Beaches The individual beach assessment was developed on the basis of the erosion projections and the table of assets provided in Sections 11.1 and 11.2, under 50 year ARI (2% AEP) conditions for present day and under 100 year ARI (1% AEP) for the 2050, 2080 and 2100 planning horizons. The assessment includes discussion of the private properties and/or public assets affected by inundation caused by static inundation (i.e. including storm surge and wave setup) as well as wave run up. A property is considered potentially affected by inundation/erosion if the inundation/erosion extent is within or intersects the property boundaries (and not necessarily the house or building). However, it should be noted that the occurrence of inundation may result in no damage, or range from nuisance flooding for some assets to major damage for others Cape Reamur There are no identified publicly managed assets or infrastructure at risk of coastal inundation or erosion, in the present to 2100 planning period Unnamed 7 Beach (VIC 521) There are 3 allotments on VIC 521 beach. Due to setbacks, these 3 allotments are at risk for the present day. The 3 allotments are in potentially inundated areas for the present day. There are no identified publicly managed assets or infrastructure at risk of coastal inundation or erosion, in the present to 2100 planning period Unnamed 6 Beach (VIC 520) There are 5 allotments on VIC 520 beach. Due to setbacks, 4 allotments are at risk for the present day. The 5 allotments are in potentially inundated areas for the present day. There are no identified publicly managed assets or infrastructure at risk of coastal inundation or erosion, in the present to 2100 planning period Unnamed 5 Beach (VIC 519) There are 2 allotments on VIC 519 beach. Due to setbacks, the 2 allotments are at risk for the present day. These 2 allotments are in potentially inundated areas for the present day. There are no identified publicly managed assets or infrastructure at risk of coastal inundation or erosion, in the present to 2100 planning period Unnamed 4 Beach (VIC 518) There are 2 undeveloped allotments on VIC 518 beach. Due to setbacks, the 2 allotments are at risk by These 2 allotments are in potentially inundated areas for the present day. The only identified public infrastructure at immediate risk of inundation, in the event of dune breaching is a gazetted unsealed road. This risk would continue to increase to It should be noted that this gazetted road could be at present risk of erosion in the event of a salient loss. WRL Technical Report 2012/21 April 2013 FINAL 122
141 Unnamed 3 Beach (VIC 517) There are 5 undeveloped beachfront allotments on VIC 517 beach and 3 additional developed allotments located further inland. Due to setbacks, 3 of the beachfront allotments are at risk from present day erosion, increasing to 6 by of these allotments are in potentially inundated areas for the present day, increasing to 7 by The only identified public infrastructure at immediate risk of inundation, in the event of dune breaching is a gazetted unsealed road. This risk would continue to increase to It should be noted that this gazetted road could be at present risk of erosion in the event of a salient loss Unnamed 2 Beach (VIC 516) There are approximately 11 beachfront allotments on VIC 516 beach. Due to setbacks, all of these are at risk from present day erosion. These 11 allotments are in potentially inundated areas for the present day. The only identified public infrastructure at immediate risk of inundation, in the event of dune breaching is Thistle Place Road. This risk would continue to increase to Ocean Drive Beach and Powling Street No coastal structure is present at the back of Ocean Drive Beach. No developed allotment is considered at risk from present day erosion. The total number of allotments at risk of erosion hazard would increase to 13 by 2050 and to 65 by 2100, due to the erosion hazard line crossing Ocean Drive roadway. The main public assets and infrastructure considered at present risk from coastal erosion are the Ocean Drive unsealed car park and the two concrete stormwater pipes crossing the beach. This risk would increase with time and include multiple roads (Ocean Drive, Steven Street, Philip Street, Jehu Street and Powling Street), as well as the stormwater, water supply and sewerage infrastructure in the 2050 planning period and onwards. There are 47 allotments in potentially inundated areas affected by elevated water levels and wave run up for the present day along Powling Street, Brophy Street, Ocean Drive and Anna Catherine Drive, increasing to 57 by 2100 with high sea level rise. At present, the public infrastructure at increasing risk of coastal inundation (i.e. wave setup and wave runup) is Ocean Drive and parts of the sewerage, stormwater and water supply infrastructure landward of Ocean Drive. This risk would continue to increase to Additionally, infrastructure, including road, sewerage, stormwater and water network, could be at immediate risk of inundation, in the event of dune breaching, wave runup or back flow through the stormwater network and would be located around the lower sections of Powling Street and northwest of Philip Street Pea Soup Beach No publicly managed coastal structure is present at the back of Pea Soup Beach. A large rock wall fronting a private property is present on the eastern part of Pea Soup Beach was not included in the erosion study as it is privately managed. This developed allotment is considered at risk from present day erosion. The total number of allotments at risk of erosion hazard would increase to 21 by 2100, due to the hazard line crossing Ocean Drive. The main public assets and infrastructure considered at present risk from coastal erosion are the Pea Soup Beach turf car WRL Technical Report 2012/21 April 2013 FINAL 123
142 park and timber stair access. Ocean Drive road, Pea Soup Beach sealed car park and the stormwater, water supply and sewerage infrastructure would be considered at risk of erosion in the 2050 planning period, with increasing risk to There are 45 allotments in potentially inundated areas affected by elevated water levels and wave run up for the present day along Mills Crescent, Reardon Street, Singleton Street and Hill Street, increasing to 74 by 2100 with high sea level rise. Additionally, infrastructure including road, sewerage, stormwater and potable water network, could be at immediate risk of inundation in the event of dune breaching or back flow through the stormwater network and would be located around the lower sections of Powling Street and Mills Crescent South Beach and Sandy Cove Area No coastal structure is present at the back of South Beach. The main public assets and infrastructure considered at present risk from coastal erosion are the South Beach car park and the adjacent section of Ocean Drive. This risk would increase with time and include the public amenities block located on the other side of Ocean Drive, as well as the stormwater, water supply and sewerage infrastructure in the 2050 planning period. At present, the main infrastructure at increasing risk of inundation is the section Ocean Drive in the Sandy Cove area. The Southcombe Park and the adjacent caravan park, the Russell Williams Reserve, sewerage, stormwater and water supply infrastructure landward of Ocean Drive would be immediately at risk of inundation and this risk would continue to increase to It should also be noted that The Passage car park on Ocean Drive as well as South Beach car park would be at risk of wave run up inundation in the 2080 and 2100 planning periods Griffiths Island Beach No coastal structure is present at the back of this section of this beach. The only public asset at risk of present and future erosion and/or inundation would be part of the natural ecological reserve, including pedestrian tracks, located in the lee of the beach. It should be noted that the main sewerage line to the offshore outfall is located immediately west of Griffiths Island Beach and that it could be potentially impacted by erosion and/or coastal inundation, but (subject to detailed engineering analysis) is probably sufficiently robust to withstand occasional inundation South Mole Beach and Southwest Passage No working coastal structure is present at the back of South Mole Beach (i.e. Lighthouse Beach). An old buried breakwater is present next to the Moyne River training wall and would be further exposed due to future erosion/recession. The other public asset at risk of present and future erosion would be part of the natural ecological reserve, including pedestrian tracks, located in the lee of South Mole Beach. It should be noted that recession of South Mole Beach would increasingly expose the southern part of the Moyne River mole and would require monitoring of the newly exposed sections for potential damage. WRL Technical Report 2012/21 April 2013 FINAL 124
143 The natural ecological reserve located in the lee of the beach is at immediate and increasing risk of coastal inundation. The lighthouse is at risk of wave runup inundation for the 2080 and 2100 planning periods. The area around the Southwest Passage causeway has been included in this subsection. The car park, information building, main causeway and pedestrian access along the Moyne River training walls are under immediate risk of overtopping East Beach (From Moyne River Training Walls to SLSC) Along the southern section of East Beach, with the rock revetment in place, the assets at risk of coastal erosion/recession are the multiple beach accesses, some of them consisting of timber stairs. If the rock revetment was removed or failed, the access roads (i.e. Lydia Place, Roger Place and Battery Lane) from Griffiths Street to East Beach and Apex Park would be considered at risk of erosion for the present day planning horizon. Approximately 41 developed allotments would be considered at risk from present day erosion, increasing to 67 by In the 2050 planning period, additional public assets under risk of coastal erosion would include the amenities block located at Apex Park as well as part of the water and sewerage network. The Battery Hill Reserve would be exposed to increasing erosion risk over time, with the Battery Hill monument affected by There are approximately 80 allotments on the western side of the Moyne River channel located on Gipps Street. There are approximately 28 allotments in potentially inundated areas for the present day, increasing to 80 by 2100 with high sea level rise. No allotments are at risk under present day conditions alongside Griffiths Street on the eastern bank of the Moyne River. Approximately 40 allotments alongside Griffiths Street on the eastern bank of the Moyne River are in potentially inundated areas by 2050, increasing to 54 by 2100 with high sea level rise. The public infrastructure currently at risk of inundation from the Moyne River side includes sections of Griffiths Street, stormwater and water lines, and part of the sewerage network. The buildings currently at risk of inundation are mainly located next to the Port Fairy Harbour. There would be an increasing risk to buildings over time with four buildings at immediate risk, three further buildings at risk by 2080 and a total of eight buildings affected by Some of these building host equipment from the Port Authority. The playground and amenities block located at Martin s Point, on the western side of the Moyne River would be at risk of inundation for the present day planning horizon, extending to the playground and amenities block in the 2050 planning period. The car parks located at Battery Lane would be at limited risk of wave runup inundation in the 2100 planning period. Most of the rock revetment would be at increased risk of wave runup overtopping by the 2050 planning period. The Moyne River moles on the ocean side of East Beach are considered at risk of overtopping for the present day planning horizon East Beach (From SLSC to Rock Revetment End) Along the central section of East Beach, where the rock revetment is in place, the assets at risk of coastal erosion/recession are the multiple beach accesses, some of them consisting of timber stairs. WRL Technical Report 2012/21 April 2013 FINAL 125
144 If the rock revetment was removed or failed, the SLSC building, the SLSC car park and public amenities building, as well as Beach Street would be at risk of coastal erosion for the present day planning horizon. This would also put approximately 45 developed allotments at risk from present day erosion. The stormwater and potable water lines behind the rock revetment and the sewerage servicing the SLSC and amenities block would also be at risk. Additionally, all access roads (i.e. Hughes Avenue, Bourne Avenue, Richie Street, Hanley Crescent, Manifold Street, Connolly Street) from Griffiths Street to East Beach would be at risk from erosion for the 2050, 2080 and 2100 planning horizons, which would increase the total number of allotments at risk of erosion to approximately 95 by the 2100 planning horizon. There are additionally approximately 101 allotments on the Belfast Lough side of Griffiths Street. There are approximately 93 houses in potentially inundated areas for the present day, increasing to 101 by 2100 with high sea level rise. Approximately 3 allotments on the eastern side of Griffiths Street are in potentially inundated areas for the present day, increasing to 56 by 2100 with high sea level rise. The public infrastructure currently at risk of inundation from the Moyne River side includes sections of Griffiths Street, stormwater and potable water lines, and part of the sewerage network. This would extend to the lower sections of the access roads (i.e. Hughes Avenue, Bourne Avenue, Richie Street, Hanley Crescent, Manifold Street, Connolly Street) from Griffiths Street to East Beach for the 2050, 2080 and 2100 planning horizons. The SLSC building would be considered at risk of wave runup inundation in the 2050 planning horizon. The SLSC car park and amenities block would be at risk of wave runup inundation in the 2100 planning horizon. Most of the rock revetment would be at increased risk of wave runup overtopping in the 2050 planning period East Beach (From Rock Revetment End to Reef Point) No coastal structure is present at the back of this section of East Beach. The public assets and infrastructure considered at risk from coastal erosion are located around Mills Reef beach access. They include the presently damaged chain and board beach access, the unsealed car park as well as the unsealed road access from Skenes Road. The results of the erosion study, at what is referred to as the Dune Breach site, has shown that the dune system could be at a very high risk of breaching by the 2080 planning horizon. Additionally, there are five (5) undeveloped allotments located immediately north of the rock revetment which are all considered at immediate risk from coastal erosion. There is currently one (1) developed allotment on the northern side of Skenes Road, which is not at risk from present day and future erosion. At present, the main infrastructure at risk of inundation is Skenes Road, due to elevated water levels in the Belfast Lough. The risk of inundation of this road and of the developed allotment would be increased in the eventuality of dune breaching. It should be noted that the turfed airstrip is presently under the risk of flooding from the Belfast Lough. It should also be noted that the existing risk of contaminant release due to erosion at the Night Soil Site and the Old Municipal Tip site will likely increase with time if no rehabilitation or protection work, either temporary or permanent, is implemented. WRL Technical Report 2012/21 April 2013 FINAL 126
145 Reef Point No coastal structure protects the back of this beach. The public assets and infrastructure considered at risk from coastal erosion and inundation consist of the multiple public beach accesses, a section of the unsealed road access from Skenes Road, as well as part of the Belfast Lough Reserve. It should be noted that part of the golf course and the existing sand fence are also considered at risk from coastal erosion and inundation. The Port Fairy Golf Club buildings are in potentially inundated areas for the present day and under increased risk by 2080 with high sea level rise. It should also be noted that Reef Point is also potentially at risk from increased coastal erosion due to salient loss Killarney Beach No coastal structure protects the back of this beach. The public assets and infrastructure considered at risk from coastal erosion consist of the multiple public beach accesses (including a concrete boat ramp), the two car parks and road accesses from Mahoneys Road, as well as part of the Belfast Lough Reserve. The caravan park and the multiple public amenities buildings, as well as the sport oval, are considered to be at risk from immediate and future coastal inundation. There are currently five (5) developed allotments on the unsealed section of Skenes Road. Due to setbacks, none of these are at risk from present day and future erosion. Four (4) of these allotments are in potentially inundated areas for the present day and under increased risk by 2080 with high sea level rise. WRL Technical Report 2012/21 April 2013 FINAL 127
146 Section 11 Key Findings Coastal Erosion Hazard Mapping of predicted coastal erosion hazard lines was performed over the Port Fairy study area for sandy beaches and rocky cliffs with present day conditions and for the 2050, 2080 and 2100 planning horizons; Both the scenarios, namely with rock revetment in place and rock revetment failure, were considered on the southern section of East Beach; With the rock revetment in place on East Beach, the areas most impacted by the recession and erosion hazards for the 2080 planning horizon are located around Ocean Drive Beach and Pea Soup Beach. In the case of the East Beach rock revetment failure, a significant number of beachfront properties located along Griffith Street would likely be impacted; An estimate of the number of private properties (defined by the allotment extent on provided cadastral boundaries) and public assets affected by the erosion and recession hazard lines is provided below: Scenario Asset Planning Horizon Present 2080 East Beach Rock Revetment In Place Private Properties Public Buildings 0 1 East Beach Rock Revetment Failure Private Properties Public Buildings 2 4 Coastal Inundation Hazard The presented inundation areas for the Port Fairy study area were derived from the combined analysis of the results of the bathtub inundation levels and the dynamic coastal inundation numerical modelling assessment for the coastal area of the Port Fairy township; The areas most impacted by the coastal inundation hazard at present are located along Ocean Drive, the Moyne River Channel and south of the Belfast Lough; For the 2080 planning horizon, additional properties would most likely be impacted along Ocean Drive due to increased wave overtopping and the south of the Belfast Lough; An estimate of the number of private properties (defined by the allotment extent on provided cadastral boundaries) and public assets affected by the inundation hazard is shown in: Asset Planning Horizon Present 2080 Private Properties Public Buildings WRL Technical Report 2012/21 April 2013 FINAL 128
147 12. Coastal Risk Monitoring Options This section first provides the reader with an introduction to the concepts of maintenance and monitoring of coastal structures as well as adaptation options to climate change. This is followed by a review of the suitability of the existing protection structures over the two identified planning timeframes (present day and 2080). The hazards and subsequent risks as applied through this study over the various timescales are then analysed to assess the suitability of these structures and to assist Council in identifying opportunities to upgrade/replace those structures at some future time Monitoring and Maintenance of Onshore Coastal Structures Over the life of a coastal protection structure, the structural components are susceptible to damage and deterioration. Damage is usually thought of as structure degradation that occurs over a relatively short period such as a single storm event. Deterioration is a gradual aging of the structure and its components over time, it can progress slowly, and often goes undetected because the seawall continues to function as originally intended. However, if left uncorrected, continual deterioration can lead to partial or complete failure of the structure. The implementation of an adequate maintenance program is therefore critical in order to ensure that a seawall continues to operate during its designed life. USACE (2003) defines the goal of a seawall maintenance program as to recognize potential problems and to take appropriate actions to assure the project continues to function at an acceptable level. Coastal defence structure maintenance consists of the following essential elements: Structure inspection and monitoring of both environmental conditions and structure response; Evaluation of inspection and monitoring data to assess the structure s physical condition and its performance relative to the design specifications; Determining an appropriate response based on evaluation results. Possible responses are no action, rehabilitation, or repair, of all or portions of the structure. The main monitoring issues are to assess what parameters of the coastal protection structure to monitor, how to evaluate the monitoring data and consequently if preventive or corrective action needs to be undertaken. The key structural parameters of existing coastal structures to monitor include: Structure Toe and Crest Levels; Armour composition; Structural integrity of the structure; Wave overtopping; Beach scour and bedrock levels; and Water table levels. WRL Technical Report 2012/21 April 2013 FINAL 129
148 The following documents provide guidance on monitoring and maintenance of coastal structures: CIRIA (2007), The Rock Manual: the use of rock in hydraulic engineering, 2nd edition, CIRIA C683, London. Coastal Engineering Manual (USACE, 2003), Chapter 8 Monitoring, Maintenance and Repair of Coastal Projects, EM (Part VI) 1 June 2006, US Army Corps of Engineers. Bray, R N, Tatham, P F B (1992). Old Waterfront Walls: Management, maintenance, and rehabilitation. E. & F.N. Spon (Imprint of Chapman and Hall), London, 1992, ISBN , 267 pp. There are numerous Australian Standards which cover materials involved in coastal structures, but there are none which specifically address the design of coastal structures. AS4997 (2005) Guidelines for the design of marine structures excludes rubble coastal engineering structures but contains valuable information on probability and the choice of a design event. It is noted that the design life of a normal coastal structure is 50 years. The Institution of Engineers Australia (Engineers Australia) has published the following series of three relevant guidelines for effectively considering climate change and ecological sustainability: Engineers Australia (2012a), Guidelines for Responding to the Effects of Climate Change in Coastal and Ocean Engineering. First published 1991, updated 2012, revised and published September Prepared by the NCCOE of Engineers Australia, published by EA Books, PO Box 588, Crows Nest, NSW; Engineers Australia (2012b), Coastal Engineering Guidelines for Working With the Australian Coast in an Ecologically Sustainable Way. First published 2004, revised and published September Prepared by the NCCOE of Engineers Australia, published by EA Books, PO Box 588, Crows Nest, NSW; and Engineers Australia (2012c), Climate Change Adaptation Guidelines in Coastal Management and Planning Published September Prepared by the NCCOE of Engineers Australia, published by EA Books, PO Box 588, Crows Nest, NSW. Coastal structures monitoring can typically be divided between condition monitoring and performance monitoring. Condition monitoring is the basis for the implementation of a successful preventive maintenance program. Coastal structures condition monitoring should always involve at least visual inspection of the structure, and in some cases the inspection can be augmented with measurements to quantify the current structure condition relative to the baseline condition. As described in Bray & Tatham (1992), such inspections can be described according to the following terminology: Superficial Inspections: this type of inspection should be carried out multiple times a year and reports any defects changes or unusual features of the structure; General Inspections: this type of inspection, carried out by trained technical staff, is more formal and detailed, and is recommended to take place approximately every two years. Monitoring of specific locations can be carried out; WRL Technical Report 2012/21 April 2013 FINAL 130
149 Principal Inspections: Principal inspections include a detailed examination of all aspects of the structure, including any areas underwater or with difficult access. These inspections should be carried out at intervals of between two to ten years, depending of the age of the structure and are carried out by qualified engineers; Special Inspections: These investigations are carried out following specific events such as extreme events, floods, storms or when any other inspection indicates a cause for major concern. Performance monitoring of a structure should mainly focus on the assessment of the principal function of preventing or alleviating overtopping and flooding of the land and the structures behind the seawall due to storm surge and waves. This would typically be undertaken during large wave or high sea level conditions, and preferably when both combine Adaptation of Coastal Structures to Climate Change Local Governments are generally responsible for the maintenance of coastal protection infrastructure, such as seawalls which they are constructed on Council managed land in order to provide a level of protection to the community. These responsibilities create a number of challenges for Local Governments in the context of climate change, as they have not only to consider historical climate variability but potential additional variability due to future climate change. The response to climate change requires a dual approach (DEWR, 2007): Management and reduction of our contribution to climate change (defined as mitigation); and Making adjustments to existing activities and practices so that vulnerability to potential impacts associated with climate change can be reduced and opportunities realised (defined as adaptation). Mitigation involves actions to reduce greenhouse gas emissions and/or enhance greenhouse gas sinks in order to offset or reverse the effects of climate change. Local governments have already made significant progress towards mitigation with councils engaged in efforts to reduce greenhouse gas emissions and waste (Smith et al. 2008). Adaptation to climate change aims to reduce the risks associated with future changes in climate. However, it additionally seeks to harness beneficial opportunities that may arise under a changed future climate system. Adaptation is a mechanism to manage risks and adjust economic activity to reduce vulnerability. In regard to existing infrastructure, the recommended adaptation action by a Local Government Authority can be summarised as: Monitor any changes to the condition in structures so that any modifications/retrofitting occurs in a timely manner and prior to failure; Identify alternative options should the existing buildings and infrastructure be impacted upon in order to maintain services and connections, e.g. to minimise isolation of communities during an adverse storm event that puts the infrastructure at higher risk; Design retrofitting to a higher standard than the minimum required where possible and practical; and Progressively incorporate higher design standards into asset management plans and rolling capital works programs. WRL Technical Report 2012/21 April 2013 FINAL 131
150 Adaptation measures are often prioritised and driven by the vulnerability of a system to climate change. Vulnerability is the degree to which a system is susceptible to, or unable to cope with, the adverse effects of climate change. Vulnerability represents the potential for an adverse impact to occur but does not necessarily indicate the magnitude of the impact or its probability. The main forcing parameters on a coastal protection structure can be separated into the hydraulic responses of the waves and the structural response of the structure. There are three (3) main hydraulic responses that need to be considered for the design of a seawall: wave runup level; wave overtopping; and wave reflection. The main failures modes of coastal structures are: Undermining, in which the sand or rubble toe level drops below the footing of the wall, causing the wall to subside and collapse into the hole (over 70% of UK seawalls fail partially or totally by this mechanism (CIRIA, 1991)); Sliding, in which the wall moves away from the retained profile; Overturning, in which the wall topples over; Slip circle failure, in which the entire embankment fails due to geotechnical instability; Loss of structural integrity, due to wave impact; or Erosion of the backfill, caused by wave overtopping, high water table levels, or leaching through the seawall. The failure modes described above are mainly caused by three types of coastal hazards, listed below: Erosion of sand in front of the structure during storm events; Wave overtopping (inundation) of the structure due to elevated water levels and large wave conditions; and Wave impacts directly on the structure itself. Generally mean sea level increase, wind climate change and wave climate change are the major concerns for coastal defence structures due to climate change. In regard to structures, such as those present in Port Fairy, the main impacts of climate change will result in: Increased wave loading; Increased overtopping and flooding of the seawall (erosion of the backfill); and Increased scouring at the toe of seawall. The potential increase in wave loading will typically require an increase in the mass of the structure to prevent displacement or movement. Modification to the existing seawall crest may be necessary to avoid overtopping exceeding acceptable levels. Adequate toe levels are critical to prevent undermining failure of the structure due to the potential increase of scour and resulting lowering of the beach levels. Coastal structures typically have design and operational lives spanning many decades and therefore climate change is an important consideration for both design of new coastal defence structures and adaptation of existing coastal defence structures. Typically, two main approaches WRL Technical Report 2012/21 April 2013 FINAL 132
151 can be applicable to the adaptation of coastal defence structures to climate change. One approach is to consider the complete sea level rise expected to occur over the life of the structure in the initial design of the adaptation plan. This is referred to as the Precautionary Approach (Headland et al., 2011). Potential limitations to this approach are that it has the potential to: Result in unnecessarily overbuilt structures for the earlier years in the design life of the structure with associated costs issues; Have greater environmental and social impacts (i.e. larger footprint); and Be under-designed in the event that sea level rise proves greater than that projected or accounted for in the design over a set time horizon. A more favoured approach nowadays, referred to as the Managed Approach (DEFRA, 2006), allows for staged adaptation in the future, and is appropriate in the majority of cases where ongoing responsibility can be assigned to track the change in risk, and manage this through multiple interventions. This approach provides flexibility to manage future uncertainties associated with climate change, during the whole life of a structure (Figure 12.1 a). To consider a precautionary approach only, could lead to greater levels of investment at some locations. A managed approach therefore allows the flexibility to ensure best value for money from public investment. Adaptive Management approaches have proven to be potentially economical for the adaptation of rubble mound breakwaters (Headland et al., 2011) even for cases where sea level rise scenarios are modified over the lifetime of the structure. Likewise, Carley et al. (2008), investigated the benefits of an adaptive management approach compared to precautionary management approach to the existing coastal flood scenarios in Clarence Council, Tasmania. It was shown that (within the limitations of the analysis technique) designing for a 100 year ARI (1% AEP) event in 2100 (with high range sea level rise) would provide a present day protection against an event of approximately 850,000 year ARI, which, depending on the cost of such an adaptation, may be excessively conservative. Similarly, a present day risk level of 100 year ARI (1% AEP) would reduce to approximately three (3) days ARI if no intervention was taken by 2100 with a high range sea level rise scenario, indicating the potential risk of no adaptation in the long term (Figure 12.1 b) East Beach Rock Revetment Review of Existing Protection The East Beach rock revetment is a 2.5 km long coastal structure that protects public assets and private properties. It is located at the toe of an eroded dune system of varying crest height (ranging from 3.5 to over 7 m AHD). The rock revetment was constructed and modified over an extended period, starting in the 1960s. Most of the structure construction appears to consist of the placement of rock directly on the dune face at the back of the beach. The part of the construction visible today appears to have been undertaken without considering contemporary coastal engineering design principles, such as the use of filter layers, secondary armour and toe protection. The overall dimensions of the rock revetment were observed to vary greatly across East Beach. It should be noted that the realistic design life for such coastal protection structure is usually estimated to be about 50 years. WRL Technical Report 2012/21 April 2013 FINAL 133
152 From the southern end of the beach to Lydia Place, the structure mainly consists of one or two rows of rocks placed on the beach, with typical size ranging from 0.3 to 0.7 m (approximately 0.1 to 1.0 tonnes), resulting in typical crest elevation levels ranging from 0.5 to 1.5 m AHD. Slumping, as well as rock displacement, was observed in multiple locations indicating that the rock size and/or design may not be suitable. The crest height of the structure is not sufficient to prevent overtopping over the majority of this section under design conditions as erosion in the lee shows overtopping to be frequent. In front of Lydia Place, the size and the condition of the rock revetment was observed to improve significantly. The structure here appears to be composed of multiple layers of rock, with size ranging from 0.5 to 1 m in size (approximately 0.5 to 2.7 tonnes). The rock revetment appears to be functioning well and subjected to limited overtopping, as grass can be observed on its crest. The typical crest elevation ranges from 4 to 6 m AHD. Significantly larger rocks, with an average size of about 1 m (2.7 tonnes) were observed to have been placed in front of the rock revetment, most probably to offer increased protection from wave action at high water levels. It was not possible to determine whether there were filter layers present. No significant change of the rock revetment was observed between Lydia Place and Ritchie Street, and the structure appears to be functioning well. It should be noted that half a dozen large rocks, with an average size of 1 m (2.7 tonnes) were observed to be precariously positioned on the rock revetment, about 0.5 to 1 m above beach level, next to the ramp at the SLSC public amenities block. These large rocks could potentially pose a safety risk to the public during and after storms. The rock revetment s overall condition was observed to deteriorate north of Ritchie Street. Except for the last 40 m, the structure appears to consist of multiple layers of rock armour with size ranging from 0.3 to 1 m in size (approximately 0.1 to 2.7 tonnes), at a slope varying from 1:1.5 to 1:1.3. Significantly larger rocks, with an average size of about 1 m (2.7 tonnes) can be observed to have been placed in front of the rock revetment, to increase protection from wave action at high water levels. Lower crest elevation of the structure was observed and ranged from 2.5 to 3.5 m AHD while the presence of a vertical scarp was observed in multiple locations, indicating overtopping of the structure and erosion of the vegetated dune. Rock displacement was observed in multiple locations as well, indicating that the rock size and/or design may not be suitable, and that the rock revetment may not be able to provide protection from wave action anymore. The shoreline was observed to have pronounced erosion/recession over the last 50 m at the end of the rock revetment, as well as immediately adjacent to it, due to seawall end effects. The extent of this localised erosion zone could be explained by the progressive extension of the rock revetment fronting the last properties over time. The overall condition of the rock revetment across the last 50 m was considered sub-standard, with inadequate crest height in several places. Additional rock protection appears to have been placed recently at the end but does not appear constructed to contemporary coastal engineering practice. Rock displacement was observed in multiple places due to storm wave action. The northern end of the rock revetment is almost completely outflanked with visible erosion of the dune located immediately behind. Typical crest elevation of the structure ranged from 2.5 to 3.5 m AHD while the ground levels for most properties along this section of East Beach are above 6.0 m AHD. The presence of a vertical scarp was observed in multiple locations, indicating overtopping of the structure and erosion of the vegetated dune. Rock displacement was observed in multiple locations as well, WRL Technical Report 2012/21 April 2013 FINAL 134
153 indicating that the rock size and/or design may not be suitable, and that the rock revetment may not able to provide sufficient protection from wave action Recommended Immediate Actions As mentioned in the above section and previous studies (BMT, 2007; Aurecon, 2010), the rock revetment does not comply with contemporary coastal engineering design principles, which limits the number of options for maintenance and adaption strategies to future climate change. The zone at the highest risk of erosion is located next to the northern end of the rock revetment, resulting in the outflanking of the structure. It is WRL s understanding that MSC is in the early stages of tendering repair/extension work on this rock revetment. Repair work to the northern end of the rock revetment should be performed so that it complies with current coastal engineering practices. It is critical to ensure that the new design of the rock revetment allows for it to be extended to ensure immediate protection from potential dune breaching. Finally, it should be verified that any work on the rock revetment does not exacerbate the erosion hazard at the Night Soil Site or at the Old Municipal Tip site. WRL recommends that an initial reshaping of the seawall be undertaken in the locations where rock displacement has been observed due to wave action. Additional rock should first be placed in the locations where slumping or outflanking has been observed. If available, additional rock should also be placed on the crest of the northern section of the rock revetment to limit further erosion due to overtopping. WRL recommends the large, precariously positioned rocks next to the ramp near the SLSC public amenities block be removed and repositioned so that the risk to safety from falling rocks is addressed. WRL recommends regular beach surveying and analysis to quantify changes since previous surveys in 2007 and The survey should extend into the foredune area and map the present dune crest levels, as well as focus on the beach level at the toe of the rock revetment. WRL recommends the establishment of a condition and performance monitoring program for the East Beach rock revetment based on the methodology described in Section Adaptation Strategies for Future Conditions Except for the rock revetment section between Lydia Place and Ritchie Street, WRL recommends that the best practice would involve the reconstruction of the rock revetment to contemporary standards to better ensure that the dune is protected from further erosion. It is acknowledged that such resources may not be immediately available. Therefore, WRL recommends that Council prepare designs and plans for installation of emergency protection works should they be required. Un-planned emergency coastal protection has been widely assessed as having long-term negative impacts on beaches around Australia. If emergency protection works are well conceived and appropriate materials are stockpiled, there is no reason why the works cannot become a permanent well engineered final line of defence against coastal erosion, with minimal additional work. WRL Technical Report 2012/21 April 2013 FINAL 135
154 As revetments have already been constructed at the rear of a significant length of East Beach, establishing a design for a continuous emergency protection revetment is advised. This is expected to involve further assessment of the location, alignment, and details of existing sections of structure in order to plan for additional sections of structure to be integrated. When planning the new sections of revetment, aspects that should be taken into consideration include (but are not limited to): Community consultation and beach/foreshore uses; Achieving a uniform and continuous plan alignment; Minimising abrupt changes in alignment or structure details (crest level, toe level, slope); Cross section design for different stretches of the beach; Beach access ways through the revetment; Alignment that maximises future opportunity for the beach to recover seaward of structure, and that will allow the terminal revetment to be buried within a vegetated dune if possible; and Location of key infrastructure or property to be protected. Based on the results of the wave transformation and overtopping, the following approximate design values can be used as an initial guide: Rock armour size: 1500 kg to 4500 kg, with median 3000 kg (SPM, 1984); Crest level: 5 m AHD to 5.5 m AHD if possible, no less than 4.5 m AHD; Toe level: -0.5 m AHD to -1.0 m AHD; Slope: no steeper than 1V:1.5H; Geotextile filter layer; Two layer thickness of rock primary armour minimum; and Two layer thickness of rock secondary armour minimum. Figures 12.2 shows a cross-section for a conceptual emergency protection terminal revetment structure. While the rock revetment section between Lydia Place and Ritchie Street appears to be functioning well and has not been overtopped recently, WRL recommends increasing the thickness of the primary armour layer to ensure protection against increased wave loading. It is also recommended that the overall crest level be raised to a minimum level of 5 m AHD to ensure protection of wave overtopping in the 2050 planning period. This could be achieved by the addition of armour rock and the reclamation of the concrete promenade and/or the turf esplanade. The addition of a concrete vertical or curved wall on the crest would further reduce the risk of overtopping. This work should be performed in a stepped approach, as the sea level rise is a gradual phenomenon, and allow for further raising of the grade to accommodate for potential higher SLR value if necessary. WRL Technical Report 2012/21 April 2013 FINAL 136
155 Adequate toe levels are critical to prevent undermining failure of rock revetments due to the potential increase of scour and resultant lowering of the beach levels. Possible solutions to prevent scour failure include: Changing wave conditions which caused erosion (installation of groynes or offshore breakwater, beach nourishment); Installation of rubble-toe protection; Reinforcing of existing rubble-toe protection; Gabions; Concrete mattresses; and Geotextile sand containers East Beach Wooden Groynes Review of Existing Protection The remnants of four (4) wooden groynes, initially built in the 1970s can be observed along the southern end of the beach, between Roger Place and Lydia Place (see Figure 3.8). The groynes are approximately 30 m in length and spaced approximately 90 m apart. All four (4) structures were found to be heavily damaged from weathering, rot and fastener corrosion, with timber piles missing. Multiple openings have been purposely formed in all four (4) groynes to facilitate public access along the beach, possibly further limiting their ongoing effectiveness to trap longshore sand. Due to their overall poor condition, these structures present a public safety risk and provide minimal to no stabilisation of the beach Recommended Immediate Actions WRL recommends the removal of the four (4) groynes as their ongoing effectiveness appears to be very limited due to their poor condition and that they present a risk to public safety. Removal should ensure at minimum that no hazard remains for all beach users, due to splintered wood or fasteners just below the surface Adaptation Strategies for Future Conditions In the medium term (i.e. 2 to 5 years), a trial of multiple geotextile groyne structures with prefill nourishment and associated beach monitoring to assess the effectiveness of the design is recommended prior to more extensive works Moyne River Moles Review of Existing Structures The southern end of East Beach is flanked by the northern Moyne River mole (Figure 3.6). These walls were initially built around the 1870s and are made of basalt with localised concrete facing. The training wall on the East Beach side is typically 3 m wide on its crest with an approximate height of 1.6 m above MSL. The training walls appear in fair condition overall, with minor localised damage where rocks have been dislodged and facing concrete is cracked or spalled. The northern end of South Mole beach is flanked by the southern Moyne River mole (Figure 3.6). They extend about 200 m offshore from the beach and were found to be in relatively good WRL Technical Report 2012/21 April 2013 FINAL 137
156 condition at the time of the visit, with no significant sign of damage except for a 20 m long section near the MSL mark, where large basalt blocks had been dislodged from their original position. If no action is taken, this damage could become a hazard to pedestrian safety, as the walls are capped by a 3 m wide concrete cap which acts as a public causeway. A similar damaged area was observed at the eastern end of the Puddeny Grounds. It has been also reported by the Port Authority (Max Dumnesy, pers. comm.) that leaching of sand from South Mole beach into the river takes place underneath and through the mole. This results in the presence of localised sand fans at the bottom of the river bed and requires regular sand dredging in this location to maintain navigable depth within the river. This was also observed by WRL engineers on their site visits Recommended Immediate Actions WRL recommends repairs on both structures at the locally damaged areas. These repairs would mainly consist of replacing the dislodged rocks, or addition of rocks of similar characteristics and concrete grouting. In the absence of reliable data concerning the sand dredging volumes, it is not possible to assess the importance of sand leeching below and/or through the mole. Potential work to avoid sand leeching would typically need to be carried out underwater and this being the case the following methods of repair could be considered: Grout-filled bags; Tremie concrete; Injected grouted aggregate; and Geotextile sand containers. WRL recommends the establishment of a condition and performance monitoring program for the Moyne River moles based on the methodology described in Section The monitoring program should also focus on the condition of the concrete causeway located on the crest of the structures and identify any potential hazards to pedestrian safety. The protection of the upper surface of the revetments is of utmost importance to prevent exposure of the core material and reduce overtopping. Concrete or asphalt capping are typical solutions to avoid this problem where pedestrian or vehicle access is required. WRL engineers are aware that the presence or absence of signage warning about potential wave impacts to pedestrians has been a key factor in several legal cases involving injuries on breakwaters Adaptation Strategies for Future Conditions The Moyne River moles primary role is to improve navigation conditions and additionally to serve as a public amenity. Future upgrade strategies to accommodate for climate change should be based on reducing hazards associated with their primary usage. This would require a better understanding of current and future usage of these structures, based on the input from such stakeholders such as: Moyne Shire Council; Port Authority; Port Fairy Coast Guard; WRL Technical Report 2012/21 April 2013 FINAL 138
157 Port Fairy Marine Rescue Group; Port Fairy Angling Club; and Port Fairy Yacht Club. The trigger points for actions should be associated with the loss of amenity for navigation and pedestrian access (i.e. number of days per year) due to wave overtopping, wave transmission over and past the structure. An initially identified upgrade would involve the progressive raising of the crest and the addition of rock armour on the ocean sides. WRL recommends the structure crest width of 3 m be maintained to allow machinery access for maintenance or adaptation works. Any modification to the Moyne River walls should consider the need for sand dredging pipe crossing in multiple locations Southwest Passage Breakwater and Puddeny Grounds Walls Review of Existing Structures The Southwest Passage breakwater provides pedestrian access from a car park to Griffiths Island and is reported to have been constructed in its present configuration in It has an overall length of 40 m, with a crest elevation of +2 m AHD. WRL estimates that the primary armour is basalt with a typical size of 0.5 to 1.0 m (approximately 0.5 to 2.7 tonnes). The average slope of the breakwater had been estimated to be between 1V:2H to 1V:3H. It was not possible to determine whether there were filter layers present. The overall condition of the rock revetment and of the concrete cap located on its crest are satisfactory. The training walls on the north side of the Southwest Passage breakwater consist of grouted basalt with a typical crest level of 1 m AHD. They were in relatively good condition at the time of WRL s site inspection, with no significant sign of damage except for a 10 m long section, close to the island shore, where significant erosion of the wall was observed. If no action is taken, this damage could become a hazard to pedestrian safety, with the undermining of the concrete cap which acts as a public walkway. South of the breakwater, the training walls on the Griffiths Island side have in the past been fitted with a concrete cap made of two metre long slabs. The overall condition of the basalt part of the wall is satisfactory; however, the concrete capping is severely damaged, with multiple concrete slabs broken or missing. This could potentially represent a safety hazard as the wall is used by pedestrians to access the south of Griffiths Island. The typical crest level for this section of the training walls is about 1 m AHD. A second pedestrian access to Griffiths Island crosses Puddeny Grounds in the lee of the training walls. This coastal asset consists also of a basalt rock revetment fitted with a concrete cap on its crest. The typical rock size on the revetment is estimated to be between 0.5 and 1 m (approximately 0.5 to 2.7 tonnes) and its crest has a typical elevation of 0.5 m AHD. The footbridge is equipped in several locations with box culverts to allow water passage from the northern part of Puddeny Grounds. The overall condition of this asset is fair, with some rock displaced in multiple locations as well as localised undermining of the concrete capping. However, this coastal asset appears to be functioning well due to the very mild wave conditions it is subjected to most of the time. WRL Technical Report 2012/21 April 2013 FINAL 139
158 Recommended Immediate Actions Due to the potential trip hazard to pedestrians, WRL recommends that repairs be undertaken to the damaged concrete causeway sections located on the vertical training walls on the southern side of the Puddeny Ground. WRL also recommends undertaking immediate repairs to the damaged area of the Moyne River training wall on the northern corner of Puddeny Grounds, as undermining of the structure could result in fall hazard or local failure of the wall. WRL recommends the establishment of a condition and performance monitoring program for the Southwest Passage structures based on the methodology described in Section The monitoring program should also focus on the condition of the concrete causeway located on the crest of the structures and identify any potential hazards to pedestrian safety. The protection of the upper surface of the revetments is of utmost importance to prevent exposure of the core material and reduce overtopping. Concrete or asphalt capping are typical solutions to avoid this problem where pedestrian or vehicle access is required. WRL engineers are aware that the presence or absence of signage warning about potential wave impacts to pedestrians has been a key factor in several legal cases involving injuries on breakwaters Adaptation Strategies for Future Conditions It should be noted that the Southwest Passage breakwater and associated causeway s primary role is to improve navigation conditions and additionally to serve as a public amenity. The results of preliminary desktop analysis of a 10 year ARI storm event show that such an event would create a wave setup of nearly 2 m AHD within the Southwest Passage. The occurrence of such water level values can be corroborated through anecdotal evidence as the Southwest Passage causeway is reported to have been overtopped multiple times during the last decade (Figure 12.3). Any upgrade or modification to the structures located in the Southwest Passage primarily depends on a better understanding of usage, requirement and amenity, of these structures and such consideration was beyond the scope of this study. In light of the overtopping risk at the Southwest Passage, a potential upgrade of the structure would be to raise the crest level by a minimum of 0.5 m AHD to minimise the risk of damage to the structure due to frequent overtopping in the near future. This upgrade could be achieved through the addition of rock armour on both the river and ocean sides. It is recommended that a structure crest width of 3 m be maintained to allow service vehicle access to Griffiths Island. A similar analysis and upgrade approach could be undertaken on the vertical training walls surrounding Puddeny Grounds. However, the associated costs would be significantly higher as the current crest levels are 1 m AHD. WRL Technical Report 2012/21 April 2013 FINAL 140
159 12.7. Further Recommendations for Monitoring The following are recommended for the entire Port Fairy study area: Regular beach surveys should be undertaken including analysis of the collected data. Such a program is being initiated by Council in association with local community groups; A detailed record of dredged sand volumes within the Moyne River and the Southwest Passage and associated deposited sand volumes on East Beach should be undertaken. This would enable a better understanding of sediment transport within the East Beach embayment. Regular bathymetric surveys should be undertaken to monitor changes within the Southwest Passage and offshore areas; Analysis and digitisation of the 1854 Barrow nautical chart in order to assess long-term changes of East Beach embayment; Vegetation management plans need to be prepared for all dune areas not currently maintained by community groups; An inventory of potential sand reserves for future beach nourishment needs to be developed and investigated. Studies for access and in-principle approvals need to be initiated; Suitable quarries for rock protection need to be identified and the suitability of their rock for coastal protection determined. WRL Technical Report 2012/21 April 2013 FINAL 141
160 Section 12 Key Findings This sections provides the reader with an introduction to the concepts of maintenance and monitoring and adaptation to climate change of onshore coastal structures; A review of the suitability of the existing protection structures in the Port Fairy Study area was performed over the two identified planning timeframes (present day and 2080); The reviewed structures were the following: - East Beach Rock Revetment; - East Beach Wooden Groynes; - Moyne River Moles; - Southwest Passage Causeway; - Puddeny Grounds. The following additional monitoring actions are recommended: - Regular beach surveys; - A detailed record of dredged sand volumes within the Moyne River and the Southwest Passage; - Regular bathymetric surveys within the Southwest Passage; - Vegetation management plans need to be prepared for all dune areas not currently maintained by community groups; - An inventory of potential sand reserves for future beach nourishment needs to be developed and investigated; - Suitable quarries for rock protection (for both emergency repairs and structure repairs) need to be identified and the suitability of their rock for coastal protection determined. WRL Technical Report 2012/21 April 2013 FINAL 142
161 13. Assumptions and Limitations Introduction The methodology applied in this report for the Future Coasts Port Fairy Coastal Hazard Assessment was developed in consultation with Moyne Shire Council and the State of Victoria Department of Sustainability and Environment, and conforms to the following documents: Victorian Coastal Hazard Guide (DSE, 2012); Victorian Coastal Strategy Guidelines (VCC, 2008); NSW Coastline Management Manual (NSW PWD, 1990); Coastal Risk Management Guide (DECCW, 2010). The assumptions and limitations applicable to the analysis and the data used in this study are described below Field Survey A visual assessment of the dunes and rock revetments allowed general and qualitative observations of the present dunes and rock revetment conditions. A detailed stability assessment was not part of the scope of works and geotechnical investigation was not undertaken for this study, apart from determining underlying bed rock levels on East Beach. Representative crest levels and foreshore geometry were estimated by experienced coastal engineers for each stretch of coast. However, in some locations these levels vary along the dune or rock revetment Sea Level Rise The sea level rise projections adopted in this investigation were based on the Victorian Coastal Hazard Guide (DSE, 2012). No further reassessment of these benchmarks was undertaken by WRL. The sea level rise benchmarks are based on projections and actual sea level rise may be higher or lower than these benchmarks over the planning period. The IPCC reviews and revises sea level rise projections at 5-7 year intervals, with the most recent revision (Assessment Report 4) being in 2007, and the Assessment Report 5 due in Water Levels and Wave Climate For storm erosion modelling purposes, a Mean High Water Spring (MHWS) tide time series was assumed, to which a tidal anomaly was added, such that the peak water level corresponded to the ARI of the storm. For modelling purposes a symmetrical shape of the anomaly was assumed, with the peak in predicted tide and tidal anomaly assumed to coincide with the peak wave height of the storm. The nearshore wave climate around the beaches of Port Fairy was determined using a numerical wave propagation model (SWAN version 40.85). The model inputs were offshore boundary conditions and bathymetric data. Offshore boundary conditions relied on extreme wave statistics analysis undertaken by WRL. Bathymetric data was obtained from DSE and Geoscience Australia. Data collection and analysis was undertaken by reputable organisations, however, minor survey errors are possible. Some temporal change in the seabed after surveys is almost certain which adds further uncertainty to the impacts of coastal hazards. WRL Technical Report 2012/21 April 2013 FINAL 143
162 13.5. Beach Erosion and Recession The volumes of storm erosion adopted in this study ultimately relied on numerical SBEACH modelling. This model has been calibrated and validated numerous places around Australia. The sand grain size modelled at each beach was equivalent to the sediment samples acquired during the site inspection. Bedrock location was implemented in SBEACH using the results of the East Beach geotechnical survey and combined analysis of 2010 aerial photography and 2007 LIDAR. Based on the experience of this report s authors, their engineering judgement, and consultation with Port Fairy s Technical Review Panel for this project, it was elected to model design erosion volumes using 2 x 50/100 year ARI storm events. Note that changes to coastal geomorphology since 2007 will not be fully captured. The rates of recession adopted in this study ultimately relied on the analysis of temporal data sets of aerial photography and photogrammetric data made available by DSE. The accuracy of this information rests with DSE. The temporal resolution of the dataset limits the accuracy and reliability of the estimates. It should be noted that the recession rates for the southern section of East Beach were based on the assumption that the rock revetment position is representative of the shoreline position in Future shoreline recession as a result of sea level rise was estimated using the Bruun Rule and the Victorian Coastal Hazard Guide (DSE, 2012). The limitations of this methodology are well recognised (Ranasinghe et al., 2007) and were taken into consideration. However, no robust and scientifically recognised alternative currently exists and the application of the Bruun Rule is currently supported by the Victorian Coastal Hazard Guide (DSE, 2012). Where known or obvious, the presence of underlying bedrock shelves was taken into account in this study. However, there may be bedrock present in other areas where it is not generally visible Wave Runup and Overtopping Best practice empirical prediction methods based on the most current published literature (Mase, 1989; EurOtop, 2007) were applied to estimate wave overtopping and runup levels at the dunes structures. Statistical and data uncertainties related to these methodologies are discussed in the referenced literature (EurOtop, 2007). The effect of wind on overtopping rates was not considered. Site specific physical modelling is the only available method offering greater certainty than the methods used Mapping of Coastal Hazard Lines Mapping of coastal hazard lines was produced to provide general guidance for coastal planning and to identify areas prone to coastal hazards. Mapping was undertaken using state-of-the-art methodologies. Mapping was based on the discretisation of the coastline into mean profiles which were obtained from the photogrammetric and /or LIDAR analysis. The limitations of the temporal and spatial resolution of the available data applies to the mapping. Site specific investigations and surveys are encouraged to overcome such limitations. WRL is not responsible for the accuracy of the LIDAR data. WRL Technical Report 2012/21 April 2013 FINAL 144
163 13.8. Modelling and Mapping of Coastal Inundation Zones Assessment of coastal inundation was performed using a combination of two methods, that is bathtub inundation modelling over the whole study area and dynamic flood modelling using a MIKE Flood model specifically around the Port Fairy Township. The Mike Flood modelling assumed the coincidence of coastal storm surge heights and catchment peak flood levels as well as no infiltration. This may lead to conservative mapping outputs. Mapping of coastal inundation zones was produced to provide general guidance for coastal planning and to identify areas prone to coastal inundation. Mapping was undertaken using state-of-the-art and Government endorsed methodologies. Mapping of inundation was based on the current shoreline location and did not include any allowance for future landward recession beyond the boundaries of the dynamic flood modelling. Mapping assumed that both seawall crest levels and topography remain as they were from the 2007 LIDAR data provided by DSE. A qualitative check indicated that the LIDAR data was consistent with the observed land forms, however, WRL is not responsible for the accuracy of the LIDAR data Vulnerability Assessment The vulnerability assessment undertaken for this study should be considered as preliminary as it relies on the spatial accuracy of the mapping data available (LIDAR data provided by DSE) and on the accuracy of the coastal hazard mapping. Site specific analysis should be undertaken to obtain a detailed risk assessment. WRL Technical Report 2012/21 April 2013 FINAL 145
164 14. References Abadie, S., Butel, R., Mauriet, S., Morichon, D. and Dupuis, H. (2006) Wave Climate and Longshore Drift on the South Aquitaine Coast Continental Shelf Research 26 (2006), pp Australian Geomechanics Society (AGS, 2007), Extract containing: Guideline for Landslide Susceptibility, Hazard and Risk Zoning for Land Use Planning Australian Geomechanics Journal and News of the Australian Geomechanics Society, Volume 42 No 1 March 2007, The Institution of Engineers Australia Andersen, M.S., Nyvang, V., Jakobsen R. and Postma, D. (2003) The Geochemistry of a Seawater Intrusion Experiment in a Shallow Sandy Aquifer Skansehage Denmark, Second International Conference on Saltwater Intrusion and Coastal Aquifers - Monitoring, Modeling and Management, Mérida, México, March 30 April 2, 2003 Andersen M.S., Christensen F.D., Engesgaard P. and Jakobsen R. (2006) Density Driven Seawater Plumes in a Shallow Aquifer Caused by a Flooding Event - Field Observations and Numerical Modelling 1st SWIM-SWICA, 19th Salt Water Intrusion Meeting & 3rd Salt Water Intrusion in Coastal Aquifers Meeting - Cagliari, Chia Laguna, Italy, September 24-29, 2006 Andersen M.S., Jakobsen R., Nyvang V., Christensen F.D., Engesgaard, P. and Postma, D. (2007) Density Driven Seawater Plumes in a Shallow Aquifer Caused by a Flooding Event - Field Observations, Consequences for Geochemical Reactions and Potentials for Remediation Schemes GQ07: Securing Groundwater Quality in Urban and Industrial Environments, Proc. 6th International Groundwater Quality Conference, Fremantle, Western Australia, 2 7 December 2007 Aurecon (2010) East Beach Coastal Erosion Engineering and Feasibility Study Peer Review by Aurecon 2010, Report prepared for the Department of Sustainability and Environment BMT WBM (2007) Port Fairy East Beach Coastal Erosion Engineering & Feasibility Study Report prepared for the Moyne Shire Council Bray, R.N., Tatham, P.F.B. (1992) Old Waterfront Walls: Management, Maintenance, and Rehabilitation. E. & F.N. Spon (Imprint of Chapman and Hall), London, 1992, ISBN , pp. 267 Bruun, P. (1962) Sea Level Rise as a Cause of Beach Erosion. Proceedings ASCE Journal of the Waterways and Harbours Division, Vol 88, WW1, pp , American Society of Civil Engineers Bruun P. (1988) The Bruun Rule of Erosion by Sea-Level Rise: A Discussion on Large-Scale Two- and Three-Dimensional Usages Journal of Coastal Research, 4 (4), pp Carley, J.T. and Cox, R.J. (2003) A Methodology for Utilising Time-dependent Beach Erosion Models for Design Events Proc 16 th Australasian Coastal and Ocean Engineering Conference, Auckland, New Zealand Carley, J.T. and Cox, R.J. (2008a) Design Setbacks for Coastal Land WRL Technical Report 2008/25, Water Research Laboratory, University of New South Wales WRL Technical Report 2012/21 April 2013 FINAL 146
165 Carley, J.T., Blacka, M.J., Cox, R.J., Attwater, C. and Watson, P. (2008b) Modelling Coastal Processes and Hazards to Assess Sea Level Rise Impacts for Integration into a Planning Scheme IPWEA National Conference on Climate Change Response, Coffs Harbour Carley, J.T. (2008c) Expert Witness Statement by James Carley Regarding Coastal Processes and Hazards for Proposed Subdivision at 228 Griffith Street, East Beach, Port Fairy WRL Technical Report 2008/21, Water Research Laboratory, University of New South Wales Carley, J.T., Shand, T.S., Goodwin, I., Splinter, K., Mariani, A. (2011a) Generic Design Coastal Erosion Volumes and Setbacks for Australia WRL Technical Research Report 247, Water Research Laboratory, University of New South Wales Carley, J.T. (2011b) Port Arthur Historic Site: Storm Damage 9-10 July 2011 WRL Letter Report , Water Research Laboratory, University of New South Wales Carlson, D.A., Van Biersel, T.P. and Milner L.R., (2007) Storm-Damaged Saline-Contaminated Boreholes as a Means of Aquifer Contamination Ground Water 46 (1), pp CEM (2006) Coastal Engineering Manual, Coastal Engineering Research Center, Waterways Experiment Station, US Army Corps of Engineer, Vicksburg, USA CES (2006a) Port Fairy Shoreline Stability Study for Marcson Pty Ltd CES (2006b) Port Fairy Shoreline Stability Study Supplementary Information Report prepared for Marcson Pty Ltd CES (2007) Port Fairy Shoreline Stability Study Supplementary Report Report prepared for Marcson Pty Ltd CIRIA (2007) The Rock Manual. The Use of Rock in Hydraulic Engineering Published by C683, CIRIA, London CSIRO (2007) Climate Change in Australia ISBN (PDF), CSIRO, Australia Chow,V.T. (1959) Open-Channel Hydraulics New York, McGraw-Hill, pp. 201 Coghlan, I.R., Carley, J.T. and Peirson, W.L. (2008) Verification of Methodology for Calculating Output of Oceanlinx Wave Energy System WRL Technical Report 2008/09, Water Research Laboratory, University of New South Wales Commander, D.P. (2000) Potential Effects of Climate Change on Groundwater Resources in Western Australia In Hydro, 2000 proceedings Crosbie, R. (2007) The Hydrological Impacts of Climate Change on Groundwater Presentation by CSIRO Water for a Healthy Country Flagship Dally, W.R., Dean, R.G. and Dalrymple, R.A. (1984) A Model for Breaker Decay on Beaches Proceedings of the 19th Coastal Engineering Conference, pp , American Society of Civil Engineers DCC (2009) Climate Change Risks to Australia s Coast Department of Climate Change DEFRA UK (2006) Coastal Defence Appraisal Guidance FCDPAG3 Economic Appraisal Supplementary Note to Operating Authorities Climate Change Impacts October 2006 UK Department for Environment, Food and Rural Affairs WRL Technical Report 2012/21 April 2013 FINAL 147
166 Department of Environment and Climate Change (2009) Sea Level Rise Policy NSW Government Department of Environment and Climate Change (2010) Coastal Risk Management Guide: Incorporating Sea Level Rise Benchmarks in Coastal Risk Assessments NSW Government Department of Sustainability and Environment (2012) Victorian Coastal Hazard Guide Victorian Government Department of Sustainability and Environment DERM (2011) Queensland Coastal Plan Department of Environment and Resource Management State of Queensland DEWR (2007) Climate Change Adaptation Actions for Local Government Published by the Australian Greenhouse Office, Department of the Environment and Water Resources DTCI (2011) Sea Level Change in Western Australia - Application to Coastal Planning Department of Transport Coastal Infrastructure, Coastal Engineering Group, Western Australia Engineers Australia (2010a) Appropriate Safety Criteria for People Stage 1 Report, Project 10 Australian Rainfall and Runoff Prepared by the UNSW Water Research Laboratory for Engineers Australia Water Engineering Engineers Australia (2010b) Appropriate Safety Criteria for Vehicles Stage 2 Report, Project 10 Australian Rainfall and Runoff Prepared by the UNSW Water Research Laboratory for Engineers Australia Water Engineering Engineers Australia (2012a) Guidelines for Responding to the Impacts of Climate Change in Coastal and Ocean Engineering First published in 1991 by the NCCOE of Engineers Australia, last updated in 2004 by Harper, B A for the NCCOE Engineers Australia (2012b) Coastal Engineering Guidelines for Working with the Australian Coast in an Ecologically Sustainable Way Prepared by Gourlay, M.R., Harper, B.A., Cox, R.J., Stone, P.B. and Webb, T. for the NCCOE of Engineers Australia, Published EA Books, Barton, ACT, 101 pages Engineers Australia (2012c) Climate Change Adaptation Guidelines in Coastal Management and Planning Prepared by the NCCOE of Engineers Australia, published by EA Books, PO Box 588, Crows Nest, NSW Evans, P and Hanslow, D (1996) Take a Long Line Risk and Reality in Coastal Hazard Assessment, Proceedings NSW Coastal Conference, Ulladulla 1996 Environmental GeoSurveys (2005) Griffiths Street, Port Fairy Geomorphology & Coastal Processes in Relation to a Proposed Subdivision Report prepared for Paul Crowe EurOtop (2007) Wave Overtopping of Sea Defences and Related Structures: Assessment Manual Environment Agency (UK), Expertise Netwer Waterkeren (NL), and Kuratorium fur Forschung im Kusteningenieurwesen (DE) FEMA, Federal Emergency Management Agency USA (2000) Coastal Construction Manual FM55 USA Flocard, F., Shand, T.S. and Carley, J.T. (2011) Port Fairy Wave Power Resource Analysis WRL Technical Report 2011/27, Water Research Laboratory, University of New South Wales WRL Technical Report 2012/21 April 2013 FINAL 148
167 Ghassemi, A., Jacobsen, G. and Jakeman, A.J. (1991) Major Australian Aquifers: Potential Change Impacts Water International 16 (1) pp Gill, E. D. (1973) Rate and mode of retrogradation on rocky coasts in Victoria, Australia, and their relation to sea level changes Boreas Volume 2 pp Goda, Y. (1988) On the Methodology of selecting design wave height Proc. 21st International. Conference of Coastal Engineering (Malaga, 1988), pp Goodwin, I.D. (2005) A Mid-Shelf, Mean Wave Direction Climatology for Southeastern Australia, and its Relationship to the El Nino-Southern Oscillation Since 1878 AD International Journal of Climatology 25 (13) pp Gordon, A.D. (1987) Beach Fluctuations and Shoreline Change NSW Proceedings of 8th Australasian Conference on Coastal Engineering, Launceston, The Institution of Engineers Australia, pp Hallermeier R.J. (1981) A Profile Zonation for Seasonal Sand Beaches from Wave Climate. Coastal Engineering Vol. 4, pp Hallermeier R.J. (1983) Sand Transport Limits in Coastal Structure Design Proceedings, Coastal Structures 83. American Society of Civil Engineers, pp Headland, J.R., Trivedi, D. and Boudreau R.H. (2011) Coastal Structures and Sea Level Rise: Adaptive Management Approach Proceedings of the Conference on Coastal Engineering Practice: Engineering Sustainable Coastal Development, San Diego, USA Hemer, M.A., Simmonds, I. and Keay, K. (2008) A Classification of Wave Generation Characteristics during Large Wave Events on the Southern Australian Margin Continental Shelf Research 28 (2008), pp , Elsevier Hyder (2011) Condition Assessment of Coastal Protection Assets, for Department of Sustainability and Environment IPCC (2007a) Summary for Policymakers. In: Climate Change 2007: The Physical Science Basis. Contribution of Working Group I to the Fourth Assessment Report of the Intergovernmental Panel on Climate Change [Solomon, S., D. Qin, M. Manning, Z. Chen, M. Marquis, K.B. Averyt, M. Tignor and H.L. Miller (eds.)]. Cambridge University Press, Cambridge, United Kingdom and New York, NY, USA IPCC (2007b) Climate Change The Physical Science Basis. Contribution of Working Group I to the Fourth Assessment Report of the Intergovernmental Panel on Climate Change (ISBN Hardback; Paperback), [Solomon, S., D. Qin, M. Manning, Z. Chen, M. Marquis, K.B. Averyt, M. Tignor and H.L. Miller (eds.)]. Cambridge University Press, Cambridge, United Kingdom and New York, NY, USA, 996 pp IPCC (2011) Renewable Energy Sources and Climate Change Mitigation, [Ottmar Edenhofer, Ramón Pichs-Madruga, Youba Sokona, Kristin Seyboth, Patrick Matschoss, Susanne Kadner, Timm Zwickel, Patrick Eickemeier, Gerrit Hansen, Steffen Schloemer, Christoph von Stechow (eds.)]. Cambridge University Press, Cambridge, United Kingdom and New York, NY, USA, 1075 pp Kamphuis, J.W., Davies, M.H., Nairn, R.B., and Sayao, O.J. (1986) Calculation of Littoral Sand Transport Rate Coastal Engineering 10, pp WRL Technical Report 2012/21 April 2013 FINAL 149
168 Kinrade, P. and Justus, M. (2008) Impacts of Climate Change on Settlements in the Western Port Region Climate Change Risks and Adaptation Report Western Port Greenhouse Alliance Leopold, L.B., Wolman, M.G. and Miller, J.P. (1964) Fluvial Processes in Geomorphology San Francisco, Freeman Limerinos, J.T. (1970) Determination of the Manning Coefficient From Measured Bed Roughness in Natural Channels United States Geological Survey Water-Supply Paper 1898-B Komar, P.D., McDougal, W.G., Marra, J.J. and Ruggiero, P. (1997) The Rational Analysis of Setback Distances: Application to the Oregon Coast Shore and Beach Vol. 67 (1), pp Komar, P.D. (1998) Beach Processes and Sedimentation, Second Edition Prentice-Hall, Englewood Cliffs, New Jersey McInnes, K.L., Macadam, I. and O Grady, J.G. (2009) The Effect of Climate Change on Extreme Sea Levels along Victoria s Coast CSIRO Mariani, A., Blacka, M.J., Cox, R.J., Coghlan, I.R. and Carley, J.T. (2009) Wave Overtopping of Coastal Structures. Physical Model versus Desktop Predictions Journal of Coastal Research Special Issue 56, ICS2009 Proceedings Mase, H. (1989) Random Wave Runup Height on Gentle Slopes Journal of the Waterway, Port, Coastal and Ocean Engineering Division, American Society of Civil Engineers, pp Moyne Shire Council (2001) Moyne Shire Coastal Action Plan, Moyne Shire Council Moyne Shire Council (2004) Conservation Management Plan for Battery Hill Reserve Moyne Shire Council Mudd, G.M., Jelecic, S., Ginnivan, F. and Reid, M. (2006) Towards Quantifying Shallow Groundwater-Climate Relationships in Central and Northern Victoria In: 10th Murray-Darling Basin Groundwater Workshop, Canberra, September, 2006 NCCOE, National Committee on Coastal and Ocean Engineering, Engineers Australia (2004) Guidelines for Responding to the Effects of Climate Change in Coastal and Ocean Engineering, The Institution of Engineers Australia Narayan K.A., Schleeberger C., Charlesworth P.B. and Bristow K.L. (2003) Effects of Groundwater Pumping on Saltwater Intrusion in the Lower Burdekin Delta North Queensland. MODSIM conference paper, Available at Nielsen, A.F., Lord, D.B. and Poulos, H.G. (1992) Dune Stability Considerations for Building Foundations, IEAust, Civil Engineering Transactions, Vol CE34 No.2, June 1992, pp NSW DoP (2010) NSW Coastal Planning Guideline - Adapting to Sea Level Rise NSW Department of Planning, August 2010 NSW PWD (1990) Coastline Management Manual PWD, Sydney Pittock, B. (2004) Climate Change - An Australian Guide to the Science and Potential Impacts Chapter 4 Potential Impacts of Climate Change: Australia, Published by Australian Greenhouse Office WRL Technical Report 2012/21 April 2013 FINAL 150
169 Rahmstorf, S. (2007) A Semi-Empirical Approach to Projecting Future Sea-Level Rise Science 315 no. 5810, pp Ranasinghe, R., Watson, P., Lord, D., Hanslow, D. and Cowell, P. (2007) Sea Level Rise, Coastal Recession and the Bruun Rule Australasian Coasts and Ports Conference, Melbourne SCOR Working Group 89 (1991) The Response of Beaches to Sea-level Changes: a Review of Predictive Models Journal of Coastal Research, 7 (3), pp Shand, T.D., Mole, M.A., Carley, J.T., Coghlan, I.R., Harley, M.D. and Peirson, W.L. (2010) NSW Coastal Inundation Hazard Study: Coastal Storms and Extreme Waves WRL Research Report 2010/16 Shand, T.D., Mole, M.A., Carley, J.T., Peirson, W.L. and Cox, R.J. (2011) Coastal Storm Data Analysis: Provision of Extreme Wave Data for Adaptation Planning WRL Research Report 242, Report Prepared for the Australian Climate Change Adaptation Research Network for Settlements and Infrastructure, p. 157 Shand, T.D. (2011b) Inspection of Clarence City Beaches following Winter 2011 Storm Events WRL Letter Report , Water Research Laboratory, University of New South Wales Short, A.D. (2007) Beaches of the Victorian Coast and Port Philip Bay Sydney University Press Sjero, E., Charteris, A. (2008) Climate Change, Sea Level Rise and Coastal Subsidence Along the Gippsland Coast Final Report Phase 2 of the Gippsland Climate Change Study Gippsland Coastal Board Sun, H., Grandstaff, D. and Shagam, R. (1999) Land Subsidence due to Groundwater Withdrawal: Potential Damage of Subsidence and Sea Level Rise in Southern New Jersey, USA Environmental Geology 37 (4), pp UKWIR (2007) Effects of Climate Change on River Flows and Groundwater Recharge A Practical Methodology, Recharge and Groundwater Level Impact Assessment UK Water Industry Research Vellinga P., Katsman C.A., Sterl A., Beersma J.J., Church J.A., Hazeleger W., Kopp R.E., Kroon D., Kwadijk J., Lammersen R., Lowe J., Marinova N., Oppenheimer M., Plag H.P., Rahmstorf S., Ridley J., von Storch H., Vaughan D.G., van der Wal R.S.W., Weisse R. (2008) Exploring highend climate change scenarios for flood protection of The Netherlands International scientific assessment carried out at request of the delta committee. Scientific Report WR KNMI/Alterra, The Netherlands VCS (2008) Victorian Coastal Strategy 2008 Victorian Coastal Council, East Melbourne, Victoria Water Technology (2008a) Port Fairy Regional Flood Study Report prepared for the Glenelg Hopkins Catchment Management Authority and Department of Sustainability and Environment Water Technology (2008b) Port Fairy Regional Flood Study - Addendum Report prepared for the Glenelg Hopkins Catchment Management Authority and Department of Sustainability and Environment Water Technology (2011) Background Data Assimilation and Gap Analysis - Port Fairy Report prepared for the Department of Sustainability and Environment WRL Technical Report 2012/21 April 2013 FINAL 151
170 WBM (2006), East Beach Port Fairy Comparative Review of Coastal Process Studies, Report prepared for the Department of Sustainability and Environment WBM Oceanics (1996) Coastal Study of East Beach Port Fairy Report prepared for the Moyne Shire Council Yesertnener, C. (2003) Impacts of Climate, Land and Water Use on Declining Groundwater Levels in the Gnangara Groundwater Mound, Perth WA The Institution of Engineers, Australia, 28th International Hydrology and Water Resources Symposium, 10-14th November 2003, Wollongong Vol 1., pp You, Z.J. (2007) Extrapolation of Extreme Wave Height with a Proper Probability Distribution Function Australian Coasts and Ports Conference, July, Melbourne Young, I.R., Zieger, S. and Babanin, A.V. (2011) Global Trends in Wind Speed and Wave Height Science, Vol 332, pp WRL Technical Report 2012/21 April 2013 FINAL 152
171 GLOSSARY
172 GLOSSARY This glossary includes terms from this coastal hazards study that may be unfamiliar to some readers. It has been adapted from Climate Change Adaptation Guidelines in Coastal Management and Planning (Engineers Australia, 2012c). ARI Average Recurrence Interval time (years), on average, between occurrence of events such as storms, tropical cyclones, wave overtopping, etc. Bed friction Loss of wave energy in shallow water due interaction of wave motion with the sea bed. Bed shear stress Horizontal force (per unit area) due to near-bed water flow. Boundary layer Region close to the sea bed or coast where the flow is significantly affected by the interaction with the boundary. Celerity Speed of wavecrest (as opposed to the speed of water particles). Coastal compartment Length of coastline (often an embayment) at the boundaries of which the sediment behaviour is clearly defined. Continental shelf wave Very long waves (of order 1000 km) that travel anticlockwise around Australia (including Tasmania) generating important coastal currents. Currents Coastal currents derive from many sources, including tide, waves (particularly broken waves), coastal trapped waves, ocean currents and density influences. Diffraction When a part of a train of waves is interrupted by a barrier, such as a breakwater, the effect of diffraction is manifested by propagation of waves into the sheltered region within the barrier s geometric shadow. Downdrift In direction of alongshore current. Geotextile Strong, resilient, porous fabric used to retain soil without building up water pressure. Grid For a numerical model points in space where velocities, water elevations, sediment and pollution concentration etc are computed. Groyne A shore protection structure built (usually perpendicular to the shoreline) to trap littoral drift or retard erosion of the shore. Laminar Smooth flow (usually slow) dominated by viscosity with water molecules only slowly changing relative position. Such flow is characterised by very slow mixing of sediment and pollutants. (c.f. turbulent ) WRL Technical Report 2012/21 April 2013 FINAL G-1
173 Littoral drift The sedimentary material moved in the littoral zone (zone extending seaward from the shoreline to just beyond the breaker zone) under the influence of waves and currents. Gross littoral drift is the sum of all transport in any direction, while net littoral the average over some time period (usually extended). Morphological response Change of seabed or shoreline due to external influences (waves, currents, wind, etc). Overtopping Passing of water over the top of a structure as a result of wave runup or surge action. Progradation Growth of sediment deposit inside an estuary (flood tide) or outside as a delta (ebb tide). Random waves Waves with irregular successive heights and wavelengths. Refraction (1) The process by which the direction of a wave moving in shallow water at an angle to the contours is changed: the part of the wave advancing in shallower water moves more slowly than that part still advancing in deeper water, causing the wave crest to bend toward alignment with the underwater contours. (2) The bending of wave crests by currents. Revetment A facing of stone, concrete, etc., built to protect a scarp, embankment, or shore structure against erosion by wave action or currents. Runoff Water flowing over land into streams, rivers and estuaries derived from rainwater that has not soaked into the ground or been intercepted by leaves, ground depression, etc. Salient Bulge in beach alignment forming behind an offshore obstruction. Sand by-passing Hydraulic or mechanical movement of sand from the accreting updrift side to the eroding downdrift side of an inlet or harbour entrance. The hydraulic movement may include natural movement as well as movement caused by human action. Seawall Structure separating land and water areas, primarily designed to prevent erosion and other damage due to wave action. Sediment transport Movement of sand, silt or clay due to combined waves and current. Sheet pile Row of interconnected piles designed to retain soil and/or water on one side. Shoal (n) Region of localised shallower water. (v) Process of getting shallower (and consequential change in wave properties) as shore is approached. Storm surge Rise in the sea water level on the open coast due to abnormal atmospheric pressure and wind shear stress. Tombolo A bar or spit that connects or ties an island to the mainland or to another island. WRL Technical Report 2012/21 April 2013 FINAL G-2
174 Trained entrance Estuary entrance fixed by artificial rock or other armour material walls, often extending seaward of the adjacent shoreline. Transgressive dune Sand dune that creeps inland under the action of prevailing wind possibly covering roads and property. Transitional Water depths between deep (where the no wave motion is felt at the seabed) and shallow (where wave motion is almost uniform from surface to seabed). Tsunami A long-period wave caused by an underwater disturbance such as a volcanic eruption, earthquake or landslide. Commonly miscalled tidal wave. Turbulent flow (usually fast) characterised by eddies and rapid mixing of sediment and pollutants. (c.f. laminar ) Updrift Against direction of alongshore current. Validation Process of adjusting model parameters to match some measured field data. Verification Testing ability of model to match field data independent of that used for validation. Wave energy flux Rate at which wave energy passes any vertical lane of water bounded by the seabed, sea surface and a metre width perpendicular to wave direction. Waves Refers to water motion generated by wind whether local (wind waves) or remote (swell). Zeta curve Looking from above, i.e. plan view, a log-spiral alignment curve often adopted naturally in embayed beaches with a predominant wave direction. WRL Technical Report 2012/21 April 2013 FINAL G-3

175
176
177
178
179
180
181
182
183
184
185
186
187
188
189
190
191
192
193
194
195
196
197
198
199
200
201
202
203
204
205
206
207
208
209
210

211
212
213
214
215
216
217
218

219
220
221
222
223
224
225
226
227
228
229
230
231
232
233
234

235
236
237
238
239
240
241
242
243
244
245
246
247
248

249
250
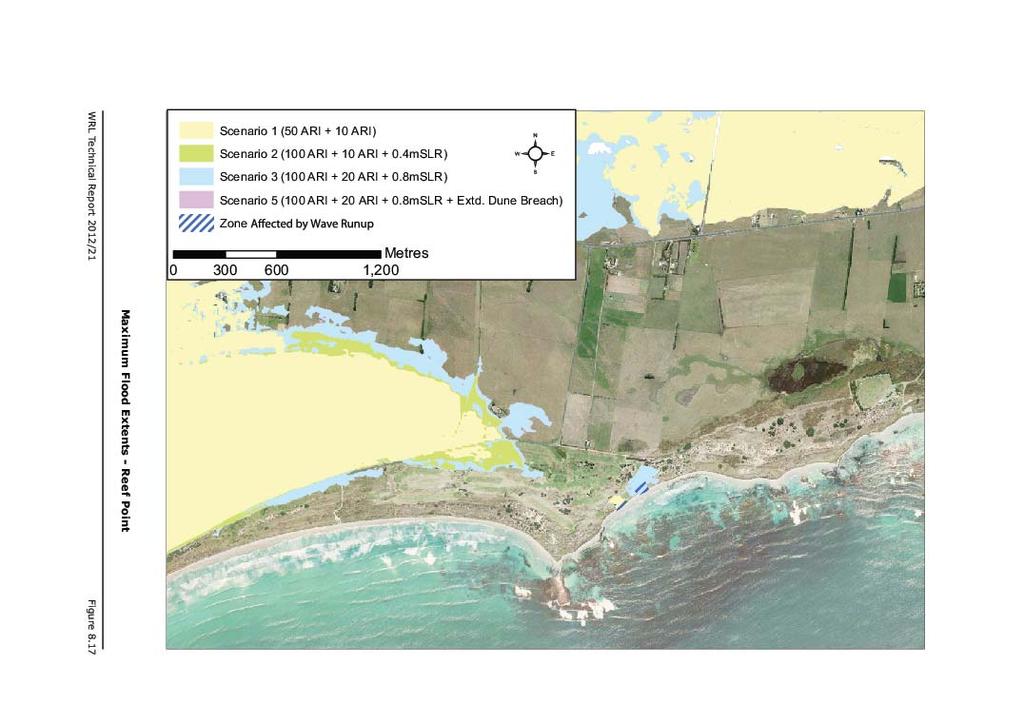
251
252
253
254
255
256
257
258
259
260
261
262
263
264
265
266
267
268
269
270
271
272
273
274
275
276
277
278
279
280
281
282
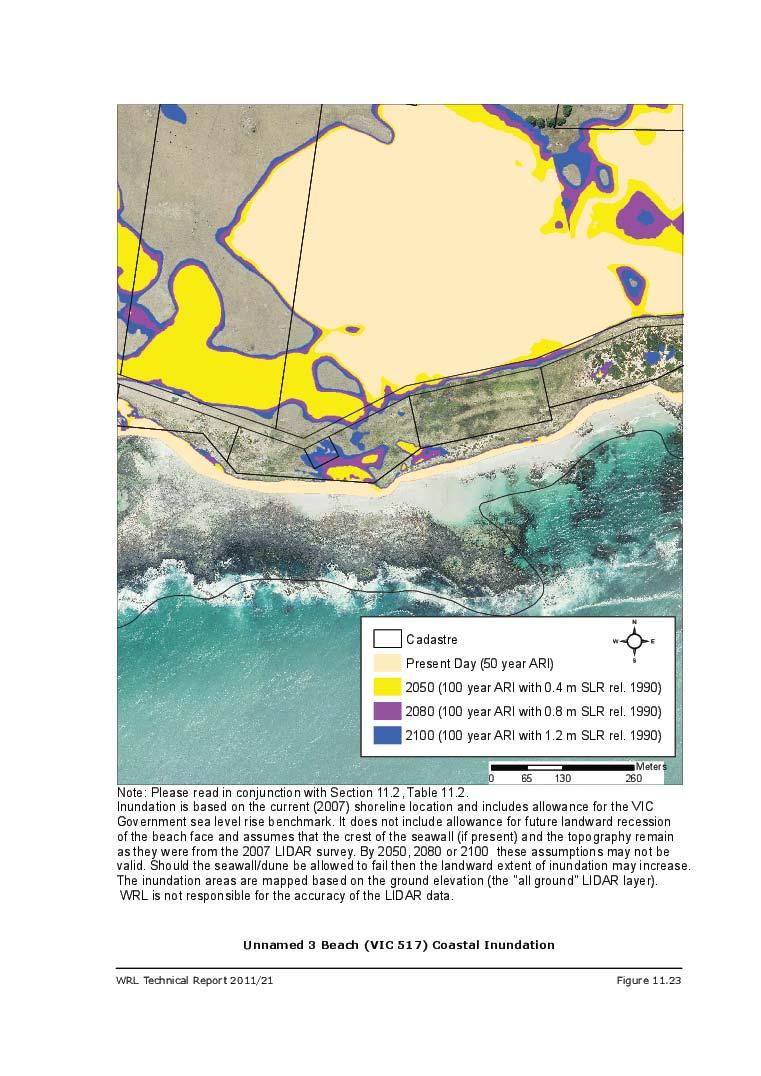
283
284
285
286
287

288
289
290
291
292

293
294
295
296
297
298
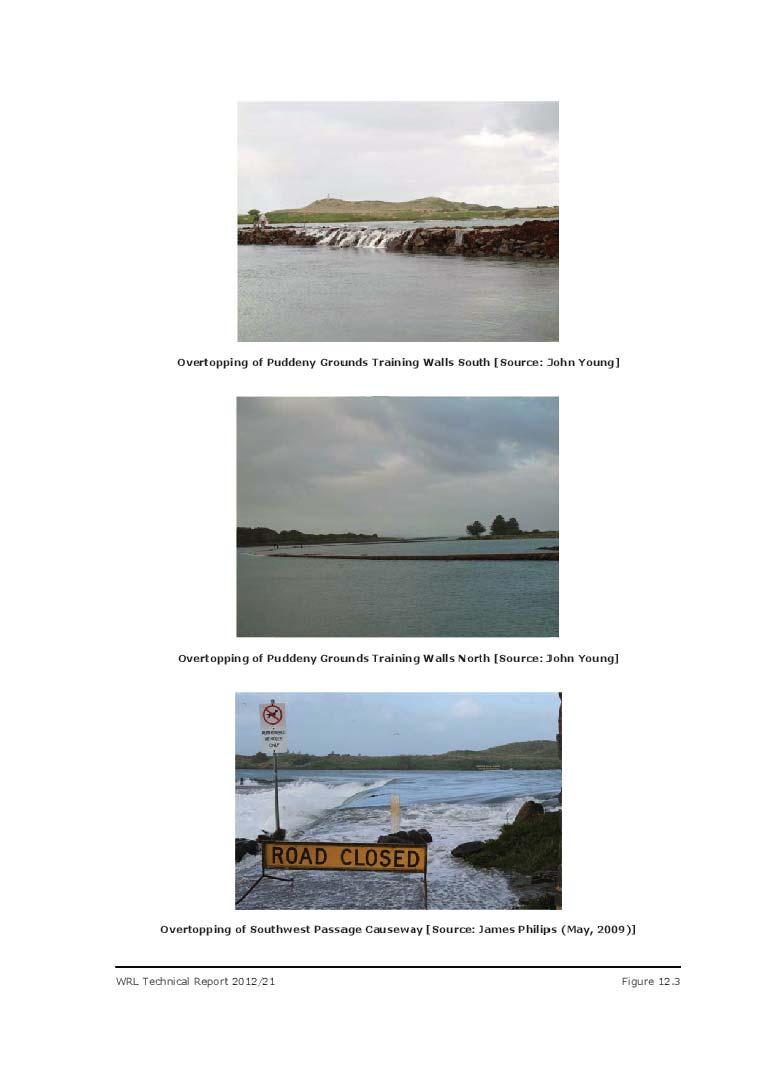
299
300
301
302
303

304
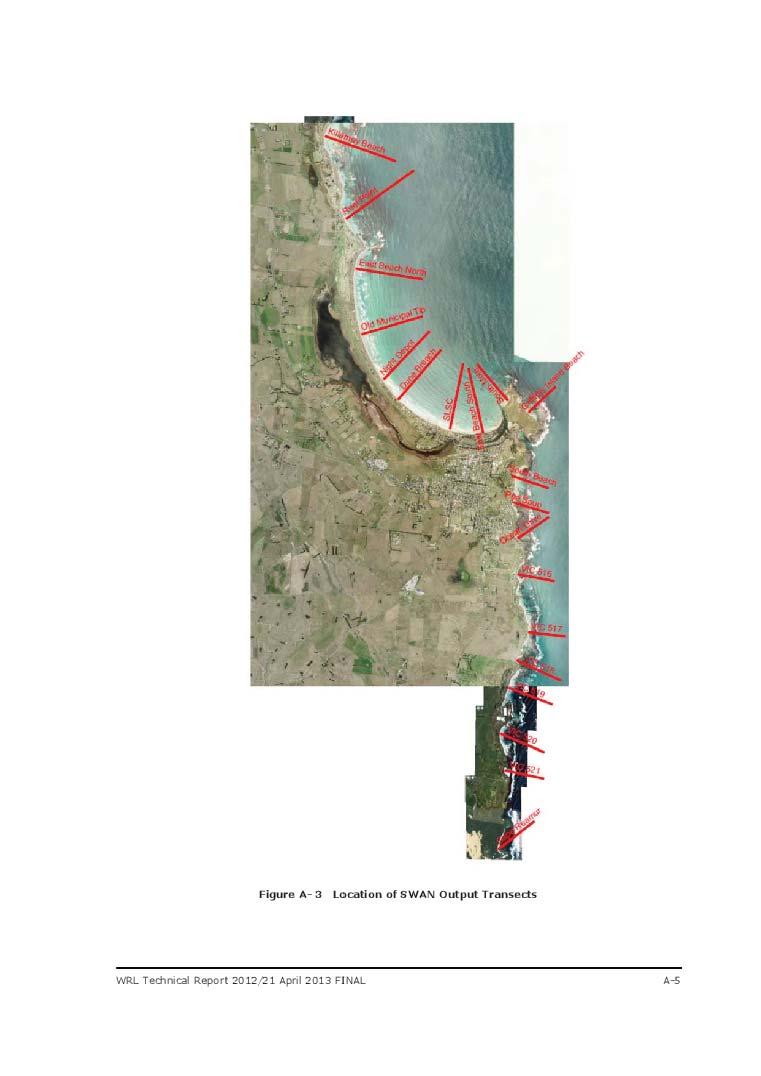
305
306
307
308
309
310
311
312
313
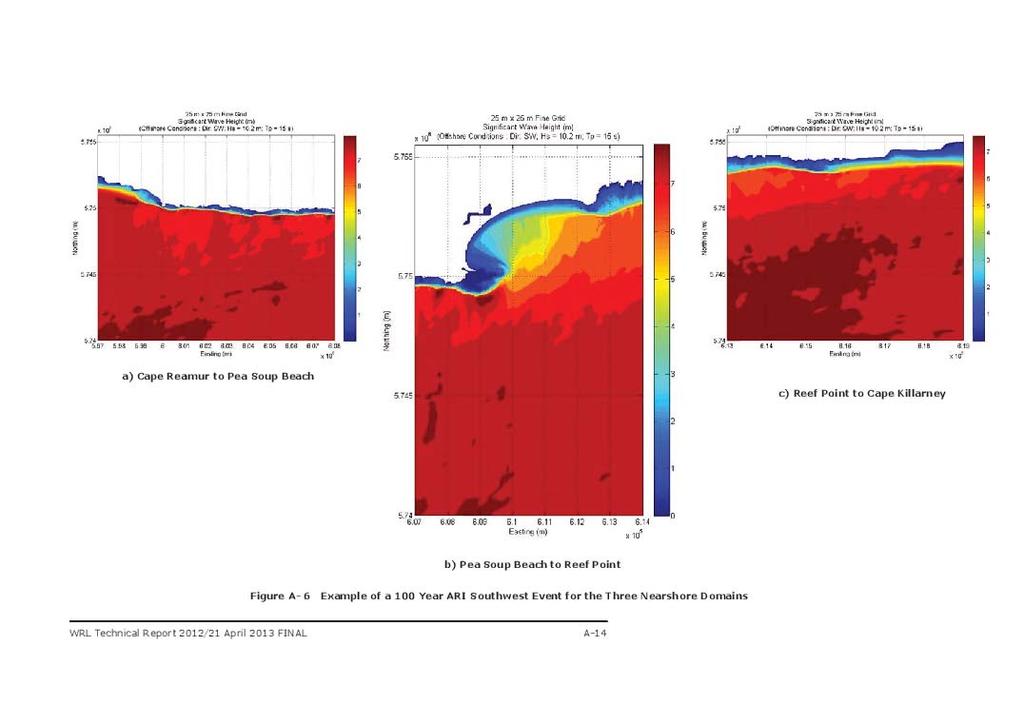
314
315
316
317
318
319
320
321
322
323
324
325 APPENDIX B DUNE BREACHING
326 APPENDIX B Dune Breaching Investigation on East Beach 1. Introduction WRL was commissioned to investigate the possibility of dune breaching in the vicinity of the site located next to the northern end of the existing rock revetment. The first part of this additional component to the study involves assessing the hazard risk due to dune erosion. The second part of this study will involve modelling the extent and consequences of the dune breaching on combined terrestrial and coastal inundation. This appendix provides a summary of the methodology used to perform the erosion study and the derivation of the hazards lines for this specific site with the study area of the Future Coasts Port Fairy Coastal Hazard Assessment. Analysis of the risk of coastal inundation due to the dune breaching was performed, with run up levels and overtopping flow rates derived at a range of locations within the study area. Finally, a summary of the main findings of this study and a set recommendations for future works on the site as well as monitoring actions are provided. Additional technical details on the methodology are provided in Sections 5 and 6 of the report. 2. Presentation of the study site 2.1 Introduction The specific area for this part of the study is the unprotected portion of East Beach located northward of the end of the rock revetment. The potential dune breach study area extends from 224 Griffiths Street to what is usually referred to as the Night Soil site (a former tip), over a total length of approximately 600 m along the beach (see Figure B-1). 2.2 Site Inspection Formal site inspections took place during the week from 2 5 April 2012 and on the 14 August 2012 and were performed by Dr F Flocard and Mr J Carley in the company of Dr R Mibus (MSC). The site inspection focused on a visual assessment of the dune condition and coastal protection works in regards to location, extent and engineering characterisation i.e. crest level, construction, present condition etc. East Beach is 5.8 km long, extending in a broad, arc from Reef Point in the east, where it faces south, to the North Mole or harbour entrance wall in the south, where it faces east. In the northeast section, the beach is backed by a dune which reaches typical elevations of 5 to 10 m AHD. A rock revetment fronts the foreshore of East Beach for approximately 2 km south of the study site, terminating close to its southern end. Functioning rock revetments protect the land and infrastructure behind them but result in additional erosion of adjacent unprotected land at the ends of the revetment, known as seawall end effects. On a receding coastline such as East Beach, sand levels seaward of such a seawall will lower over time. The overall condition of the rock revetment is sub-standard, with inadequate crest height in several places. At the southern end of the study area (Figure B-2 a), rock protection appears to have been placed recently but is not constructed to best contemporary coastal engineering practice. Rock displacement can be observed in multiple places due to storm wave action. The WRL Technical Report 2012/21 April 2013 FINAL B-1
327 northern end of the rock revetment is almost completely outflanked with visible erosion of the dune located immediately behind. As expected, the shoreline has a pronounced erosion/recession immediately adjacent to the end of the rock revetment due to seawall end effects, north-east of the section fronting the last properties. Typical ground level for the two properties in the lee of the rock revetment is about 6 to 7 m AHD. The dune located immediately adjacent to the end of the rock revetment is relatively steep with a crest level of approximately 8 to 10 m AHD, with the presence of a localised low point of 5 m AHD (Figure B-2 b) probably due to pedestrian action and/or previous sand extraction. Over the first 60 m north of the end of the rock revetment, the front dune is backed by a relatively lowlying vegetated area, with typical ground elevation of 2 to 3 m AHD, backed by a secondary dune system with crest levels of 6 to 7 m AHD. This localised depression may have been caused by wind action. No sand mining has been reported to take place at this location, but this cannot be excluded as a cause. Progressing north, the two dunes progressively merge together, resulting in a dune system about 60 to 70 m wide at the Night Soil site. The foredune has a cover of marram grass and some woody shrubs. The dune front can be observed to have been eroding/receding over the whole extent of the study area with a clear and steep scarp extending from the beach level (1 to 2 m AHD) to the dune crest with typical elevation levels between 8 to 12 m AHD. In the north, the study area ends at the Night Soil site. This site has been used in the past as a landfill. The ongoing dune erosion, due to the combined action of storm and underlying recession, is now uncovering the landfill resulting in the release of contaminants and debris into the coastal environment with consequent safety, environmental and aesthetic impacts (Figure B- 2 g). 2.3 Sediment analysis Sediment samples were collected from the intertidal zone at East Beach for three locations. The dried sediment samples were treated according to AS 1289 (2009) to determine the particle size distributions by mechanical sieving. The median particle size (d 50 ) for the sand fraction of sediment was found to vary between 0.2 and 0.4 mm. A d 50 of 0.2 mm was adopted for this erosion study as a conservative approach. Table B-1 Median Sand Fraction Particle Sizes for East Beach Name d 50 (μm) d 50 (mm) East Beach North East Beach Centre (Study Area) East Beach South WRL Technical Report 2012/21 April 2013 FINAL B-2
328 3. Data and Environmental Conditions 3.1 Available Data Aerial Photography and Photogrammetry Data Aerial photography and photogrammetry data was provided by the Department of Sustainability and Environment (DSE) and QASCO Pty Ltd. Analysis of aerial photography allowed the assessment of movement of the seaward edge of dune vegetation. The analysis of the photogrammetry data, available for the study area, including profile plotting and volumetric analysis, allowed the determination of long term recession rates and the validation of these derived through the analysis of vegetation line. The data analysed is summarised for East Beach in Table 3.1. Table 3.1 Summary of Aerial Photography and Photogrammetric Data (source DSE) Location Aerial Photography (years) (a) Photogrammetry East Beach 1948; 1970; 1986; 2003; ;1969;1977; 2002; 2007 Additionally, analysis of long term recession around East Beach was performed using an historical navigation map from 1870 (survey of Stanley) in order to track the evolution of the shoreline over a longer time period. Bathymetric and Topographic Data Bathymetric and topographic sources are listed in Table 3.2. Table 3.2 Summary of Bathymetric and Topographic Data Sources Dataset Data Source Grid Reference System Datum Offshore Contours Geoscience Australia 9 arc second Bathy and Topo Grid ausbath_09_v4 GCS_WGS_1984 AHD DSE LIDAR 2007 Department of Sustainability and MGA Zone54 (topography) Environment (DSE) GDA94 AHD DSE LIDAR Department of Sustainability and MGA Zone (bathymetry) Environment (DSE) GDA94 AHD East Beach GPS_RTK MGA Zone54 Moyne Shire Council (MSC) Survey (2011) GDA94 AHD The East Beach Survey data from 2011 provided by MSC, mainly reported dune toe levels every 70 m along the study area but no information regarding the dune crest level. This information was used to verify the calculated storm demand values as well as the underlying erosion rates, and infer a present day front dune profile at multiple transects locations Wave data and wave modelling This section provides the reader with a brief summary of the findings of the wave modelling study performed for the whole Port Fairy Study area. A more detailed version of this section will be available in the main report of the Future Coasts Port Fairy Coastal Hazard Assessment study. WRL Technical Report 2012/21 April 2013 FINAL B-3
329 The best available data source for wave data is wave buoys. The closest known wave buoys to the site are: Off Port Campbell, VIC, approximately 80 km to the west, operated for approximately 1 year by Sustainability Victoria; Off Cape Bridgwater, VIC, approximately 100 km to the south-east, operated for approximately 1 year by Sustainability Victoria; Off Cape du Couedic, Kangaroo Island, SA, approximately 500 km to the north-west, operated for approximately 9 years by the Bureau of Meteorology; Off Cape Sorell, TAS, approximately 500km to the south-east, operated for approximately 7 years by CSIRO and a further 12 years by the Bureau of Meteorology, giving a total of 19 years of data. The Port Campbell and Cape Bridgewater buoys are directional and provided valuable information in relation to the local wave transformation processes along this particular section of the coastline but at present do not provide long term data. It is generally accepted that ARIs can be extrapolated to three or four times the record length. The Cape du Couedic and Cape Sorell buoys are non-directional. Although these wave buoys are somewhat remote from Port Fairy, Hemer et al. (2008) found that for large storm events in the Southern Ocean, there was often a relationship between waves recorded at Cape Sorell and Cape du Couedic. The analysis of this buoy data, in conjunction with the analysis of long-term global directional wave modelling outputs (NWW3, ERA-40), allowed the establishment of offshore extreme wave conditions for the study area, presented in Table 3.3 and Table 3.4. Table 3.3 Design Extreme Offshore Significant Wave Heights at Nearby Locations Location Years of data Hs (m) for ARI (years) Port Campbell Cape Bridgewater Cape Du Couedic Cape Sorell A detailed analysis of wave transformation from offshore to within the beach embayment was undertaken using a contemporary SWAN (Simulating WAves Nearshore) numerical model. The model was developped with appropriate extents, grid resolution, and nested grids, to ensure the best modelling practice of wave transformation from deep water to the nearshore zone. The SWAN model was run for offshore wave directions in 22.5º increments, ranging from east to west swell directions, as described in Table 3.4. Table 3.4 Adopted Directional Extreme Offshore Significant Wave Heights for Port Fairy Direction Hs average Hs (m) for ARI (years) (m) East to South South-South-west South-west West-South-west to West WRL Technical Report 2012/21 April 2013 FINAL B-4
330 The SWAN modelling provided an estimate of nearshore waves during extreme events, as well as an understanding of the gradient/variation in wave exposure during typical wave conditions. To improve the estimates of wave breaking through the surf zone, the SWAN model output was coupled with the 1-D Dally Dean and Dalrymple (1984) surf zone model. This provided significantly more reliable predictions of wave breaking, setup, and runup on the beach slope. This task was performed at seven locations over the study area, ranging from the northern end of the rock wall to, the former night soil disposal site (Figure B-3). While the offshore analysis of the buoy and model data found that for large wave events the most likely directions and largest storm events originated from South-west to West, the near shore wave propagation study revealed that the most severe wave conditions for the study area originated from the South-east. Given that the main purpose of this specific study was to assess the potential for dune breaching, it was decided to adopt a conservative approach and only consider 100 yr ARI storm events. 3.3 Extreme water levels and Sea Level Rise The design elevated water levels for the 100 yr average recurrence interval (ARI) considered in this investigation is presented in Table 3.5, using the results from the CSIRO on extreme sea levels along the Victoria s coast (CSIRO, 2009). While these design water levels incorporate allowance for tides, barometric setup and wind setup (i.e. storm surge), they do not include wave setup and wave runup, which need to be determined through modelling. Table 3.5 Design Present Day Water Levels Tide +Storm Surge (source CSIRO, 2009) Average Recurrence MHWS Storm Surge Height Water Level Excluding Wave Setup and Runup Interval ARI (yr) (m AHD) (m AHD) (m AHD) ± ±0.05 The time frame over which this specific dune breach erosion study has been conducted is slightly different than for the main Future Coasts Port Fairy Coastal Hazard Assessment study. Erosion and inundation modelling were performed for four different planning periods, these being Present Day, 2020, 2035 and Given the uncertainty on short-term sea level rises values, it was decided to incorporate a sea level rise of 0.8 m for the 2080 horizon, which is consistent with the approach adopted by the Victorian Coastal Hazard Guide (DSE, 2012). The consequences of a potential sea level rise of 0.2 m by 2035 were additionally investigated for the identified area under risk of breaching by 2035 with no notable additional impact to the scenario which did not considered a sea-level rise. WRL Technical Report 2012/21 April 2013 FINAL B-5
331 4. Coastal Erosion Hazards 4.1 Methodology In accordance with the recommendations within the Victorian Coastal Hazard Guide (DSE, 2012), coastal hazard lines were identified for the present day condition as well as immediate shortterm dates, i.e and 2035 and for the 2080 planning horizon including a sea level rise projection of 0.8 m. Figure B-4 presents the method for estimation of immediate and future position of the coastal hazard lines diagrammatically. The landward limit of the coastline hazard zone corresponds to the estimated position of the backshore erosion scarp for the particular planning period. The immediate hazard line position was obtained by considering the erosion hazard due to storm demand and allowing for slope adjustment. For all sandy stretches, in accordance with Nielsen et al. (1992) (Figure B-4 b), the zone of slope adjustment was be identified and included in the hazard lines definition as it is relevant for buildings. On the other hand, the zone of reduced foundation capacity was not included as the main purpose of this specific study was to establish of the risk of the dune being breached as this stretch of coast does not have presently buildings. The future hazard lines, for the 2020, 2035 and 2080 planning horizons, were estimated by adding the underlying shoreline recession and the sea level rise induced shoreline recession, for 2080 only. As shown in Figure B-4 b, three key components of coastal setback were defined in this specific study and incorporated into the hazard line, namely: S1: Allowance for short term storm erosion (storm demand); S2: Allowance for ongoing underlying recession; and S3: Allowance for recession due to future sea level rise for The total design setback (S) for three planning horizons comprises: Present day: S = S1; 2020: S = S1 + S2(2020); 2035: S = S1 + S2(2035); and 2080: S = S1 + S2(2080) + S3(2080). 4.2 Short Term Storm Erosion (S1) Beach erosion relates to the erosion of the beach by a single extreme storm event or from several storm events in close succession. The amount of sand (above 0 m AHD) transported offshore by wave action is referred to as storm demand and expressed as a volume of sand per metre length of beach (m 3 /m). Design storm demands for the beaches of the Port Fairy study area were assessed through SBEACH numerical modelling (Carley and Cox, 2003). These are presented for each of the seven transect locations over the study area (Figure B-3) in Table 4.1 for the 100 year ARI event. WRL Technical Report 2012/21 April 2013 FINAL B-6
332 Table 4.1 Design Storm Demands for 100 year ARI event Volume of Storm Demand (m 3 /m) Representative Profile SBEACH Modelling Location year year year ARI Event ARI Event Adopted ARI Event Transect A (Rock revetment end) Transect B Transect C Transect D Transect E Transect F Transect G (Night Soil Site) To allow for several storm events in close succession (storm clustering), WRL adopted the storm demand from year ARI events modelled in SBEACH. The choice of using three consecutive storms, instead of two as initially proposed, arose from the need to take into account the evolution of the dune system and shoreline position since the 2007 LIDAR data acquisition campaign as well as the multiple severe storm events which took place since 2007, such as in June and July The results of this verification exercise are given in Section Underlying Recession Ongoing underlying recession is the progressive onshore shift of the long term average land-sea boundary which may result from sediment loss. It is expressed in terms of change over years in volume of sand within the beach fronting the seawalls (m 3 /m/year) and/or corresponding landward shoreline movement (m/year). Recession rates due to sediment loss around the study area coastline were derived through the analysis of long term changes in the location of the vegetation line using the available aerial photography. The analysis was performed by assessing the horizontal movement of the vegetation line between the 1948, 1970, 1986 and 2010 aerial photography plates (see Figure B-5). It was decided not to use the 2003 aerial photography as the resolution was significantly lower and ortho-rectification was assessed as problematic. As the rock revetment construction was started in the 1960s, the aerial photography of 1948 was not used in this analysis in order to consider the seawall-end effects immediately north of the rock revetment northern end. These results were compared to the results of the photogrammetric analysis performed by Carley (2008) over a 600 m stretch of East Beach, immediately north of the northern end of the rock revetment. The average change over the study area was m/year (recession) over 38 years from 1969 to 2007, with recession more pronounced over the 200 m stretch of coast adjacent to the end of the rock revetment. The underlying recession rates at the different transects locations for both methods are provided in Table 4.2 (negative value is recession). WRL Technical Report 2012/21 April 2013 FINAL B-7
333 Table 4.2 WRL Interpretation of Coastal Change from Aerial Photography and Photogrammetry Representative Profile Location Vegetation lines (m/yr) Photogrammetry (m/yr) (1) Adopted (m/yr) Transect A (Rock revetment end) Transect B Transect C Transect D Transect E Transect F Transect G (Night Soil Site) Notes: (1) WRL analysed the horizontal movement of the +4 and +6 m AHD contours (on the seaward face) as these were below the foredune crest for all profiles. Higher contours were present, however, these were often well back from the dune face fronting the beach WRL s analysis of the vegetation lines and the photogrammetry profiles showed found generally similar values for both methods. The recession was highest at the southern end of the study area, grading to negligible at the northern end of the subject site. This higher rate of recession at the southern end is most likely to be due to end effects from the rock revetment. Additionally, a quantification of longer term change was performed by comparing the evolution of the shoreline location extracted from the chart of Stanley (1870) with the vegetation line obtained from analysis of the 2010 aerial photography (Figure B-6). This exercise indicates that shoreline recession over the period from 1870 until 2010, was approximately 60 m at the southern limit of the study area and reduced northward to 25 m at a the Night Soil site, with the results presented in Table 4.3. Over a period of 140 years, this indicates : a recession rate at the south of the study area of 0.41 m/year, reducing to; a recession rate 0.18 m/year, at the Night Soil site. These rates are further complicated by the construction of the training walls in the 1870s and 1880s and the rock revetment on the southern part of the beach from the 1960s. These structures can be expected to have altered the rates of shoreline change both updrift and downdrift. Table 4.3 WRL Interpretation of Coastal Change from Comparison of 2010 Aerial Photography with Stanley 1870 Chart Representative Profile Location Evolution (m) Evolution rate (m/yr) Transect A (Rock revetment end) Transect B Transect C Transect D Transect E Transect F Transect G (Night Soil Site) Recent major storms, such as the events of June and August 2011, have caused recent erosion which may make the recession appear to have accelerated over the last decade. WRL Technical Report 2012/21 April 2013 FINAL B-8
334 4.4 Verification of calculated storm demand and underlying recession rates The calculated storm demand volumes as well as the underlying recession rates at the different locations were compared to the nearest survey points from the November 2011 MSC RTK-GPS survey. In order to take account of the potential erosion of the dune due to multiple storms in the time interval, as well as the effect of underlying recession, an inferred profile was deducted from the 2007 LIDAR data by applying the storm demand obtained from SBEACH and 5 years of recession to the different studied profiles (see Figures B-7 to B-10). The calculation of the resulting combined setback (S1 (1x yr100ari) + S2(2011)) allowed for the creation an inferred present day profile (red line) at each transect location, which was compared to the results of the nearest point of the 2011 RTK GPS survey. The results and difference are given in Table 4.4. Table 4.4 Comparison of dune toe elevation from the 2011 RTK-GPS survey and the WRL inferred present day profiles Representative Profile Location 2011 RTK-GPS (m AHD) WRL Inferred Profile (m AHD) Transect A (Rock revetment end) Transect B Transect C Transect D Transect E Transect F Transect G (Night Soil Site) The results of this verification exercise were satisfactory, with calculated elevations of the dune toe within a ±0.5 m AHD difference with the survey data and are given in Section Recession due to Sea Level Rise It is expected that open coast sandy beaches will recede under sea level rise. The most commonly used method for estimating this recession rate is the Bruun Rule (Bruun, 1962, 1988), which is expressed as the rate of sea level rise divided by the average slope of the active beach profile. This rule is based on the concept that the existing beach profile is in equilibrium with the incident wave climate and existing average water level. It is a simple concept, which assumes that the beach system is two-dimensional and that there is no interference with the equilibrium profile by headlands and offshore reefs. The Bruun rule is typically expressed as R SLR * X h (B.1) d c where R is horizontal recession (m) SLR is sea level rise (m) X is the horizontal distance between h and d c h is active dune/berm height (m) d c is profile closure depth (m, expressed as a positive number). WRL Technical Report 2012/21 April 2013 FINAL B-9
335 This is frequently simplified to R = BF * SLR (B.2) where R is recession BF is the Bruun Factor, being a function of X, h and d c. A range of methods were used to determine the Bruun Factor for the study area as well as other locations on East Beach (Figure B-11), such as the method of Hallermeier (1981, 1983) and Birkemeier (1985). The calculated Bruun Factors derived from the different methods are shown in Table 4.5. Table 4.5 Calculation of Bruun Factor for Different Methods across East Beach Representative Profile Location BF Hallermeier BF Birkemeier BF Adopted East Beach South East Beach SLSC Rock Revetment Nth Night Soil Old Municipal Tip East Beach North Both methods provided similar results and a Bruun Factor of 40 was adopted for the study area, since the bay is likely to have only one unique value. The impact of a 0.80 m sea level for the 2080 planning timeframe using a Bruun Factor of 40 will be a coastal recession of 32 m. The impact of a sea level rise of 0.2 m for the 2035 planning timeframe using a Bruun Factor of 40 will be a coastal recession of 8 m. The consequence of this additional setback on the dune areas at risk of breaching by 2035 are minimal as the change to the resulting eroded dune crest height does not significantly impact the extent of the breach. Note that the Bruun Rule provides an order of magnitude of long term recession due to sea level rise only. The projected recession would not eventuate if the seawall was extended northward, or if major sand nourishment and/or groyne construction was undertaken. 4.6 Summary of Design Setbacks Allowances A summary of design setback allowances from the preceding information is shown in Table 4.6. For initial application, these setbacks were established on the +4m AHD contour on the frontal dune escarpment. The setback distances were assessed using the following assumptions: A planning timeframe ranging from Present Day to 2080; A 100 year ARI design erosion event consisting of 3 consecutives 100 year ARI storms (due to clustering, see Section 4.2); WRL Technical Report 2012/21 April 2013 FINAL B-10
336 Underlying recession rates continue at the average rates observed for 1970 to 2010; 0.8 m sea level rise by the horizon of 2080 and the predictions of the Bruun rule being realised. The setback allowances have been calculated volumetrically at the different transect locations (Figures B-7 to B-10) and the resulting hazard lines are shown in Figure B-12. These utilise the 2007 LIDAR digital terrain model supplied by DSE. Table 4.6 Summary of Setback Allowances over the Study Area for Present Day, 2020, 2035 and 2080 Representative Profile Location Present Future Erosion Setback (m) Erosion Setback (m) S1 S1 + S2(2020) S1 + S2(2035) S1 + S2(2080) + S3(2080) Transect A (Rock revetment end) >60 Transect B >74 Transect C Transect D Transect E >85 Transect F >74 Transect G (Night Soil Site) The analysis of the different eroded profiles (Figures B-7 to B-10) show that the zone immediately adjacent to the end of the rock revetment (i.e. Transects A, B and C) is subject to a risk of dune breaching between the ocean and the localised low-lying area in the lee of the dune by the 2020 and 2035 planning horizons. A more severe sequence of storms than that applied for the analysis might breach the dune prior to these dates. The remaining area to the north of Transect C is not subject to an immediate or short term risk of breaching as the dune system is significantly wider here. A review of the predicted eroded dune crest heights at the different transects locations is provided in Table 4.7. WRL Technical Report 2012/21 April 2013 FINAL B-11
337 Table 4.7 Summary of the eroded dune crest heights over the Study Area for Present Day, 2020, 2035 and 2080 scenarios Representative Profile Location Dune Crest Height (m AHD) Future Dune Crest Height (m AHD) Present Day Transect A (Rock revetment end) 7 5 & 5 (1) 3 & 5 (1) 2 Transect B 4 & 7 (1) 4 & 7 (1) 4 & 7 (1) 3 Transect C 5 & 10 (1) 3 & 10 (1) 2 & 10 (1) 4 Transect D Transect E Transect F Transect G (Night Soil Site) Notes: (1) For Transects A, B and C, two dune crest height values a provided. The first value represents the frontal dune crest height after erosion, the second value represents the secondary dune crest height located leeward after erosion. Should a 0.80 m sea level rise eventuate, and the resultant coastal recession be consistent with the projections of this report, there would be a risk of a breach of the dunes between the ocean and Griffith Street, through to Belfast Lough, over a significant portion of the study area (from Transects A to F). 5. Coastal Inundation Determination 5.1 Introduction Coastal inundation is the flooding of coastal land areas by ocean waters. It is due to elevated water levels and/or extreme waves impacting the coast. Consequently, inundation levels along the coast are characterised by two components: a quasi-static component, which includes the effects of elevated water levels due to tide, storm surge and wave setup; and a dynamic component, which includes the effects of wave runup and wave overtopping caused by the direct impact of waves on the coastal structures. The quasi-static inundation level is the most representative inundation level for areas located away from direct impact of the overtopping waves (generally those properties which are not in the front row facing the water). Wave runup and overtopping are a predictor of the wave impacts beachfront structures are likely to suffer during extreme storm events. The results presented in the following sections are an initial assessment of the potential extent of the resulting coastal flooding component in the event of dune breaching. Further flood modelling is being presently undertaken, using the results (overtopping volumes and/or wave setup) of this localised erosion investigation to estimate likely inundation extents in the area of 224 Griffith Street, Port Fairy. This in association with the results of the catchment flooding levels from the Port Fairy Regional Flood Study (Water Technology, 2008). The SWAN and SBEACH model results will be used to drive the existing Mike Flood model developed by Water Technology for the 2008 Port Fairy Regional flood study. WRL will apply a local modification to the topography grid in order to simulate the dune breaching for two agreed scenarios (present WRL Technical Report 2012/21 April 2013 FINAL B-12
338 day or 2035 and 2080). The results of this flood modelling exercise will be presented in a future report. 5.2 Coastal Inundation Zones Design water levels incorporating tide and storm surge were presented in Section 3.3 and derived from the CSIRO study on extreme water levels along the Victorian coast Guide (CSIRO, 2010). Wave setup varies along the Port Fairy beaches as it is intrinsically dependent on the wave conditions at each beach. For instance, East Beach will present a lower wave setup compared to south-west facing ocean beaches due to the typically lower incident wave conditions. Wave setup was calculated by implementing the Darlymple, Dean & Dally surfzone model (1984) locally at each representative location within the study area using the nearshore wave modelling outputs. Quasi-static inundation levels were then derived by adding the calculated wave setup to the design water levels. Predicted inundation levels incorporating astronomical tide, barometric setup, and wave setup for present day conditions (which are identical for the 2020 and 2035 scenarios as no SLR was used) and for the 2080 SLR scenario are presented in Table 5.1. Table 5.1 Summary of Present Day and Future SLR Inundation Levels (excluding wave runup and overtopping) Representative Profile Location Present Inundation Future Inundation Levels Level (m AHD) (m AHD) 100 year ARI Event 100 year ARI Event No SLR SLR = 0.8 m Transect A (Rock revetment end) Transect B Transect C Transect D Transect E Transect F Transect G (Night Soil Site) The analysis of these static inundation levels combined with the eroded crest levels obtained from the erosion study provided in Table 4.7 indicate that there is a low risk of coastal inundation for the Present Day, 2020 and 2035 planning horizons, when not considering wave runup. On the other hand, should a 0.80 m sea level rise eventuate, there would be a high risk of a breach of the dunes between the ocean and Griffith Street, through to Belfast Lough, over a significant portion of the study area (Transects A, B and E). 5.3 Wave Runup and Overtopping The portion of East Beach considered within this specific study is backed by sand dunes. Wave runup was quantified using the method of Mase (1989) and expressed as run up levels to m AHD. Overtopping was quantified in terms of volume of water being discharged above the dune WRL Technical Report 2012/21 April 2013 FINAL B-13
339 crest and expressed in L/s per metre length of crest, using the method described in EurOtop (2007). Wave overtopping was quantified at each transect location taking into account the following factors: eroded dune crest height for each scenario considered; nearshore wave conditions i.e. wave height and period as derived from the wave modelling exercise. Typically depth limited conditions dominated at the ocean beach seawalls while non-breaking wave conditions dominated at the harbour seawalls; elevated water levels calculated at each representative location incorporating tides, storm surge and wave setup. The estimated overtopping rates refer to the zone immediately behind the dune crest and can be related to the published tolerable rates (CEM, 2003, EurOtop, 2007) with regards to structural and people safety. Wave runup and overtopping discharges estimated for the Present Day, 2020, 2035 and 2080 planning horizon after erosion are presented in Tables 5.2 and 5.3 respectively. Table 5.2 Present Day and 2020 Predicted Wave Overtopping Discharge Present Day 2020 Representative Profile Location Crest Level Wave Runup (R 2%) Mean Overtopping Discharge Crest Level Wave Runup (R 2%) Mean Overtopping Discharge (m AHD) (m AHD) (L/s per m) (m AHD) (m AHD) (L/s per m) Transect A & 5 (1) Transect B 4 & 7 (1) & 7 (1) Transect C 5 & 10 (1) & 10 (1) & 0 (2) Transect D Transect E Transect F Transect G Notes: (1) For Transects A, B and C, two dune crest height values are provided, the first value represents the frontal dune crest height after erosion, the second value represents the secondary dune crest height located leeward after erosion. (2) For Transects A and B, two overtopping discharges values a provided, the first value represents the discharge rating entering the low-lying area behind the frontal dune, while second value indicates that there is no overtopping of the leeward dune. WRL Technical Report 2012/21 April 2013 FINAL B-14
340 Table and 2080 Predicted Wave Overtopping Discharge Wave Mean Crest Wave Runup Overtopping Level Runup (R 2%) Discharge (R 2%) Representative Profile Location Crest Level Mean Overtopping Discharge (m AHD) (m AHD) (L/s per m) (m AHD) (m AHD) (L/s per m) Transect A 3 & 5 (1) & 0 (2) Transect B 4 & 7 (1) Transect C 2 & 10 (1) & 0 (2) Transect D Transect E Transect F Transect G Notes: (1) For Transects A, B and C, two dune crest height values are provided, the first value represents the frontal dune crest height after erosion, the second value represents the secondary dune crest height located leeward after erosion. (2) For Transects A and B, two overtopping discharges values a provided, the first value represents the discharge rating entering the low-lying area behind the frontal dune, while second value indicates that there is no overtopping of the leeward dune. The analysis of the wave runup and overtopping values indicate that there is negligble risk of the frontal dune breaching under the Present Day conditions from wave runup alone. The analysis of the wave runup and overtopping values indicate that there is a moderate risk for the frontal dune being breached between Transects A and C by the 2020 and 2035 planning horizons. While the calculated discharges rates, and therefore flood volumes, in the low-lying area can be considered low, they would potentially increase the erosion hazard and accentuate the erosion hazard risk to properties immediately behind the northern end of the rock revetment by outflanking the rock revetment. As expected from the conclusions of the previous sections, should a 0.80 m sea level rise eventuate, the risk of a breach of the dunes between the ocean and Griffith Street, through to Belfast Lough, over a significant portion of the study area (Transects A, B and E) would be very high, with overtopping discharge rates of about 50 L/s/m. An approximate presentation of the coastal flooding extent due to the dune breaching based on R2% run up values and the 2007 LIDAR data, for the 2020, 2035 and 2080, is provided on Figures B-13, B-14 and B-15. For the case of the dune breaching for the 2080 planning horizon, the blue polygon representing the potential extent of coastal flooding has been extended past Griffiths Street to visually represent the potential risk of catchment flooding from the Belfast Lough and coastal flooding merging together. The extent of the coastal flood polygon does not represent in any way the propagation distance of the overtopping waves over the eroded dune crest. WRL Technical Report 2012/21 April 2013 FINAL B-15
341 6. Conclusions and Recommendations This letter report presents the main findings of a localised coastal hazard assessment study for the undeveloped site located immediately next to the northern end of the rock revetment on East Beach in Port Fairy, VIC. The study area of this specific erosion study occupies a narrow sand peninsula, and is constrained by the ocean, Griffith Street and Belfast Lough. The main focus of this study was to assess the potential risk of dune breaching for different planning horizons, i.e. Present Day, 2020, 2035 and The volumes of storm erosion adopted in this study were assessed through SBEACH numerical modelling (Carley and Cox, 2003). The rates of recession adopted in this study were derived from the analysis of aerial photography as well as photogrammetric profiles. These values were calibrated and compared to the only recent survey data available (MSC 2011). Future shoreline recession as a result of sea level rise was estimated using the Bruun Rule and satisfied the guidelines given by Victorian Coastal Hazard Guide (DSE, 2012). The limitations of this methodology are well recognised (Ranasinghe et al., 2007) and were taken into consideration. However, no robust and scientifically recognised alternative currently exists and the application of the Bruun Rule is currently supported by various state government policies. Mapping of coastal hazard lines was produced to provide general guidance for coastal planning and to identify areas prone to coastal hazards. Mapping was undertaken using state-of-the-art and government endorsed methodologies. Mapping was based on the discretisation of the coastline into mean profiles which were obtained from the available 2007 LIDAR data. The limitations of the temporal and spatial resolution of the available data applies to the mapping as well, and site specific investigations and surveys are encouraged to overcome such limitations. At present, the risk of dune breaching over the study area is low. For the planning horizons of 2020 and 2035, localised dune breaching could potentially take place over a 70 m wide section of the frontal dune immediately adjacent to the northern end of the rock revetment. The extent of the coastal flooding should be contained within a low lying area located immediately behind the breached dune, and is unlikely to extend to Griffiths Street. This localised hazard could, however, impact the stability of the properties located at 222 and 224 Griffiths Street. For the 2080 planning horizon, contingent on 0.80 m sea level rise eventuating, the risk of a 400 m long breach of the dunes between the ocean and Griffith Street, through to Belfast Lough, would be very high, with overtopping discharges rate of about 50 L/s/m. The consequences of this dune breaching event could be significantly exacerbated should coastal and catchment flooding coincide, with a second entrance to the Moyne River forming (albeit perhaps only temporary). Additionally, it should be noted that the design storm event adopted for this study would result in a coastline erosion of approximately 10 m in front of the Night Soil Site. This erosion of the shoreline would be associated with significant exposure of landfill material and would result in an increased health and safety hazard within the coastal environment. WRL Technical Report 2012/21 April 2013 FINAL B-16
342 It is WRL s understanding that MSC is in the early stages of tendering repair/extension work on the rock revetment. Taking this potential change into account, the following future work priorities are recommended to reduce imminent and medium to long-term hazard of dune breaching along East Beach: 6.1 Immediate / Short Term (6 months 1 year) Work Priorities Survey beach and analyse data to quantify changes since 2007 LIDAR and survey of The survey should extend in the foredune area and map the present dune crest levels; Repair the northern end of the rock revetment so that it complies with current coastal engineering practices; Ensure that the new design of the rock revetment allows for it to be extended in order to ensure immediate protection from potential dune breaching; Establish a dune height and volume trigger level based on the updated dune profile and storm demand volume in order to facilitate the decision making process for rock revetment extension work; Ensure that any work on the rock revetment does not exacerbate the erosion hazard at the Night Soil site or at the old Municipal Tip site; Import or redistribute sand to raise low points in dune crest and revegetate with native grasses and sand binding species; Place sand in critically eroded locations such as adjacent to the current rock revetment end; Investigate the possibility of filling the low-lying area next to 224 Griffith Street with sand and revegetate with native grasses and sand binding species; Identify rock sources for possible future use. Assess potential rock for available size and durability; Identify possible land or offshore sand sources and estimate costs to transport and place on beach (initial start-up cost and subsequent cost per m). 6.2 Medium Term (2-5 years) Work Priorities Moderate beach nourishment to replace volume lost during most recent storm from offshore or land-based source; Trial geotextile groyne structure with pre-fill nourishment and associated beach monitoring to assess effect and assist in design of more extensive works; Consideration of emergency geotextile or rock wall at severely eroded and/or critical locations (i.e. 224 Griffiths Street, Night Soil site); Initiate investigation of long-term management strategies for East Beach. The fundamental issue resolved during this process should be whether to Protect (e.g. seawall or backstop wall, major nourishment, groynes, etc.), Accommodate (minor nourishment, scraping, etc.) or Retreat (do nothing or managed retreat) in the long-term. 6.3 Long-term (>5 years) Work Priorities Subject to outcomes long-term management strategies project, if a decision is made to Accommodate or Protect, works may include: WRL Technical Report 2012/21 April 2013 FINAL B-17
343 Raising of dune crests to counter increased future run-up elevations with sea level rise; Ongoing nourishment/sand relocation to counter sediment deficit and longshore movement with or without control structures depending on community sentiment and coupled physicaleconomic modelling; Engineered backstop wall to limit shoreline retreat past a defined position. WRL Technical Report 2012/21 April 2013 FINAL B-18
344
345
346

347
348
349
350
351
352
353
354
355
356
357
358
359

360
ST LEONARDS COASTAL HAZARD VULNERABILITY ASSESSMENT
 Level 12, 333 Collins Street Melbourne VIC 3000 Australia Telephone: +61 3 8676 3500 Facsimile: +61 3 8676 3505 www.worleyparsons.com WorleyParsons Services Pty Ltd ABN 61 001 279 812 23 November 2011
1. Introduction. 1.1 Background
 1. Introduction 1.1 Background The Eurobodalla Shire Council (ESC) coastline is approximately 110 km long extending from South Durras to Mystery Bay and includes Batemans Bay east of the Tollgate Bridge.
SELECTION OF THE PREFERRED MANAGEMENT OPTION FOR STOCKTON BEACH APPLICATION OF 2D COASTAL PROCESSES MODELLING
 SELECTION OF THE PREFERRED MANAGEMENT OPTION FOR STOCKTON BEACH APPLICATION OF 2D COASTAL PROCESSES MODELLING C Allery 1 1 DHI Water and Environment, Sydney, NSW Abstract This paper presents an approach
HURRICANE SANDY LIMITED REEVALUATION REPORT UNION BEACH, NEW JERSEY DRAFT ENGINEERING APPENDIX SUB APPENDIX D SBEACH MODELING
 HURRICANE SANDY LIMITED REEVALUATION REPORT UNION BEACH, NEW JERSEY DRAFT ENGINEERING APPENDIX SUB APPENDIX D SBEACH MODELING Rev. 18 Feb 2015 1 SBEACH Modeling 1.0 Introduction Following the methodology
Appendix M: Durras Lake Tailwater Conditions
 Appendix M: Durras Lake Tailwater Conditions M.1 Preamble WRL has completed a tailwater condition assessment for the entrance to Durras Lake, to be used as an ocean boundary condition for a future flood
Appendix D: SWAN Wave Modelling
 Appendix D: SWAN Wave Modelling D.1 Preamble The Eurobodalla Shire Council area is subject to extreme waves originating from offshore storms. When swell waves approach the coast, they are modified by the
April 7, Prepared for: The Caribbean Disaster Emergency Response Agency Prepared by: CEAC Solutions Co. Ltd.
 April 7, 2006 Prepared for: The Caribbean Disaster Emergency Response Agency Prepared by: Introduction CEAC Solutions Co. Ltd was commissioned in May 2005 to prepare coastal beach erosion hazard maps for
Australian Coastal Councils Conference
 Australian Coastal Councils Conference Kiama March 2019 Where Has My Beach Gone? (and what can I do about it?) Dr Andrew McCowan Water Technology Where Has My Beach Gone? Where Has My Beach Gone? Where
Long Beach Island Holgate Spit Little Egg Inlet Historical Evolution Introduction Longshore Transport Map, Survey and Photo Historic Sequence
 Appendix B Long Beach Island Holgate Spit Little Egg Inlet Historical Evolution Introduction The undeveloped southern end of Long Beach Island (LBI) is referred to as the Holgate spit as it adjoins the
Inspection of Clarence City Beaches following Winter 2011 Storm Events
 18 July 2011 WRL Ref: WRL10086TDS L20110718 Messrs P Watson & I Preece Clarence City Council PO Box 96 Rosny Park TAS 7018 By email: pwatson@ccc.tas.gov.au ipreece@ccc.tas.gov.au Dear Phil/Ian, Inspection
Inventory of coastal sandy areas protection of infrastructure and planned retreat
 2018-02-28 Inventory of coastal sandy areas protection of infrastructure and planned retreat Johanna Birgander, Thorbjörn Nilsson, Pär Persson Summary To estimate the natural protection around the coast
Beach profile surveys and morphological change, Otago Harbour entrance to Karitane May 2014 to June 2015
 Beach profile surveys and morphological change, Otago Harbour entrance to Karitane May 2014 to June 2015 Prepared for Port Otago Ltd Martin Single September 2015 Shore Processes and Management Ltd Contact
CHAPTER 8 ASSESSMENT OF COASTAL VULNERABILITY INDEX
 124 CHAPTER 8 ASSESSMENT OF COASTAL VULNERABILITY INDEX 8.1 INTRODUCTION In order to assess the vulnerability of the shoreline considered under this study against the changing environmental conditions,
In order to better manage coastline hazards, it is necessary to first understand the various processes that cause them. The waves, water levels and
 In 2015 Council worked with coastal engineering consultants to complete a detailed analysis of coastal processes and the risks from coastal hazards along the coastal zone of the Shire. This study looked
Inlet Management Study for Pass-A-Grille and Bunces Pass, Pinellas County, Florida
 Inlet Management Study for Pass-A-Grille and Bunces Pass, Pinellas County, Florida Final Report Submitted By Ping Wang, Ph.D., Jun Cheng Ph.D., Zachary Westfall, and Mathieu Vallee Coastal Research Laboratory
City of Del Mar Local Coastal Plan (LCP) Amendment for Sea Level Rise and Coastal Flooding
 Amendment for Sea Level Rise and Coastal Flooding") City of Del Mar Local Coastal Plan (LCP) Amendment for Sea Level Rise and Coastal Flooding 6/22/17 Presentation to Sea Level Rise Stakeholder- Technical Advisory Committee (STAC) Nick Garrity, P.E. Lindsey
City of Del Mar Local Coastal Plan (LCP) Amendment for Sea Level Rise and Coastal Flooding 6/22/17 Presentation to Sea Level Rise Stakeholder- Technical Advisory Committee (STAC) Nick Garrity, P.E. Lindsey
Technical Brief - Wave Uprush Analysis Island Harbour Club, Gananoque, Ontario
 Technical Brief - Wave Uprush Analysis RIGGS ENGINEERING LTD. 1240 Commissioners Road West Suite 205 London, Ontario N6K 1C7 October 31, 2014 Table of Contents Section Page Table of Contents... i List
Volume and Shoreline Changes along Pinellas County Beaches during Tropical Storm Debby
 Volume and Shoreline Changes along Pinellas County Beaches during Tropical Storm Debby Ping Wang and Tiffany M. Roberts Coastal Research Laboratory University of South Florida July 24, 2012 Introduction
Coastal Inundation. An Overview for TCDC
 Coastal Inundation An Overview for TCDC Rick Liefting Team Leader Regional Hazards and Environmental Compliance Integrated Catchment Management Waikato Regional Council Photo: Sugar Loaf Wharf, Coromandel.
Door County, WI Coastal Hazard Analysis Flood Risk Review Meeting. August 21, 2017
 Door County, WI Coastal Hazard Analysis Flood Risk Review Meeting August 21, 2017 Agenda Introductions Coastal Flood Risk Study and Mapping Program Current Status Technical Overview of Study and Mapping
St. Louis County, MN Coastal Hazard Analysis Flood Risk Review Meeting. May 2, 2018
 St. Louis County, MN Coastal Hazard Analysis Flood Risk Review Meeting May 2, 2018 Agenda Introductions Coastal Flood Risk Study and Mapping Program Current Status Technical Overview of Study and Mapping
Bay County, MI Coastal Hazard Analysis Flood Risk Review Meeting. May 14, 2018
 Bay County, MI Coastal Hazard Analysis Flood Risk Review Meeting May 14, 2018 Agenda Introductions Coastal Flood Risk Study and Mapping Program Current Status Technical Overview of Study and Mapping Floodplain
NORTHERN CELL OPTIONS SHORTLIST RECOMMENDATIONS
 OPTIONS SHORTLIST RECOMMENDATIONS Coastal Unit C: Bayview Options recommended for MCDA scoring. Status quo. Planting 3. Renourishment (gravel) 6. Beach-scraping 7. Restore shingle crest. Inundation accommodation
FOR INFORMATION ONLY. Gold Coast Seaway Channel Scour and Rock Wall Stability Investigation. R.B doc December 2011
 A part of BMT in Energy and Environment Gold Coast Seaway Channel Scour and Rock Wall Stability Investigation R.B18625.001.00.doc December 2011 Gold Coast Seaway Channel Scour and Rock Wall Stability Investigation
New Jersey Coastal Zone Overview. The New Jersey Beach Profile Network (NJBPN) 3 Dimensional Assessments. Quantifying Shoreline Migration
 3 Dimensional Assessments. Quantifying Shoreline Migration") New Jersey Coastal Zone Overview The New Jersey Beach Profile Network (NJBPN) Objectives Profile Locations Data Collection Analyzing NJBPN Data Examples 3 Dimensional Assessments Methodology Examples Quantifying
New Jersey Coastal Zone Overview The New Jersey Beach Profile Network (NJBPN) Objectives Profile Locations Data Collection Analyzing NJBPN Data Examples 3 Dimensional Assessments Methodology Examples Quantifying
SHOREHAM BEACH LOCAL NATURE RESERVE
 SHOREHAM BEACH LOCAL NATURE RESERVE Coastal Geography Education Programme 2014-15 S. Savage 2014 COASTAL GEOGRAPHY OPPORTUNITIES Shoreham Beach Shoreham Beach is a shingle spit formed over many centuries
Bayfield & Ashland Counties, WI Coastal Hazard Analysis Flood Risk Review Meeting. June 05, 2018
 Bayfield & Ashland Counties, WI Coastal Hazard Analysis Flood Risk Review Meeting June 05, 2018 Agenda Introductions Coastal Flood Risk Study and Mapping Program Current Status Technical Overview of Study
Technical Brief - Wave Uprush Analysis 129 South Street, Gananoque
 Technical Brief - Wave Uprush Analysis 129 South Street, Gananoque RIGGS ENGINEERING LTD. 1240 Commissioners Road West Suite 205 London, Ontario N6K 1C7 June 12, 2013 Table of Contents Section Page Table
Future Condi,ons coastal hazard modeling and mapping
 Future Condi,ons coastal hazard modeling and mapping Presented by Bob Ba:alio, PE Environmental Science Associates, Inc. (ESA) On behalf of the physical processes team (USGS, TerraCosta- Scripps, ESA)
Water Research Laboratory (WRL), School of Civil and Environmental Engineering, UNSW Australia, Manly Vale, NSW 2
, School of Civil and Environmental Engineering, UNSW Australia, Manly Vale, NSW 2") Wave Forces and Overtopping on Stepped Seawalls B Modra, I Coghlan, J Carley, G Blumberg 2, W Boyd 3 Water Research Laboratory (WRL), School of Civil and Environmental Engineering, UNSW Australia, Manly
Wave Forces and Overtopping on Stepped Seawalls B Modra, I Coghlan, J Carley, G Blumberg 2, W Boyd 3 Water Research Laboratory (WRL), School of Civil and Environmental Engineering, UNSW Australia, Manly
To: William Woods, Jenni Austin Job No: CentrePort Harbour Deepening Project - Comments on community queries
 Memo To: William Woods, Jenni Austin From: Richard Reinen-Hamill Date: Subject: cc: 1 Purpose This memo sets out our response to issues raised at and after Seatoun community consultation sessions held
INTRODUCTION TO COASTAL ENGINEERING
 The University of the West Indies Organization of American States PROFESSIONAL DEVELOPMENT PROGRAMME: COASTAL INFRASTRUCTURE DESIGN, CONSTRUCTION AND MAINTENANCE A COURSE IN COASTAL DEFENSE SYSTEMS I CHAPTER
NCCOE EA Coastal Adaptation Guidelines. Section I Emerging Technology Novel Alternative Approaches to Coastal Erosion
 NCCOE EA Coastal Adaptation Guidelines Section I Emerging Technology Novel Alternative Approaches to Coastal Erosion Alessio Mariani, Doug Lord, Tony Webb James Carley, Matt Blacka, Brett Miller Ian Turner,
Evaluation of June 9, 2014 Federal Emergency Management Agency Flood Insurance Study for Town of Weymouth, Norfolk, Co, MA
 Evaluation of June 9, 2014 Federal Emergency Management Agency Flood Insurance Study for Town of Weymouth, Norfolk, Co, MA Prepared For: Woodard & Curran 95 Cedar Street, Suite 100 Providence, RI 02903
Q1. What are the primary causes/contributors to coastal erosion at Westshore and the concept of longshore / littoral drift.
 Q1. What are the primary causes/contributors to coastal erosion at Westshore and the concept of longshore / littoral drift. In order of (timing related) contribution to present problem 1. Beach is too
COUPLED MANAGEMENT STRATEGY LAKE CATHIE ESTUARY & COAST
 Lake Cathie Progress Association Inc. ABN 28 251 433 854 P.O. Box 247 Lake Cathie NSW 2445 PHONE/FAX: 02 6584 8211 EMAIL: r3packag@bigpond.com 20 th October 2009 Port Macquarie Hastings Council PO Box
The Impact on Great South Bay of the Breach at Old Inlet Charles N. Flagg School of Marine and Atmospheric Sciences, Stony Brook University
 The Impact on Great South Bay of the Breach at Old Inlet Charles N. Flagg School of Marine and Atmospheric Sciences, Stony Brook University The previous report provided a detailed look at the conditions
PUBLIC EXHIBITION OF COASTAL ZONE MANAGEMENT PLAN FOR COLLAROY-NARRABEEN BEACH AND FISHERMANS BEACH
 ITEM 8.3 REPORTING MANAGER TRIM FILE REF 2014/110936 ATTACHMENTS PUBLIC EXHIBITION OF COASTAL ZONE MANAGEMENT PLAN FOR COLLAROY-NARRABEEN BEACH AND FISHERMANS BEACH GROUP MANAGER NATURAL ENVIRONMENT 1
EXISTING AND PLANNED STRATEGIES AND ACTIONS CONNECTED WITH COASTAL PROTECTION IN ASPECT OF PREDICTED SEA LEVEL RISE
 EXISTING AND PLANNED STRATEGIES AND ACTIONS CONNECTED WITH COASTAL PROTECTION IN ASPECT OF PREDICTED SEA LEVEL RISE Andrzej Cieślak Long term coastal protection strategy In 2000 a new 1 Polish long term
Baraga County, MI Coastal Hazard Analysis Flood Risk Review Meeting. July 12, 2018
 Baraga County, MI Coastal Hazard Analysis Flood Risk Review Meeting July 12, 2018 Agenda Introductions Coastal Flood Risk Study and Mapping Program Current Status Technical Overview of Study and Mapping
ALTERNATIVES FOR COASTAL STORM DAMAGE MITIGATION
 ALTERNATIVES FOR COASTAL STORM DAMAGE MITIGATION Dave Basco Old Dominion University, Norfolk, Virginia, USA National Park Service Photo STRUCTURAL (changes to natural, physical system) hardening (seawalls,
Climate Change Risks for Victoria s Surf Coast
 Climate Change Risks for Victoria s Surf Coast Craig A, Clifton 1, Dan Ware 1, Simon Coverdale 2 and Chloe Hanson-Boyd 1 1 Sinclair Knight Merz, Melbourne, AUSTRALIA. email: cclifton@globalskm.com 2 Great
# Post Consultation and Submissions Resource Consent Conditions for Surfing Impact Mitigation August 2016
 # Post Consultation and Submissions Resource Consent Conditions for Surfing Impact Mitigation August 2016 Surf Mitigation Management Plan 1 1 Not less than 6 months prior to the commencement of the construction
EVALUATION OF BEACH EROSION UP-DRIFT OF TIDAL INLETS IN SOUTHWEST AND CENTRAL FLORIDA, USA. Mohamed A. Dabees 1 and Brett D.
 EVALUATION OF BEACH EROSION UP-DRIFT OF TIDAL INLETS IN SOUTHWEST AND CENTRAL FLORIDA, USA Mohamed A. Dabees 1 and Brett D. Moore 1 The paper discusses the analysis of up-drift beach erosion near selected
THE HYDRAULIC AND MORPHOLOGICAL RESPONSE OF A LARGE COASTAL LAKE TO RISING SEA LEVELS
 THE HYDRAULIC AND MORPHOLOGICAL RESPONSE OF A LARGE COASTAL LAKE TO RISING SEA LEVELS Mr Evan K Watterson 1 Dr Joanna M Burston 1 Ms Heather Stevens 2 Mr Dan J Messiter 1 1 Author affiliation: WorleyParsons
CALCASIEU SALINITY STRUCTURES. HYDRODYNAMIC MODELING (To Support Design of Salinity Barriers)
") CALCASIEU SALINITY STRUCTURES HYDRODYNAMIC MODELING (To Support Design of Salinity Barriers) Presentation Overview 1 2 3 4 5 Project Overview and CEA Circulation Modeling Vessel Hydrodynamics Modeling
CALCASIEU SALINITY STRUCTURES HYDRODYNAMIC MODELING (To Support Design of Salinity Barriers) Presentation Overview 1 2 3 4 5 Project Overview and CEA Circulation Modeling Vessel Hydrodynamics Modeling
A Coastal Storm Modeling System for determination of flood hazards along a high energy coast in response to SLR and 21 st century storms
 Li Erikson, Patrick Barnard, Andrea O Neill, Jodi Eshleman, Amy Foxgrover, Michael Fitzgibbon 2, Grant Ballard 2, Kelly Higgason 3 A Coastal Storm Modeling System for determination of flood hazards along
INVESTIGATING STRATEGIES TO REPAIR HISTORIC TIDE WALLS ON THE CLARENCE RIVER AND ADJACENT BEACH AND RIVER BANK PROTECTION
 INVESTIGATING STRATEGIES TO REPAIR HISTORIC TIDE WALLS ON THE CLARENCE RIVER AND ADJACENT BEACH AND RIVER BANK PROTECTION I Jayewardene 1, A Hartley 2, B Blumberg 1, E Couriel 1 1 NSW Water Solutions,
Figure 4, Photo mosaic taken on February 14 about an hour before sunset near low tide.
 The Impact on Great South Bay of the Breach at Old Inlet Charles N. Flagg and Roger Flood School of Marine and Atmospheric Sciences, Stony Brook University Since the last report was issued on January 31
MONITORING SEDIMENT TRANSPORT PROCESSES AT MANAVGAT RIVER MOUTH, ANTALYA TURKEY
 COPEDEC VI, 2003 in Colombo, Sri Lanka MONITORING SEDIMENT TRANSPORT PROCESSES AT MANAVGAT RIVER MOUTH, ANTALYA TURKEY Isikhan GULER 1, Aysen ERGIN 2, Ahmet Cevdet YALCINER 3 ABSTRACT Manavgat River, where
ALTERNATIVES FOR COASTAL STORM DAMAGE MITIGATION AND FUNCTIONAL DESIGN OF COASTAL STRUCTURES
 The University of the West Indies Organization of American States PROFESSIONAL DEVELOPMENT PROGRAMME: COASTAL INFRASTRUCTURE DESIGN, CONSTRUCTION AND MAINTENANCE A COURSE IN COASTAL DEFENSE SYSTEMS I CHAPTER
CROSS-SHORE SEDIMENT PROCESSES
 The University of the West Indies Organization of American States PROFESSIONAL DEVELOPMENT PROGRAMME: COASTAL INFRASTRUCTURE DESIGN, CONSTRUCTION AND MAINTENANCE A COURSE IN COASTAL DEFENSE SYSTEMS I CHAPTER
Feasibility Study for Restoration of Titlow Lagoon Fish Passage. South Puget Sound Salmon Enhancement Group
 Feasibility Study for Restoration of Titlow Lagoon Fish Passage South Puget Sound Salmon Enhancement Group January 2010 Feasibility Study for Restoration of Titlow Lagoon Fish Passage Prepared for South
Appendix E Cat Island Borrow Area Analysis
 Appendix E Cat Island Borrow Area Analysis ERDC/CHL Letter Report 1 Cat Island Borrow Area Analysis Multiple borrow area configurations were considered for Cat Island restoration. Borrow area CI1 is located
Town of Duck, North Carolina
 Tracking No. 00.00.2010 Erosion Mitigation And Shoreline Management Feasibility Study Town of Duck, North Carolina Coastal Planning & Engineering of North Carolina August 15, 2012 Tom Jarrett Robert Neal
COFFS HARBOUR SEDIMENT MODELLING AND INVESTIGATION
 COFFS HARBOUR SEDIMENT MODELLING AND INVESTIGATION Luke McAvoy Undergraduate Engineer (Civil) Griffith School of Engineering, Griffith University, Gold Coast, Australia Daniel Rodger Senior Engineer Water
Bob Battalio, PE Chief Engineer, ESA September 8, 2016
 RELATING FUTURE COASTAL CONDITIONS TO EXISTING FEMA FLOOD HAZARD MAPS Technical Methods Manual Bob Battalio, PE Chief Engineer, ESA September 8, 2016 FMA 2016 Sacramento, California DWR-OST-SIO PILOTING
COASTAL ENVIRONMENTS. 454 lecture 12
 COASTAL ENVIRONMENTS Repeated movement of sediment & water constructs a beach profile reflecting the balance between average daily or seasonal wave forces and resistance of landmass to wave action Coasts
SURGE SUPPRESSION ACHIEVED BY DIFFERENT COASTAL SPINE (IKE DIKE) ALIGNMENTS. Bruce A. Ebersole, Thomas W. Richardson and Robert W.
 ALIGNMENTS. Bruce A. Ebersole, Thomas W. Richardson and Robert W.") SURGE SUPPRESSION ACHIEVED BY DIFFERENT COASTAL SPINE (IKE DIKE) ALIGNMENTS Abstract Bruce A. Ebersole, Thomas W. Richardson and Robert W. Whalin, Jackson State University, Jackson, Mississippi The primary
SURGE SUPPRESSION ACHIEVED BY DIFFERENT COASTAL SPINE (IKE DIKE) ALIGNMENTS Abstract Bruce A. Ebersole, Thomas W. Richardson and Robert W. Whalin, Jackson State University, Jackson, Mississippi The primary
Marine Renewables Industry Association. Marine Renewables Industry: Requirements for Oceanographic Measurements, Data Processing and Modelling
 Marine Renewables Industry Association Marine Renewables Industry: Requirements for Oceanographic Measurements, Data Processing and Modelling October 2009 Table of Contents 1. Introduction... 1 2. Measurements
Taranaki Tsunami Inundation Analysis. Prepared for Taranaki Civil Defence Emergency Management Group. Final Version
 Taranaki Tsunami Inundation Analysis Prepared for Taranaki Civil Defence Emergency Management Group Final Version June 2012 AM 12/07 HBRC Plan Number 4362 Asset Management Group Technical Report Prepared
Building Coastal Resiliency at Plymouth Long Beach
 Building Coastal Resiliency at Plymouth Long Beach Department of Marine and Environmental Affairs March 30, 2017 Introducing Green Infrastructure for Coastal Resiliency Plymouth Long Beach & Warren s Cove
MODELLING THE SHORELINE IMPACTS OF RICHMOND RIVER TRAINING WALLS
 MODELLING THE SHORELINE IMPACTS OF RICHMOND RIVER TRAINING WALLS D Patterson 1 1 BMT WBM / University Of Qld, Brisbane, QLD Introduction The construction of river entrance training walls is generally aimed
Shoreline Response to an Offshore Wave Screen, Blairgowrie Safe Boat Harbour, Victoria, Australia
 Shoreline Response to an Offshore Wave Screen, Blairgowrie Safe Boat Harbour, Victoria, Australia T.R. Atkins and R. Mocke Maritime Group, Sinclair Knight Merz, P.O. Box H615, Perth 6001, Australia ABSTRACT
Mouth of the Columbia River Jetties Three-Phase Construction Plan
 Mouth of the Columbia River Jetties Three-Phase Construction Plan Project Overview October 9, 2012 US Army Corps of Engineers MCR Jetties Major Rehabilitation Sand Island pile dikes 1930-1935 Columbia
Beach Profiles. Topics. Module 9b Beach Profiles and Crossshore Sediment Transport 3/23/2016. CE A676 Coastal Engineering
 Beach Profiles AND CROSS-SHORE TRANSPORT Orson P. Smith, PE, Ph.D., Professor Emeritus Topics Features of beach and nearshore profiles Equilibrium profiles Cross-shore transport References Text (Sorensen)
Update: UNSW s Research Program for Extreme Waves on Fringing Reefs. Matt Blacka,Kristen Splinter, Ron Cox
 Update: UNSW s Research Program for Extreme Waves on Fringing Reefs Matt Blacka,Kristen Splinter, Ron Cox Overview Research Area 1: Extreme wave and water level processes for fringing reef coastlines Research
Environmental Protection on the Gold Coast of Queensland, Australia. 1. What is the appeal of the Gold Coast to tourists?
 Environmental Protection on the Gold Coast of Queensland, Australia Sections 1. What is the appeal of the Gold Coast to tourists? 2. How are Gold Coast visitor trends changing? 3. How can the impacts of
What are we adapting to? David Provis Senior Principal, Oceanography, Cardno Member, Victorian Coastal Council
 What are we adapting to? David Provis Senior Principal, Oceanography, Cardno Member, Victorian Coastal Council Sea-level -NOAA Sea-level - NOAA 90% probability ranges Sea-level - NOAA Sea-level Port Phillip
BILLY BISHOP TORONTO CITY AIRPORT PRELIMINARY RUNWAY DESIGN COASTAL ENGINEERING STUDY
 Bâtiment Infrastructures municipales Transport Industriel Énergie Environnement BILLY BISHOP TORONTO CITY AIRPORT PRELIMINARY RUNWAY DESIGN COASTAL ENGINEERING STUDY N. Guillemette 1, C. Glodowski 1, P.
SUPPLEMENTAL DOCUMENT SEA LEVEL RISE SCENARIO SELECTION AND DESIGN TIDE CALCULATION
 SUPPLEMENTAL DOCUMENT SEA LEVEL RISE SCENARIO SELECTION AND DESIGN TIDE CALCULATION FOR THE GUIDANCE FOR INCORPORATING SEA LEVEL RISE INTO CAPITAL PLANNING IN SAN FRANCISCO: ASSESSING VULNERABILITY AND
Julebæk Strand. Effect full beach nourishment
 Julebæk Strand Effect full beach nourishment Aim of Study This study is a part of the COADAPT funding and the aim of the study is to analyze the effect of beach nourishment. In order to investigate the
Implications of proposed Whanganui Port and lower Whanganui River dredging
 PO Box 637 Wanganui 4540 Attention: Rowan McGregor Dear Rowan 1 Summary We understand that it has been proposed to bring large vessels into the Port at Whanganui requiring the excavation of a channel up
UPPER BEACH REPLENISHMENT PROJECT RELATED
 ASSESSMENT OF SAND VOLUME LOSS at the TOWNSHIP of UPPER BEACH REPLENISHMENT PROJECT RELATED to the LANDFALL OF HURRICANE SANDY - PURSUANT TO NJ-DR 4086 This assessment is in response to Hurricane Sandy
INTRODUCTION TO COASTAL ENGINEERING AND MANAGEMENT
 Advanced Series on Ocean Engineering Volume 16 INTRODUCTION TO COASTAL ENGINEERING AND MANAGEMENT J. William Kamphuis Queen's University, Canada World Scientific Singapore New Jersey London Hong Kong Contents
The Islands. Barbados. A prefeasibility study. R. Drieman M. Hinborch M. Monden E.A.J. Vendrik
 The Islands Barbados A prefeasibility study R. Drieman M. Hinborch M. Monden E.A.J. Vendrik General notice to the reader: In the academic programme for Hydraulic Engineering we have in the 4th year (i.e.
Climate Change Impacts to KSC Launch Complex
 Climate Change Impacts to KSC Launch Complex Presented to: 2010 International Workshop on Environment and Energy By: John Shaffer NASA Environmental Management Branch Kennedy Space Center Hurricane Season
Photo by: Darryl Hatheway, 2011
 Photo by: Darryl Hatheway, 2011 September 11, 2015 Presentation Discussion Examine PFD V-Zone Mapping in Wave Runup Dominated West Coast Application of PFD V-Zone Mapping Criteria in Pacific G&S PFD V-Zone
Available online at ScienceDirect. Procedia Engineering 116 (2015 )
") Available online at www.sciencedirect.com ScienceDirect Procedia Engineering 116 (2015 ) 320 325 8th International Conference on Asian and Pacific Coasts (APAC 2015) Department of Ocean Engineering, IIT
Available online at www.sciencedirect.com ScienceDirect Procedia Engineering 116 (2015 ) 320 325 8th International Conference on Asian and Pacific Coasts (APAC 2015) Department of Ocean Engineering, IIT
Open Pacific Coast Study. California Coastal Analysis and Mapping Project
 Open Pacific Coast Study California Coastal Analysis and Mapping Project September 2012 California Open Coast Counties California Coastal Analysis and Mapping Project This publication is an initiative
Low-crested offshore breakwaters: a functional tool for beach management
 Environmental Problems in Coastal Regions VI 237 Low-crested offshore breakwaters: a functional tool for beach management K. Spyropoulos & E. Andrianis TRITON Consulting Engineers, Greece Abstract Beach
Currents measurements in the coast of Montevideo, Uruguay
 Currents measurements in the coast of Montevideo, Uruguay M. Fossati, D. Bellón, E. Lorenzo & I. Piedra-Cueva Fluid Mechanics and Environmental Engineering Institute (IMFIA), School of Engineering, Research
MODELLING COASTAL PROCESSES AND HAZARDS TO ASSESS SEA LEVEL RISE IMPACTS FOR INTEGRATION INTO A PLANNING SCHEME
 MODELLING COASTAL PROCESSES AND HAZARDS TO ASSESS SEA LEVEL RISE IMPACTS FOR INTEGRATION INTO A PLANNING SCHEME James Carley, Senior Coastal Engineer, Water Research Laboratory, School of Civil and Environmental
MODELING OF CLIMATE CHANGE IMPACTS ON COASTAL STRUCTURES - CONTRIBUTION TO THEIR RE-DESIGN
 Proceedings of the 14 th International Conference on Environmental Science and Technology Rhodes, Greece, 3-5 September 2015 MODELING OF CLIMATE CHANGE IMPACTS ON COASTAL STRUCTURES - CONTRIBUTION TO THEIR
LAKKOPETRA (GREECE) EUROSION Case Study. Contact: Kyriakos SPYROPOULOS. TRITON Consulting Engineers. 90 Pratinou Str Athens (GREECE)
 EUROSION Case Study. Contact: Kyriakos SPYROPOULOS. TRITON Consulting Engineers. 90 Pratinou Str Athens (GREECE)") LAKKOPETRA (GREECE) Contact: Kyriakos SPYROPOULOS TRITON Consulting Engineers 90 Pratinou Str. 11634 Athens (GREECE) Tel: +32 10 729 57 61 Fax: +32 10 724 33 58 e-mail: kspyropoulos@tritonsa.gr 19 1 1.
LAKKOPETRA (GREECE) Contact: Kyriakos SPYROPOULOS TRITON Consulting Engineers 90 Pratinou Str. 11634 Athens (GREECE) Tel: +32 10 729 57 61 Fax: +32 10 724 33 58 e-mail: kspyropoulos@tritonsa.gr 19 1 1.
Shorelines Earth - Chapter 20 Stan Hatfield Southwestern Illinois College
 Shorelines Earth - Chapter 20 Stan Hatfield Southwestern Illinois College The Shoreline A Dynamic Interface The shoreline is a dynamic interface (common boundary) among air, land, and the ocean. The shoreline
Llandudno Beach Management Plan and Options Appraisal
 Llandudno Beach Management Plan and Options Appraisal August, 2017 G.B. Edwards BEng (Hons) CEng FICE Head of, Mochdre Offices, Conway Road, Mochdre, Colwyn Bay, LL28 5AB. Tel. (01492) 574000 Fax. (01492)
DUNE STABILIZATION AND BEACH EROSION
 DUNE STABILIZATION AND BEACH EROSION CAPE HATTERAS NATIONAL SEASHORE NORTH CAROLINA ROBERT DOLAN PAUL GODFREY U. S. DEPARTMENT OF INTERIOR NATIONAL PARK SERVICE OFFICE OF NATURAL SCIENCE WASHINGTON, D.
FEMA Region V. Great Lakes Coastal Flood Study. Pilot Study Webinar. Berrien County, Michigan. February 26, 2014
 FEMA Region V Great Lakes Coastal Flood Study Pilot Study Webinar Berrien County, Michigan February 26, 2014 2 Pilot Study Webinar Agenda Great Lakes Coastal Flood Study Background Demonstration Project
Hydrodynamic and hydrological modelling to support the operation and design of sea ports
 Hydrodynamic and hydrological modelling to support the operation and design of sea ports Data needs and examples Martijn de Jong (port/nautical requirements, waves, currents) Sofia Caires (mean and extreme
DUXBURY WAVE MODELING STUDY
 DUXBURY WAVE MODELING STUDY 2008 Status Report Duncan M. FitzGerald Peter S. Rosen Boston University Northeaster University Boston, MA 02215 Boston, MA 02115 Submitted to: DUXBURY BEACH RESERVATION November
OECS Regional Engineering Workshop September 29 October 3, 2014
 B E A C H E S. M A R I N A S. D E S I G N. C O N S T R U C T I O N. OECS Regional Engineering Workshop September 29 October 3, 2014 Coastal Erosion and Sea Defense: Introduction to Coastal Dynamics David
VENICE LOCAL COASTAL PROGRAM UPDATE: COASTAL HAZARDS WELCOME
 VENICE LOCAL COASTAL PROGRAM UPDATE: COASTAL HAZARDS WELCOME 1 Introducing the Team Hosted by the Department of City Planning and grant funded in part by the California Coastal Commission 2 Workshop Purpose
LOCALLY CONCENTRATED SEVERE BEACH EROSION ON SEISHO COAST CAUSED BY TYPHOON T0709
 F-4 Fourth International Conference on Scour and Erosion 2008 LOCALLY CONCENTRATED SEVERE BEACH EROSION ON SEISHO COAST CAUSED BY TYPHOON T0709 Yoshimitsu TAJIMA 1 and Shinji SATO 2 1 Member of JSCE, Associate
APPENDIX C. Fluvial and Tidal Hydraulics Report
 APPENDIX C Fluvial and Tidal Hydraulics Report BUENA VISTA LAGOON ENHANCEMENT PROJECT FLUVIAL AND TIDAL HYDRAULICS ANALYSES Prepared for: SANDAG 401 B Street, Suite 800 San Diego, California 92101 Contact:
Boothbay Harbor Rotary Club May 12, 2016
 Mapping Potential Sea Level Rise and Storm Surge in Boothbay Harbor, ME Boothbay Harbor Rotary Club May 12, 2016 Peter A. Slovinsky, Marine Geologist Maine Geological Survey S.M. Dickson, MGS Quickly,
BELLARINE PENINSULA - CORIO BAY LOCAL COASTAL HAZARD ASSESSMENT INUNDATION SUMMARY REPORT
 BELLARINE PENINSULA - CORIO BAY LOCAL COASTAL HAZARD ASSESSMENT INUNDATION SUMMARY REPORT Acknowledgements A partnership between the relevant organisations from the study area was formed as part of this
TITLE: The Importance of Model Validation: Two Case Studies. AUTHOR:Julie Thomas. Scripps Institution of Oceanography, La Jolla, CA.
 TITLE: The Importance of Model Validation: Two Case Studies AUTHOR:Julie Thomas Scripps Institution of Oceanography, La Jolla, CA jothomas@ucsd.edu CO-AUTHOR: Corey Olfe Scripps Institution of Oceanography,
Exemplar for Internal Assessment Resource Geography Level 3. Resource title: The Coastal Environment Kaikoura
 Exemplar for internal assessment resource Geography 3.5A for Achievement Standard 91430 Exemplar for Internal Assessment Resource Geography Level 3 Resource title: The Coastal Environment Kaikoura This
Coastal management has lagged behind the growth in population leading to problems with pollution
 Fifty percent of the population of the industrialized world lives within 100 km of a coast. Coastal management has lagged behind the growth in population leading to problems with pollution and natural