WAVE ENERGY A PRIMER FOR BRITISH COLUMBIA BRYSON ROBERTSON, HELEN BAILEY AND BRADLEY BUCKHAM
|
|
|
- Logan Pearson
- 5 years ago
- Views:
Transcription
1 WAVE ENERGY A PRIMER FOR BRITISH COLUMBIA BRYSON ROBERTSON, HELEN BAILEY AND BRADLEY BUCKHAM 1


2 2


3 3
4 Science writer: Leigh Phillips Infographics and layout: Leigh Phillips and Stephanie Inman PICS Executive Director Sybil Seitzinger PICS Senior Communications Officer Robyn Meyer Photography: Adriana, Vincent Desjardins, Sebastian Herrmann, Bernadette Hubbart, Henrik Berger Jørgensen, Ann and Peter MacDonald, Maciej, J. Triepke, Austin Valley, Artur Vittori, Chris Wells Cover image: Harry Fenn, The Whirlpool (1894) The Pacific Institute for Climate Solutions gratefully acknowledges the generous endowment provided by the Province of British Columbia through the Ministry of Environment in This funding is enabling ongoing independent research aimed at developing innovative climate change solutions, opportunities for adaptation, and steps toward achieving a vibrant low-carbon economy. Phone Fax pics@uvic.ca Web pics.uvic.ca University of Victoria PO Box 1700 STN CSC Victoria, BC V8W 2Y2 4
5 WAVE ENERGY A PRIMER FOR BRITISH COLUMBIA BRYSON ROBERTSON, HELEN BAILEY AND BRADLEY BUCKHAM 5

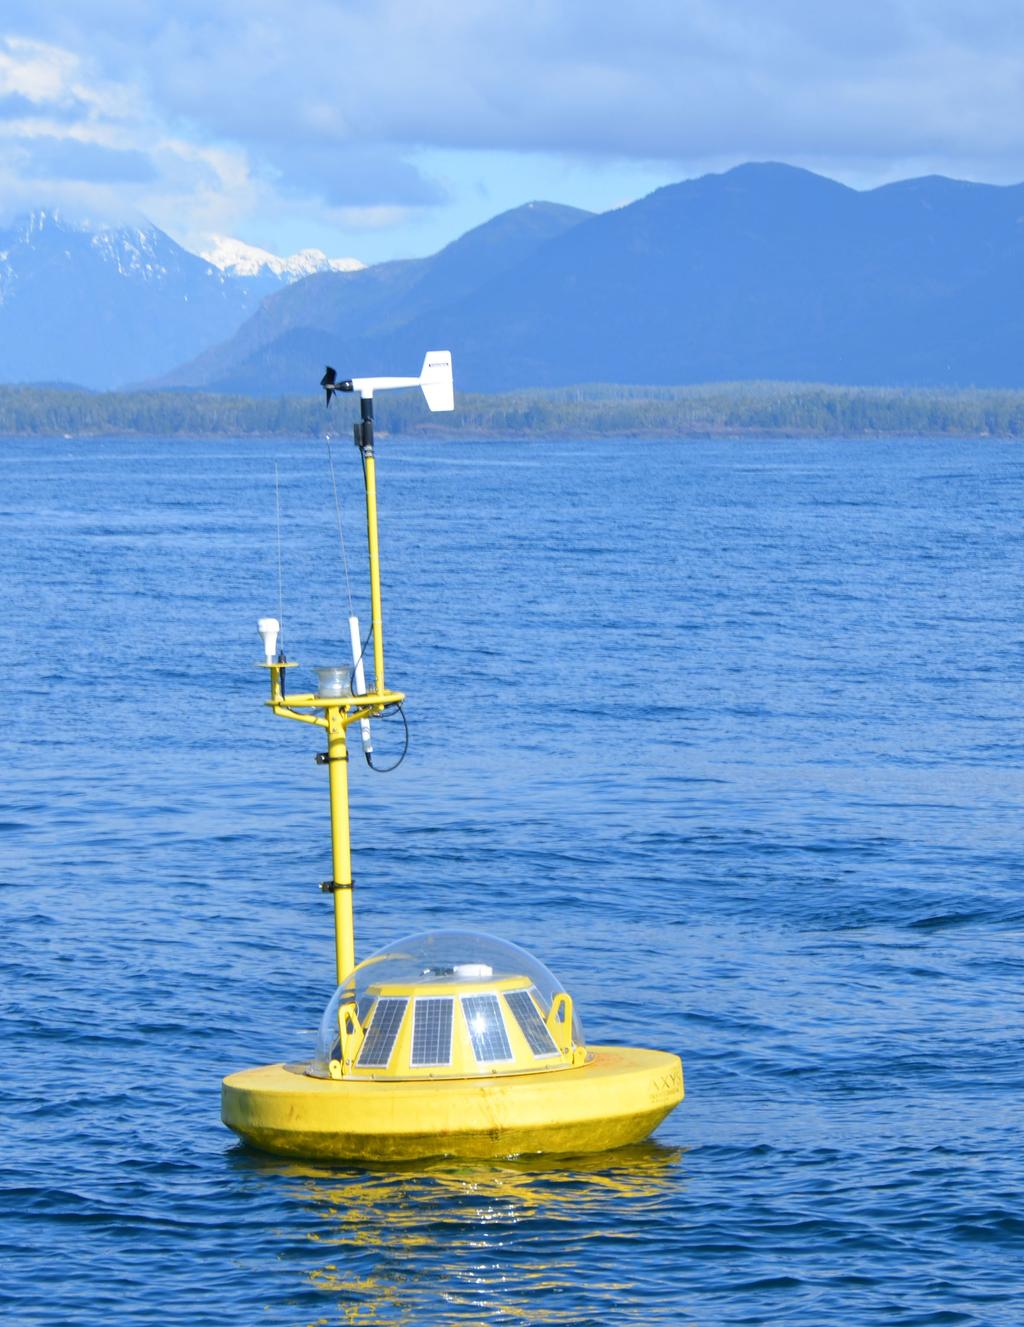
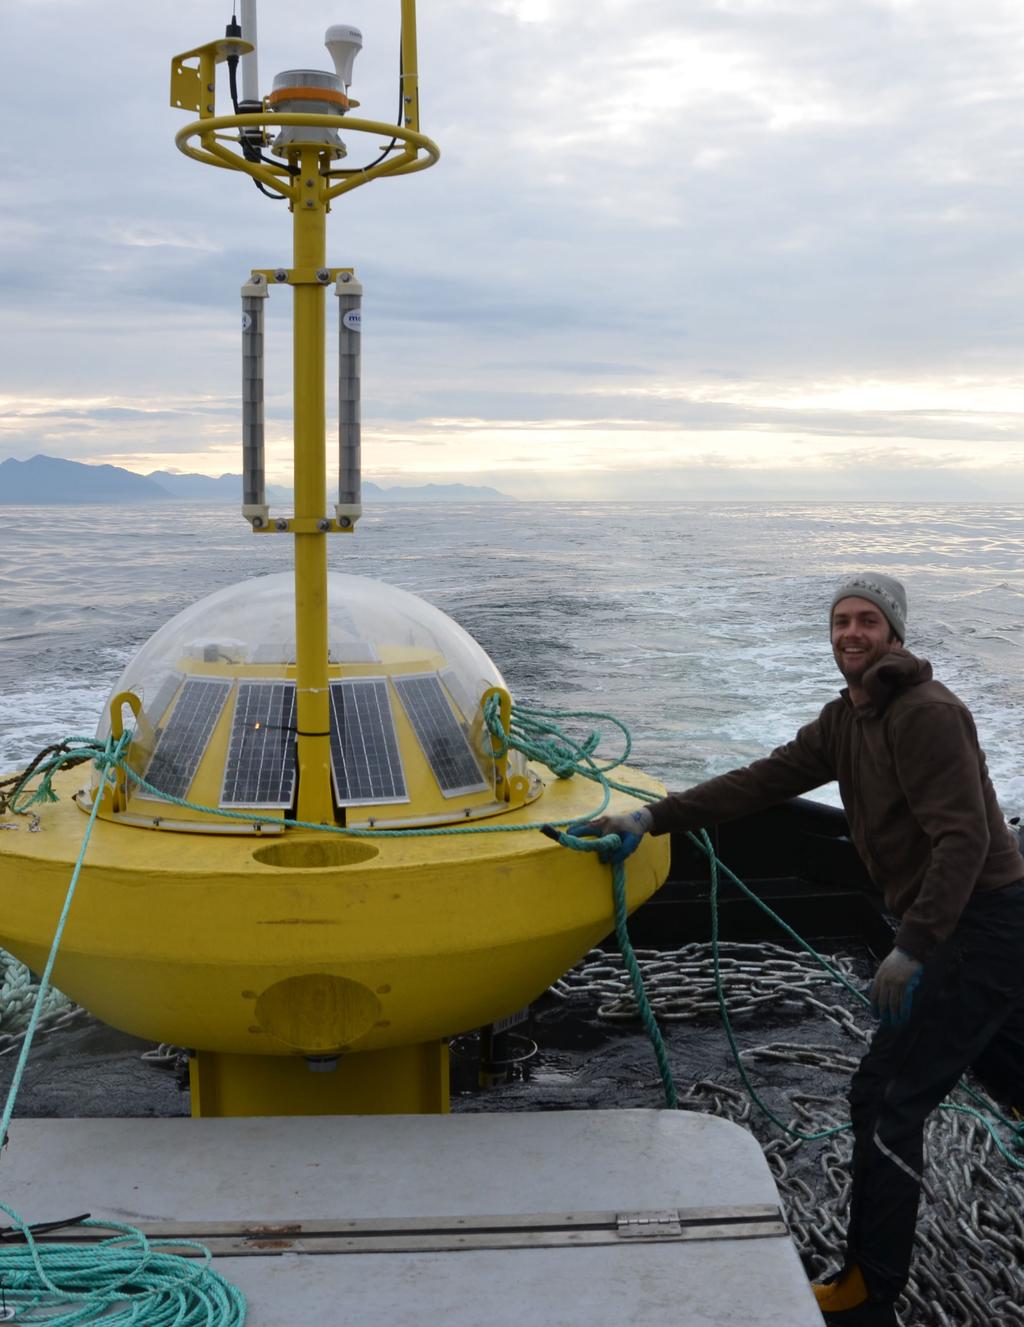
6 Launch of wave measurement buoy off the coast of Vancouver Island 6
7 CONTENTS Message from the executive director of the Pacific Institute for Climate Solutions... 8 Message from the director of the West Coast Wave Initiative... 9 Introduction The competitive advantage: Pacific Canada s wave energy potential...12 The West Coast Wave Initiative Waves & Wave energy converters...14 Converting ocean waves to electricity: A brief history of wave energy research in BC The challenge of quantifying waves...27 Models vs buoys...29 WCWI SWAN model and wave measurement buoys...31 Vancouver Island s gross wave energy resource...34 Digging deeper: Characterising the resource Opportunities and challenges...38 Winter peaking...38 The predictable variable renewable...39 A boon to at-risk communities Operational and financial challenges...42 Conclusion...44 Policy recommendations...45 Endnotes
8 MESSAGE FROM THE EXECUTIVE DIRECTOR OF THE PACIFIC INSTITUTE FOR CLIMATE SOLUTIONS In late 2016, Canada s federal government unveiled its long-term Mid-Century Strategy for climate change, featuring a variety of options on how to achieve deep emissions reductions of 80 percent on 2005 levels by Modelling work appearing in the document suggests that Canada requires a mammoth growth in the generation of non-emitting electricity: somewhere between 113 and 295 percent compared to a reference year of We need this to decarbonise the electricity system and to meet the increase in demand from the electrification of transport, heating and industry. In all seven scenarios considered in the federal strategy, each with different mixes of energy types and levels of energy conservation stringency, the heavy lifting of this growth would be performed by expansion of largescale hydro and nuclear power, both controversial sources of electricity in the public arena. Intermittent sources of clean electricity such as wind and solar would play a role too, but due to their intermittency and the still unresolved challenge of energy storage, dependence on more reliable options, notably largescale hydro and nuclear albeit with much weaker social licence due to some people s concerns over land footprint in the case of the former and safety, and waste in the case of the latter appeared to be the only way to achieve the scale of reductions needed. Because wave and tidal energy are still at the demonstration stage, Ottawa felt it was too early to consider modelling these options. Yet due to our extensive coastline, Canada has some of the most significant wave and tidal potential in the world, with the Atlantic coast particularly rich in tidal resources and the Pacific coast particularly rich in wave resources. Once developed, these two energy sources could play a substantial role in the clean transition, as initial energy systems modelling work in this publication shows. What makes wave energy so attractive is that while it is still intermittent like wind and solar, it is also much more predictable than either of these two, while offering a vast quantity of untapped energy. It lies somewhere between the high variability of wind and solar, and the always on dispatchability of hydro, nuclear, and, of course, fossil fuels. This makes wave energy more reliable and therefore easier to integrate into the electricity grid. This primer on wave energy presents modelling and field research that for the first time allows us to understand in detail the extent of the wave resource available on the Pacific coast, and how feasible it would be to integrate initial amounts of wave energy into the British Columbian grid. The engineering challenges and costs are also described, and these are not insubstantial. The ocean is a tough environment for any human device. However, with the sort of public sector support that wind and solar have received, shepherding innovation from lab bench to market, and with the sharing of experience and expertise from other marine industries, wave energy could potentially follow a similar path of cost reductions. With such backing, wave energy as part of a resilient, all of the above approach to energy choices could potentially play a sizeable role in helping us meet our international climate obligations. Meanwhile British Columbia and Canada, being some of the first movers in this field, would likely benefit from the development of a new industry featuring a suite of technologies that could be sold to the rest of the world. There is no reason why tackling the climate crisis cannot at the same time yield economic opportunities for the province and indeed the country as a whole. Sybil Seitzinger 8
9 MESSAGE FROM THE DIRECTOR OF THE WEST COAST WAVE INITIATIVE For over half a century, generations of British Columbians have established the province as a world leader in the generation of energy from water. We generate up to 98 percent of our power from renewable resources and are fortunate enough to have some of the lowest residential power rates in the world. However, the combined pressures of electrifying our transportation and heating sectors, enhanced greenhouse gas emission reduction policies, and the significant social resistance to large hydro-system reservoirs will ultimately put acute strain on existing BC energy infrastructure. Future generations of BC residents will not be able to rely on single energy resource global clean energy resource diversification is needed, inevitable and to BC s benefit. BC has a true wealth of renewable energy resources, including wave, tidal, wind, riverine, biomass, solar and geothermal. But of all these resources, it can be argued that the province s substantive competitive advantage lies in waves. The sheer magnitude of the wave energy resource impinging on BC s coastline is matched by that of only a few countries around the globe. Much of our knowledge of wave energy potential until now has been broad strokes stuff. But working in collaboration with national and international wave energy technology developers, globally recognised ocean measurement companies and BC-based consultants, the Institute of Integrated Energy Systems and the West Coast Wave Initiative have now built a database of BC wave conditions that is globally unique in its extent and comprehensiveness. Nowhere else does anyone have this level of fine-grained detail. And what this detail tells us is exciting. Across larger time and geographic scales, wave energy is not reliant on local conditions in the way that wind and solar are. Rather, waves arriving on the shores of BC s beaches are the result of storms occurring across the vast Pacific Ocean. Thus these waves represent an extremely predictable, renewable energy supply. At specific locations, when designing a machine to extract usable electricity from the motion of individual waves, the multitude of possible wave heights, frequencies and directions must be accounted for that information is critical to detailed mechanical design. This knowledge has been missing in other jurisdictions. We now have it in hand. Building on these research efforts, BC s significant expertise in generating power from water, and our exposure to the entire expanse of the north Pacific, the development of ocean wave energy is a logical step in the continuing transition toward a cleaner energy system. Wave energy also helps provincial and national efforts to reduce dependence on diesel fueled electricity generation by remote communities. Completing these innovations in our province, there is an opportunity to see made-in-bc technologies exported to coastal jurisdictions worldwide, spurring domestic job growth and accentuating BC s position in the clean energy marketplace worldwide. Vast, predictable and distributed; the wave resources off our coast provide British Columbia a unique opportunity to play a global leadership role in the development of this future industry. Bradley Buckham 9
10 INTRODUCTION Ocean waves offer a tremendous opportunity for nonemitting electricity generation, with significant energy resources just waiting to be tapped particularly off the west coast of North America. Global wave inventories have shown that the British Columbian coastal region is home to one of the most energetic wave climates in the world. While this resource may be much less developed than other renewables, crucially, it is much more predictable than highly variable wind and solar. In addition, due to this greater predictability, the cost of integrating wave energy into a utility scale electrical grid would be lower than these latter two sources. Given that wave energy has all these advantages, why has it not reached same levels of penetration as wind, solar or hydro? Much of the answer comes down to the fact that historically we have only had a rough sense of the scope of the wave energy resource and have lacked sufficient fine-grained understanding of the best locations for deployment. Combined with a lack of knowledge around reliability, costs and grid integration issues, this has resulted in an unquantified value proposition for wave energy development. This primer aims to fill these gaps for Canada and the province of British Columbia. It is intended both as an introduction to wave energy and an exploration of its potential, based on the very latest projections from BC-based energy systems researchers and waveenergy engineering specialists. Overall, this report aims to deliver a frank survey of the opportunities and challenges associated with wave energy that the public and policy-makers need to be familiar with, if the province is to take advantage of this rich resource

11 11

12 1. THE COMPETITIVE ADVANTAGE: PACIFIC CANADA S WAVE POTENTIAL Global wave energy inventories have shown that Canada s west coast possesses one of the most energetic wave climates in the world, with average annual wave energy transports of kw/m occurring at the continental shelf. The International Energy Agency s Ocean Energy Systems organization estimates that the annual global wave resource could provide up to 29,500 TW. To put this in perspective, the total annual energy consumption of all humans around the world in 2012 clocked in at 104,426 TWh. Of the global wave resource, 764 TWh could be generated along the west spatial distribution of the wave resource, especially near-shore, is a critical step in enabling wave energy development. As BC Hydro commented in 2013: Wave energy in some locations off the west coast of Vancouver Island is considered sufficient for wave power systems but information specific to the area is unavailable. For these reasons, wave power was not persued. Wave energy technology developers, project development outfits and government policy makers require detailed spatial and temporal wave resource WAVE ENERGY IN SOME LOCATIONS OFF THE WEST COAST OF VANCOUVER ISLAND IS CONSIDERED SUFFICIENT FOR WAVE POWER SYSTEMS BUT INFORMATION SPECIFIC TO THE AREA IS UNAVAILABLE. FOR THESE REASONS, WAVE POWER WAS NOT PERSUED. BC Hydro in 2013 coast of North America 7 with the coast of British Columbia making up the dominant share, at 324 TWh. If all this energy could be extracted, electricity from ocean waves would be able to deliver about 6x British Columbia s current energy requirements. While the values presented by these global figures are dramatic and convey the magnitude of this untapped carbon neutral resource, these are broadstrokes analyses. They are unable to provide the necessary detail and fine-grained resolution that are required to assess the true opportunity for a future wave-energy industry in British Columbia. Moving beyond the global scale and resolving the information to ensure proposed deployment sites are suitably energetic (but not too destructive) to permit accurate evaluation of wave energy converter (WEC) technology performance. That important work has now been performed by the authors of this report. Through the efforts of the West Coast Wave Initiative, British Columbia now has the sufficient resolution of the resource to provide the necessary building blocks for a future wave-energy conversion industry, and can provide the necessary scientific knowledge to provide an indication of the opportunities and challenges associated with wave power generation in British Columbia. 12
, based out of the Institute of Integrated Energy Systems (IESVic) at the University of Victoria, is developing industry leading wave resource assessment methods")
13 THE WEST COAST WAVE INITIATIVE While commercial wave energy development in BC has more or less stagnated since 2002, the research and development effort has not. The West Coast Wave Initiative (WCWI), based out of the Institute of Integrated Energy Systems (IESVic) at the University of Victoria, is developing industry leading wave resource assessment methods and the necessary fundamental knowledge to drive the wave energy industry forward in the province. WCWI has been in operation since 2008 and is funded by Natural Resources Canada, the Natural Sciences and Engineering Council of Canada, the BC Ministry of Energy and Mines, the Pacific Institute for Climate Solutions (PICS) and a host of international Wave Energy Converter (WEC) technology developers. WCWI aims to determine the feasibility, impacts, and possible structure of future wave energy conversion opportunities in the province and the rest of Canada. This includes developing methods to quantify the temporal and spatial detail of the wave resource, assessing the performance of wave energy converters (WECs) in Canadian waves, and studying the costs and impact of integration of wave energy into electrical grids. This research applies to all scales of development, from remote communities, through to utility scale distribution and transmission systems. 13

14 2. WAVES & WAVE ENERGY CONVERTERS Waves transmit significant quantities of energy across the vast distances in our global oceans with very little attenuation, or loss of energy. The story of waves starts with the differential solar heating of the planet, with some regions absorbing more heat than others. As a result, air moves from cooler, high pressure regions to warmer, low pressure regions; thus creating wind. When this wind blows over stretches of unobstructed ocean (called fetch ), energy is transmitted from the wind to the sea surface - causing waves to be generated. If the wind blows with sufficient speed, over a large enough fetch and for sufficient periods of time, waves will be generated. The longer and harder the wind blows over sufficiently large fetches, the more energy will be transferred from the wind to the waves. As time progresses, this results in larger waves with increasing wave periods (the time between consecutive wave crests). Once waves become fully developed and travel beyond the region where the wind is blowing, they are called swells. Ocean swells are able to propagate across vast distances with negligible energy dissipation or dependence on the wind that generated them. So the waves breaking on the shores of western Canada are not only generated by local winds, but by the cumulative effects of hundreds of storms across millions of square kilometres of Pacific Ocean. It is important to note that waves do not result in the transmission or movement of water, but are actually a transmission of energy passing through water. They could almost be thought of as moving stores of wind energy or solar energy. 14
15 15

16 CONVERTING WAVES TO E A SURVEY OF THE MOST COMMON WAVE ENERGY 16

17 LECTRICITY CONVERTER DESIGNS POWERBUOY POINT ABSORBERS The Carnegie CETO and Ocean Power Technologies PowerBuoy are the most wellknown point absorbers. There exists a wide variety of point absorber designs and power take-off systems currently in development. The current Carnegie CETO system features a slightly submerged, 20 m diameter floating buoy connected to the sea floor by an anchoring system. The relative motion between the sea floor and the float (under the influence of waves) drives a hydraulic cylinder internal to the float and from there to an electricity power pod. An electrical cable from the float transmits power to shore. 17

18 POWERBUOY 18
 jointed by power takeoff hinges.")

19 PELAMIS ATTENUATORS Pelamis is an attenuator type of wave energy converter. The P2 Pelamis device featured four cylindrical sections (120 m in length and 3.5 m in diameter) jointed by power takeoff hinges. Each cylinder section features a self-contained power system, complete with hydraulic rams, smoothing accumulators, and a hydraulic electricity generator. As waves pass under the individual cylindrical sections, they induce relative motion at the hinges between neighbouring sections. For each direction of motion, hydraulic rams resist the waveinduced forces and pump high-pressure oil to a hydraulic motor, which generates electricity. The power from each hinge is combined and transmitted back to shore through a single electrical cable. 19
20 20

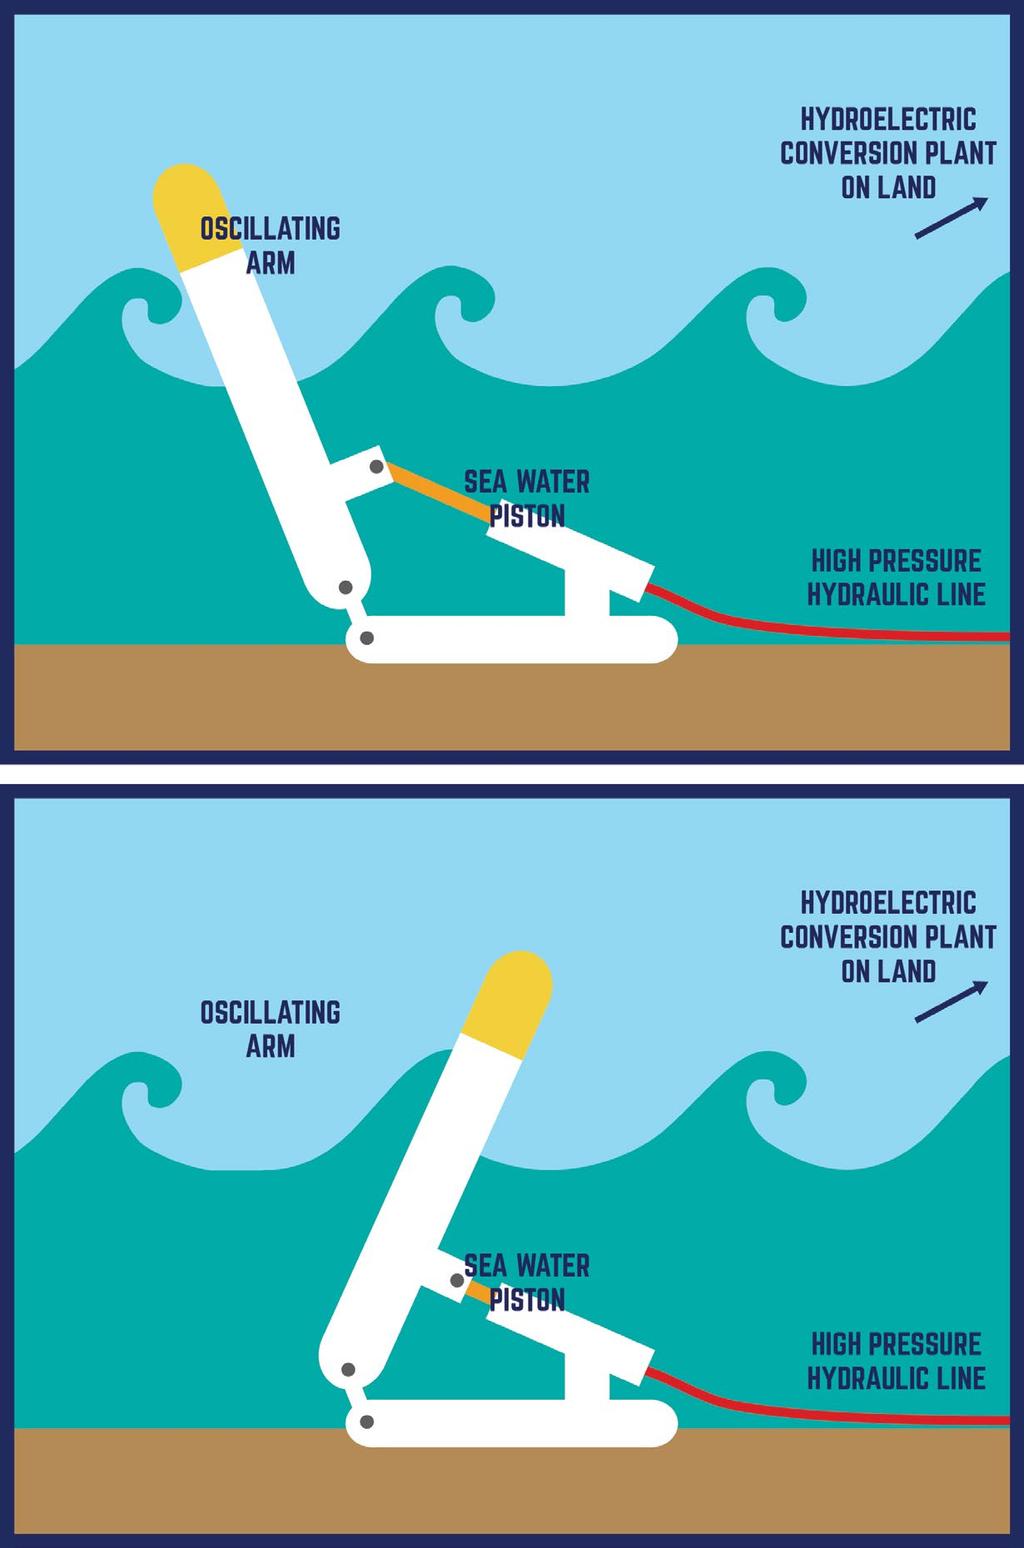
21 OYSTER PITCHING DEVICES Oyster is a seafloor-mounted pitching flap converter. However, the device is just one commercial version of this type of WEC. Others include Resolute Marine Energy and WaveRoller. The current Oyster device is 18 m wide, 14 m high and 4 m thick. Its power take-off involves a series of hydraulic rams operating between a pitching frame and a seafloor mounted frame. As a wave passes over the device, the flap pitches forward, compressing the hydraulic rams and forcing a working fluid (often water) through a high pressure pipeline back to shore. Once ashore, a hydraulic motor converts this fluid potential energy into electricity. 21
22 OYSTER 22


23 WAVE DRAGON OVERTOPPERS Wave Dragon was the world s first offshore WEC and most well-known of the overtopping converters, although the firm behind it is has since closed up shop. The prototype Wave Dragon was approximately 58 m x 33 m and featured long, extended arms to focus the wave and an associated water level towards an elevated reservoir. Using a series of buoyancy tanks, the reservoir level was slightly higher than the surrounding water level. A series of low-head hydroelectric generators would convert this head pressure potential into electric power. An electric cable would transmit the power back to shore. 23
24 LIMPET 24

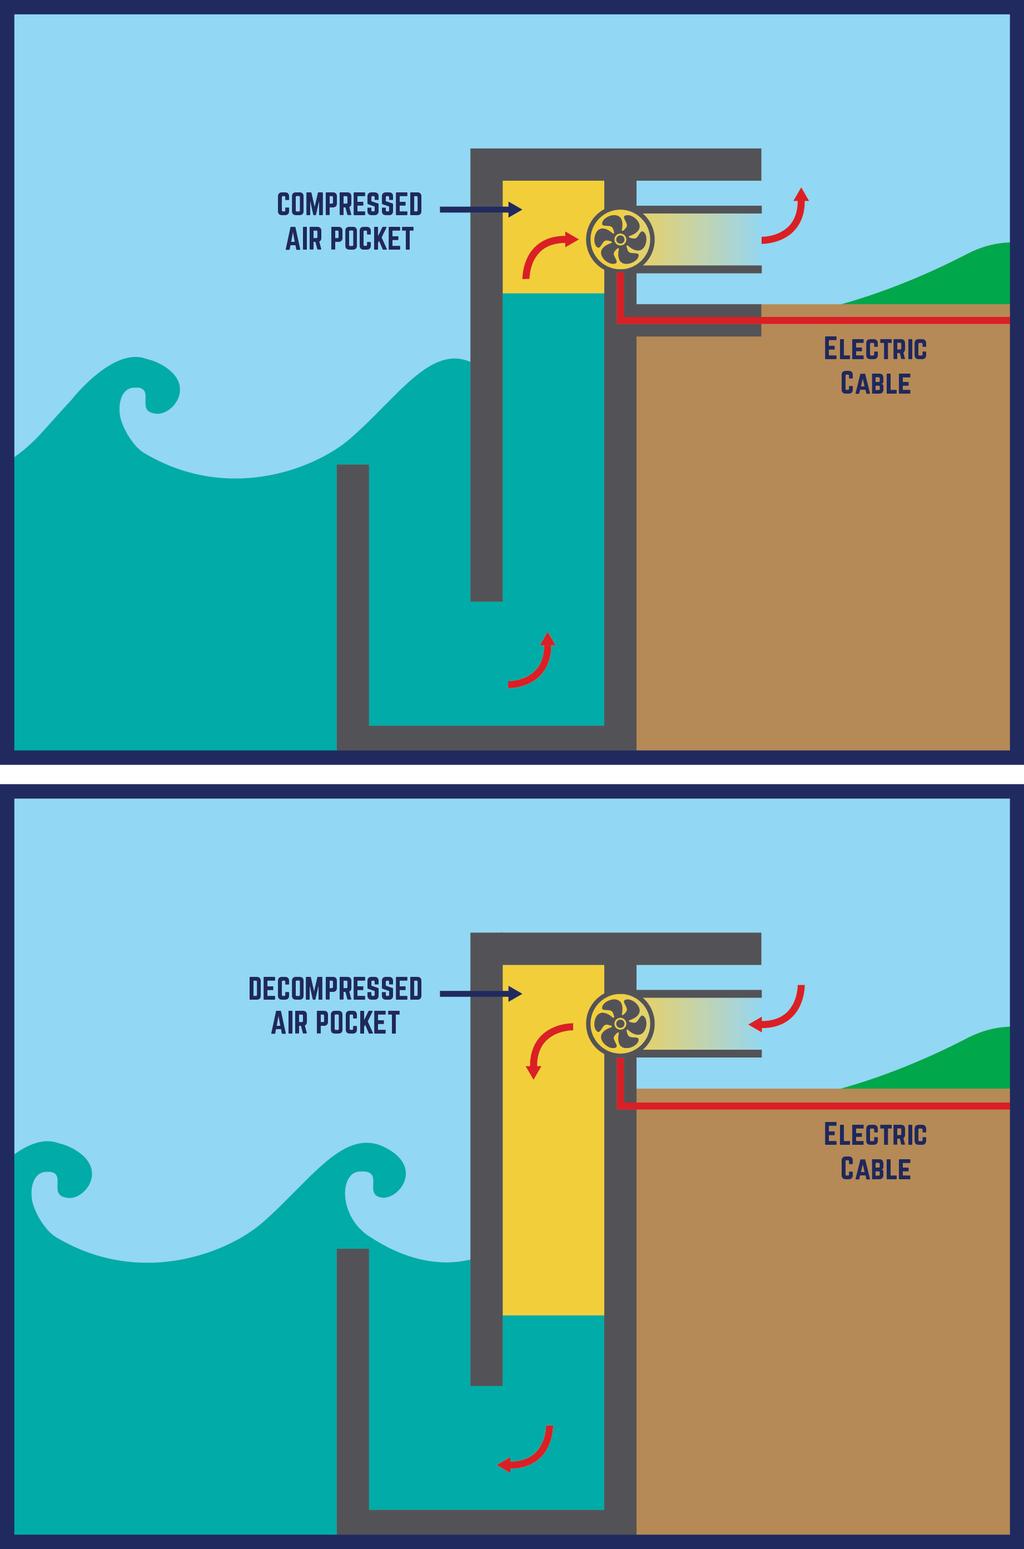
25 LIMPET OSCILLATING WATER COLUMN Limpet, a shore-mounted oscillating water column converter (OWC), is the oldest functioning WEC. An OWC takes advantage of the vertical displacement of ocean waves to pressurize and depressurize an enclosed air chamber. Incoming waves compress the air within the chamber, which then drives an electric air turbine. As waves pass, the water level then drops, creating a low pressure region within the air chamber and the air turbine extracts energy from the incoming air. The air turbines are generally bi-directional, allowing its blades to continually spin in a single direction despite differing flow directions. Ocean Energy Limited is developing a floating OWC for deepwater deployments. 25

26 A BRIEF HISTORY OF WAVE ENERGY RESEARCH IN BC At over 200,000 kilometres, Canada s coastline is more than double the length of the coastline of any other country in the world. The combination of abundant raw wave and tidal resources provide Canada a natural advantage in establishing itself as a global leader in marine renewable energy. In 2001, BC Hydro entered into negotiations with two private wave energy converter technology developers, Edinburgh-based Ocean Power Delivery (later named Pelamis Wave Power, now in administration) and Energetech Australia. The two companies were to develop two separate ventures aiming to produce 4 MW of wave power for Vancouver Island, sufficient to supply about 4,000 homes when running at full capacity. The government of the day then decided that the public power company should not play the role of project developer for new clean-energy technologies, but instead should release calls for power under a technology-neutral competitive bid process. In this way, the government would not be picking a technology winner, but letting the various clean-energy options sort themselves based on cost. Ultimately, an assessment by the BC Utilities Commission found that the two wave demonstration projects were not cost competitive and were cancelled. Not one kilowatt of wave power was delivered as electricity to homes in the province. Subsequently, a pair of pilot projects off the west coast of Vancouver Island, developed by SyncWave Energy Systems and the Pacific Coastal Wave Energy Corp, were approved for provincial funding, and several potential wave farm development sites have been investigated, but no pilots were developed. No Tidal turbine ready for Nova Scotia s Bay of Fundy. Image credit: OpenHydro physical wave energy technology deployments have occurred because BC s Clean Energy plan mandated development of the lowest cost renewable resources hydroelectricity. The nascent technologies were simply too expensive. Despite these setbacks, there continues to be international interest in the wave-energy potential of the province. Global Energy Horizons, a Victoria firm with United Kingdom and California offices, and Australia-based Carnegie Wave Energy have actively maintained an Investigative Use Permit for a region just off Ucluelet, BC, since This type of permit covers activities at the early stage of a major project, offering access to Crown land sites to determine how suitable the area is for the proposed development. In Canada, the province of Nova Scotia has recently led the marine energy charge, but the focus has been on tidal energy, rather than the energy in waves. The Bay of Fundy, between New Brunswick, Nova Scotia and Maine, is home to the highest vertical tidal range on the planet and potentially offers the world s best potential for tidal power. Significant financial support has flowed from provincial, utility, industry and federal backers to the 2 MW Fundy Ocean Renewable Centre of Excellence (FORCE) project, deployed by the private firm Cape Sharp Tidal. While FORCE has seized the opportunity presented by tides on Canada s Atlantic Coast, the best opportunity for wave energy nationally, and amongst the best globally, is undoubtedly located on the Pacific front. BC s coastline is exposed to ocean swells generated in both the north and south of the vast Pacific, the world s largest ocean. The magnitude and consistency of the resource is truly world class. Elsewhere in the world, Ocean Energy Systems (OES), an intergovernmental collaboration operating under the International Energy Agency (IEA), projects that 337 GW of ocean energy can be developed worldwide by In the EU, there is around 8 MW of currently installed wave and tidal stream capacity, with an additional 2,000 MW of projects in the pipeline. If all of these projects are implemented, they could supply electricity to more than 1.5 million households, according to European Commission estimates. And from , the firm Carnegie Wave Energy deployed 2.25 MW of wave energy projects in Australia.
 per square metre and reaches a maximum of 1 kw/m 2 at high noon at the equator, while a relatively benign sea state of 2 m wave height with a")
27 3. THE CHALLENGE OF QUANTIFYING WAVES Apart from tides, waves are the most energy dense form of all the intermittent renewable energy sources. Solar energy density is measured in kilowatts (kw) per square metre and reaches a maximum of 1 kw/m 2 at high noon at the equator, while a relatively benign sea state of 2 m wave height with a ten-second period enjoys about 20 kw/m of wave energy intensity. (Note that wave energy is measured by the transport of energy passing through a linear one-metre wide section of water from the sea surface to the sea floor, hence it is presented as kw/m while solar energy is presented as kw/ m 2 ). Quantifying the amount of energy contained in waves as they propagate or more simply, the wave energy transport is more complex and intricate than assessing the energy contained in wind, tidal or solar resources. In general, wind, tidal and solar energy sources can be described using a single variable; air speed, water speed and incoming solar 27 irradiation, respectively. In contrast, wave energy transport is multi-dimensional and depends on a variety of factors. In the simplest form, it can only be quantified through detailed knowledge of both wave period and height (known as the significant wave height ). Given that not all waves in a swell are of identical height, it is difficult to quantify the wave height by a single number, a significant wave height parameter is used to represent the varying wave heights. The significant wave height is defined as the average height of the highest one third of the waves during the period of observation. A similar issue arises with wave period, since not all waves feature the same time period between crests. This requirement of detailed knowledge about two linked parameters significantly complicates the assessment of wave resources.
28 28
29 MODELS VS BUOYS Traditionally, wave resource assessments have been based on large scale, coarse, numerical models of wave propagation, or wave measurement buoys permanently deployed out in the ocean. Global wave models, such as WaveWatch III run by the US National Centre for Environmental Prediction (NCEP) or the Wave Action Model (WAM) run by the European Centre for Medium Range Weather Forecast (ECMWF), provide coarse, long-term databases of wave conditions called hindcasts a sort of backward historical look used to identify energetic wave regions.9 These models generally only output simplified wave characteristic parameters every 0.5 (or ~54 km); insufficient for detailed resource assessments but an excellent resource for identifying wave energy resources across vast geographical regions. Meanwhile, moored wave-measurement buoys directly measure waves, wind and ocean currents, but provided limited spatial information. Unlike computer models, these single-point measurements offer a high-resolution spectral representation of the sea state. A spectral representation shows the amount of energy at every wave frequency and wave direction combination. The data gathered by buoys is also of sufficiently high resolution to enable validation of the computer models and allows for investigation of short-term effects (on second-tosecond timescales) such as localized wind, currents, and large unexpected waves. WAVE POWER (kw/m)
30 30

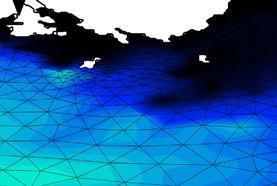
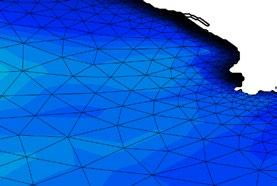
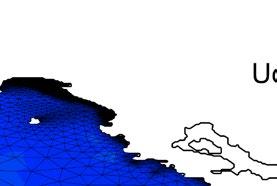
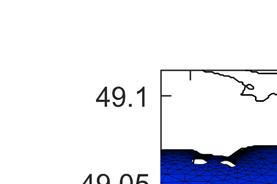
31 WCWI SWAN MODEL AND WAVE MEASUREMENT BUOYS In the near shore region, wave conditions differ dramatically across both space and time due to the effects of seafloor depth (or bathymetry ) and variations in currents and tides. Unfortunately, the application of these physical effects is generally absent in global wave models, or lies below their computational spatial resolution, even though they dramatically influence the performance of wave energy converters (WECs) and the development of wave energy projects. The variation through time (temporal variability) is directly measured by wave measurement buoys, while the geographical variation of such effects through space (spatial variability) can only be captured through the development of a highresolution coastal wave model. It is important to ensure that the spatial resolution of the coastal wave model is sufficient for all relevant bathymetric levels and that tidal effects are captured and represented. The combination of a highly spatially resolved coastal wave model and temporally resolved wave measurement buoys is the best way to get an accurate sense of the resource on offer. The WCWI developed a high resolution computer model of the BC coastline using the SWAN (Simulating WAves Nearshore) modelling package, and combined this with the deployment of a suite of dedicated wave measurement buoys from AXYS Technologies. This two pronged approach allows WCWI to develop and maintain the most highresolution and accurate wave resource assessment available for British Columbia and to also play a leadership role in global efforts to better quantify wave energy resources. The WCWI SWAN model covers roughly 400,000 square kilometres, covering the entirety of the coastline from the Columbia River in the south up to the southern tip of Haida Gwaii in the north. 10 It also currently features some 130,000 data output locations and uses input data from European metrological offices and US Navy research divisions. The model is used to hindcast the wave conditions off the BC coast, at an extremely high resolution, every three hours over the past 12 years ( ). Figure 1 shows the unstructured computational grid used by SWAN and the locations of the WCWI buoys. FIGURE 1: SWAN COMPUTATIONAL GRID In simple terms, the white lines represent the distances over which the model s computations occur, while the junctions where the white lines meet are output locations for the model. Estevan Point Florencia Bay Amphitrite Bank Port Renfrew WCWI wave measurement buoy 31
32 Table 1: Wave buoy information Location Depth Starting date Resolution Latitude Longitude Amphitrite Bank 43 m 19/04/2013 Hourly N W Estevan Point 42 m 23/04/2013 Hourly N W Florencia Bay 25 m 01/06/2013 Hourly N W Port Renfrew 28 m 26/09/2015 Hourly N W The WCWI currently has four wave measurement buoys deployed along a strategic southeast to northwest line of the coast of Vancouver Island. The buoys sit at a variety of depths and locations with differing wave resource climates. Each location has been strategically chosen to measure conditions at possible areas for future deployments of WECs. Table 1 provides a quick overview of the locations, depths and deployment length. It is important to validate the outputs from the spatially explicit SWAN model against the measured wave buoy data before utilizing the values for analyses. The simulations from the WCWI s SWAN wave model and the measurements from the buoys match up very well when describing significant wave height, with the model generally being biased low by just three centimetres. When describing the peak wave period, again, the model and the buoy data matched up well, being off by 0.02 seconds on average. As shown in Figures 2 and 3, the measured buoy data is more volatile and features more frequent outliers than the smoother model hindcast. This discrepancy is well-understood and is the result of a number of factors. Firstly, the SWAN model represents the average (mean) of sea state behaviour over a three-hourly time frame. In reality, the sea state is an ever changing, bumpy and random ( stochastic ) process, and the deployed buoys only sample the wave conditions over discrete intervals. So, due to sampling variability, the buoy wave spectrum sample will equal the mean only when averaged out across a sufficient period of time. The time averaging used in most buoy systems is limited in order to enable the assumption of a quasistationary sea state. Secondly, the physics employed in the numerical wave model are parameterized for computational efficiency and are inherently limited by the accuracy and resolution across the time resolution of the wind inputs. As such, they are generally unable to reproduce short-lived extreme wind or wave events. These caveats aside, the validation exercise proves the performance of the model and ability to apply to wave energy resource assessments. H La Perouse Bank (48.83N, E) T La Perouse Bank (48.83N, E) Wave Height (m) H s (Buoy) H s (SWAN) Wave Period (s) T p (Buoy) T p (SWAN) 5 Apr May Jun Jul Aug FIGURE 2: SIMULATED SWAN AND BUOY SIGNIFICANT WAVE HEIGHT MEASUREMENTS AT LA PEROUSE BANK 32 Apr May Jun Jul Aug FIGURE 3: SIMULATED SWAN AND BUOY PEAK PERIOD MEASUREMENTS AT LA PEROUSE BANK

33 33
 in a particular area.")
34 Ucluelet shoreline VANCOUVER ISLAND S GROSS WAVE ENERGY RESOURCE The primary metric that wave energy technology developers, project developers and policy makers need to know is the average amount of energy being transported by the waves (mean annual wave energy transport) in a particular area. This provides a simple representation of the total wave energy at any one location and gives a quick sense of the electricity generation that is, in principle, achievable. Figure 4a provides both an overview of the mean annual wave energy transport off the coast of Vancouver Island over the SWAN hindcast period. As shown, the continental shelf of British Columbia enjoys wave energy transport values of between 35 kw per metre and 40 kw per metre on average. Temporally, the resource very rarely falls below 0.5 kw/m and during larger winter wave events can reach staggering values of more than 1000 kw/m. 11 However, deploying technologies on the continental shelf means extreme depths and substantially increased costs of mooring, laying cable and maintaining any mechanical devices. As a result, WEC developers have limited interest in such distant locations and more focussed on shallower nearshore regions that are easier and cheaper to access. Approaching the near-shore region, the local sea floor begins to show significant variation in depth. These changes in depth (bathymetry) cause waves to refract (change speed due to changes in localized depth) and diffract (change direction as they pass through an opening or around a barrier) and result in significant variation in wave conditions over short spatial distances. Figure 4b shows a zoomed-in section near Ucluelet known as Amphitrite Bank. This charmed location features mean annual wave energy transport values greater than 30 kw/m, a relatively small reduction from offshore values, yet is just seven kilometres from shore and only 40 m deep. 4,6 In order to provide some back of the envelope context; assume a simple WEC has a wave-to-wire (electricity) conversion efficiency of 10 percent (that is, we are able to capture ten percent of the gross wave energy transport in the waves) and has a width of 20 metres, a single device deployed at Amphitrite Bank would produce about 525 MWh over the course of the year, or sufficient to supply the needs of 52 houses in British Columbia, based on 2007 electrical usage. And that s just one WEC. Such simplified metrics provide a quick but illustrative view of the significant untapped renewable wave energy resource, and the unique opportunity Canada has along the west coast of Vancouver Island. 34


")


35 Coastline Wave energy transport Latitude degrees east kw/m of wave front 10 5 Longitude degrees north FIGURE 4A: MEAN ANNUAL WAVE ENERGY FLUX OFF VANCOUVER ISLAND (W/M) Coastline Wave energy transport Ucluelet 30 Latitude degrees east kw/m of wave front 10 5 Longitude degrees north FIGURE 4B: ZOOM-IN OF THE UCLUELET REGION 35
36 DIGGING DEEPER: CHARACTERISING THE RESOURCE The gross wave energy transport values described in this primer provide a simple method to identify attractive locations for future development, but they do not supply the necessary detail on the associated wave height, periods, direction or respective distributions to design, maintain or operate a WEC. These extra details are paramount to ensure that WECs can be appropriately designed to maximise electricity generation from the waves and can be controlled to survive under storm conditions. 12 For the Amphitrite Bank location, the histogram presented in Figure 5 shows the annual mean number of occurrences and the percentage of the total annual wave energy transport for specific wave height and period combinations. The sea-state frequency, denoted by the number of hours per year, is illustrated by the numerical values in each box, while the percentage of the total annual wave energy is indicated by the contour colour map. As shown, for the Amphitrite Bank location, the most common wave height is 1.25 metres with a period of 7.5 seconds. This occurs for 533 hours annually. Interestingly, this sea-state does not provide the highest contribution to the annual energy; waves that are 2.25 metres high and occurring every 9.5 seconds provide about 4.5 percent of the total wave energy. Here lies an obvious trade-off. The WEC developer will need to determine which sea state will result in increased WEC performance and higher economic value. Do they prefer sites with the most frequent or the most energetic wave conditions? The histogram presentation provides good detail on the distribution of wave energy across differing wave height and period combinations. However, it does not provide any detail on the inter-annual variation in these combinations. This is important. From a WEC developer s point of view, the cost of generating a kwhr of wave energy is constant. However, when viewing any variable renewable energy source from a systems-level perspective, the value of that electron varies dramatically over the year. As a result, both project developers and policymakers need detailed information about the fluctuations in wave conditions over the year to maximise power production at times of highest value. The interannual variability of mean wave energy transport and significant wave height on Amphitrite Bank, presented in Figures 6 and 7 respectively, illustrates the seasonality of the wave resource. Focusing on Figure 6, a significant seasonal shift in the directional wave energy flux is immediately evident, with monthly mean values of 50 kw/m during the winter and only 6.5 kw/m during the calmer summer months. The low summer values are directly related to the decrease in the significant wave height and lower energy periods during this period. This effect is regional, not global. Other locations in the world will feature dominant summer wave activity, while others will receive short intensive bursts of wave energy during monsoon or hurricane seasons. Wave Height (m) Percentage of mean annual wave energy flux Wave Period (s) 3 1 FIGURE. 5: HISTOGRAM SHOWING THE PROBABILITY AND ENERGY DISTRIBUTION AT THE AMPHITRITE BUOY LOCATION 36
37 Directional Wave Energy (W/m) Mean Mean+Std Mean-Std 10th Pecentile 50th Pecentile 90th Pecentile 1 0 Jan Feb Mar Apr May Jun Jul Aug Sep Oct Nov Dec Month FIGURE. 6: Monthly variation in gross wave energy transport at Amphitrite Bank Mean Mean+Std Mean-Std 10th Pecentile 50th Pecentile 90th Pecentile H mo (m) Jan Feb Mar Apr May Jun Jul Aug Sep Oct Nov Dec Month FIGURE. 7: Monthly variation in significant wave height at Amphitrite Bank 37
38 4. OPPORTUNITIES AND CHALLENGES As with every nascent renewable energy industry, there are significant opportunities and challenges associated with the resource, the technology employed to exploit it, and the inherent value of the power. The primary opportunity, or competitive advantage, of wave energy in British Columbia is simply the enormity of the raw resource. This has already been described in detail. When compared against many other sources of clean energy, wave energy in Canada does have additional benefits. Firstly, wave energy offers a high correlation with the electricity demand that is, we would get the greatest amount of wave energy power production at times when the electrical system needs it most. Secondly, wave energy is much more predictable than other variable sources of renewable electricity thus lowering the overall operational cost of the electrical system. Lastly, wave energy generation would occur at locations closest to communities currently at high risk from electrical supply interruptions. WINTER PEAKING The wave energy resource available varies dramatically between winter and summer. At first glance this may seem detrimental to the future development of a wave energy industry in Canada. However, the value of the electrical energy generated from any renewable or non-renewable resource is only as valuable as the moment-to-moment demand for that resource/electricity. In British Columbia and the majority of Canada, electricity demand peaks during the cold winter months and is lower during the summer. As shown in Figure 8, the variation in monthly wave energy transport follows a remarkably similar trend to the Vancouver Island monthly electricity demand. Thus, wave energy converters would maximise electricity production during the periods of the year when the demand for the power is greatest and would provide BC Hydro with energy resources when the province needs it. 10 Vancouver Island Electrical Demand (MW) Wave Energy Transport (kw/m) Vancouver Island Electrical Demand (MW) Wave Energy Transport (kw/m) Months of the Year FIGURE 8: ANNUAL WAVE ENERGY TRANSPORT AND VANCOUVER ISLAND ELECTRICITY DEMAND 38

39 THE PREDICTABLE VARIABLE RENEWABLE Wind and solar receive a lot of press and policy-maker attention. Their prices have fallen dramatically over the past decade. However, they present significant challenges when integrating them into the electricity grid. Given that the amount of sun (solar irradiance) and the wind speed varies dramatically over short time periods, these energy sources require backup, or reserve, power a generation source that is on-line and spinning and can quickly respond to changes in the wind/solar generation, thus ensuring the electrical demand is always exactly met. These back-up power requirements result in additional expenses to the entire electrical system and reduce the efficiency of other dispatchable generation technologies. Thus, wind and solar are required to pay an integration charge in many jurisdictions to account for these system-wide efficiency losses and costs. As a result of this inherent variability and the associated costs, the large-scale deployment of such renewable energy sources will continue to be hampered. To minimise this problem, power system managers need accurate renewable energy resource forecasts for operational planning to ensure that energy generation matches demand exactly at all times. This allows them to constantly optimize the operation of the electrical system. Waves are not reliant on local conditions. A storm in any portion of the Pacific will generate waves and ocean swell. Once swell develops, it is able to travel vast distances with very little loss of energy and the physics of wave energy transport are very well understood. Hence, the exact local arrival time of swell from storms far away can be quickly calculated. 11 So what does this mean for the electrical system in BC? Firstly, the Pacific Ocean can be seen as our wave energy catchment area (to borrow a hydro term) almost any storm that occurs at any location within the north Pacific Ocean will send some wave energy to the coasts of BC. And secondly, we are able to predict the exact timing of the arrival of that energy with precision. Ultimately, this means the wave energy resource is less dependent on local conditions and the associated detrimental variability one of the major shortcomings of wind and solar resources. The WCWI research has found that wave energy can be very well forecast over the short time frames of interest to power system managers. On average, a four-hour wave forecast features just a 15 percent margin of error, while wind and solar in the Pacific North West are closer to 77 percent and 86 percent respectively. 11 Due to this impressive forecastability, the requirements for back-up power source would be significantly lower, allowing for more efficient use of the entire electrical system, less redundancy in capacity, and overall lower costs to integrate the same quantities of renewable energy. When the cost of energy is expressed in terms of the reserves required, this research has also shown that both wind and solar need back-up equivalent to about a sixth of the power supplied (16.3 percent and 15.2 percent respectively). 11 Meanwhile, the WCWI research shows that wave energy requires backup equivalent to just percent of the power, depending on the type of WEC deployed. In plain language, this means that when costs are expressed in terms of the amount of reserve required, waves are far less expensive than other forms of variable renewable energy. 39
40 A BOON TO AT-RISK COMMUNITIES An additional benefit of exploiting the significant natural wave energy resources in Canada is the coastal location of electricity generation. Coastal communities are generally at the end of long and frequently compromised transmission lines resulting in recurring black-outs and electricity loss. Wave energy would provide energy generation at the point of use, thus mitigating the risk of black-outs and reducing the requirements for transmission expansion in the future load growth scenarios. Researchers from the PICS 2060 Project developed a numerical model of Vancouver Island s electrical system and assessed the impacts of integrating 500 MW wave energy farms into the Vancouver Island grid. They found that wave energy has the potential to service a significant portion of Vancouver Island s demand, could reduce the dependency on transmission of electricity from the Lower Mainland by up to 11 percent annually, and reduce peak winter demand by up to 15 percent. This also reinforces the complementarity between the wave energy generation and the seasonal electricity demand. 13 Note that the substantially higher contribution of wave energy over wind is due to the wind portion being attributed to the wind farm currently installed at Cape Scott off the northwestern tip of Vancouver Island. The wave portion represents a theoretical 500 MW (from ten 50 MW wave farms), while the wind is limited to the 99 MW that has been installed. One of the main take-aways from this figure is the complimentary timing of wave production and electrical demand Hydro Natural Gas Wind Wave Imports Energy (GWh) Jan-07 Jul-07 Jan-08 Jul-08 Jan-09 Jul-09 Jan-10 Jul-10 Jan-11 Jul-11 Jan-12 Jul-12 Jan-13 Jul-13 Dec-13 FIGURE 9: POTENTIAL ENERGY MIX ON VANCOUVER ISLAND WITH THE DEPLOYMENT OF 500 MW OF WEC CAPACITY 40

41 41

42 OPERATIONAL AND FINANCIAL CHALLENGES As with all existing and nascent energy sources, wave energy does not come without challenges. By far the greatest challenge to the future development of wave energy is the current cost per unit of wave energy. In British Columbia specifically, this challenge is compounded by the current lack of demand for utility-scale low-carbon generation given the province s abundance of hydroelectricity. There is very little information in the public domain on the true costs of wave energy. The publically available figures show a need to reduce the costs significantly prior to becoming competitive on the open energy market. For example, the World Energy Council estimates that the costs of wave energy vary between US$284/MWh and US$1058/MWh. 14 Given that BC s residential consumer rate is below US$75/MWhr, wave energy generation costs need to be substantially reduced in order to reach parity or even to be cost comparable to other sources of renewable energy. The cost range is so wide due to the uncertainty over many permitting, construction and operational costs, as well as the final realized power production from the WECs. Pre-operating costs including preliminary studies, environmental impact assessments and consenting procedures vary widely on the type of installation and its location. Deployment and operating costs are still vague as a result of the limited number of physical deployments and a lack of public dissemination of final cost and production numbers. There simply is not enough experience and time in the water to limit the cost uncertainty yet. Initial rough estimates have been made on the basis of the accrued experience thus far, and knowledge from the offshore oil, gas, and wind projects. WECs are generally designed for specific operating conditions with maximum annual energy production generally in moderately sized waves yet survivability in extreme wave conditions is a significant design variable and driver of the ultimate cost. Given the inherent outlier nature of extreme conditions, it is difficult to physically test full scale WECs in extreme conditions. Confoundingly, numerical modelling of extreme waves is difficult because of the nonlinear nature of breaking waves and the associated impact forces. As a result, the dynamics of these phenomena remain poorly understood. In addition, the accessibility of the deployed devices, for operational maintenance, is directly connected to the current wave conditions. Deployments in active wave sites will ultimately generate more power, but will be less accessible due to the increased wave heights and periods. Life thrives at sea. WECs, like any engineering work in the ocean, are susceptible to marine life and biofouling. Biofouling is a process whereby bacterial biofilms, then barnacles, mussels, tube worms or seaweeds build up deposits or otherwise attach themselves. Biofouling could impair the functioning of WECs, and while the final impact of bio-fouling is unknown, the biomass density would undoubtedly increase with deployment time. 42

43 Finally, while technological and scientific studies will help illuminate the optimal deployment locations and capacities for future WEC farms, these locations will be under intense scrutiny and could potentially be under licence, tenure or use by other industries. Commercial and recreational fishing, vessel transportation routes and marine protected areas cover large swaths of the coastal oceans and a future industry in wave-energy conversion will have to accommodate competing industries and interests before acquiring both social and government licence to deploy WECs. For example, in Nova Scotia, Bay of Fundy fishermen are apprehensive about the deployment of tidal energy project, fearing negative impacts on marine life and that they will be pushed out of their fishing grounds. Similar concerns may be raised around the deployment of wave energy projects. In essence, the high levelized cost of wave energy (LCOE) is mainly due to the limited experience of deploying devices, the inherently hostile ocean environment and device survival in highly energetic waves. One suggested opportunity for cost reductions may be the joint deployment of offshore wave and wind projects. A combined wind and wave array could exploit the greater reliability of wave energy to smooth out some of the variability of wind, while also reducing deployment and maintenance costs via the use of common equipment. While the costs reductions and attendant technological innovation required are significant, a historical perspective of the cost reductions that have been achieved by the solar and wind industries provide evidence to show that, if similarly significant technological improvements are made in wave energy, this challenge is not insurmountable. Across Canada, the current and forecast demand for zerocarbon electrical generation varies dramatically. In the BC context, there is limited need for additional utility-scale zero-carbon electrical generation given the large-scale hydroelectric generation system. However, the BC coast is dotted with remote communities that are reliant on expensive and carbon intensive diesel fuel for electricity generation these communities provide a unique opportunity for WEC developers to compete economically with other sources of power. Additionally, the province is in principle internationally obliged to decarbonise its transport fleet, heating systems and industrial processes, all of which will require vast increases in clean electricity generation. In neighbouring Alberta, recently unveiled policy directives call for significant increases in renewable energy generation and BC s wave energy resource could theoretically provide a measure of Alberta s future renewable generation requirements, if provincial politics would allow. 15 The WCWI is working closely with the 2060 Project to quantify the timelines and magnitude of wave-energy generation that would be economically cost effective, and identify optimal deployment locations to service such increased clean energy demand. Brown algae biofouling a grate 43
 technologies.")
44 CONCLUSION Global wave energy inventories have shown that the west coast of Vancouver Island is one of the most energetic wave climates in the world. With this energetic climate, there is an opportunity to generate significant quantities of renewable electricity through the use of wave-energy conversion (WEC) technologies. In response to the international attention on Vancouver Island, the West Coast Wave Initiative at the University of Victoria was mandated to develop a wave-to-wire numerical modelling effort to understand the feasibility, impacts, and possible structure of future wave energy conversion opportunities in Canada. This primer provides an overview of the spatial and temporal distribution of the gross wave resource, the methods utilized to characterize the resource, and provides an objective vision of both the opportunities and challenges for a future wave energy industry in Canada. Via the gross resource assessment process, we have identified multiple locations on Vancouver Island s west coast that would be suitable for future wave energy development; for example, Amphitrite Bank provides a very attractive opportunity for wave energy conversion with mean energy transport values of 34.5 kw/m only 7 km from shore. This compares favourably against the leading international wave energy development sites in Europe. The wave energy resource varies dramatically over the year. Fortunately, the high correlation between the gross wave resource and electrical demand in British Columbia shows that wave energy would produce more electricity at times of greatest provincial demand (winter) and less electricity in lock-step with local and provincial demand. Wave-produced electricity is also able to increase energy security at various scales and provide local distributed generation, as shown for Vancouver Island. Lastly, the value of variable renewable energies (VRE) is often reduced due to inaccurate renewable generation forecasts and the associated costs to maintain grid reliability. Predictions of wave energy generation are significantly more accurate than competing VREs, hence the integration costs of wave power are lower and associated grid value higher. The greatest challenge to the future development of wave energy is undoubtedly the cost per unit of energy wave energy costs need to be significantly reduced to compete for market share against other renewables. But the scale of the technological challenge is no greater than that which faced wind and solar energy up until the last few years, and both are now enjoying rapid and ongoing cost declines. With similar government support for research and incentives for deployment, there is no reason why wave energy cannot attain similar success. If anything, wave energy may achieve even greater triumphs, given how much more dependable a resource it is. 44
45 POLICY RECOMMENDATIONS Leverage natural competitive advantage to allow BC to capture international market opportunity: Investigate the international market place for marine energy and determine how BC might leverage its natural competitive advantage, in terms of resource scale and diversity, to be a significant player in the global marine energy market. Develop the necessary infrastructure to allow BC and Canadian companies to test, operate and maintain WECs and ancillary technologies in BC rather than losing them to international markets. Develop relevant legislation to support the nascent wave energy industry when it matures to deployment. This includes access to priority locations, streamlining of permitting and co-operation of electrical utilities. Provide seed capital to assist the development and manufacture of WEC technologies designed for the Canadian wave climate. Continued financial support for academic research efforts to help better understand and accelerate the pace of development in the marine energy sector. 45
46 ENDNOTES 1. A. Cornett and J. Zhang, Nearshore Wave Energy Resources, Western Vancouver Island, B.C, Canadian Hydraulics Centre, D. Dunnett and J. S. Wallace, Electricity generation from wave power in Canada, Renew. Energy, vol. 34, no. 1, pp , C.-K. Kim, J. E. Toft, M. Papenfus, G. Verutes, A. D. Guerry, M. H. Ruckelshaus, K. K. Arkema, G. Guannel, S. A. Wood, and J. R. Bernhardt, Catching the Right Wave: Evaluating Wave Energy Resources and Potential Compatibility with Existing Marine and Coastal Uses, PLoS One, vol. 7, no. 11, p. e47598, G. Reikard, B. Robertson, B. Buckham, J.-R. Bidlot, and C. Hiles, Simulating and forecasting ocean wave energy in western Canada, Ocean Eng., vol. 103, pp , B. Robertson, C. Hiles, and B. Buckham, Characterizing the Nearshore Wave Energy Resource on the West Coast of Vancou er Island., Renew. Energy, vol. In submiss, C. E. Hiles, B. J. Buckham, P. Wild, and B. Robertson, Wave energy resources near Hot Springs Cove, Canada, Renew. Energy, vol. 71, pp , EPRI, EPRI USA Waters Wave Resource Assessment, A. Cornett, Inventory of Canada s Marine Renewable Energy Resources, National Research Council - Canadian Hydraulics Centre, Ottawa, K1A 0R6, Canada, Using wave boundary conditions from European Centre for Medium-Range Weather Forecasts (ECMWF) and wind forcing fields from the Fleet Numerical Metrology and Oceanography Centre (FNMOC) model. 10. The model is computationally expensive and hence boundaries need to be drawn somewhere. Our mandate is BC. WCWI collaborates with University of Washington and Oregon State University for US PNW models. 11. G. Reikard, B. Robertson, and J.-R. Bidlot, Combining wave energy with wind and solar: Short-term forecasting, Renew. Energy, vol. 81, pp , The International Electrotechnical Commission (IEC) Technical Committee 114 has recently released TS Wave Energy Resource Assessment and Characterisation; a technical specification to provide a globally consistent methodology to assess wave resources, temporal variability, characteristics and extreme wave conditions. International Electrotechnical Commission T C 114, IEC TS Technicial Specification - Part 101: Wave energy resource assessment and characterization., I. Moazzen, B. Robertson, P. Wild, A. Rowe, and B. Buckham, Impacts of Large-Scale Wave Integration into a Transmission-Constrained Grid, Renew. Energy, vol. 88, pp , Joseph Salvatore, World Energy Perspective - Cost of Energy Technologies, A. Leach, A. Adams, S. Cairns, L. Coady, and G. Lambert, Alberta Climate Leadership Plan,

47 47
Wave Energy. ME922/927 Wave energy
 Wave Energy ME922/927 Wave energy 1 Global ocean wave energy resource 102 48 38 15 15 24 50 97 32 49 19 18 25 33 92 70 38 19 17 21 50 12 38 34 14 40 43 78 20 41 18 10 37 72 84 48 Annual average in kw/m
Wave Energy Atlas in Vietnam
 Wave Energy Atlas in Vietnam Nguyen Manh Hung, Duong Cong Dien 1 1 Institute of Mechanics, 264 Doi Can Str. Hanoi, Vietnam nmhungim@gmail.com; duongdienim@gmail.com Abstract Vietnam has achieved remarkable
Ocean Energy. Haley, Shane, Alston
 Ocean Energy Haley, Shane, Alston What is Ocean Energy? The world s oceans cover nearly 70% of the world's surface The oceans are the world's largest collector of the sun s energy that is continually
Wave Energy. Penn Sustainability Review. Sasha Klebnikov. Volume 1 Issue 7 Optimizing Sustainability. Article
 Penn Sustainability Review Volume 1 Issue 7 Optimizing Sustainability Article 7 12-1-2015 Wave Energy Sasha Klebnikov This paper is posted at ScholarlyCommons. http://repository.upenn.edu/psr/vol1/iss7/7
Ocean Energy Policy Brief
 Ocean Energy Policy Brief August 2013 Author and Primary Contact Prof JL (Wikus) van Niekerk wikus@sun.ac.za +27 (0)21 808 4251 Summary: South Africa has an exploitable wave energy resource that compares
Characterizing Ireland s wave energy resource
 Snapshots of Doctoral Research at University College Cork 2011 Characterizing Ireland s wave energy resource Brendan Cahill Hydraulics & Maritime Research Centre, UCC Introduction In theory, the energy
The transition to sustainable energy
 ATSE Symposium The transition to sustainable energy Peter Littlewood 8 Nov 2016 The changing world economy Index 180 170 160 150 140 130 120 110 100 90 Economies less energy intensive Electricity less
Kavala Bay. Fiji nearshore wave hindcast ' ' 19 00'
 Kavala Bay Fiji nearshore wave hindcast 1 00' 19 00' 1 30' 19 00' 1 00' 1 30' 1 00' 1 30' 1 30' Figure 1. Location maps of the site. The map on the left shows the region. The map on the right shows the
Energy from seas and oceans
 Energy from seas and oceans Marine energy can represent an important source of renewable energy in the near future. In Italy, activities performed in this sector are growing rapidly both in terms of assessment
Maritime Renewable Energy
 Maritime Renewable Energy Prospects & Opportunities Prof Minoo Patel minoo.patel@cranfield.ac.uk m.patel@bpp-tech.com Tel: +44 (0) 7711 980173 Contents Existing technologies in wave, wind and tidal energy:
Operating Principle, Performance and Applications of the Wave Mill
 Journal of Energy and Power Engineering 11 (2017) 311-316 doi: 10.17265/1934-8975/2017.05.004 D DAVID PUBLISHING Operating Principle, Performance and Applications of the Wave Mill Ivan Voropaev Wave Power
Mango Bay_Resort. Fiji nearshore wave hindcast ' ' 19 00'
 Mango Bay_Resort Fiji nearshore wave hindcast 1 00' 1 30' 1 00' 177 00' 177 30' 17 00' 17 30' Figure 1. Location maps of the site. The map on the left shows the region. The map on the right shows the island
Wave Energy Converters (WECs)
") Aquamarine Power Oyster* The Oyster is uniquely designed to harness wave energy in a near-shore environment. It is composed primarily of a simple mechanical hinged flap connected to the seabed at a depth
Aquamarine Power Oyster* The Oyster is uniquely designed to harness wave energy in a near-shore environment. It is composed primarily of a simple mechanical hinged flap connected to the seabed at a depth
Sand Bank Passage. Fiji nearshore wave hindcast ' ' 19 00'
 Sand Bank Passage Fiji nearshore wave hindcast 1 00' 1 00' 1 30' 1 00' 177 00' 177 30' 17 00' 17 30' 17 30' Figure 1. Location maps of the site. The map on the left shows the region. The map on the right
Energy capture performance
 Energy capture performance Cost of energy is a critical factor to the success of marine renewables, in order for marine renewables to compete with other forms of renewable and fossil-fuelled power generation.
Modelling and Assessment of Marine Renewable Energy Resources. Andrew Cornett Canadian Hydraulics Centre National Research Council Canada May 2008
 Modelling and Assessment of Marine Renewable Energy Resources Andrew Cornett Canadian Hydraulics Centre National Research Council Canada May 2008 Background Pan-Canadian resource inventory in 2005/06 Canada
Maria Kamargianni Prof. Nikitas Nikitakos Dr. Theodoros Lilas
 3rd International Scientific Conference Energy and Climate Change An overview of wave energy devices. Case study: wave energy in Agios Efstratios, the first greek green island Maria Kamargianni Prof. Nikitas
Background. that may differ from the rest of the world.
 Background ¾Climate Change impacts in the Pacific very serious and will impact the lives and livelihoods of the people people. ¾Sea level rise is a major threat need to help reduce carbon emission. One
Avaavaroa passage. Rarotonga nearshore wave hindcast 21 09' 21 12' 21 15' 21 18' ' ' ' '
 Avaavaroa passage Rarotonga nearshore wave hindcast 21 09' 21 ' Fuel Pipeline Avatiu Passage Black Rock Avarua Passage Pue Tupapa Papua Passage Avaavaroa Passage 21 15' Ngatangiia Passage onga Wave Hotspot
BILLY BISHOP TORONTO CITY AIRPORT PRELIMINARY RUNWAY DESIGN COASTAL ENGINEERING STUDY
 Bâtiment Infrastructures municipales Transport Industriel Énergie Environnement BILLY BISHOP TORONTO CITY AIRPORT PRELIMINARY RUNWAY DESIGN COASTAL ENGINEERING STUDY N. Guillemette 1, C. Glodowski 1, P.
Marine Renewables Industry Association. Marine Renewables Industry: Requirements for Oceanographic Measurements, Data Processing and Modelling
 Marine Renewables Industry Association Marine Renewables Industry: Requirements for Oceanographic Measurements, Data Processing and Modelling October 2009 Table of Contents 1. Introduction... 1 2. Measurements
InVEST model demo: Renewable Energy (Wave Energy) Gregg Verutes
 Gregg Verutes") InVEST model demo: Renewable Energy (Wave Energy) Gregg Verutes Some WEC Devices Attenuator Point Absorber Oscillating Water Column Overtopping Device Oscillating Wave Surge Converter Submerged Pressure
InVEST model demo: Renewable Energy (Wave Energy) Gregg Verutes Some WEC Devices Attenuator Point Absorber Oscillating Water Column Overtopping Device Oscillating Wave Surge Converter Submerged Pressure
Wave Prediction in the Santa Barbara Channel
 Wave Prediction in the Santa Barbara Channel OCS Study MMS 2001-055 Final Technical Summary Final Study Report U.S. Department of the Interior Minerals Management Service Pacific OCS Region Wave Prediction
Carnegie Wave Energy Limited
 Carnegie Wave Energy Limited Mr Kieran O Brien Executive Director European Business Development Copyright Carnegie Wave Energy Limited 2015 1 Disclaimer The information contained herein has been prepared
Beach Wizard: Development of an Operational Nowcast, Short-Term Forecast System for Nearshore Hydrodynamics and Bathymetric Evolution
 Beach Wizard: Development of an Operational Nowcast, Short-Term Forecast System for Nearshore Hydrodynamics and Bathymetric Evolution Ad Reniers Civil Engineering and Geosciences, Delft University of Technology
Ensuring Reliability in ERCOT
 Ensuring Reliability in ERCOT Beth Garza Director, ERCOT IMM bgarza@potomaceconomics.com 512-225-7077 February 27, 2018 2 Data Comparisons ERCOT Population (million) 24 80 Germany Annual electricity consumption
Harvesting the waves
 TOM THORPE HEAD OF GLOBAL PROJECT MANAGEMENT, ENERGETECH AUSTRALIA PTY MARINE MATTERS Harvesting the waves The emergence of waves as a useful source of energy The potential for extracting useful energy
page - Laboratory Exercise #5 Shoreline Processes
 page - Laboratory Exercise #5 Shoreline Processes Section A Shoreline Processes: Overview of Waves The ocean s surface is influenced by three types of motion (waves, tides and surface currents). Shorelines
Ngatangiia passage. Rarotonga nearshore wave hindcast 21 09' 21 12' 21 15' 21 15' 21 18' ' ' ' '
 Ngatangiia passage Rarotonga nearshore wave hindcast 21 0' 21 ' Fuel Pipeline Avatiu Passage Black Rock Avarua Passage Pue Tupapa Ngatangiia Passage 21 15' Ngatangiia Passage onga Wave Hotspot Rutaki Passage
La Rance tidal power plant in La Rance, France. Tidal and Wave Energy
 La Rance tidal power plant in La Rance, France Tidal and Wave Energy Tides Tides are caused by the pull of the moon. Tides involve the rise and fall of sea levels. Around the coast of Ireland, the sea
COMPARISON OF DEEP-WATER ADCP AND NDBC BUOY MEASUREMENTS TO HINDCAST PARAMETERS. William R. Dally and Daniel A. Osiecki
 COMPARISON OF DEEP-WATER ADCP AND NDBC BUOY MEASUREMENTS TO HINDCAST PARAMETERS William R. Dally and Daniel A. Osiecki Surfbreak Engineering Sciences, Inc. 207 Surf Road Melbourne Beach, Florida, 32951
HARBOUR SEDIMENTATION - COMPARISON WITH MODEL
 HARBOUR SEDIMENTATION - COMPARISON WITH MODEL ABSTRACT A mobile-bed model study of Pointe Sapin Harbour, in the Gulf of St. Lawrence, resulted in construction of a detached breakwater and sand trap to
TRIAXYS Acoustic Doppler Current Profiler Comparison Study
 TRIAXYS Acoustic Doppler Current Profiler Comparison Study By Randolph Kashino, Axys Technologies Inc. Tony Ethier, Axys Technologies Inc. Reo Phillips, Axys Technologies Inc. February 2 Figure 1. Nortek
Suva. Fiji. A copy of this report is available at ' ' 18 30' 19 00' ' ' ' '
 Suva Fiji 16 17 30' 17 1 00' 1 1 30' 1 20 1 00' 177 17 17 10 17 17 177 30' 17 00' 17 30' 17 00' Figure 1. Location maps of the site. The map on the left shows the region. The map on the right shows the
DEVELOPMENTS IN WAVE ENERGY CONVERSION
 Türkiye Offshore Energy Conference, Istanbul, 19-21 June 2013 DEVELOPMENTS IN WAVE ENERGY CONVERSION António F. O. Falcão Instituto Superior Técnico, Universidade Técnica de Lisboa, Lisbon, Portugal SUMMARY
International and Niche Markets for Wave and Tidal Energy. Neil Ferguson
 International and Niche Markets for Wave and Tidal Energy Neil Ferguson Scottish Enterprise Scottish Enterprise aims to deliver a significant, lasting effect on the Scottish economy. Our four interconnected
Technical Brief - Wave Uprush Analysis Island Harbour Club, Gananoque, Ontario
 Technical Brief - Wave Uprush Analysis RIGGS ENGINEERING LTD. 1240 Commissioners Road West Suite 205 London, Ontario N6K 1C7 October 31, 2014 Table of Contents Section Page Table of Contents... i List
Wind and Tidal - Benefits and Opportunities in Australia
 Wind and Tidal - Benefits and Opportunities in Australia Presented by MR MATTHEW KEYS, BEng (Civil) Lead Analysis Engineer Carnegie Corporation Ltd 2007 Carnegie Corporation Ltd Outline Ocean Energy Introduction
Honiara. Solomon Islands
 Honiara Solomon Islands 8 30' 9 00' 8 9 9 30' 10 11 10 00' 12 19 10 11 12 13 14 1 1 1 19 00' 19 30' 10 00' 10 30' Figure 1. Location maps of the site. The map on the left shows the region. The map on the
Wind Power. Kevin Clifford METR 112 April 19, 2011
 Wind Power Kevin Clifford METR 112 April 19, 2011 Outline Introduction Wind Turbines Determining Wind Power Output The Price of Wind Power Wind Power Availability across the World and US California Wind
System Performance, Availability and Reliability Trend Analysis Portfolio Review 2016
 System Performance, Availability and Reliability Trend Analysis Portfolio Review 2 Published in March 217 SPARTA by numbers 2 TWh Produced by portfolio in reporting period 1 Number one First benchmarking
POWER YOUR FUTURE Universidade do Algarve - Faro. 7 th September 2007
 POWER YOUR FUTURE Universidade do Algarve - Faro Wave Energy The experience of wave energy in Portugal Eng.ª Sofia Patrício 7 th September 2007 Topics Wave Energy Resource Wave Energy in Portugal Wave
Recent developments in wave energy along the coast of southern Africa
 Recent developments in wave energy along the coast of southern Africa J. R. Joubert 1 and J. L. van Niekerk 2 1 Centre for Renewable Energy Studies, Mechanical & Mechatronic Engineering Department, Stellenbosch
PHYSICAL AND NUMERICAL MODELING OF THE WAVECAT WAVE ENERGY CONVERTER
 PHYSICAL AND NUMERICAL MODELING OF THE WAVECAT WAVE ENERGY CONVERTER Hernán Fernández 1, Gregorio Iglesias 1, Rodrigo Carballo 1, Alberte Castro 1 and Pedro Bartolomé 1 Wave energy presents a great potential
Whitney Hauslein Global War Wa ming
 Whitney Hauslein Global Warming The Ocean has only recently been used and tested as a new resource to be used as an alternative energy source. This seems awful late in forthcoming since the ocean covers
WIND SPEED LENGTH OF TIME WIND BLOWS (Duration) DISTANCE OVER WHICH IT BLOWS (Fetch)
 DISTANCE OVER WHICH IT BLOWS (Fetch)") WAVES Up and down movement of ocean surface Transportation of energy across the water over vast distances If not stopped by anything, waves can travel entire oceans Size and speed depend upon: WIND SPEED
WAVES Up and down movement of ocean surface Transportation of energy across the water over vast distances If not stopped by anything, waves can travel entire oceans Size and speed depend upon: WIND SPEED
WINDSPEED. Resultat og erfaringer med MSP. 26. september 2013 Hans Chr. Sørensen, SPOK ApS. Contract number: EIE/07/759/S
 WINDSPEED Resultat og erfaringer med MSP 26. september 2013 Hans Chr. Sørensen, SPOK ApS Contract number: EIE/07/759/S12.499460 www.windspeed.eu Background H C Sørensen Business and university background
Webinar: Trends in renewable energy support
 Webinar: Trends in renewable energy support Is the Spanish case a forerunner for the rest of the EU? Matthew Jones Senior Analyst EU Power & Carbon Anise Ganbold Senior Analyst EU Power & Carbon 12 July
Port Moresby. Papua New Guinea
 Port Moresby Papua New Guinea 00' 2 4 30' 6 8 00' 12 30' 142 144 146 148 150 152 154 156 146 30' 147 00' 147 30' 148 00' Figure 1. Location maps of the site. The map on the left shows the region. The map
Tidal Energy. Definition of Tidal Energy. Tidal energy is energy derived from the movement of the ocean tides.
 Tidal Energy Definition of Tidal Energy Tidal energy is energy derived from the movement of the ocean tides. Water has mass. When it moves, it has kinetic energy which can be harnessed. Kinetic energy
United Nations Conference on Trade and Development
 United Nations Conference on Trade and Development 11 th MULTI-YEAR EXPERT MEETING ON COMMODITIES AND DEVELOPMENT 15-16 April 2019, Geneva Saudi economic growth strategy on the face of oil price uncertainty
Nuku alofa. Tonga. A copy of this report is available at ' 21 00' 21 30' 22 00' ' ' ' '
 Nuku alofa Tonga 16 20 30' 18 21 00' 20 21 30' 176 174 172 22 00' 176 00' 175 30' 175 00' 174 30' Figure 1. Location maps of the site. The map on the left shows the region. The map on the right shows the
UK Energy Futures. Richard Smith Head of Energy Strategy & Policy
 UK Energy Futures Richard Smith Head of Energy Strategy & Policy September 2012 Our 2012 scenario development Jan. Feb. Mar. Apr. May Jun. Jul. Aug. Sep. Oct. Nov. Dec. Stakeholder workshops (London &
Taranaki Tsunami Inundation Analysis. Prepared for Taranaki Civil Defence Emergency Management Group. Final Version
 Taranaki Tsunami Inundation Analysis Prepared for Taranaki Civil Defence Emergency Management Group Final Version June 2012 AM 12/07 HBRC Plan Number 4362 Asset Management Group Technical Report Prepared
Rimatara. French Polynesia
 Rimatara French Polynesia 8 22 00' 16 22 30' 20 23 00' 24 23 30' 28 152 8 4 0 136 153 30' 153 00' 152 30' 152 00' Figure 1. Location maps of the site. The map on the left shows the region. The map on the
Portuguese Market Outlook up to 2040
 Portuguese Market Outlook up to 2040 POYRY A report to APREN Disclaimer The results and conclusions here presented are the outcome of an outsourced study developed by Pöyry, with APREN s guidance, but
Applicability and potential of wave power in China
 DEPARTMENT OF TECHNOLOGY AND BUILT ENVIRONMENT Applicability and potential of wave power in China Lihui Guo June 2010 Master s Thesis in Energy Systems 2 Preface This study was carried out as a final thesis
Technology and innovation challenges for UK Offshore Wind Energy Andrew Scott
 Technology and innovation challenges for UK Offshore Wind Energy Andrew Scott Offshore Wind Operations/Science Meets Industry, Bergen 2013 10 September 2013 2013 Energy Technologies Institute LLP The information
Norway s solution: Hywind- world s first full scale floating turbine Dr. Nenad Keseric Asset Manager/Specialist Statoil ASA MPR RE Operations
 Norway s solution: Hywind- world s first full scale floating turbine Dr. Nenad Keseric Asset Manager/Specialist Statoil ASA MPR RE Operations Strategy and Support Leveraging Statoil s offshore oil and
ASX Announcement. 27 February 2018 CETO Wave Energy Update
 ASX Announcement 27 February 2018 CETO Wave Energy Update Albany Wave Energy Project site specific design and development advances CETO 6 design, development and testing progress Significant European and
CHAPTER 6 DISCUSSION ON WAVE PREDICTION METHODS
 CHAPTER 6 DISCUSSION ON WAVE PREDICTION METHODS A critical evaluation of the three wave prediction methods examined in this thesis is presented in this Chapter. The significant wave parameters, Hand T,
Ocean Energy in Ireland
 Ocean Energy in Ireland Engineers Ireland, Midlands Region Fergus Sharkey, Technology Integration Engineer, ESB Ocean Energy 25 th February 2012 Agenda ESB and Ocean Energy Ocean Energy in Ireland Wave
DUKC Chart Overlay. Presentation to IHO TWL and DQ Working Groups Wollongong, March 2014
 DUKC Chart Overlay Presentation to IHO TWL and DQ Working Groups Wollongong, March 2014 Outline Who is OMC? DUKC description & methodology. DUKC Chart Overlay concept. Chart Overlay application example.
WAVE PREDICTIONS AT THE SITE OF A WAVE ENERGY CONVERSION ARRAY
 WAVE PREDICTIONS AT THE SITE OF A WAVE ENERGY CONVERSION ARRAY Jeffrey A. Oskamp 1 and H. Tuba, Özkan-Haller 2 The SWAN spectral wave model was applied to a domain along the coast of Oregon State, USA
IMPACTS OF COASTAL PROTECTION STRATEGIES ON THE COASTS OF CRETE: NUMERICAL EXPERIMENTS
 IMPACTS OF COASTAL PROTECTION STRATEGIES ON THE COASTS OF CRETE: NUMERICAL EXPERIMENTS Tsanis, I.K., Saied, U.M., Valavanis V. Department of Environmental Engineering, Technical University of Crete, Chania,
CROSS-SHORE SEDIMENT PROCESSES
 The University of the West Indies Organization of American States PROFESSIONAL DEVELOPMENT PROGRAMME: COASTAL INFRASTRUCTURE DESIGN, CONSTRUCTION AND MAINTENANCE A COURSE IN COASTAL DEFENSE SYSTEMS I CHAPTER
Technical Brief - Wave Uprush Analysis 129 South Street, Gananoque
 Technical Brief - Wave Uprush Analysis 129 South Street, Gananoque RIGGS ENGINEERING LTD. 1240 Commissioners Road West Suite 205 London, Ontario N6K 1C7 June 12, 2013 Table of Contents Section Page Table
Yellowknife Area Wind Potential
 Yellowknife Area Wind Potential Prepared for by Jean-Paul Pinard, P. Eng., PhD. 703 Wheeler St., Whitehorse, Yukon Y1A 2P6 Tel. (867) 336-2977; Email jpp@northwestel.net, and Annika Trimble (Ed.), Aurora
AN APPROACH TO WAVE ENERGY CONVERTER APPLICATIONS ON TURKEY AND THEIR ELECTRICITY GENERATION CAPACITY
 AN APPROACH TO WAVE ENERGY CONVERTER APPLICATIONS ON TURKEY AND THEIR ELECTRICITY GENERATION CAPACITY Abdi KUKNER 1 Akile Nese HALILBESE 2 Sertac BULUT 3 1 PhD, Professor, Department of Shipbuilding and
April 7, Prepared for: The Caribbean Disaster Emergency Response Agency Prepared by: CEAC Solutions Co. Ltd.
 April 7, 2006 Prepared for: The Caribbean Disaster Emergency Response Agency Prepared by: Introduction CEAC Solutions Co. Ltd was commissioned in May 2005 to prepare coastal beach erosion hazard maps for
Designing Wave Energy Converting Device. Jaimie Minseo Lee. The Academy of Science and Technology The Woodlands College Park High School, Texas
 Designing Wave Energy Converting Device Jaimie Minseo Lee The Academy of Science and Technology The Woodlands College Park High School, Texas Table of Contents Abstract... i 1.0 Introduction... 1 2.0 Test
Prediction of Nearshore Waves and Currents: Model Sensitivity, Confidence and Assimilation
 Prediction of Nearshore Waves and Currents: Model Sensitivity, Confidence and Assimilation H. Tuba Özkan-Haller College of Oceanic and Atmospheric Sciences Oregon State University, 104 Ocean Admin Bldg
The Importance of Getting Your Feet Wet: Field Measurements from the OPERA project Sam Weller and Lars Johanning
 The Importance of Getting Your Feet Wet: Field Measurements from the OPERA project Sam Weller and Lars Johanning Southampton 6 th July 2017 Wind Turbine Development Image: Molina (2011) Modelling and Control
DUXBURY WAVE MODELING STUDY
 DUXBURY WAVE MODELING STUDY 2008 Status Report Duncan M. FitzGerald Peter S. Rosen Boston University Northeaster University Boston, MA 02215 Boston, MA 02115 Submitted to: DUXBURY BEACH RESERVATION November
Wave energy converter effects on wave and sediment circulation
 Wave energy converter effects on wave and sediment circulation Grace Chang and Craig Jones Integral Consulting Inc. cjones@integral-corp.com; gchang@integral-corp.com Jesse Roberts, Kelley Ruehl, and Chris
FINANCING THE ENERGY TRANSITION
 FINANCING THE ENERGY TRANSITION CLEAN ENERGY INVESTMENT TRENDS: HISTORY AND PROSPECTS GUY TURNER CHIEF ECONOMIST PRESENTATION TITLE, DAY MONTH YEAR 1 CONTENTS 1. Global investment patterns to date 2. UK
Sustainable Energy Science and Engineering Center. Ocean Energy. Reference: Renewable Energy by Godfrey Boyle, Oxford University Press, 2004.
 Ocean Energy Reference: Renewable Energy by Godfrey Boyle, Oxford University Press, 2004. Ocean Energy Oceans cover most of the (70%) of the earth s surface and they generate thermal energy from the sun
SCIENCE OF TSUNAMI HAZARDS
 SCIENCE OF TSUNAMI HAZARDS ISSN 8755-6839 Journal of Tsunami Society International Volume 31 Number 2 2012 SEA LEVEL SIGNALS CORRECTION FOR THE 2011 TOHOKU TSUNAMI A. Annunziato 1 1 Joint Research Centre,
CHAPTER 8 ASSESSMENT OF COASTAL VULNERABILITY INDEX
 124 CHAPTER 8 ASSESSMENT OF COASTAL VULNERABILITY INDEX 8.1 INTRODUCTION In order to assess the vulnerability of the shoreline considered under this study against the changing environmental conditions,
JCOMM Technical Workshop on Wave Measurements from Buoys
 JCOMM Technical Workshop on Wave Measurements from Buoys Val Swail Chair, JCOMM Expert Team on Wind Waves and Storm Surges Neville Smith Vincent Cardone Peter Janssen Gerbrand Komen Peter Taylor WIND WAVES
The data inputs and assumptions underlying this Reference Case are described in the Assumptions Book.
 MEMORANDUM To: From: Caroline Garber, Chief, Environmental Studies Section, WI DNR Kris Krause, Co-Chair, GWTF Technical Advisory Committee George Edgar, Co-Chair, GWTF Technical Advisory Committee Glen
Rural Energy Conference Planning the Construction of Lake Dorothy Hydro By Tim McLeod President Alaska Electric Light and Power
 Rural Energy Conference Planning the Construction of Lake Dorothy Hydro By Tim McLeod President Alaska Electric Light and Power Under the provisions of the its tariff, a utility is obligated to provide
Waves. G. Cowles. General Physical Oceanography MAR 555. School for Marine Sciences and Technology Umass-Dartmouth
 Waves G. Cowles General Physical Oceanography MAR 555 School for Marine Sciences and Technology Umass-Dartmouth Waves Sound Waves Light Waves Surface Waves Radio Waves Tidal Waves Instrument Strings How
University of Leeds Travel Plan
 University of Leeds Travel Plan 2015-2018 Contents 1: Introduction 1.1 What is a Travel Plan? 1.2 Why do we need one? 1.3 Sustainability Strategy 2: Overview 2.1 The bigger picture 2.2 The City scale 2.3
WAVE FORECASTING FOR OFFSHORE WIND FARMS
 9 th International Workshop on Wave Hindcasting and Forecasting, Victoria, B.C. Canada, September 24-29, 2006 WAVE FORECASTING FOR OFFSHORE WIND FARMS Morten Rugbjerg, Ole René Sørensen and Vagner Jacobsen
Wave Dragon A slack moored wave energy converter
 Wave Dragon A slack moored wave energy converter J. P. KOFOED 1, P. FRIGAARD 1, H. C. SØRENSEN 2 and E. FRIIS-MADSEN 3 1 Hydraulics and Coastal Engineering Laboratory, Aalborg University, Aalborg, Denmark.
Recent Events in the Market for Canadian Snow Crab
 Recent Events in the Market for Canadian Snow Crab Overview The quantity of snow crab produced and exported by Canada increased dramatically through the late 1990s, but has levelled off and remained quite
Experiment of a new style oscillating water column device of wave energy converter
 http://www.aimspress.com/ AIMS Energy, 3(3): 421-427. DOI: 10.3934/energy.2015.3.421 Received date 16 April 2015, Accepted date 01 September 2015, Published date 08 September 2015 Research article Experiment
Coastal Wave Energy Dissipation: Observations and Modeling
 Coastal Wave Energy Dissipation: Observations and Modeling Jeffrey L Hanson US Army Corps of Engineers Field Research Facility USACE Field Research Facility Kent K. Hathaway US Army Corps of Engineers
Taking Stock: Building an Offshore Wind Research Agenda for the U.S. Industry
 Taking Stock: Building an Offshore Wind Research Agenda for the U.S. Industry Walt Musial Manager Offshore Wind National Renewable Energy Laboratory 2016 MRP Workshop December 15, 2016 Pioneering Offshore
Manufacturers continue capacity expansion as technology orders grow
 Contact: Penny Brown, AMT, 703-827-5275 pbrown@amtonline.org For Release: September 10, 2018 Manufacturers continue capacity expansion as technology orders grow Manufacturing technology orders for July
Influence of oceanographic processes on coastal erosion, morphology and inundation
 FACULTY OF ENGINEERING, COMPUTING AND MATHEMATICS Influence of oceanographic processes on coastal erosion, morphology and inundation Charitha Pattiaratchi School of Civil, Environmental and Mining Engineering
Pacific Pilotage Authority. submission to the. Canada Transportation Act Review Panel. January 2015
 Pacific Pilotage Authority submission to the Canada Transportation Act Review Panel January 2015 This submission is respectfully submitted to the Canada Transportation Act Review Panel by the Pacific Pilotage
Inuvik Wind Monitoring Update 2016
 Inuvik Wind Monitoring Update 2016 Source: MACA Prepared for By Jean Paul Pinard, P. Eng., PhD. 703 Wheeler St., Whitehorse, Yukon Y1A 2P6 Tel. (867) 336 2977; Email jpp@northwestel.net March 31, 2016
Safety Monitor Requirements. September 2012
 Introduction This document sets out Safety Monitors for the 2012/13 winter, pursuant to National Grid s obligations under the Uniform Network Code (UNC), Section Q. Safety Monitors were introduced in 2004
DETRMINATION OF A PLUNGER TYPE WAVE MAKER CHARACTERISTICE IN A TOWING TANK
 The 9 th International Conference on Coasts, Ports and Marine Structures (ICOPMAS 2010) 29 Nov.-1 Dec. 2010 (Tehran) DETRMINATION OF A PLUNGER TYPE WAVE MAKER CHARACTERISTICE IN A TOWING TANK sayed mohammad
EMPOWERING OFFSHORE WINDFARMS BY RELIABLE MEASUREMENTS
 EMPOWERING OFFSHORE WINDFARMS BY RELIABLE MEASUREMENTS Joerg Bendfeld University of Paderborn Fakultät Elektrotechnik, Mathematik und Informatik Lehrstuhl für Elektrische Energietechnik Pohlweg 55 D-33014
RESEARCH Massachusetts Recreational Boater Survey. Project Summary
 Coastal and Marine Spatial Planning RESEARCH Project Summary 2010 Massachusetts Recreational Boater Survey The 2010 Massachusetts Recreational Boater Survey gathered spatial and economic data relating
PUV Wave Directional Spectra How PUV Wave Analysis Works
 PUV Wave Directional Spectra How PUV Wave Analysis Works Introduction The PUV method works by comparing velocity and pressure time series. Figure 1 shows that pressure and velocity (in the direction of
WindProspector TM Lockheed Martin Corporation
 WindProspector TM www.lockheedmartin.com/windprospector 2013 Lockheed Martin Corporation WindProspector Unparalleled Wind Resource Assessment Industry Challenge Wind resource assessment meteorologists