CONTENTS. The consultant team for this study included: 292 Design Group Ballard*King and Associates RJM Construc!on Reengineered
|
|
|
- Brandon Francis
- 5 years ago
- Views:
Transcription

1 Family Aquatic Center Study Brooklyn Park, Minnesota May 23, 2018 DRAFT
2 CONTENTS Statement of Purpose & Scope of Work Execuve Summary ES1 Process 1 Demographic & Market Analysis 2 Concept Opons Overview 43 Facility Components 44 Sites 47 Opera!ons Assump!ons 48 Concept Op!on Diagrams & Summaries 49 Appendix Opera!ng Projec!on Details 74 Building Programs 125 Teen Workshop/April Community Workshop/April Community Mee!ng Presenta!on/April Cost Es!ma!ng Breakdown 145 Cost Es!ma!ng Clarifica!ons and Excluded Costs 147 The consultant team for this study included: 292 Design Group Ballard*King and Associates RJM Construc!on Reengineered Thank you to city staff, stakeholders and community members for their input and feedback. Their contribu!ons were invaluable.
3 Why the Aquac Study? The development of a Family Aquac Center in the City of Brooklyn Park was one of the top five priories the community idenfied as part of the 2018 Parks and Recreaon System Plan process. In order to be er understand the type of aquac facility, its components, programs and cost to construct along with the long-term financial business plan and what impact it would have on the City and the community a feasibility study was needed. The feasibility study would provide policy makers and staff the research and business analysis necessary to inform decision makers on the best approach to addressing this recreaon facility gap in the community. The City of Brooklyn Park released a Request for Proposal (RFP) for qualified aquac/architectural/engineering consultant firms to conduct a feasibility study and entered into a professional services agreement with 292 Design Group. The feasibility study purpose was to: Develop mulple opons (concept plans) for improvements to the exisng Community Acvity Center, (CAC) which included: Addi!on of a Family Aqua!c Facility (recrea!on and lesson pools) and front entry remodel (living room) Addi!on of a Family Aqua!c Facility (recrea!on and lesson pools) and other recrea!on facility components (gymnasium, fitness center), and front entry remodel (living room) Recrea!on facility addi!ons (gymnasium, fitness center) and front entry remodel (living room) One (1) concept plan for a free standing Community Aquac Facility that includes a 50 meter pool, recreaon and lesson pool within the City, with the interest in working with third party lease(s) for a locaon yet to be determined; and To conduct the Market Feasibility Research, determine operaon and financial analysis (Proforma) for each of the prepared concepts and research and assess operaonal/management and/ or possible partnership models for successful operaons. The outcomes of the Feasibility Study will inform future community polling that will further validate how an aquac facility fits within the broader priories of the community and their willingness to pay for an aquacs facility and/or other priority investments within the broader park system.
4 [This page le inten onally blank]


5 EXECUTIVE SUMMARY PROCESS The feasibility study was conducted over approximately three months. Input was gathered from city staff, stakeholders, and the community. Building programs a list of proposed spaces and their square footages were created to guide subsequent concept development. A series of concepts were created to explore the impact of the proposed facili"es on the sites, site and building entry, parking and space adjacencies. The concept op"ons were revised as feedback was gathered from the community, City staff and stakeholders. Community engagement was an important part of the study process. A variety of community and stakeholder mee"ngs were held including one-on-one interviews, design workshops and community at-large mee"ngs. The feedback from the community engagement process resulted in the explora"on of concept op"ons not iden"fied earlier in the process. A Family Aqua"c Facility (recrea"on and lesson pools), 50 meter pool with support facili"es, recrea"on facility addi"ons (gymnasium, fitness center and front entry remodel (living room) at the CAC loca"on. A free-standing Community Aqua"c Facility with a 50-meter pool, lesson pool and therapy pool, within the City and in partnership with a third party lease(s), for a loca"on yet to be determined. CONCEPT OPTIONS Facility Components Proposed facility components were based on feedback from city staff, stakeholders the community and demographic/ market analysis informa"on. Major components contained in the concept op"ons include: Leisure Pool: A zero-depth entry pool with spray features and a water slide that is used for recrea"on. Lesson/lap pool: A 25-yard pool for lessons, lap swimming and aqua"c exercise. 50-meter pool: A 50-meter by 25-yard pool for compe""ve swimming, lap swimming and, depending upon depth, aqua"c exercise. Therapy pool: A warm water pool for rehabilita"on and exercise New Main Entry from Edinbrook Terrace Outdoor splashpad: An outdoor area with spray features and no standing water. Gymnasium: A mul"-purpose space sized to include a full-size basketball court and cross-courts. Includes a walking/running track above. Fitness Areas: Including space for group (fitness studios) and individual fitness (open cardio and weight area) Living room: The central gathering space with concessions, public restrooms and lounge/sea"ng space. Locker room: Includes men s and women s locker rooms and all gender (or family) locker rooms. Offices: Include facility or Recrea"on and Parks department offices. Sites Concept op"ons were developed for two sites: at the exis"ng CAC and at a new, to-be-determined site. Concepts op"ons at the CAC illustrated the proposed facili"es as an addi"on to the exis"ng building. Concepts at the new site were developed to determine the approximate square footage necessary for the proposed facili"es 12.5 to 15 acres. A significant change was proposed at the CAC site. Given the loca"on of parking and the poten"al for increased programming of the outdoor space to the south of the building, the concept op"ons at the CAC show the main entry drive shi%ing north to the exis"ng entry at Edinbrook Terrace. The main entry drive off of 85th would be eliminated, although access from 85th to parking on the east side of the CAC would remain. The proposed addi"on s main entry would also shi% to the north, adjacent to the majority of parking. This removed vehicular traffic from the south of the exis"ng building and provides opportuni"es to create connec"ons between the CAC interior spaces and exterior green space. Building Main Entry Exis!ng CAC Event green space/garden/ Sunfish Pond Exis!ng Entry from 85th Avenue to parking on the east BROOKLYN PARK FAMILY AQUATIC CENTER FEASIBILITY STUDY ES1
6 CONCEPT OPTIONS Project Cost The Project Development Costs presented in this report are intended to provide the City of Brooklyn Park with the comprehensive costs to develop each specific op!on. Should the city elect to develop any of the possible six op!ons, the city should feel confident that the costs are adequate to complete the project. These costs include: Es!mated cost of the construc!ng of the building Es!mated cost of site work including parking, drives and walks, and site improvements, such as landscaping A one-year infla!on escala!on factor An Owner con!ngency An allowance for fixtures, furnishings, and equipment Design and engineering fees Special inspec!on and tes!ng fees Specifically, not included in the cost es!mates are the costs of purchasing the land required for Op!ons 4 and 6 and any poten!al unusual costs that these sites may have. These include poor soils or other problems not found on typical sites. Also not included ni the costs es!mates for Op!ons 1, 2, 3, and 5 is the purchasing of the library property from Hennepin County. It is also important to note that these Project Development Costs do not include the cost of financing the project (debt payments) or annual opera!ng cost projec!ons. See the Appendix on Project Development Costs for more details on the descrip!on of the Project Costs for each Op!on. DEMOGRAPHICS/MARKET/OPERATIONS Demographics B*K accesses demographic informa!on from Environmental Systems Research Ins!tute (ESRI) who u!lizes 2010 Census data and their demographers for projec!ons. In addi!on to demographics, ESRI also provides data on housings, recrea!on, and entertainment spending and adult par!cipa!on in ac!vi!es. B*K also uses informa!on produced by the Na!onal Spor!ng Goods Associa!on (NSGA) to overlay onto the demographic profile to determine poten!al par!cipa!on in various ac!vi!es. For purposes of the study, B*K worked with the City and iden!fied two service areas; primary service area City of Brooklyn Park, secondary service area 5-mile radius from the current CAC. Because a 50M pool is one of the op!ons being considered a larger regional service area was also iden!fied and B*K provided key demographic indicators for that area. The key demographic indicators that B*K looks at are median age, median income and current spending on housing and entertainment/recrea!on services. The median age in the City of Brooklyn Park is less than the State, Na!onal, Regional and Secondary Service Areas. This lower median age points to the presence of families with children, a primary user of aqua!c and recrea!on facili!es. While this is important to note, it is equally important to note that swimming as an ac!vity is one that reaches the full age spectrum. As such, most aqua!c centers, especially those trying to achieve a maximum cost recovery are mul!-genera!onal with mul!-bodies of water at mul!ple temperatures. To further emphasize the presence of families, according to the 2010 Census 41.0% of household in the City had children present. The median household income in the City is comparable to all the services areas iden!fied, and all of those are slightly greater than the Na!onal number. This informa!on becomes important when the City begins to make decisions on price point and general cost recovery philosophy. It is also important to balance the median household income for the areas with the cost of living. consistent with the median household income. However, it does not take into account the tax rate of the City, which is higher than some of its surrounding neighbor communi!es. The age distribu!on for the City of Brooklyn Park and that of the Secondary Service Area further underscore the presence of children, in par!cular in comparison to na!onal sta!s!cs. It is also important to note that almost all age categories are an!cipated to see increases through This points to growth, but with the understanding that the City is land locked and will reach build out in the not-so-distant future. A dis!nguishing characteris!c of the City and to a lesser extent the Secondary Service Area is the diversity. Within the City almost 25.7% of the popula!on iden!fies through the Census as Black and 18.1% in the Secondary Service Area. Based on sta!s!cs provided by the Na!onal Spor!ng Goods Associa!on (NSGA) we know that as the diversity increases in the Black and Hispanic popula!on the rates of par!cipa!on can fluctuate. The diversity in the City points to the need for more leisure focused water with an emphasis on instruc!onal programs, socializa!on opportuni!es and water play. While the City cannot drown-proof it s popula!on the ability to offer an invi!ng community aqua!c center that addresses the needs of the majority of residents allows the City, at minimum, to raise aqua!c awareness. The Tapestry Segmenta!on that B*K provides as part of the demographic analysis helps further describe the City and various subsets of popula!on, outside of race and ethnicity, that are present within the community. Demographic Conclusion: It is the opinion of B*K that the demographics of the City (primary service area) would welcome a community focused aqua!c center. Because of the diversity within the community, it will be important to con!nue to engage residents about the types of programs that could be offered, and the type of environment needed to accommodate all poten!al user groups. Par!cipa!on Sta!s!cs As previously referenced, B*K uses sta!s!cs produced annually by the Na!onal Spor!ng Goods Associa!on (NSGA). At the!me the study was ini!ated the most recent data gathered was in 2016 and appeared in the 2017 NSGA Report. The NSGA collects par!cipa!on data by age group, median household income, regional of the country and na!onally. This informa!on allows B*K to use the demographics of the City (primary service area) and develop a unique par!cipa!on percentage for swimming and other related ac!vi!es. Based on this informa!on one can assume that approximately 15.2% of individuals within the City par!cipate in swimming, making it one of the top 5 ac!vi!es par!cipated in by residents. The only ac!vi!es with a greater par!cipa!on percentage in the City are; Exercise Walking (36.8%), Exercise w/ Equipment (20.3%), Aerobic Exercising (16.3%) and Running/Jogging (16.1%). Swimming as an ac!vity, and based on B*K s years of experience doing similar studies, typically falls in the top 5 of most community profiles. The significant rate of par!cipa!on in these other ac!vi!es also points to the opportunity to include non-aqua!c components in the facility. This will increase the overall appeal of the facility, which in turn will provide further opportunity for the facility to get closer to a 100% cost recovery level. For swimming specifically, 15.2% of the popula!on equates to 10,122, 11,138, and 11,750 par!cipants in 2010, 2017, and 2022 respec!vely. Within that 15.2% of swimmers there are further defini!ons of swimming that iden!fy frequent (6.8%), occasional (42.0%) and infrequent (51.2%) levels of par!cipa!on. Using the rates of par!cipa!on for these categories and applying it to the 2017 swimming popula!on, B*K is able to determine that there is approximately 483,780 swimming days or pool visits within the City of Brooklyn Park. This is a significant number and points to the City being able to sustain a community recrea!on center. The cost of living within the City of Brooklyn Park is almost iden!cal to that of the State of Minnesota when you look at Spending Poten!al Index for Housing and Entertainment & Recrea!on Services. This informa!on is important and BROOKLYN PARK FAMILY AQUATIC CENTER FEASIBILITY STUDY ES2
7 EXECUTIVE SUMMARY It is also important to note that each of categories of swimming; frequent, occasional and infrequent par!cipants are looking for different experiences from their aqua!c facility. Frequent swimmers are looking for lap lane, deep water compe!!on and cooler water temperatures. These desires are consistent with the compe!!ve swimming community and mul!-sport athletes. This group of par!cipants would be strong proponents of a 50M pool complex. Occasional swimmers are looking for a variety of ameni!es. Those that ride the line of being frequent par!cipants have much of the same wants. However, as you make your way to the mid-point the want changes to shallow water, instruc!onal programs/exercise and warmer water temperatures. This becomes more consistent with the instruc!onal pool, therapy pool and leisure pool concept. The last group, and by far the largest, are visi!ng pools for the relaxa!on and social opportuni!es. They are not interested in deep water or lap lanes, but rather shallow warm water and entertainment, which aligns with the leisure pool concept. Trends Non-Aqua!cs (Indoor): Across the country B*K is seeing more communi!es get in the business of offering fitness and wellness opportuni!es to the public. While there is some concern from the private sector, there is significant antecdotal evidence that suggests, community fitness and wellness facili!es become gateways to the private sector. There is a significant por!on of the public, for varying reasons that will simply not use a private fitness facility. However, those same individuals are much more prone to use public facili!es, un!l their fitness rou!ne outgrows the public offerings, as which!me they transi!on to the private market. Another area of need, in par!cular given the geographic loca!on of Brooklyn Park is that of gymnasium space and mul!-puprose indoor ac!vity space. At one!me school district facili!es served this need, but as school programs and security have increased, the availability of these spaces has decreased. The result is communi!es developing indoor community recrea!on centers with fitness, group exercise, gymnasium and indoor walking/jogging opportuni!es. A common component that is then added is aqua!cs. Aqua!cs (Indoor): Outside of ice arenas, indoor aqua!c facili!es, regardless of design or components are some of the most expensive to build and operate. Like ice arenas they are a 24-hour a day opera!on, the circula!on pumps and chemical feeders do not turn off if they are not being used. As such, when developing aqua!c facili!es it is important to include components with vast appeal so as to maximize use and revenue poten!al. Common components that are discussed when developing an aqua!c center include: Compe!!ve Venues. These facili!es can vary in range from a 25Y lap pool to a 50M compe!!ve aqua!c venue. They are tradi!onally rectangle shaped bodies of water with varying depths. If a lap pool is being used for instruc!onal purposes one will typically find more shallow (less than 5 feet) water, with warmer (86-88 degrees) temperatures. Those facili!es that are meant to accommodate compe!!ve aqua!cs tend to be deeper (6-8 feet), with cooler (78-80 degrees) water temperatures. A tradi!onal 25Y lap pool can serve many needs of the public and get close to a cost recovery level, while a 50M lap pool narrows the popula!on willing to use the facility and comes with a significantly higher opera!ng costs. Most 50M pools that report to be 100% cost recovery are found in the south and southwest and are not typically indoor facili!es. Leisure Pools. These facili!es are typically referred to as indoor water parks and can be sizable depending on ameni!es. Common components include a zero depth entry, current channel of some variety, play features and 1-2 water slides. These bodies of water tend to be warmer (86-88 degrees) and have a broad appeal to the swimming popula!on. The challenge with these facili!es, is that because of their components they typically have a higher cost to operate with respect to part-!me staffing (lifeguards). However, because of their broad appeal, they typically generate more revenue and come closer to a 100% cost recovery level, especially when combined with other dry components. Therapy Pools. There is an increased development of therapy pools across the country. A therapy pool can vary in size from an 8 x 8 to a 30 x 30 body of water. The benefit of the therapy pool is significantly warmer water (94-98 degrees), which allows for a wide range of programming which could be tradi!onal therapy specific, to swim lessons. There are other trend footnotes that are important to include when discussing aqua!cs. Typically stand-alone aqua!c facili!es, no dry components included, struggle in most cases to recover 100% of their opera!ng costs. 50M compe!!ve venues, while costly to operate and difficult to recover 100% of opera!ng costs, can have a significant posi!ve economic impact on the community. An organiza!on cannot achieve such an economic impact from a lap pool, leisure pool or therapy pool. Facility Recommenda!ons Based on the demographic reali!es of the City, combined with the par!cipa!on percentages and trends, B*K would recommend the following as the City moves forward. 1. The City should look to develop a full service recrea!on facility that includes both dry and wet components. 2. The dry components should include lobby, gymnasium, fitness, group exercise space, offices and circula!on. 3. The wet components should include a 25Y lap pool for fitness and instruc!onal purposes, and a leisure pool with zero depth entry, current channel, play structure and other interac!ve components. Addi!onally, there should be locker rooms, family changing rooms and associated locker space M Pool. B*K would not recommend that the City pursue an indoor 50M pool at this!me. To pursue such a facility the City would need to be prepared to operate the facility and have long term contacts with local swim clubs, which guaranteed lap lane rental and meet revenue. While such a 50M pool would have a posi!ve economic impact on the area, there is no guarantee that said economic impact would be Brooklyn Park specific. It is also important to note that the development of a 50M pool would not guarantee compe!!ve events, as those would enter a compe!!ve bidding process with exis!ng facili!es like those as the University of Minnesota and Rochester, plus addi!onal providers in the region. Opera!onal Reali!es Based on the informa!on gathered in the feasibility process, combined with the public input the City had already received, 292 Design Group provided 6 different models for considera!on. B*K then used informa!on gathered in the market study and heir history of opera!ng aqua!c centers to develop an opera!onal plan. From plan to plan there are consistencies as it relates to hours of opera!on, staffing levels, and rates for programs and services. It is important to note that these opera!onal opinions are based on the best informa!on available at the!me of the study. It is also important to note that B*K takes a conserva!ve approach to developing these figures, which is to say that the City as the operator could achieve efficiencies in staffing and other expenses and could poten!ally increase revenue projec!ons. It is equally important to note that these projects are reflec!ve of a year 1 opera!on and do not project satura!on in programming, rentals or meets. BROOKLYN PARK FAMILY AQUATIC CENTER FEASIBILITY STUDY ES3


 ($168,334) ($152,428) ($157,001) Recovery % 84% 89% 92% 93% 93% The aqua\"c components are indica\"ve of what residents would want in a facility The 50M pool would address the needs of the")

")
8 Op!on 1: Family Aqua!c Center at CAC Project Construc!on Cost: $23.6 M 6-lane 25Y lesson/lap pool Leisure pool Outdoor splashpad Locker rooms Offices Living room/lobby Concessions Category Year 1 Year 2 Year 3 Year 4 Year 5 Expenses $1,181,909 $1,193,728 $1,217,602 $1,241,954 $1,279,213 Revenues $710,699 $760,447 $798,470 $822,424 $847,097 Difference ($471,210) ($433,280) ($419,132) ($419,530) ($432,116) Recovery % 60% 64% 66% 66% 66% The aqua"c components are indica"ve of what residents would want in a facility. The challenge with the opera"ons is that there are no dry-side components, which allow for an increase in membership rates. 50M Compe!!ve pool 6-lane 25Y lesson/lap pool Leisure pool Outdoor splashpad Locker rooms Offices Living room/lobby Concessions Op!on 4: Family Aqua!c Center/50 Meter Pool at New Site Project Construc!on Cost: $31.8 M Category Year 1 Year 2 Year 3 Year 4 Year 5 Expenses $2,034,180 $2,054,522 $2,095,612 $2,137,525 $2,201,650 Revenues $1,715,424 $1,835,503 $1,927,278 $1,985,097 $2,044,650 Difference ($318,757) ($219,019) ($168,334) ($152,428) ($157,001) Recovery % 84% 89% 92% 93% 93% The aqua"c components are indica"ve of what residents would want in a facility The 50M pool would address the needs of the regional compe""ve aqua"c community. Because the facility is only an aqua"c center, the daily admission rates and the membership rates are more in line with those of Model #1. Note: This facility could have close to a $2.3 million economic impact on the area, less hotel rooms, if it is able to secure the number of meets reflected in the proforma. However, B*K believes that the penetra"on rates for meets and the rental associated with prac"ce "me is aggressive. Op!on 2: Family Aqua!c Center/Gym/Fitness at CAC Project Construc!on Cost: $29.5 M Category Year 1 Year 2 Year 3 Year 4 Year 5 Expenses $1,538,999 $1,554,389 $1,585,476 $1,617,186 $1,665,702 Revenues $1,316,513 $1,408,668 $1,479,102 $1,523,475 $1,569,179 Difference ($222,486) ($145,720) ($106,375) ($93,711) ($96,522) Recovery % 86% 91% 93% 94% 94% The aqua"c components are indica"ve of what residents would want in a facility. The dry-side components allow for more programs and for membership rates to see a significant increase. Op!on 5: Gym/Fitness at CAC Project Construc!on Cost: $12.5 M Category Year 1 Year 2 Year 3 Year 4 Year 5 Expenses $675,421 $682,175 $695,818 $709,735 $731,027 Revenues $564,333 $603,837 $634,028 $653,049 $672,641 Difference ($111,087) ($78,338) ($61,790) ($56,685) ($58,386) Recovery % 84% 89% 91% 92% 92% 6-lane 25Y lesson/lap pool Leisure pool Outdoor splashpad Locker rooms Offices Living room/lobby Concessions Gymnasium (with walking track) Fitness (group & individual) Locker rooms Offices Living room/lobby Concessions Gymnasium (with walking track) Fitness (group & individual) This model has the highest rate of cost recovery level, and the smallest deficit, but it does not have any aqua"c components included in the facility. The rates for such a facility are greater than that of Model #4, but not the same as illustrated in Models #2 or #3, because it is not a full-service facility with the lack of aqua"cs. EXECUTIVE SUMMARY Op!on 3: Family Aqua!c Center/Gym/Fitness/50 Meter Pool at CAC Project Construc!on Cost: $41.4 M Category Year 1 Year 2 Year 3 Year 4 Year 5 Expenses $2,307,555 $2,330,630 $2,377,243 $2,424,788 $2,497,532 Revenues $2,181,330 $2,334,023 $2,450,724 $2,524,246 $2,599,973 Difference ($126,225) $3,393 $73,481 $99,458 $102,442 Recovery % 95% 100% 103% 104% 104% This model addresses the aqua"c needs of the public, the lack of compe""ve aqua"c space in the regional, and includes dry-side components which allow for more programs and for membership rates to see a significant increase. Note: This facility could have close to a $2.3 million economic impact on the area, less hotel rooms, if it is able to secure the number of meets reflected in the proforma. However, B*K believes that the penetra"on rates for meets and the rental associated with prac"ce "me is aggressive. Op!on 6: 50 Meter Pool at New Site Project Construc!on Cost: $24.5 M Category Year 1 Year 2 Year 3 Year 4 Year 5 Expenses $1,656,080 $1,672,641 $1,706,093 $1,740,215 $1,792,422 Revenues $1,537,285 $1,614,149 $1,678,715 $1,712,290 $1,746,535 Difference ($118,795) ($58,491) ($27,378) ($27,926) ($45,887) Recovery % 93% 97% 98% 98% 97% 50M Compe""ve pool 6-lane 25Y lesson/lap pool Leisure pool Outdoor splashpad Locker rooms Offices Living room/lobby Concessions Gymnasium (with walking track) Fitness (group & individual) 50M Compe!!ve pool Therapy pool 6-lane 25Y lesson/lap pool Leisure pool Locker rooms Offices Living room/lobby Concessions The aqua"c components are not indica"ve of what the residents want in a community aqua"c center. The inclusion of a 50M pool would address the needs of the regional compe""ve aqua"c community. The inclusion of a therapy pool would open the City to a unique market, but the elimina"on of the leisure pool would decrease the overall appeal of the facility to the public. Note: This facility could have close to a $2.3 million economic impact on the area, less hotel rooms, if it is able to secure the number of meets reflected in the proforma. However, B*K believes that the penetra"on rates for meets and the rental associated with prac"ce "me is aggressive. BROOKLYN PARK FAMILY AQUATIC CENTER FEASIBILITY STUDY ES4


9 PROCESS The feasibility study was conducted over approximately three months and involved a series of activities that were iterative in nature - meaning that the information gathering in subsequent phases of the process prompted revisions in previous work to reflect the additional feedback. The process included the following phases as outlined below. Stakeholder Input Information about community needs and preferences was gathered from City staff and stakeholders. Facility Program Development Facility programs lists of proposed spaces and their associated square footages were created to guide concept development for the various options Concept Options A series of concept options were created that explored issues such as fit on the site, entry, parking, adjacencies of facility spaces, etc. The options were revised as feedback was gathered from the community, City staff and stakeholders. Construction Cost Estimates Construction cost estimates were prepared for each concept option. Draft/Final Report A report document compiling results of the study was created and reviewed by City staff. The final report document was presented to the City Council. Mar April May = Feb 26 Demographic & Market Analysis The demographics and market conditions were analyzed. Operations Analysis Operations proformas were prepared for each concept option Community Workshops/Meetings Community Engagement Efforts Involving the community and gathering community feedback about what types of aquatic amenities were desired was an important part of the feasibility study process. City staff and the consultant team, in partnership with the City s Community Engagement Team, conducted a variety of stakeholder and community engagement meetings that included 1) a series of one-on-one meetings with multiple stakeholder groups and potential partners; 2) two community design workshops (one with youth); and 3) two community at-large meetings that gathered community feedback regarding multiple draft concept plans. Exploring additional options This community engagement process resulted in development of an additional concept not identified at the onset of the feasibility study process. Addition of a Family Aquatic Facility (recreation and lesson pools), 50 meter pool with support facilities, recreation facility additions (gymnasium, fitness center and front entry remodel (living room) at the CAC location. The community was interested in putting all recreation opportunities at a single location to create a hub of activity that the community could take pride in and that provided economic development opportunities for the City. Furthermore, an additional concept was developed after presentation of the market analysis and concept option proformas (5) at a City Council Work Session. This concept includes the: Development of a concept plan for a free-standing Community Aquatic Facility that includes a 50-meter pool, lesson pool and therapy pool within the City, in partnership with a third party lease(s), and for a location yet to be determined. BROOKLYN PARK - FAMILY AQUATIC CENTER FEASIBILITY STUDY 1
10 DEMOGRAPHIC & MARKET ANALYSIS Market Assessment Ballard*King & Associates (B*K) has been hired as part of a larger project team, led by 292 Design Group to perform a market assessment for the City Brooklyn Park, MN. The focus of the study is two-fold; first, determine what aquatic and non-aquatic amenities could be added to the Community Activity Center (CAC), second, the viability of a stand-alone aquatic operation with the main component being a 50M indoor pool. B*K accesses demographic information from Environmental Systems Research Institute (ESRI) who utilizes 2010 Census data and their demographers for projections. In addition to demographics, ESRI also provides data on housings, recreation, and entertainment spending and adult participation in activities. B*K also uses information produced by the National Sporting Goods Association (NSGA) to overlay onto the demographic profile to determine potential participation in various activities. Service Areas: The first focus of the study is how to address the aquatic needs of the residents of Brooklyn Park. As such the Primary Service Area for the study is the City boundaries. Additionally, a Secondary Service Area has been identified as a 5-mile radius from the current facility location. The Secondary Service Area extends to Coon Rapids the North, Fridley to the East, Robbinsdale to the South and Maple Grove to the West. Finally, a Regional Service Area has been identified for purposes of the study, which is a 30-minute drive time from the current facility. The Regional Service Area is where B*K identified other aquatic facilities that help determine the overall market for aquatic services. The Regional Service Area is also an estimate of the distance that competitive swimmers may travel to practice at an indoor 50M pool. B*K defines Primary Service Areas as the distance individuals are willing to travel on a weekly basis to use facility and programs. B*K defines Secondary Service Areas as the distance people will travel on a less frequently basis (2-3 times per month) to utilize recreation facilities. Service areas can expand, or contract based upon a facility s proximity to major thoroughfares and the market in which they reside. A 50M pool greatly expands a primary and secondary service area as there are so few available. Other factors impacting the use as it relates to driving distance are the presence of alternative service providers in the service area. Alternative service providers can influence membership, daily admissions and the associated penetration rates for programs and services. 2 BROOKLYN PARK - FAMILY AQUATIC CENTER FEASIBILITY STUDY 1 1% of total revenue generation.
11 DEMOGRAPHIC & MARKET ANALYSIS Demographic Summary Population: Households: Families: Primary Service Area Brooklyn Park, MN Secondary Service Area Regional Area 2010 Census 75, , ,662, Estimate 82, ,299 1,794, Estimate 87, ,757 1,884, Census 26,229 80, , Estimate 28,235 85, , Estimate 29,588 89, , Census 18,763 54, , Estimate 20,128 58, , Estimate 21,054 60, ,248 Average Household Size: 2010 Census Estimate Estimate Ethnicity (2017 Estimate): Median Age: Median Income: Hispanic 6.4% 6.4% 6.3% White 48.0% 62.7% 72.4% Black 25.7% 18.1% 1.8% American Indian 0.5% 0.6% 0.8% Asian 18.1% 11.3% 8.5% Pacific Islander 0.0% 0.0% 0.0% Other 3.6% 3.2% 2.9% Multiple 4.0% 4.0% 3.6% 2010 Census Estimate Estimate Estimate $65,572 $63,378 $66, Estimate $71,569 $68,925 $74,911 1 From the Census, Brooklyn Park, MN experienced a 12.5% increase in population. 2 From the Census, the Secondary Service Area experienced a 4.1% increase in population. BROOKLYN PARK - FAMILY AQUATIC CENTER FEASIBILITY STUDY 3

12 DEMOGRAPHIC & MARKET ANALYSIS Age and Income: The median age and household income levels are compared with the national number as both of these factors are secondary determiners of participation in recreation activities. The lower the median age, the higher the participation rates are for most activities. The level of participation also increases as the median income level goes up. Table A Median Age 2010 Census 2017 Projection 2022 Projection City of Brooklyn Park Secondary Service Area Regional Service Area State of Minnesota Nationally Chart A Median Age: The median age in Brooklyn Park and the Secondary Service Area is less than the State of Minnesota and the National number. A lower median age typically points to the presence of families with children. The following chart provides the number of households and percentage of households in Brooklyn Park and the Secondary Service Area with children. Table B Households w/ Children Number of Households w/ Children Percentage of Households w/ Children City of Brooklyn Park 10, % Secondary Service Area 28, % Regional Service Area 201, % State of Minnesota 658, % The information contained in Table-B helps further outline the presence of families with children. As a point of comparison in the 2010 Census, 33.4% of households nationally had children present. 4 BROOKLYN PARK - FAMILY AQUATIC CENTER FEASIBILITY STUDY

13 DEMOGRAPHIC & MARKET ANALYSIS Map A Median Age by Block Group BROOKLYN PARK - FAMILY AQUATIC CENTER FEASIBILITY STUDY 5

14 DEMOGRAPHIC & MARKET ANALYSIS Table C Median Household Income: 2017 Projection 2022 Projection City of Brooklyn Park $65,572 $71,569 Secondary Service Area $63,378 $68,925 Regional Service Area $66,546 $74,911 State of Minnesota $63,470 $71,939 Nationally $54,149 $59,476 Chart B Median Household Income: 6 BROOKLYN PARK - FAMILY AQUATIC CENTER FEASIBILITY STUDY

15 DEMOGRAPHIC & MARKET ANALYSIS Based on 2017 projections for median household income the following narrative describes the service areas: In the City of Brooklyn Park, the percentage of households with median income over $50,000 per year is 63.1% compared to 55.9% on a national level. Furthermore, the percentage of the households in the service area with median income less than $25,000 per year is 14.0% compared to a level of 21.5% nationally. In the Secondary Service Area, the percentage of households with median income over $50,000 per year is 62.5% compared to 55.9% on a national level. Furthermore, the percentage of the households in the service area with median income less than $25,000 per year is 15.0% compared to a level of 21.5% nationally. In the Regional Service Area, the percentage of households with median income over $50,000 per year is 62.8% compared to 55.9% on a national level. Furthermore, the percentage of the households in the service area with median income less than $25,000 per year is 16.9% compared to a level of 21.5% nationally. While there is no perfect indicator of use of an indoor recreation facility, the percentage of households with more than $50,000 median income is a key indicator. Therefore, those numbers are significant and balanced with the overall cost of living. Chart C Median Household Income Distribution BROOKLYN PARK - FAMILY AQUATIC CENTER FEASIBILITY STUDY 7

16 DEMOGRAPHIC & MARKET ANALYSIS Map B Household Income by Block Group 8 BROOKLYN PARK - FAMILY AQUATIC CENTER FEASIBILITY STUDY
17 DEMOGRAPHIC & MARKET ANALYSIS In addition to taking a look at Median Age and Median Income, it is important to examine Household Budget Expenditures. In particular, reviewing housing information; shelter, utilities, fuel and public services along with entertainment & recreation can provide a snapshot into the cost of living and spending patterns in the services areas. The table below looks at that information and compares the service areas. Table D Household Budget Expenditures 1 : City of Brooklyn Park SPI Average Amount Spent Percent Housing 107 $22, % Shelter 108 $17, % Utilities, Fuel, Public Service 102 $5, % Entertainment & Recreation 105 $3, % Secondary Service Area SPI Average Amount Spent Percent Housing 102 $21, % Shelter 103 $16, % Utilities, Fuel, Public Service 98 $4, % Entertainment & Recreation 100 $3, % Regional Service Area SPI Average Amount Spent Percent Housing 116 $24, % Shelter 118 $19, % Utilities, Fuel, Public Service 111 $5, % Entertainment & Recreation 113 $3, % State of Minnesota SPI Average Amount Spent Percent Housing 106 $22, % Shelter 106 $17, % Utilities, Fuel, Public Service 108 $5, % Entertainment & Recreation 108 $3, % SPI: Spending Potential Index as compared to the National number of 100. Average Amount Spent: The average amount spent per household. Percent: Percent of the total 100% of household expenditures. Note: Shelter along with Utilities, Fuel, Public Service are a portion of the Housing percentage. 1 Consumer Spending data are derived from the 2014 and 2015 Consumer Expenditure Surveys, Bureau of Labor Statistics. ESRI forecasts for 2017 and BROOKLYN PARK - FAMILY AQUATIC CENTER FEASIBILITY STUDY 9
18 DEMOGRAPHIC & MARKET ANALYSIS Chart D Household Budget Expenditures Spending Potential Index: The total number of housing units in Brooklyn Park is 27,841 and 94.2% are occupied, or 26,229 housing units. The total vacancy rate for the service area is 5.8%. Of the available units: For Rent 2.3% Rented, not Occupied 0.1% For Sale 1.9% Sold, not Occupied 0.2% For Seasonal Use 0.2% Other Vacant 1.1% 10 BROOKLYN PARK - FAMILY AQUATIC CENTER FEASIBILITY STUDY
19 DEMOGRAPHIC & MARKET ANALYSIS Recreation Expenditures Spending Potential Index: Finally, through the demographic provider that B*K utilizes for the market analysis portion of the report, we can examine the overall propensity for households to spend dollars on recreation activities. The following comparisons are possible. Table E Recreation Expenditures Spending Potential Index 2 : City of Brooklyn Park SPI Average Spent Fees for Participant Sports 112 $ Fees for Recreational Lessons 115 $ Social, Recreation, Club Membership 108 $ Exercise Equipment/Game Tables 102 $60.93 Other Sports Equipment 99 $10.49 Secondary Service Area SPI Average Spent Fees for Participant Sports 105 $ Fees for Recreational Lessons 105 $ Social, Recreation, Club Membership 103 $ Exercise Equipment/Game Tables 96 $57.28 Other Sports Equipment 93 $9.87 Regional Service Area SPI Average Spent Fees for Participant Sports 118 $ Fees for Recreational Lessons 117 $ Social, Recreation, Club Membership 118 $ Exercise Equipment/Game Tables 109 $65.18 Other Sports Equipment 107 $11.34 State of Minnesota SPI Average Spent Fees for Participant Sports 107 $ Fees for Recreational Lessons 103 $ Social, Recreation, Club Membership 104 $ Exercise Equipment/Game Tables 110 $65.54 Other Sports Equipment 112 $11.83 Average Amount Spent: The average amount spent for the service or item in a year. SPI: Spending potential index as compared to the national number of Consumer Spending data are derived from the 2013 and 2014 Consumer Expenditure Surveys, Bureau of Labor Statistics. BROOKLYN PARK - FAMILY AQUATIC CENTER FEASIBILITY STUDY 11
20 DEMOGRAPHIC & MARKET ANALYSIS Chart E Recreation Spending Potential Index: In the case of Participant Sports and Recreational Lessons, the SPI for Brooklyn Park is higher than the national number of 100. In many instances when this number is higher it is due to the presence of families with children and the presence of opportunities within the community. It is also important to note that these dollars are spent across all activities, not specific to swimming or one activity. 12 BROOKLYN PARK - FAMILY AQUATIC CENTER FEASIBILITY STUDY

21 DEMOGRAPHIC & MARKET ANALYSIS Map C Recreation Spending Potential Index by Block Group BROOKLYN PARK - FAMILY AQUATIC CENTER FEASIBILITY STUDY 13
 and the Secondary")
22 DEMOGRAPHIC & MARKET ANALYSIS Map D Primary & Secondary Service Area Map Green Boundary City of Brooklyn Park Proper, Primary Service Area Red Boundary 5-Mile Radius from Site, Secondary Service Area In addition to the key indicator information provided on the previous pages, B*K provides a detailed demographic analysis of the Primary Service Area (City of Brooklyn Park proper) and the Secondary Service Area (5-mile radius). 14 BROOKLYN PARK - FAMILY AQUATIC CENTER FEASIBILITY STUDY
23 DEMOGRAPHIC & MARKET ANALYSIS Population Distribution by Age: Utilizing census information for the Primary Service Area (Brooklyn Park) and the Secondary Service Area, the following comparisons are possible. Table F 2017 Primary Service Area (Brooklyn Park) Age Distribution (ESRI estimates) Population: Ages Population % of Total Nat. Population Difference 0-5 6, % 6.0% +2.1% , % 16.3% +2.9% , % 9.7% -0.9% , % 26.4% +3.3% , % 13.0% -1.0% , % 12.9% -1.3% , % 9.2% -2.5% 75+ 3, % 6.4% -2.5% 2017 census estimates in the different age groups in the Primary Service Area (Brooklyn Park). % of Total: Percentage of Primary Service Area (Brooklyn Park) population in the age group. National Population: Difference: Percentage of the national population in the age group. Percentage difference between the Primary Service Area (Brooklyn Park) population and the national population. Chart F 2017 Primary Service Area (Brooklyn Park) Age Group Distribution The demographic makeup of Primary Service Area (Brooklyn Park), when compared to the characteristics of the national population, indicates that there are some differences with a larger population in the age groups, 0-17 and A smaller population exists in the younger age groups and over 45. The greatest positive variance is in the age group with +3.3%, while the greatest negative variance is in the and 75+ age groups with -2.5%. As it relates to recreation this would point to the need for the facility to have a multi-generational focus with programming. As it relates to aquatics specifically, this points to need for multi-generational programming with multiple temperatures of water to address the varied needs. BROOKLYN PARK - FAMILY AQUATIC CENTER FEASIBILITY STUDY 15

24 DEMOGRAPHIC & MARKET ANALYSIS Table G 2017 Secondary Service Area Age Distribution (ESRI estimates) Ages Population % of Total Nat. Population Difference , % 6.0% +1.1% , % 16.3% 0.9% , % 9.7% -1.1% , % 26.4% +2.3% , % 13.0% -0.4% , % 12.9% -0.3% , % 9.2% -1.6% , % 6.4% -0.9% Population: 2017 census estimates in the different age groups in the Secondary Service Area. % of Total: Percentage of the Secondary Service Area population in the age group. National Population: Percentage of the national population in the age group. Difference: Percentage difference between Secondary Service Area population and the national population. Chart G 2017 Secondary Service Area Age Group Distribution The demographic makeup of the Secondary Service Area, when compared to the characteristics of the national population, indicates that there are some differences with a larger population in the 0-17 and A smaller population exists in the younger age groups and over 45. The greatest positive variance is in the age group with +3.3%, while the greatest negative variance is in the and 75+ age groups with -2.5%. 16 BROOKLYN PARK - FAMILY AQUATIC CENTER FEASIBILITY STUDY
25 DEMOGRAPHIC & MARKET ANALYSIS Population Distribution Comparison by Age: Utilizing census information from the Primary Service Area (Brooklyn Park) and the Secondary Service Area, the following comparisons are possible. Table H 2017 Primary Service Area (Brooklyn Park) Population Estimates (U.S. Census Information and ESRI) Ages 2010 Census 2017 Projection 2022 Projection Percent Change Percent Change Nat l -5 6,599 6,757 7, % +2.3% ,383 15,816 16, % +0.7% ,249 7,284 7, % +0.2% ,984 24,641 26, % +11.4% ,708 9,923 9, % -9.4% ,930 9,620 9, % +18.2% ,528 5,563 6, % +61.8% 75+ 2,400 3,130 4, % +34.7% Chart H Primary Service Area (Brooklyn Park) Population Growth Table-H illustrates the growth or decline in age group numbers from the 2010 census until the year It is projected that all age categories, except and will see an increase in population. The population of the United States is aging, and it is not unusual to find negative growth numbers in the younger age groups and significant net gains in the 45 plus age groupings in communities which are relatively stable in their population numbers. BROOKLYN PARK - FAMILY AQUATIC CENTER FEASIBILITY STUDY 17
26 DEMOGRAPHIC & MARKET ANALYSIS Table I 2017 Secondary Service Area Population Estimates (U.S. Census Information and ESRI) Ages 2010 Census 2017 Projection 2022 Projection Percent Change Percent Change Nat l -5 16,649 16,696 17, % +2.3% ,883 40,217 41, % +0.7% ,702 19,956 19, % +0.2% ,041 66,976 71, % +11.4% ,614 29,532 28, % -9.4% ,839 29,519 30, % +18.2% ,942 17,700 21, % +61.8% ,709 12,704 15, % +34.7% Chart I Secondary Service Area Population Growth Table-I illustrates the growth or decline in age group numbers from the 2010 census until the year It is projected that all age categories will see an increase in population, except the age groups and The population of the United States is aging, and it is not unusual to find negative growth numbers in the younger age groups and significant net gains in the 45 plus age groupings in communities which are relatively stable in their population numbers. 18 BROOKLYN PARK - FAMILY AQUATIC CENTER FEASIBILITY STUDY
 Ethnic Population and Median Age 2017 (Source U.S. Census Bureau and ESRI) Ethnicity Total Population Median Age % of Population % of MN Population Hispanic 5,265 24.")
27 DEMOGRAPHIC & MARKET ANALYSIS Below is the distribution of the population by race and ethnicity for the Primary Service Area (Brooklyn Park) and the Secondary Service Area for 2017 population projections. Those numbers were developed from 2010 Census Data. Table J Primary Service Area (Brooklyn Park) Ethnic Population and Median Age 2017 (Source U.S. Census Bureau and ESRI) Ethnicity Total Population Median Age % of Population % of MN Population Hispanic 5, % 5.4% Table K Primary Service Area (Brooklyn Park) by Race and Median Age 2017 (Source U.S. Census Bureau and ESRI) Race Total Population Median Age % of Population % of MN Population White 39, % 82.6% Black 21, % 6.1% American Indian % 1.2% Asian 15, % 5.1% Pacific Islander % 0.1% Other 3, % 2.2% Multiple 3, % 2.8% 2017 Primary Service Area (Brooklyn Park) Total Population:82,734 Residents Chart J 2017 Primary Service Area (Brooklyn Park) Population BROOKLYN PARK - FAMILY AQUATIC CENTER FEASIBILITY STUDY 19
28 DEMOGRAPHIC & MARKET ANALYSIS Table L Secondary Service Area Ethnic Population and Median Age 2017 (Source U.S. Census Bureau and ESRI) Ethnicity Total Population Median Age % of Population % of MN Population Hispanic 14, % 5.4% Table M Secondary Service Area by Race and Median Age 2017 (Source U.S. Census Bureau and ESRI) Race Total Population Median Age % of Population % of MN Population White 146, % 82.6% Black 42, % 6.1% American Indian 1, % 1.2% Asian 26, % 5.1% Pacific Islander % 0.1% Other 7, % 2.2% Multiple 9, % 2.8% 2017 Secondary Service Area Total Population: 233,299 Residents Chart K 2017 Secondary Service Area Population 20 BROOKLYN PARK - FAMILY AQUATIC CENTER FEASIBILITY STUDY
29 DEMOGRAPHIC & MARKET ANALYSIS Tapestry Segmentation There is value including this information for the City of Brooklyn Park. The data assists the City in understanding the consumers/ constituents in the community and supply them with the right products and services, specific to an indoor aquatic center. The Tapestry segmentation system classifies U.S. neighborhoods into 65 unique market segments. Neighborhoods are sorted by more than 60 attributes including; income, employment, home value, housing types, education, household composition, age and other key determinates of consumer behavior. The following page and table outline the top 5 tapestry segments the Primary and Secondary Service Areas and provide a brief description of each. This information combined with the key indicators and demographic analysis of each service area help further describe the markets that the City looks to serve with programs, services, and special events. Table N Primary Service Area (Brooklyn Park) Tapestry Segment Comparison (ESRI estimates) Percent Brooklyn Park Cumulative Percent Median Age Demographics Median HH Income Home Improvement (4B) 26.8% 26.8% 37.0 $67,000 Metro Fusion (11C) 15.4% 42.2% 28.8 $33,000 Boomburbs (1C) 11.1% 53.3% 33.6 $105,000 Soccer Moms (4A) 7.7% 61.0% 36.6 $84,000 Parks and Rec (5C) 7.0% 68.0% 40.3 $55,000 Enterprising Young Prof. (2D) 6.4% 74.4% 34.8 $77,000 Bright Young Professionals (8C) 5.9% 80.3% 32.2 $50,000 Savvy Suburbanites (1D) 5.6% 85.9% 44.1 $104,000 Young and Restless (11B) 3.8% 89.7% 29.4 $36,000 NeWest Residents (13C) 3.2% 92.9% 27.0 $28, % In Style (5B) 2.7% 95.6% 41.1 $66,000 American Dreamers (7C) 1.5% 97.1% 31.8 $48,000 Retirement Communities (9E) 1.5% 98.6% 52.0 $35,000 Comfortable Empty Nesters (5A) 1.4% 100.0% 46.8 $68, % BROOKLYN PARK - FAMILY AQUATIC CENTER FEASIBILITY STUDY 21
30 DEMOGRAPHIC & MARKET ANALYSIS Home Improvement (4B) Married couple families make up most of this group. Education and diversity levels are like the U.S. These families spend a lot of time on the go and therefore tend to eat out regularly. More than half of the households consist of marriedcouple families; another 12% include single-parent families. There is a significant Hispanic (18.9%) and Black (13.2%) population in this segment. Metro Fusion (11C) This is a young, diverse market. Many residents do not speak English fluently and have moved into their homes recently. Many households have young children; a quarter are single-parent families. This is a hard-working market with residents that are dedicated to climbing ladders of their social and professional lives. There is a significant Hispanic (33.6%), Other (14.7%) and Black (30.1%) population in this segment. Football and soccer are popular sports. Boomburbs (1C) This is an affluent market but with a higher proportion of mortgages. Rapid growth still distinguishes this segment. Residents are well-educated professionals with a running start on prosperity. There is a significant Hispanic (14.5%) and Asian/Pacific Island (13.9%) population in this segment. Physical fitness is a priority, including club memberships and home equipment. Leisure activities include hiking, bicycling, swimming and golf along with visits to theme parks or water parks. Soccer Moms (4A) This is an affluent, family-oriented market with a country flavor. Residents are partial to new housing away from the bustle of the city but close enough to commute to professional job centers. Most households are married couples with children. There is a significant Hispanic (11.2%) population in this segment. Outdoor activities and sports are characteristics of life, like bicycling, jogging, golfing, boating and target shooting. Parks and Rec (5C) Many of these families are two-income married couples approaching retirement age; they are comfortable in their jobs and their homes, budget wisely, but do not plan on retiring anytime soon or moving. Households by type mirror the U.S. distribution; married couples, more without children, dominate. Residents here take advantage of local parks and recreation activities. Their exercise routine is a balance of home-based exercise; a session at their local community gym; or a quick jog, swim or run. Front Porches (8E) This segment blends household types, with more young families with children or single households than average. This group is also more diverse than the U.S. Friends and family are central to these residents and help to influence household buying decisions. Income and net worth are well below the U.S. average. There is a significant Hispanic (22.6%) and Black (14.5%) in this segment. Residents participate in leisure activities including sports, indoor water parks, bingo and video games. (Not present in City of Brooklyn Park) Table O Secondary Service Area Tapestry Segment Comparison (ESRI estimates) Secondary Service Area Percent Cumulative Percent Median Age Demographics Median HH Income Parks and Rec (5C) 20.4% 20.4% 40.3 $55,000 Home Improvement (4B) 19.7% 40.1% 37.0 $67,000 Metro Fusion (11C) 8.6% 48.7% 28.8 $33,000 Soccer Moms (4A) 6.2% 54.9% 36.6 $84,000 Front Porches (8E) 6.1% 61.0% 34.2 $39,000 All tapestry segments are identical to the Primary Service Area (Brooklyn Park), except for: 22 BROOKLYN PARK - FAMILY AQUATIC CENTER FEASIBILITY STUDY
31 DEMOGRAPHIC & MARKET ANALYSIS Demographic Summary The following summarizes the demographic characteristics of the service areas. Population Concentration There is a significant, greater than 50,000, population in both the Primary & Secondary Service Areas. Such population numbers make it possible for the community to support a community focused indoor aquatic center with multiple water types and a full spectrum of aquatic programming. Median Age The median age in both the Primary & Secondary Service Area are lower than the national number, which points to the presence of families with children. As an activity swimming is one that individuals can participate in and enjoy from birth to grave. Given that information most municipal aquatic centers take on a multi-generational focus. At the same time some of the greatest rates of participation for swimming are in the younger age groups, which are present in the service areas. Income The median household income in the Primary & Secondary Service Areas has a significant percentage making more than $50,000. While there is not perfect predictor of a facility s success the income trend points to the ability to pay for services, which is further underscored by the Spending Potential Index for Entertainment and Recreation being greater than the National number. Age Growth & Distribution The age distribution and associated growth with the Primary & Secondary Service Areas point to a thriving community that continues to grow. As such the development on a community aquatic center would be an investment in the community. Diversity There is significant diversity within both service areas, but within the City proper. With significant diversity comes challenges as it relates to aquatics. The main challenge is getting those groups to the pool and educating them on what can take place at the facility, both in terms of socialization and programming. As the project continues to move forward the City would be well-served by engaging these groups and identifying barriers to them using a municipal aquatic center. Subsequently, it will be important for the consulting team to address those barriers in design and staff to address them with hours of operation, water temperature and programming. Tapestry The tapestry segments within the service areas further underline the diversity identified in the report. It also points to many segments of the community that are invested in health and wellness, of which swimming and participation at a community pool addresses. BROOKLYN PARK - FAMILY AQUATIC CENTER FEASIBILITY STUDY 23
32 DEMOGRAPHIC & MARKET ANALYSIS Participation, Trends & Providers In addition to analyzing the demographic realities of the service areas, it is possible to project possible participation in recreation and sport activities. Participation Numbers: On an annual basis, the National Sporting Goods Association (NSGA) conducts an in-depth study and survey of how Americans spend their leisure time. This information provides the data necessary to overlay rate of participation onto the Primary Service Area (Brooklyn Park) to determine market potential. The information contained in this section of the report, utilizes the NSGA s most recent survey. For that data was collected in 2016 and the report was issued in June of B*K takes the national average and combines that with participation percentages of the Primary Service Area (Brooklyn Park) based upon age distribution, median income, region and National number. Those four percentages are then averaged together to create a unique participation percentage for the Primary Service Area (Brooklyn Park). This participation percentage when applied to the population of the Primary Service Area (Brooklyn Park) then provides an idea of the market potential for various activities. Community Recreation Related Activities Participation: These activities could take place at an indoor community recreation center space. Table A Participation Rates for Primary Service Area (Brooklyn Park) Age Income Region Nation Average Aerobics 15.6% 17.0% 17.1% 15.5% 16.3% Basketball 9.2% 8.2% 8.2% 8.4% 8.5% Bicycle Riding 12.9% 13.1% 13.9% 12.3% 13.0% Boxing 1.3% 2.1% 1.1% 1.2% 1.4% Exercise Walking 35.1% 37.8% 38.4% 36.0% 36.8% Exercise w/ Equipment 19.3% 22.4% 20.1% 19.5% 20.3% Hockey (ice) 1.2% 1.3% 2.0% 1.1% 1.4% Ice/Figure Skating 2.8% 2.6% 3.0% 2.6% 2.8% Martial Arts/MMA 2.3% 2.0% 2.5% 2.1% 2.2% Pilates 0.3% 1.7% 2.4% 1.9% 1.6% Running/Jogging 16.3% 16.4% 16.3% 15.3% 16.1% Swimming 16.0% 16.0% 13.2% 15.5% 15.2% Table Tennis/Ping Pong 3.7% 3.3% 4.5% 3.5% 3.7% Volleyball 4.0% 3.2% 3.1% 3.6% 3.5% Weight Lifting 12.4% 14.2% 12.5% 12.1% 12.8% Workout at Clubs 13.0% 14.1% 12.3% 12.9% 13.1% Wrestling 1.1% 1.1% 1.5% 1.0% 1.2% Yoga 10.7% 10.7% 10.6% 10.3% 10.6% Did Not Participate 22.2% 21.8% 22.4% 22.4% 22.2% Age: Participation based on individuals ages 7 & Up of Primary Service Area (Brooklyn Park). Income: Participation based on the 2016 estimated median household income in Primary Service Area (Brooklyn Park). Region: Participation based on regional statistics (West North Central). National: Participation based on national statistics. Average: Average of the four columns. Note: Did Not Participate refers to all 55 activities tracked by the NSGA. 24 BROOKLYN PARK - FAMILY AQUATIC CENTER FEASIBILITY STUDY
33 DEMOGRAPHIC & MARKET ANALYSIS Anticipated Participation Number: Utilizing the average percentage from Table-A above plus the 2010 census information and census estimates for 2017 and 2022 (over age 7) the following comparisons are available. Table B Participation Growth or Decline in Primary Service Area (Brooklyn Park) Average 2010 Population 2017 Population 2022 Population Difference Aerobics 16.3% 10,861 11,950 12,607 1,746 Basketball 8.5% 5,669 6,237 6, Bicycle Riding 13.0% 8,700 9,573 10,099 1,399 Boxing 1.4% 957 1,053 1, Exercise Walking 36.8% 24,554 27,018 28,502 3,948 Exercise w/ Equipment 20.3% 13,554 14,914 15,733 2,179 Hockey (ice) 1.4% 926 1,019 1, Ice/Figure Skating 2.8% 1,840 2,024 2, Martial Arts/MMA 2.2% 1,485 1,634 1, Pilates 1.6% 1,056 1,162 1, Running/Jogging 16.1% 10,718 11,794 12,442 1,723 Swimming 15.2% 10,122 11,138 11,750 1,627 Table Tennis/Ping Pong 3.7% 2,492 2,742 2, Volleyball 3.5% 2,314 2,546 2, Weight Lifting 12.8% 8,527 9,382 9,898 1,371 Workout at Clubs 13.1% 8,714 9,589 10,115 1,401 Wrestling 1.2% Yoga 10.6% 7,056 7,764 8,190 1,134 Did Not Participate 22.2% 14,802 16,287 17,182 2,380 Note: These figures do not necessarily translate into attendance figures for various activities or programs. The Did Not Participate statistics refers to all 55 activities outlined in the NSGA 2016 Survey Instrument. BROOKLYN PARK - FAMILY AQUATIC CENTER FEASIBILITY STUDY 25
34 DEMOGRAPHIC & MARKET ANALYSIS Because the focus of the study for Brooklyn Park is aquatics it is helpful to understanding not only the percentage of participation, but how frequently those participants seek facilities and services. The following charts below outline the frequency of participation in Swimming. Table C Participation Frequency Swimming The NSGA classifies Swimming based on how often individuals participate: Frequent Occasional Infrequent Swimming Frequency Swimming Percentage of Population 6.8% 42.0% 51.2% In Table-C one can look at Swimming and how it is defined with respect to visits being Frequent, Occasional or Infrequent and then the percentage of population that participates. Table D Participation Numbers Frequent Occasional Infrequent Total Swimming Frequency Visits/Person Population 757 4,678 5,703 Visits 84, ,417 85, ,780 Table-D takes the frequency information one step further and identifies the number of times individuals may participate in the activity, applies the percentage from Table-C to the 2016 Swimming population (11,138) and then gives a total number of swimming days. This indicates that a total of 483,780 swimmers are available within the Primary Service Area (Brooklyn Park) market. It is also important to note that those are being absorbed, on some level, by the other service providers in the area. 26 BROOKLYN PARK - FAMILY AQUATIC CENTER FEASIBILITY STUDY
35 DEMOGRAPHIC & MARKET ANALYSIS Swimming Frequency Definitions It is also important to further identify the uses of frequent, occasional and infrequent participants in swimming. Frequent Swimmers (6.8% of total swimming population) These participants are largely the individuals participating in competitively geared programs. They can be described as competitive athletes of all variety to include multi-sport athletes, youth through adult. These participants are interested in traditional flat-water facilities, i.e. lap pools. Their preference is for deep water (greater than 6 feet) and cooler water temperatures (between 78-80). Occasional Swimmers (42.0% of total swimming population) These participants are the in between group of swimmers. The individuals on the high end of the uses per year are interested in swimming, or aquatic activities, as a means of exercise and prefer water like that of frequent swimmers. As you approach the mid-point and lower-level of participation the reason for aquatic participation changes. Those individuals are either interested in aquatic participation for exercise/therapy or strictly the entertainment and social aspects of being in a pool. Those individuals on the mid and lower level of participation are interested in a different kind of water. They are more interested in a warmer water temperature (82-86 degrees) shallow water (less than 4 feet up to a zero-depth entry). Infrequent Swimmers (51.2% of total swimming population) These participants are strictly interested in the social and entertainment aspects of swimming. They typically don t use participation in aquatic programs as a means of exercise, but rather socialization. The water that they are interested in is identical to the lower end of the occasional swimmers. However, they are also interested in a wow-factor which plays a key role in determining which facility they may visit. As the City of Brooklyn Park contemplates future allocation of dollars specific to aquatics, they should consider which swimming population(s) they are addressing and which they want to address. Swimming As A Life Skill Providing swim lessons and exposure to aquatic facilities, while limited based on availability is what B*K would identify as a core service the Brooklyn Park Recreation Department. As a community there are several factors that impact this core service and underscore its necessity within the community. There are many significant bodies of water near Brooklyn Park; ponds, lakes, tributaries and the Mississippi River, but there are none with the City boundaries. It can be said that within the Land of a 1,000 Lakes, the City is land locked. Because of this reason, some residents encounter open water without a basic understanding of swimming and the dangers associated with open water. This fact is compounded by the diversity within the City. The Centers for Disease Control (CDC), the American Red Cross (ARC) and other risk management providers track drownings and near drowning across the U.S. The statistics that those groups collect that point to a higher rate of drowning and near drowning as the diversity within a community increases. Given the diversity of the City, one can draw the conclusion that the potential rate of drownings and near drownings in Brooklyn Park is significant. As such, the core service of offering swim lessons and exposing the whole community to pools and the potential dangers associated with water becomes paramount. The development of a community aquatic center, focused on exposing the greatest number of people to basic swimming skills and dangers associated with water becomes paramount. While most standalone aquatic centers do not recovery 100% of their operating costs, the ability to offer aquatic services to the community at an affordable price makes these types of facilities more aligned with government, tax subsidized operations. BROOKLYN PARK - FAMILY AQUATIC CENTER FEASIBILITY STUDY 27
36 DEMOGRAPHIC & MARKET ANALYSIS Participation by Ethnicity and Race: The table below compares the overall rate of participation nationally with the rate for Hispanics and African Americans. Utilizing information provided by the National Sporting Goods Association s 2016 survey, the following comparisons are possible. Table F Comparison of National, African American and Hispanic Participation Rates Indoor Activity Primary Service Area (Brooklyn Park) National Participation African American Participation Hispanic Participation Aerobics 16.3% 15.5% 13.9% 14.6% Basketball 8.5% 8.4% 12.8% 10.2% Bicycle Riding 13.0% 12.3% 12.2% 13.2% Boxing 1.4% 1.2% 9.3% 12.4% Exercise Walking 36.8% 36.0% 32.5% 30.5% Exercise w/ Equipment 20.3% 19.5% 17.5% 18.4% Hockey (ice) 1.4% 1.1% 0.3% 1.6% Ice/Figure Skating 2.8% 2.6% 1.4% 3.8% Martial Arts/MMA 2.2% 2.1% 1.9% 3.2% Pilates 1.6% 1.9% 2.2% 2.6% Running/Jogging 16.1% 15.3% 14.6% 17.3% Swimming 15.2% 15.5% 9.3% 14.1% Table Tennis/Ping Pong 3.7% 3.5% 2.9% 3.4% Volleyball 3.5% 3.6% 3.7% 5.3% Weight Lifting 12.8% 12.1% 13.9% 11.2% Workout at Clubs 13.1% 12.9% 10.9% 13.1% Wrestling 1.2% 1.0% 1.6% 1.2% Yoga 10.6% 10.3% 9.3% 11.5% Did Not Participate 22.2% 22.4% 26.3% 23.6% Secondary Service Part: National Rate: African American Rate: Hispanic Rate: The unique participation percentage developed for Primary Service Area (Brooklyn Park). The national percentage of individuals who participate in the given activity. The percentage of African-Americans who participate in the given activity. The percentage of Hispanics who participate in the given activity. Given the diversity within the Primary (Brooklyn Park) AND Secondary Service Area these numbers, specifically swimming, become important. In many cases a general lack of exposure to pools and aquatics is a trend within these communities. For the City that means educating residents on the facility amenities and the types of programs and socialization opportunities that exist. It also means that the City will need to continue to be sensitive to the needs of the various cultures with regards to aquatics and pool usage. 28 BROOKLYN PARK - FAMILY AQUATIC CENTER FEASIBILITY STUDY
37 DEMOGRAPHIC & MARKET ANALYSIS Summary of Sports Participation: The following chart summarizes participation for indoor activities utilizing information from the 2016 National Sporting Goods Association survey. Table G Sports Participation Summary Sport Nat l Rank 3 Nat l Participation (in millions) Exercise Walking Exercising w/ Equipment Swimming Aerobic Exercising Running/Jogging Club Bicycle Riding Weight Lifting Yoga Basketball Volleyball Table Tennis Ice/Figure Skating Martial Arts MMA Pilates Boxing Hockey Wrestling Nat l Rank: Nat l Participation: Popularity of sport based on national survey. Population that participate in this sport on national survey. These figures are national numbers and provide perspective as to the popularity of activities on a national level. 3 This rank is based upon the 55 activities reported on by NSGA in their 2016 survey instrument. BROOKLYN PARK - FAMILY AQUATIC CENTER FEASIBILITY STUDY 29
38 DEMOGRAPHIC & MARKET ANALYSIS Participation by Age Group: Within the NSGA survey, participation is broken down by age groups. As such B*K can identify the top 3 age groups participating in the activities reflected in this report. Chart H Participation by Age Group: Activity Largest Second Largest Third Largest Aerobics Basketball Bicycle Riding Boxing Exercise Walking Exercise w/ Equipment Hockey (ice) Ice/Figure Skating Martial Arts/MMA Pilates Running/Jogging Swimming Table Tennis/Ping Pong Volleyball Weight Lifting Workout at Clubs Wrestling Yoga Did Not Participate Largest: Second Largest: Third Largest: Age group with the highest rate of participation. Age group with the second highest rate of participation. Age group with the third highest rate of participation. This information becomes important for the City because it helps focus marketing efforts and key participant demographics. The one missing piece of information is participation of individuals under 7 years of age. The NSGA does not track this information, but it can be said for many of the activities outlined above, in particular swimming, that this age segment is a significant participant. 30 BROOKLYN PARK - FAMILY AQUATIC CENTER FEASIBILITY STUDY
39 DEMOGRAPHIC & MARKET ANALYSIS Emerging Sport Trend Another source for tracking participation trends can be found with the Sports and Fitness Association (SFIA) Topline Report. SFIA produces an annual report aimed to establish activity levels and identify trends in sports and fitness participation. Statistics were gathered through networking with other major trade associations and information gathered through a nation on-line panel. The Topline Report indicates that most sport categories experienced an increase in participation with fitness sports and team sports having the most increase over the previous year. Closer examination of individual sports tracked through SFIA for Pickleball are highlighted below. Table E - SFIA Pickleball (participation numbers in 1,000 s) 2014 Participation 2015 Participation 2016 Participation % Change 2015/2016 Total 2,462 2,506 2, % Note: Largest increase in all Racquet Sports Additional Information: 2/3 are Casual participants who play 1-7 times a year. Core participants play 8 or more times a year. Casual participants are 63% male, while Core participants are 73% male. 13% of Casual participants are age 55 and older, 75% of Core participants are 55 and older. Market Potential Index for Adult Participation: In addition to examining the participation numbers for various indoor activities through the NSGA 2016 Survey and the Spending Potential Index for Entertainment & Recreation, B*K can access information about Sports & Leisure Market Potential. The following information illustrates participation rates for adults in various activities. Table I Market Potential Index for Adult Participation in Activities in Primary Service Area (Brooklyn Park) Adults participated in: Expected Number of Adults Percent of Population MPI Aerobics 14, % 102 Basketball 16, % 110 Bicycle Riding 18, % 103 Exercise Walking 48, % 102 Pilates 5, % 109 Running/Jogging 27, % 115 Swimming 28, % 103 Volleyball 6, % 110 Weight Lifting 19, % 110 Expected # of Adults: Number of adults, 18 years of age and older, participating in the activity in Primary Service Area (Brooklyn Park). Percent of Population: Percent of the service area that participates in the activity. MPI: Market potential index as compared to the national number of 100. This table indicates that the overall propensity for adults to participate in the activities listed is greater than the national number of 100 in all instances. In many cases when a participation number is lower than the National number, secondary factors include a lack of facilities or an inability to pay for services and programs. BROOKLYN PARK - FAMILY AQUATIC CENTER FEASIBILITY STUDY 31
40 DEMOGRAPHIC & MARKET ANALYSIS Sports Participation Trends: Below are listed several sports activities and the percentage of growth or decline that each has experienced nationally over the last ten years ( ). Table J National Activity Trend (in millions) Increasing in Popularity 2007 Participation 2016 Participation Percent Change Yoga % Hockey % Running/Jogging % Wrestling % Aerobic Exercising % Exercise Walking % Exercising w/ Equipment % Weight Lifting % Basketball % Club % Pilates % Decreasing in Popularity 2007 Participation 2016 Participation Percent Change Martial Arts/MMA % Bicycle Riding % Boxing % Ice/Figure Skating % Volleyball % Swimming % Table Tennis/Ping Pong % 2016 Participation: The number of participants per year in the activity (in millions) in the United States Participation: The number of participants per year in the activity (in millions) in the United States. Percent Change: The percent change in the level of participation from 2005 to Change from Change from BROOKLYN PARK - FAMILY AQUATIC CENTER FEASIBILITY STUDY
41 DEMOGRAPHIC & MARKET ANALYSIS Table K Sports Participation Trends Beyond 10-Year History by Millions Swimming While swimming has decreased steadily since 1990 there have been multiple changes in the market impacting the overall participation. In no order of importance: Financial Constraints. It was not uncommon in the 1970s and 1980s for municipal agencies to offer free swim lessons. Additionally, many swim teams utilized public and school facilities at no cost. Transitioning from the 1980s to the 1990s there became a renewed focus on fiscal responsibility of the host agencies and many began to assess fees. Aging Facilities. Hand in hand with the financial constraints of operating a pool and shifting from free to pay-to-use, aquatic facilities are aging. As those facilities age many agencies are faced with the decision to continue offering services or eliminate them. Many agencies have consolidated their facilities. Recreation Activity and Facility Trends (Indoor): There continues to be very strong growth in the number of people participating in recreation and leisure activities. The Physical Activity Council in its 2013 study indicated that 33% of Americans (age 6 and older) are active to a healthy level. However, the study also indicated that 28% of Americans were inactive. It is estimated that one in five Americans over the age of six participates in some form of fitness related activity at least once a week. American Sports Data, Inc. reported that membership in U.S. health clubs has increased by 10.8% from 2009 to 2010, and memberships in health clubs reached an all-time high of 50.2 million in Statistics also indicate that approximately 12 out of every 100 people of the U.S. population (or 12%) belong to a health club. On the other side, most public recreation centers attract between 20% and 30% of a market area (more than once) during a year. All of this indicates the relative strength of a market for a community recreation facility. However, despite these increases the American population continues to lead a rather sedentary life with an average of 25% of people across the country reporting that they engage in no physical activity (per The Center for Disease Control). One of the areas of greatest participant growth over the last 10 years is in fitness related activities such as exercise with equipment, aerobic exercise and group cycling. This is also the most volatile area of growth with specific interest areas soaring in popularity for a couple of years only to be replaced by a new activity for the coming years. Also, showing particularly strong growth numbers are ice hockey and running/ jogging while swimming participation remains consistently high despite recent drops in overall numbers. It is significant that many of the activities that can take place in an indoor recreation setting are ranked in the top fifteen in overall participation by the National Sporting Goods Association. Due to the increasing recreational demands, there has been a shortage in most communities of the following spaces: Gymnasiums Pools (especially leisure pools) Weight/cardiovascular equipment areas Indoor running/walking tracks Meeting/multipurpose (general program) space Senior s program space Pre-school and youth space Teen use areas Fieldhouses Thus, many communities have attempted to include these amenities in public community recreation facilities. With the growth in youth sports and the high demand for school gyms, most communities are experiencing an acute lack of gymnasium space. Weight/ cardiovascular space is also in high demand and provides a facility with the potential to generate significant revenues. BROOKLYN PARK - FAMILY AQUATIC CENTER FEASIBILITY STUDY 33
42 DEMOGRAPHIC & MARKET ANALYSIS The success of most recreation departments is dependent on meeting the recreational needs of a variety of individuals. The fastest growing segment of society is the senior population and meeting the needs of this group is especially important now and will only grow more so in the coming years. Indoor walking tracks, exercise areas, pools and classroom spaces are important to this age group. Marketing to the younger more active senior (usually age 55-70) is paramount, as this age group has the free time available to participate in leisure activities, the desire to remain fit, and more importantly the disposable income to pay for such services. Youth programming has always been a cornerstone for recreation services and will continue to be so with an increased emphasis on teen needs and providing a deterrent to juvenile crime. With a continuing increase in single parent households and two working parent families, the needs of school age children for before and after school child care continues to grow as does the need for preschool programming. As more and more communities attempt to develop community recreation facilities the issues of competition with other providers in the market area have inevitably been raised. The loudest objections have come from the private health club market and their industry voice IHRSA. The private sector has vigorously contended that public facilities unfairly compete with them in the market and have spent considerable resources attempting to derail public projects. However, the reality is that in most markets where public community recreation centers have been built, the private sector has not been adversely affected and in fact in many cases has continued to grow. This is due in large part to the fact that public and private providers serve markedly different markets. One of the other issues of competition comes from the non-profit sector (primarily YMCA s but also JCC s, and others), where the market is much closer to that of the public providers. While not as vociferous as the private providers, the non-profits have also often expressed concern over public community recreation centers. What has resulted from this is strong growth in the number of partnerships that have occurred between the public and non-profit sector in an attempt to bring the best recreation amenities to a community. Aquatic Participation Trends: Swimming is one of the most popular sports and leisure activities, meaning that there is a significant market for aquatic pursuits. Despite the recent emphasis on recreational swimming the more traditional aspects of aquatics (including swim teams, instruction and aqua fitness) remain as an important part of most aquatic centers. The life safety issues associated with teaching children how to swim is a critical concern in most communities and competitive swim team programs through USA Swimming, high schools, masters, and other community-based organizations continue to be important. Aqua fitness, from aqua exercise to lap swimming, has enjoyed robust growth during the last ten years with the realization of the benefits of water-based exercise. Competitive A competitive pool allows for a variety of aquatic activities to take place simultaneously and can handle aqua exercise classes, learn to swim programs as well competitive swim training and meets (short course and possibly long course). In communities where there are several competitive swim programs, utilizing a pool with 8 lanes or more is usually important. A competitive pool that is designed for hosting meets will allow a community to build a more regional or even national identity as a site for competitive swimming. However, it should be realized that regional and national swim meets are difficult to obtain on a regular basis, take a considerable amount of time, effort and money to run; can be disruptive to the regular user groups and can be financial losers for the facility itself. The meets are difficult to obtain as the organization/team must go through a bidding process, and as illustrated in the mapping there are other regional 50M pool providers. The reason that these meets are typically losers with revenue generation is that the opportunity to charge meet rental decreases as the number of swimmers narrows. In many instances it is an honor to host these meets. On the other side, such events can provide a strong economic stimulus to the overall community. Competitive diving is an activity that is often found in connection with competitive swimming. Most high school and regional diving competition centers on the 1-meter board with some 3-meter events (non-high school). The competitive diving market, unlike swimming, is usually very small (usually 10% to 20% the size of the competitive swim market) and has been decreasing steadily over the last ten years or more. Thus, many states have or are considering the elimination of diving as a part of high school swimming. Diving programs have been more viable in markets with larger populations and where there are coaches with strong diving reputations. Moving from springboard diving to platform (5-meter and 10-meter, and sometimes 3 and 7.5-meters), the market for divers drops even more while the cost of construction with deeper pool depths and higher dive towers becomes significantly larger. Platform diving is usually only a competitive event in regional and national diving competitions. As a result, the need for inclusion of diving platforms in a competitive aquatic facility needs to be carefully studied to determine the true economic feasibility of such an amenity. 34 BROOKLYN PARK - FAMILY AQUATIC CENTER FEASIBILITY STUDY
43 DEMOGRAPHIC & MARKET ANALYSIS There are a couple of other aquatic sports that are often competing for pool time at competitive aquatic centers. However, their competition base and number of participants is relatively small. Water polo is a sport that continues to be reasonably popular on the east and west coasts but is not nearly as strong in the Midwest and uses a space of 25 yards or meters by feet wide (the basic size of an 8 lane, 25-yard pool). However, a minimum depth of 6 foot 6 inches is required which is often difficult to find in more community-based facilities. Synchronized swimming also utilizes aquatic facilities for their sport and they also require deeper water of 7-8 feet. This also makes the use of some community pools difficult. Leisure Without doubt one of the hottest trend in aquatics is the leisure pool concept. This idea of incorporating slides, lazy rivers (or current channels), fountains, zero depth entry and other water features into a pool s design has proved to be extremely popular for the recreational user. The age of the conventional pool in most recreational settings has greatly diminished. Leisure pools appeal to the younger kids (who are the largest segment of the population that swims) and to families. These types of facilities can attract and draw larger crowds and people tend to come from a further distance and stay longer to utilize such pools. This all translates into the potential to sell more admissions and increase revenues. It is estimated conservatively that a leisure pool can generate up to 30% more revenue than a comparable conventional pool and the cost of operation while being higher, has been offset through increased revenues. Of note is the fact that patrons seem willing to pay a higher user fee with this type of pool that is in a community center setting as opposed to a stand-alone aquatic center. Therapy Another trend that is growing more popular in the aquatic s field is the development of a raised temperature therapy pool for instruction, relaxation, socialization, and rehabilitation. This has been effective in bringing in swimmers who are looking for a unique experience and non-swimmers who want the advantages of warm water in a different setting. The development of natural landscapes has enhanced this type of amenity and created a pleasant atmosphere for adult socialization. Aquatic Centers The multi-function indoor aquatic center concept of delivering aquatics services continues to grow in acceptance with the idea of providing for a variety of aquatics activities and programs in an open design setting that features a lot of natural light, interactive play features and access to an outdoor sun deck. The outdoor sun deck is a typical location for agencies to incorporate a seasonal splash pad. These amenities increase the diversity of use with minimal impact on the operating budget as it relates to staffing. The placing of traditional instructional/competitive pools, with shallow depth/interactive leisure pools and therapy water, in the same facility has been well received in the market. This idea has proven to be financially successful by centralizing pool operations for recreation service providers and through increased generation of revenues from patrons willing to pay for an aquatics experience that is new and exciting. Indoor aquatic centers have been instrumental in developing a true family appeal for community-based facilities. The keys to success for this type of center revolve around the concept of intergenerational use in a quality facility that has an exciting and vibrant feel in an outdoor like atmosphere. Dry-Side Inclusion Also changing is the orientation of aquatic centers from stand-alone facilities that only have aquatic features to more of a full-service recreation center that has fitness, sports and community-based amenities. This change has allowed for a better rate of cost recovery and stronger rates of use of the aquatic portion of the facility as well as the other dry side amenities. BROOKLYN PARK - FAMILY AQUATIC CENTER FEASIBILITY STUDY 35

44 DEMOGRAPHIC & MARKET ANALYSIS Alternative Service Providers For purposes of the study, several providers were identified. The focus of the study is aquatics, as such the bulk of the facilities identified have an aquatic component. Indoor Providers The star identifies the current facility in Brooklyn Park, with the 5-mile radius representing the Secondary Service Area. The facilities identified is not an all-inclusive list, but illustrates the other providers in the area, and additional facilities that help define the market. Facilities identified include: Shoreview Community Center Roosevelt Community Pool Life Time Fitness, Champlin Maple Grove Community Center & Life Time Fitness LA Fitness; Brooklyn Park, Blaine, Brooklyn Center Great River WaterPark 36 BROOKLYN PARK - FAMILY AQUATIC CENTER FEASIBILITY STUDY

45 DEMOGRAPHIC & MARKET ANALYSIS YMCA The YMCA has a significant presence in the greater Minneapolis/St. Paul area. This is not a definitive list but identifies the facilities that are closest to Brooklyn Park s current facility. North Community YMCA Cora McCorvey YMCA Dayton YMCA Ridgedale YMCA Andover YMCA BROOKLYN PARK - FAMILY AQUATIC CENTER FEASIBILITY STUDY 37

46 DEMOGRAPHIC & MARKET ANALYSIS Indoor 50M Pools A component of the study is the development of a stand-alone aquatic center with the main component being and indoor 50M pool. There are 2 indoor 50M pools in the area as identified on the map. Brooklyn Center Community Center 3 Jean K Freeman Natatorium (University of Minnesota) 3 While competitive teams could use this facility for 50M practices, the City of Brooklyn Park is not actively seeking opportunities to hold competitions in this venue. 38 BROOKLYN PARK - FAMILY AQUATIC CENTER FEASIBILITY STUDY

47 DEMOGRAPHIC & MARKET ANALYSIS 50M Pools Regional The following facilities are identified on the map above: Recreation Center & Pool, Rochester, MN Jean K Freeman Natatorium (University of Minnesota) BSC Aquatic & Wellness Center, Bismarck, ND Hyslop Sports Center, Grand Forks, ND Mandan Aquatic Center, Mandan, ND Hulbert Aquatic Center, West Fargo, ND Williston Area Recreation Center, Williston, ND Midco Aquatic Center, Sioux Falls, SD University of Wisconsin, Madison, WI Rec-Plex, Pleasant Prairie, WI Schroeder Aquatic Center, Milwaukee, WI University of Iowa, Iowa City, IA BROOKLYN PARK - FAMILY AQUATIC CENTER FEASIBILITY STUDY 39
48 DEMOGRAPHIC & MARKET ANALYSIS Aquatic Facilities Potential Market Orientation: Based on the market information, the existing pools, and typical aquatic needs within a community, there are specific market areas that need to be addressed with any aquatic facility. These include: 1. Leisure/Recreation Aquatic Activities This includes a variety of activities found at leisure pools with zero depth entry, warm water, play apparatus, slides, seating areas and deck space. These are often combined with other non-aquatic areas such as concessions and birthday party or other group event areas. 2. Instructional Programming The primary emphasis is on teaching swimming and lifesaving skills to many different age groups. These activities have traditionally taken place in more conventional pool configurations but should not be confined to just these spaces. Reasonably warm water, shallow depth with deeper water (4 ft. or more), and open expanses of water are necessary for instructional activities. Easy pool access, a viewing area for parents, and deck space for instructors is also crucial. 3. Fitness Programming These types of activities continue to grow in popularity among a large segment of the population. From aqua exercise classes, to lap swimming times, these programs take place in more traditional settings that have lap lanes and large open expanses of water available at a 3 1/2 to 5 ft. depth. 4. Therapy A growing market segment for many aquatic centers is the use of warm, shallow water for therapy and rehabilitation purposes. Many of these services are offered by medically based organizations that partner with the center for this purpose. 5. Social/Relaxation The appeal of using an aquatics area for relaxation has become a primary focus of many aquatic facilities. This concept has been very effective in drawing non-swimmers to aquatic facilities and expanding the market beyond the traditional swimming boundaries. The use of natural landscapes and creative pool designs that integrate the social elements with swimming activities has been most effective in reaching this market segment. 6. Special Events/Rentals There is a market for special events including kid s birthday parties, corporate events, community organization functions, and general rentals to outside groups. The development of this market will aid in the generation of additional revenues and these events/rentals can often be planned for after or before regular hours or during slow use times. It is important that special events or rentals not adversely affect daily operations or overall center use. 7. Competitive Aquatics While there are a significant number of aquatic facilities within the area, there are not a lot of competitively oriented aquatic facilities outside of the school districts. This particular market becomes a topic of conversation for the City and if they feel the need to provide this service to a very specific user group and community. 40 BROOKLYN PARK - FAMILY AQUATIC CENTER FEASIBILITY STUDY
49 DEMOGRAPHIC & MARKET ANALYSIS Specific market segments include: 1. Families Within this market, an orientation towards family activities is essential. The ability to have family members of different ages participate in a fun and vibrant facility is essential. 2. Pre-school Children The needs of pre-school age children need to be met with very shallow or zero depth water which is warm and has play apparatus designed for their use. Interactive programming involving parents and toddlers can also be conducted in more traditional aquatic areas as well. 3. School Age Youth A major focus of most pools is to meet the needs of this age group from recreational swimming to competitive aquatics. The leisure components such as slides, fountains, lazy rivers and zero depth will help to bring these individuals to the pool on a regular basis for drop-in recreational swimming. The lap lanes provide the opportunity and space necessary for instructional programs and aquatic team use. 4. Teens Another aspect of many pools is meeting the needs of the teenage population. Serving the needs of this age group will require leisure pool amenities that will keep their interest (slides) as well as the designation of certain teen times of use. 5. Adults This age group has a variety of needs from aquatic exercise classes to lap swimming, triathlon training and competitive swimming through the master s program. 6. Seniors As the population of the United States and the service area continues to age, meeting the needs of an older senior population will be essential. A more active and physically oriented senior is now demanding services to ensure their continued health. Aqua exercise, lap swimming, therapeutic conditioning and even learn to swim classes have proven to be popular with this age group. 7. Special Needs Population This is a secondary market, but with the A.D.A. requirements and the existence of shallow warm water and other components, the amenities are present to develop programs for this population segment. Association with a hospital and other therapeutic and social service agencies will be necessary to reach this market. 8. Special Interest Groups These include swim teams (and other aquatic teams), school district teams, day care centers and social service organizations. While the needs of these groups can be great, their demands on an aquatics center can often be incompatible with the overall mission of the facility. Care must be taken to ensure that special interest groups are not allowed to dictate use patterns for the center. With the proper pools and strong utilization of the aquatics area, it is possible to meet most of the varied market orientations as outlined above. BROOKLYN PARK - FAMILY AQUATIC CENTER FEASIBILITY STUDY 41
50 DEMOGRAPHIC & MARKET ANALYSIS Market Constraints: A significant market constraint with regards to the City of Brooklyn Park proper is the presence of a significant number of HOA and backyard pools. This creates a constraint, because it gives many residents the impression that there is not a need for a publicly funded an operated aquatic facility. However, in many instances the presence of HOA and backyard pools, don t compare with the quality and entertainment value of a leisure-focused aquatic center. The City of Brooklyn Park is unique in it s diversity across several segments. However, that diversity creates challenges in that there is an aversion to using public aquatic facilities. The City is acutely aware of the diversity within the community and will need to engage and market to these segments to help them learn about the benefits of a public aquatic center AND the considerations the City has taken to address their needs. Standalone aquatic facilities are not typically revenue positive operations, which is to say, they do not recover 100% of their associated operating costs, which does not include debt service. The level of cost recovery that some agencies share can vary based on their cost accounting methods and how maintenance, custodial and utilities are captured by the facility. In comparing leisure to competitively focused aquatic centers, the leisure facilities capture more of their operating expense and can typically get close to 100% cost recovery. The reason for this is that the leisure focused facility appeals to a broader percentage of the swimming population. There are a significant number of alternative service providers, non-profit and private, in and surrounding Brooklyn Park. The challenge associated with this is that the City would enter a pre-existing market with price point expectations that have been pre-established by other providers. Orienting the aquatic facility on the current site could create challenges in terms of check points. This could in turn have an impact on the staffing levels in perpetuity of the facility s operation. A 50M pool operation moves the City from a community focused facility to a regionally focused facility. While there are advantages to be a regionally oriented facility, it does not address the needs of the public. Market Opportunities: The diversity of the community was identified as a potential constraint, but it is also an opportunity. It is quantifiable with data that the higher level of diversity correlates to a higher rate of near drownings and drownings. The City, in developing a community aquatic center with a full spectrum of aquatic programs, positions themselves to have a positive impact on teaching a life-skill of swimming. The City s current aquatic programs are robust given a lack of pool. The development of a municipal aquatic center allows the City to grow their already robust program and control their own destiny as it relates to aquatic programming and general public access. While there are a number of municipal aquatic facilities in the market there are not a significant number with a good theme or brand. The City has a unique opportunity to separate themselves from the rest of the market based on the bodies of water included in the facility, combined with an appropriate brand. The City has aquatic professionals on staff that are well versed in programming, risk management and aquatic operations. The addition of a municipal aquatic facility will have an impact on the number of part-time, and potentially full-time, staff needed for successful operations. However, there will not be a learning curve as it relates to aquatic operations. This is usually a significant hurdle that agencies have to plan meticulously for. There is an opportunity to develop a 50M pool, become a regional provider, and increase the economic on the community. It also provides opportunity for other aquatics sports like master swimming, water polo and synchronized swimming. 42 BROOKLYN PARK - FAMILY AQUATIC CENTER FEASIBILITY STUDY


51 CONCEPT OPTIONS OVERVIEW Six options were considered for potential Brooklyn Park aquatic facilities; four options include an addition/renovation to the existing Community Activity Center (CAC), and two options include development of aquatic facilities on a new, unidentified site. A description of each option is included in the following pages of this section. The six options include: Option 1: Family Aquatic Center at CAC Option 4: Family Aquatic Center/50 Meter Pool at New Site Option 2: Family Aquatic Center/Gym/Fitness at CAC Option 5: Gym/Fitness at CAC Option 3: Family Aquatic Center/Gym/Fitness/ 50 Meter Pool at CAC Option 6: 50 Meter Pool at New Site BROOKLYN PARK - FAMILY AQUATIC CENTER FEASIBILITY STUDY 43


52 CONCEPT OPTIONS FACILITY COMPONENTS Components included in each option were based on feedback derived from survey results of the park planning process, public and teen workshops, and input meetings with city staff and stakeholder groups. Each option is unique and does not include all proposed facility components. Options explored inclusion of various components to evaluate the impact on the sites, on the estimated construction costs and on the operations proformas. Building program documents lists of all spaces and their associated square footages can be found in the Appendix. Major components included throughout the concept options include: Indoor Pools Leisure Pool: This is a irregularly-shaped pool with play features and a zero-depth entry that gradually slopes from the deck, becoming deeper with each step much like a natural beach. Other leisure pool features may include a current channel (moving water that provides some resistance) and a plunge area (a deeper section at the base of a water slide). Leisure pools range in depth according to features, and are typically warm water pools running between degrees Fahrenheit. Leisure pools are used for play, but can also be used for aquatic exercise or lessons. Lesson/Lap Pool: This is a rectangular, 25-yard-long pool (the length of a competition short course) that can be used for lessons, lap swimming and aquatic exercise. The number of lanes can vary, and typical lane widths fall between 8 to 10 feet. The depth of the pool can also vary. If used only for lessons, exercise or lap swimming, the pool depth may be 3 to 4 feet over the extent of the pool. If it s also used for competitive swimming practice or competitions, the depth would be greater. A 7-foot depth allows for diving from the edge of the pool or starting blocks a 3 to 4-foot depth allows for flip turns. The water temperature of this pool ranges from degrees Fahrenheit. 50 Meter Pool: This is an Olympic-size pool (50-meters long by 25-yards wide) that can be used for competition long courses (50 meters) and competition short courses (25 yards). Depending upon the pool depth, it can also be used for lap swimming, exercise classes and general recreation. If used only for competition or lap swimming, the depth may be 7 to 8 feet throughout. If used for aquatic exercise and general recreation, in addition to competition or lap swimming, the depth may vary from 3 to 4 feet on one end to provide a shallow area for general recreation and fitness activities to 7 feet on the other. The water temperature of this pool ranges from degrees Fahrenheit. 44 BROOKLYN PARK - FAMILY AQUATIC CENTER FEASIBILITY STUDY


53 CONCEPT OPTIONS Outdoor Splashpad Outdoor splashpads are areas that have little to no standing water. They include play features or ground nozzles that spray water. The splashpad deck is a textured, non-slip surface. Party Rooms Party rooms are spaces with tables, seating and a kitchenette area with a sink and counter for serving. They are typically located adjacent to the pool deck and can be reserved for birthday parties or other events. Living Room The living room is the central gathering space and common area for the community facilities. Its intended to be a space where people can meet and hang out, and would include reception, a seating area, access to concessions and restrooms. It could also include elements such as coffee bar, fireplace or lounge area. Locker Rooms Women s locker rooms, men s locker rooms and all gender locker rooms are indicated in the diagrams. The women s and men s locker rooms include changing areas with lockers, toilets, vanity areas, and individual showers. The all gender locker rooms, formerly called family locker rooms, include individual changing rooms with showers and toilets, and a common area with lockers. BROOKLYN PARK - FAMILY AQUATIC CENTER FEASIBILITY STUDY 45
, and area for individual fitness (cardio or weight training).")


54 CONCEPT OPTIONS Fitness Space Fitness spaces include areas for group fitness (yoga, spinning or other fitness classes), and area for individual fitness (cardio or weight training). Gym The multi-purpose gymnasium, with walking track above, is sized to include a full-size basketball court with cross-courts. It could be used for various activities basketball, volleyball, pickleball, indoor play space and more. Additional Components In addition to the major project components, concept options include support spaces such as lifeguard and aquatic offices, sauna, pool mechanical rooms, pool storage, general office space, concessions, and public restrooms. For options at the CAC site,components of the existing facilities would require improvements in association with the proposed facility additions. Particulars of these spaces are outlined on the concept diagrams that follow in this section. 46 BROOKLYN PARK - FAMILY AQUATIC CENTER FEASIBILITY STUDY


55 CONCEPT OPTIONS SITES Concept options were developed for two sites: the existing CAC site and an unidentified, new site. New Site The new site is unidentified, so concept options and associated site improvements were generalized and used to determine the approximate acreage needed for the proposed facilities. The size of site required for a new aquatic facility ranges from 12.5 to 15 acres. CAC Site Concept options at the CAC site were developed as additions to the existing facility. Numerous approaches to the location of the proposed additions were considered, but one general approach was selected for its response to facility entry and existing parking, and for its potential to retain and enhance the existing garden/park area to the south of the existing CAC. Proposed site changes are similar for all options at the CAC and include the following: 1 Shifting main entry drive and drop off The most significant change is the proposed removal of the existing entry drive and drop-off. The entry off of 85th Avenue would remain, but would only access parking on the east end of the existing facility. The entry drive in the proposed concept options would be located at the existing entry from Edinbrook Terrace to the north. Relocation of the facility s main entry allows the existing, main parking area to relate more closely to the facility s entry, and also allows expansion and development of the existing event green space and garden. The existing green space could be enhanced for events and provide exterior space for programs. 2 Expansion of parking on the east Parking on the east end of the existing facility has been expanded. The expanded parking area provides more spaces for the facility in general, but also helps zone access when multiple events are occurring at the CAC. People attending events or meetings in the banquet spaces would have parking available at the east end of the building, in addition to the parking on the west. 3 Expansion of parking on the west/ Removal of existing building In all concept options, the existing parking to the west has been expanded. Existing entry drives off of Edinbrook Terrace remain. Additional landscaping has been included to soften the expansive parking area. In some options the existing, unused library remains; in one option the building is removed to further expand the parking area. 4 Relocation of facility main entry In all concept options, the main building entry is located to the north of the facility. This allows a direct connection between the main parking area and the building entry, and removes traffic on the south, providing opportunities to create connections between the facility s interior spaces and the exterior event green space/garden and Sunfish Pond. Existing Entry from Edinbrook Terrace 4 Existing CAC Existing Entry from 85th Avenue BROOKLYN PARK - FAMILY AQUATIC CENTER FEASIBILITY STUDY 47
56 CONCEPT OPTIONS OPERATIONAL PLAN ASSUMPTIONS Six operational plans, coinciding with the six facility concepts options, were prepared. The operational plans vary based on components included in each option, and on the overall attractiveness to the aquatic community and the public. These assumptions do not include debt payment in the capital or operating projections. The following assumptions are consistent with all six operational plans. Assumptions In all operational models it is assumed that the City of Brooklyn Park will be responsible for the operation of the facility. Which is to say they will be responsible for full-time and part-time staff, commodities, contractual obligations and capital improvement. In addition, City staff will be responsible for admissions, concessions, programming and rental of the facility. In the case of aquatic events, like swim meets, it is assumed that Brooklyn Park would rent the facility to perspective swim clubs that want to host a meet. It will then be the responsibility of the swim club to secure timers, officials and other staff necessary to run a successful event. The City will have staff on-site that can respond in the case of equipment challenges or emergency, but the responsibility of administering the event would fall to the host club. It is assumed that the market will not drastically change over the next 3-5 years, which is to say that another indoor pool (leisure or competitive) will not enter the market. It also assumes that none of the non-profit and private markets will not shift or expand. It is assumed that aquatics portion of the facility will have multiple purposes. Depending on the model the focus could be on the social and recreation aspects of swimming. There is also the possibility of once the 50M pool is introduced that there would be a significant focus on competitive swimming. The fitness and gymnasium components are important to specific models as it increases the appeal to the public and provides for additional revenue streams. The addition of the fitness component also allows for increases to be made to the fee structure and membership rates. It is assumed that the facility will operate year around. The staff schedule is based on a 51-week operation. The staffing structure is reflective of other models B*K has observed and focuses on having a managerial level position on-site almost 100% of the time. The lifeguard staffing plan assumes that if the pool is open and occupied, by anyone regardless of abilities, that there is a lifeguard on-duty and on-stand. This includes any instructional courses, open swim, swim practices or swim meets. The fee structure for membership, admission, and programs is consistent with the market identified in the study. The same can be said for lap lane rental rates. The facilities, those with the 50M pool configuration, focus strictly on competitive swimming because that market currently exists. These same models do not account for revenue that could be generated from masters swimming, water polo, or synchronized swimming. Because of water depth in the 50M pool the assumption has been made that competitive diving could not be accommodated. The operational model accounts for some lap lane rental associated with practices. Those practices are undefined as they could be for high schools, a local club team, or outside youth groups looking to secure lane time. The hours of operation are consistent with other facilities in the market and fluctuate between hours of access per week. To access the building there is a tiered structure of both resident and non-resident rates. There is a daily admission identified for youth, adult, senior and family, a 10-visit punch pass option and an annual membership identified for youth, adult, senior and family. The specific rate structure varies with the different options and amenities. There are a sizeable number of programs factored into the overall operation. It is important to note that these are all NEW programs and do not account for existing programs that the Recreation Department is currently offering that could be absorbed by the facility, based on the model. Aquatic programs include; aquatic group exercise, swim lessons, therapy classes, birthday parties, etc. Non-aquatic programs include; group exercise, enrichment programs, leagues and pickleball. Rental revenue is based on lap lane rental for practices, shortcourse swim meets, long-course swim meets, full-facility rentals, etc. It is important to note that both the aquatic programs, non-aquatic programs, and rentals are not factored at capacity, which means there is opportunity to increase the cost recovery percentage. Full-time and part-time staffing rates are consistent with the City s current and projected future levels. 48 BROOKLYN PARK - FAMILY AQUATIC CENTER FEASIBILITY STUDY

57 CONCEPT OPTIONS Opon 1: Family Aquac Center at CAC Project Construcon Cost: $23.6 M $18.7 Family Aqua!cs + $4.9 Other Improvements Family Aqua!cs The family aqua!cs por!on Includes a leisure pool with play features and a water slide, a six-lane lap pool, outdoor splashpad, locker rooms, party rooms, living room, and support spaces. Other Improvements Other improvements include renova!on of exis!ng ice arena lobby (2 levels), relocated/renovated senior center, relocated nature preschool, exis!ng banquet corridor refresh, and site improvements (parking and removal of drive to exis!ng main entry). BROOKLYN PARK FAMILY AQUATIC CENTER FEASIBILITY STUDY 49


58 CONCEPT OPTIONS Opon 1: Family Aquac Center at CAC Upper Level BROOKLYN PARK FAMILY AQUATIC CENTER FEASIBILITY STUDY 50
59 CONCEPT OPTIONS Opon 1: Operaons Assumpons Hours of Opera!on: 98 Hours per Week Monday-Friday 6:00A-9:00P Saturday 7:00A-9:00P Sunday 10:00A-7:00P Admission Free Structure Daily Drop-In Fees Resident Non-Resident Youth $7.00 $9.00 Adult $9.00 $11.00 Senior $7.00 $9.00 Family $28.00 $35.00 Lap Swim Punch Pass Fee Resident Non-Resident 10 Visit Punch Pass $70.00 $88.00 Annual Membership Resident Non-Resident Youth $150 $188 Adult $200 $275 Senior $150 $188 Family $450 $570 Program Factors Aqua!c Group Exercise Swim Lessons Birthday Par!es Rental Revenue Prac!ce Rental Mul!-Purpose Room Rental Full Facility Rental Compensa!on Wages Front Desk Lifeguard Lead Lifeguard Pool A"endant Concessions Program Staff Full Time Staff Program Assistant III Maintenance Janitorial $10.00/hr $11.00/hr $14.00/hr $10.00/hr $10.00/hr Variable B*K has developed the following opera!onal projec!ons for the City of Brooklyn Park, MN. The informa!on used to develop the opera!onal plan includes informa!on that B*K gathered while on-site and B*K s familiarity with similar opera!ons. Opera!onal projec!ons are based on the best available informa!on and are developed in a conserva!ve fashion. Expenses: Personnel Full-Time 224, Part-Time 596, Total $821, Commodi!es & Contractual Office supplies 2, Clothing Supplies (staff uniforms) 2, License/Cer!fica!on 2, Janitorial & Cleaning Supplies 12, Chemical Supplies (Pool Chemicals) 20, Educa!on/Recrea!on supplies 7, Other Supplies 2, Food/Beverage (concessions) 10, Food & Beverage (staff) 1, Non-Capital Items 2, Rental 5, Special Services 12, Telephone Services 1, Electric Service 130, Gas Service 40, Water/Sewer 15, Maintenance Other Equipment 4, Adver!sing 1, General Services (prin!ng fees) 1, Credit Card Fees 1 6, Travel Training 2, Membership 1, Total $285, % of total revenue generation. Expenses Staffing 821, Commodi!es & Contractual 285, Capital 75, Total $1,178, Percentage of Expense Budget by Category Full-Time Staffing Detail: Posi!on Salary Number Total Program Assistant III Maintenance (CPO) 62, ,400 40, ,000 Janitorial 35, ,000 Subtotal 172,400 Benefits 30% 51,720 Total $224,120 Part-Time Staffing Detail: Posi!on Rate/Hr Hours/ Wk Weeks Total Front Desk School , Front Desk Non School , Lifeguard School , Lifeguard Non School Lead Lifeguard School Lead Lifeguard Non-School Pool A"endant School Pool A"endant Non-School Concessions School Concessions Non- School Custodial (part-!me supplement) , , , , , , , , Sub-Total 470, Programs 2 72, Sub-Total 542, Benefits 10.0% 54, Total $596, The compensation rate varies by the program. Capital Alloca!on Replacement Fund 75, Total $75, BROOKLYN PARK FAMILY AQUATIC CENTER FEASIBILITY STUDY 51
60 CONCEPT OPTIONS Opon 1: Operaons Assumpons (connued) The following revenue opportuni!es are based on informa!on B*K gathered while on-site and that the City provided. It is important to note that the revenue numbers reflected in this report are not a maximum. Class par!cipa!on is reflec!ve of 60% satura!on. The market penetra!on rate for membership numbers are less than 5%; the private sector typically a#empts to be at 5-10% based on a 5-mile radius service area. These sta!s!cs point to opportunity for an increase in revenue genera!on if marketed and operated appropriately. Revenues: Category Pool Opera!on Fees Daily 193, Drop-In Punch Card 25, Annual Membership 147, Rentals 41, Sub-Total 407, Programs Aqua!c 241, Sub-Total 241, Other Birthday Par!es 21, Concessions 3 35, Misc. 5, Sub-Total 61, Total 710, Concession revenues are factored based on daily admissions and a per visit spending. Percentage of Revenue Budget by Category Pool Revenue/Expense Comparison: Year 1 Expenses $1,181,909 Revenues $710,699 Difference ($471,210) Cost Recovery Percentage 60% The following provides a 5-year comparison for the opera!on of the facility and is based on the best informa!on available at the!me of the report. It is important to note that the opera!onal expenses are an!cipated to increase at a rate of 1-2% per year over this 5-year span. It is also important to note that this 5-year span projects a 7% increase in revenues from year 1-2, a 5% increase in year 2-3, a 3% increase in year 3-4, and a 3% increase in year 4-5 Category Year 1 Year 2 Year 3 Year 4 Year 5 Expenses $1,181,909 $1,193,728 $1,217,602 $1,241,954 $1,279,213 Revenues $710,699 $760,447 $798,470 $822,424 $847,097 Difference ($471,210) ($433,280) ($419,132) ($419,530) ($432,116) Recovery % 60% 64% 66% 66% 66% Based on the work that B*K has completed across the country, most stand-alone aqua!c centers can operate at a 50-75% cost recovery rate based on market and opera!ng philosophy. The inclusion of dry fitness has an impact on the membership numbers. BROOKLYN PARK FAMILY AQUATIC CENTER FEASIBILITY STUDY 52

61 CONCEPT OPTIONS Opon 2: Family Aquac Center/Gym/Fitness at CAC Project Construcon Cost: $29.5 M $18.7 Family Aqua!cs + $ 4.9 Other Improvements + $5.9 Gym/Fitness Family Aqua!cs The family aqua!cs por!on Includes a leisure pool with play features and a water slide, a six-lane lap pool, outdoor splashpad, locker rooms, party rooms, living room, and support spaces. Other Improvements Other improvements include renova!on of exis!ng ice arena lobby (2 levels), relocated/renovated senior center, relocated nature preschool, exis!ng banquet corridor refresh, and site improvements (parking and removal of drive to exis!ng main entry). Gym/Fitness Gym/fitness elements include a gymnasium with mul!-purpose courts, a walking/running track, group fitness studios and open fitness space with cardio and weights. BROOKLYN PARK FAMILY AQUATIC CENTER FEASIBILITY STUDY 53

62 CONCEPT OPTIONS Opon 2: Family Aquac Center/Gym/Fitness at CAC Upper Level BROOKLYN PARK FAMILY AQUATIC CENTER FEASIBILITY STUDY 54
63 CONCEPT OPTIONS Opon 2: Operaons Assumpons Hours of Opera!on: 98 Hours per Week Monday-Friday 6:00A-9:00P Saturday 7:00A-9:00P Sunday 10:00A-7:00P Admission Free Structure Daily Drop-In Fees Resident Non-Resident Youth $8.00 $10.00 Adult $10.00 $13.00 Senior $8.00 $10.00 Family $35.00 $10.00 Lap Swim Punch Pass Fee Resident Non-Resident 10 Visit Punch Pass $ $ Annual Membership Resident Non-Resident Youth $300 $375 Adult $360 $450 Senior $300 $375 Family $600 $750 Program Factors Aqua!c Group Exercise Swim Lessons Birthday Par!es Group Exercise (dry) Leagues Drop-In Pickleball Enrichment Programs Rental Revenue Prac!ce Rental Mul!-Purpose Room Rental Court Rental Full Facility Rental Compensa!on Wages Front Desk Lifeguard Lead Lifeguard Pool A"endant Concessions Program Staff Full Time Staff Program Assistant III Program Assistant I Maintenance Janitorial $10.00/hr $11.00/hr $14.00/hr $10.00/hr $10.00/hr Variable B*K has developed the following opera!onal projec!ons for the City of Brooklyn Park, MN. The informa!on used to develop the opera!onal plan includes informa!on that B*K gathered while on-site and B*K s familiarity with similar opera!ons. Opera!onal projec!ons are based on the best available informa!on and are developed in a conserva!ve fashion. Expenses: Personnel Full-Time 328, Part-Time 721, Total $1,049, Commodi!es & Contractual Office supplies 3, Clothing Supplies (staff uniforms) 2, License/Cer!fica!on 2, Janitorial & Cleaning Supplies 17, Chemical Supplies (Pool Chemicals) 20, Educa!on/Recrea!on supplies 10, Other Supplies 3, Food/Beverage (concessions) 16, Food & Beverage (staff) 1, Non-Capital Items 2, Rental 5, Special Services 12, Telephone Services 1, Electric Service 195, Gas Service 80, Water/Sewer 15, Maintenance Other Equipment 7, Adver!sing 1, General Services (prin!ng fees) 1, Credit Card Fees 1 13, Travel Training 2, Membership 1, Total 414, % of total revenue generation. Capital Alloca!on Replacement Fund 75, Total $75, Expenses Staffing 1,049, Commodi!es & Contractual 414, Capital 75, Total $1,538, Percentage of Expense Budget by Category Full-Time Staffing Detail: Posi!on Salary Number Total Program Assistant III Program Assistant I Maintenance (CPO) 62, ,400 45, ,000 40, ,000 Janitorial 35, ,000 Subtotal 252,400 Benefits 30% 75,720 Total $328,120 Part-Time Staffing Detail: Posi!on Rate/Hr Hours/ Wk Weeks Total Front Desk School , Front Desk Non School , Lifeguard School , Lifeguard Non School Lead Lifeguard School Lead Lifeguard Non-School Pool A"endant School Pool A"endant Non-School Gym A"endant School Gym A"endant Non School Concessions School Concessions Non- School Custodial (part-!me supplement) , , , , , , , , , , Sub-Total 496, Programs 2 158, Sub-Total 654, Benefits 10.0% 65, Total $720, The compensation rate varies by the program. BROOKLYN PARK FAMILY AQUATIC CENTER FEASIBILITY STUDY 55
64 CONCEPT OPTIONS Opon 2: Operaons Assumpons (connued) The following revenue opportuni!es are based on informa!on B*K gathered while on-site and that the City provided. It is important to note that the revenue numbers reflected in this report are not a maximum. Class par!cipa!on is reflec!ve of 60% satura!on. The market penetra!on rate for membership numbers are less than 5%; the private sector typically a#empts to be at 5-10% based on a 5-mile radius service area. These sta!s!cs point to opportunity for an increase in revenue genera!on if marketed and operated appropriately. Revenues: Category Pool Opera!on Fees Daily 358, Drop-In Punch Card 36, Annual Membership 452, Rentals 72, Sub-Total 918, Programs Aqua!c 241, Non-Aqua!c 76, Sub-Total 318, Pool Revenue/Expense Comparison: Year 1 Expenses $1,538,999 Revenues $1,316,513 Difference ($222,486) Cost Recovery Percentage 86% The following provides a 5-year comparison for the opera!on of the facility and is based on the best informa!on available at the!me of the report. It is important to note that the opera!onal expenses are an!cipated to increase at a rate of 1-2% per year over this 5-year span. It is also important to note that this 5-year span projects a 7% increase in revenues from year 1-2, a 5% increase in year 2-3, a 3% increase in year 3-4, and a 3% increase in year 4-5. Other Birthday Par!es 21, Concessions 3 53, Misc. 5, Sub-Total 79, Total $1,316, Concession revenues are factored based on daily admissions and a per visit spending. Percentage of Revenue Budget by Category Category Year 1 Year 2 Year 3 Year 4 Year 5 Expenses $1,538,999 $1,554,389 $1,585,476 $1,617,186 $1,665,702 Revenues $1,316,513 $1,408,668 $1,479,102 $1,523,475 $1,569,179 Difference ($222,486) ($145,720) ($106,375) ($93,711) ($96,522) Recovery % 86% 91% 93% 94% 94% This model has a significant be#er cost recovery rate than others. The primary reason being is that the aqua!cs area appeals to the greatest spectrum of par!cipants, combined with dry-side components, in par!cular fitness which equates to the draw for membership. BROOKLYN PARK FAMILY AQUATIC CENTER FEASIBILITY STUDY 56

65 CONCEPT OPTIONS Opon 3: Family Aquac Center/Gym/Fitness/50 Meter Pool at CAC Project Construcon Cost: $41.4 M $18.7 Family Aqua!cs + $ 4.9 Other Improvements + $5.9 Gym/Fitness + $ Meter Pool Family Aqua!cs The family aqua!cs por!on Includes a leisure pool with play features and a water slide, a six-lane lap pool, outdoor splashpad, locker rooms, party rooms, living room, and support spaces. Other Improvements Other improvements include renova!on of exis!ng ice arena lobby (2 levels), renovated/expanded senior center, exis!ng banquet corridor refresh, and site improvements (parking and removal of drive to exis!ng main entry). Gym/Fitness Gym/fitness elements include a gymnasium with mul!-purpose courts, a walking/running track, group fitness studios and open fitness space with cardio and weights. 50-Meter Pool 50-Meter pool elements include a 50-meter by 25-yard pool, locker rooms, concessions, restrooms and office space. BROOKLYN PARK FAMILY AQUATIC CENTER FEASIBILITY STUDY 57


66 CONCEPT OPTIONS Opon 3: Family Aquac Center/Gym/Fitness/ 50 Meter Pool at CAC Upper Level BROOKLYN PARK FAMILY AQUATIC CENTER FEASIBILITY STUDY 58
67 CONCEPT OPTIONS Opon 3: Operaons Assumpons Hours of Opera!on: 98 Hours per Week Monday-Friday 6:00A-9:00P Saturday 7:00A-9:00P Sunday 10:00A-7:00P Admission Free Structure Daily Drop-In Fees Resident Non-Resident Youth $8.00 $10.00 Adult $10.00 $13.00 Senior $8.00 $10.00 Family $35.00 $40.00 Lap Swim Punch Pass Fee Resident Non-Resident 10 Visit Punch Pass $ $ Annual Membership Resident Non-Resident Youth $300 $375 Adult $360 $450 Senior $300 $375 Family $600 $750 Program Factors Aqua!c Group Exercise Swim Lessons Birthday Par!es Group Exercise (dry) Leagues Drop-In Pickleball Enrichment Programs Rental Revenue Prac!ce Rental Mul!-Purpose Room Rental Court Rental Full Facility Rental Compensa!on Wages Front Desk Lifeguard Lead Lifeguard Pool A"endant Concessions Program Staff Full Time Staff Program Assistant III Program Assistant II Program Assistant I Maintenance Janitorial $10.00/hr $11.00/hr $14.00/hr $10.00/hr $10.00/hr Variable B*K has developed the following opera!onal projec!ons for the City of Brooklyn Park, MN. The informa!on used to develop the opera!onal plan includes informa!on that B*K gathered while on-site and B*K s familiarity with similar opera!ons. Opera!onal projec!ons are based on the best available informa!on and are developed in a conserva!ve fashion. Expenses: Personnel Full-Time 614, Part-Time 895, Total $1,509, Commodi!es & Contractual Office supplies 4, Clothing Supplies (staff uniforms) 3, License/Cer!fica!on 2, Janitorial & Cleaning Supplies 25, Chemical Supplies (Pool Chemicals) 35, Educa!on/Recrea!on supplies 12, Other Supplies 3, Food/Beverage (concessions) 65, Food & Beverage (staff) 2, Non-Capital Items 2, Rental 5, Special Services 17, Telephone Services 1, Electric Service 315, Gas Service 95, Water/Sewer 45, Maintenance Other Equipment 10, Adver!sing 1, General Services (prin!ng fees) 2, Credit Card Fees 1 21, Travel Training 2, Membership 1, Total $673, % of total revenue generation. Capital Alloca!on Replacement Fund 125, Total $125, Expenses Staffing 1,509, Commodi!es & Contractual 673, Capital 125, Total $2,307, Percentage of Expense Budget by Category Full-Time Staffing Detail: Posi!on Salary Number Total Program Assistant III Program Assistant II Program Assistant I Maintenance (CPO) 62, ,400 55,000 2 $110,000 45, ,000 40, ,000 Janitorial 35, ,000 Subtotal 472,400 Benefits 30% 141,720 Total $614,120 Part-Time Staffing Detail: Posi!on Rate/Hr Hours/Wk Weeks Total Front Desk School Front Desk Non School , , Lifeguard School , Lifeguard Non School Lead Lifeguard School Lead Lifeguard Non-School Pool A"endant School Pool A"endant Non-School Assistant Manager Weekends Gym A"endant School Gym A"endant Non School Concessions School Concessions Non-School Custodial (part-!me supplement) , , , , , , , , , , , Sub-Total 640, Programs 2 173, Sub-Total 813, Benefits 10.0% 81, Total $895, The compensation rate varies by the program. BROOKLYN PARK FAMILY AQUATIC CENTER FEASIBILITY STUDY 59
68 CONCEPT OPTIONS Opon 3: Operaons Assumpons (connued) The following revenue opportuni!es are based on informa!on B*K gathered while on-site and that the City provided. It is important to note that the revenue numbers reflected in this report are not a maximum. Class par!cipa!on is reflec!ve of 60% satura!on. The market penetra!on rate for membership numbers are less than 5%; the private sector typically a#empts to be at 5-10% based on a 5-mile radius service area. These sta!s!cs point to opportunity for an increase in revenue genera!on if marketed and operated appropriately. Revenues: Category Pool Opera!on Fees Daily 312, Drop-In Punch Card 36, Annual Membership 452, Rentals 696, Sub-Total 1,430, Programs Aqua!c 428, Non-Aqua!c 76, Sub-Total 505, Other Birthday Par!es 21, Concessions 3 218, Misc. 5, Sub-Total 244, Total $2,181, Concession revenues are factored based on daily admissions and a per visit spending. Percentage of Revenue Budget by Category Revenue Notes: It is the opinion of B*K that the rental revenue projec!ons are aggressive based on the market for year-1 opera!on. The rental figures assume a swim team ren!ng 16 lanes for 5 hours per day $10/hr/lane. The City will want a mul!-year contract with said club team. The rental for aqua!c compe!!on assumes 40.4% of weeks per year. The 25Y meets assume 800 par!cipants per $9.00 per par!cipant and the 50M meets assume 45 par!cipants per $9.00 per par!cipant. The addi!on of a 50M pool and the associated penetra!on rate for meets, which equate to approximately $2.3 million economic impact on the area, less hotel rooms. The City will want to secure a minimum rental fee per day for meets equivalent to $3,600 which equates to $15/hr/lane for 12 hours of 25Y configura!on or $30/hr/ lane for 12 hours of 50M configura!on. The revenue figures do not factor charging spectators a daily admission, but this is an area the City could explore to close the subsidy gap. It is the opinion of B*K that the City should be selec!ve with which meets they do charge admission for and which they do not. Pool Revenue/Expense Comparison: Year 1 Expenses $2,307,555 Revenues $2,181,330 Difference ($126,225) Cost Recovery Percentage 95% The following provides a 5-year comparison for the opera!on of the facility and is based on the best informa!on available at the!me of the report. It is important to note that the opera!onal expenses are an!cipated to increase at a rate of 1-2% per year over this 5-year span. It is also important to note that this 5-year span projects a 7% increase in revenues from year 1-2, a 5% increase in year 2-3, a 3% increase in year 3-4, and a 3% increase in year 4-5. Category Year 1 Year 2 Year 3 Year 4 Year 5 Expenses $2,307,555 $2,330,630 $2,377,243 $2,424,788 $2,497,532 Revenues $2,181,330 $2,334,023 $2,450,724 $2,524,246 $2,599,973 Difference ($126,225) $3,393 $73,481 $99,458 $102,442 Recovery % 95% 100% 103% 104% 104% The 50M compe!!ve pool, while a very unique amenity, shi:s the opera!onal model of the facility from a community aqua!c/recrea!on center to a compe!!ve aqua!c center with addi!onal focus on community recrea!on. BROOKLYN PARK FAMILY AQUATIC CENTER FEASIBILITY STUDY 60
69 CONCEPT OPTIONS Opon 4: Family Aquac Center/50 Meter Pool at New Site Project Construcon Cost: $31.8 M $18.7 Family Aqua!cs + $ Meter Pool Family Aqua!cs The family aqua!cs por!on Includes a leisure pool with play features and a water slide, a six-lane lap pool, outdoor splashpad, locker rooms, party rooms, living room, and support spaces. 50-Meter Pool 50-Meter pool elements include a 50-meter by 25-yard pool, locker rooms, training area, proshop, concessions, restrooms and office space. BROOKLYN PARK FAMILY AQUATIC CENTER FEASIBILITY STUDY 61

70 CONCEPT OPTIONS Opon 4: Family Aquac Center/50 Meter Pool at New Site BROOKLYN PARK FAMILY AQUATIC CENTER FEASIBILITY STUDY 62
71 CONCEPT OPTIONS Opon 4: Operaons Assumpons Hours of Opera!on: 98 Hours per Week Monday-Friday 6:00A-9:00P Saturday 7:00A-9:00P Sunday 10:00A-7:00P Admission Free Structure Daily Drop-In Fees Resident Non-Resident Youth $7.00 $9.00 Adult $9.00 $11.00 Senior $7.00 $9.00 Family $28.00 $35.00 Lap Swim Punch Pass Fee Resident Non-Resident 10 Visit Punch Pass $70.00 $88.00 Annual Membership Resident Non-Resident Youth $150 $188 Adult $200 $275 Senior $150 $188 Family $400 $570 Program Factors Aqua!c Group Exercise Swim Lessons Birthday Par!es Group Exercise (dry) Rental Revenue Prac!ce Rental Full Facility Rental Compensa!on Wages Front Desk Lifeguard Lead Lifeguard Pool A"endant Concessions Program Staff Full Time Staff Program Assistant III Program Assistant II Program Assistant I Maintenance Janitorial $10.00/hr $11.00/hr $14.00/hr $10.00/hr $10.00/hr Variable B*K has developed the following opera!onal projec!ons for the City of Brooklyn Park, MN. The informa!on used to develop the opera!onal plan includes informa!on that B*K gathered while on-site and B*K s familiarity with similar opera!ons. Opera!onal projec!ons are based on the best available informa!on and are developed in a conserva!ve fashion. Expenses: Personnel Full-Time 568, Part-Time 770, Total $1,339, Commodi!es & Contractual Office supplies 4, Clothing Supplies (staff uniforms) 3, License/Cer!fica!on 2, Janitorial & Cleaning Supplies 25, Chemical Supplies (Pool Chemicals) 35, Educa!on/Recrea!on supplies 12, Other Supplies 3, Food/Beverage (concessions) 61, Food & Beverage (staff) 2, Non-Capital Items 2, Rental 5, Special Services 17, Telephone Services 1, Electric Service 260, Gas Service 75, Water/Sewer 25, Maintenance Other Equipment 10, Adver!sing 1, General Services (prin!ng fees) 2, Credit Card Fees 1 17, Travel Training 2, Membership 1, Total $569, % of total revenue generation. Capital Alloca!on Replacement Fund 125, Total $125, Expenses Staffing 1339, Commodi!es & Contractual 569, Capital 125, Total $2,034, Percentage of Expense Budget by Category Full-Time Staffing Detail: Posi!on Salary Number Total Program Assistant III Program Assistant II Program Assistant I Maintenance (CPO) 62, ,400 55, ,000 45, ,000 40, ,000 Janitorial 35, ,000 Subtotal 437,400 Benefits 30% 131,220 Total $568,620 Part-Time Staffing Detail: Posi!on Rate/Hr Hours/ Wk Weeks Total Front Desk School , Front Desk Non School , Lifeguard School , Lifeguard Non School , Lead Lifeguard School Lead Lifeguard Non- School Pool A"endant School Pool A"endant Non- School Assistant Manager Weekends , , , , , Concessions School , Concessions Non- School Custodial (part-!me supplement) , , Sub-Total 613, Programs 2 87, Sub-Total 700, Benefits 10.0% 70, Total 770, The compensation rate varies by the program. The total accounts for aquatic and non-aquatic program instructors. BROOKLYN PARK FAMILY AQUATIC CENTER FEASIBILITY STUDY 63
72 CONCEPT OPTIONS Opon 4: Operaons Assumpons (connued) The following revenue opportuni!es are based on informa!on B*K gathered while on-site and that the City provided. It is important to note that the revenue numbers reflected in this report are not a maximum. Class par!cipa!on is reflec!ve of 60% satura!on. The market penetra!on rate for membership numbers are less than 5%; the private sector typically a#empts to be at 5-10% based on a 5-mile radius service area. These sta!s!cs point to opportunity for an increase in revenue genera!on if marketed and operated appropriately. Revenues: Category Fees Pool Opera!on Daily 193, Drop-In Punch Card 25, Swim Meet Spectator Fee 64, Annual Membership 164, Rentals 607, Sub-Total 1,055, Programs Aqua!c 428, Sub-Total 361, Other Birthday Par!es 21, Concessions 3 205, Misc. 5, Sub-Total 231, Total $1,715, Concession revenues are factored based on daily admissions and a per visit spending. Percentage of Revenue Budget by Category Revenue Notes: It is the opinion of B*K that the rental revenue projec!ons are aggressive based on the market for year-1 opera!on. The rental figures assume a swim team ren!ng 16 lanes for 5 hours per day $10/hr/lane. The City will want a mul!-year contract with said club team. The rental for aqua!c compe!!on assumes 40.4% of weeks per year. The 25Y meets assume 800 par!cipants per $9.00 per par!cipant and the 50M meets assume 45 par!cipants per $9.00 per par!cipant. The addi!on of a 50M pool and the associated penetra!on rate for meets, which equate to approximately $2.3 million economic impact on the area, less hotel rooms. The City will want to secure a minimum rental fee per day for meets equivalent to $3,600 which equates to $15/hr/lane for 12 hours of 25Y configura!on or $30/ hr/lane for 12 hours of 50M configura!on. Pool Revenue/Expense Comparison: Year 1 Expenses $2,034,180 Revenues $1,715,424 Difference ($318,757) Cost Recovery Percentage 84% The following provides a 5-year comparison for the opera!on of the facility and is based on the best informa!on available at the!me of the report. It is important to note that the opera!onal expenses are an!cipated to increase at a rate of 1-2% per year over this 5-year span. It is also important to note that this 5-year span projects a 7% increase in revenues from year 1-2, a 5% increase in year 2-3, a 3% increase in year 3-4, and a 3% increase in year 4-5. Category Year 1 Year 2 Year 3 Year 4 Year 5 Expenses $2,034,180 $2,054,522 $2,095,612 $2,137,525 $2,201,650 Revenues $1,715,424 $1,835,503 $1,927,278 $1,985,097 $2,044,650 Difference ($318,757) ($219,019) ($168,334) ($152,428) ($157,001) Recovery % 84% 89% 92% 93% 93% BROOKLYN PARK FAMILY AQUATIC CENTER FEASIBILITY STUDY 64
, renovated/expanded senior center, exis!ng banquet corridor refresh, and site improvements (parking and removal of drive to exis!ng main entry).")
73 CONCEPT OPTIONS Opon 5: Gym/Fitness at CAC Project Construcon Cost: $12.5 M $2.1 Other Improvements + $10.4 Gym/Fitness Other Improvements Other improvements include renova!on of exis!ng ice arena lobby (2 levels), renovated/expanded senior center, exis!ng banquet corridor refresh, and site improvements (parking and removal of drive to exis!ng main entry). Gym/Fitness Gym/fitness elements include a gymnasium with mul!-purpose courts, a walking/running track, group fitness studios and open fitness space with cardio and weights. BROOKLYN PARK FAMILY AQUATIC CENTER FEASIBILITY STUDY 65

74 CONCEPT OPTIONS Opon 5: Gym/Fitness at CAC Upper Level BROOKLYN PARK FAMILY AQUATIC CENTER FEASIBILITY STUDY 66
75 CONCEPT OPTIONS Opon 5: Operaons Assumpons Hours of Opera!on: 98 Hours per Week Monday-Friday 6:00A-9:00P Saturday 7:00A-9:00P Sunday 10:00A-7:00P Admission Free Structure Daily Drop-In Fees Resident Non-Resident Youth $7.00 $9.00 Adult $9.00 $11.00 Senior $7.00 $9.00 Family $28.00 $35.00 Lap Swim Punch Pass Fee Resident Non-Resident 10 Visit Punch Pass $70.00 $88.00 Annual Membership Resident Non-Resident Youth $150 $188 Adult $200 $275 Senior $150 $188 Family $400 $570 Program Factors Group Exercise (dry) Birthday Par!es Leagues Drop-in Pickleball Enrichment Programs Rental Revenue Mul!-Purpose Room Court Rental Full Facility Rental Compensa!on Wages Front Desk Lifeguard Lead Lifeguard Pool A"endant Concessions Program Staff Full Time Staff Maintenance Janitorial $10.00/hr $11.00/hr $14.00/hr $10.00/hr $10.00/hr Variable B*K has developed the following opera!onal projec!ons for the City of Brooklyn Park, MN. The informa!on used to develop the opera!onal plan includes informa!on that B*K gathered while on-site and B*K s familiarity with similar opera!ons. Opera!onal projec!ons are based on the best available informa!on and are developed in a conserva!ve fashion. Expenses: Personnel Full-Time 143, Part-Time 276, Total $419, Commodi!es & Contractual Office supplies 1, Clothing Supplies (staff uniforms) 1, License/Cer!fica!on 1, Janitorial & Cleaning Supplies 12, Chemical Supplies (Pool Chemicals) Educa!on/Recrea!on supplies 5, Other Supplies 1, Food/Beverage (concessions) 6, Food & Beverage (staff) 1, Non-Capital Items 2, Rental 2, Special Services 2, Telephone Services 1, Electric Service 150, Gas Service 25, Water/Sewer 3, Maintenance Other Equipment 2, Adver!sing 1, General Services (prin!ng fees) 1, Credit Card Fees 1 5, Travel Training 1, Membership 1, Total $230, % of total revenue genera"on. Capital Alloca!on Replacement Fund 25, Total $25, Expenses Staffing 419, Commodi!es & Contractual 230, Capital 25, Total $675, Percentage of Expense Budget by Category Full-Time Staffing Detail: Posi!on Salary Number Total Maintenance 40, ,000 Janitorial 35, ,000 Subtotal 110,000 Benefits 30% 33,000 Total $143,000 Part-Time Staffing Detail: Posi!on Rate/Hr Hours/ Wk Front Desk School Front Desk Non School Gym A"endant School Gym A"endant Non-School Concessions School Concessions Non-School Custodial (part-!me supplement) Weeks Total , , , , , , , Sub-Total 163, Programs 2 88, Sub-Total 251, Benefits 10.0% 25, Total $276, The compensa"on rate varies by the program. The total accounts for aqua"c and non-aqua"c program instructors. BROOKLYN PARK FAMILY AQUATIC CENTER FEASIBILITY STUDY 67
76 CONCEPT OPTIONS Opon 5: Operaons Assumpons (connued) The following revenue opportuni!es are based on informa!on B*K gathered while on-site and that the City provided. It is important to note that the revenue numbers reflected in this report are not a maximum. Class par!cipa!on is reflec!ve of 60% satura!on. The market penetra!on rate for membership numbers are less than 5%; the private sector typically a#empts to be at 5-10% based on a 5-mile radius service area. These sta!s!cs point to opportunity for an increase in revenue genera!on if marketed and operated appropriately. Revenues: Category Pool Opera!on Fees Daily 157, Drop-In Punch Card 5, Annual Membership 249, Rentals 32, Pool Revenue/Expense Comparison: Year 1 Expenses $675,421 Revenues $564,333 Difference ($111,087) Cost Recovery Percentage 84% Sub-Total 445, Programs Non-Aqua!c 76, Sub-Total 76, Other Birthday Par!es 16, Concessions 3 20, Misc. 5, Sub-Total 42, Total $564, Concession revenues are factored based on daily admissions and a per visit spending. The following provides a 5-year comparison for the opera!on of the facility and is based on the best informa!on available at the!me of the report. It is important to note that the opera!onal expenses are an!cipated to increase at a rate of 1-2% per year over this 5-year span. It is also important to note that this 5-year span projects a 7% increase in revenues from year 1-2, a 5% increase in year 2-3, a 3% increase in year 3-4, and a 3% increase in year 4-5. Category Year 1 Year 2 Year 3 Year 4 Year 5 Expenses $675,421 $682,175 $695,818 $709,735 $731,027 Revenues $564,333 $603,837 $634,028 $653,049 $672,641 Difference ($111,087) ($78,338) ($61,790) ($56,685) ($58,386) Recovery % 84% 89% 91% 92% 92% Percentage of Revenue Budget by Category BROOKLYN PARK FAMILY AQUATIC CENTER FEASIBILITY STUDY 68
77 CONCEPT OPTIONS Opon 6: 50 Meter Pool at New Site Project Construcon Cost: $24.5 M $ Meter Pool 50-Meter Pool 50-Meter pool elements include a 50-meter by 25-yard pool, a 25-yard, 6-lane lesson/lap pool, locker rooms, training area, therapy pool with changing area, proshop, concessions, restrooms and office space. BROOKLYN PARK FAMILY AQUATIC CENTER FEASIBILITY STUDY 69

78 CONCEPT OPTIONS Opon 6: 50 Meter Pool at New Site BROOKLYN PARK FAMILY AQUATIC CENTER FEASIBILITY STUDY 70

79 CONCEPT OPTIONS Opon 6: Operaons Assumpons Hours of Opera!on: 98 Hours per Week Monday-Friday 6:00A-9:00P Saturday 7:00A-9:00P Sunday 10:00A-7:00P Admission Free Structure Daily Drop-In Fees Resident Non-Resident Youth $7.00 $9.00 Adult $9.00 $11.00 Senior $7.00 $9.00 Family $28.00 $35.00 Lap Swim Punch Pass Fee Resident Non-Resident 10 Visit Punch Pass $70.00 $88.00 Annual Membership Resident Non-Resident Youth $150 $188 Adult $200 $275 Senior $150 $188 Family $400 $570 Program Factors Aqua!c Group Exercise Swim Lessons Birthday Par!es Group Exercise (dry) Rental Revenue Prac!ce Rental Full Facility Rental 25Y Swim Meets 50M Swim Meets Compensa!on Wages Front Desk Lifeguard Lead Lifeguard Pool A"endant Concessions Program Staff $10.00/hr $11.00/hr $14.00/hr $10.00/hr $10.00/hr Variable B*K has developed the following opera!onal projec!ons for the City of Brooklyn Park, MN. The informa!on used to develop the opera!onal plan includes informa!on that B*K gathered while on-site and B*K s familiarity with similar opera!ons. Opera!onal projec!ons are based on the best available informa!on and are developed in a conserva!ve fashion. Expenses: Personnel Full-Time 471, Part-Time 619, Total $1,090, Commodi!es & Contractual Office supplies 3, Clothing Supplies (staff uniforms) 2, License/Cer!fica!on 2, Janitorial & Cleaning Supplies 22, Chemical Supplies (Pool Chemicals) 32, Educa!on/Recrea!on supplies 10, Other Supplies 3, Food/Beverage (concessions) 37, Food & Beverage (staff) 1, Non-Capital Items 2, Rental 5, Special Services 17, Telephone Services 1, Electric Service 200, Gas Service 60, Water/Sewer 15, Maintenance Other Equipment 10, Adver!sing 1, General Services (prin!ng fees) 2, Credit Card Fees 1 14, Travel Training 1, Membership 1, Total $448, % of total revenue genera"on. Expenses Staffing 1,090, Commodi!es & Contractual 448, Capital 100, Total $1,639, Percentage of Expense Budget by Category Full-Time Staffing Detail: Posi!on Salary Number Total Program Assistant III 62, ,400 Program Assistant II 55, ,000 Program Assistant I 45, ,000 Maintenance (CPO) 40, ,000 Janitorial 35, ,000 Subtotal 362,400 Benefits 30% 108,720 Total $471,120 Part-Time Staffing Detail: Posi!on Rate/Hr Hours/ Wk Weeks Total Front Desk School , Front Desk Non School , Lifeguard School , Lifeguard Non School Lead Lifeguard School Lead Lifeguard Non-School Pool A"endant School Pool A"endant Non-School Assistant Manager Weekends Concessions School Concessions Non- School Custodial (part-!me supplement) Sub-Total 468, , , , , , , , , , Programs 2 94, Sub-Total 563, Benefits 10.0% 56, Full Time Staff Program Assistant III Program Assistant II Program Assistant I Maintenance Janitorial Capital Alloca!on Replacement Fund 100, Total $100, Total 619, The compensa"on rate varies by the program. The total accounts for aqua"c and non-aqua"c program instructors. BROOKLYN PARK FAMILY AQUATIC CENTER FEASIBILITY STUDY 71
80 CONCEPT OPTIONS Opon 6: Operaons Assumpons (connued) The following revenue opportuni!es are based on informa!on B*K gathered while on-site and that the City provided. It is important to note that the revenue numbers reflected in this report are not a maximum. Class par!cipa!on is reflec!ve of 60% satura!on. The market penetra!on rate for membership numbers are less than 5%; the private sector typically a#empts to be at 5-10% based on a 5-mile radius service area. These sta!s!cs point to opportunity for an increase in revenue genera!on if marketed and operated appropriately. Revenues: Category Pool Opera!on Fees Daily 78, Drop-In Punch Card 25, Annual Membership 73, Swim Meet Admission 64, Rentals 677, Sub-Total 919, Programs Aqua!c 428, Sub-Total 428, Other Birthday Par!es 4, Concessions 3 179, Misc. 5, Sub-Total 189, Total $1,537, Concession revenues are factored based on daily admissions and a per visit spending. Percentage of Revenue Budget by Category Revenue Notes: It is the opinion of B*K that the rental revenue projec!ons are aggressive based on the market for year-1 opera!on. The rental figures assume a swim team ren!ng 16 lanes for 5 hours per day $10/hr/lane. The City will want a mul!-year contract with said club team. The rental for aqua!c compe!!on assumes 40.4% of weeks per year. The 25Y meets assume 800 par!cipants per $9.00 per par!cipant and the 50M meets assume 45 par!cipants per $9.00 per par!cipant. The addi!on of a 50M pool and the associated penetra!on rate for meets, which equate to approximately $2.3 million economic impact on the area, less hotel rooms. The City will want to secure a minimum rental fee per day for meets equivalent to $3,600 which equates to $15/hr/lane for 12 hours of 25Y configura!on or $30/ hr/lane for 12 hours of 50M configura!on. The therapy pool represents approximately $90,000 in rental revenue. The City will want to secure a 3rd party provider for specific therapy classes. Typically local health care providers welcome such an opportunity. Pool Revenue/Expense Comparison: Year 1 Expenses $1,656,080 Revenues $1,537,285 Difference ($118,795) Cost Recovery Percentage 93% The following provides a 5-year comparison for the opera!on of the facility and is based on the best informa!on available at the!me of the report. It is important to note that the opera!onal expenses are an!cipated to increase at a rate of 1-2% per year over this 5-year span. It is also important to note that this 5-year span projects a 7% increase in revenues from year 1-2, a 5% increase in year 2-3, a 3% increase in year 3-4, and a 3% increase in year 4-5. Category Year 1 Year 2 Year 3 Year 4 Year 5 Expenses $1,656,080 $1,672,641 $1,706,093 $1,740,215 $1,792,422 Revenues $1,537,285 $1,614,149 $1,678,715 $1,712,290 $1,746,535 Difference ($118,795) ($58,491) ($27,378) ($27,926) ($45,887) Recovery % 93% 97% 98% 98% 97% BROOKLYN PARK FAMILY AQUATIC CENTER FEASIBILITY STUDY 72
81 APPENDIX BROOKLYN PARK FAMILY AQUATIC CENTER FEASIBILITY STUDY 73
82 APPENDIX 74 BROOKLYN PARK! FAMILY AQUATIC CENTER FEASIBILITY STUDY
83 APPENDIX BROOKLYN PARK FAMILY AQUATIC CENTER FEASIBILITY STUDY 75

84 APPENDIX 76 BROOKLYN PARK! FAMILY AQUATIC CENTER FEASIBILITY STUDY
85 APPENDIX BROOKLYN PARK FAMILY AQUATIC CENTER FEASIBILITY STUDY 77
86 APPENDIX 78 BROOKLYN PARK! FAMILY AQUATIC CENTER FEASIBILITY STUDY
87 APPENDIX BROOKLYN PARK FAMILY AQUATIC CENTER FEASIBILITY STUDY 79
88 APPENDIX 80 BROOKLYN PARK! FAMILY AQUATIC CENTER FEASIBILITY STUDY
89 APPENDIX BROOKLYN PARK FAMILY AQUATIC CENTER FEASIBILITY STUDY 81
90 APPENDIX 82 BROOKLYN PARK! FAMILY AQUATIC CENTER FEASIBILITY STUDY

91 APPENDIX BROOKLYN PARK FAMILY AQUATIC CENTER FEASIBILITY STUDY 83
92 APPENDIX 84 BROOKLYN PARK! FAMILY AQUATIC CENTER FEASIBILITY STUDY

93 APPENDIX BROOKLYN PARK FAMILY AQUATIC CENTER FEASIBILITY STUDY 85

94 APPENDIX 86 BROOKLYN PARK! FAMILY AQUATIC CENTER FEASIBILITY STUDY

95 APPENDIX BROOKLYN PARK FAMILY AQUATIC CENTER FEASIBILITY STUDY 87
96 APPENDIX 88 BROOKLYN PARK! FAMILY AQUATIC CENTER FEASIBILITY STUDY

97 APPENDIX BROOKLYN PARK FAMILY AQUATIC CENTER FEASIBILITY STUDY 89

98 APPENDIX 90 BROOKLYN PARK! FAMILY AQUATIC CENTER FEASIBILITY STUDY

99 APPENDIX BROOKLYN PARK FAMILY AQUATIC CENTER FEASIBILITY STUDY 91
100 APPENDIX 92 BROOKLYN PARK! FAMILY AQUATIC CENTER FEASIBILITY STUDY
101 APPENDIX BROOKLYN PARK FAMILY AQUATIC CENTER FEASIBILITY STUDY 93

102 APPENDIX 94 BROOKLYN PARK! FAMILY AQUATIC CENTER FEASIBILITY STUDY

103 APPENDIX BROOKLYN PARK FAMILY AQUATIC CENTER FEASIBILITY STUDY 95
104 APPENDIX 96 BROOKLYN PARK! FAMILY AQUATIC CENTER FEASIBILITY STUDY

105 APPENDIX BROOKLYN PARK FAMILY AQUATIC CENTER FEASIBILITY STUDY 97
106 APPENDIX 98 BROOKLYN PARK! FAMILY AQUATIC CENTER FEASIBILITY STUDY

107 APPENDIX BROOKLYN PARK FAMILY AQUATIC CENTER FEASIBILITY STUDY 99

108 APPENDIX 100 BROOKLYN PARK! FAMILY AQUATIC CENTER FEASIBILITY STUDY
109 APPENDIX BROOKLYN PARK FAMILY AQUATIC CENTER FEASIBILITY STUDY 101
110 APPENDIX 102 BROOKLYN PARK! FAMILY AQUATIC CENTER FEASIBILITY STUDY

111 APPENDIX BROOKLYN PARK FAMILY AQUATIC CENTER FEASIBILITY STUDY 103

112 APPENDIX 104 BROOKLYN PARK! FAMILY AQUATIC CENTER FEASIBILITY STUDY

113 APPENDIX BROOKLYN PARK FAMILY AQUATIC CENTER FEASIBILITY STUDY 105
114 APPENDIX 106 BROOKLYN PARK! FAMILY AQUATIC CENTER FEASIBILITY STUDY

115 APPENDIX BROOKLYN PARK FAMILY AQUATIC CENTER FEASIBILITY STUDY 107

116 APPENDIX 108 BROOKLYN PARK! FAMILY AQUATIC CENTER FEASIBILITY STUDY
117 APPENDIX BROOKLYN PARK FAMILY AQUATIC CENTER FEASIBILITY STUDY 109
118 APPENDIX 110 BROOKLYN PARK! FAMILY AQUATIC CENTER FEASIBILITY STUDY
119 APPENDIX BROOKLYN PARK FAMILY AQUATIC CENTER FEASIBILITY STUDY 111

120 APPENDIX 112 BROOKLYN PARK! FAMILY AQUATIC CENTER FEASIBILITY STUDY

121 APPENDIX BROOKLYN PARK FAMILY AQUATIC CENTER FEASIBILITY STUDY 113

122 APPENDIX 114 BROOKLYN PARK! FAMILY AQUATIC CENTER FEASIBILITY STUDY
123 APPENDIX BROOKLYN PARK FAMILY AQUATIC CENTER FEASIBILITY STUDY 115
124 APPENDIX 116 BROOKLYN PARK! FAMILY AQUATIC CENTER FEASIBILITY STUDY

125 APPENDIX BROOKLYN PARK FAMILY AQUATIC CENTER FEASIBILITY STUDY 117

126 APPENDIX 118 BROOKLYN PARK! FAMILY AQUATIC CENTER FEASIBILITY STUDY

127 APPENDIX BROOKLYN PARK FAMILY AQUATIC CENTER FEASIBILITY STUDY 119

128 APPENDIX 120 BROOKLYN PARK! FAMILY AQUATIC CENTER FEASIBILITY STUDY
129 APPENDIX BROOKLYN PARK FAMILY AQUATIC CENTER FEASIBILITY STUDY 121
130 APPENDIX 122 BROOKLYN PARK! FAMILY AQUATIC CENTER FEASIBILITY STUDY
131 APPENDIX BROOKLYN PARK FAMILY AQUATIC CENTER FEASIBILITY STUDY 123
132 APPENDIX,-! A'* '" *,-.,.! "" # $%& ' ( $%) ') & *+ "!!!, * -.$/ 0""" * 12%" 3 4 " + " ( $5 + " 1 + " ( 2, )),# # 4 " 1'+ " 3, +' )!!! 3, ",!! / ' ' # * "" # *67 8:9 "" # 9'+ " 66 ;3 < ' "#$%"!" #$%&$' /=1=4 > (? ( &)%*+)!,- & &'(),!!. & / "66' " /$/ / + 6% 33# (''%*!%% ( /$%#/$ 124 BROOKLYN PARK! FAMILY AQUATIC CENTER FEASIBILITY STUDY
133 APPENDIX,-! A'* '" 1,- 0.,.! "" # $%& ' ( ) ') & *+ "!!!, * -.$/ 0""" * 12%" 3 4 " + " ( $5 + " 1 + " ( 2, )),# # 4 " 1'+ " 3, +' )!!! 3, ",!! 0! "#$ %! $ $ % +",%- / ' ' # * "" # *67 8:9 "" # 9'+ " 66 ;3 < ' "#$%"!" )'%1$' /=1=4 > ( +1%##)!,- & &'(),!!. & / "66' " /$/ / + 6% 33# (''%*!%% ( $&%/*$ BROOKLYN PARK FAMILY AQUATIC CENTER FEASIBILITY STUDY 125
134 APPENDIX,-! A'* '" #,- 0/'.,. 1* #"0 3! "" ( %. /#%'! 0 12 *+ ", 7' & $%& ' ') $%) 11'")!!! * -.$/ 0""" * 12%" 3# 1% 4 " + " ( $5 + " 1 + " ( 2, )),# # 4 " 1'+ " 3, +' ) 3, 3 129)!* &!!! 1 + ",!! 0! "#$ %! $ $ % +",%- / ' ' * "" # *67 8:9 "" # * "" 9'+ " 66 ;3 < ' "#$%"!" 2/%#$' /=1=4 >?( ( **&%&/)!,- & &'(),!!. & / 0 / + 6% 33# (''%*!%% ( *11%&#$ 126 BROOKLYN PARK! FAMILY AQUATIC CENTER FEASIBILITY STUDY
135 APPENDIX,-! A'* '" &,- /'34 1* #"0 3! "" ( %. /#%'! 0 12 *+ ", 7' # & $%& ' ') $%) 11'")!!! * -.$/ 0""" * 12%" 3# 1% / " 84 " # + " / " 8$5 + " / " 81 ( + " 4 " + " # $5 + " 1 + " ( 3 ) &44? 3 *67 84 " *67 81? # / ' ' # * 66+ ' "#$%" 3!" +'%&'' /=1=4 > # ( $&%&$'!,- & &'() ( $$%'$' BROOKLYN PARK FAMILY AQUATIC CENTER FEASIBILITY STUDY 127
136 APPENDIX,-! A'* '" /0.,. 4 " + " ( $5 + " 1 + " ( 2, )),# # 4 " 1'+ " 3, +' )!!! 3, ",!! 0 5"" ' 6 9 5"& ' B8/ & B& ' ' 3 +",%- / ' ' # * "" # *67 8:9 "" # 9'+ " 66 ;3 < ' "#$%"!" #+%*$' /=1=4 > (3 ( &&%)*),!!. & / "66' " /$/ / + 6% 33# (''%*!%% ( BROOKLYN PARK! FAMILY AQUATIC CENTER FEASIBILITY STUDY
137 APPENDIX,-! A'* '" )/'34 1* #"0 3 #! "" %. /#%'! 0 12 ( 7*! "" # *1%.%.( -1!" *+ ", 7' # $%& ' 3 '!!! 3 * -.$/ 0""" * 12%" 1% 4 "5 + " # $5 + " 1A + " ( ) C? &44 *67 84 " * ? # / ' ' # 66+ ' "#$%"!" /#%2'' /=1=4 > (# ( )&%)$' BROOKLYN PARK FAMILY AQUATIC CENTER FEASIBILITY STUDY 129


138 APPENDIX Teen Workshop/April Teens who were par"cipa"ng in Youth in Government Day took part in a design workshop where they planned the layout and selected ameni"es for the proposed aqua"c facility. GROUP 1 GROUP BROOKLYN PARK! FAMILY AQUATIC CENTER FEASIBILITY STUDY


139 APPENDIX GROUP 3 GROUP 4 BROOKLYN PARK FAMILY AQUATIC CENTER FEASIBILITY STUDY 131

 in combination to support each other 4.")

140 APPENDIX Community Workshop April 18, 2018 Brooklyn Park Community Activity Center Priority elements from small group discussions (7 tables) 1. Wellness, solar panels, 50 meter pool, stacked parking and accessibility for all 2. Place for all ages, group and individual fitness, fitness trail, multi-purpose courts, indoor and outdoor pool, zero-depth entry pool, and place to view into pools, living room with fireplace meter pool with a bulkhead to separate areas within the pool, diving, other features (gym, fitness, etc.) in combination to support each other 4. Multi-purpose gym with courts for basketball and pickleball, walking track, fitness studio, wheelchair-friendly facility, heated therapy pool, a current channel in the pool, party rooms, diving, fireplace and view outdoors 5. Pool for lessons and water sports, a current channel that adults can use too, an outdoor splashpad, concessions that are open all the time, family changing rooms, gym that can be divided for multiple activities, walking track, fitness areas meter pool separate from the CAC, a relaxing space with concessions, a quiet space for meeting and stretching, gymnasium space, locker rentals, electronic board with activities so people know what s happening meter pool, amenities for all people so people stay in this community, fitness and other elements for families who have children swimming Information/desire amenities from table discussions and notecards Leisure pool preferences Current channel Water slides Lazy river Zero-depth entry Obstacle course Spray fountains and waterfalls Lily pads Central location for the community Love the resistance wave Leisure pool needed Spa/therapy pool Accessible for all ramps into water Warm water for therapy 132 BROOKLYN PARK! FAMILY AQUATIC CENTER FEASIBILITY STUDY
141 APPENDIX Therapy pool needed Splashpad Outdoor with ground sprays and fountains and interactive features Outdoor spray features (spray features in leisure pool as well) Bottom-up spray features, floor geysers, fountains and toy features (animals, cars, etc.) Include indoor and outdoor splashpad 50 meter pool Would help give ability for our children to compete and develop into high-level swimmers There is a strong swim club in Brooklyn Park The UMN and Rochester have 50 meter pools, nothing else in our area Would be nice to have other amenities with the pool so that when children are swimming other members of the family could work-out Would be nice to have a space to view children swimming Could be a regional draw Could bring economic development to Brooklyn Park The swim club uses area school pools but there is nowhere to train in a 50 meter pool The 25-yeard lap pool in other options couldn t be used for meets as there is no seating around the pool and no place to watch from the lobby. Where are the other 50 meter pools? Will there be enough demand to justify it? 50 meter facility separate from the CAC is a top priority partnerships! 50 meter pool is our money maker Lesson pool To be used for activities for all ages Accommodate exercise and fitness Use for fun Use for learning Include a separate therapy pool Gym Fitness trail and walking track Courts for basketball and volleyball Multipurpose space Space that could also be used for large events Space that could be used for fitness group programming Like use for basketball and pickleball Walking track a priority More gym and other fitness opportunities at the CAC campus Gym with activities for all young and old Fitness Group studio space Include space for spinning/rowing Aerobic space Free-weight area Sell memberships for fitness Fitness areas/studios (maybe three rooms) Wheelchair friendly/wheelchair-sport friendly BROOKLYN PARK FAMILY AQUATIC CENTER FEASIBILITY STUDY 133
142 APPENDIX Accessible fitness and NuStep/adapted fitness Enough room for seniors to have a defined area Support space Family locker rooms and gender-neutral locker rooms Sauna Poolside seating (behind glass) Space to watch activities Party rooms for revenue Snack and concession areas for revenue Living room Visual observation of the pool Nice welcoming control desk Nice general seating Fireplace (great hall) during the wintertime Lobby as a gathering area Warm (not cold) Need counter Outdoor observation A fireplace is nice but... Need welcoming front of the house with easier access to staff and better wayfinding friendlier Priority for chalet style living room/lounge with concessions a quiet space for teams and families to gather/relax Other/overall theme Diving board Warmed heated pools Concessions Locker area Party area Need better locker rooms and rentable lockers At a 50 meter facility, offer other pools for lessons, fitness and fun (indoor pools) Call the facility a wellness center Consider solar panels For us to make this work, it needs to be bold and different, something that draws people to come to our city. We need opportunities for all a thriving community, inspiring pride A walking path Party rooms Locker rooms Stacked parking Front porch with great sight lines Accessibility for all 134 BROOKLYN PARK! FAMILY AQUATIC CENTER FEASIBILITY STUDY


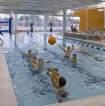
143 APPENDIX Community Workshop/April BROOKLYN PARK FAMILY AQUATIC CENTER FEASIBILITY STUDY 135


144 APPENDIX 136 BROOKLYN PARK! FAMILY AQUATIC CENTER FEASIBILITY STUDY


145 APPENDIX BROOKLYN PARK FAMILY AQUATIC CENTER FEASIBILITY STUDY 137


146 APPENDIX 138 BROOKLYN PARK! FAMILY AQUATIC CENTER FEASIBILITY STUDY


147 APPENDIX Community Meeng/April BROOKLYN PARK FAMILY AQUATIC CENTER FEASIBILITY STUDY 139


148 APPENDIX 140 BROOKLYN PARK! FAMILY AQUATIC CENTER FEASIBILITY STUDY


149 APPENDIX BROOKLYN PARK FAMILY AQUATIC CENTER FEASIBILITY STUDY 141


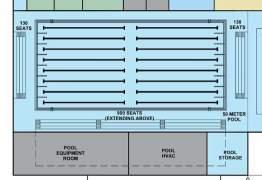
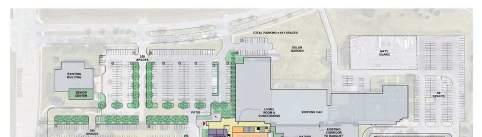

150 APPENDIX 142 BROOKLYN PARK! FAMILY AQUATIC CENTER FEASIBILITY STUDY


151 APPENDIX BROOKLYN PARK FAMILY AQUATIC CENTER FEASIBILITY STUDY 143
152 APPENDIX 144 BROOKLYN PARK! FAMILY AQUATIC CENTER FEASIBILITY STUDY
153 APPENDIX Op!on 1: Family Aqua!c Center at the CAC Cost of Construcon $16,992,000 Inflaon Escalaon Factor $708,000 Conngency $2,360,000 Furshishings, Fixtures, and Equipment $1,180,000 Tesng, Design, and Engineering $2,360,000 Total Project Cost $23,600,000 Op!on 2: Family Aqua!c Center/Gym/Fitness at the CAC Cost of Construcon $21,240,000 Inflaon Escalaon Factor $885,000 Conngency $2,950,000 Furshishings, Fixtures, and Equipment $1,475,000 Tesng, Design, and Engineering $2,950,000 Total Project Cost $29,500,000 Op!on 3: Family Aqua!c Center/Gym/Fitness/50 Meter Pool at the CAC Cost of Construcon $29,808,000 Inflaon Escalaon Factor $1,242,000 Conngency $4,140,000 Furshishings, Fixtures, and Equipment $2,070,000 Tesng, Design, and Engineering $4,140,000 Total Project Cost $41,400,000 BROOKLYN PARK FAMILY AQUATIC CENTER FEASIBILITY STUDY 145
154 APPENDIX Op!on 4: Family Aqua!c Center/50 Meter Pool at New Site Cost of Construcon $22,896,000 Inflaon Escalaon Factor $954,000 Conngency $3,180,000 Furshishings, Fixtures, and Equipment $1,590,000 Tesng, Design, and Engineering $3,180,000 Total Project Cost $31,800,000 Op!on 5: Gym/Fitness at the CAC Cost of Construcon $9,000,000 Inflaon Escalaon Factor $375,000 Conngency $1,250,000 Furshishings, Fixtures, and Equipment $625,000 Tesng, Design, and Engineering $1,250,000 Total Project Cost $12,500,000 Op!on 6: 50 Meter Pool at New Site Cost of Construcon $17,640,000 Inflaon Escalaon Factor $735,000 Conngency $2,450,000 Furshishings, Fixtures, and Equipment $1,225,000 Tesng, Design, and Engineering $2,450,000 Total Project Cost $24,500, BROOKLYN PARK! FAMILY AQUATIC CENTER FEASIBILITY STUDY
155 APPENDIX Cost Estimating Clarifications In Options 1, 2, 3, and 5, construction costs include the cost of constructing the building, modification to the existing CAC, site improvements, including parking, drives, walks, and landscape improvements, to the existing Community Activity Center site. In Options 4 and 6, the construction costs include the cost of constructing the building, and parking areas, and drives, and walks and typical site improvements on a 15-arce site. The Inflation Escalation Factor is estimated at 3% to adjust for predicted increases in construction cost over the next 12 months. Should the project be constructed more than 1 year later, this should be adjusted The contingency is set at 10% of the estimated consturction cost. This will allow for design development and potential changes in construction costs over the design period. The Furnishings, Fixtures, and Equipment amount in the allowance for purchasing necessary items not part of the building itself and is set at 5% of the estimate construction. This is based on similar projects designed by 292 Design Group and constructed by RJM Construction. Testing, Design, and Engineering fees are the estimated cost of soft costs for the architectual and engineering for the documents to construct the building. Options 1, 2, 3, and 5, include costs for demolition of the library to expand the parking areas. All options on the CAC included a $200,000 allowance for the relocation of the water main connected to the well on the CAC site. Note this is a projected allowance, no engineering or specific cost estimating has been done on the relocation. Excluded Costs It is important to note the costs outlined in the above Project Costs do not include: Cost of purchasing a site in Options 4 and 6. Unusual site development cost that cna occur on sites with bad soils, or steep topography, or requiring extensive utility improvements, or other potential expenses. It is recommended that the before purchasing or selecting any site for the project, that the site be examined for these potential costs. Not included in the Project Cost are the costs for bond sales, interest on the bonds, or other financing costs. Although there are costs for the demolition of the library included in Options 1, 2, 3, and 5 to construct expanded parking, there are no costs allocated for purchasing the library and its site from Hennepin County. BROOKLYN PARK FAMILY AQUATIC CENTER FEASIBILITY STUDY 147

156
John H. Furbee Aquatics Center Operations Study
 Final Report John H. Furbee Aquatics Center Operations Study Ken Ballard Ballard*King & Associates 2743 E Ravenhill Cir. Highlands Ranch, CO 80126 (303) 470-8661 ken@ballardking.com March 6, 2013 Table
Feasibility Study to Assess the Viability of Developing Shared Indoor Pool/Aquatic Facility
 City of University Park, Texas Feasibility Study to Assess the Viability of Developing Shared Indoor Pool/Aquatic Facility Draft Report December 10, 2014 2743 Ravenhill Circle, Highlands Ranch, CO 80126
University Park, Texas
 City of University Park, Texas Feasibility Study to Assess the Viability of Developing Shared Indoor Pool/Aquatic Facility Final Report January 7, 2015 2743 Ravenhill Circle, Highlands Ranch, CO 80126
COMMUNITY AQUATIC FACILITY
 COMMUNITY AQUATIC FACILITY Brunswick, Maine Feasibility Study Prepared for: Town of Brunswick Parks & Recreation Department Prepared by: Bargmann Hendrie + Archetype, Inc. Boston, MA December 16, 2016
Aquatic Facility Feasibility Study Falmouth, MA. Presented By: James Preisig: Falmouth Aquatics Kevin Post: Counsilman-Hunsaker
 Aquatic Facility Feasibility Study Falmouth, MA Presented By: James Preisig: Falmouth Aquatics Kevin Post: Counsilman-Hunsaker Agenda 1. Introduction to Falmouth Aquatics 2. Counsilman-Hunsaker Process
LAKE BLUFF PARK DISTRICT BLAIR PARK SWIMMING POOL Questions and Answers OVERVIEW
 LAKE BLUFF PARK DISTRICT BLAIR PARK SWIMMING POOL Questions and Answers www.lakebluffparks.org OVERVIEW Q: How did the community rate the pool on the Community Wide survey? A: The top three highest rated
Athletic Field Use & Demand Analysis Study
 Athletic Field Use & Demand Analysis Study Final Report October 13, 2014 2743 Ravenhill Circle * Highlands Ranch, CO 80126 * 303.470.3014 * www.ballardking.com * bka@ballardking.com Table of Contents Section
Execuve Summary Site Overview Regional Map Traffic Count Comparison Site Overview Springdale Map Site Overview Rogers Map...
 INDEX Execuve Summary... 2 Site Overview Regional Map... 4 Traffic Count Comparison... 5 Site Overview Springdale Map... 6 Site Overview Rogers Map... 7 Radii Map 30-minute Drives... 8 Radii Map 60-minute
CITY COUNCIL AGENDA REPORT
 CITY COUNCIL AGENDA REPORT Subject: GROSVENOR POOL REPORT Recommendation(s) 1. That the Grosvenor Outdoor Pool Report Part 2, 2015, provided as Attachment 1 to the Grosvenor Pool Report agenda report dated
Rochester Area Bike Sharing Program Study
 roc bike share Rochester Area Bike Sharing Program Study Executive Summary ~ January 2015 JANUARY 2015 8484 Georgia Avenue, Suite 800 Silver Spring, MD 20910 3495 Winton Pl., Bldg E, Suite 110 Rochester,
Student Population Projections By Residence. School Year 2016/2017 Report Projections 2017/ /27. Prepared by:
 Student Population Projections By Residence School Year 2016/2017 Report Projections 2017/18 2026/27 Prepared by: Revised October 31, 2016 Los Gatos Union School District TABLE OF CONTENTS Introduction
Honey Lake Valley Recreation Authority Pool Community Workshop Presentation
 PREVIOUS WORK UNDERTAKEN BY HLVRA Phase I 19 sites were explored and scored for viability Phase II 3 finalists emerged 800 South Street Site Credence School Site* Mesa Street Site March 2014 Aquatic Design
APPENDIX 2 PROPOSAL FOR REPLACEMENT FOR POOLE (DOLPHIN) LEISURE CENTRE FINAL SPECIFICATION
 LEISURE CENTRE FINAL SPECIFICATION") APPENDIX 2 PROPOSAL FOR REPLACEMENT FOR POOLE (DOLPHIN) LEISURE CENTRE FINAL SPECIFICATION 1 PURPOSE 1.1 To provide the following information and supporting evidence for the Member decision (reference
APPENDIX 2 PROPOSAL FOR REPLACEMENT FOR POOLE (DOLPHIN) LEISURE CENTRE FINAL SPECIFICATION 1 PURPOSE 1.1 To provide the following information and supporting evidence for the Member decision (reference
A Look Ahead At 2014 And Lessons From 2013 Greater OKC Chamber
 A Look Ahead At 2014 And Lessons From 2013 Greater OKC Chamber One of the nation s largest chambers! More than 5,000 Members American Chamber of Commerce Executives Best of Show in 2012 Consistently rated
Community Development and Recreation Committee. General Manager, Parks, Forestry and Recreation. P:\2015\Cluster A\PFR\CD AFS#22685
 CD10.2 STAFF REPORT ACTION REQUIRED City of Toronto Outdoor Tennis Operations Date: February 19, 2016 To: From: Wards: Reference Number: Community Development and Recreation Committee General Manager,
WANAKA SWIMMING FACILITIES STATEMENT OF PROPOSAL
 WANAKA SWIMMING FACILITIES STATEMENT OF PROPOSAL 17 October 2014 Contents Executive Summary Background National Guidelines The Status Quo Issue One Timing Issue Two Location Issue Three Size Issue Four
Aquatic Concepts. July 23, 2018
 Aquatic Concepts July 23, 2018 DESIGN DIRECTION Lazy River Zero Depth Entry Water slides at least one for 48 + and one for little kids Spray features Indoor lap lanes Outdoor lap lanes that can accommodate
Town of Carbondale John M. Fleet Municipal Pool
 Town of Carbondale John M. Fleet Municipal Pool History Master Plans Survey Data Present Pool Funding RSUT Budget Actuals- 2014-2017 Budget FY 2018 Pool admittance numbers comparison 2015-2017 Cost Recovery
Big Sky Recreation Center Big Sky Event Center
 Big Sky Recreation Center Big Sky Event Center Feasibility Study Update The Isaac Sports Group And USAquatics March 13, 2014 AQUATICS Family Aquatic Center 84 to 86 degrees Zero Depth entry Maximum Depth
Delaware County s Fishing Industry
 Delaware County s Fishing Industry Economic Impact Study December, 2013 Prepared for: Delaware County Department of Economic Development Table of Contents 1.0 Background 1-1 2.0 2-1 2.1 Fishing Industry
Fred Endert Municipal Swimming Pool 10-Year Operations Master Plan Crescent City, CA
 Fred Endert Municipal Swimming Pool 10-Year Operations Master Plan Crescent City, CA Completed by: Counsilman-Hunsaker Contact: George Deines 2425 N. Central Expressway Suite 359 Richardson, TX 75080 972-370-3741
RunGR Races Partnership Opportunities 2018
 RunGR Races Partnership Opportunities 2018 February 2018 Dear Potenal Partner, For nearly two decades, RunGR has been providing opportunies in Grand Rapids and beyond for individuals to live, train, and
A Comparison for Ames, Iowa
 A Comparison for Ames, Iowa Overview Comparative analysis not concept planning Costs based on defined pool types and sizes Costs indexed to 2017 Pool examples shown Pool Types Considered Option 1 --- competition
Disc Golf at Battle Point Park. Bainbridge Island Metropolitan Park and Recreation District Board Meeting June 1, :00 pm
 Disc Golf at Battle Point Park Bainbridge Island Metropolitan Park and Recreation District Board Meeting June 1, 2017 6:00 pm 1 Recap of Ac+ons Taken To Date Met with the Board on December 1, 2016 to provide
Memo. Pat Hogan, USA Swimming Club Development Managing Director NEW MEMBERSHIP CATEGORY RECOMMENDATIONS
 Memo To: From: 2017 USA Swimming House of Delegates Pat Hogan, USA Swimming Club Development Managing Director RE: NEW MEMBERSHIP CATEGORY RECOMMENDATIONS Date: August 28, 2017 At the 2017 USAS Convention
Manatee County Parks & Natural Resources. John H. Marble Community Pool Revitalization & Marketing Plan Summer 2014
 Manatee County Parks & Natural Resources John H. Marble Community Pool Revitalization & Marketing Plan Summer 2014 Submitted March 2014 Manatee County Parks & Natural Resources John H. Marble Community
May 12, 2016 Metro Potential Ballot Measure Issue Brief: Local Return
 Summary: Local return is an important revenue source for cities to maintain their local transportation infrastructure. Most cities use their local return to operate small bus systems and repave streets,
Aquatic Facility Needs Assessment Study
 Aquatic Facility Needs Assessment Study Final Report September 5, 2012 In association with: Ken Ballard -President Darin Barr - Senior Associate BallardKing & Associates, Ltd. 2743 E. Ravenhill Circle
Bethel School District Aquatic Center Study. April 30, 2014
 Bethel School District Aquatic Center Study Prepared By The Sports Management Group April 30, 2014 Bethel School District Aquatic Center Study Prepared For The Bethel School District By The Sports Management
Compe&&ve Strategic Plan. February 2016
 Compe&&ve Strategic Plan Objec&ves, Strategies and Goals for RAGE compe&&ve soccer: Objec'ves are the ends (results) they define what you want to achieve. They are broad, non-specific statements,?meless,
Springville Aquat ic Act ivit y Cent er Explorat ory Commit t ee Meet ing Tuesday, February 24, :00pm
 Springville Aquat ic Act ivit y Cent er Explorat ory Commit t ee Meet ing Tuesday, February 24, 2015 7:00pm Members present: Alan Bird, Mark Brewer, Mike Stansfield, Devin Bird, Kathryn Crandall, Lesa
THE ECONOMIC CONTRIBUTION FROM HORSES
 THE ECONOMIC CONTRIBUTION FROM HORSES ECONOMIC CONTRIBUTION FROM HORSES HIGHLIGHTS The horse industry contributes more than $19 billion annually to the Canadian economy On-farm activities with horses generate
El Camino Real. Dear Transit, You Complete me. Love, The Street. Kevin Connolly Transit Planning Manager, Valley Transportation Authority
 El Camino Real Dear Transit, You Complete me. Love, The Street Kevin Connolly Transit Planning Manager, Valley Transportation Authority November 2012 BUS RAPID TRANSIT El Camino Real Plan/Eng: 2010-2014
Fiscal Impact of SunTrust Park and The Battery Atlanta on Cobb County Executive Summary Sept. 18, 2018
 Fiscal Impact of SunTrust Park and The Battery Atlanta on Cobb County Executive Summary Sept. 18, 2018 Overview Historically, professional sports stadiums were privately owned by the sports teams that
Transitions: 2019 Economic Forecast for Metro Denver February 6, 2019
 Transitions: 2019 Economic Forecast for Metro Denver February 6, 2019 Prepared by: Can Stock Photo / jkirsh In Partnership with: Consumer Changes and Influences Slowing population growth Aging of the population
Final Report, October 19, Socioeconomic characteristics of reef users
 Socioeconomic Study of Reefs in Southeast Florida - Executive Summary By Hazen and Sawyer in association with Florida State University and National Oceanic and Atmospheric Administration, October 19, 2001
SANDRINGHAM GOLF LINKS PROJECT
 SANDRINGHAM GOLF LINKS PROJECT STAKEHOLDER ENGAGEMENT BACKGROUND INFORMATION PAPER SEPTEMBER 2017 This paper provides information regarding the context for the concept proposal for the Sandringham Golf
North Liberty, Iowa. Aquatic Master Plan
 North Liberty, Iowa Aquatic Master Plan November 2016 North Liberty, Iowa Aquatic Master Plan Table of Contents Introduction 3 Executive Summary 3 Aquatic History 6 The Traditional Pool 6 The Trend in
The University of Georgia
 The University of Georgia Center for Agribusiness and Economic Development College of Agricultural and Environmental Sciences Economic Impacts of Alabama Quail Hunting Prepared by: Archie Flanders and
Big Changes, Unknown Impacts
 Big Changes, Unknown Impacts Boulder Economic Forecast Place cover image here Richard Wobbekind Senior Economist and Associate Dean for Business and Government Relations January 17, 2018 Real GDP Growth
PROSPECTUS: HEIGHTS SWIM CLUB, INC. AQUATICS FACILITY DEVELOPMENT January 20, 2017
 HEIGHTS SWIM CLUB, INC. AQUATICS FACILITY DEVELOPMENT January 20, 2017 Disclaimer Please read the following notice carefully before reading this prospectus (the Prospectus) prepared by the Heights Swim
University of Victoria Campus Cycling Plan Terms of Reference. 1.0 Project Description
 University of Victoria Campus Cycling Plan Terms of Reference 1.0 Project Description The Campus Cycling Plan, a first for the University, will provide a comprehensive and coordinated approach to support
Guidelines for Providing Access to Public Transportation Stations APPENDIX C TRANSIT STATION ACCESS PLANNING TOOL INSTRUCTIONS
 APPENDIX C TRANSIT STATION ACCESS PLANNING TOOL INSTRUCTIONS Transit Station Access Planning Tool Instructions Page C-1 Revised Final Report September 2011 TRANSIT STATION ACCESS PLANNING TOOL INSTRUCTIONS
ECONOMIC DEVELOPMENT ELEMENT
 ECONOMIC DEVELOPMENT ELEMENT Background The Economic Development Element considers labor force and labor force characteristics, employment by place of work and residence, and analysis of the community
City of Placerville M E M O R A N D U M. Steven M. Youel, Director of Community Services
 City of Placerville M E M O R A N D U M DATE: February 27, 2007 TO: FROM: SUBJECT: City Council Steven M. Youel, Director of Community Services RECOMMENDATION That the City Council adopt a resolution establishing
Summary of Proposal to Upgrade Swimming Facilities for the Wanaka Ward
 Attachment B Summary of Proposal to Upgrade Swimming Facilities for the Wanaka Ward Introduction The Queenstown Lakes District Council is proposing to build an eight lane lap pool and a learners pool costing
Angling in Manitoba (2000)
") Angling in Manitoba (2000) TABLE OF CONTENTS Page Introduction 1 Angler Profile 2 Angling Effort 7 Catch and Harvest 10 Angling Expenditures 13 Bait Use 16 Nonresident Trip Characteristics 18 Angling in
Angling in Manitoba (2000) TABLE OF CONTENTS Page Introduction 1 Angler Profile 2 Angling Effort 7 Catch and Harvest 10 Angling Expenditures 13 Bait Use 16 Nonresident Trip Characteristics 18 Angling in
TRENDS IN PARTICIPATION RATES FOR WILDLIFE-ASSOCIATED RECREATION BY RACE/ETHNICITY AND GENDER:
 TRENDS IN PARTICIPATION RATES FOR WILDLIFE-ASSOCIATED RECREATION BY RACE/ETHNICITY AND GENDER: 1980-2001 Allan Marsinko Professor Department of Forestry and Natural Resources Clemson University Clemson,
User Characteristics and Use Trends Since the 1990s on Paved State Bicycle Trails
 User Characteristics and Use Trends Since the 1990s on Paved State Bicycle Trails State paved bicycle trails (segments studied are mapped) Paul Bunyan segment near Bemidji Heartland Paul Bunyan Gitchi-Gami
FULL PROFILE Census, 2018 Estimates with 2023 Projections Calculated using Weighted Block Centroid from Block Groups Realm Realty Lat/Lon: 3
 FULL PROFILE 2000-2010 Census, 2018 Estimates with 2023 Projections Calculated using Weighted Block Centroid from Block Groups Realm Realty Lat/Lon: 30.0027/-90.1613 RF1 Lakeside Shopping Center Metairie,
1999 On-Board Sacramento Regional Transit District Survey
 SACOG-00-009 1999 On-Board Sacramento Regional Transit District Survey June 2000 Sacramento Area Council of Governments 1999 On-Board Sacramento Regional Transit District Survey June 2000 Table of Contents
2014 Economic Indicators, Trends & Observations. 51 South Main Street Janesville, WI P F RockCountyAlliance.
 2014 Economic Indicators, Trends & Observations 51 South Main Street Janesville, WI 53545 P.608.757.5598 F.608.757.5586 RockCountyAlliance.com Indicators, Trends & Observations National Level State of
BAINBRIDGE ISLAND AQUATICS FEASIBILITY STUDY 01/17/2019
 BAINBRIDGE ISLAND AQUATICS FEASIBILITY STUDY Outline Public Outreach Jurisdiction Requirements Site Analysis Site Design Plans Pricing Operational Study Slide 2 of 47 Outline PUBLIC OUTREACH Primary Users
County of Orange Resources and Development Management Department Harbors, Beaches and Parks. Strategic Plan. HBP Strategic Plan Workshop 1.
 County of Orange Resources and Development Management Department Harbors, Beaches and Parks Strategic Plan HBP Strategic Plan Workshop 1 v18 PRESENTATION OUTLINE Harbors, Beaches & Parks (HBP) History
STATE OF NEW YORK OFFICE OF THE STATE COMPTROLLER 110 STATE STREET ALBANY, NEW YORK September 2015
 THOMAS P. DiNAPOLI COMPTROLLER STATE OF NEW YORK OFFICE OF THE STATE COMPTROLLER 110 STATE STREET ALBANY, NEW YORK 12236 GABRIEL F. DEYO DEPUTY COMPTROLLER DIVISION OF LOCAL GOVERNMENT AND SCHOOL ACCOUNTABILITY
Have your say. Aquatic AND Leisure Facility. Aquatic AND Leisure Facility ON THE NEW. Information Booklet
 Have your say Aquatic AND Leisure Facility ON THE NEW Aquatic AND Leisure Facility Information Booklet It s time to upgrade our aquatic and leisure facilities to meet your needs now, and into the future.
Paddlesports Kayaking Canoeing. A Partnership Project of:
 A Special Report on Paddlesports 2009 Kayaking Canoeing Rafting A Partnership Project of: PADDLESPORTS Paddlesports Paddlesports offer some of the most diverse outdoor experiences of any nature-based activity
Planning for tennis in your Local Government Area. A resource from Tennis Australia
 Planning for tennis in your Local Government Area A resource from Tennis Australia Part 1 July 2016 ABOUT THIS RESOURCE This resource forms part of Tennis Australia's Local Government Engagement Program.
MARKET AND CAPACITY UPDATE. Matthew Marsh September 2016
 MARKET AND CAPACITY UPDATE Matthew Marsh September 2016 1980 1981 1982 1983 1984 1985 1986 1987 1988 1989 1990 1991 1992 1993 1994 1995 1996 1997 1998 1999 2000 2001 2002 2003 2004 2005 2006 2007 2008
Pocatello Regional Transit Master Transit Plan Draft Recommendations
 Pocatello Regional Transit Master Transit Plan Draft Recommendations Presentation Outline 1. 2. 3. 4. What is the Master Transit Plan? An overview of the study Where Are We Today? Key take-aways from existing
V I C TO R I A N R U G B Y FA C I L I T I E S DEVELOPMENT PLAN
 V I C TO R I A N R U G B Y FA C I L I T I E S DEVELOPMENT PLAN V R U B o a r d a n d C o m m u n i t y P r e s e n t a t i o n M o n d a y 2 1 st N o v e m b e r 2 0 1 6 Project objectives 1. Research
WHERE ARE ARIZONA DEMOGRAPHICS TAKING US? HOW GROWING SLOWER, OLDER AND MORE DIVERSE AFFECTS REAL ESTATE
 WHERE ARE ARIZONA DEMOGRAPHICS TAKING US? HOW GROWING SLOWER, OLDER AND MORE DIVERSE AFFECTS REAL ESTATE March 2017 Tom Rex Office of the University Economist and Center for Competitiveness and Prosperity
Bike Share Social Equity and Inclusion Target Neighborhoods
 Bike Share Social Equity and Inclusion Target Neighborhoods Target Neighborhoods West End/Visitation Park/Academy/Hamilton Heights Wellsgoodfellow/Kingsway West The Ville/Greater Ville Kingsway East/Fountain
KINDERSLEY AQUATICS CENTRE Town of Kindersley. Public Consultation #2 July
 KINDERSLEY AQUATICS CENTRE Town of Kindersley Public Consultation #2 July 7 2015 Agenda Introduction Summary of Consultation #1 Site Review 3 Options Team Exercise Costs Team Exercise Next Steps Process
Council HOBBS REPORT FOR March 7, 2016
 Council HOBBS REPORT FOR 2015 March 7, 2016 Overview/History Hobbs Ice Center is a year round ice skating facility with three indoor sheets of ice. Originally constructed in 1974, it was expanded to a
2017 Nebraska Profile
 2017 Nebraska Profile State, 9 NEW Regions, 93 Counties, plus 31 Cities Three Volumes Demographic Change in the State Economic Influences at Work Housing Statistics and Trends Summary of Findings Discuss
Flames Na onal Team. Registra on Contract for the season. First name Last name. Address. Parent/Guardian Names : Addresses:
 facility for people of all abilies. Flames Naonal Team Registraon Contract for the 2017 2018 season REGISTRANT First name Last name Address City Postal Code Parent/Guardian Names : Email Addresses: Gender
Bowie Indoor Sports Facility - Summary (Bowie, MD) Five-Year Operating Pro Forma
 Five-Year Operating Pro Forma") Bowie Indoor Sports Facility - Summary (Bowie, MD) Five-Year Operating Pro Forma Date: May 2013 Developed for: The City of Bowie Note: SFA has no responsibility to update this financial forecast for events
Bowie Indoor Sports Facility - Summary (Bowie, MD) Five-Year Operating Pro Forma Date: May 2013 Developed for: The City of Bowie Note: SFA has no responsibility to update this financial forecast for events
North Peace Sub- Regional Recrea5on Facility Inventory and Assessment. Peace River Regional District, City of Fort St. John and District of Taylor
 North Peace Sub- Regional Recrea5on Facility Inventory and Assessment Peace River Regional District, City of Fort St. John and District of Taylor Facility Audit and Assessments 46 buildings and 35 outdoor
U.S. Commercial Swimming Pool Market Year Ending 2015
 U.S. Commercial Swimming Pool Market Year Ending 2015 1 p a g e YE 2015 U.S. Commercial Swimming Pool Report 2016, P.K. Data, Inc. About Pkdata Pkdata is a market research firm that has tracked the swimming
Walkable Retail: When Old Becomes New Again Part 1
 Walkable Retail: When Old Becomes New Again Part 1 By Erin Talkington, Vice President, and Jacob Ross, Associate You have probably read the following headline thousands of times, perhaps this year alone:
MEETING Agenda. Introductions. Project Overview. Key Study Components. Alternative Station Concepts. Preferred Station Concept. Next Steps.
 City GARLAND Council ROADVISION Briefing STUDY VISION STUDY Dallas, TX April 8, 2010 1 1 MEETING Agenda Introductions Project Overview Key Study Components Alternative Station Concepts Preferred Station
MANITOBA'S ABORIGINAL COMMUNITY: A 2001 TO 2026 POPULATION & DEMOGRAPHIC PROFILE
 MANITOBA'S ABORIGINAL COMMUNITY: A 2001 TO 2026 POPULATION & DEMOGRAPHIC PROFILE MBS 2005-4 JULY 2005 TABLE OF CONTENTS I. Executive Summary 3 II. Introduction.. 9 PAGE III. IV. Projected Aboriginal Identity
How does Wind affect Coal (Cycling, Emissions and Cost)
") How does Wind affect Coal (Cycling, Emissions and Cost) Outline Analysis of cycling costs Why analyze cycling damage and costs Damage mechanisms of cycling Cycling costs Reducing cycling costs Loca9ng
How does Wind affect Coal (Cycling, Emissions and Cost) Outline Analysis of cycling costs Why analyze cycling damage and costs Damage mechanisms of cycling Cycling costs Reducing cycling costs Loca9ng
Population & Demographics
 Population & Demographics Conditions and Trends When looking at trends in the total number of people living in Windham (population) and at the characteristics of the people who live here by factors such
Maryland Stadium Authority to Release Phase Two of the Pimlico Race Course Study
 to Release Phase Two of the Pimlico Race Course Study Baltimore, MD The (MSA) is pleased to announce that the Phase Two, Pimlico Race Course Study is complete. The study will be available online on Thursday,
CITY OF MERRIAM PARKS AND RECREATION FACILITIES MASTER PLAN
 CITY OF MERRIAM PARKS AND RECREATION FACILITIES MASTER PLAN Process Site analysis and facility assessments Programs and services assessments Financial analysis Levels of service standards Where are We
St. Michael-Albertville Ice Arena Market Demand Study
 St. Michael-Albertville Ice Arena Market Demand Study National Sports Center Consulting 2015 TABLE OF CONTENTS SCOPE OF STUDY... 3 Objectives and Methods... 3 General Limiting Conditions... 3 NSC Consulting...
September HAWKHURST PARISH COUNCIL Page 1 of 13 SPORTS STRATEGY FINAL
 September 2017 HAWKHURST PARISH COUNCIL Page 1 of 13 SPORTS STRATEGY FINAL Table of Contents EXECUTIVE SUMMARY 3 1. INTRODUCTION 4 2. LOCAL CONTEXT 5 3. OBJECTIVES 7 4. PRIORITIES 8 5. FUNDING OPTIONS
February Funded by NIEHS Grant #P50ES RAND Center for Population Health and Health Disparities
 Urban Use and Physical Activity Deborah Cohen, Thom McKenzie, Amber Sehgal, Stephanie Williamson, Daniela Golinelli, Multi-Cultural Area Health Education Center (MAHEC) Funded by NIEHS Grant #P50ES012383
 Time of Change We Are Growing We Are An Attractive Place To Live We Are Age Diverse + Living Longer 50000 40000 30000 20000 10000 0 2010 Census Job Density Housing Sheds Transit Sheds The Project FUNDING
Texas Housing Markets: Metropolitan vs. Border Communities. September 22, 2014
 Texas Housing Markets: Metropolitan vs. Border Communities Luis Bernardo Torres Ruiz, Ph.D. Research Economist El Paso Branch Dallas Federal Rio Grande Economic Association September 22, 2014 Contents
Rural Ontario s Hidden Sector: The Economic Importance of the Horse Industry Final Report
 Rural Ontario s Hidden Sector: The Economic Importance of the Horse Industry Final Report - 2009 Photo Credit: J.W. Wilton Dr. Bronwynne Wilton and Dr. Wayne Caldwell University of Guelph 1 Executive Summary
Hunter and Angler Expenditures, Characteristics, and Economic Effects, North Dakota,
 Agribusiness and Applied Economics Report No. 507-S January 2003 Hunter and Angler Expenditures, Characteristics, and Economic Effects, North Dakota, 2001-2002 Dean A. Bangsund and F. Larry Leistritz*
Preface. The Economic Impact of Equestrian Ac5vi5es in the Aloue8e Valley
 The Economic Impact of Equestrian Ac5vi5es in the Aloue8e Valley Preface The Aloue)e Valley Associa0on (AVA) has been advoca0ng for safe accessible mul0- use pathways along 132nd ave and 224th st. These
SWIM POOL MANAGEMENT City of Blue Springs, Missouri
 Request for Qualifications SWIM POOL MANAGEMENT City of Blue Springs, Missouri The City of Blue Springs, Missouri will accept Request for Qualifications (RFQ) statements from interested firms to provide
STATE OF NEW YORK OFFICE OF THE STATE COMPTROLLER 110 STATE STREET ALBANY, NEW YORK September 2015
 THOMAS P. DiNAPOLI COMPTROLLER STATE OF NEW YORK OFFICE OF THE STATE COMPTROLLER 110 STATE STREET ALBANY, NEW YORK 12236 GABRIEL F. DEYO DEPUTY COMPTROLLER DIVISION OF LOCAL GOVERNMENT AND SCHOOL ACCOUNTABILITY
Main- McVay Transit Study
 Main- McVay Transit Study Stakeholder Advisory Commi3ee Mee5ng #2 May 27, 2014 A collabora)ve study between Main- McVay Transit Study Stakeholder Advisory Commi3ee Mee5ng #2 May 27, 2014 WELCOME Agenda
City of Kingston Report to Council Report Number
 To: From: Resource Staff: City of Kingston Report to Council Report Number 17-012 Mayor and Members of Council Date of Meeting: Subject: Executive Summary: Lanie Hurdle, Commissioner, Community Services
The Future of Quarterpath Pool. October 8, 2012
 The Future of Quarterpath Pool October 8, 2012 The Big Questions Primary Purpose: Swimming lessons or recreation? What can Williamsburg do that others can t or that differentiates us? Pool Open: How do
PEDESTRIAN ACTION PLAN
 ATTACHMENT 2 CITY OF SANTA MONICA PEDESTRIAN ACTION PLAN CITY OF SANTA MONICA PEDESTRIAN ACTION PLAN This page intentionally left blank EXECUTIVE SUMMARY CHAPTER 1 EXECUTIVE SUMMARY Setting the Stage
A Threatened Bay: Challenges to the Future of the Penobscot Bay Region and its Communities
 A Threatened Bay: Challenges to the Future of the Penobscot Bay Region and its Communities 1 A A Threatened Bay: Challenges to the Future of the Penobscot Bay Region and its Communities In 1996 the Island
Sony Centre for Performing Arts
 CAPITAL PROGRAM SUMMARY Highlights Overview I: 10-Year Capital 6 II: Issues for Discussion 15 Sony Centre for Performing Arts 2016 2025 CAPITAL BUDGET AND PLAN OVERVIEW The Sony Centre for the Performing
102 E. Michigan, Urbana Green/Grey/Bronze Questions: Register: Closure Dates Closed all day - No public activities
 Well-trained Guards Zero-depth Pool equipped with water geysers, dinosaur slide and rain drop umbrella toy Drop & Flume Slides Competition Pool 1-Meter Diving Board Locker Rooms Party Room Follow us on
CITY OF HAMILTON PUBLIC WORKS DEPARTMENT Energy, Fleet & Facilities Management Division
 CITY OF HAMILTON PUBLIC WORKS DEPARTMENT Energy, Fleet & Facilities Management Division TO: Chair and Members Public Works Committee COMMITTEE DATE: June 5, 2017 SUBJECT/REPORT NO: Municipal Golf Course
Travel and Rider Characteristics for Metrobus
 Travel and Rider Characteristics for Metrobus 040829040.15 Travel and Rider Characteristics for Metrobus: 2012-2015 Overview The Miami Dade County Metropolitan Planning Organization (MPO) conducted a series
More of the Same; Or now for Something Completely Different?
 More of the Same; Or now for Something Completely Different? C2ER Place cover image here Richard Wobbekind Chief Economist and Associate Dean for Business and Government Relations June 14, 2017 Real GDP
METROPOLITAN TRANSPORTATION PLAN OUTREACH: INTERACTIVE MAP SUMMARY REPORT- 10/03/14
 METROPOLITAN TRANSPORTATION PLAN OUTREACH: INTERACTIVE MAP SUMMARY REPORT- 10/03/14 INTRODUCTION This document summarizes the results of the online interactive mapping exercise implemented by MIG for the
TO: Board Members Vancouver Park Board FROM: General Manager Parks and Recreation SUBJECT: Seaside Greenway Improvements
 Date: October 1, 2013 TO: Board Members Vancouver Park Board FROM: General Manager Parks and Recreation SUBJECT: Seaside Greenway Improvements RECOMMENDATION A. THAT the Board approve the new bike paths
The North Shore Transportation Improvement Strategy and Western Richmond Terrace 1 : The Forgotten Corridor
 Elm Park Civic Association Island Voice Do Me A Faber The North Shore Transportation Improvement Strategy and Western Richmond Terrace 1 : The Forgotten Corridor Introduction Richmond Terrace is the northernmost