Texas Transportation Institute Texas A&M University System College Station, Texas
|
|
|
- Merry Bell
- 5 years ago
- Views:
Transcription
1 1. Report No. SWUTC/06/ Technical Report Documentation Page 2. Government Accession No. 3. Recipient's Catalog No. 4. Title and Subtitle Children and Transportation: Identifying Environments that Foster Walking and Biking to School 5. Report Date September Performing Organization Code 7. Author(s) Byoung-Suk Kweon, Woo-Hwa Shin, Robert Folzenlogen, & Jun-Hyun Kim 9. Performing Organization Name and Address Texas Transportation Institute Texas A&M University System College Station, Texas Sponsoring Agency Name and Address Southwest Region University Transportation Center Texas Transportation Institute Texas A&M University System College Station, Texas Performing Organization Report No. Report Work Unit No. (TRAIS) 11. Contract or Grant No. DTRS99-G Type of Report and Period Covered Research Report: September 2004-September Sponsoring Agency Code 15. Supplementary Notes Supported by a grant from the U.S. Department of Transportation, University Transportation Centers Program. 16. Abstract Few children walk or bike to school. In fact, less than 13% of children in the U.S. walk or bike to school and 85% of trips to school are made by car or school bus (United States Department of Health and Human Services [USDHHS], 2004). Almost 50% of children walked or biked to school in 1969 (United States Environmental Protection Agency [USEPA], 2003). Did changes in transportation infrastructure contribute to this reduction in walking and biking? What new changes should be made in transportation infrastructure today to reverse this trend and provide a greater likelihood that children will walk or bike to school? Although there is very limited understanding of how pedestrian environments influence children s walking and biking to school, previous research shows that physical environments can foster non-automobile mode choices to school. Landscape buffers and trees add to parents perceptions of their children s safety and increase their willingness to let their children walk to school (Kweon, Naderi, Maghelal, & Shin, 2004). Ewing (in press) also found that more children walked to school where there were sidewalks. In addition, Safe Routes to School programs increase children s walking to school (Staunton, Hubsmith, & Kallins, 2003). Physical environments can also be a barrier to children walking and biking to school. In fact, in a study completed by the CDC (2002, August 16), distance was found to be the number one barrier to children walking to school. Texas along with many other states established 2mile school walk zones measured by the nearest practical route from the school attended. However, particularly in the U.S., why distance is the dominant factor in determining walk zone policies and what an appropriate distance might be for walking to school have yet to be consistently documented. In this research we investigated how additional physical attributes (e.g., street pattern, land use, housing density, environmental content) in the pedestrian environment influence children s walking and biking to school. We also measured what school children consider walkable and bikable distances to school. One hundred eighty six parents from four school walk zones in College Station, TX participated in this study. They reported their children s commute modes, routes to school and perceived walking and biking environments to school. Satellite imagery and spatial data from the College Station Geographic Information Services were used to further investigate distances to school, environmental content, surrounding land use, and street patterns. Results indicate that children walk more in older neighborhoods with mature trees while they bike more in newer neighborhoods with more sidewalks. Also children who live on cul-de-sacs walk to school less than those who live on grid streets. Also, children s walking is also significantly related to housing densities and mixed land use. Contrary to the popular 2mile walk zone guidelines, the mean distance for walking in this study is.71 miles while the mean distance of biking is.93 miles. On average, children who live beyond 1 mile from their school either ride in a car, car pool, or pay a transportation fee to ride a school bus. These findings are being used to shape better school walk zone guidelines in support of active and healthy communities. 17. Key Words Walking and Biking, Children, School Walk Zone, Pedestrian Environment 19. Security Classif.(of this report) Unclassified 20. Security Classif.(of this page) Unclassified 18. Distribution Statement No restrictions. This document is available to the public through NTIS: National Technical Information Service 5285 Port Royal Road Springfield, Virginia No. of Pages Price Form DOT F (8-72) Reproduction of completed page authorized
2 ii
3 Children and Transportation: Identifying Environments that Foster Walking and Biking to School By Byoung-Suk Kweon, Ph. D. Assistant Professor Department of Landscape Architecture and Urban Planning Texas A&M University Woo-Hwa Shin Ph.D. Student Department of Landscape Architecture and Urban Planning Texas A&M University Robert Folzenlogen MLA Student Department of Landscape Architecture and Urban Planning Texas A&M University Jun-Hyun Kim Ph.D. Student Department of Landscape Architecture and Urban Planning Texas A&M University Research Report SWUTC/06/ Sponsored by Southwest Region University Transportation Center TEXAS TRANSPORTATION INSTITUTE The Texas A&M University System College Station, Texas September 2006 iii
4 iv
5 ABSTRACT Few children walk or bike to school. In fact, less than 13% of children in the U.S. walk or bike to school and 85% of trips to school are made by car or school bus (United States Department of Health and Human Services [USDHHS], 2004). Almost 50% of children walked or biked to school in 1969 (United States Environmental Protection Agency [USEPA], 2003). Did changes in transportation infrastructure contribute to this reduction in walking and biking? What new changes should be made in transportation infrastructure today to reverse this trend and provide a greater likelihood that children will walk or bike to school? Although there is very limited understanding of how pedestrian environments influence children s walking and biking to school, previous research shows that physical environments can foster non-automobile mode choices to school. Landscape buffers and trees add to parents perceptions of their children s safety and increase their willingness to let their children walk to school (Kweon, Naderi, Maghelal, & Shin, 2004). Ewing (in press) also found that more children walked to school where there were sidewalks. In addition, Safe Routes to School programs increase children s walking to school (Staunton, Hubsmith, & Kallins, 2003). Physical environments can also be a barrier to children walking and biking to school. In fact, in a study completed by the CDC (2002, August 16), distance was found to be the number one barrier to children walking to school. Texas along with many other states established 2mile school walk zones measured by the nearest practical route from the school attended. However, particularly in the U.S., why distance is the dominant factor in determining walk zone policies and what an appropriate distance might be for walking to school have yet to be consistently documented. In this research we investigated how additional physical attributes (e.g., street pattern, land use, housing density, environmental content) in the pedestrian environment influence children s walking and biking to school. We also measured what school children consider walkable and bikable distances to school. One hundred eighty six parents from four school walk zones in College Station, TX participated in this study. They reported their children s commute modes, routes to school and perceived walking and biking environments to school. Satellite imagery and spatial data from the College Station Geographic Information Services were used to further investigate distances to school, environmental content, surrounding land use, and street patterns. Results indicate that children walk more in older neighborhoods with mature trees while they bike more in newer neighborhoods with more sidewalks. Also children who live on cul-de-sacs walk to school less than those who live on grid streets. Also, children s walking is also significantly related to housing densities and mixed land use. Contrary to the popular 2mile walk zone guidelines, the mean distance for walking in this study is.71 miles while the mean distance of biking is.93 miles. On average, children who live beyond 1 mile from their school either ride in a car, car pool, or pay a transportation fee to ride a school bus. These findings are being used to shape better school walk zone guidelines in support of active and healthy communities. v
6 vi
7 EXECUTIVE SUMMARY Children Commuting to School Few children walk or bike to school. In fact, less than 13% of children in the U.S. walk or bike to school and 85% of trips to school are made by car or school bus (United States Department of Health and Human Services [USDHHS], 2004). Almost 50% of children walked or biked to school in 1969 (United States Environmental Protection Agency [USEPA], 2003). Did changes in transportation infrastructure contribute to this reduction in walking and biking? What changes should be made in transportation infrastructure today to reverse this trend and provide greater safety for children? Children and Obesity Increased walking and biking may help to reduce childhood obesity. Obesity among American children is rising. About 15 percent of children aged 6 to 19 are overweight. Since 1970, the prevalence of childhood obesity has been tripled. Health experts have referred to this situation as an epidemic of obesity. Links between Transportation Choices and Children s Obesity National Impacts- The Surgeon General identified that obesity is a major public health problem in the U.S. (U.S. Department of Health and Human Services, 2001). In Response, the CDC has developed a new Kids Walk-to-School program. However, no studies have provided evidence of whether our transportation infrastructure is adequately prepared to support these national efforts. Nontraditional Groups: Young school aged children are an under-represented group in transportation research. However, current efforts to increase physical activity among children will likely lead to greater use of transportation corridors by this group. Increasing transportation research in this population is both timely and necessary to ensure children s safety and to augment the potential benefits of increased walking and biking. Enormous economic significance: Healthcare costs that associated with childhood obesity may be reduced by providing safe commuting environments that accommodate walking and biking to school. These costs can include diagnostic, and treatment services by physicians as well as hospital stays and prescription medicine. This study examines the transportation infrastructure currently available for children to walk and bike to school in College Station, TX. The College Station Independent School District provides school buses for children who live beyond 2 miles of their school or who cross major arterials. Otherwise, the School District recommends students walk or bike to school. The objectives of this study are two fold: 1. Find out how many students actually walk or bike to school when the commute distance is less than 2 miles. 2. Investigate specific elements of commuting environments that motivate children and their parents to walk or bike to school such as the existence and connectivity of sidewalks/bike lanes, street pattern, land use mix and so on. vii
8 The results of this study indicate that 20-30% of children walk to school within walk zones. However, a 2 mile walk zone might not be a practical distance for the intermediate and middle school children. In our study, the average walking distance is.71 miles. Different distance considerations should probably be made for different age groups and the actual distance threshold should be determined using a more scientific approach. We also found that physical environments have a significant impact on children s walking and biking to school. Results indicate that distance to school, street pattern (grid vs. cul-de-sac), land use mix, greenery, sidewalks, bike lanes, intersections, and housing density have significant relationships with children s walking and biking to school. These finding can be used to shape better school walk zone transportation infrastructure that may have lasting health consequences for young school children. viii
9 TABLE OF CONTENTS ABSTRACT...v EXECUTIVE SUMMARY...vii INTRODUCTION...1 METHODS...3 Sampling and Participants...3 Measures...5 Survey Questionnaire...5 Geographic Information System (GIS) Data...6 RESULTS...7 Commute to School...7 Commute Frequency by Mode...8 Commute Distance by Mode...8 Parent's Perceived Barriers: Walkers vs. Non-Walkers...9 Parent's Perceived Barriers: Bikers vs. Non-Bikers...10 Who Tends to Walk or Bike?...10 Who Tends to Ride a Car or Bus?...12 DISCUSSION...12 CONCLUSION...12 REFERENCES...15 APPENDIX I...17 Page ix
10 LIST OF ILLUSTRATIONS Figure 1. Examples of school walk zone map (a) and respondent distribution (b)...3 Page LIST OF TABLES Table 1. Response rate by school...4 Table 2. Respondents background information...4 Table 3. Comparison of commute modes to and from school by two different School levels (i.e.: intermediate and middle school)...7 Table 4. Commute to school by gender...8 Table 5. Mean frequency of commute mode per week by school level...8 Table 6. Mean frequency of commute mode per week by gender...8 Table 7. Mean street distance to school by school level...9 Table 8. Mean street distance to school by gender...9 Table 9. T-tests between walkers vs. non-walkers for parents perceived concerns...10 Table 10. The mean differences of perceived concerns between bikers vs. non-bikers...10 Table 11. Correlations among commute mode, personal and household information, and built environment variables...11 Page x
11 DISCLAIMER The content of this report reflect the views of the authors, who are responsible for the facts and the accuracy of the information presented herein. This document is disseminated under the sponsorship of the Department of Transportation, University Transportation Centers Program in the interest of information exchange. The U.S. Government assumes no liability for the contents or use thereof. ACKNOWLEDGEMENT The authors recognize that support was provided by a grant from the US Department of Transportation, University Transportation Centers Program to the Southwest Region University Transportation Center. xi
12 xii
13 INTRODUCTION Few children walk or bike to school. In fact, less than 13% of children in the U.S. walk or bike to school and 85% of trips to school are made by car or school bus (United States Department of Health and Human Services [USDHHS], 2004). Back in 1969 almost 50% of children walked or biked to school (United States Environmental Protection Agency [USEPA], 2003). Did changes in transportation infrastructure contribute to this reduction in walking and biking? What changes should be made in transportation infrastructure today to reverse this trend and provide a greater likelihood that children will walk or bike to school? Quadrupling over the past 25 years, more than 30% of adolescents (ages 12 to 19) are overweight and 15% are obese (American Obesity Association [AOA], 2004). Additionally, overweight adolescents have a 70% chance of becoming overweight or obese as adults (USDHHS, 2001). Second only to tobacco, obesity is the leading cause of preventable death in the United States (AOA, 2000). In the U.S. alone, more than 300,000 deaths per year are attributed to overweight conditions and obesity. The cost of obesity to the U.S. in 2000 was estimated to be more than 100 billion (USDHHS, 2004). Overweightness and obesity among all ages has been found to significantly increase the chances for many illnesses, including heart disease, hypertension, Type 2 diabetes and depression. Previously considered adult-only issues, both high blood pressure and Type 2 diabetes amongst children are on the rise with the increase in childhood overweight and obesity (USDHHS, 2001). More than 35% of children do not participate in regular physical activity and on average children watch television for 4 hours a day (AOA, 2004). Increasing physical activity amongst children is one way to reduce the overweight and obesity epidemic. Walking or biking to school is an avenue for physical activity that many children can easily incorporate into their daily lives. In addition to weight control, walking and biking to school can lead to other individual benefits. Walking is associated with maintaining healthy bones, muscles and joints, preventing high blood pressure, reducing depression and anxiety, and increasing self-esteem (AOA, 2004). Other benefits of children walking or biking to school include decreasing rush-hour traffic congestion, reducing environmental pollution, and cutting down fuel consumption (USEPA, 2003). An equally important outcome is the possibility that children who incorporate walking or biking to school into their daily lives also seek out other means of obtaining physical activity. Research has shown that children who walked to school recorded a significantly higher amount of moderate-to-vigorous physical activity during the afternoon and evening hours compared to those kids that did not walk or bike to school (Cooper, Page, Foster, & Qahwaji, 2003). Establishing adolescent patterns of physical activity outside school hours is growing in importance as more and more school systems decrease physical education and recess times. America is taking national action to increase children s physical activity in general, and walking and biking to school in particular. Programs like the CDC s Kids Walk-to-School and the Safe Routes to School (SRS) initiative are sustained efforts by parents, community members, local, state, and federal governments to improve the health and well-being of children by enabling and encouraging them to walk and bike to school. By 2010, the target proportions for walking within 1 mile or bicycling within 2miles to school are 50% and 5% respectively 1
14 (USDHHS, 2004). However, it is likely that these campaigns will be short lived if in fact there are barriers to walking or biking to school that outweigh the momentum created by such programs. Although there is very limited understanding of how pedestrian environments influence children s walking and biking to school, previous research shows that physical environments can foster non-automobile mode choices to school. Landscape buffers and trees add to parents perceptions of their children s safety and increase their willingness to let their children walk to school (Kweon, Naderi, Maghelal, & Shin, 2004). Ewing (in press) also found that more children walked to school where there were sidewalks. In addition, Safe Routes to School programs increase children s walking to school (Staunton, Hubsmith, & Kallins, 2003). The physical environment can also be a barrier to children walking and biking to school. In fact, in a study completed by the CDC ( Barriers to Children, 2002), distance was found to be the number one barrier to children walking to school. Several additional studies support distance as a significant factor in whether or not children walk or bike to school (USEPA, 2003; Cervero & Duncan, 2003; Rivara et. al, 1989; Ziviani, Scott, & Wadley, 2004). In a study conducted by the EPA ( Travel and Environmental, 2003), it was suggested that even if distances to schools were decreased from 1.5 to 1.1 miles, one more student for every 100 would walk to school. It is unclear if distance is purely associated with a time and convenience factor, or if it is also associated with ones attitude towards a desired level of physical activity or perhaps a perceived safety risk tied to increased distances. All we really can conclude is that parents perceive distance to be an issue, and, in some areas, that the distance between residences and schools is being increased by poor municipal planning practices. Texas, along with many other states established 2-mile school walk zones measured by the nearest practical route from the school attended. Why is distance the dominant factor in determining walk zone policies? What is an appropriate distance for walking to school? Answers to these questions have yet to be consistently documented. In order to meet local minimum acreage guidelines, new schools are often pushed to the fringes of communities where land is less expensive (USEPA, 2003; Walljasper, 2001). For example, some California middle schools are required to have 20 acres plus a minimum of one acre per 100 students ( Surface Transportation, 2003). These requirements can be double or triple this amount for high schools in some states. Only a handful of states, including Texas, have no such requirements (CEFPI, 2004). Additionally, some municipal budget processes discourage renovation of smaller, often more centrally located schools in favor of new, larger schools that serve a broader area (and therefore longer distances to some residences). Regardless, even when kids live within a couple of miles from school they often still ride the bus ( Surface Transportation, 2003); thereby suggesting that distance by itself is certainly not the only factor influencing whether or not a child will walk to school. In this research we investigated how additional physical attributes (e.g., street pattern, land use, housing density, environmental content, etc) in the pedestrian environment influence children s walking and biking to school. We also measured what school children consider walkable and bikable distances to school. 2

. The participants were scattered throughout the study area (see Figure 1b). The majority of children are white (79.2%) followed by Hispanic (8.8%), Asian (8.")
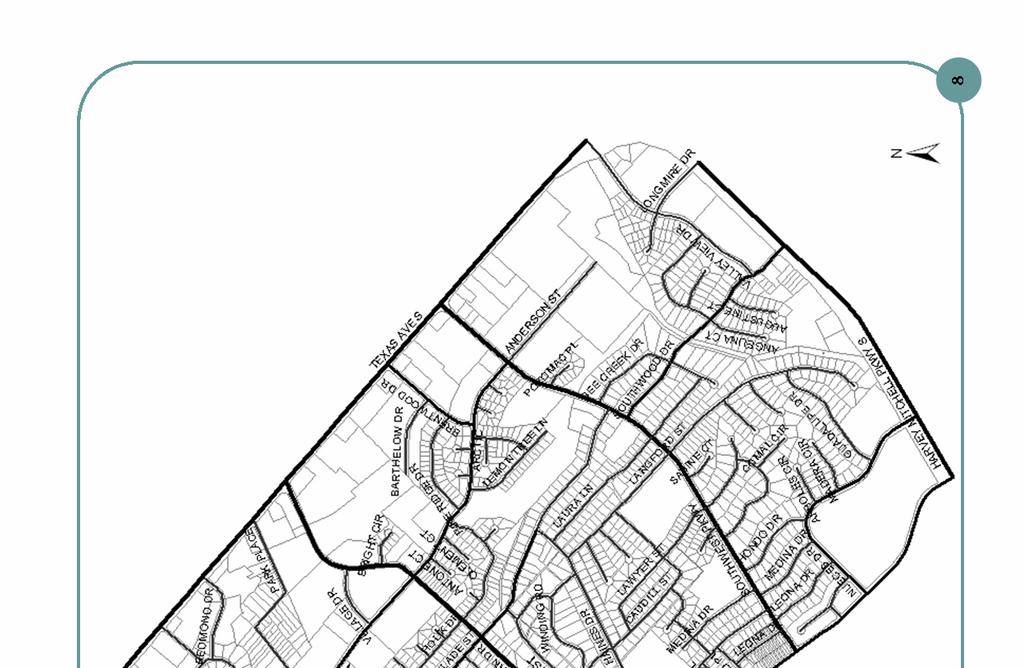
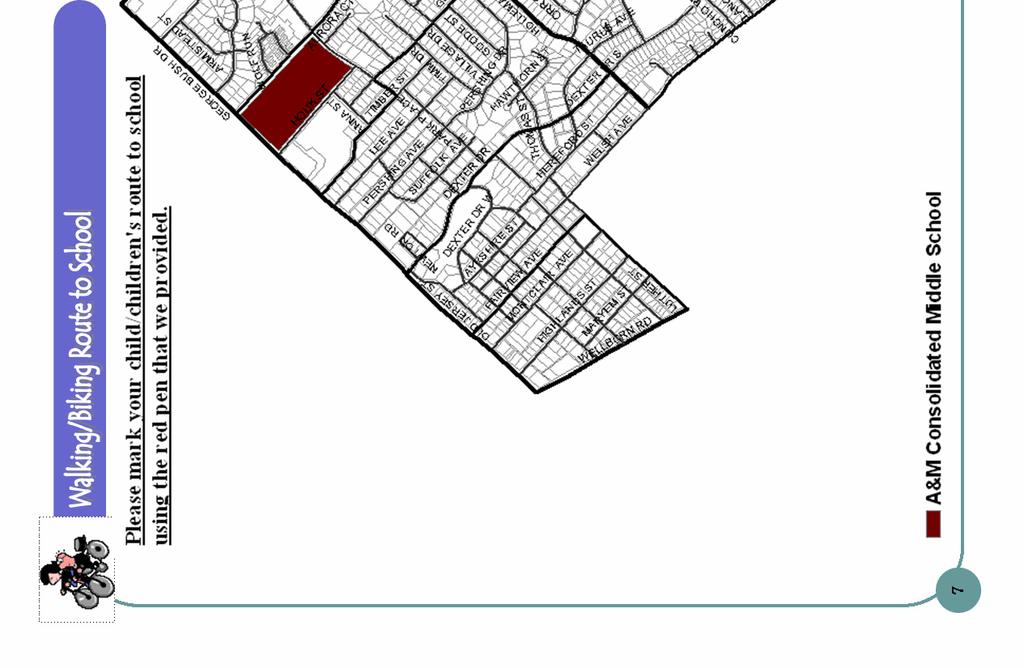
15 METHODS Sampling and Participants Three hundred seventy survey questionnaires were mailed to households with intermediate and middle school children within four school walk zones. Intermediate schools include grades 5-6 while middle schools include grades 7-8. Participants addresses were obtained from the College Station Independent School District. Among 370 survey questionnaires, 10 questionnaires (3%) were returned with a vacancy notice while 187 questionnaires (50%) were completed and returned: 89 from two different intermediate schools and 106 from two middle schools (see Table 1). The participants were scattered throughout the study area (see Figure 1b). The majority of children are white (79.2%) followed by Hispanic (8.8%), Asian (8.2%), and African American (3.8%). The student gender distribution consists of 46.5% male and 53.5% female. More than 50% of the household earned over $80,000 (see table 2). Figure 1. Examples of school walk zone map (a) and respondent distribution (b) Middle School Intermediate School a) Walk zone map b) Spatial distribution of respondents 3
16 Table 1. Response rate by school Category School name Sample Size Completion Vacant Total Intermediate School Oakwood (60.5%) 2 (5%) 28 (65.1%) (Grade 5-6 th ) Cypress Grove (54.2%) 3 (3%) 61 (57.0%) Middle School A & M Consolidate (42.6%) 1 (2%) 28 (45.9%) (Grade 7-8 th ) College Station (47.2%) 4 (3%) 79 (49.7%) Total (50.3%) 10 (3%) 196 (53.0%) Table 2. Respondents background information Intermediate School Cypress Grove Oakwood Middle School A & M Consolidated College Station Subtotal Total Subtotal CHILD Age(Mean) Gender Male 13 (68.4%) 19 (40.4%) 32(48.5%) 10 (40.0%) 32 (42.7%) 42(45.2%) 74(46.5%) Female 6 (31.6%) 28 (59.6%) 34(51.5%) 15 (60.0%) 36 (52.9%) 51(54.8%) 85(53.5%) Grade 5 12 (63.2%) 26 (55.3%) 38(57.6%) 38(23.3%) 6 7 (36.8%) 21 (44.7%) 28(42.4%) 28(17.2%) 7 10 (38.5%) 33 (46.5%) 43(44.3%) 43(26.4%) 8 16 (61.5%) 38 (53.5%) 54(55.7%) 54(33.1%) Ethnicity African American 1 (5.3%) 1(1.6%) 2 (7.7%) 3 (4.3%) 5(5.3%) 6(3.8%) Hispanic 3 (15.8%) 3 (6.7%) 6(9.4%) 2 (7.7%) 6 (8.7%) 8(8.4%) 14(8.8%) Asian 1 (5.3%) 5 (11.1%) 6(9.4%) 1 (3.8%) 6 (8.7%) 7(7.4%) 13(8.2%) White 14 (73.7%) 37 (82.2%) 51(79.7%) 21 (80.8%) 54 (78.3%) 75(78.9%) 126(79.2%) Other Height (Mean) Weight (Mean) Bikeownership Y 18 (94.7%) 42 (93.3%) 60(63.8%) 18 (75%) 60 (89.6%) 78(85.7%) 138(89%) N 1 (5.3%) 3 (6.7%) 4(6.3%) 6 (25.0%) 7 (10.4%) 13(14.3%) 17(11%) PARENTS Age (Mean) Gender Male 5 (19.2%) 12 (21.1%) 17(20.5%) 3 (11.5%) 15 (20.5%) 18(18.2%) 35(19.2%) Female 21 (80.8%) 45 (78.9%) 66(79.5%) 23 (88.5%) 57 (78.1%) 80(80.8%) 146(80.2%) Both 1 (1.4%) 1(1%) 1(0.5%) Ethnicity African American 1 (3.8%) 1(1.2%) 1 (3.8%) 3 (4.1%) 4(4.0%) 5(2.7%) Hispanic 4 (15.4%) 3 (5.3%) 7(8.4%) 1 (3.8%) 5 (6.8%) 6(6.1%) 13(7.1%) Asian 1 (3.8%) 6 (10.5%) 7(8.4%) 1 (3.8%) 9 (12.3%) 10(10.1%) 17(%9.3) White 20 (76.9%) 47 (82.5%) 67(80.7%) 21 (80.8%) 55 (75.3%) 76(76.8%) 143(78.6%) Other 1 (1.8%) 1(1.2%) 2 (7.7%) 1 (1.4%) 3(3.0%) 4(2.2%) Marital State Married 22 (84.6%) 51 (89.5%) 73(88%) 22 (84.6%) 64 (88.9%) 86(84.3%) 159(87.8%) Common-law married 1 (3.8%) 1(1.2%) 3 (4.2%) 3(2.9%) 4(2.2%) Divorced 3 (11.5%) 3 (5.3%) 6(7.2%) 3 (11.5%) 4 (5.6%) 7(6.9%) 13(7.2%) Widowed 1 (1.8%) 1(1.2%) 1 (3.8%) 1 (1.4%) 2(2.0%) 3(1.7%) Never-married 2 (3.5%) 2(2.4%) 2(1.1%) Farther-Work Full Time 24 (96.0%) 51 (92.7%) 75(93.8%) 20 (95.2%) 67 (94.4%) 87(94.6%) 162(94.2%) Part Time 2 (3.6%) 2(2.5%) 1 (4.8%) 1(1.1%) 3(1.7%) Retired 3 (4.2%) 3(3.3%) 3(1.7%) Not employed 1 (4.0%) 2 (3.6%) 3(3.8%) 1 (1.4%) 1(1.1%) 4(2.3%) Mother-Work Full Time 13 (50.0%) 32 (57.1%) 45(54.9%) 13 (52.0%) 44 (61.1%) 57(58.8%) 102(57.0%) Part Time 6 (23.1%) 10 (17.9%) 16(19.5%) 4 (16.0%) 14 (19.4%) 18(18.6%) 34(19.0%) Not employed 7 (26.9%) 14 (25.0%) 21(25.6%) 8 (32.0%) 14 (19.4%) 22(22.7%) 43(24.0%) 4
17 Household Income(Mean) Less than $20,000 2 (8.3%) 4 (5.9%) 6(5.9%) 6(3.5%) $40,000 6 (24.0%) 5 (9.1%) 11(13.8%) 6 (25.0%) 4 (5.9%) 10(9.8%) 21(12.2%) $60,000 2 (8.0%) 7 (12.7%) 9(11.3%) 3 (12.5%) 11 (16.2%) 14(13.7%) 23(13.4%) $80,000 4 (16.0%) 8 (14.5%) 12(15.0%) 4 (16.7%) 13 (19.1%) 17(16.7%) 29(16.9%) More than $80, (52.0%) 35 (63.6%) 48(60.0%) 9 (37.5%) 36 (52.9%) 45(44.1%) 93(54.1%) Education(Mean) Less than High School 1 (4.0%) 1(1.0%) 1(1.0%) High School / GED 2 (8.3%) 5 (10.6%) 7(9.0%) 4 (16.0%) 8 (11.0%) 12(13.0%) 19(11.0%) Community Collage 3 (12.5%) 10 (17.5%) 13(16.0%) 3 (12.0%) 13 (20.5%) 16(17.0%) 29(17.0%) College Degree 12 (50.0%) 23 (40.4%) 35(44.0%) 9 (40.0%) 25 (34.2%) 34(36.0%) 69(39.0%) Graduate Degree 7 (29.2%) 18 (31.6%) 25(31.0%) 7 (28.0%) 25 (34.2%) 32(34.0%) 57(33.0%) No. of Household Members (Mean) No. of Children (Mean) No. of Cars (Mean) No. of Licensed Drivers (Mean) No. of Years (Mean) Measures Survey Questionnaire (see Appendix I) The survey questionnaire Children s Walking and Biking to School has five sections: 1) Information about children, 2) Walking and biking environments to school, 3) Walking and biking in your neighborhood, 4) Commute route to school, 5) Background information and 6) Comments for walking and biking to school. These are described below. Information about Children: In this section we asked parents about their children s age, gender, ethnicity, height, weight, and grade. We also asked about children s commute modes to and from school within a typical week. Walking and Biking Environments to School: We asked parents about their children s walking and biking environments to school. Concerns about current walking conditions as well as possible incentives to increase walking and biking were included in the section. Concerns about walking and biking environments within school zones were measured with the question What concerns do you have about your child/children walking to or from school? The sample items included distance, traffic conditions (e.g., traffic volume and speed), infrastructure (e.g., sidewalks, landscape buffer), safety, convenience, weather, time, etc. Parents answered the question using 4 response-scales from not a concern to concerns me greatly. Parents also asked if your child/children does not walk or bicycle to school what would make you more likely to allow your child/children to walk or bike to school? Examples included crime watch, group walking, traffic controls, safety training, better infrastructure (e.g., sidewalks, bike lane, landscape buffer) walking program and so on. We also asked appropriate walking and biking distances to school for their children. Walking and Biking in Your Neighborhood: In this section, we accessed children s walking and biking activities in their neighborhood using the question How often do your children walk or bike to the following places within one week? We included friend s house, park/trails/playgrounds, stores/restaurants, sport facilities/after school events, and children s part- 5
18 time work place as destination places. Parents indicated the frequency of their children s trips to each place by using a none to 7 times/week response scale. We also include Not within walking /biking distance as an option. Commute Route to School: We asked parents to mark their children s route to school on a school walk zone map that was included in the questionnaire (see Figure1) Background information: Parents provided background information about themselves such as gender, age, work status, marital status, and so on. They also provided household information such as income, number of children, number of cars, number of household members, number of licensed drivers, and so on. Comments for walking and biking to school: In the final section we asked an open end question using would you like to say anything else about your children s walking or biking to school? Do you have any additional comments on what is needed for your child to walk or bike to school? Geographic Information System (GIS) Data Spatial data from the College Station Geographic Information Services were used to measure the street distance to school, intersection density, sidewalk density, bike lane density, housing density, land use mix, amount of greenery, and street pattern (grid vs. cul-de-sac). Street distance to school: Parents marked their children s route to school on a map that we provided in the questionnaire (see Figure 1a) and GIS was used to measure the street distances from home to school for each child. Intersection density: This was measured by the number of intersections per acre of walk zone. A higher measured value indicates more intersections per acre. Sidewalk density: Sidewalk density was measured by the number of linear miles of sidewalk per acre within a walk zone. A higher measured value indicates more sidewalks. Bike land density: Bike lane density was measured by the number of linear miles of bike lane per acre. Housing density: Housing density was measured by the number of housing units per acre within each walkzone. Land use mix: Land use mix ranged from 0 to 1 and captured how evenly the square footage of each area is distributed within the walk zone. A lower value (0) indicates homogeneity, wherein all land uses are of a single type while a higher value (1) indicates heterogeneity wherein all land use categories are evenly distributed throughout the area. Land use mix is calculated by the following formula (Frank, Schmid, Sallis, & Chapman, 2005): n i = 1 Land Use Mix = [{ ( p )(ln p )}/ ln n] i i 6
19 p i = the total proportion of estimated square footage attributed to land use i (proportion of total land uses) n = the number of land uses (category of land use) Amount of greenery: Data values for greenery were derived from 4-meter, multispectral satellite imagery (Ikonos). These data were processed by computer using a normalized difference vegetation index formula (NDVI) to classify the areas with trees and shrubs. The amount (square feet) of tree/shrub cover (greenery) located within a school walk zone was calculated and recorded in the database. Cul-de-sac: The location of house was given a value of one (1) if on a cul-de-sac or dead end and zero (0) in all other cases. RESULTS Commute to School The majority children commute to and from school by car. About 55% of intermediate school children and 50% of middle school children ride a car to and from school. About 20% of intermediate school children walk to and from school while more than 31% of middle school children walk to and from school. Particularly in the afternoon more children walk home from school than walk to school in both intermediate and middle schools. About 16% of children bike to and from school in both school levels. Table 3. Comparison of commute modes to and from school by two different school levels (i.e.: intermediate and middle school). To School From School To/From School N Percentage N Percentage N Percentage Intermediate School Walking Biking Car/Car Pool School Bus Total Middle School Walking Biking Car/Car Pool School Bus Total We also looked at the commute modes by gender. Female children use motorized commute modes (62%) more than male children (50%). Particularly male children (20.7%) bike more than female children (13%). Walking more in the afternoon is a similar trend for both genders. 7
20 Table 4. Commute to school by gender To School From School To/From School N Percentage(%) N Percentage(%) N Percentage(%) Female Walking Biking Car/Car Pool School Bus Total Male Walking Biking Car/Car Pool School Bus Total Commute Frequency by Mode Among 10 possible commute times per week, middle school students walk significantly more often than intermediate school children. There are no significant differences using other commute modes (e.g., biking, car/car pool, and school bus) between the two school levels. Table 5. Mean frequency of commute mode per week by school level Intermediate Middle Mean Difference t-value N Mean (SD) N Mean (SD) Walking (2.52) (3.21) *** Biking (3.51) (3.45) Car/Car Pool (4.26) (3.92) School Bus (2.43) (1.48) **p <.01 Male children bike significantly more often per week than female children. However, female children ride cars more often than males although the relationship is marginal. Table 6. Mean frequency of commute mode per week by gender Male Female Mean Difference t-value N Mean (SD) N Mean (SD) Walking (2.90) (2.93) Biking (4.00) (3.04) * Car/Car Pool (4.08) (3.97) School Bus (1.52) (1.93) p <.10, *p <.05 Commute Distance by Mode Among children who walk to and from school, the mean walking street distance is.71 miles while the mean biking distance is approximately.9 miles. Beyond one mile, children tend to ride in a car or school bus. 8
21 Compared to intermediate schools, a slightly shorter trend exists for middle schools with respect to mean walking, biking, car/carpool, and school bus ridership distances. This may be influenced by the location of the school as can be seen in Figure 1. The middle school is more centrally located while the intermediate school is located at the edge of the school zone. The only significant mode difference between the two schools is the car/car pool driving distance.. Table 7. Mean street distance to school by school level Total Intermediate Middle N Mean Mean Mean N N (SD) Mean (SD) (SD) Difference t-value Walking (0.44) (0.46) (0.43) Biking (0.41) (0.44) (0.38) Car/Pool (0.51) (0.52) (0.42) *** Bus (0.68) (0.83) (0.35) * Unit of all distances is mile Compared to females, male children walk longer distances (t = 1.77, p <.10 (two tailed), d =.20). Otherwise, there are no significant mean distance differences between male and female children. Table 8. Mean street distance to school by gender Male Female N Mean Mean N Mean (SD) (SD) Difference t-value Walking (0.43) (0.45) Biking (0.37) (0.45) Car/Pool (0.45) (0.56) Bus (0.57) (0.75) * Unit of all distances is mile Parent's Perceived Barriers: Walkers vs. Non-Walkers A T-test was run to investigate the difference between walkers and non-walkers. The mean differences of parents perceived concerns for non-walkers are much higher than for walkers (see Table 9). The means of non-walkers concerns are significantly higher nine (9) of fifteen (15) items including traffic volume, speed, walking/biking alone, sidewalk/bikeway distances to traffic, absence (or inadequate) sidewalks/bikeways, lack of time, after school schedule, distance, and heavy backpack. 9
22 Table 9. T-tests between walkers vs. non-walkers for parents perceived concerns Parents Concerns Walkers Non-walkers Mean Mean SD N Mean SD N Difference t-value much traffic * speed * crime weather heavy backpack *** walking/biking alone * CSW/bikeways' closeness *** convenience children's unwillingness no CSW/bikeways * parking not enough time *** after-school schedule * distance *** store bike *p<.05, **p<.01, ***p<.001 Parent's Perceived Barriers: Bikers vs. Non-Bikers There are 3 (out of 15) significant mean differences for parents perceived concerns between bikers and non- bikers (see Table 10). The parents of non-bikers are more concerned about distance, lack of time, and children s unwillingness. Table 10. The mean differences of perceived concerns between bikers vs. non-bikers Bikers Non-bikers Mean t-value Mean SD N Mean SD N Difference distance * not enough time *** children's unwillingness ** Who Tends to Walk or Bike? As shown in Table 11, correlational analysis indicates that children who frequently walk to school tend to live on a gridded street rather than cul-de-sac and live closer to school. Walkers also tend to be tall and have more other children in their household. Their school walk zone has fewer sidewalks and bike lanes, but more trees and shrubs, a higher housing density, and a greater mix of land uses. In addition, middle school children are more likely to walk than intermediate school children. 10
23 Table 11. Correlations among commute mode, personal and household information, and built environment variables 1. Walking 2. Biking 3. Car/Pool 4. Bus 5. School 6. Age 7. Gender ** *** -.62*** * *** 1.21** *** * Height.20* ***.48*** Weight ***.40*** *** Income 11. Education 12. Fam Mem 13. Children # 14. Cars 15. Driver # 16. Distance 17. Intersection 18. Sidewalk 19. Bike lane 20. Housing 21. Land Mix 22. Greenery ** *.41*** *.17* ** ** *** ***.13.32***.15* ***.07.47***.27***.77*** *** **.27*** -.38*** -.32*** * ** *** -.60*** ** -.18* *** ** * -.35*** -.35*** * -.28**.19* ** -.31*** *** * * -.80*** -.63*** ** -.20* *** 1.00** ** -.15* *.20* ** -.19* **.33** *.23** -.97** *** *.54***.51*** **.32*** -.18* *.26*** *** -.27*** -.96*** -.36***.88*** 1.19* *.83***.67*** ***.24** *** -.97*** -.25** -1.00***.02.50*** 1 23.Cul-De-Sac ** ** * * p <.10, *p <.05, **p <.01, ***p <.001, 5. S L (0 : I, 1 : M ), 7. G (0 : M, 1 : F ), 1 2. F, 1 3. N C, 1 4. N C, 1 5. N L D, ,, 2 1. L U M 11
24 Children who bike more frequently tend to live on a gridded street rather than on a cul-de-sac. They also tend to live in a school walk zone with marginally higher sidewalk density and with significantly lower housing density. Who Tends to Ride a Car or Bus? As shown in Table 11, children who frequently ride in a car to school tend to live on a cul-de-sac street that is located farther away from school. They also have fewer household members and fewer other children in their households. Children who frequently ride a school bus tend to live farther away from school and have a greater number of household numbers. They also tend to live in areas with high intersection density, and more sidewalks and bike lanes. Their school walk zones have fewer trees and shrubs and a lower mix of land uses. DISCUSSION The average percentage of children walking to school in our study is higher than the national average (13%). About 20% of intermediate school children walk to and from school while more than 31% of middle school children walk to and from school. These numbers may be higher because not all the children in the district were included in the study. That is, children residing outside the walk zone were not included. The results suggest that a 2 mile walk zone might not be practical distance for the intermediate and middle school children. Different distance considerations should probably be made for different age groups and the actual distance threshold should be determined using a more scientific approach. School location within the walk zone may influence the distance traveled by mode. The centrally located school resulted in consistently lower travel distances than the peripherally located school. However, this study only examined two schools so conclusions have limited generalizability. It is interesting to note that walking is positively related to the amount of greenness. Since Texas is known for its heat, shade from the trees may provide some protection from the heat for children who walk to and from school. Another interesting finding is that sidewalk density is related more to biking than to walking. It seems that children may prefer using sidewalks for biking rather than the bike lanes. In addition, bike lanes have no significant influence on biking. It is possible that the bike lanes are not conveniently located or are perceived to be too dangerous.. CONCLUSION This research investigates how physical attributes in the pedestrian environment influence children s walking and biking to school. Our results indicate that distance to school, street pattern (grid vs. cul-de-sac), land use mix, greenery, sidewalks, bike lanes, intersections, housing density have significant impacts on 12
25 children s walking and biking to school. These findingscan be used to shape better school walk zone transportation infrastructure that may have lasting health consequences for young school children. 13
26 14
27 REFERENCES American Obesity Association. (2004). AOA Fact Sheets: Obesity in Youth. Retrieved December 22, 2004, from American Obesity Association. (2000). Objectives for Achieving and Maintaining a Healthy Population. Retrieved November 10, 2004, from CEFPI: The School Building Association. (2003). School Site Size: How Many Acres Are Necessary?. Retrieved December 1, 2004, from Centers for Disease Control and Prevention. (2002, August 16). Barriers to Children Walking and Biking to School --- United States, MMWR Weekly, 51(32), 1-6. Cervero, R., & Duncan, M. (2003). Walking, Bicycling, and Urban Landscapes: Evidence from the San Francisco Bay Area. American Journal of Public Health, 93(9), Cooper, A.R., Page, A.S., Foster, L.J., & Qahwaji, D. (2003). Commuting to School: Are Children Who Walk More Physically Active?. American Journal of Preventative Medicine, 25(4), Ewing, R., Schroeer, W., & Greene, W. (2004) School location and student travel: analysis of factors affecting mode choice. Transportation Research Record, 1895, Frank, L.D., Schmid, T.L., Sallis, J.F., Chapman, J. (2005). Linking objectively measured physical activity with objectively measured urban form. American Journal of Preventitive Medicine, 28 (2S2), Kweon, B., Naderi, J. R., Maghelal, P., & Shin, W. (2004). Correlates of environmental constructs and perceived safety enhancements in pedestrian corridors adjacent to urban street. College Station, TX: Texas A&M University. (NTIS No. PB ) Rivara, F.P., Bergman, A.B., & Drake, C. (1989). Parental Attitudes and Practices Toward Children as Pedestrians. Pediatrics, 84(6), Staunton, C., Hubsmith, D., & Kallins, W. (2003). Promoting Safe Walking and Biking to School: The Marin County Success Story. American Journal of Public Health 93: Surface Transportation Policy Project. (2003, September). Can t Get There from Here: The Declining Independent Mobility of California s Children and Youth. Retrieved November 15, 2004, from U.S. Department of Health and human Services. (2001). The Surgeon General s Call to Action to Prevent and Decrease Overweight and Obesity. Retrieved October 2, 2004, from 15
28 U.S. Department of Health and Human Services. (2004). Nutrition and Overweight: Healthy People 2010 Progress Review. Retrieved September 15, 2004, from U.S. Department of Health and Human Services Centers for Disease Control and Prevention. (2004). Kids Walk to School Programs: Fact Sheet. Retrieved April 28, 2004, from U.S. Environmental Protection Agency. (2003). Travel and Environmental Implications of School Siting (Publication EPA 231-R ). Retrieved November 3, 2004, from Walljasper, J. (2001, September-October). Why Johnny and Jana Can t Walk to School. Utne Reader, 5-6. Ziviani, J., Scott J., & Wadley, D. (2004). Walking to School: Incidental Physical Activity in the Daily Occupations of Australian Children. Occupational Therapy International, 11(1),

29 APPENDIX I: Survey Questionnaire 17
30 18
31 19
32 20
33 21
34 22
35 23
36 24
37 25
Summary Report: Built Environment, Health and Obesity
 Research and education Built Environment Edmonton Project Summary Report: Built Environment, Health and Obesity Introduction In 2007 the Canadian Institutes of Health Research and the Heart and Stroke
Walkable Communities and Adolescent Weight
 Walkable Communities and Adolescent Weight Sandy Slater, PhD Assistant Professor, University of Illinois at Chicago, School of Public Health Research Scientist, UIC Institute for Health Research and Policy
What s Health Got to Do With It? Health and Land Use Planning
 What s Health Got to Do With It? Health and Land Use Planning CANDACE RUTT, PH.D. EXECUTIVE DIRECTOR APRIL 13 TH, 2016 Planning and Public Health Planning + Public Health Healthy Communities Healthier
Urban planners have invested a lot of energy in the idea of transit-oriented
 DOES TRANSIT-ORIENTED DEVELOPMENT NEED THE TRANSIT? D A N I E L G. C H AT M A N Urban planners have invested a lot of energy in the idea of transit-oriented developments (TODs). Developing dense housing
Non-motorized Transportation Planning Resource Book Mayor s Task Force on Walking and Bicycling City of Lansing, Michigan Spring 2007 pg.
 Non-motorized Transportation Planning Resource Book pg. 105 of 158 Non-motorized Transportation Planning Resource Book pg. 106 of 158 Non-motorized Transportation Planning Resource Book pg. 107 of 158
National Safe Routes to School Program: Initial Results
 National Safe Routes to School Program: Initial Results Lauren Marchetti National Center for Safe Routes to School 9 th Annual New Partners for Smart Growth Thursday, February 4, 2010 Seattle, WA August
FACTS AND FIGURES: MAKING THE CASE FOR COMPLETE STREETS IN LEE COUNTY
 FACTS AND FIGURES: MAKING THE CASE FOR COMPLETE STREETS IN LEE COUNTY Safety: Close to 5,000 pedestrians and bicyclists die each year on U.S. roads, and more than 70,000 are injured. [Mean Streets, Surface
Sandra Nutter, MPH James Sallis, PhD Gregory J Norman, PhD Sherry Ryan, PhD Kevin Patrick, MD, MS
 Objectively Measured Environmental Correlates of Adolescent Physical Activity Sandra Nutter, MPH James Sallis, PhD Gregory J Norman, PhD Sherry Ryan, PhD Kevin Patrick, MD, MS San Diego State University
A Safe Routes to School Survey in Hillsborough County
 A Safe Routes to School Survey in Hillsborough County Prepared for Florida Department of Transportation, District 7 Project Manager: Peter Hsu, P.E. Prepared by Huaguo Zhou, Ph.D., P.E. Senior Research
This is a story of the Ugly, the Bad, and the Good. Fewer kids are biking and walking. More parents are driving.
 Why Safe Routes to School Matters: Safety, Health & Transportation This is a story of the Ugly, the Bad, and the Good. Fewer kids are biking and walking. More parents are driving. 2001: 16% walked Parents
Active Community Design: Why Here? Why Now?
 Active Community Design: Why Here? Why Now? Chris Holm Development Review Coordinator 20 April, 2015 Sacramento, California Our environment has changed North Natomas We ve rapidly urbanize our open space
1999 On-Board Sacramento Regional Transit District Survey
 SACOG-00-009 1999 On-Board Sacramento Regional Transit District Survey June 2000 Sacramento Area Council of Governments 1999 On-Board Sacramento Regional Transit District Survey June 2000 Table of Contents
The Impact of Policy and Environmental Outcomes on Youth Physical Activity
 The Impact of Policy and Environmental Outcomes on Youth Physical Activity Childhood Obesity Conference, San Diego, CA June 30, 2011 Sandy Slater, PhD Assistant Professor, University of Illinois at Chicago,
Active and Green: Healthy Communities Are Sustainable Communities
 Active and Green: Healthy Communities Are Sustainable Communities James Sallis, PhD San Diego State University www.drjamessallis.sdsu.edu For LISC Webinar May 4, 2011 Goals of talk Physical inactivity
Childhood Obesity: A Policy Perspective
 Leadership for Healthy Communities Advancing Policies to Support Healthy Eating and Active Living Childhood Obesity: A Policy Perspective Elizabeth Hinman elizabeth@leadershipforhealthycommunities.org
Background and Goals of SRTS
 Safe Routes to School Background and Goals of SRTS Oklahoma Kick-off May 4, 2011 The Good, the Bad, and the Ugly Fewer kids are biking and walking More parents are driving 1969 2009 48% walked or biked
The best indicator of an individual s and expanding access to parks and open space.
 Health & Wellness Create a Safe and Healthy Built Environment Artist s rendering, 2014 Health is important to Loveland residents, and stakeholders see the many strong connections between quality of life,
OC Healthy Communities Forum. The proportion of the population that live within a half mile of a major transit access point.
 OC Healthy Communities Forum Transit Access The proportion of the population that live within a half mile of a major transit access point. Use of public transit can result in decreased greenhouse gas emissions
Traffic Safety Barriers to Walking and Bicycling Analysis of CA Add-On Responses to the 2009 NHTS
 Traffic Safety Barriers to Walking and Bicycling Analysis of CA Add-On Responses to the 2009 NHTS NHTS Users Conference June 2011 Robert Schneider, Swati Pande, & John Bigham, University of California
Blueprint for Active Living Communities: Innovative Solutions. James Sallis University of California, San Diego For IOM PA Workshop.
 Blueprint for Active Living Communities: Innovative Solutions James Sallis University of California, San Diego For IOM PA Workshop. April 15, 2015 Outline of Talk Do built environments matter? Progress
The Walkability Indicator. The Walkability Indicator: A Case Study of the City of Boulder, CO. College of Architecture and Planning
 1 : A Case Study of the City of Boulder, CO College of Architecture and Planning University of Colorado Author Note: Daryoosh Ardalan, Urban Regional Planning, College of Architecture and Planning, University
Crash Analysis of I-64 Closure in St. Louis County
 Report # MATC-MST: 341 Final Report 25-1121-0001-341 Crash Analysis of I-64 Closure in St. Louis County Ghulam H. Bham, Ph.D. Professor Department of Civil, Architectural, and Environmental Engineering
Complete Streets Basics and Benefits
 Complete Streets Basics and Benefits November 14, 2017 Complete Streets Workshop Ann Ogoreuc, AICP, Allegheny County Economic Development Hannah E. Hardy, Allegheny County Health Department Benefits of
Life Transitions and Travel Behaviour Study. Job changes and home moves disrupt established commuting patterns
 Life Transitions and Travel Behaviour Study Evidence Summary 2 Drivers of change to commuting mode Job changes and home moves disrupt established commuting patterns This leaflet summarises new analysis
Active Travel and Exposure to Air Pollution: Implications for Transportation and Land Use Planning
 Active Travel and Exposure to Air Pollution: Implications for Transportation and Land Use Planning Steve Hankey School of Public and International Affairs, Virginia Tech, 140 Otey Street, Blacksburg, VA
How Policy Drives Mode Choice in Children s Transportation to School
 How Policy Drives Mode Choice in Children s Transportation to School Physical Activity through Active Transportation Ruth L. Steiner 2011 Technical Conference and Exhibit Lake Buena Vista, FL April 3-6,
Creating walkable, bikeable and transit-supportive communities in Halton
 Creating walkable, bikeable and transit-supportive communities in Halton By presenting current research and best practices, the information in this paper is meant to support and broaden discussion on how
Complete Streets: Building Momentum in Connecticut
 Complete Streets: Building Momentum in Connecticut Tri-State Transportation Campaign, 2012 What are Complete Streets? Complete Streets are safe, comfortable, and convenient for travel for everyone, regardless
Public Healthy and Community Design
 Public Healthy and Community Design Jeffery Rosenhall, MA, LCI #2312 Health Program Manager, CDPH April 24, 2017 Stairwell interventions Urban bike track Public health and planning: A Road Map Planning,
Built Environment and Older Adults: Supporting Smooth Transitions Across the Life- Span. Dr. Lawrence Frank, Professor and Bombardier UBC
 Built Environment and Older Adults: Supporting Smooth Transitions Across the Life- Span Dr. Lawrence Frank, Professor and Bombardier Chair @ UBC The Hidden Health Costs of Transportation - Frank et al
Cabrillo College Transportation Study
 Cabrillo College Transportation Study Planning and Research Office Terrence Willett, Research Analyst, Principle Author Jing Luan, Director of Planning and Research Judy Cassada, Research Specialist Shirley
Health Impact Analysis for Integrated Regional Land Use and Transportation Plan
 Health Impact Analysis for Integrated Regional Land Use and Transportation Plan Hsi-Hwa Hu, Guoxiong Huang, Frank Wen, Simon Choi (Southern California Association of Governments) Margaret Shih (Los Angeles
Philadelphia Bus Network Choices Report
 Philadelphia Bus Network Choices Report JUNE 2018 SEPTA Table of Contents Executive Summary...7 What if transit gave us more freedom?... 8 What is this report?... 8 The main conclusions... 9 What is happening
How to Develop a Pedestrian Safety Action Plan
 How to Develop a Pedestrian Safety Action Plan Course Introduction Presented by: Peter Eun FHWA RC Safety Engineer Ryan Snyder President, Ryan Snyder Associates, LLC Paul Zykofsky Director, Land Use and
Transportation Issues Poll for New York City
 2016-17 Transportation Issues Poll for New York City 82% support Vision Zero and reducing traffic deaths 72% on average, support more street space for children to play, protected bike lanes and other safety
NASHUA REGIONAL PLANNING COMMISSION REGIONAL BICYCLE AND PEDESTRIAN PLAN
 NASHUA REGIONAL PLANNING COMMISSION REGIONAL BICYCLE AND PEDESTRIAN PLAN June, 2005 Prepared by the Nashua Regional Planning Commission 2005 NRPC Regional Bicycle and Pedestrian Plan- JUNE 2005 ACKNOWLEDGEMENTS
Chapter 5. Complete Streets and Walkable Communities.
 Chapter 5. Complete Streets and Walkable Communities. 5.1 Description of Complete Streets. Cities throughout the world, and specifically the United States, are coming to embrace a new transportation and
Health and Community Design: The Local Government Role in Promoting Active Living
 Health and Community Design: The Local Government Role in Promoting Active Living Rich Killingsworth, Director Active Living by Design National Program Office University of North Carolina School of Public
Built Environment Childhood Obesity Forum September 15, 2010
 Built Environment Childhood Obesity Forum September 15, 2010 TITLE Why do we have cities? Boston MA To minimize travel & maximize exchange (bring people closer together) How have we built our urban roadway
Making the Case for Healthy Planning & Initiatives
 Making the Case for Healthy Planning & Initiatives George Berger, AICP NC-ARTS Region 4 Coordinator Cabarrus REACH Safe Routes to School Coordinator Counties Served: Alexander, Cabarrus, Catawba, Cleveland,
METROPOLITAN TRANSPORTATION PLAN OUTREACH: INTERACTIVE MAP SUMMARY REPORT- 10/03/14
 METROPOLITAN TRANSPORTATION PLAN OUTREACH: INTERACTIVE MAP SUMMARY REPORT- 10/03/14 INTRODUCTION This document summarizes the results of the online interactive mapping exercise implemented by MIG for the
Investment in Active Transport Survey
 Investment in Active Transport Survey KEY FINDINGS 3 METHODOLOGY 7 CYCLING INFRASTRUCTURE 8 Riding a bike 9 Reasons for riding a bike 9 Mainly ride on 10 Comfortable riding on 10 Rating of cycling infrastructure
Agenda. US-1 Corridor Study and HIA Update. Pathway Diagram / Primary Indicators. Research Questions. Linking Multimodal Improvements to Indicators
 Icebreaker Agenda US-1 Corridor Study and HIA Update Pathway Diagram / Primary Indicators Research Questions Linking Multimodal Improvements to Indicators Vulnerable Populations US-1 Corridor Study Vision
Montana Safe Routes to School. Encouraging Active Lifestyles
 Montana Safe Routes to School Encouraging Active Lifestyles SRTS Coordinator Taylor Lonsdale, PE taylor.lonsdale@coe.montana.edu (406) 994-7031 Call me! It s my job to help you. The need for Safe Routes
Introduction. Who is WILMAPCO. Why are walkable communities important
 Walkable Community Workshops Round 1 April 2005 SPONSORED BY WILMAPCO AND CCOBH CITY OF NEW CASTLE EDGEMOOR GARDENS CIVIC ASSOCIATION WITH FUNDING BY DELAWARE DEPARTMENT OF TRANSPORTATION AND THE DELAWARE
BUILDING THE CASE FOR TRAVEL OPTIONS IN WASHING TON COUNTY. Image: Steve Morgan. Image: Steve Morgan
 BUILDING THE CASE FOR TRAVEL OPTIONS IN WASHING TON COUNTY Image: Steve Morgan Image: Steve Morgan Image: TriMet Image: TriMet WHAT ARE TRAVEL OPTIONS PROGRAMS? Travel options programs encourage residents,
Active People, Healthy Nation Creating an Active America, Together
 National Center for Chronic Disease Prevention and Health Promotion Division of Nutrition, Physical Activity, and Obesity Active People, Healthy Nation Creating an Active America, Together October 19,
Thresholds and Impacts of Walkable Distance for Active School Transportation in Different Contexts
 Thresholds and Impacts of Walkable Distance for Active School Transportation in Different Contexts Xuemei Zhu, Chanam Lee, Zhipeng Lu, Chia-Yuan Yu College of Architecture, Texas A&M University CONTENT
U.S. Bicycling Participation Study
 U.S. Bicycling Participation Study Report of findings from the 2016 survey Conducted by Corona Insights Commissioned by PeopleForBikes Released July 2017 Table of Contents Background and Objectives 3 Research
Health Beyond Healthcare The Chronic Disease Impacts of Neighborhood Design. Erik J. Aulestia, AICP Principal, Torti Gallas + Partners
 Health Beyond Healthcare The Chronic Disease Impacts of Neighborhood Design Erik J. Aulestia, AICP Principal, Torti Gallas + Partners Prior to 20th Century How should a city look and function? Architects
CITY OF COCOA BEACH 2025 COMPREHENSIVE PLAN. Section VIII Mobility Element Goals, Objectives, and Policies
 CITY OF COCOA BEACH 2025 COMPREHENSIVE PLAN Section VIII Mobility Element Goals, Objectives, and Policies Adopted August 6, 2015 by Ordinance No. 1591 VIII MOBILITY ELEMENT Table of Contents Page Number
Perceptions of the Physical Environment Surrounding Schools & Physical Activity among Low-income, Urban, African American Adolescent Girls
 Perceptions of the Physical Environment Surrounding Schools & Physical Activity among Low-income, Urban, African American Adolescent Girls Erin Hager, PhD Candice Gormley, BS Laura Latta, MHS M. Reese
COLUMBUS AVENUE NEIGHBORHOOD TRANSPORTATION STUDY
 COLUMBUS AVENUE NEIGHBORHOOD TRANSPORTATION STUDY Pedestrian Survey Findings Survey Main Findings: Transit and walking are the main two modes used by both visitors and residents of the area, regardless
Modal Shift in the Boulder Valley 1990 to 2009
 Modal Shift in the Boulder Valley 1990 to 2009 May 2010 Prepared for the City of Boulder by National Research Center, Inc. 3005 30th Street Boulder, CO 80301 (303) 444-7863 www.n-r-c.com Table of Contents
Building Health into Communities: A Smart Solution to Public Health Challenges Juan Pablo Reynoso
 1 Building Health into Communities: A Smart Solution to Public Health Challenges Juan Pablo Reynoso I. Introduction Over the past few decades, the United States has seen a dramatic rise in the prevalence
LESSONS FROM THE GREEN LANES: EVALUATING PROTECTED BIKE LANES IN THE U.S.
 LESSONS FROM THE GREEN LANES: EVALUATING PROTECTED BIKE LANES IN THE U.S. FINAL REPORT: APPENDIX C BICYCLIST ORIGIN AND DESTINATION ANALYSIS NITC-RR-583 by Alta Planning and Design Matt Berkow Kim Voros
Chapter 2. Bellingham Bicycle Master Plan Chapter 2: Policies and Actions
 Chapter 2 Bellingham Bicycle Master Plan Chapter 2: Policies and Actions Chapter 2: Policies and Actions The Bicycle Master Plan provides a road map for making bicycling in Bellingham a viable transportation
Neighborhood environments and physical activity in youth: from research to practice
 Neighborhood environments and physical activity in youth: from research to practice Jordan Carlson, PhD Center for Children s Healthy Lifestyles and Nutrition Children s Mercy Kansas City Contributors
Physical activity has a number of benefits
 Health Policy Brief September 2018 Walking Among California Adults Susan H. Babey, Joelle Wolstein, and Allison L. Diamant SUMMARY: This policy brief describes two types of walking among California adults:
INFRASTRUCTURE: Using the Grid to Create a more Self-Sustaining Downtown. Studio Spring 2013
 EMERGENT FUTURES The San Diego Section of the American Society of Civil Engineers (ASCE) released a new report, the 2012 San Diego County Infrastructure Report Card. Since the last San Diego Report Card
DOT HS September Crash Factors in Intersection-Related Crashes: An On-Scene Perspective
 DOT HS 811 366 September 2010 Crash Factors in Intersection-Related Crashes: An On-Scene Perspective DISCLAIMER This publication is distributed by the U.S. Department of Transportation, National Highway
Complete Streets Policy and Practice
 Complete Streets Policy and Practice presented by Leslie Phemister, Nancy Wagner and Kasey Holloway Active Transportation Alliance 1 Learning Objectives Understand the connection between public health
Health and the Built Environment
 Health and the Built Environment Today s children may be the first generation to have a shorter life expectancy than their parents have. Obesity is the tip of the iceberg; other chronic conditions are
CITY OF ALPHARETTA DOWNTOWN MASTER PLAN TRAFFIC EVALUATION
 CITY OF ALPHARETTA DOWNTOWN MASTER PLAN TRAFFIC EVALUATION June 2015 CITY OF ALPHARETTA DOWNTOWN MASTER PLAN TRAFFIC EVALUATION Introduction The Alpharetta Downtown Master Plan was developed in the fall
2016 APS Go! Surveys Summary Results for Arlington Traditional School
 2016 APS Go! Surveys Summary Results for Arlington Traditional School This report summarizes results from the 2016 APS Go! surveys for Arlington Traditional School. Student, parent/caregiver and staff
City of Elizabeth City Neighborhood Traffic Calming Policy and Guidelines
 City of Elizabeth City Neighborhood Traffic Calming Policy and Guidelines I. Purpose: The City of Elizabeth City is committed to ensure the overall safety and livability of residential neighborhoods. One
Online Open House Survey Report. December 2016
 December 216 I. OVERVIEW & OUTREACH SUMMARY Introduction Washington County evaluated long-term transportation investments and strategies as part of the Transportation Futures Study. The purpose of the
Location Matters: Where America Is Moving
 Location Matters: Where America Is Moving Nearly half of all American households plan to move at some point in the future. While some will move for a larger or nicer home, or perhaps to purchase a home
11/28/2016 VIA
 11/28/2016 VIA EMAIL Ethan Meltzer, Assistant Planner City of Sacramento Community Development Department 300 Richards Blvd., 3 rd Floor Sacramento, Ca 95811 RE: Natomas Corporate Center Commercial Building
Rider Satisfaction Survey Phoenix Riders 2004
 Rider Satisfaction Survey Riders Prepared For: Valley Metro Spring 2720 E. Thomas Rd. Bldg. A, Arizona 85016-8296 602-707-0050 answers@westgroupresearch.com Valley Metro Rider Satisfaction Survey - Page
2017 North Texas Regional Bicycle Opinion Survey
 2017 North Texas Regional Bicycle Opinion Survey Sustainable Development Program Kevin Kokes, AICP Public Meetings April, 2018 North Central Texas Council of Governments MPO for the Dallas-Fort Worth Region
2015 Florida Main Street Annual Conference. Complete Streets Equal Stronger Main Streets
 WHAT ARE COMPLETE STREETS? CASE STUDIES COMPLETING YOUR MAIN STREET 2015 Florida Main Street Annual Conference St. Petersburg, Florida August 19, 2015 WHAT ARE COMPLETE STREETS? CASE STUDIES COMPLETING
Summary Report School Walking & Bicycling Audits. Mesa County Regional Transportation Planning Office
 Summary Report School Walking & Bicycling Audits Mesa County Regional Transportation Planning Office This page left blank intentionally WALKING & BICYCLING AUDIT SUMMARY 2 Executive Summary Background:
SUSTAINABILITY, TRANSPORT, & HEALTH. Ralph Buehler, Virginia Tech
 SUSTAINABILITY, TRANSPORT, & HEALTH Ralph Buehler, Virginia Tech Prepared for National Academies Roundtable on Science and Technology for Sustainability 6 December 2013 Overview Trends in Motorization
NEWS-CFA: Confirmatory Factor Analysis Scoring for Neighborhood Environment Walkability Scale (Updated: March 15, 2011)
") NEWS-CFA: Confirmatory Factor Analysis Scoring for Neighborhood Environment Walkability Scale (Updated: March 15, 2011) The NEWS is a self-report perceived environment survey originally developed by Saelens
NEWS-CFA: Confirmatory Factor Analysis Scoring for Neighborhood Environment Walkability Scale (Updated: March 15, 2011) The NEWS is a self-report perceived environment survey originally developed by Saelens
10/30/2012 VIA
 10/30/2012 VIA EMAIL David Hung, Associate Planner Community Development Department, Current Planning Division City of Sacramento 300 Richards Blvd., 3 rd Floor Sacramento, CA 95811 RE: The Cannery On-Site
THESE DAYS IT S HARD TO MISS the story that Americans spend
 WHICH COMES FIRST: THE NEIGHBORHOOD OR THE WALKING? BY SUSAN HANDY AND PATRICIA MOKHTARIAN THESE DAYS IT S HARD TO MISS the story that Americans spend more time stuck in traffic than ever, that they re
Peel Health Initiatives Health and Urban Form
 Region of Peel Public Health Peel Health Initiatives Health and Urban Form alpha Conference June 9, 2008 Gayle Bursey Director, Chronic Disease and Injury Prevention Declaration No part of the information
2016 APS Go! Surveys Summary Results for Oakridge Elementary School
 2016 APS Go! Surveys Summary Results for Oakridge Elementary School This report summarizes results from the 2016 APS Go! surveys for Oakridge Elementary School. Student, parent/caregiver and staff surveys
Briefing Paper #1. An Overview of Regional Demand and Mode Share
 2011 Metro Vancouver Regional Trip Diary Survey Briefing Paper #1 An Overview of Regional Demand and Mode Share Introduction The 2011 Metro Vancouver Regional Trip Diary Survey is the latest survey conducted
AAMPO Regional Transportation Attitude Survey
 AAMPO Regional Transportation Attitude Survey Traditionally Underserved Populations helping organizations make better decisions since 1982 2018 Submitted to the AAMPO By: ETC Institute 725 W. Frontier
Key objectives of the survey were to gain a better understanding of:
 3 COMMUNITY INPUT Community input is an essential part of corridor studies. For the SR 87 corridor study, VTA staff conducted an extensive online survey of people living and commuting along the corridor.
Complete Street Analysis of a Road Diet: Orange Grove Boulevard, Pasadena, CA
 Complete Street Analysis of a Road Diet: Orange Grove Boulevard, Pasadena, CA Aaron Elias, Bill Cisco Abstract As part of evaluating the feasibility of a road diet on Orange Grove Boulevard in Pasadena,
2010 Pedestrian and Bicyclist Special Districts Study Update
 2010 Pedestrian and Bicyclist Special Districts Study Update Pedestrian and Bicyclist Special Districts Program Overview H-GAC s Special Districts Program aims to provide strategic investments in pedestrian
Transportation Trends, Conditions and Issues. Regional Transportation Plan 2030
 Transportation Trends, Conditions and Issues Regional Transportation Plan 2030 23 Regional Transportation Plan 2030 24 Travel Characteristics Why Do People Travel? Over one-half of trips taken in Dane
IMPACT OF BICYCLE INFRASTRUCTURE IMPROVEMENTS IN NEW ORLEANS, LOUISIANA. Kathryn M. Parker MPH, Janet Rice PhD, Jeanette Gustat PhD
 IMPACT OF BICYCLE INFRASTRUCTURE IMPROVEMENTS IN NEW ORLEANS, LOUISIANA Kathryn M. Parker MPH, Janet Rice PhD, Jeanette Gustat PhD Background A comparison of both self-reported and objectively measured
1. Slide Summary: This course covers methods and best practices used by professional planners, engineers, and consultants/researchers This course
 1 1. Slide Summary: This course covers methods and best practices used by professional planners, engineers, and consultants/researchers This course does not focus on advocacy; rather, it introduces current
FLETCHER AVENUE PEDESTRIAN AND BICYCLIST BEHAVIOR CHANGE FORMATIVE RESEARCH PROJECT
 FLETCHER AVENUE PEDESTRIAN AND BICYCLIST BEHAVIOR CHANGE FORMATIVE RESEARCH PROJECT EXTENT OF CHANGES IN PEDESTRIAN AND BICYCLIST ATTITUDES AND BEHAVIORS DIRECTLY AFTER A COMPLETE STREETS PROJECT IN FLORIDA
RESOLUTION NO ?? A RESOLUTION OF THE CITY OF NEPTUNE BEACH ADOPTING A COMPLETE STREETS POLICY
 RESOLUTION NO. 2018-?? A RESOLUTION OF THE CITY OF NEPTUNE BEACH ADOPTING A COMPLETE STREETS POLICY WHEREAS, safe, convenient, and accessible transportation for all users is a priority of the City of Neptune
Safe Routes to School: A Step in the Right Direction
 Safe Routes to School: A Step in the Right Direction Eric Bjorlin Active Transportation Alliance 1 Safe Routes to School Programs Make walking and bicycling safer options for getting to and from school
Cascade Bicycle Club Strategic Plan
 The Greater Context Bicycling has become fundamentally important as large-scale currents of change threaten the health, economy and livability of communities throughout the United States and the world
2014 peterborough city and county. active. transportation. & health. indicators primer
 2014 city and county active transportation & health indicators primer executive summary Walking, cycling and transit are good for our personal health, our local economies, and the environment. Understanding
Public Health in the Public Realm: Influencing Street Design with Health in Mind Dr. David McKeown Medical Officer of Health
 Public Health in the Public Realm: Influencing Street Design with Health in Mind Dr. David McKeown Medical Officer of Health Complete Streets Forum April 23, 2010 Common Goals of Public Health and Complete
Parent Survey Report: One School in One Data Collection Period
 Parent Survey Report: One School in One Data Collection Period School Name: Pinckney Elementary School Set ID: 12170 School Group: Douglas County Month and Year Collected: October 2014 School Enrollment:
WALK Friendly Communities: Creating Vibrant, Inclusive Places for People
 WALK Friendly Communities: Creating Vibrant, Inclusive Places for People Walkers are the indicator species for vibrant communities ~ Dr. Rodney Tolley, Director, Walk21 Imagine yourself walking safely
Smart Growth: Residents Social and Psychological Benefits, Costs and Design Barbara Brown
 Smart Growth: Residents Social and Psychological Benefits, Costs and Design Barbara Brown By Scott Siedor 11 At the invitation of the Goodwin-Niering Center for the Environment, Barbara Brown came to Connecticut
GRAHAM PEDESTRIAN TRANSPORTATION PLAN
 GRAHAM PEDESTRIAN TRANSPORTATION PLAN Chapter 1 I 1.1 Scope and Purpose n March of 2005, the City of Graham contracted with Greenways Incorporated (GWI) to create a Pedestrian Transportation Plan. The
Incorporating Health in Regional Transportation Planning
 Mayor Karl Dean, Chairman Incorporating Health in Regional Transportation Planning Leslie A. Meehan, AICP Center TRT Intervention Webinar January 29, 2013 Objectives for Today Background About the Nashville
City of Novi Non-Motorized Master Plan 2011 Executive Summary
 City of Novi Non-Motorized Master Plan 2011 Executive Summary Prepared by: February 28, 2011 Why Plan? Encouraging healthy, active lifestyles through pathway and sidewalk connectivity has been a focus
Purpose and Need. Chapter Introduction. 2.2 Project Purpose and Need Project Purpose Project Need
 Chapter 2 Purpose and Need 2.1 Introduction The El Camino Real Bus Rapid Transit (BRT) Project (Project) would make transit and other transportation improvements along a 17.6-mile segment of the El Camino