Evaluation of Blue Confirmation Lights on Red Light Running at Signalized Intersections
|
|
|
- Jesse May
- 5 years ago
- Views:
Transcription


1 Report # MATC-KU: 147 Final Report WBS: Evaluation of Blue Confirmation Lights on Red Light Running at Signalized Intersections Steven D. Schrock, Ph.D., P.E. Associate Professor Civil, Environmental, & Architectural Engineering University of Kansas Eric Fitzsimmons, Ph.D. Post Doctoral Researcher Civil, Environmental, & Architectural Engineering University of Kansas Kwaku Boakye Graduate Research Assistant Civil, Environmental, & Architectural Engineering University of Kansas 2015 A Cooperative Research Project sponsored by U.S. Department of Transportation-Research and Innovative Technology Administration The contents of this report reflect the views of the authors, who are responsible for the facts and the accuracy of the information presented herein. This document is disseminated under the sponsorship of the Department of Transportation University Transportation Centers Program, in the interest of information exchange. The U.S. Government assumes no liability for the contents or use thereof.
2 Evaluation of Blue Confirmation Lights on Red Light Running at Signalized Intersections Steven D. Schrock, Ph.D., P.E. Associate Professor Civil, Environmental, & Architectural Engineering University of Kansas Eric Fitzsimmons, Ph.D. Post Doctoral Researcher Civil, Environmental, & Architectural Engineering University of Kansas Kwaku Boakye Graduate Research Assistant Civil, Environmental, & Architectural Engineering University of Kansas A Report on Research Sponsored by Mid-America Transportation Center University of Nebraska-Lincoln January 2015
3 Technical Report Documentation Page 1. Report No. 2. Government Accession No. 3. Recipient s Catalog No Title and Subtitle 5. Report Date Evaluation of Blue Confirmation Lights on Red Light Running at Signalized January 2015 Intersection 6. Performing Organization Code 7. Author(s) 8. Performing Organization Report No. S.D. Schrock, E.J. Fitzsimmons, and K. Boakye Performing Organization Name and Address 10. Work Unit No. (TRAIS) Mid-America Transportation Center 2200 Vine St. PO Box Lincoln, NE Contract or Grant No. 12. Sponsoring Organization Name and Address 13. Type of Report and Period Covered Research and Innovative Technology Administration 1200 New Jersey Ave., SE Washington, D.C Supplementary Notes 14. Sponsoring Agency Code MATC TRB RiP No Abstract Red light running (RLR) is a national safety issue. The Insurance Institute for Highway Safety reported in 2012 that RLR resulted in 683 fatalities and an estimated 133,000 injuries nationwide. Currently, a wide range of countermeasures including low-cost strategies (e.g. signal timing adjustments, signal backplates, signage improvements, and targeted enforcement) to high-cost strategies (e.g. automated enforcement, lighted stop bar systems, and intersection geometric improvements) exist to mitigate RLR violations and associated crashes. The severity of RLR crashes and the high societal cost associated with RLR have provided the impetus for increased red light enforcement programs throughout the country. In the State of Kansas, where automated red light cameras are not authorized, communities rely on targeted traffic law enforcement. Traditionally, red light enforcement has required a police officer to be located upstream of an intersection to observe the violation and another officer located downstream to pullover the offender and issue a ticket. This is labor intensive. In locations where enforcement resources are limited, having a single police officer monitor RLR raises intersection safety concerns. Confirmation light systems can aid a single police officer located downstream of an intersection in monitoring RLR violations without having to travel through an intersection to pull over the offender. The City of Lawrence installed confirmation lights at two signalized intersections (treatment sites) where RLR was prevalent. This study evaluated the effectiveness of the system using a before study and one and three months after RLR violation study at the two treatment sites and other 11 non-treated intersections. A test of proportion was used to determine if the changes in RLR violation rates from the before period to the after periods were statistically significant at the 95 percent level of confidence. The violation rates at the two treated sites were then compared to non-treated sites that included six spillover sites (intersections nearby the treatment sites) and five control sites. Results of the analysis showed a 57.4 percent reduction in left turn RLR violation rates at the treatment sites and a 55.7 percent reduction at the spillover sites one month after installation of the confirmation lights. The three-months-after study saw a 42.7 percent decrease in violation rates at the treatment sites and a 31.7 percent decrease at spillover sites. Considering RLR violations in the City of Lawrence as a whole, the control sites saw reductions in left turn RLR violations during the after periods which were not statistically significant. The through movement RLR violations showed substantial reductions one month after installation at the treatment and spillover sites, but overall showed an increase in the violation rates three months after installation. At the control sites, the through movement violations increased significantly with time. In conclusion, the main findings of this research study indicated that confirmation lights can be an effective low-cost countermeasure to aid traffic law enforcement units to safely and efficiently monitor RLR violations at signalized intersections. 17. Key Words 18. Distribution Statement 19. Security Classification (of this report) 20. Security Classification (of this page) Unclassified. Unclassified No. of Pages 22. Price ii
4 Table of Contents Abstract... ix Acknowledgements... xi Chapter 1 Introduction... Error! Bookmark not defined. 1.1 Background Research Objective Thesis Organization... 3 Chapter 2: Literature Review... Error! Bookmark not defined. 2.1 Red Light Running Frequency of Red Light Running Characteristics of Red Light Runners Factors Contributing to Red Light Running Red Light Running Countermeasures Engineering Countermeasures Signal Operation Yellow Change Interval All-Red Clearance Interval Green Extension Signal Operation and Coordination Motorist Information Improve Signal Visibility Improve Signal Conspicuity Advance Warning Signs Physical Improvements Enforcement Countermeasures Automated Enforcement Targeted Enforcement Confirmation Lights Public Education Literature Review Summary Chapter 3: Problem Statement Chapter 4: Research Approah... Error! Bookmark not defined. 4.1 Measure of Safety Site Selection Site Category Treatment Sites Spillover Sites Control Sites Site Description Treatment Sites rd Street & Iowa Street rd Street & Louisiana Street Spillover Sites th Street & Louisiana Street rd Street & Alabama Street rd Street and Ousdahl Road iii
5 Clinton Parkway & Crestline Drive th Street & Iowa Street th Street & Iowa Street Control Sites th Street & Kasold Drive th Street & Wakarusa Drive th Street and Michigan Street st Street & Iowa Street Clinton Parkway & Kasold Drive Field Data Collection Data Reduction Data Collection and Reduction Limitations Installation of Confirmation Lights Public Awareness of the Confirmation Lights Chapter 5: Results... Error! Bookmark not defined RLR Violation Rates by Intersection Lane Background Methodology Results Left Turn RLR Violation Rates Through Movement RLR Violation Rates Right Turn Violation Rates Violation by the Time of Day Background Methodology Results Morning Peak RLR Violation Evening Peak RLR Violation Time into Red Analysis Background Methodology Results Left Turning Movement Through Movement Average Time into Red Violation Configurations and Vehicle Types Background Methodology Results Violation Configurations Violation by Vehicle Type Chapter 6: Statistical Analysis of RLR Violations Comparison of RLR Violation Rates after Installation of Confirmation Lights Methodology Results for Change in Red Light Running Violations Analysis of Left Turning Movement Red Light Running Violations iv
6 6.3.2 Analysis of Through Movement Red Light Running Violations Before-After Effect on Violation Time into Red Methodology Results Chi-Square Test for Before and 1 month After Study Chi-Square Test for Before and 3 months After Study Chapter 7: Conclusions and Recommendations General Conclusions Contributions to Highway Safety Research Limitations Future Research Crash Data Analysis Additional Violation Studies Evaluation of Public Awareness Campaign Refrences... Error! Bookmark not defined. Appendix A Characteristics and Aerial Views of Intersections Appendix B Reduced RLR Violation Data for Before and After Studies Appendix C Press Releases v
7 List of Figures Figure 1.1 Varieties of confirmation lights... 2 Figure 2.1 Retroreflective backplate border (FDOT, 2014) Figure 2.2 Redundant red light signal configurations (MUTCD 2009) Figure 2.3 Lighted stop bar system (active) in Houston, Texas (Tydlacka et al. 2011) Figure 2.4 LED backplate (active) in Houston, Texas (Tydlacka et al. 2011) Figure 2.5 Signal ahead sign, W3-3 (MUTCD 2009) Figure 2.6 Be Prepared To Stop sign, W3-4 (MUTCD 2009) Figure 2.7 Be Prepared To Stop sign supplemented with flashing beacons and when flashing plaque (MUTCD 2009) Figure 2.8 Design features and layout of AWEGS (Messer et al. 2004) Figure 2.9 Confirmation light wired directly into red aspect of signal Figure 4.1 Layout of treatment and spillover intersections in Lawrence, KS (Google maps 2013) Figure 4.2 Layout of the control and treatment sites in Lawrence, KS (Google maps 2013) Figure 4.3 Aerial view of 23 rd Street and Iowa Street (Google maps 2013) Figure 4.4 Ground view of the intersection of 23 rd Street and Iowa Street (northbound) Figure 4.5 Aerial view of the intersection of 23 rd Street and Louisiana Street (Google maps 2013) Figure 4.6 Ground view of the intersection of 23 rd Street and Louisiana Street (eastbound) Figure 4.7 Aerial view of the intersection of 19 th Street and Louisiana Street (Google maps 2013) Figure 4.8 Ground view of the intersection of 19 th Street and Louisiana Street (eastbound) Figure 4.9 Aerial view of the intersection of 23 rd Street and Alabama Street (Google maps 2013) Figure 4.10 Ground view of the intersection of 23 rd Street and Alabama Street (westbound) Figure 4.11 Aerial view of the intersection of 23 rd Street and Ousdahl Road (Google maps 2013) Figure 4.12 Ground view of the intersection of 23 rd Street and Ousdahl Road (eastbound) Figure 4.13 Aerial view of the intersection of Clinton Parkway and Crestline Drive (Google maps 2013) Figure 4.14 Ground view of the intersection of Clinton Parkway and Crestline Drive (westbound) Figure 4.15 Aerial view of the intersection of 19 th Street and Iowa Street (Google maps 2013). 52 Figure 4.16 Ground view of the intersection of 19 th Street and Iowa Street (northbound) Figure 4.17 Aerial view of the intersection of 25 th Street and Iowa Street (Google maps 2013). 54 Figure 4.18 Ground view of the intersection of 25 th Street & Iowa Street (northbound) Figure 4.19 Aerial view of the intersection of 6 th Street and Kasold Drive (Google maps 2013) Figure 4.20 Ground view of the intersection of 6 th Street and Kasold Drive (eastbound) Figure 4.21 Aerial view of the intersection of 6 th Street and Wakatrusa Drive (Google maps 2013) Figure 4.22 Ground view of the intersection of 6 th Street and Wakarusa Drive (eastbound) Figure 4.23 Aerial view of the intersection of 6 th Street and Michigan Street (Google maps 2013) vi
8 Figure 4.24 Ground view of the intersection of 6 th Street and Michigan Street (eastbound) Figure 4.25 Aerial view of the intersection of 31 st Street and Iowa Street (Google maps 2013). 64 Figure 4.26 Ground view of the intersection of 31 st Street and Iowa Street (northbound) Figure 4.27 Aerial view of the intersection of Clinton Parkway and Kasold Drive (Google maps 2013) Figure 4.28 Ground view of the intersection of Clinton Parkway and Kasold Drive (westbound) Figure 4.29 Camera view of an intersection approach Figure 4.30 Equipment used for field data collection effort Figure 4.31 Camera positions at intersection Figure 4.32 A member of the research team setting up a camera to record RLR violations Figure 4.33 RLR violation configurations Figure 4.34 Sample of reduced data in Microsoft Excel sheet Figure 4.35 Field installation of the confirmation light Figure 4.36 Daytime operation at 23 rd Street and Louisiana Street Figure 4.37 Nighttime operation at 23 rd Street and Louisiana Street Figure 4.38 Project investigator meeting with the media at one of the treatment intersections Figure 5.1 Left turn RLR violations rates per study intersection for before-after study (morning) Figure 5.2 Left turn RLR violations rates per study intersection for before-after study (evening) Figure 5.3 Through movement RLR violation rates per study intersection for before-after study (morning) Figure 5.4 Through movement RLR violation rates per study intersection for before-after study (evening) Figure 5.5 Right turn RLR violation rate per study intersection for before-after study (morning) Figure 5.6 Right turn RLR violation rate per study intersection for before-after study (evening) Figure 5.7 Distribution of RLR violation by time of the day during the morning peak Figure 5.8 Distribution of RLR violation by time of the day during the evening peak Figure 5.9 Left turning movement time into red at treatment intersections Figure 5.10 Left turning movement time into red at spillover intersections Figure 5.11 Left turning movement time into red at control intersections Figure 5.12 Through movement time into red at treatment intersections Figure 5.13 Through movement time into red at spillover intersections Figure 5.14 Through movement time into red at control intersections vii
9 List of Tables Table 2.1 Intersection, traffic and environmental factors to RLR (Yang and Najm 2006)... 8 Table 2.2 Possible causes and appropriate countermeasures for RLR (Hallmark et al. 2012) Table 2.3 Engineering countermeasures to red light running Table 4.1 Characteristics of the intersection of 23 rd Street and Iowa Street Table 4.2 Characteristics of the intersection of 23 rd Street and Louisiana Street Table 4.3 Characteristics of the intersection of 23 rd Street and Louisiana Street Table 4.4 Characteristics of the intersection of 23 rd Street and Alabama Street Table 4.5 Characteristics of the intersection of 23 rd Street and Ousdahl Road Table 4.6 Characteristics of the intersection of Clinton Parkway and Crestline Drive Table 4.7 Characteristics of the intersection of 19 th Street and Iowa Street Table 4.8 Characteristics of the intersection of 25 th Street and Iowa Street Table 4.9 Characteristics of the intersection of 6 th Street and Kasold Drive Table 4.10 Characteristics of the intersection of 6 th Street and Wakarusa Drive Table 4.11 Characteristics of the intersection of 6 th Street and Michigan Street Table 4.12 Characteristics of the intersection of 31 st Street and Iowa Street Table 4.13 Characteristics of the intersection of Clinton Parkway and Kasold Drive Table 4.14 RLR violation configuration description Table 5.1 Average time into red (seconds) Table 5.2 Violation configuration Table 5.3 RLR violation by vehicle type Table 6.1 Results of the red light running violation analysis for left turning movements Table 6.2 Results of the red light running violation analysis for through movements Table 6.3 Contingency table for RLR violation frequency at the treatment sites Table 6.4 Expected frequencies Table 6.5 Chi-square test for before and 1 month after study Table 6.6 Chi-square test for before and 3 months after study viii
10 Abstract Red light running (RLR) is a national safety issue. The Insurance Institute for Highway Safety reported in 2012 that RLR resulted in 683 fatalities and an estimated 133,000 injuries nationwide. Currently, a wide range of countermeasures including low-cost strategies (e.g. signal timing adjustments, signal backplates, signage improvements, and targeted enforcement) to high-cost strategies (e.g. automated enforcement, lighted stop bar systems, and intersection geometric improvements) exist to mitigate RLR violations and associated crashes. The severity of RLR crashes and the high societal cost associated with RLR have provided the impetus for increased red light enforcement programs throughout the country. In the State of Kansas, where automated red light cameras are not authorized, communities rely on targeted traffic law enforcement. Traditionally, red light enforcement has required a police officer to be located upstream of an intersection to observe the violation and another officer located downstream to pullover the offender and issue a ticket. This is labor intensive. In locations where enforcement resources are limited, having a single police officer monitor RLR raises intersection safety concerns. Confirmation light systems can aid a single police officer located downstream of an intersection in monitoring RLR violations without having to travel through an intersection to pull over the offender. The City of Lawrence installed confirmation lights at two signalized intersections (treatment sites) where RLR was prevalent. This study evaluated the effectiveness of the system using a before and one and three months after RLR violation study at the two treatment sites and other 11 non-treated intersections. A test of proportion was used to determine if the changes in RLR violation rates from the before period to the after periods were statistically significant at the 95 percent level of confidence. The violation rates at the two treated sites were then compared to ix
11 non-treated sites that included six spillover sites (intersections nearby the treatment sites) and five control sites. Results of the analysis showed a 57.4 percent reduction in left turn RLR violation rates at the treatment sites and a 55.7 percent reduction at the spillover sites one month after installation of the confirmation lights. The three-months-after study saw a 42.7 percent decrease in violation rates at the treatment sites and a 31.7 percent decrease at spillover sites. Considering RLR violations in the City of Lawrence as a whole, the control sites saw reductions in left turn RLR violations during the after periods which were not statistically significant. The through movement RLR violations showed substantial reductions one month after installation at the treatment and spillover sites, but overall showed an increase in the violation rates three months after installation. At the control sites, the through movement violations increased significantly with time. In conclusion, the main findings of this research study indicated that confirmation lights are an effective low-cost countermeasure to aid traffic law enforcement units to safely and efficiently monitor RLR violations at signalized intersections. x
12 Acknowledgments The research team would like to thank the following students for their assistance in collecting and reducing field video data: Ibraheem AlJulaijel, Prathmesh Argade, Huan Cheng, Tamara Jerjawi, Eric Kocher, Tomás Lindheimer, Lauren Marcucci, Shivraj Patil, Vishal Sarikonda, and Mazharali Udaipurwala. We would also like to thank the Lawrence Police Department and the Lawrence Traffic Engineering Department for their input in providing information, guidance, technical expertise, and their assistance in deploying the blue confirmation lights. xi
13 Chapter 1 Introduction 1.1 Background Vehicles running red lights is the leading cause of vehicle crashes at urban signalized intersections (IIHS 2013). Red light running (RLR) is a serious traffic safety issue that many communities in the United States are facing. RLR is a common event or situation where a vehicle proceeds through the signalized intersection when the red aspect of the signal is shown. In 2012, RLR resulted in 683 fatalities and an estimated 133,000 injuries nationwide (IIHS, 2013). Approximately half of the fatalities reported in 2012 were not the drivers, but were passengers, pedestrians, cyclists, and other road users. The consequences of RLR crashes have also had a negative effect on the U.S. economy. According to the Federal Highway Administration (FHWA), the annual societal cost of RLR is approximately 14 billion dollars (FHWA 2005). In 2013, AAA Foundation for Traffic Safety (2014) conducted a survey to assess how Americans value and pursue road safety. Results of the survey indicated that 93.1 percent of drivers believed running a red light was unacceptable, yet 35.2 percent of the same drivers polled admitted doing so when it was safe to stop at least once in the previous month. Due to the seriousness of RLR, considerable efforts have been taken by states and local agencies to explore and implement strategies to reduce RLR violations and associated crashes. Currently, a wide range of countermeasures exists to mitigate RLR violations and crashes. These include low-cost strategies such as traffic signal timing adjustments, signage improvements, targeted police enforcement, public awareness campaigns, and high-cost strategies, such as improvements to the physical geometric and operational characteristics of intersection approaches, and automated enforcement. These countermeasures have been implemented across 1
.")

14 the country, and previous studies have been completed to measure their effectiveness (Institute of Transportation Engineers 2003; Bonneson et al. 2004; Hallmark et al. 2012). As of May 2014, 503 communities in the United States have red light camera programs in place to capture drivers running red lights (IIHS 2014). However, automated red light cameras are sometimes not practical, feasible, or legal in some communities. The high cost of installation, state statutes, and the controversies surrounding their implementations have hindered their usage nationwide. In these circumstances, communities without automated enforcement rely on low-cost countermeasures to reduce RLR crashes at signalized intersections. A low-cost RLR countermeasure that has been found to have limited research are confirmation lights, sometimes referred to as enforcement lights. Confirmation lights come in variety of colors. For example, Figure 1.1 (A) shows a white confirmation light in Florida, and Figure 1.1 (B) shows a blue confirmation light in Kansas. This countermeasure has been deployed widely in communities located in California, Florida, and Texas (FHWA 2009). (a) (b) Figure 1.1 Varieties of confirmation lights 2
15 1.2 Research Objective The primary objective of this research study was to evaluate the effectiveness of confirmation lights at signalized intersections in Lawrence, Kansas. This was accomplished by conducting before and after RLR violation studies at two treated signalized intersections where confirmation lights were installed and at 11 non-treated signalized intersections. Analysis of the violation was completed with the understanding that reductions in the violation rates from the before period to the after periods were surrogate measures for reducing crashes at signalized intersections. 1.3 Report Organization This report is divided into seven chapters. Chapter 1 presents a brief background of RLR and discusses some of the strategies adopted in mitigating RLR at signalized intersections. In this same chapter, the objective of this study is presented as well. Chapter 2 summarizes literature from past and current studies on RLR. The literature review discusses RLR definitions, characteristics of the RLR violators, RLR violation and crash rates, and explains some of the countermeasures that have been implemented and evaluated by other researchers. Chapter 3 introduces the problem statement and explains why low-cost countermeasures to reduce RLR are beneficial and the need for this research. Chapter 4 outlines the methodology used in gathering and analyzing field video data from the study intersections. Chapter 5 presents descriptive statistics of the RLR violation data. Chapter 6 presents the analyses of RLR violation data using statistical methods and discusses the key findings from this research. Finally, Chapter 7, presents the conclusions, recommendations based on the research findings, and proposes future studies. 3
16 Chapter 2 Literature Review This chapter reviews current literature on RLR. It cites information from articles, informational and technical reports, research journals, and other relevant publications pertaining to RLR. The objective of this literature review was to: Define red light running; Identify characteristics of red light runners; Determine how frequently drivers run red lights; Determine factors that contribute to RLR; and Explore some of the strategies that have been implemented in reducing RLR violations and associated crashes. 2.1 Red Light Running RLR is one of the leading causes of vehicle crashes at urban signalized intersections. The definition of RLR differs from state to state based on whether permissive yellow or restrictive yellow laws are in effect. According to the FHWA (2013), under the permissive yellow rule as stated in the Manual on Uniform Traffic Control Device (MUTCD) and Uniform Vehicle Code (UVC)); Driver can legally enter intersection during the entire yellow interval and violation occurs if driver enters intersection after onset of red. Under the restrictive yellow rule, driver can neither enter nor be in intersection on red and violation occurs if driver has not cleared intersection after onset of red. In most states, vehicles that are within the intersection waiting to make a left turn when the signal changes from yellow to red are not considered to be running a red light, and are encouraged to clear the intersection. At intersections where a right turn on red is permitted, a 4
17 vehicle must come to a complete stop; failure to do so is also considered a violation (IIHS 2013). 2.2 Frequency of Red Light Running The AAA Foundation for Traffic Safety conducted a national survey in 2013 to assess the degree to which Americans value and pursue traffic safety. A sample size of 3,103 U.S. residents aged 16 years and older was asked to complete a web-based survey for this study. It was found that approximately 93 percent of drivers considered RLR an aggressive and unacceptable way of driving. However, 35 percent of the same drivers admitted doing so when it was safe to stop at least once in the previous month (AAA Foundation for Traffic Safety, 2014). McCartt and Eichelberge (2011) conducted a study to evaluate the attitudes of motorists towards red light camera programs in 15 cities in the United States. A sample size of 3,411 drivers participated in the telephone survey study. Results of the study indicated that 82 percent of the drivers said running a red light was a serious threat to their personal safety, and 93 percent said it was unacceptable to society. Hill and Lindly (2003) performed a study to develop models in predicting RLR violation rates at four-leg intersections based on their traffic operational and geometry characteristics. They collected RLR violation data at 19 study intersections in four states (Alabama, California, Iowa, and Texas) for a period of six hours on weekdays (2 p.m. to 8 p.m.). They observed 1,775 violations in 554 hours representing a rate of 3.2 violations per hour per intersection. Retting et al. (1998) conducted a study to analyze RLR violation data at two busy intersections equipped with red light cameras in Arlington, Virginia. They collected data between November 1994 and The study found a total of 8,121 RLR violations over a 5
18 period of 2,694 hours, representing an average of 3.0 red light runners per hour (Retting et al. 1998). 2.3 Characteristics of Red Light Runners Porter et al. (1999) conducted a telephone survey study to identify red light runners and their characteristics. Out of the 5,024 respondents who completed the survey, 4,007 were concentrated in ten target states and 1,017 in the remaining 40 states. Based on national data, the authors concluded that a driver running a red light was more likely to be: A younger driver; A driver without a child or children (less than 20 years old); Driving alone; In a rush to school or work in the morning on weekdays; Unemployed or employed in jobs requiring less education; Driving more than two miles from home; and Previously ticketed for RLR. Retting and Williams (1996) also conducted a similar study to investigate the behavior of red light runners in Arlington, Virginia. They asked trained observers to collect RLR violation data at an intersection equipped with red light enforcement cameras. During each cycle length, the observers recorded the characteristics of the drivers that ran the red lights and the type of vehicles they were driving. Out of 1,373 observations, the observers recorded 462 RLR violations at the study location. Findings from their study indicated that red light runners generally were drivers below 30 years of age, who drove small cars and had multiple convictions for speeding and moving violations. They also found out that violations were common for 6
19 drivers with car models manufactured after 1991 and the drivers were less likely to be wearing seat belts. Retting et al. (1999c) extracted data from the Fatality Analysis Reporting System (FARS ) and the General Estimates System (GES) to review the characteristics of red light runners. They found that red light runners were more likely to be a male driver under 30 years of age, more likely to have been ticketed for moving violations and more likely to have been convicted for driving while intoxicated. The authors also found that the violators were more likely to run red lights in the nighttime than in the daytime, and 53 percent of such drivers were believed to have a high blood alcohol concentration. 2.4 Factors Contributing to Red Light Running In the previous section, it was found that a majority of the RLR violations and crashes were human related. However, many studies have identified other contributing factors that lead to the frequency of RLR. Traffic operation characteristics such as approach volume and speed and intersection features such as signal timing, approach grade, and sight distance affect drivers behavior as they approach an intersection. Additionally, environmental factors such as time of day and weather conditions may also influence driving behavior (Yang and Najm 2006). Table 2.1 explains how intersection, traffic, and environmental factors contribute to the frequency of RLR. 7
20 Table 2.1 Intersection, traffic, and environmental factors to RLR (Yang and Najm, 2006) Element Variable Key Finding Reference The frequency of RLR increases when the yellow interval is less than 3.5 Brewer et al seconds. Signal Longer yellow intervals will cause Timing drivers to enter intersection later and Eccles and McGee 2000 lengthening the all-red intervals caters Intersection Traffic & Environment Stopping Distance Approach Speed Grade Intersection Width Approach Volume Time of Day Day of the week Weather to red light violators. Probability of a vehicle stopping for traffic signal decreases as its distance from the intersection decreases. Probability of a driver stopping for traffic signal decreases as the approach speed to the intersection increases. Probability of a driver stopping for traffic signal increases as the approach grade to the intersection increases. Drivers tend to stop for traffic lights more at wider intersections than at narrower intersections. Higher red light running rates are observed in cities with wider intersections and higher traffic volumes. The RLR frequency increases as the approach traffic volume at intersection increases. Higher red light violations occur during the time period of 3:00 p.m. to 5:00 p.m. The average number red light violations are higher during a.m. and p.m. peak hours compared to other times of the day. There are more red light violations on weekdays compared to weekends. The influence of rainfall on RLR behavior is not significant. Chang et al Chang et al Chang et al Chang et al Porter and England 2000 Brewer et al Kamyab et al. 2002; Kamyab et al Retting et al Lum and Wong 2003; Kamyab et al. 2002; Kamyab et al. 2000; Retting et al Retting et al Poor visibility as a result of obstructions from overhanging vegetation, billboards, large trucks, commercial signs, low pressure sodium lights, bad design of the intersection alignments, 8
21 parked vehicles, and pedestrians can be a major factor that influence drivers stop-go decisions at intersections. Clearing these obstacles enhance safety and traffic operations at intersections (FHWA 2005). 2.5 Red Light Running Countermeasures Successful RLR countermeasures range from engineering, education, and enforcement, and have been implemented in many communities across the United States. Studies have been conducted to investigate the effectiveness of these countermeasures, and sometimes results showed a positive effect in reducing RLR violations and associated crashes. Prior to implementation of any of the countermeasures, studies investigating possible causes of red light running should be carried out and then appropriate countermeasures be selected to mitigate the problem (Bonneson et al. 2004). Table 2.2 shows why a driver might want to run a red light and correlates the appropriate countermeasures that are likely or could address the cause (Hallmark et al. 2012). 9
22 Table 2.1 Possible causes and appropriate countermeasures for RLR (Hallmark et al. 2012) Possible Causes of RLR Signal Operation Engineering Countermeasures Motorist Information Physical Improvement Congestion or excessive delay Enforcement Disregard for red Judged safe due to low conflicting volume Judged safe due to narrow cross street Judged safe due to following < 2 sec behind vehicle infront Expectation of green when in platoon Downgrade steeper than expected Speed higher than posted limit Unable to stop (excessive deceleration) Pressured by closely following vehicle Tall vehicle ahead blocked view Unexpected, first signal encountered Not distracted, just did not see signal Distracted and did not see traffic signal Restricted view of signal Confusing signal display 2.6 Engineering Countermeasures From the literature, engineering countermeasures are generally categorized into three groups: signal operation countermeasures, motorist information countermeasures, and physical improvement countermeasures. Signal operation countermeasures involve the modifications or 10
23 adjustments of the timing of the signal phases and the change in cycle intervals. With motorist information countermeasures, drivers are provided with advance information about existing traffic signals ahead for drivers to respond appropriately as they approach an intersection. Physical improvement countermeasures involve the redesign of intersections to increase vehicle operational characteristics. Table 2.3 shows the three countermeasure categories with specific engineering countermeasure to reduce RLR. Table 2.2 Engineering countermeasures to red light running Countermeasure Category Signal Operation Motorist Information Physical Improvements RLR Countermeasure Yellow change interval Green extension Signal operation and coordination All red clearance interval Improve sight distance Improve signal visibility Improve signal conspicuity Advance warning signs Placement and number of signal heads Size of signal display Line of sight Redundancy LEDs signal lenses Backplates Lighted Stop Bar Systems LED outlined backplates. Signal ahead signs Advance warning flashers Rumble strips Remove unwanted signals Add capacity with additional traffic lanes Improve the geometry (vertical and horizontal curves) Convert signalized intersection to roundabout intersection Signal Operation Yellow Change Interval Most RLR violations occur less than two seconds after the onset of the red light (Washburn 2004). This means that increasing the yellow signal time could aid drivers in safely 11
24 clearing the intersection prior to the onset of the red signal. Retting et al. (2007) conducted a before-after comparison study to determine the effects of lengthening the yellow change time interval at two study intersections in Philadelphia, Pennsylvania. The yellow time was increased by one second, followed by red light camera enforcement several months later. They conducted a similar study at comparison intersections without any treatment. Results of their study showed a 36 percent reduction in violations when the yellow change interval was increased by one second. With the addition of red light enforcement, they observed a further reduction in RLR violations by 96 percent beyond the implemented yellow time change. The MUTCD provides guidance with regards to a minimum and maximum yellow interval. It recommends a minimum yellow change interval of three seconds and a maximum of six seconds. It also suggests that longer intervals should be reserved for use on approaches with higher speeds (MUTCD 2009). The Traffic Engineering Handbook, 6 th Edition (2009), recommends equation 2.1 be used to calculate the appropriate yellow time for any signalized intersection approach. However, it cautions that maximum care should be used when the interval time chosen is more than five seconds. McGee et al. (2012) in their research study did not find any reason to suggest a minimum or maximum yellow interval. v y = t + [ 2a + 2Gg ] (2.1) where y = yellow clearance interval (sec); t = reaction time (typically 1 sec); v = design speed (ft/sec 2 ); a = deceleration rate (typically 10 ft/sec 2 ); 12
25 g = acceleration due to gravity (32 ft/sec 2 ); and G = grade of approach (percent/100, downhill is negative grade) All-Red Clearance Interval An all-red phase is defined as when all the approaches at an intersection have a red-signal display for a very short period of time. If a vehicle enters an intersection without an all-red interval at the end of the yellow phase, it is more likely to result in a crash when vehicles in conflicting approaches receive a green light (McGee et al. 2003). Schattler et al. (2003) conducted a study at three signalized intersections in Oakland County, Michigan. The purpose of the study was to evaluate the impact of all-red clearance intervals on RLR violations and the late exit of vehicles within the intersections when the red light was indicated. They used video cameras to collect data before and after the implementation of the clearance intervals. They found that the implementation of all-red clearance intervals which ranged from two to three seconds significantly reduced the risk of late exiting of vehicles being struck by opposing traffic streams that have a green signal. According to the MUTCD (2009), Except when clearing a one-lane, two-way facility or when clearing an exceptionally wide intersection, a red clearance interval should have a duration not exceeding six seconds. However, in the Traffic Engineering Handbook, 6 th Edition (2009), it is suggested that equation 2.2 should be used to calculate the appropriate all red clearance interval. McGee et al. (2012) also recommended a minimum of one second time to be used for all-red clearance intervals. They suggested that providing additional time for vehicles that are legally in an intersection at the onset of red light allows drivers to clear the intersection in order to avoid conflict with adjacent traffic stream with a given green light. 13
26 where R = all red interval (sec); R = (w/l)/v (2.2) w = width of stop line to far side non-conflict point (ft); v = design speed (ft/sec); and L = length of vehicle Green Extension Green-extension systems (GES) extend the green phase of traffic signals before the yellow aspect of the signal is shown. This allows a vehicle or platoon of vehicles to clear the intersection before the yellow indication is shown. With this technology, advance detectors are deployed on major roads at actuated-signaled intersection approaches to change the signal phase or increase the green time when a vehicle passes over them. Approaches are cleared of vehicles that might have been in the dilemma zone until the green phase is maxed-out. Zegeer and Deen (1978) conducted a study to evaluate how GES could reduce RLR crashes at three signalized intersections in Kentucky. They used about nine years of before crash data and about four years of crash data after the installation of the GES at the three study sites. Results of their study showed 54 percent reduction in total crashes Signal Operation and Coordination Two or more adjacent signalized intersections are sometimes coordinated to move platoons of vehicles along a corridor in order to minimize delays and increase traffic flow. At isolated locations where signalized intersections are not in coordination, it may result in excessive delays, and impatient drivers may violate a red light when they arrive at an intersection 14
27 near the end of the green interval (Bonneson et al. 2002). For this reason, adjacent intersections should be coordinated so that the likelihood of drivers running a red light is minimized. Changes in signal phasing or cycle length can also reduce delays which potentially may reduce the frequency of RLR (Bonneson et al. 2002) Motorist Information The common reason drivers give for frequently running a red light is that I did not see the signal (McGee et al., 2003). Poor signal visibility and conspicuity, lack of advance warning signs, and inadequate sight distance at signalized intersections influence driving behavior (Fitzsimmons et al. 2007) Improve Signal Visibility The positioning of signals either overhead or pole-mounted impacts driving behavior. An overhead signal display provides a clear meaning, good visibility, and eliminates the blockage of drivers line-of-sight to the signal head when tall vehicles such as trucks are present in the traffic stream. Schattler et al. (2011) investigated how different signal mounting configurations affect RLR at urban signalized intersections in Illinois and Michigan. The researchers focused on three types of signal mounting configurations: mast arm, diagonal span wire, and near-side/far-side post mount. They collected data at 12 study intersections looking for red light runners and yellow light runners (YLR) using video cameras. Data collections were for three hours (noon to 3 p.m.) on weekdays in the spring and summer of A comparative parallel analysis of their data showed significantly fewer RLR and YLR at the intersections with mast arm configurations than at intersections with span wire configurations. At the near-side/far-side post mounted signalized intersections, the authors found a higher rate of RLR and YLR. Their study showed that post- 15

28 mounted configurations reduced the visibility of signal heads, which may result in an increase in the frequency of RLR. When considering the location to mount a signal at an intersection, a driver s line of sight is a critical factor that should not be overlooked. The closer the signal heads are installed to a driver s line of sight, the more visible the signal heads become Improve Signal Conspicuity Another technique for making signal heads conspicuous is to use retroreflective materials on the borders of backplates as shown in figure 2.1. Figure 2.1 Retroreflective backplate border (FDOT, 2014) The MUTCD (Section 4D.18) requires the front surface of the backplate to have a dull black finish to minimize light reflection and to increase contrast between the signal indication and its background. Research has shown that signal head backplates have the effect of reducing the frequency of crashes at intersections by 32 percent (Bonneson et al. 2002). In 2010, the FHWA reported a before-after study at three intersections in Columbia, South Carolina on the effectiveness of retroreflective borders on the backplates. The study found a 28.6 percent 16

29 reduction in total crashes, a 36.7 percent reduction in injury crashes, and a 49.6 percent in late-night/early-morning crashes (FHWA 2010). For intersections where visibility is a problem, using redundant signal heads is a means of improving the conspicuity of the signals. The MUTCD (2009) illustrates various configurations of redundant signal heads that have shown to be effective at signalized intersections. Figure 2.2 illustrates different configurations of two red signal heads from the MUTCD. A study in Winston-Salem, North Carolina found a 33.1 percent significant reduction in RLR right-angle crashes when nine study intersections were equipped with redundant signal heads (Polanis 2002). Figure 2.2 Redundant red light signal configurations (MUTCD 2009) Lighted Stop Bar Systems (LSBS) and Light Emitting Diode (LED) outlined backplates have shown to be effective in reducing RLR at signalized intersections. LSBS consists of markers installed into the pavement along the stop line of an intersection. The markers contain LED lights which activates during the red signal indication of the traffic light. LED outlined backplate also consists of LEDs placed around the perimeter of a signal backplate. The LEDs emit light during the red signal indication of the traffic light to gain the attention of drivers 17
 in Houston, Texas (Tydlacka et al.")
 conducted a study at two signalized intersections in Houston, Texas to evaluate the effectiveness of these")
30 approaching the intersection. Active operation of the LSBS and LED outlined backplates are shown in figure 2.3 and figure 2.4, respectively. Figure 2.3 Lighted stop bar system (active) in Houston, Texas (Tydlacka et al. 2011) Figure 2.4 LED backplate (active) in Houston, Texas (Tydlacka et al. 2011) Tydlacka et al. (2011) conducted a study at two signalized intersections in Houston, Texas to evaluate the effectiveness of these supplemental traffic control devices. They collected 18

31 data using video cameras three days before and three days after the installation of the LED backplates and LSBS separately at the two study intersections. They found a statistically significant reduction of RLR violations from 21.8 to 11.2 violations per day per 10,000 vehicles at the site where the LED blackplates were installed. At the intersection with LSBS, they found a reduction in RLR violations from 12.9 to 11.3 violations per day per 10,000 vehicles. That was found to be not statistically significant Advance Warning Signs Advance warning signs gain the attention of road users to unexpected roadway conditions that might be not readily apparent to them. According to the MUTCD (2009), the Signal Ahead sign (W3-3) shown in figure 2.5 can be used to alert derivers of the presence of a signalized intersection ahead. Figure 2.5 Signal ahead sign, W3-3 (MUTCD 2009) Polanis (2002) analyzed a before-after crash data (36 to 48 months) from collision diagrams prepared by police department in the city of Winston Salem, North Carolina to evaluate the effectiveness of eight engineering countermeasures to reduce RLR. A before-after 19

 shown in figure 2.")
32 study of Signal Ahead signs was one of the strategies evaluated. It was found that installation of the Signal Ahead sign at 11 study locations showed a 44 percent reduction in right angle crashes. Another type of advance warning sign is the Be Prepared To Stop sign (W3-4) as shown in figure 2.6. Flashing beacons and When flashing plaques (W16-13P) shown in figure 2.7 can be added to this sign to alert drivers that the green light is about to change to red in a few seconds (MUTCD 2009). Figure 2.6 Be Prepared To Stop sign, W3-4 (MUTCD 2009) Figure 2.7 Be Prepared To Stop sign supplemented with flashing beacons and when flashing plaque (MUTCD 2009) 20
33 Messer et al. (2004) performed a two year study to evaluate how the Advance Warning for End-of-Green Systems (AWEGS), could reduce RLR violations at two high speed intersections in Texas. Red light runners were detected at their study sites by using video imaging vehicle detection systems (VIVDS). Prior to the installation of the systems, they collected data for two weeks. After installation of AWEGS, they collected data for 35 days for the first phase of their study followed by the second phase where data were collected for 21 days. Results of their field evaluations showed that AWEGS reduced RLR violations within five seconds of the onset of the red light indication by 40 to 45 percent. Figure 2.8 shows the design features and layout of the AWEGS. 21

34 Figure 2.8 Design features and layout of AWEGS (Messer et al. 2004) Physical Improvements At low-volume intersections where traffic signals are unwarranted, removing the signals can be an effective measure to reducing crashes at such locations provided the safety and the operational characteristics of the intersections are not compromised. Before traffic signals are installed at any intersection, warrant studies should be conducted based on pedestrian volumes, 22
35 traffic volumes, and safety measures at the intersection. A study in Philadelphia showed that the removal of unwanted signals at 199 low-volume intersections contributed to a crash reduction of 24 percent at those intersections (Retting et al. 1998). Additional traffic lanes for maneuvering through or making right or left turns at signalized intersections is an effective measure of reducing congestion. Most traffic delays occur at intersections and when drivers stay in queues for longer periods, they might run red lights to avoid waiting for the next cycle. When additional lanes are added to intersections to increase their capacity, the problem of congestion will be reduced. A modern roundabout is another alternative to reduce the severity of crash such as right-angles that are common at signalized intersections. Converting a signalized intersection into a roundabout has shown to increase safety. In NCHRP Report 572-Roundabouts in the United States, Rodegerdts et al. (2007) found a 48 percent reduction in all crash types and a 77.7 percent reduction in injury and fatal crashes when nine signalized intersections were converted to a roundabout. Persaud et al. (2001) performed a study to evaluate the change in vehicle crashes when 23 signalized or stop-controlled intersections were converted to roundabouts at urban, suburban, and rural locations in the United States. They performed a before-after Empirical Bayes analysis of the data they gathered. Results of their study showed a 40 percent reduction of all crash types and an 80 percent reduction of all injury crashes at the 23 intersections combined. 2.7 Enforcement Countermeasures Enforcement countermeasures are those that include the use of a police officer, or a device which acts as a surrogate to a police officer. Several studies have been conducted to 23
36 investigate the effectiveness of these three countermeasures or a combination of the countermeasures in reducing RLR at signalized intersections Automated Enforcement Automated enforcement is a highly effective way of using cameras to enforce RLR at signalized intersections. As of May 2014, 503 communities in the United States had red light camera programs (IIHS 2014). Several studies have shown that using automated enforcement is an effective tool in reducing RLR violations and associated crashes at signalized intersections. Fitzsimmons et al. (2007) found 44 percent, 90 percent, and 40 percent reductions in total, right-angle, and rear-end crashes, respectively, in a study they conducted in Council Bluffs, Iowa. Similarly, a study conducted in North Carolina at red light camera equipped intersections showed a 17 percent reduction in total crashes, a 22 percent reduction in RLR related crashes, a 42 percent reduction in angle crashes, and a 25 percent reduction in rear-end crashes (Cunningham and Hummer 2004). Studies in Oxnard, California and Fairfax, Virginia found red light cameras reduced RLR violations by approximately 40 percent (Retting et al. 1999a; Retting et al. 1999b) Targeted Enforcement Targeted enforcement is designed to target an identified signalized intersection or corridor where RLR has recently become a problem, or has been identified as a problem through a crash and/or violation study. Law enforcement agencies will increase the number of officers at a particular location and enforce red light running. The goal of targeted enforcement is to make the public more aware of red light running through an increase in ticketed violations or the presence of law enforcement at the intersection. 24
.")
37 2.7.3 Confirmation Lights Confirmation lights are a relatively small, low-cost light mounted on the top or the bottom of a traffic signal head or mast arm. This light is sometimes referred to as Red-Signal Enforcement Lights or Red Indication Lights or Rat Boxes or Tattletale Lights (Hsu et al. 2009). The confirmation light activates simultaneously during the red signal phase to aid a police officer located downstream of the intersection in observing a RLR violation. After the confirmation light turns on, it is visible 360 degrees from any intersection approach. The confirmation light is wired directly into the red signal aspect and only activates when red light is indicated as shown in figure 2.9. Figure 2.9 Confirmation light wired directly into red aspect of signal This system eliminates the need for a team of officers to monitor red light violators at a single intersection, thereby cutting down the police staff to effectively enforce RLR at an intersection. Additionally, the low cost of confirmation lights (approximately $50 to $150 in 25
38 2014 dollars) potentially allows more installation at other problematic intersections, hence, increasing enforcement resources efficiently (Hsu et al. 2009). Reddy et al. (2008) investigated white enforcement lights at 17 intersections on the state highway system in Hillsborough County, Florida. The researchers evaluated effectiveness by a violation and crash analysis. Five months prior to installation, violation data were collected at 24 intersections on weekdays during morning and evening peak hours. A similar study was conducted in the three months after installation at the 17 intersections in which the lights were installed. Considering all intersections, a total of 759 violations were recorded in the before period while 567 violations were recorded in the after period. It was noted that some intersections saw an increase in violations. A matched-pair t-test was performed and it was determined the reduction in violations were statistically significant. The authors upon further analysis found that the reduction in violations during the morning peak hour were not statistically significant while the evening violations were at the 95 percent level of confidence. Crash data were obtained from the Florida Department of Transportation for a period of six years ( ). Data from were considered the before period in which 828 crashes per year occurred at the study intersections of which 56 crashes per year were due to RLR. Data from January 2004 to December 2004 were considered the after period with 2003 being considered the installation period. An average of 860 crashes per year at the study intersections was recorded with 52 crashes per year due to RLR. The authors further broke down the crash analysis and investigated approaches with white enforcement lights and found crashes were reduced from approximately 40 crashes per year to 28 crashes per year. The Minnesota Local Technical Assistance Program (2009) summarized a completed study conducted by the University of Minnesota and City of Burnsville, Minnesota in which blue 26
39 confirmation lights were installed at two signalized intersections on County Roads 5 and 11. An investigation assisted by the University of Minnesota saw the daily violation rate reduced by 41 percent. Research also found that violations increased in heavy traffic and most violations occurred during peak hours. Although confirmation lights have been largely deployed throughout the United States including communities in Florida, Texas, Minnesota, Kentucky and California, limited research studies have been published to determine the effectiveness of the countermeasure in reducing RLR violations or crashes. 2.8 Public Education Reaching out and educating the public is an effective way to communicate the seriousness of a driver running red light at a signalized intersection. Public education could include media campaigns, grants for targeted enforcement, commercials, further instruction during drivers education classes, and/or television newscast segments on high crash intersection locations. 2.9 Literature Review Summary As reported in the literature search, RLR continues to be a serious safety concern and many communities and researchers have investigated countermeasures ranging from low-cost signal timing adjustments to expensive intersection geometric improvements or automated enforcement. To fully address RLR, it takes all aspects of the three Es (Engineering, Enforcement, and Education). As stated previously, this research project is intended to investigate a low-cost countermeasure to aid police officers and make the public aware of RLR at designated intersections in Kansas. This research will provide additional information into the effectiveness of the confirmation light system. 27
40 Chapter 3 Problem Statement RLR continues to be a serious safety concern for many communities across the United States. Traditionally, when signalized intersections have been identified as a location with a high number of RLR violations, traditional targeted enforcement is used to reduce the number of violations. In the case of targeted enforcement, multiple police officers are needed to verify a vehicle has run a red light to correctly ticket the driver. Many times, this requires at least one officer watching the signal and stop line while another is waiting downstream of the targeted approach and/or movement. In some instances, an officer observing a RLR violation will chase an offending driver through the intersection, thus exposing him or her to crossing vehicular traffic. Also stated in the literature search, many communities have turned to automated enforcement to monitor and ticket red light runners at signalized intersections. Automated enforcement, although found by many research studies to be effective at reducing RLR violations and related crashes, have become a target of driver privacy. The State of Kansas currently has legislation that prohibits the use of automated enforcement (State of Kansas, 2013 Statute, , subsection (a)(6)), unless deemed essential for safety by a community and all other options have been exhausted. However, automated enforcement can be found in the neighboring state of Missouri. The objective of this study was to investigate the effectiveness of a low-cost signalized intersection treatment to reduce RLR at signalized intersections. The research team selected confirmation lights as a way to aid police officers in more easily observing red light running violations when positioned downstream from the intersection. Confirmation lights have been deployed in many communities across the United States. However, limited effectiveness data has 28
41 been published that can support the effectiveness of this device. The research team also selected to test the effectiveness of this device at two busy signalized intersections in Lawrence, Kansas. Effectiveness of the confirmation lights were determined by a before-after violation study. The changes in violations were used as a safety surrogate for the potential changes in crashes. A secondary performance measure that was used included the change of violation time into red, which is an indicator of how long after the red signal a vehicle violated the red light. 29
42 Chapter 4 Research Approach The research study was conducted in Lawrence, Kansas. The City of Lawrence has a population of over 87,000 residents and is the location of the University of Kansas. Kansas Highway 10 (K-10) runs east-west and connects the City to the Kansas City Metropolitan area. Iowa Street (US 59) runs north-south and connects traffic to Interstate 70 (I-70) in the north of the City. Prior to meeting with city officials, the research team specifically required that the study intersections be located within city limits, were similar in operation, and had no current or planned construction at the intersection during the study period. Since the project was limited to a 12 month study, the research team decided on a violation study in place of a crash study which would require multiple years of before and after crash data. 4.1 Measure of Safety Typical countermeasure effectiveness studies rely on three to six years of before and after crash data (Tarko et al. 2009). However, crash data may be limited due to small sample size and lack of details to explain the mechanisms of crash failures and driver crash avoidance behaviors (Tarko et al. 2009). To measure the safety effect of a treatment, a significant number of crashes need to have been recorded before an action is taken. In situations where a recent countermeasure is implemented, such as was the case in this study, it is difficult to measure the safety effect of that countermeasure if crash data from the period prior to and after installation are limited. Because of these issues, other observable non crash traffic events and surrogate data instead of crash data can be used in road safety analysis. In this research study, before-after violation data were used as a surrogate measure to evaluate the effectiveness of the confirmation light system since crash data were limited. 30
43 4.2 Site Selection Prior to meeting with city officials, the research team identified 22 possible intersections for confirmation light installation. A set of variables identified by the research team were investigated at each of the intersections including: approach geometry (e.g. number of lanes, pavement markings, taper, and right turning lane), posted speed limited between 30 and 50 mph, protected and/or protected/permitted left turning lanes, a safe location where a police car could be positioned near the intersection approaches, and moderate to high peak hour volumes. The 22 intersections and their set of variables are shown in Appendix A. The 22 intersections were reduced to 13 candidate sites. This was accomplished by eliminating intersections which did not meet the set of variables that the research team used as criteria. To verify similarities in traffic volumes at specific intersections where the research team judged to have the most promise for treatment, nine intersections peak hour traffic counts were collected during the morning and evening peak hours on either a Tuesday, Wednesday, or Thursday between August and September of After manual traffic counts were recorded, the research team met with City of Lawrence officials including the city traffic engineer, traffic signal technician, and the police Lieutenant in charge of traffic enforcement. The research team along with city officials agreed on the two treatment sites where the confirmation lights would be installed and also other intersections to be studied to investigate possible spillover effects of the treatment, and global changes using control intersections located in different areas of the city. Section 4.2 explains the various intersections used for the study. A total of two treatment sites, six spillover sites, and five control sites were used. 31
44 4.3 Site Category Treatment Sites As stated previously, two signalized intersections in Lawrence were determined to be optimal locations for the confirmation lights to be installed. These included: 23 rd Street and Iowa Street; and 23 rd Street and Louisiana Street. Both of these intersections are located on K-10 which passes through Lawrence. The intersection of 23 rd Street and Iowa Street is the highest volume intersection in the city with also the most crashes. Detailed information on each intersection can be found in the following sections. At the request of the Lawrence Police Department, the research team equipped both of these intersections protected left turning movement only approaches with confirmation lights due to the highest number of red light violations for these movements. Additionally, the intersection of 23 rd Street and Iowa Street has a high percentage of heavy vehicles. Heavy vehicles predominantly travel through this intersection by making a left turn from southbound on Iowa Street to eastbound on 23 rd Street as a way to access the southern Kansas City Metropolitan area Spillover Sites Spillover sites are signalized intersections located directly adjacent to the two treatment intersections in Lawrence. These included the following locations: 19 th Street and Iowa Street; 19 th Street and Louisiana Street; 23 rd Street and Ousdahl Road; 23 rd Street and Alabama Street; 32

45 25 th Street and Iowa Street; and Clinton Parkway and Crestline Drive. Previous research relating to automated enforcement has indicated that if an intersection is treated with an enforcement device (e.g. automated red light running camera), similar effects can occur at nearby intersections (Retting and Kyrychenko 2002; McGee and Eccles 2003) thus terming the phrase spillover effect or halo effect. It was a goal of the research team that if a reduction in red light violations occurred at the treatment intersections, a reduction would also be found at these six intersections as well. A map indicating where the treatment and spillover intersections are located is in shown in figure 4.1. Figure 4.1 Layout of treatment and spillover intersections in Lawrence, KS (Google maps 2013) 33
46 4.3.3 Control Sites The five control sites selected for the study were located outside of the study corridor but still in the City of Lawrence and were the following intersections: 6 th Street and Kasold Drive; 6 th Street and Michigan Street; 6 th Street and Wakarusa Drive; 31 st Street and Iowa Street; and Clinton Parkway and Kasold Drive. The purpose of the control sites were to determine if any global changes were happening in Lawrence in terms of red light running. For example, if the research team saw a reduction in red light running violations at both the control and treatment sites, other factors may be contributing to the reduction in red light running that may or may not be quantifiable (e.g. public awareness campaign or targeted enforcement). The research team expected that a reduction in violations at the treatment site and a constant or increase in the number of violations at the control site would also be an indicator of treatment effectiveness. Figure 4.2 shows the location of the treatment sites as well as the control sites. 34

47 Figure 4.2 Layout of the control and treatment sites in Lawrence, KS (Google maps 2013). 4.4 Site Description As stated in the previous section, the research team utilized thirteen intersections for this study. This section provides additional information for each intersection. Each intersection has a table that provides posted speed limit, lane configuration (e.g. L = left, T = through, R = right, and shr = shared right turning lane/through lane), number of lanes, and peak hour volumes. The morning and evening peak hours determined by the research team were 7 a.m. to 9 a.m. and 4 p.m. to 6 p.m. on either a Tuesday, Wednesday, or Thursday. 35

48 4.4.1 Treatment Sites rd Street & Iowa Street Iowa Street (US-59) and 23 rd Street (K-10) is located west of downtown Lawrence and south of the University of Kansas. Table 4.1 provides operational information, and the research team noted that this signal operates as a split phase signal timing due to geometric constraints for the southbound and northbound turning movement traffic. As shown in table 4.1, right turning movements were not considered for the northbound, southbound, and westbound movements as they were free right turns as shown in figure 4.3. Table 3.1 Characteristics of the intersection of 23 rd Street and Iowa Street A Free right movements not included in this study 36

49 Figure 3 Aerial view of 23 rd Street and Iowa Street (Google maps 2013) Figure 4.4 is a ground view of the intersection looking northbound. As shown, the right turning movement is a free right with a median island. The northbound and southbound left turning movements are dual turning lanes and a single protected left turn signal provides guidance to the vehicles. The two through lanes have a single signal for each lane. A significant number of pedestrians utilize this intersection due to a large apartment complex located south of the intersection. Adjacent to the intersection are commercial developments on three of the four quadrants. 37

50 Figure 4. Ground view of the intersection of 23 rd Street and Iowa Street (northbound) rd Street & Louisiana Street Similar to 23 rd Street and Iowa Street, the second treatment site 23 rd Street and Louisiana Street is located on the same east-west corridor. This intersection mainly handles east-west traffic as shown in table 4.2 by the east and westbound peak hour through movements. During peak hours, a large portion of this traffic consists of commuter traffic to or from the Kansas City Metropolitan area. 38


51 Table 4.2 Characteristics of the intersection of 23 rd Street and Louisiana Street Figure 4.5 shows an aerial view of the intersection and it should be noted that on the north and eastbound approaches the gas station driveways are close to the intersection. Commercial development, including a grocery store and strip mall, are located on two of the intersection quadrants. Figure 5 Aerial view of the intersection of 23 rd Street and Louisiana Street (Google maps 2013) 39

52 A ground view of the intersection looking eastbound is shown in figure 4.6. As stated previously, the gas station driveways are located close to the intersection. Additionally, north and southbound approaches to the intersection operate on a protected and permitted signal. The city had elected to install a single five head dog house signal on both approaches. The research team noted this and it is further explained in the following sections as to how this applied to the study. Figure 6 Ground view of the intersection of 23 rd Street and Louisiana Street (eastbound) 40
53 4.4.2 Spillover Sites th Street & Louisiana Street The intersection of 19 th Street and Louisiana Street is located directly north of the intersection of 23 rd Street and Louisiana Street. This intersection is one of two spillover intersections for this treatment intersection. This intersection is located between the 23 rd Street corridor and the University of Kansas and is adjacent to Lawrence High School. This intersection also handles a significant amount of traffic each day as shown by the eastbound and westbound approaches in table 4.3. Table 4.3 Characteristics of the intersection of 23 rd Street and Louisiana Street As shown by the aerial image in figure 4.7, the intersection is located in a residential area with Lawrence High School located in the southwest Quadrant. A city park is located on the northeast quadrant and single family homes and business driveways are located near the intersection in the other two quadrants. 41

54 Figure 7 Aerial view of the intersection of 19 th Street and Louisiana Street (Google maps 2013) Shown in figure 4.8 is a ground view of the intersection looking eastbound. As shown, left turns for all approaches are protected/permitted using a four signal head unit that is vertical. Additionally, right turns for all approaches are controlled by a permitted/protected signal as well. Through movements are controlled by a single signal over the lane for all approaches. 42

55 Figure 8 Ground view of the intersection of 19 th Street and Louisiana Street (eastbound) rd Street & Alabama Street Moving down the corridor west to east, the intersection of 23 rd Street and Alabama Street is the first spillover intersection located near the intersection of 23 rd Street & Louisiana Street. As shown in table 4.4, this intersection handles a similar amount of east and westbound commuter traffic. The northbound and southbound approaches are considered minor roadways. 43

56 Table 4.4 Characteristics of the intersection of 23 rd Street and Alabama Street As shown in figure 4.9, this intersection has car dealerships on two of the quadrants and a fast food restaurant on the northeast quadrant. Each eastbound and westbound left turning lane is an extension on the two-way-left-turning-lane (TWLTL). Figure 4.9 Aerial view of the intersection of 23 rd Street and Alabama Street (Google maps, 2013) 44

57 Figure 4.10 is a ground view of the intersection looking westbound. As shown, the eastbound and westbound left turning movement signal is the same dog house configuration with five signal heads, one on top and two on each side. The northbound and southbound movement is controlled by a single signal head. Also shown in this figure is an excellent view of the 23 rd Street corridor, note the continued TWLTL. Finally, this intersection flashes yellow in the east and westbound directions after 11 p.m. Figure Ground view of the intersection of 23 rd Street and Alabama Street (westbound) rd Street and Ousdahl Road The intersection of 23 rd Street and Ousdahl Road is the east spillover intersection for the treatment intersection of 23 rd Street and Iowa Street. Similar to the previously mentioned 45
58 spillover intersection, this signalized intersection also handles a significant number of eastbound and westbound traffic along 23 rd Street. The northbound and southbound approaches are minor roads and have shared lanes as shown in table 4.5. Table 4.5 Characteristics of the intersection of 23 rd Street and Ousdahl Road As shown in figure 4.11, near the intersection are multiple restaurants and on the south-west side of the intersection is the large parking lot of a Hobby Lobby. A residential area including single family homes and apartment complexes are both north and south of the intersection. 46

59 Figure 10 Aerial view of the intersection of 23 rd Street and Ousdahl Road (Google maps 2013) Shown in figure 4.12 is a ground view of the intersection looking east. Similar to the previously mentioned spillover intersections, eastbound and westbound approach left turns are controlled by protected/permitted dog house signals. Northbound and southbound turning movements are controlled by a single signal head. Also shown in figure 4.12 is a pedestrian crossing sign, since an elementary school is located north of the intersection and there are children crossing the intersection during the a.m. peak hour times. 47

60 Figure 4.12 Ground view of the intersection of 23 rd Street and Ousdahl Road (eastbound) Clinton Parkway & Crestline Drive The intersection of Clinton Parkway (23 rd Street) and Crestline Drive is the spillover intersection located directly west of the 23 rd Street and Iowa Street intersection. Similar to the previously mentioned spillover intersections, this signalized intersection also handles a significant amount of eastbound and westbound traffic. However, this intersection is the entrance to the University of Kansas commuter parking lot. This is reflected in the morning northbound left and right, and evening left and right movements as shown in table


61 Table 4.6 Characteristics of the intersection of Clinton Parkway and Crestline Drive Figure 4.13 shows an aerial view of the intersection with the entrance to the University of Kansas commuter parking lot on the north side. The eastbound and westbound approaches have a raised center median and a separate right turning lane for all approaches. Figure 11 Aerial view of the intersection of Clinton Parkway and Crestline Drive (Google maps 2013) 49

62 Figure 4.14 is a ground view of the intersection looking westbound. As shown, all of the approaches left turning movements are permitted/protected by dog house signal configurations. Additionally, a permitted right turn signal is present to help control right turning movement for the northbound and westbound approaches. Figure Ground view of the intersection of Clinton Parkway and Crestline Drive (westbound) th Street & Iowa Street The intersection of 19 th Street and Iowa Street is located directly north of the intersection of 23 rd Street and Iowa Street. As shown in table 4.7, this intersection handles a lot of north and southbound traffic. This traffic is made up of commuters to the University of Kansas campus and 50

63 also traffic that has exited I-70 in north Lawrence and are wanting to turn left at the intersection of 23 rd Street and Iowa Street to take K-10 to the south Kansas City Metropolitan area. Table 4.7 Characteristics of the intersection of 19 th Street and Iowa Street Figure 4.15 is an aerial view of the intersection. The University of Kansas campus is located on three of the four quadrants with an apartment complex and fire station located on the southeast quadrant. The northbound and southbound left turning lanes are offset with a painted median. The intersection is on a grade with the crest of the hill located north of the intersection. 51

64 Figure 12 Aerial view of the intersection of 19 th Street and Iowa Street (Google maps 2013) Shown in figure 4.16 is the intersection during the evening peak hour looking northbound. This figure also gives an excellent view of the uphill grade. There is a signal over each of the four through movement approaches and a single protected signal for the northbound and southbound left turning movements. Eastbound and westbound (minor streets) left turning movements are controlled by a protected/permitted signal. 52
65 Figure Ground view of the intersection of 19 th Street and Iowa Street (northbound) th Street & Iowa Street The intersection of 25 th Street and Iowa Street is located directly south of the intersection of 23 rd Street and Iowa Street. As shown in table 4.8, most of the traffic during the peak hours is north and southbound with the minor streets being eastbound and westbound. 53


66 Table 4.8 Characteristics of the intersection of 25 th Street and Iowa Street This intersection as shown in figure 4.17 is surrounded by commercial developments including restaurants and gas stations. The north and southbound left turning lane is offset with a painted median. Figure 14 Aerial view of the intersection of 25 th Street and Iowa Street (Google maps 2013) 54
67 Figure 4.18 shows a ground view of the intersection facing northbound. As shown, vehicles traveling northbound are cresting a vertical curve before they approach the intersection of 23 rd Street and Iowa Street. There is a single signal for each north and southbound through movement and a single signal for all movements east and westbound. The north and southbound left turning movements are permitted/protected and, similar to other spillover intersections, are a dog house signal configuration. Figure 15 Ground view of the intersection of 25 th Street & Iowa Street (northbound) 55
 as 6 th Street is one route commuters take to and from Topeka, Kansas. Table 4.")
68 4.4.3 Control Sites th Street & Kasold Drive The intersection of 6 th Street (US-40) and Kasold Drive is a large signalized intersection in northwest Lawrence. The intersection is fully actuated and handles a significant amount of east-west traffic (shown in table 4.9) as 6 th Street is one route commuters take to and from Topeka, Kansas. Table 4.9 Characteristics of the intersection of 6 th Street and Kasold Drive Figure 4.19 is an aerial view of the intersection. As shown, the eastbound and westbound approaches have two protected left turning lanes and the northbound and southbound approaches have one left turning lane that is permitted/protected. Surrounding the intersection is a gas station (northwest quadrant) and Walgreens (southeast quadrant), where driveway access is close to the intersection. Additionally, a strip mall and bank are in the other two quadrants of the intersection. 56
 A ground view of the intersection facing eastbound is shown in figure 4.20. As shown, a raised six inch median stretches along the length of the east and westbound left turning lanes.")
69 Figure 16 Aerial view of the intersection of 6 th Street and Kasold Drive (Google maps 2013) A ground view of the intersection facing eastbound is shown in figure As shown, a raised six inch median stretches along the length of the east and westbound left turning lanes. Additionally, the eastbound approach has a right turning lane that also serves as a bus stop. 57
 and Wakarusa Drive.")
70 Figure 17 Ground view of the intersection of 6 th Street and Kasold Drive (eastbound) th Street & Wakarusa Drive Continuing west on 6 th Street and also located in the northwest part of Lawrence is the intersection of 6 th Street (US-40) and Wakarusa Drive. This intersection also handles significant east-west commuter traffic as well as south and northbound high school and residential traffic. The operational data collected in the field is shown in table

71 Table 4.10 Characteristics of the intersection of 6 th Street and Wakarusa Drive An aerial view of the intersection is shown in Figure As shown, all approaches have two protected left turning lanes. All approaches besides the northbound approach have permitted right turning lanes. Figure 18 Aerial view of the intersection of 6 th Street and Wakatrusa Drive (Google maps 2013) 59

72 Figure 4.22 shows a ground view of the intersection facing eastbound. As shown, each approach has a raised median with the traffic signal pole and mast arm located in the center of the intersection. Also note that there are two protected left turning signals with one of the signals directly over the lane and one lower at the center of the pole. The intersection is surrounded by commercial development with driveway access far from where the intersection queue would occur. Figure 19 Ground view of the intersection of 6 th Street and Wakarusa Drive (eastbound) th Street and Michigan Street. The intersection of 6 th Street (US-40) and Michigan Street is close to downtown Lawrence. The intersection serves a considerable amount of east-west traffic similar to the other 60

73 two control intersections along 6 th Street. Additionally, the intersection serves the Lawrence hospital and residential areas in north Lawrence. This intersection flashes yellow after 11 p.m. similar to other minor intersections in the city. Table 4.11 shows the characteristics of this intersection. Table 4.11 Characteristics of the intersection of 6 th Street and Michigan Street Figure 4.23 shows an aerial view of the intersection. As shown, the left turning lanes are part of a TWLTL through this part of 6 th Street. The westbound approach has a permitted right turning lane. The photo was taken in 2011 when a new overlay and pavement markings were installed. This intersection also has pedestrian traffic as this is one way for residents to travel from the north Lawrence housing developments to the University of Kansas. 61

74 Figure 20 Aerial view of the intersection of 6 th Street and Michigan Street (Google maps 2013) Figure 4.23 is a ground view of the intersection facing eastbound. As shown, all approaches have permitted signals for the through, right, and left turning movements. Surrounding the intersection are restaurants and small businesses. A business with driveway access very close to the intersection is a Dunkin Donuts, which is located in the intersection s northwest quadrant as shown in figure

75 Figure 21 Ground view of the intersection of 6 th Street and Michigan Street (eastbound) st Street & Iowa Street The intersection of 31st Street and Iowa Street is located at the south end of Lawrence. This intersection handles a considerable amount of north-south traffic of commuters traveling to Lawrence from the south and also traffic that has taken the K-10 bypass around west Lawrence. Table 4.12 shows the peak hour volumes for the intersection. East-west traffic is local traffic and those wishing to access large commercial developments surrounding the intersection. 63


76 Table 4.12 Characteristics of the intersection of 31 st Street and Iowa Street An aerial view of the intersection is shown in figure The intersection is fully actuated and has dual protected left turning lanes for all approaches and permitted right turning lanes for all approaches. The intersection is surrounded by banks and strip malls including a discount superstore. Figure 4.25 Aerial view of the intersection of 31 st Street and Iowa Street (Google maps 2013) 64

77 A ground view of the intersection is shown in figure 4.26 facing northbound. As shown, each lane has a signal head over it. Additionally, a raised median is located on all approaches. Driveway accesses to the adjacent properties are signal controlled and are not close to the intersection. Figure 4.26 Ground view of the intersection of 31 st Street and Iowa Street (northbound) Clinton Parkway & Kasold Drive The intersection of Clinton Parkway and Kasold Drive is a large signalized intersection located southwest of downtown Lawrence. This intersection handles a significant amount of commuter traffic traveling east and west in the south part of the city as shown in table

78 Table 4.13 Characteristics of the Intersection of Clinton Parkway and Kasold Drive An aerial image of the intersection shown in figure 4.27 shows three of the four approaches having raised medians with the northbound approaching having a painted median. Pedestrian traffic is mainly east-west with a public drinking fountain located on the sidewalk in the southeast quadrant. Surrounding the intersection are a strip mall with a grocery store, residential areas, and a medical complex. 66

79 Figure 4.27 Aerial view of the intersection of Clinton Parkway and Kasold Drive (Google maps 2013) A ground view of the intersection is shown in figure Eastbound and westbound left turning movements are protected while the southbound and northbound left turning movements are protected/permitted using the dog house type signal. The eastbound and westbound approaches also have a permitted right turning signal for the right turning movement. 67

80 Figure 4.28 Ground view of the intersection of Clinton Parkway and Kasold Drive (westbound) 4.5 Field Data Collection As stated previously, the research team conducted a before-after violation study to determine the effectiveness of the blue confirmation lights at two signalized intersections in Lawrence. The best way to collect violation data was by using video cameras. However, collecting and reducing video data was complicated and time consuming. The research team consulted with the City of Lawrence about using permanently installed pan/tilt/zoom cameras located at the all of the intersections. However, the field of view did not allow for sufficient data extraction. The field of view needed to collect and reduce the data is shown in figure

81 Figure 4.29 Camera view of an intersection approach The research team was interested in one field of view that could monitor a single approach. As stated in the previous section, almost all of the intersections under investigation had multiple lanes and sometimes a right turning lane. The field of view also needed to include the stop bar and traffic signals. As shown in figure 4.29, this field of view was for the eastbound approach at the intersection of 6th Street and Kasold Drive. The research team used commonly available equipment for the data collection effort. The high definition video cameras used to collect the data had a maximum battery life of 0.5 to 1 hour, thus needing either an extended battery pack or a deep cell battery and inverter to extend the record time of each camera as shown in figure

82 Figure 22 Equipment used for field data collection effort Another important aspect to the data collection methodology was setting up the video camera equipment at all four approaches of each intersection as shown in figure Each camera set-up was positioned as far from the traveled lanes as practicable to minimize the likelihood of drivers noticing it. Figure 4.32 shows one member of the research team setting up the equipment. Prior to video data collection at any intersection, the research team notified the City of Lawrence Police Department dispatch that research was being conducted. 70
83 Figure 4.31 Camera positions at intersection 71
 on either a Tuesday, Wednesday, or Thursday.")
84 Figure 4.32 A member of the research team setting up a camera to record RLR violations. A member of the research team would monitor the cameras at the intersection from a vehicle parked close by. Video data were collected on weekdays that were non-holidays or during a special event (e.g. basketball game) on either a Tuesday, Wednesday, or Thursday. Data were collected during the morning peak hour (7 a.m. to 9 a.m.) and evening peak hour (4 p.m. to 6 p.m.). A similar data collection methodology was used for the after study. The dates in which video data were collected, including the installation date, are as follows: Before study October 17 to November 29, 2012; Confirmation Light Installation July 1 to July 2, 2013; One month after study August 6 to August 22, 2013; and 72
85 Three month after study October 9 to November 5, As shown by these data collection dates, videotaping intersections twice on a single day took a considerable amount of staff time with limited equipment. Quality control in the field was imperative to obtain accurate results. 4.6 Data Reduction The research team collected a total of 760 hours of video data for the entire project which resulted in over 2 terabytes of high definition video. Intersection video data were reduced manually by student undergraduate research assistants. A methodology developed by the research team ensured accurate video data reduction, which resulted in a substantial archive of red light running and signalized intersection operational data. Students reduced the peak hour data at all previously listed intersections. The following guidelines were given to each student to reduce the video data: A vehicle that proceeded through (or crossed the stop bar), made a right turn, or made a left turn after the red signal was shown was considered a RLR violation. A vehicle that crossed the stop bar during the yellow interval, or was in the intersection when the signal showed yellow or red was not considered a RLR violation (e.g. permitted left turns). A vehicle that made a right turn on red without coming to a complete stop was considered a RLR violation. If a vehicle ran a red light, calculate the time into red and record. If a vehicle ran a red light, record by indicating the type of vehicle (e.g. passenger car (1), truck (2), bus (3) or recreational vehicle (4)). 73
86 While monitoring one approach at a time for red light running violations, the traffic counts for each lane were recorded. Violations were recorded based on the configurations shown in figure Table 4.14 explains the configurations indicated by codes (0 through 9) in figure Figure 4.33 RLR violation configurations Table 4.14 RLR Violation Configuration Description Code 0 Violation Description Three or more vehicles following closely (in platoon) violate red light together traveling side by side (double through lane) 1 A single vehicle violates red light when making a left turn 2 A single vehicle violates red light when it proceeds through intersection 3 A single vehicle violates red light when making a right turn 74
87 4 Two or more vehicles in platoon violate the red light when making left turn 5 Two or more vehicles in platoon violate the red light when they proceed through intersection 6 Two or more vehicles in platoon violate the red light when making right turn 7 Two vehicles violate red light together traveling side by side (double left turn) 8 Two vehicles violate red light together traveling sided be side (double through lane) 9 Three or more vehicles in platoon violate red light together traveling side by side (double left turn) the video data. Illustrated in figure 4.34 is the template that was distributed to the students that reduced Number of Type of Seconds Time of Day NB SB EB WB Vehicles Vehicle into Red (a.m./p.m.) :35 a.m :15 p.m :20 a.m :50 p.m Approach Morning or Evening Peak Volume Left turn Through Right turn Total Volume NB SB EB WB Figure 4.34 Sample of reduced data in Microsoft Excel sheet 75
88 The primary data of interest shown in figure 4.34 are the number of vehicles that ran the red light, the type of vehicle, the number of seconds into red, on which approach the violation occurred, the type of configuration, and the time of day the violation occurred. Additionally, the turning movement counts are shown for each approach. Detailed results for all the study intersections are shown in Appendix B. Once a student completed an intersection (including all four approaches), the sheet was given to one of the research team members to perform a quality check/assurance. At this point the research team member viewed the recorded incidents to ensure a RLR violation occurred and was recorded accurately. Once the data reduction effort was complete, the data were aggregated into one excel file for analysis. 4.7 Data Collection and Reduction Limitations Collecting field data can result in unknown and sometimes complicating situations. The research team had no control over these situations which complicated the data collection and reduction efforts: A RLR crash was observed at one of the treatment sites (23 rd Street and Iowa Street) during the 3 months after data collection during the morning peak hour. Prior to this crash, video data were only collected for an hour. Due to the intersection being shut down temporarily by the Lawrence Police Department, video data were recollected on a different week day. At the intersection of 6th Street and Kasold Drive, the video camera monitoring the eastbound approach was stolen. The data stored on the camera were lost, and data were collected at the intersection the following day. 76
89 After 45 minutes of data collection at the intersection of 23rd Street and Louisiana Street during the 3 month-period, a contractor entered the intersection to setup a temporary work zone, delaying the data collection effort for another weekday. During the data collection effort, Kansas weather brought rain, wind, sleet, and snow. The research team had to either shut data collection down early, or readjust the equipment (e.g. plastic bags or chain tie-downs). Since the research project utilized commonly available video recording and power source equipment, limitations on equipment reliability was an issue during some recording sessions. This included malfunctioning batteries, inverters, or cameras. Identified equipment failure was noted by the research team either in the field or during the data reduction process and data recollection occurred as quickly as possible. At many locations, pedestrian s passing by the camera setups began to tamper with the units. Upon seeing a member of the research team, they left the area. Camera equipment was checked in the field every time immediately after this occurred. 4.8 Installation of Confirmation Lights The research team elected to use Pelco confirmation lights, which range from $110-$140 depending on the mounting bracket. As shown in figure 4.1, the City of Lawrence specified to the research team that they wanted the light to be mounted by a cable Astro-Brac. Also shown in figure 4.1, excess cable and wire were zip-chord strapped to the mast arm and sign bracket. The Pelco confirmation light comes in multiple colors including blue, red, and clear. A standard Edison light bulb is used and the plastic dome is sealed by a rubber weather stripping. The 77
90 confirmation comes with a short three strand wire that included a ground wire. The Lawrence traffic signal technicians removed the provided wire and attached a standard two-wire. Since the traffic signal controller cabinet and signal heads were low-powered and LED, the city asked the research team to find the brightest low-powered light bulb as a conventional 65 watt incandescent bulb would trip the intersection battery backup system. The research team purchased three LED light bulbs from a local hardware store and decided on an 800 Lumens 9 Watt LED light bulb. On July 1, 2013, between 9 a.m. and 10 a.m., the confirmation lights were installed at 23 rd Street and Iowa intersection by the City of Lawrence Traffic Engineering Department. The Lawrence Police Department was interested in monitoring RLR violations on left turn approaches. At the request of the department, the lights were installed on all the left turn approaches which were protected. During the installation of the first light, the city signal technician touched the group wire in the traffic signal with the positive wire and shorted the entire electrical system and shut down the traffic signal cabinet. Unfortunately, during this time the entire intersection went dark for approximately 30 minutes without traffic control, creating a safety problem. The research team along with the City of Lawrence decided to close down installation until the signal technicians could evaluate the problem and develop a plan for the following morning to safely control traffic if the same occurrence happened. The confirmation lights were installed at both intersections (23 rd Street and Iowa Street & 23 rd Street and Louisiana Street) on July 2, 2013, between 9 a.m. and 10 a.m. At the intersection of 23 rd and Louisiana, the lights were installed only on the eastbound and westbound approaches. The northbound and southbound approaches had protected-permitted left turn signals that make 78


91 the confirmations lights work less than expected. The permitted phase for left turn movements will show both solid red and solid green indications and will activate the confirmation lights at the same time. In this instance, it will be confusing for a police officer located downstream of an intersection to tell whether a violation occurred during the permitted phase or after the red signal indication. In order to avoid such confusion, the confirmation lights were installed on protected left turn approaches only. No problems were encountered during the installation of the confirmation lights at this study site as was the case before. Figure 4.35 shows a field installation of the confirmation lights by the City of Lawrence at the Intersection of 23 rd Street and Iowa Street. Figure 4.35 Field installation of the confirmation light 79
92 4.9 Public Awareness of the Confirmation Lights Prior to installation and activation of the blue confirmation lights at both intersections, the City of Lawrence consulted with the city and country traffic judges as well as the city and county prosecutors to avoid confusion if the court system saw the words blue light on a citation. Additionally, the research team consulted with the University of Kansas and the City of Lawrence to jointly release a statement regarding the project. Copies of the press release can be found in the Appendix C. The coordinated press release was designed to inform drivers that a change was happening at two intersections and a different color was going to be present besides red, yellow, and green. The press release was also designed to show commitments to intersection safety by the research team and the City. Shown in figures 4.36 and 4.37 are the blue confirmations lights during the daytime and nighttime, respectively, at the intersection of 23 th Street and Louisiana Street. 80

93 Figure 23 Daytime operation at 23 rd Street and Louisiana Street 81

94 Figure 24 Nighttime operation at 23 rd Street and Louisiana Street Additionally, the research project was spotlighted by local television and newspaper media. A photo of the principal investigator answering questions by the local media is shown in figure

95 Figure 25 Project investigator meeting with the media at one of the treatment intersections It should be noted that the effectiveness of the public awareness campaign was not evaluated as part of this study. Additionally, the research team specifically asked the Lawrence Police Department to continue their regular duties monitoring red light running and to avoid targeted enforcement during the study period. 83
96 Chapter 5 Results This chapter presents the descriptive statistics of all the before and after RLR violation data collected at the 13 study intersections. Variables, including RLR violation rates by intersection lane, the time of the day when RLR violations occurred, the amount of time into red and thus the elapsed time after the onset of the red aspect of the signal to when a violation occurred, the vehicle types involved in RLR violations, and the RLR violations by configuration types, are presented in this chapter RLR Violation Rates by Intersection Lane Background The severity of RLR crashes depends on typical signalized intersection crash types such as right-angle, rear end, left turn and/or sideswipe. At signalized intersections, right angle crashes have more serious safety implications than other crash types. Since signalized intersection crash types largely depend on vehicle movements at a signalized intersection, the research team decided to analyze the violation rates by intersection lane in order to get a clearer perspective of how serious RLR violations are for each of the three movements: left turn, right turn, and through Methodology Data were reduced as described in chapter 4. RLR violations were expressed as rates (violations per 10,000 entering vehicles) by using equation 5.1. Rates were used in order to account for varying intersection volumes (exposure). The morning peak hour violations as well as the evening peak hour violations for each study sites were added together. Then, the violation rates were plotted against the site categories for all the study periods. The next section provides detailed results for the morning and evening peak hours violations. 84
97 Rate(TEV) = N i V i 10,000 Entering Vehicle (5.1) where Ni = total number of violations (N) observed during the study period i Vi = total number of entering vehicles (V) during the study period i Results Left Turn RLR Violation Rates Figure 5.1 shows the left turn RLR violation rates for the three types of study sites during the morning peak hours. As shown, the treatment site saw the highest violation rates during the before, one month and three months after installation of the confirmation lights. The treatment and spillover sites saw greater reductions in the violation rate one month after the installation than the control sites. Additionally, these sites saw further decreases in violation rates three months after the installation. At the control sites, violation rates decreased during the one month after study but remained the same as the before violation rate during the three months after study. Figure 5.1 Left turn RLR violations rates per study intersection for before-after study (Morning). 85
98 Figure 5.2 shows the left turn RLR violation rates for the evening peak hours. As previously discussed, the treatment sites again saw the highest violation rates as compared to the other two study sites. Overall, one month after the installation of the confirmation lights, the violation rates decreased considerably at the treatment and spillover sites but increased slightly at the control sites. The three months after study saw increases in the violation rates at the treatment and spillover sites but were still lower than the before rates. At the control sites, no significant changes in RLR violation rates were observed during all the study periods. Figure 5.2 Left turn RLR violations rates per study intersection for before-after study (Evening) Through Movement RLR Violation Rates Figure 5.3 shows the through movement RLR violation rates for the morning peak hours. As seen in the figure, the treatment sites recorded a significant reduction in RLR violation rates one month after the installation of the confirmation lights but saw a higher increase than the 86
99 before rate three months after installation. The research team observed that as drivers traveling through the intersection became familiar with the confirmation lights, knowing that they were installed to monitor violations for left turn only movements, the drivers reverted to their former driving behavior as time progressed. This explains why the higher increase in violation rates three months-after installation than the one month after period rates. The spillover and the control sites showed the same trends in the violation rates during the study periods. The violation rates at the spillover and control sites increased steadily with the study periods. Figure 5.3 Through movement RLR violation rates per study intersection for before-after study (Morning). The evening peak hour RLR violation rates for through movement is shown in figure 5.4. As shown, the treatment sites saw a similar trend in violation rates as previously observed in the morning. The one month after study at the treatment sites saw a great decrease in violation rates 87
100 but increased substantially during the three months after study. However, this increase was below the before violation rate. The spillover sites saw a decrease in violation rate during the one month after study, but the rates increased during the three months after study period. This increase was higher than the before violation rate. The control sites showed similar trend in violation rates as was previously seen in the morning. Figure 5.4 Through movement RLR violation rates per study intersection for before-after study (Evening) Right Turn Violation Rates It should be noted that the research team found inconsistencies in how the individual students reduced the video data for the right turning movements for the after periods. Some of the students found it difficult to determine whether a vehicle stopped or slowed down or rolled through the intersection when the vehicle made a right turn. Tasking one student to reduce the 88
101 after studies video data again for the right turn movements was not practical considering the time frame in which this study was to be completed. Though these discrepancies were keenly noticed, the research team still made the attempt to make do with the data. Results of the RLR violation rates for right turn movements during the morning peak are shown in figure 5.5. As shown, the treatment and control sites saw considerable reductions in violation rates from the before period to the one month after installation period. Overall, three months after installation of the confirmation lights both treatment and control sites saw increases in violation rates, yet they were still below the before rates. Violation rate at the spillover sites one month after installation increased marginally than the before period but the rates decreased substantially during the three months after study. Figure 5.5 Right turn RLR violation rate per study intersection for before-after study (Morning). 89
102 Figure 5.6 shows the right turn violation rates for the evening peak hours. The treatment and spillover sites saw increases in violation rates one month after the confirmation lights were installed. However, during the three months after study, the spillover sites saw a great decrease in violation rate while the treatment sites saw a great increase in violation rate. At the control sites, the one month after study saw higher reduction in violation rate than the three month after study. From figure 5.5, the inconsistencies in reducing the data are clearly shown at the spillover and the control sites. Figure 5.6 Right turn RLR violation rate per study intersection for before-after study (Evening) Violation by the Time of Day Background As previously discussed in the literature section, the frequency of red light running is significantly influenced by the time of day when a driver ran a red light. Studies have shown that 90
103 a majority of red light running occurs during the normal work hours (Kamyab et al. 2000; Retting et al. 1998). It is believed that during the morning and evening peak hours, drivers tend to run red lights due to lateness to and from work and also for being stuck in traffic for long hours (Porter et al. 2000). As part of this study, the research team was interested in investigating the distribution of the red light running violations by the time of day to determine if the findings were consistent with other studies Methodology Data were obtained from the violation study by the hour of the day when violation occurred. The research team collected RLR violation video data in the morning from 7:00 a.m. to 9:00 a.m. and in the evening from 4:00 p.m. to 6:00 p.m. with the expectancy that most of the violations would be observed at those time periods as previously reviewed from the literature. From the reduced data, the times when violations occurred were grouped into 15 minute intervals for both the morning and evening periods to determine when drivers run red lights. The total number of violations observed, including through movements and left and right turn movements for each study period, were converted to rates (violations per 10,000 vehicles) to account for vehicle exposure. The violation rates were plotted on the y-axis and the time of day (15 minute intervals) plotted on the x-axis. The results of the distribution of the violations are presented in the following section Results Morning Peak RLR Violation Figure 5.7 illustrates the distribution of RLR violation rates by 15 minute time intervals from 7 a.m. to 9 a.m. The overall trend shown in this figure is consistent with the expectation that most RLR occurs during day time hours when majority of drivers commute to work. The 91

104 highest violation rates for the one month and 3 months after studies occurred between 7:30 a.m. and 8 a.m., which accounted for approximately 30 percent of the total observed RLR violations in the morning peak hours. However, the highest violation rate for the before study period occurred between 8:45 a.m. and 9 a.m. As shown, one month and three months after the installation of the confirmation lights, the violation study saw decreases across all the study intersections. It can be speculated that the confirmation lights had a global effect in reducing red light running violations in the City. The violation rates during the one month after study were generally lower than the violations three months after installation at the treatment sites. Figure 5.7 Distribution of RLR violation by time of the day during the morning peak 92

105 Evening Peak RLR Violation The RLR violation trend for the evening peak hours is shown in figure 5.8. As shown, the violation rates were prevalent between 5:00 p.m. and 5:30 p.m. for all the study periods. RLR violation rates at this time period accounted for approximately 30 percent of the total observed violations as was previously discussed in figure 5.5. From the figure, the research team observed that RLR violations were lower one month and three months after the installation of the confirmation lights than the before violation study. Again, this indicates that the confirmation lights generally had a positive effect in reducing the violation rates. However, it should be noted that between 4 p.m. and 4:30 p.m., the research team observed an increase in violation rates during the three month after study which may be due to seasonal variations. Figure 5.8 Distribution of RLR violation by time of the day during the evening peak 93
106 5.3. Time into Red Analysis Background An important aspect to a vehicle running a red light is how long into the red did the violation occur. Violations found within the all-red time (generally one to two seconds) are most likely due to a driver caught in the intersection dilemma zone or at the end of a platoon and intentionally run the red light. The dilemma zone of an intersection is an area prior to the stop bar where the driver is unsure either to stop or proceed through the intersection during the yellow phase. However, drivers that enter the intersection past the all-red phase create a more dangerous situation, particularly if the conflicting movement has a green light. Hallmark et al (2012) stated that drivers that run a red light late into the red phase are more likely unintentional and involve a distraction, impairment, or fatigue. Hallmark et al. (2012) also found when evaluating RLR cameras in Cedar Rapids, IA that over 120 of violations occurred from 0 to less than 1 second into the red phase, while over 60 violations occurred 25 seconds into the red phase during a pre-ticket evaluation period of seven intersection approaches. Another research study has found that 95 percent of RLR violations occur in the first 2 minutes of the red phase (Beeber 2011). As explained in detail in the previous chapter, the research team investigated the effectiveness of the confirmation light system by determining if the change in RLR violations were statistically significant before and after the confirmation light installation. Effectiveness of the confirmation light system was also extended into investigating the change of the time into red for violations captured by the video data. 94
107 5.3.2 Methodology The time into red was evaluated similar to the previous chapter where the treatment intersections were compared to the spillover and control intersections for three study periods (before, one month after installation, and three months after installation). Additionally, two intersection movements were investigated including left turning (lights were for this movement at the treatment intersections) and the through movement. The average time into red for each movement were also determined at each treatment, spillover, and control site. Time into red was plotted where the x-axis was the number of violations and the y-axis was time into red (in seconds). Violations were aggregated in the y-axis for seconds with a maximum time plotted of greater than five seconds. It should be noted, as stated in the previous section, that the number of violations in each study period changed, so the total number of violations plotted in the following figures is not a consistent number for each study period Results Left Turning Movement Figures 5.9, 5.10, and 5.11 show the results of the RLR time into red for the left turning movement for all of the intersections studied. Figure 5.9 shows the left turning movement time into red for the two treatment intersections. 95
108 Figure 5.9 Left turning movement time into red at treatment intersections Figure 5.10 Left turning movement time into red at spillover intersections 96
109 Figure 5.11 Left turning movement time into red at control intersections As shown in figure 5.9, most of the violations occurred less than one second after the onset of the red light. The total number of violations happening was reduced after the confirmation lights were installed between periods. The research team found that no red light violations occurred after four seconds during the three study periods indicating that most of the RLR was occurring closer to the all-red phase, decreasing the chances of a crash with a conflicting movement. Figure 58 shows the left turning movement time into red at the spillover intersections adjacent to the two treatment intersections. As shown, the overall number of violations was less than the two treatment intersections and no violations occurred in the after periods between four and five seconds. However, the research team did find vehicle running a red light more than five seconds into the red before and after the confirmation lights were installed. This does pose a 97
110 safety concern as these drivers were entering the intersection while the conflicting traffic had a green light. Figure 5.11 shows the left turning movement time into red at the control intersections. Similar to the previous two figures, most of the RLR violations occurred less than one second after the red light shown. However, similar to the spillover intersections, it was found that RLR violations were occurring after five seconds into the red light before and after the confirmation lights were installed at the treatment intersections. This also poses a safety concern at these intersections as drivers were running the red light during the start of the green phase for conflicting traffic movements Through Movement Figures 5.12, 5.13, and 5.14 show the results of the time into red for the through movement violations at all of the intersections studied. Figure 5.12 shows the through movement violations time into red for the two treatment intersections. Figure 5.12 Through movement time into red at treatment intersections 98
111 Figure 5.13 Through movement time into red at spillover intersections Figure 5.14 Through movement time into red at control intersections 99
112 As shown in figure 5.12, most of the through movement violations occurred under a second into the red at the treatment intersections. Other violations were found to occur between one and three seconds into the red. The research team did find violations occurring after five seconds into the red three months after installation, meaning there were some unintentional violations during that period. Figure 5.13 shows the through movement RLR violations at the spillover intersections. Similar to the treatment intersections, most of the through movement violations occurred under one second into the red, and no violations were found after three seconds into the red, indicating that the violations were intentional. Similar to the treatment and spillover intersections, the control intersections saw many through movement violations occurring less than one second into the red phase, indicating that RLR violations were intentional. The research team recorded violations between one and three seconds into the red which was also common at the other two types of intersections. The research team found that no violations occurred after 5 seconds into the red at the control intersections during any period of the study as shown in figure Average Time into Red The average time elapsed (in seconds) after the onset of the red aspect of the signal when drivers entered the intersections are shown in table
113 Table 5.1 Average Time into Red (seconds) Site Category Movement Morning Peak Evening Peak Before 1 mo 3 mo Before 1mo 3 mo Left turn Treatment Through Right turn Left turn Spill Over Through Right turn Left turn Control Through Right turn As seen in table 5.1, the average times into red for the right turn movement were higher than left turn and through movements. The average times into red ranged from 1.0 second to 17.0 seconds for the left turn movements, 1.0 second to 3.0 seconds for the through movements, and 1.8 seconds to 34.2 seconds for right turns. The high range of time into red for right turn movement indicated that the majority of the drivers, as they approached the study intersections, disregard the signal long after the red light indication was shown. From the table, it can be seen that the times into red for each movement varied across study periods for each study intersection Violation Configurations and Vehicle Types Background As discussed in chapter 5, how far a vehicle enters an intersection after the onset of the red aspect of the red signal is vital to intersection safety. Findings from the time into red showed 101
114 that the majority of RLR violations occurred during or just after the all-red signal phase. The research team observed that drivers running red lights were either part of a platoon, or caught behind a tall vehicle making it difficult for a driver to see the red signal. As previously reviewed from the literature, little or no studies have been conducted to determine the pattern of RLR violations. The pattern of RLR was define by the research team as a single vehicle or multiple vehicles traveling in a platoon or side by side and violating the red aspect of the traffic signal together. Another primary factor that was of interest to the research team was the types of vehicles driven by the red light runners Methodology During the field video data reductions, students were also given guidelines to group the violations by the configuration types shown in figure 4.33 on page 74. The violation configurations coded 0 to 9 were explained to each student using table 4.14, on pages Additionally, students were asked to record the type of vehicle involved in the RLR violation. The types of vehicles included passenger cars, buses, trucks, and recreational vehicles Results Violation Configurations The results of the violation study for each study period is shown in table 5.2. The table shows the number of violations (in percentage) for each of the ten configuration types during the study periods. Morning and evening peak hour violations for all the 13 study intersections were combined. Then, for each configuration type, the percentage of RLR violations were calculated by dividing the number of violations that occurred in that configuration type by the total number of violations for that study period and multiplying the result by 100. For example, if 82 violations were recorded for the violation type coded 1 during the before study, and the total 102
115 number of violations observed was 420, then the percentage of the violations that occurred for configuration type 1 was expressed as (82/420)100, yielding 20 percent. It should be noted that the research team was just interested in finding the general pattern in RLR violations and therefore did not consider the configuration types by site category. Table 5.2 Violation Configuration Violation Violations in percentage Violation Violations in percentage Configuration Before 1 mo 3 Mo Configuration Before 1 mo 3 mo 20% 22% 18% 5% 3% 6% 14% 16% 29% 2% 0% 0% 58% 58% 43% 0% 0% 1% 103
116 1% 1% 0% 0% 0% 1% 0% 0% 2% 0% 0% 0% From table 5.2, it was found that a single vehicle making a right turn showed the highest percentage of RLR violations across all the study periods. This violation type accounted for 40 to 60 percent of all the violations observed during the three study period (before, one month after installation, and three months after installation).the high percent of right turn violations by a single vehicle met the expectation of the research team. As obvious as it was, the research team recognized that at locations where right turns on red were permitted, the majority of the drivers failed to stop and rolled through the intersection, thereby violating the red aspect of the signal. A single vehicle making a left turn showed the second highest percentage of RLR violations during the before and one month after study periods, followed by a single vehicle traversing through the intersection. However, during the three months after study, the through movement violations by a single vehicle showed a higher percentage in RLR violations than a single vehicle making a left turn. 104
117 As shown in table 5.2, violation configuration types 4, 5, 7, 8 and 9 saw less than three percent of the total violations observed for each before-after study period. This small percentage gives the evidence that drivers driving too closely to each other in a platoon or traveling side by side seldom violate the red aspect of the signal together. However, the violation configuration type 6 (a platoon of vehicles making a right turn) saw approximately three to six percent of the total observed violations for each study period. As was expected, no violations were recorded for violation configuration type Violation by Vehicle Type The percentages of RLR violations categorized by the type of vehicle driven by the violators are shown in table 5.3, where, over 98 percent of the RLR violations were committed by drivers of passenger cars during all the study periods. As previously reviewed in the literature, Retting and Williams (1999) found similar results in their study. They reported that drivers who run red lights are more likely to be driving small vehicles. Despite the fact that passenger cars or small vehicles were predominantly involved in RLR violations, the results showed evidence of truck and bus drivers seldom involved in RLR. Table 5.3 RLR Violation by Vehicle Type Vehicle Type RLR Violations Before 1 mo 3 mo Passenger Car 99.3% 98.4% 99.7% Truck 0.5% 1.6% 0.3% Bus 0.2% 0.0% 0.0% Recreational Vehicle 0.0% 0.0% 0.0% 105
118 Chapter 6 Statistical Analysis of RLR Violations 6.1 Comparison of RLR Violation Rates after Installation of Confirmation Lights Studies that have assessed the effectiveness of a roadway safety device rely on a beforeafter crash analysis. These studies involve at least three years of before data and three years of after data (Nicholson 1985). However, many communities want to know the effectiveness of a device or treatment shortly after installation to determine if the investment in the device was a good decision. Many times, in place of a before-after crash analysis, researchers will use a safety surrogate measure in its place. Researchers have previously used the reduction in RLR violations as a crash surrogate for a reduction in RLR crashes. This relationship is not direct due to the fact that RLR violations occur more frequent than RLR crashes since they are rare and random events. Research has also shown that red light runners tend to have common traits such as age, driving experience, speed convictions, and vehicle type (Retting and Williams 1996). However, a reduction in violations means there is a reduction in exposure, or a reduction in the chances of a RLR crash to occur. Additionally, besides considering a change in RLR violations before and after the confirmation lights were installed, the research team investigated the change in violations three months after installation. Unlike previous research studies, it is unknown if the confirmation lights (or really any safety countermeasure) become less effective over time as drivers become accustom to the treatment and associated enforcement. However, changes in driver behavior or changes in enforcement using the confirmation lights may be more effective over time. 6.2 Methodology The RLR violation rate was the metric used to compare changes during the before, 1 month after, and 3 months after installation of the confirmation lights. Violation rate was used 106
119 instead of the number of violations to account for varying intersection volumes (exposure). RLR rate was expressed in 10,000 entering vehicles as shown previously in equation 2.1. Once a violation rate was determined for each data collection period, a change in the violation rates were determined using equation 6.1. Change (%) = π i π b π b 100% (6.1) where π b= violation rate for before period π i = violation rate for after period i To compare the calculated rates for the before, 1 month, and 3 months after installation of the confirmation lights, the research team decided to use a test of proportions to determine if the changes in rate were statistically significant. Equation 6.2 was used to perform this step of the analysis. Z = π b(1 π b) n b (π b π i) + π i(1 π i) n i (6.2) where Z = z-test statistic π b= violation rate for before period nb = volume for before period π i= violation rate for after period i ni = volume for after period i 107
120 The calculated z-test statistic was compared to a Z table with α = 0.05 to determine significance at the 95 percent level of confidence. If the Z was greater than 1.96, the resulting decrease in violation rate was statistically significant. Similarly, if the Z was less than -1.96, the resulting increase in violation rate was statistically significant. 6.3 Results for Change in Red Light Running Violations The results of the violation study for all intersections are presented in this section. As stated previously, the blue confirmation lights were installed at two intersections for the left turning movement. A total of six approaches were treated, four at the intersections of 23 rd Street and Iowa Street and two at the intersection of 23 rd Street and Louisiana Street. Since the intersection of 23 rd Street and Iowa Street had two approaches that were not treated with the blue confirmation light, the research team determined that these two approaches would be considered as not treated approaches and would act as immediate spillover sites. Additionally, six spillover and five control intersections were investigated. The research team evaluated the change in violations for left turning movements and through movements separately. The results are presented in the following sections Analysis of Left Turning Movement Red Light Running Violations Table 6.1 shows the results of the analysis for the left turning movements only. Morning and evening peak hours were combined. The table shows: the intersection, RLR violations recorded, the number of vehicles counted, RLR rates per 10,000 vehicles, and the percent change in violation rates between periods. For the percent change in violation rates, a period represents an infinite change. A total change in RLR rates is the average rate for the treatment site, the treatment site with no confirmation lights, the spillover sites, and the control sites. 108
121 Table 6.1 Results of the Red Light Running Violation Analysis for Left Turning Movements 23rd Street & Iowa Street (NB) B ,007 2,059 2, rd Street & Iowa Street (SB) B ,236 2,448 2, rd Street & Iowa Street (WB) B ,948 2,881 3, rd Street & Iowa Street (EB) B ,759 3,288 3, A rd Street &Louisiana Street (WB) B ,232 3,853 4, rd Street & Louisiana Street (EB) B ,108 4,234 4, A Total ,290 18,763 20, A A 23rd Street & Louisiana Street (NB) B ,915 1,971 1, A Change in violation rate is statistically significant at the 95 percent level of confidence B NB, SB, WB, EB denotes northbound, southbound, westbound, and eastbound respectively Number of Violations Number of Vehicles Violations/TEV Percent Change Treatment Site (Treated App.) Before 1 mo 3 mo Before 1 mo 3 mo Before 1 mo 3 mo 1 mo 3 mo Treatment Site (Non-Treated) 23rd Street & Louisiana Street (SB) B ,619 1,558 1, Total ,534 3,529 3, Spillover Sites 23rd Street & Ousdahl Road ,609 5,697 8, th Street & Iowa Street ,609 7,580 9, A th Street & Louisiana Street ,203 6,312 6, Clinton Parkway & Crestline Drive ,719 7,191 8, th Street & Iowa Street ,471 5,332 5, rd Street & Alabama Street ,552 9,282 9, Total ,163 41,394 48, A Control Sites 6th Street & Kasold Drive ,977 11,753 9, th Street & Michigan Street ,511 8,674 9, st Street & Iowa Street ,668 7,434 8, th Street & Wakarusa Drive ,061 7,402 7, Clinton Parkway & Kasold Drive ,030 12,138 12, Total Overall, the blue confirmation lights showed promising results at the treatment intersections/approaches for left turning movements. Two of the left turn treated approaches saw an increase in violations while four approaches saw a decrease in violations. When the total 109
122 change in left turning violations at all treated approaches were compared, the number of left turning violations decreased, and it was statistically significant at the 95 percent level of confidence. The research team did note that the two left turning intersection approaches that experienced an increase at both treatment intersections were westbound. Based on heavy commuter traffic both east and westbound at both intersections, it can be speculated that commuter traffic during the peak hours may have influenced the increase in RLR violations for this movement. Overall, the decrease in left turn RLR violation rates were substantial with east and northbound approaches having a greater than 40 percent reduction in left turning red light running violations with eastbound approaches having a 100 percent reduction in violations. The research team also found that the northbound non-treated intersection approach at the intersection of 23 th Street and Louisiana Street saw a minor decrease (1 month after) and a major increase (3 months after) in left turning RLR violations. It should be noted that substantial increase in the violation rates did not represent a significant safety issue due to small numbers of violations observed for that approach. The research team also found an overall reduction in left turn RLR violations at the spillover intersections. Similar to the non-treated intersection approaches, many of the spillover intersections saw minimal RLR violations. However, based on an overall analysis, it can be speculated that driver behavior may have changed due to the confirmation lights being present at the treatment intersections located nearby. It should be noted that a substantial reduction in left turning RLR violations occurred at the spillover intersection of 19 th Street and Iowa Street, and that the blue lights can clearly be seen by the drivers at this intersection. 110
123 Globally, the research team found a slight decrease in left turn RLR violations in Lawrence based on the selected control intersections located far away from the treatment and spillover intersections. As shown, the intersection of Clinton Parkway and Kasold Drive saw a large number of left turning RLR violations throughout the study, indicating that although this is a global reduction in RLR violations, there are some major intersections in Lawrence that are seeing an increase Analysis of Through Movement Red Light Running Violations Table 6.2 shows the results of the analysis for the through movements only. The morning and evening peak hours were combined. Table 6.2 shows: the intersection, RLR violations recorded, the number of vehicles counted, RLR rates per 10,000 vehicles, and the percent change in violation rates between periods. For the percent change in violation rates, a period represents an infinite change. A total change in red light running rates is the average rate for the treatment site, the treatment site with no confirmation lights, the spillover sites, and control sites 111
124 6th Street & Michigan Street ,511 8,674 9, A Total ,247 47,401 48, A A Change in violation rate is statistically significant at the 95 percent level of confidence Table 4 Results of the Red Light Running Violation Analysis for Through Movements Number of Violations Number of Vehicles Violations/TEV Percent Change Treatment Sites Before 1 mo 3 mo Before 1 mo 3 mo Before 1 mo 3 mo 1 mo 3 mo 23rd Street & Iowa Street ,950 10,676 11, A rd Street & Louisiana Street ,874 11,616 12, Total ,824 22,292 24, A 32.7 Spillover Sites 23rd Street & Ousdahl Road ,609 5,697 8, th Street & Iowa Street ,609 7,580 9, th Street & Louisiana Street ,203 6,312 6, Clinton Parkway & Crestline Drive ,719 7,191 8, th Street & Iowa Street ,471 5,332 5, rd Street & Alabama Street ,552 9,282 9, Total ,163 41,394 48, A Control Sites 6th Street & Kasold Drive ,977 11,753 9, st Street & Iowa Street ,668 7,434 8, th Street & Wakarusa Drive ,061 7,402 7, Clinton Parkway & Kasold Drive ,030 12,138 12,
125 As shown in table 6.2, the treatment intersections saw a decrease in RLR violation one month after installation of the confirmation lights. An increase in violation rate was observed at 23 rd Street and Louisiana Street and a decrease in violation rate at 23 rd Street and Iowa Street during the three months after study. An overall reduction in through movement RLR violations of 84.1 percent was found in the one month after study and a 32.7 percent increase in through movement RLR violations for the three months after study period. The research team speculates that the through movement traffic noticed the blue lights immediately after installation and then got accustomed to the treatment. The decrease in through movement RLR violations for the intersection of 23 rd Street and Iowa Street as well as the overall decrease in through movement red light running violations for one month after study was statistically significant at the 95 percent level of confidence. The spillover intersections followed a similar trend as the treatment intersections in that the through movement RLR violations decreased one month after the blue confirmation light installation and then saw an increase in through movement RLR violations for the three month study. It should be noted that the decrease was smaller than the treatment intersections and the increase was larger (and statistically significant at the 95 percent level of confidence) as compared to the treatment intersections. Considering the City of Lawrence as a whole including the control intersections, it was found that through movement RLR violations increased in both study periods, with the overall three month percentage being statistically significant at the 95 percent level of confidence. The research team, based on the collected through movement data, determined that the blue confirmation lights had a positive impact on the through movement traffic at the treatment and 113
126 spillover intersections, even though the confirmation lights were installed for the left turning movement only. 6.4 Before-After Effect on Violation Time into Red A secondary performance matrix that the research team used in evaluating the confirmation lights was the violation time into red, which was defined as the time elapsed prior to a violation occurring. Studies have shown that RLR violations occurring more than two seconds after the red signal indication are more dangerous compared to violations occurring less than a second after the all-red phase (Fitzsimmons et al. 2007; Lum and Wong 2003). During an all-red phase, vehicles that enter the intersection less than a second after the red indication normally clear the intersection before vehicles currently stopped at the cross street get the green light to start. In such instances, drivers of vehicles in the cross street are not exposed to potential conflicts that could result in crashes. However, drivers who enter the intersection late (say more than three seconds into the red indication) may put themselves and other road users at risk. One of the research team s goals was to measure the before-after effect on RLR violation time after the onset of the red signal to verify whether confirmation lights have the potential to change driver behavior. The null and alternate hypotheses were stated respectively as: Ho : Confirmation lights have no effect on the frequency of RLR violation time into red, and Ha: Confirmation lights have an effect on the frequency of RLR violation time into red. 6.5 Methodology After the video data were reduced, RLR violations for left turn and through movements were combined and grouped into two. Group 1 consisted of all the RLR violations which occurred within two seconds after the onset of the red signal and group 2 consisted of the violations which occurred more than two seconds after the red indication. Due to the small 114
127 sample size of the RLR violation time into red, 2 x 2 contingency tables were used for analyzing the data for each site category (treatment, spillover, and control sites). Table 6.3 shows an example of the 2 x 2 contingency table with the frequency of RLR violations, which occurred less than two seconds and after two seconds during the before and one month after study periods at the treatment sites. Table 6.3 Contingency Table for RLR Violation Frequency at the Treatment Sites Study period 2 seconds Number of Violations > 2 seconds Total Before month after Total After developing the 2 x 2 contingency tables for each study site, the research team chose the Chi-Square Test of Independence as the statistical method to determine if there exists a relationship between the two nominal variables: violation times after red indication, and beforeafter violation period. This analysis was completed with the understanding that confirmation lights may have an effect at reducing the frequency of dangerous RLR violations at signalized intersections. The formula for the Chi-Square Test of Independence is shown in equation 6.3. χ 2 (E O)2 = E (6.3) where χ 2 = calculated Chi-Square value E = expected frequency of RLR violation and 115
128 O = observed frequency of RLR violation. In order to find the Chi-Square value, the expected frequency for each column i and row j in table 6.3 was calculated using equation 6.4. E ij = T i T j N (6.4) where E ij = the expected frequency for the cell in the i th row and the j th column, T i = the total number of subjects in the i th row T j = the total number of subjects in the j th column N = the total number of subjects in the table. Table 6.4 shows the expected frequencies for the cells in table 6.3. Table 6.4 Expected Frequencies Study Period 2 seconds Number of Violations > 2 seconds Total Before month after Total The chi-square value was computed as follows: χ 2 (E O)2 ( )2 (2.99 2)2 ( )2 (1.01 2)2 = = = E The Chi-Square value was then compared to Chi-Square tables with degrees of freedom equal to one to determine the p-values at 95 and 90 percent levels of significance. If the p-value was less 116
129 than 0.05 and/or 0.1, then the null hypothesis that confirmation lights have no effect on the frequency of RLR violation time into red was rejected at the 95 and/or 90 percent levels of confidence Results Chi-Square Test for Before and 1 month After Study Table 6.5 shows the Chi-Square Test result for the before and one month after study periods. As shown, the numbers of RLR violations that occurred within two seconds after the red indication were higher than the number of violations that occurred more than two seconds after the red indication at all the study sites. It can be seen from table 6.5 that most of the before violations reduced substantially one month after installation of the confirmation lights. The Chi- Square statistical analysis showed p-values greater than 0.1 indicating that there were no significant changes in the before-after violation time into red at all the study sites. This means that the confirmation lights one month shortly after installation did not have any significant effect on drivers behavior of entering the intersections early or late after the red signal was indicated. 117
130 Table 5 Chi-Square Test for Before and 1 Month after Study Site Category Study Period 2 seconds into red Number of Violations >2 seconds into red Chi-square Value P-value Treatment Spillover Control Before month after 17 2 Before month after 26 4 Before month after Chi-Square Test for Before and 3 months After Study Table 6.6 shows the results of the Chi-Square Test and their associated p-values for the before and three months after violation time into red at the treatment, the spillover, and the control sites. As previously discussed, more RLR violations occurred within two seconds after the red indication than the number of violations which occurred more than two seconds after the red indication. At all the study intersections, the statistical tests showed p-values greater than This indicated that the confirmation lights did not have any effect on the frequency of RLR violation time into red at the 95 percent level of confidence. However, the Chi-Square Test at the 90 percent level of confidence showed that the confirmation lights have a significant effect on the RLR violation times into red at the treatment sites. Though the spillover sites did not see any significant difference in the violation times into red, a p-value of 0.15 showed promising results. Considering the City of Lawrence as whole, the control sites did not see any difference in the violation time into red before and after the confirmation lights were installed. Overall, the research team saw very little change in the violation time into red after the installation of this 118
131 countermeasure indicating that this countermeasure cannot change driver behavior when the violation occurs. Table 6.6 Chi-Square Test for Before and 3 months After Study Site Category Study Period 2 seconds into red Number of Violations >2 seconds into red Chi-square Value P-value Treatment Spillover Control Before month after 39 6 Before month after 61 3 Before month after A A Confirmation lights have statistical significant effect on the frequency on RLR violation time into red at the 90 percent level of confidence. 119
132 Chapter 7 Conclusions and Recommendations 7.1. General Conclusions This study evaluated how blue confirmation lights affect RLR violations at signalized intersections. The City of Lawrence installed confirmation lights on the left turn approaches at two signalized intersections on July 2, 2013, to aid traffic enforcement officers to effectively and safely enforce RLR. The research team conducted before-after violation studies to evaluate the effectiveness of the system since crash data were limited. Prior to installation of the confirmation lights, RLR violation data were collected at the study sites from October 17 to November 29, Two phases of data collection were completed after the installation of the confirmation lights. This included a one-month-after study from August 6 to August 22, 2013, and a three-months-after study from October 9 to November 5, A test of proportion was used to analyze the changes in violation rates from the before period to each after period. This was completed with the understanding that a decrease in the violation rate was a surrogate measure to a decrease in RLR crashes. A Chi-Square Test was also utilized to analyze the RLR violation times into red as a secondary performance matrix to evaluate whether confirmation lights had any effects on driver behavior. In general, the one-month-after violation study saw a 57.4 percent reduction in the left turn RLR violation rates at the treatment sites and a 55.7 percent reduction at the spillover sites. Both of these reductions were statistically significant at the 95 percent level of confidence. At the treatment sites, the violation study three months after the installation of the confirmation lights saw a 42.7 percent decrease in RLR violation rates, which was statistically significant, and a 31.7 percent decrease (not statistically significant) at spillover sites. 120
133 Considering the control sites, the City of Lawrence saw a global reduction in left turn RLR violations, which indicate that confirmation lights are an effective system for reducing RLR violation in the short and long term periods. These findings are consistent or similar with the study reported by Reddy et al. (2008) in Hillsborough County, Florida where they saw a 25 percent reduction in violations after the implementation of confirmation lights. Analysis of the violation study for the through movement showed mixed results. One month after installation of the confirmation lights, the treatment sites saw 84.1 percent overall reductions in violations (statistically significant), and the spillover sites saw a 14.4 percent overall reduction (not statistically significant) in violations. However, three months after the installation of the confirmation lights, both the treatment and spillover sites saw an overall increase in violation rates, which were not statistically significant. At the control sites, the violation rates increase one month after and three months after the installation of the confirmation lights, but the rate was only statistically significant in the three months after study (112.3 percent increase). In general, the City of Lawrence saw an overall increase in through movement RLR violations one and three months after the confirmation light were installed. The treatment and spillover intersections both saw a decrease one month after installation and an increase in violations three months after installation. The decrease was greater and the increase was less at the treatment intersections as compared to the spillover and control intersections. Although the treatment intersections did not have confirmation lights installed for the through movement, the lights were effective in the short term for reducing RLR violations. Analysis of the time into red for left turn and through movements was also studied by the research team. Results of the analysis showed that most RLR violations occurred less than one 121
134 second after the onset of the red aspect of the signal or shortly after the all-red phase. This indicates that the red light runners were either distracted or were following too closely to one another in a platoon. RLR violations more than five seconds after the indication of the red aspect of the signal were also observed at the study intersections. There were several instances where impatient drivers who had been waiting to be given the green light could no longer wait and decided to run the red lights after initially stopping. The Chi-Square Test showed no significant effect on RLR violation time into red one month after installation, however, the three months study showed a statistical difference at the 90 percent level of confidence at the treatment sites. Overall, very little change in time into red was noticed at study intersections after the confirmation lights were installed. This means that this countermeasure is less effective in changing driver behavior. Additionally, further investigations were conducted to determine how most RLR violations occur (whether a single vehicle or multiple vehicles in platoons or traveling side by side). Results of the study showed that approximately 50 percent of the RLR violations observed for each study period were committed by drivers of single vehicles making a right turn, ranking as the number one RLR violation pattern in the City. The before and one month after study periods showed left turn RLR violation by a single vehicle as the second most observed violation type followed by a through movement violation by a single vehicle. However, the three months after study showed a through movement violation by a single vehicle as the second most observed violation configuration. Though there were evidences of multiple vehicles running red lights either in platoon or vehicles traveling side by side, these violation types rarely occurred. The research team observed quite a number of right turn violation movements by multiple vehicles in a platoon 122
135 (approximately three to six percent of the total violations observed for each study period). Moreover, over 98 percent of the RLR violations were committed by drivers driving small passenger cars. Buses, trucks, and recreational vehicles showed little or no involvement in the observed RLR violations. Overall, the main finding of this research study has indicated that confirmation lights are an effective low-cost countermeasure to aid traffic law enforcement units to safely and efficiently monitor RLR violations at signalized intersections. 7.2 Contributions to Highway Safety RLR violations contribute substantially to the millions of vehicle crashes at signalized intersection in the United States each year. This is a serious safety issue for many communities nationwide. The past decade has seen states department of transportation implementing effective countermeasures and programs to reduce RLR violations and the associated crashes. Confirmation light systems, a low cost option, have been one of the least countermeasures considered by many states officials. This research study has demonstrated that confirmation lights, when used in combination with enforcement efforts, can reduce RLR violations at targeted signalized intersections. When this system is implemented, a single enforcement officer can monitor RLR violations, pull over offenders, and issue a ticket. Thus, this can potentially replace a police officer observing RLR violations, hence, cut down the staff required to enforce RLR compliance. Secondly, confirmation lights eliminate the need for an enforcement officer to travel through the intersection to pull over the red light runner. This promotes intersection safety for both the enforcement officer and other road users. In addition, the low cost of confirmation lights 123
136 (approximately $110 to $140) potentially allows installations at more signalized intersections where RLR is prevalent. This will lead to efficient use of enforcement resources. In summary, confirmation lights promote intersection safety by reducing RLR violations. It is recommended that State DOTs and other road safety organizations use this countermeasure to aid traffic enforcement units to effectively and safely enforce RLR. 7.3 Research Limitations It should be noted that the research team faced several limitations that were beyond the scope of the study. As previously discussed, two of the approaches at 23 rd Street and Louisiana Street did not receive any treatment though this intersection was selected as one of treatment sites. The research team found that the confirmation lights would not work as expected because the north and southbound left movements were controlled by protected/permitted signals. Had the confirmation lights been installed on these approaches, it would be nearly impossible for a police officer to correctly identify a violator. Therefore, in the statistical analysis of the RLR violations, these two approaches were analyzed separately from the treated approaches. As a result, the overall effect of the confirmation light could not be reported for that treatment site. Secondly, the methodology chosen by the research team limited the hours of data collection to four hours instead of 24 hours. This affected the sample size to carry out a more rigorous statistical analysis to determine how confirmation lights were effective in changing driver behavior. It is suggested that in the future a practical research methodology be designed to collect more violation data over a longer period of hours (say 12 hours) to increase the sample size for more in-depth statistical analysis to be performed. As previously discussed in section 4.7 and 4.8, the research team faced several challenges during the stages of the data collection. The limitations included malfunctioning of equipment 124
137 during some recording sessions, stolen cameras from the site, bad to severe weather conditions, unexpected crash incidents, temporary work zone set-ups during filming, and distractions from pedestrians. Finally, the research team realized that the reductions of the RLR violations for right turn movements were inconsistent among the individual students who reduced the data. It was difficult to determine whether a vehicle stopped or slowed down or rolled through the intersection when the vehicle made a right turn. No statistical tests were conducted for the right turning violations due to these inconsistencies. It is suggested that a more accurate method be adopted in the future to avoid the variations. 7.3 Future Research This study evaluated the effectiveness of confirmation lights at signalized intersections in Lawrence, Kansas after one and three months of installation. Three studies are recommended by the research team to be conducted to support the findings reported herein. These future studies are discussed in the following section Crash Data Analysis A more acceptable method to evaluate a safety measure is to use two to three years of crash data. Due to the short time period within which this study was to be completed, crash data were limited to this research. If the confirmation lights stay in place for a long period of time and crash data become available, crash analysis can be performed to quantify the effects of confirmation lights on crashes. It is recommended that the Empirical Bayes method should be used for the analysis since it is the most commonly accepted crash analysis technique as of today. 125
138 7.3.2 Additional Violation Studies In this study, RLR violation data were collected one month after and three months after the confirmation lights were installed. A violation study one year or more after the installation is recommended. Having a one-year study will help determine if confirmation lights have long lasting impacts on reducing RLR violations, and also to avoid any seasonal changes that may be present in this current research. Results of the study showed that though the confirmation lights were installed on left turn approaches, it had a significant impact in reducing RLR violations in the short term. It is recommended that the lights be installed for the through movement and a before-after violation study be conducted to validate the findings in this report Evaluation of Public Awareness Campaign As was stated earlier, this study did not evaluate how the public awareness campaign contributed to the effectiveness of the confirmation lights in reducing RLR violations. It is suggested that a survey study be conducted in the future to determine how the public awareness campaign impacted the findings reported herein. 126
139 References AAA Foundation for Traffic Safety Traffic Safety Culture Index. Washington, DC, January, Beeber, J. Safer Streets in Los Angeles: Why Engineering Countermeasures are More Effective than Photo Enforcement in Reducing Red Light Related Crashes. Safety Streets L.A. Accessed May, Bonneson, J., and K. Zimmerman. Red Light Running Handbook: An Engineer's Guide to Reduce Red Light Related Crashes. Report FHWA/TX-05/ P1. Texas Transportation Institute, Texas A&M University, College Station, TX, Bonneson, J.A., and K.H. Zimmermann. Effect of Yellow Interval Timing on Red Light Violation Frequency at Urban Intersections. Texas Transportation Institute, Texas A&M University, College Station, TX, Bonneson, J.A., and K. Zimmermann, M. Brewer. Engineering Countermeasures to Reduce Red Light Running. Texas Transportation Institute, Texas A&M University, College Station, Cunningham, C.M., and J.S. Hummer. Evaluating the Use of Red Light Running Photographic Enforcement Using Collisions and Red Light Running Violations. Institute for Transportation Research and Education, North Carolina State University, Raleigh, NC, Datta, K.T., K. Schattler, and S. Datta. Red Light Violations and Crashes at Urban Intersections. In Transportation Research Record: Journal of the Transportation Research Board, No. 7134, Transportation Research Board of National Academies, Washington, D.C., 2000, pp Eccles, P.L., and H.W. McGee. A History of the Yellow and All-Red Intervals for Traffic Signals. Washington D.C: Institute of Transportation Engineers, Federal Highway Administration. How Red-Light Running is Defined and How Crash Figures Are Determined. FHWA, U.S. Department of Transportation, Washington D.C. Accessed January 10, Federal Highway Administration. Manual on Uniform Traffic Control Device (MUTCD) U.S. Department of Transportation, Washington, D.C., Accessed October 24,
140 Federal Highway Administration. Red Light Camera Systems Operational Guidelines. U.S. Department of Transportation, Washington, D.C., Accessed February 10, Federal Highway Administration. Red-Signal Enforcement Lights. U.S. Department of Transportation, Washington, D.C., Accessed January 15, Federal Highway Administration. Retroflective Borders on Traffic Signal Backplates. U.S. Department of Transportation, Washington, D.C, s.shtmaccessed February 10, Fitzsimmons, E.J., S. Hallmark, T. McDonald, M. Orellana, and D. Matulac. The Effectiveness of Iowa's Automated Red Light Running Enforcement Programs. Center for Transportation Research and Education, Iowa State University, Ames, IA, Hallmark, S., N. Oneyear, and T. McDonald. Toolbox of Countermeasures to Reduce Red Light Running. Center for Transportation Research and Education, Iowa State University, Ames, IA, Hill, S.E, and J.K. Lindly. Red Light Running Prediction and Analysis. Report FHWA/CA/OR-. University Transportation Centre for Alabama, University of Alabama, Tuscaloosa, AL, Hsu, P., J. Smith, and E. Rice. Red Light Signal Enforcement. FHWA, U.S. Department of Transportation, Washington, D.C., Insurance Institute for Highway Safety. Q&A Red light Cameras. Accessed April 15, Kamyab, A., T. McDonald, and J.J. Stribiak. Red Light Running in Iowa: The Scope, Impact, and Possible Implications. Center for Transportation Research and Education, Iowa State University, Ames, Lum, K. M. and Wong, Y. D. (2003). Impacts of Red Light Camera on Violation Characteristics. Journal of Transportation Engineering, November/December, Manual on Uniform Traffic Control Device (MUTCD) Edition. Accessed October 24, McCartt, T.A., and A. Eichelberge. Attitudes Towards Red Light Cameras in Large Cities with Camera Programs.In Traffic Injury Prevention. Vol 13, 2012, pp
141 McCartt, T.A., and W. Hu. Effects of Red Light Camera Enforcement on Red Light Violations in Arlington County, Virginia. Journal of Safety Research. Vol 48, 2014, pp McGee, H., K. Moriarty, K. Eccles, M. Liu, T. Gates, and R. Retting. NCHRP Report 731: Guidelines for Timing Yellow and All-Red Intervals at Signalized Intersections. Transportation Research Board, Washington, D.C., McGee, H.W., K. Eccles, J. Clark, L.prothe, and C. O'Connell. Making Intersections Safer: A Toolbox of Engineering Countermeasures. Informational Report. Federal Highway Administration, Institute of Transportation Engineers, Washington, D.C., Messer, C.J., S.R. Sunkari, H.A. Charara, and R.T. Parker. Development of Advanced Warnining Systems for End-of-Green Phase at High Speed Traffic Signals. Report FHWA/TX-04/ Texas Transportation Institute, Texas A&M Universtiy, College Station, TX, Minnesota Local Technical Assistance Program Local Operational Research Assistance (OPERA) Program Annual Report. University of Minnesota, Minneapolis, Minnesota, Nicolson, A.J. The Variability of Accident Counts. Accident Analysis and Prevention, Vol. 17, No. 1, 1985, pp Lum, K. M. and Wong, Y. D. (2003). Impacts of Red Light Camera on Violation Characteristics. Journal of Transportation Engineering, November/December, Persaud, N.B., R.A. Retting, P.E. Garder, and D. Lord. Safety Effect of Roundabout Conversions in the United States, Empirical Bayes Observational Before-After Study. In Transportation Research Record: Journal of Transportation Research Board, No. 1751, Transportation Research Board of National Academies, Washington, D.C., 2007, pp Polanis, Stanley F. Improving Intersection Safety Through Design and Operations (EXAMPLES). ITE Spring Conference and Exhibit, Palm Harbor, FL, Porter, B.E., and K.J. England. Predicting Red-Light Running Behavior: A Traffic Safety Study in Three Urban Settings. National Safety Council and Elsevier Science Ltd. Journal of Safety Research.. Vol. 31, No , pp Porter, B.E., T.D. Berry, J. Harlow, and T. Vandecar. A Nationwide Survey of Red Light Running: Measuring Driver Behaviors for the Stop Red Light Running Program. Old Dominion University, Norfolk, VA, Reddy, V., P. Datta, D. McAvoy, P. Savolainen, M. Abdel-Aty, and S. Pinapaka. Evaluation of Innovative Safety Treatments. HNTB Corporation, Fort Lauderdale, FL,
142 Retting, R.A., and A.F. Williams. Characteristics of Red Light Violators: Results of a Field Investigation. National Safety Council and Elsevier Science Ltd. Journal of Safety Research. Vol. 27, No , pp Retting, Richard A., A.F. Williams, C. M. Farmer, and A. F Feldman. Evaluation of Red Light Camera Enforcement in Oxnard, California. Accident Analysis and Prevention, Vol 31, No. 3, 1999(a), pp Retting, Richard A., A. F. Williams, C. M. Farmer, and A.F. Feldman. Evaluation of Red Light Camera Enforcment in Fairfax, VA, USA. In ITE Journal, Vol 69, No. 8, 1999 (b), pp Retting, R.A., A.F Williams, and M.A. Greene. Red-Light Running and Sensible Countermeasures: Summary of Research Findings. In Transportation Research Record: Journal of Transportation Research Board, No. 1640, Transportaion Research Board of National Academies, Washington, D.C., 1998, pp Retting, R.A., and M.A. Greene. Influence of Traffic Signal Timing on Red Light Running and Potential vehicle Conflicts at Urban Intersections. In Transportation Research Record: Journal of Transportation Research Board, No. 1595, Transportaion Research Board of National Academies, Washington, D.C., 1997, pp Retting, R.A., and R.G. Ulmer, A.F. Williams. Prevalence and Characteristics of red Light running crashes in the United States. Accident Analysis and Prevention, Vol 31, No. 6, 1999 (c), pp Retting, R. A., S. A. Ferguson, and C.M. Farmer. Reducing Red light Running Through Longer Yellow Signal Timing and Red Light Camera Enforcement: Results of Field Investigation. Insurance Institute for Highway Safety, Arlington, VA, Retting, R. A., and S. Y. Kyrychenko. Reductions in Injury Crashes Associated With Red Light Camera Enforcement in Oxnard, California. American Journal of Public Health, Vol 92, No.11, 2002, pp Roadway Improvements. Traffic Engineering and Operation Office. Florida Department of Transportation. s.shtm Accessed January 12, Rodegerdts, L., M. Blogg, E. Wemple, E. Myers, M. Kyte, M. Dixon, G. List, A. Flannery, R. Troutbeck,, W. Brilon, N. Wu, B. Persaud, C. Lyon, D. Harkey, and D. Carter. NCHRP Report 572, Roundabouts in the United States. Transportation Research Board, Washington, D.C.,
143 Schattler, K.L., D. McAVOY, M.T. Christ, and C.M. Glauber. Impact of Signal Mounting Configurations on Red-Light Running at Urban Signalized Intersections. ITE Journal, Vol. 81, No. 2, 2011, pp.22-24, Schattler, K.L., T.K. Datta, and C.L. Hill. Change and Clearance Interval Design on Red Light Running and Late Exits. In Transportation Research Record: Journal of Transportation Research Board, No. 1856, Transportaion Research Board of National Academies, Washington, D.C., 2003, pp State of Kansas, 2013 Statute, , subsection (a)(6). e/021_061_0001_section/021_061_0001_k/. Accessed May 9, Tarko, A., G. Davis, N. Saunier, T. Sayed, and S. Washington. White Paper. Surrogate Measures of Safety. ANB20(3) Subcommittee on Surrogate Measures of Safety. ANB20 Committee on Safety Data Evaluation and Analysis, Traffic Engineering Handbook. 6th Edition. Institute of Transportation Engineers, Tydlacka, J., A.P. Voigt, and W.C. Langford III. Evaluation of Lighted Pavement Marker Stop Bars and LED Outlined Traffic Signal Backplates. IMSA Journal, Vol. 49, No. 3, 2011, pp Washburn, S.S., and K.G. Courage. Investigation of Red Light Running Factors. Department of Civil and Coastal Engineering, University of Florida, Gainesville, FL, Yang, C.Y., and W. Najm. Analysis of Red Light Violation Data Collected from Intersections Equipped with Red Light Photo Enforcement Cameras. Report DOT-VNTSC-NHTSA U.S. Department of Transportation, Research and Innovative Technology Administration, John A. Volpe National Transportation Systems Center, Cambridge, MA, Zegeer, C.V., and R.C. Deen. Green-Extension Systems at High-Speed Intersections. ITE Journal, 1978, pp

144 Appendix A Characteristics and Aerial Views of Intersections 132
145 133
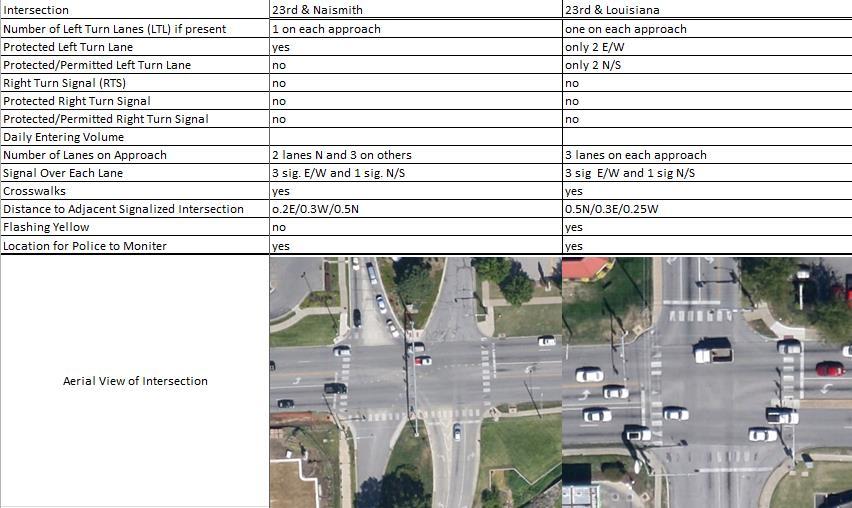
146 134
147 135
148 136
149 137
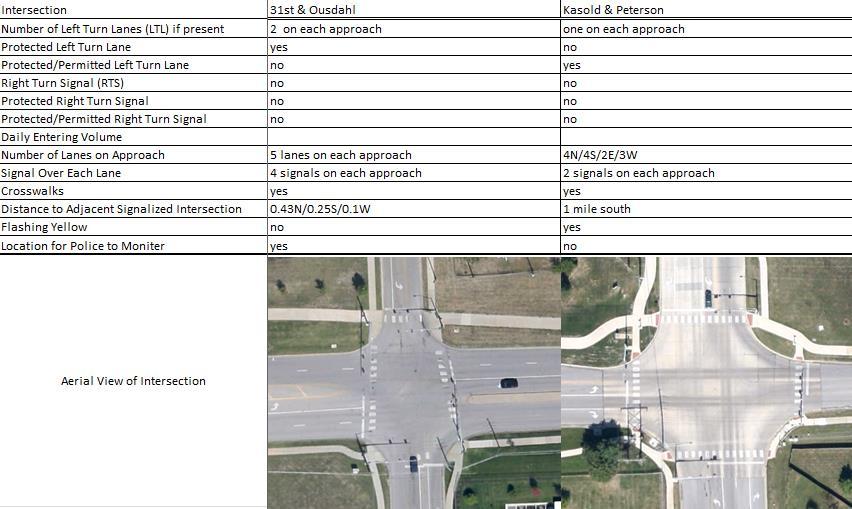
150 138
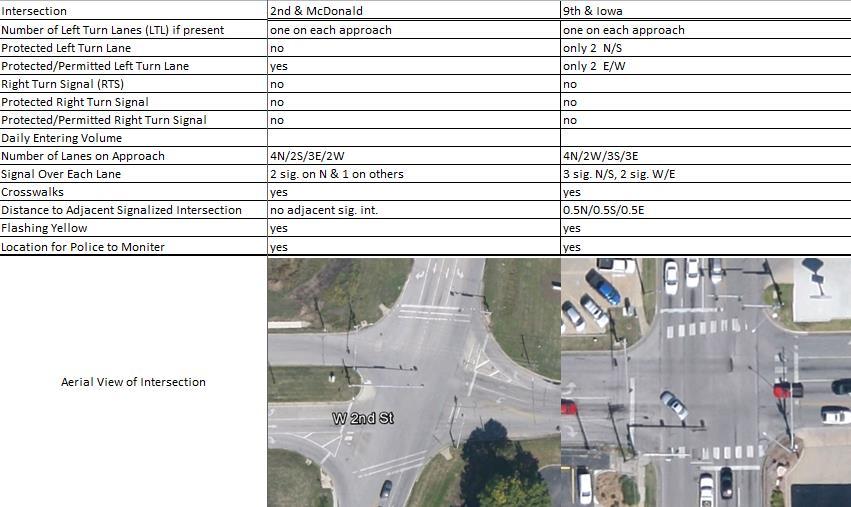
151 139
152 140
153 141
 Yes No Protected Right Turn Signal Yes No Protected/Permitted Right Turn Signal No Permitted No Daily Entering Volume Number of Lanes on Approach 4 on")
154 Intersection 23rd & Kasold 23rd & Iowa Number of Left Turn Lanes (LTL) if present 1 on each approach 2 each N/S and 1 each W/E Protected Left Turn Lane Yes Yes Protected/Permitted Left Turn Lane No Permitted No Permitted Right Turn Signal (RTS) Yes No Protected Right Turn Signal Yes No Protected/Permitted Right Turn Signal No Permitted No Daily Entering Volume Number of Lanes on Approach 4 on 23rd, 3 on Kasold 5 lanes N/S and 4 lanes E/W Signal Over Each Lane Yes 3 signals on each approach Crosswalks Yes Yes Distance to Adjacent Signalized Intersection 1,200 ft 0.25E/0.5N/0.3S/0.25W Flashing Yellow Yes No Location for Police to Moniter Yes Yes Aerial View of Intersection 142
155 Appendix B Reduced RLR Violation Data for Before and After Studies BEFORE STUDY RLR VIOLATIONS Treatment Sites Before Study at Intersection of 23 rd Street & Louisiana Street (Morning) Number of Type of Seconds Time of Day NB SB EB WB Vehicles Vehicle into Red (a.m.) : : : : : : : : : : : : :22 Before Study at 23 rd Street & Louisiana Street (Evening) Number of Type of Seconds Time of Day NB SB EB WB Vehicles Vehicle into Red (PM) : : : : : : : : : : : : : : :47 143
156 Before Study 23 rd Street & Iowa Street (Morning) Number of Type of Seconds Time of Day NB SB EB WB Vehicles Vehicle into Red (a.m.) : : : : : : : : : : : : : : : : : : : : : : :53 144
157 Before Study at 23 rd Street & Iowa Street (Evening) Number of Type of Seconds Time of Day NB SB EB WB Vehicles Vehicle into Red (p.m.) : : : : : : : : : : : : : : : : : : : : : : : : : : : : : : : : : : : :20 145
158 Before Study Traffic Volume at Treatment Sites Intersection Period Approach 23rd Street & Iowa Street 23rd Street & Louisiana Street Morning Peak Evening Peak Morning Peak Evening Peak Volume per lane L T R Volume per Approach NB 148 1, ,296 SB ,099 WB ,028 EB 501 1, ,930 Total 1,277 3, ,353 NB 336 1,375-1,711 SB 621 1,516-2,137 WB 405 1,515-1,920 EB 393 1, ,829 Total 1,755 5, ,597 NB SB WB 133 1, ,786 EB 236 1, ,878 Total 644 3, ,055 NB ,104 SB ,039 WB 434 1, ,446 EB 278 1, ,230 Total 1,172 4, ,
159 Control Sites Before Study at 31 st Street & Iowa Street (Morning) Number of Type of Seconds Time of Day NB SB EB WB Vehicles Vehicle into Red (a.m.) : : : : : : : : : : : : : : : :34 Before Study at 31 st Street & Iowa Street (Evening) Number of Vehicles Type of Vehicle Seconds into Red NB SB EB WB Time of Day (p.m.) : : : : : : : :42 147
160 Before Study at 6 th Street & Wakarusa Drive (Morning) Number of Vehicles Type of Vehicle Seconds into Red NB SB EB WB Time of Day (a.m.) : : : : : : : : : : : : : : : : : : : : : : : : : : : : ; : :56 148
161 Before Study at 6 th Street & Wakarusa Drive (Evening) Number of Vehicles Type of Vehicle Seconds into Red NB SB EB WB Time of Day (p.m.) : : : : : : : : : : : : : : : : :57 ` : : :33 149
162 Before Study at Clinton Parkway & Kasold Drive (Morning) Number of Vehicles Type of Vehicle Seconds into Red NB SB EB WB Time of Day (a.m.) : : : : : : : : : : : : : : : : : : : : : : : : : : : : : : :53 150
163 Before Study at Clinton Parkway & Kasold Drive (Evening) Number of Vehicles Type of Vehicle Seconds into Red NB SB EB WB Time of Day (p.m.) : : : : : : : : : : : : : : : : : : :49 Before Study at 6 th Street & Kasold Drive (Morning) Number of Vehicles Type of Vehicle Seconds into Red NB SB EB WB Time of Day (a.m.) : : : : : : : : : :41 151
164 Before Study at 6 th Street & Kasold Drive (Evening) Number of Vehicles Type of Vehicle Seconds into Red NB SB EB WB Time of Day (p.m.) : : : : : : : : : : : : : : : : : : : : : : : : : : : : : : : : : :48 152
165 Before Study at 6 th Street & Michigan Street (Morning) Number of Vehicles Type of Vehicle Seconds into Red NB SB EB WB Time of Day (a.m.) : : : : : : : : : :31 Before Study at 6 th Street & Michigan Street (Evening) Number of Vehicles Type of Vehicle Seconds into Red NB SB EB WB Time of Day (p.m.) : : : : : : :41 153
166 Before Study Traffic Volume at Control Sites Intersection Period Approach Volume per lane Volume per L T R Approach NB SB Morning Peak WB 200 1, ,284 EB 39 1, ,847 6th Street Total 689 3, ,533 & NB ,202 Kasold Drive SB Evening Peak WB 420 1, ,514 EB 118 1, ,073 Total 1,207 4, ,444 6th Street & Michigan Street 31st Street & Iowa Street 6th Street & Wakarusa Drive Clinton Parkway & Kasold Drive Morning Peak Evening Peak Morning Peak Evening Peak Morning Peak Evening Peak Morning Peak Evening Peak NB SB WB EB Total NB SB WB 19 2, ,482 EB 69 1, ,963 Total 614 4, ,372 NB ,231 SB WB EB Total 554 2, ,321 NB ,361 SB 376 1, ,826 WB EB ,162 Total 1,271 3,017 1,059 5,347 NB SB WB ,111 EB Total 1,009 1, ,446 NB ,261 SB WB ,591 EB ,159 Total 1,234 2,247 1,134 4,615 NB SB WB ,271 EB ,748 Total 868 2, ,574 NB ,082 SB ,448 WB 262 1, ,370 EB 137 1, ,556 Total 1,256 3,832 1,368 6,
167 Spillover Sites Before Study at 19th Street & Iowa Street (Morning) Number of Type of Seconds Time of Day NB SB EB WB Vehicles Vehicle into Red (a.m.) : : : : : : : : : : : : : : : : : : : : : : : : : : : : :38 155
168 Before Study at 19 Street & Iowa Street (Evening) Number of Type of Seconds Time of Day NB SB EB WB Vehicles Vehicle into Red (p.m.) : : : : : : : : : : : : : : : : : : : : : : : : : : : : : : : : : : : : : : : : : : : : : : :18 156
169 Before Study at 19 th Street & Louisiana (Morning) Number of Vehicles Type of Vehicle Seconds into Red NB SB EB WB Time of Day (a.m.) : : : : : : :35 Before Study at 19 th Street & Louisiana (Evening) Number of Vehicles Type of Seconds Vehicle into Red NB SB EB WB : : : : :06 Time of Day (p.m.) Before Study at 23 rd Street & Ousdahl (Morning) Number of Type of Seconds Time of Day NB SB EB WB Vehicles Vehicle into Red (a.m.) : : : : : : : : :42 Before Study at 23 rd Street & Ousdahl (Evening) Number of Type of Seconds Time of Day NB SB EB WB Vehicles Vehicle into Red (p.m.) : : : : : :56 157
170 Before Study at 25 th Street & Iowa Street (Morning) Number of Vehicles Type of Vehicle Seconds into Red NB SB EB WB Time of Day (AM) :54 Before Study at 25 th Street & Iowa Street (Evening) Number of Vehicles Type of Seconds Vehicle into Red NB SB EB WB : : : : : : : : : :28 Time of Day (p.m.) Before Study at Crestline Drive & Clinton Parkway (Morning) Number of Vehicles Type of Vehicle Seconds into Red NB SB EB WB Time of Day (a.m.) : : : : : : : : : : : : :00 158
171 Before Study at Crestline Drive & Clinton Parkway (Evening) Number of Vehicles Type of Vehicle Seconds into Red NB SB EB WB Time of Day (p.m.) : : : : : : : : :37 Before Study at 23 rd Street & Alabama Street (Morning) Number of Vehicles Type of Seconds Vehicle into Red NB SB EB WB : : : : : : : :37 Time of Day (a.m.) Before Study at 23rd Street & Alabama Street (Evening) Number of Type of Seconds Time of Day NB SB EB WB Vehicles Vehicle into Red (p.m.) : : :29 159
172 Before Study Traffic Volume at Spillover Sites Intersection Period Approach 23rd Street & Ousdahl Street 19th Street & Iowa Street 19th Street & Louisiana Street Clinton Parkway & Crestline Drive Morning Peak Evening Peak Morning Peak Evening Peak Morning Peak Evening Peak Morning Peak Evening Peak Volume per lane L T R Volume per Approach NB SB WB 42 1, ,662 EB 246 1, ,161 Total 378 3, ,244 NB SB WB 102 2, ,302 EB 136 2, ,355 Total 445 4, ,365 NB 32 1, ,073 SB 478 1, ,915 WB EB Total 711 3,221 1,012 4,944 NB 71 1, ,278 SB 475 2, ,855 WB ,170 EB Total 1,132 4,515 1,018 6,665 NB SB WB ,141 EB Total 645 1, ,658 NB SB WB 542 1, ,560 EB ,038 Total 794 2, ,545 NB SB WB 122 1, ,460 EB 279 2, ,616 Total 516 3, ,418 NB SB WB 59 1, ,749 EB 53 1, ,969 Total 417 3, ,
173 Before Study Traffic Volume at Spillover Sites (continued) Intersection Period Approach 25th Street & Iowa Street 23rd Street & Alabama Street Morning Peak Evening Peak Morning Peak Evening Peak Volume per lane L T R Volume per Approach NB 34 1, ,525 SB WB EB Total 163 2, ,603 NB 82 2, ,262 SB 67 1, ,149 WB EB Total 390 4, ,868 NB SB WB 49 1, ,633 EB 59 1, ,759 Total 238 3, ,840 NB SB WB 147 2, ,602 EB 78 2, ,536 Total 464 4, ,
174 1 MONTH AFTER STUDY RLR VIOLATIONS Treatment Sites 1 Month after Study at 23 rd Street & Louisiana Street (Morning) Number of Vehicles Type of Vehicle Seconds into Red NB SB EB WB Time of Day (a.m.) : : : : :57 1 Month after Study at 23 rd Street & Louisiana Street (Evening) Number of Vehicles Type of Vehicle Seconds into Red NB SB EB WB Time of Day (p.m.) : : : : : : : : : :06 1 Month after Study at 23 rd Street & Iowa Street (Morning) Number of Type of Seconds Time of Day NB SB EB WB Vehicles Vehicle into Red (a.m.) : : : : : : :53 162
175 1 Month after Study at 23 rd Street & Iowa Street (Evening) Number of Type of Seconds Time of Day NB SB EB WB Vehicles Vehicle into Red (p.m.) : : : : : : : : : : : : : : : :51 1 Month after Study Traffic Volume at Treatment Sites Intersection Period Approach 23rd Street & Iowa Street 23rd Street & Louisiana Street Morning Peak Evening Peak Morning Peak Evening Peak Volume per lane Volume per L T R Approach NB SB WB EB 379 1, ,642 Total 965 3, ,308 NB ,173 SB 525 1,076-1,601 WB 471 1,477-1,948 EB 265 1, ,646 Total 1,526 4, ,368 NB SB WB 207 1, ,769 EB 214 1, ,096 Total 680 3, ,279 NB ,079 SB ,036 WB 410 1, ,084 EB 226 1, ,138 Total 1,062 4, ,
176 Control Sites 1 Month after Study at 6th Street & Kasold Drive (Morning) Number of Type of Seconds Time of Day NB SB EB WB Vehicles Vehicle into Red (a.m.) : : : : : : : : : : : : : : : : : : : : : : : :56 164
177 1 Month after Study at 6th Street & Kasold Drive (Evening) Number of Vehicles Type of Vehicle Seconds into Red NB SB EB WB Time of Day (p.m.) : : : : : : : : : : : : : : : : : : :33 1 Month after Study at 31st Street & Iowa Street (Morning) Number of Vehicles Type of Vehicle Seconds into Red NB SB EB WB Time of Day (a.m.) : : : : : : : :43 165
178 1 Month after Study at 31st Street & Iowa Street (Evening) Number of Vehicles Type of Vehicle Seconds into Red NB SB EB WB Time of Day (p.m.) : : : : :49 1 Month after Study at 6th Street & Michigan Street (Morning) Number of Vehicles Type of Vehicle Seconds into Red NB SB EB WB Time of Day (a.m.) : : : : :10 1 Month after Study at 6th Street & Michigan Street (Evening) Number of Vehicles Type of Vehicle Seconds into Red NB SB EB WB Time of Day (p.m.) : : :42 1 Month after Study at 6th Street & Wakarusa Drive (Morning) Number of Vehicles Type of Vehicle Seconds into Red NB SB EB WB Time of Day (a.m.) : : : : : : : :49 166
179 1 Month after Study at 6th Street & Wakarusa Drive (Evening) Number of Vehicles Type of Vehicle Seconds into Red NB SB EB WB Time of Day (p.m.) : :53 1 Month after Study at Clinton Parkway & Kasold Drive (Morning) Number of Vehicles Type of Vehicle Seconds into Red NB SB EB WB Time of Day (a.m.) : : : : : :52 1 Month after Study at Clinton Parkway & Kasold Drive (Evening) Number of Vehicles Type of Vehicle Seconds into Red NB SB EB WB Time of Day (p.m.) : : : : : : : : : : : : : : :45 167
180 1 Month after Study Traffic Volume at Control Sites Intersection Period Approach 6th Street & Kasold Drive 6st Street & Michigan Street 31st Street & Iowa Street 6th Street & Wakarusa Drive Clinton Parkway & Kasold Drive Morning Peak Evening Peak Morning Peak Evening Peak Morning Peak Evening Peak Morning Peak Evening Peak Morning Peak Evening Peak Volume per lane L T R Volume per Approach NB ,011 SB WB 266 1, ,484 EB 57 1, ,092 Total 836 3, ,225 NB ,360 SB WB 514 1, ,638 EB 110 1, ,934 Total 1,341 4, ,528 NB SB WB 4 1, ,380 EB 51 1, ,785 Total 542 3, ,866 NB SB WB 19 1, ,118 EB 52 1, ,810 Total 589 3, ,808 NB SB WB EB Total 445 1, ,540 NB ,252 SB ,473 WB EB ,226 Total 1,138 2, ,894 NB SB WB ,114 EB ,066 Total 906 1, ,374 NB SB WB ,568 EB ,085 Total 1,083 2, ,028 NB SB ,089 WB ,202 EB ,234 Total 925 2, ,228 NB 288 1, ,443 SB ,689 WB 227 1, ,408 EB ,370 Total 1,407 4,320 2,183 7,
181 Spillover Sites 1 Month after Study at 23 rd Street & Alabama Street (Morning) Number of Vehicles Type of Vehicle Seconds into Red NB SB EB WB Time of Day (a.m.) : : : : : : : : : : : : : : : : : : : : :37 1 Month after Study at 23 rd Street & Alabama Street (Evening) Number of Vehicles Type of Seconds Vehicle into Red NB SB EB WB : : : : : : : : : : : : : :16 Time of Day (p.m.) 169
182 1 Month after Study at 19 th Street & Louisiana Street (Morning) Number of Vehicles Type of Vehicle Seconds into Red NB SB EB WB Time of Day (a.m.) : : : : : : : : : :08 1 Month after Study at 19 th Street & Louisiana Street (Evening) Number of Vehicles Type of Vehicle Seconds into Red NB SB EB WB Time of Day (p.m.) : : : : : : : : : : : : : : : :41 170
183 1 Month after Study at 25 th Street & Iowa Street (Morning) Number of Vehicles Type of Vehicle Seconds into Red NB SB EB WB Time of Day (a.m.) : : : : :59 1 Month after Study at 25 th Street & Iowa Street (Evening) Number of Vehicles Type of Vehicle Seconds into Red NB SB EB WB Time of Day (p.m.) : : : :53 1 Month after Study at 19 th Street & Iowa Street (Morning) Number of Vehicles Type of Vehicle Seconds into Red NB SB EB WB Time of Day (a.m.) : : : : : : : :21 171
184 1 Month after Study at 19 th Street & Iowa Street (Evening) Number of Vehicles Type of Vehicle Seconds into Red NB SB EB WB Time of Day (p.m.) : : : : : : : : : : : : : : : : :42 1 Month after Study at 23rd Street & Ousdahl Road (Morning) Number of Vehicles Type of Vehicle Seconds into Red NB SB EB WB Time of Day (a.m.) :21 1 Month after Study at 23rd Street & Ousdahl Road (Evening) Number of Vehicles Type of Vehicle Seconds into Red NB SB EB WB Time of Day (p.m.) : : : : : :40 172
185 1 Month after Study at Clinton Parkway & Crestline Drive (Morning) Number of Type of Seconds Time of Day NB SB EB WB Vehicles Vehicle into Red (a.m.) : : : : :14 1 Month after Study at Clinton Parkway & Crestline Drive (Evening) Number of Type of Seconds Time of Day NB SB EB WB Vehicles Vehicle into Red (p.m.) : : : : :55 173
186 1 Month after Study Traffic Volume at Spillover Sites Intersection Period Approach 23rd Street & Ousdahl Road 19th Street & Iowa Street 19th Street & Louisiana Street Clinton Parkway & Crestline Drive Morning Peak Evening Peak Morning Peak Evening Peak Morning Peak Evening Peak Morning Peak Evening Peak Volume per lane L T R Volume per Approach NB SB WB 51 1, EB 94 1, ,779 Total 206 3, ,425 NB SB WB 106 2, EB 163 2, ,344 Total 453 4, ,534 NB 55 1, ,455 SB ,018 WB EB Total 336 2, ,110 NB 95 1, ,570 SB 157 1, ,745 WB EB Total 764 3, ,470 NB SB WB ,081 EB Total 579 1, ,490 NB SB WB ,619 EB ,109 Total 866 2, ,822 NB SB WB EB 140 1, ,794 Total 225 2, ,932 NB SB WB 85 2, ,178 EB 14 1, ,684 Total 244 3, ,
187 1 Month after Study Traffic Volume at Spillover Sites (Continuation) Intersection Period Approach 25th Street & Iowa Street 23rd Street & Alabama Street Morning Peak Evening Peak Morning Peak Evening Peak Volume per lane L T R Volume per Approach NB ,017 SB WB EB Total 129 1, ,927 NB 72 1, ,407 SB 43 1, ,563 WB EB Total 332 2, ,405 NB SB WB 51 1, ,626 EB 31 1, ,818 Total 208 3, ,791 NB SB WB 143 2, ,577 EB ,249 2,456 Total 403 2,651 2,437 5,
188 3 MONTHS AFTER STUDY RLR VIOLATIONS Treatment Sites 3 Months after Study at 23 rd Street & Louisiana Street (Morning) Number of Vehicles Type of Vehicle Seconds into Red NB SB EB WB Time of Day (a.m.) : : : : : : : : : : : :53 3 Months after Study at 23 rd Street & Louisiana Street (Evening) Number of Vehicles Type of Vehicle Seconds into Red NB SB EB WB Time of Day (p.m.) : : : : : : : : : : : : : : :39 176
189 3 Months after Study at 23 rd Street & Iowa Street (Morning) Number of Vehicles Type of Vehicle Seconds into Red NB SB EB WB Time of Day (a.m.) : : : : : : : : : : : : : : : :59 3 Months after Study at 23 rd Street & Iowa Street (Evening) Number of Vehicles Type of Vehicle Seconds into Red NB SB EB WB Time of Day (p.m.) : : : : : : : : : : : : : : : : : : : : : : : :47 177
190 1 Month after Study Traffic Volume at Treatment Sites Intersection Period Approach 23rd Street & Iowa Street 23rd Street & Louisiana Street Morning Peak Evening Peak Morning Peak Evening Peak Volume per lane L T R Volume per Approach NB ,110 SB WB ,076 EB 486 1, ,001 Total 1,174 3, ,042 NB ,139 SB 493 1,185-1,678 WB 519 1,497-2,016 EB 341 1, ,837 Total 1,596 4, ,670 NB SB WB 173 1, ,846 EB 211 1, ,818 Total 638 3, ,024 NB ,139 SB ,124 WB 511 2, ,664 EB 256 1, ,393 Total 1,229 5, ,
191 Control Sites 3 Months after Study at 6th Street & Kasold Drive (Morning) Number of Vehicles Type of Seconds Vehicle into Red NB SB EB WB : : : : : : : : : : : : :37 Time of Day (a.m.) 3 Months after Study at 6th Street & Kasold Drive (Evening) Number of Vehicles Type of Vehicle Seconds into Red NB SB EB WB Time of Day (p.m.) : : : : : : : : : : : : : : : : : : : : : : : : : :57 179
192 3 Months after Study at 31st Street & Iowa Street (Morning) Number of Type of Seconds Time of Day NB SB EB WB Vehicles Vehicle into Red (a.m.) : : : : : : : : : : : : : : : : : :31 3 Months after Study at 31st Street & Iowa Street (Evening) Number of Vehicles Type of Vehicle Seconds into Red NB SB EB WB Time of Day (p.m.) : : : :02' : : : : : : : : : : : : : : : : :34 180
193 3 Months after Study at 6th Street & Michigan Street (Morning) Number of Vehicles Type of Vehicle Seconds into Red NB SB EB WB Time of Day (a.m.) : : : : : : : : : :14 3 Months after Study at 6th Street & Michigan Street (Evening) Number of Vehicles Type of Vehicle Seconds into Red NB SB EB WB Time of Day (p.m.) : : : : : : : : : :58 3 Months after Study at 6th Street & Wakarusa Drive (Morning) Number of vehicles Type of Vehicle Seconds into Red NB SB EB WB Time of Day (a.m.) : : : : : : : : :47 181
194 3 Months after Study at 6th Street & Wakarusa Drive (Evening) Number of Vehicles Type of Vehicle Seconds into Red NB SB EB WB Time of Day (p.m.) : : : : : : :41 3 Months after Study at Clinton Parkway & Kasold Drive (Morning) Number of Vehicles Type of Vehicle Seconds into Red NB SB EB WB Time of Day (a.m.) : : : : : : : : : : : : : : : : : : : :21 182
195 3 Months after Study at Clinton Parkway & Kasold Drive (Evening) Number of Type of Seconds Time of Day NB SB EB WB Vehicles Vehicle into Red (p.m.) : : : : : : : : : : : : : : : : : : :34 183
196 3 Months after Study Traffic Volume at Control Sites Intersection Period Approach Volume per lane Volume per L T R approach NB SB Morning Peak WB 212 1, ,379 EB 61 1, ,766 6th Street Total 755 3, ,696 & NB ,275 Kasold Drive SB Evening Peak WB 233 1, ,516 EB 113 1, ,885 Total 956 3, ,252 6th Street & Michigan Street 31st Street & Iowa Street 6th Street & Wakarusa Drive Clinton parkway & Kasold Drive Morning Peak Evening Peak Morning Peak Evening Peak Morning Peak Evening Peak Morning Peak Evening Peak NB SB WB 8 1, ,553 EB 81 1, ,913 Total 585 3, ,206 NB SB WB 30 2, ,547 EB 56 1, ,016 Total 672 4, ,546 NB ,015 SB WB EB Total 476 1, ,807 NB ,482 SB 391 1, ,952 WB ,072 EB ,299 Total 1,318 3,263 1,224 5,805 NB SB WB ,121 EB Total 900 1, ,486 NB ,095 SB WB ,481 EB ,149 Total 1,079 2,112 1,045 4,236 NB SB ,139 WB ,413 EB ,879 Total 1,042 3,141 1,011 5,194 NB ,082 SB ,711 WB 216 1, ,652 EB 217 1, ,803 Total 1,382 4,197 1,669 7,
197 Spillover Sites 3 Months after Study at 23 rd Street & Alabama Street (Morning) Number of Vehicles Type of Vehicle Seconds into Red NB SB EB WB Time of Day (a.m.) : : : : : : : :54 3 Months after Study at 23 rd Street & Alabama Street (Evening) Number of Vehicles Type of Vehicle Seconds into Red NB SB EB WB Time of Day (p.m.) : : : : : : : :48 3 Months after Study at 19 th Street & Louisiana Street (Morning) Number of Vehicles Type of Seconds Vehicle into Red NB SB EB WB : : : : : : : : : :24 Time of Day (a.m.) 185
198 3 Months after Study at 19 th Street & Louisiana Street (Evening) Number of Vehicles Type of Vehicle Seconds into Red NB SB EB WB Time of Day (p.m.) : : : : : : : : : :50 3 Months after Study at 25 th Street & Iowa Street (Morning) Number of Vehicles Type of Seconds Vehicle into Red NB SB EB WB : : : : : :33 Time of Day (a.m.) 3 Months after Study at 25 th Street & Iowa Street (Evening) Number of Vehicles Type of Vehicle Seconds into Red NB SB EB WB Time of Day (p.m.) : : : : : : :27 186
199 3 Months after Study at 19 th Street & Iowa Street (Morning) Number of Vehicles Type of Vehicle Seconds into Red NB SB EB WB Time of Day (a.m.) : : : : : : : : : : :21 3 Months after Study at 19 th Street & Iowa Street (Evening) Number of Vehicles Type of Vehicle Seconds into Red NB SB EB WB Time of Day (p.m.) : : : : : : : : : : : : : :55 187
200 3 Months after Study at 23rd Street & Ousdahl Road (Morning) Number of Vehicles Type of Vehicle Seconds into Red NB SB EB WB Time of Day (a.m.) : : : : : : :48 3 Months after Study at 23rd Street & Ousdahl Road (Evening) Number of Vehicles Type of Vehicle Seconds into Red NB SB EB WB Time of Day (p.m.) : : :37 3 Months after Study at Clinton Parkway & Crestline Drive (Morning) Number of Type of Seconds Time of Day NB SB EB WB Vehicles Vehicle into Red (a.m.) : : : : : : : :53 3 Months after Study at Clinton Parkway & Crestline Drive (Evening) Number of Vehicles Type of Vehicle Seconds into Red NB SB EB WB Time of Day (p.m.) :57 188
201 3 Months after Study Traffic Volume at Spillover Sites Intersection Period Approach 23rd Street & Ousdahl Road 19th Street & Iowa Street 19th Street & Louisiana Street Clinton Parkway & Crestline Drive Morning Peak Evening Peak Morning Peak Evening Peak Morning Peak Evening Peak Morning Peak Evening Peak Volume per lane L T R Volume per Approach NB SB WB 44 1, ,376 EB 232 1, ,864 Total 383 3, ,682 NB SB WB 106 1, ,958 EB 113 1, ,078 Total 405 3, ,656 NB 67 1, ,756 SB ,133 WB EB Total 817 2, ,856 NB 108 1, ,786 SB 251 1, ,905 WB ,275 EB Total 1,033 3, ,452 NB SB WB ,221 EB Total 670 1, ,765 NB SB WB 630 1, ,722 EB ,103 Total 952 2, ,967 NB SB WB 60 1, ,194 EB 306 2, ,451 Total 434 3, ,855 NB SB WB 98 2, ,477 EB 46 1, ,828 Total 428 4, ,
202 3 Months after Study Traffic Volume at Spillover Sites (Continuation) Intersection Period Approach 25th Street & Iowa Street 23rd Street & Alabama Street Morning Peak Evening Peak Morning Peak Evening Peak Volume per lane L T R Volume per Approach NB 42 1, ,194 SB WB EB Total 159 1, ,122 NB 69 1, ,373 SB 52 1, ,563 WB EB Total 311 2, ,356 NB SB WB 60 1, ,776 EB 82 1, ,999 Total 204 3, ,988 NB SB WB 133 2, ,546 EB 73 2, ,611 Total 393 4, ,

203 Appendix C Press Releases 191
Evaluation of Blue Confirmation Lights on Red Light Running at Signalized Intersections in. Lawrence, Kansas: A Case Study Kwaku Frimpong Boakye
 Evaluation of Blue Confirmation Lights on Red Light Running at Signalized Intersections in Lawrence, Kansas: A Case Study By 2014 Kwaku Frimpong Boakye Submitted to the graduate degree program in Civil,
Evaluation of Blue Confirmation Lights at Signalized Intersections in Overland Park, Kansas, to Reduce Red Light Running Violations
 Report No. K-TRAN: KU-13-5 FINAL REPORT October 2015 Evaluation of Blue Confirmation Lights at Signalized Intersections in Overland Park, Kansas, to Reduce Red Light Running Violations Tomás E. Lindheimer
THE VALUE OF CONFIRMATION LIGHTS AND THEIR UNINTENDED IMPACT ON DRIVER COMPLIANCE AND/OR DETERRENCE TO RUN A RED LIGHT
 0 THE VALUE OF CONFIRMATION LIGHTS AND THEIR UNINTENDED IMPACT ON DRIVER COMPLIANCE AND/OR DETERRENCE TO RUN A RED LIGHT Kwaku F. Boakye *, Eric J. Fitzsimmons, Steven D. Schrock and Tomas E. Lindheimer
Crash Analysis of I-64 Closure in St. Louis County
 Report # MATC-MST: 341 Final Report 25-1121-0001-341 Crash Analysis of I-64 Closure in St. Louis County Ghulam H. Bham, Ph.D. Professor Department of Civil, Architectural, and Environmental Engineering
Texas Transportation Institute The Texas A&M University System College Station, Texas
 1. Report No. FHWA/TX-05/0-4084-P1 4. Title and Subtitle GUIDELINES FOR THE USE OF COUNTERMEASURES TO REDUCE CRASHES ON APPROACHES TO SIGNALIZED INTERSECTIONS NEAR VERTICAL CURVES 2. Government Accession
Toolbox of Countermeasures and Their Potential Effectiveness to Make Intersections Safer
 8 Toolbox of Countermeasures and Their to Make Intersections Safer Introduction Studies included in the NCHRP 17-18 (3), Guidance for Implementation of the AASHTO Strategic Highway Safety Plan, as well
Driver Behavior Characteristics at Urban Signalized Intersections
 Schattler and Datta Page 0 Driver Behavior Characteristics at Urban Signalized Intersections Kerrie L. Schattler, Ph.D. Assistant Professor Department of Civil and Environmental Engineering Wayne State
Evaluation of LED-Outlined Backplates at Intersections With Light Rail Lines In Houston, Texas
 Evaluation of LED-Outlined Backplates at Intersections With Light Rail Lines In Houston, Texas ITS Texas Annual Meeting, November 2015 Jonathan Tydlacka, P.E. (TTI) Why Are We Here Today? Great forum to
Recent U.S. Research on Safety Evaluation of Low-Cost Road Engineering Safety Countermeasures Lessons for Canada
 Recent U.S. Research on Safety Evaluation of Low-Cost Road Engineering Safety Countermeasures Lessons for Canada Bhagwant Persaud Department of Civil Engineering, Ryerson University 350 Victoria Street,
DOT HS September Crash Factors in Intersection-Related Crashes: An On-Scene Perspective
 DOT HS 811 366 September 2010 Crash Factors in Intersection-Related Crashes: An On-Scene Perspective DISCLAIMER This publication is distributed by the U.S. Department of Transportation, National Highway
Abstract. Background. protected/permissive operation. Source: Google Streetview, Fairview/Orchard intersection
 ITE 2015 Western District Annual Meeting Ada County Highway District s Flashing Yellow Arrow Initiative Primary Author: Tim Curns, PE Ada County Highway District Traffic Engineer Author: Andrew Cibor,
Subject: Use of Pull-off Areas in Work Zones Page: 1 of 13. Brief Description: Guidance for the use and placement of pull-off area in work zones.
 6 - G2 Subject: Use of Pull-off Areas in Work Zones Page: 1 of 13 MdMUTCD REF. NO. None Date Issued: 09/09 Effective Date: 09/09 Brief Description: Guidance for the use and placement of pull-off area in
PERFORMANCE OF THE ADVANCE WARNING FOR END OF GREEN SYSTEM (AWEGS) FOR HIGH SPEED SIGNALIZED INTERSECTIONS
 FOR HIGH SPEED SIGNALIZED INTERSECTIONS") PERFORMANCE OF THE ADVANCE WARNING FOR END OF GREEN SYSTEM (AWEGS) FOR HIGH SPEED SIGNALIZED INTERSECTIONS Submitted for 2007 Technical Paper Award Texas District of the Institute of Transportation Engineers
PERFORMANCE OF THE ADVANCE WARNING FOR END OF GREEN SYSTEM (AWEGS) FOR HIGH SPEED SIGNALIZED INTERSECTIONS Submitted for 2007 Technical Paper Award Texas District of the Institute of Transportation Engineers
Florida s Intersection Safety Implementation Plan (ISIP)
") Florida Department of TRANSPORTATION Florida s Intersection Safety Implementation Plan (ISIP) Alan El-Urfali, PE State Traffic Engineering and Operations Office March 28, 2017 Intersection Safety Implementation
Florida Department of TRANSPORTATION Florida s Intersection Safety Implementation Plan (ISIP) Alan El-Urfali, PE State Traffic Engineering and Operations Office March 28, 2017 Intersection Safety Implementation
Yellow and Red Intervals It s Just a Matter of Time. 58 th Annual Alabama Transportation Conference February 9, 2015
 Yellow and Red Intervals It s Just a Matter of Time 58 th Annual Alabama Transportation Conference February 9, 2015 Presentation Content Background on Timing Methodology Findings and Recommendations from
Overview. Updated pictures of the intersection are shown in Exhibits 1 thru 4, and the aerial photo provided by Google Maps is shown in Exhibit 5.
 Overview The (here in after referred to as the Village ) is submitting the follow up interim RLRC Safety Report for the intersection of Lincoln Highway (US 30) at Orchard Drive. Additional reports, as
Chapter V TRAFFIC CONTROLS. Tewodros N.
 Chapter V TRAFFIC CONTROLS www.tnigatu.wordpress.com tedynihe@gmail.com Lecture Overview Traffic markings Longitudinal markings Transverse markings Object markers and delineator Traffic signs Regulatory
ENHANCED PARKWAY STUDY: PHASE 2 CONTINUOUS FLOW INTERSECTIONS. Final Report
 Preparedby: ENHANCED PARKWAY STUDY: PHASE 2 CONTINUOUS FLOW INTERSECTIONS Final Report Prepared for Maricopa County Department of Transportation Prepared by TABLE OF CONTENTS Page EXECUTIVE SUMMARY ES-1
FYG Backing for Work Zone Signs
 Report Title Report Date: 2001 FYG Backing for Work Zone Signs Principle Investigator Name Kamyab, Ali Affiliation Western Transportation Institute Address c/o Caltrans, 1227 O Street, 5th Floor Sacramento,
INSURANCE INSTITUTE FOR HIGHWAY SAFETY 1005 NORTH GLEBE ROAD ARLINGTON, VA PHONE 703/ FAX 703/
 Statement before the Virginia House of Delegates Militia, Police, and Public Safety Committee Red light violations and red light cameras Stephen L. Oesch INSURANCE INSTITUTE FOR HIGHWAY SAFETY 1005 NORTH
Lf Wv-11 L_ Mario Dupigny-G iroux, P.E. Traffic Safety Engineer. ja WTtffiti. _J~?feL. \~tk 1pp Research Technician
 Activated Approach Flasher System Final Report October 2009 Report 2009-11 Reporting on Work Plan No. W P 2006-R-1 State of Vermont Agency of Transportation Materials and Research Section Prepared by:
Acknowledgements. Mr. David Nicol 3/23/2012. Daniel Camacho, P.E. Highway Engineer Federal Highway Administration Puerto Rico Division
 Daniel Camacho, P.E. Highway Engineer Federal Highway Administration Puerto Rico Division Acknowledgements Mr. David Nicol Director, FHWA Office of Safety FHWA Office of Safety http://safety.fhwa.dot.gov/provencountermeasures/
1.3.4 CHARACTERISTICS OF CLASSIFICATIONS
 Geometric Design Guide for Canadian Roads 1.3.4 CHARACTERISTICS OF CLASSIFICATIONS The principal characteristics of each of the six groups of road classifications are described by the following figure
A Traffic Operations Method for Assessing Automobile and Bicycle Shared Roadways
 A Traffic Operations Method for Assessing Automobile and Bicycle Shared Roadways A Thesis Proposal By James A. Robertson Submitted to the Office of Graduate Studies Texas A&M University in partial fulfillment
The Effect of Pavement Marking on Speed. Reduction in Exclusive Motorcycle Lane. in Malaysia
 Contemporary Engineering Sciences, Vol. 3, 2010, no. 3, 149-155 The Effect of Pavement Marking on Speed Reduction in Exclusive Motorcycle Lane in Malaysia Seyed Farzin Faezi PhD student in highway and
GUIDELINES FOR USING DECISION SIGHT DISTANCE AT IGNALIZED INTERSECTIONS NEAR VERTICAL CURVES
 1. Report No. FHWA/TX-05/0-4084-P2 4. Title and Subtitle 2. Government Accession No. 3. Recipient's Catalog No. GUIDELINES FOR USING DECISION SIGHT DISTANCE AT IGNALIZED INTERSECTIONS NEAR VERTICAL CURVES
INSURANCE INSTITUTE FOR HIGHWAY SAFETY 1005 NORTH GLEBE ROAD ARLINGTON, VA PHONE 703/ FAX 703/
 Statement before the Virginia House of Delegates Militia, Police, and Public Safety Committee Red light violations and red light cameras Stephen L. Oesch INSURANCE INSTITUTE FOR HIGHWAY SAFETY 1005 NORTH
Evaluation of Large-Truck Fixed-Object Crashes at Bridge Structures in Kansas
 Report # MATC-KU: 466 Final Report 25-1121-0001-466 Evaluation of Large-Truck Fixed-Object Crashes at Bridge Structures in Kansas Steven D. Schrock, Ph.D., P.E. Associate Professor Civil, Environmental,
Traffic Impact Study. Westlake Elementary School Westlake, Ohio. TMS Engineers, Inc. June 5, 2017
 TMS Engineers, Inc. Traffic Impact Study Westlake Elementary School Westlake, Ohio June 5, 2017 Prepared for: Westlake City Schools - Board of Education 27200 Hilliard Boulevard Westlake, OH 44145 TRAFFIC
HSIS. Association of Selected Intersection Factors With Red-Light-Running Crashes. State Databases Used SUMMARY REPORT
 HSIS HIGHWAY SAFETY INFORMATION SYSTEM The Highway Safety Information Systems (HSIS) is a multi-state safety data base that contains accident, roadway inventory, and traffic volume data for a select group
Module 3 Developing Timing Plans for Efficient Intersection Operations During Moderate Traffic Volume Conditions
 Module 3 Developing Timing Plans for Efficient Intersection Operations During Moderate Traffic Volume Conditions CONTENTS (MODULE 3) Introduction...1 Purpose...1 Goals and Learning Outcomes...1 Organization
Texas Intersection Safety Implementation Plan Workshop JUNE 2, 2016
 Texas Intersection Safety Implementation Plan Workshop JUNE 2, 2016 Why Intersection Safety? A small part of overall highway system, but Each year roughly 50% of all crashes estimated 3 million involve
Chapter 5 DATA COLLECTION FOR TRANSPORTATION SAFETY STUDIES
 Chapter 5 DATA COLLECTION FOR TRANSPORTATION SAFETY STUDIES 5.1 PURPOSE (1) The purpose of the Traffic Safety Studies chapter is to provide guidance on the data collection requirements for conducting a
An analysis of driver behavior in response to warning beacon installations on stop signs
 Graduate Theses and Dissertations Iowa State University Capstones, Theses and Dissertations 2018 An analysis of driver behavior in response to warning beacon installations on stop signs Qilin Liu Iowa
WEST AVENUE AND NEW ROAD TRAFFIC STUDY PART III WEST AVENUE CLOSURE ALTERNATIVES ANALYSIS
 WEST AVENUE AND NEW ROAD TRAFFIC STUDY PART III WEST AVENUE CLOSURE ALTERNATIVES ANALYSIS CITY OF LINWOOD ATLANTIC COUNTY, NEW JERSEY March 30, 2006 PREPARED FOR: City of Linwood 400 Poplar Avenue Linwood,
Significant Changes to California's Yellow Signal Timing Protocols
 Significant Changes to California's Yellow Signal Timing Protocols Previous Yellow Interval Timing Rules Permitted to use posted speed limit or prima facie speed limit in calculating the minimum yellow
INTRADEPARTMENTAL CORRESPONDENCE. The Honorable Board of Police Commissioners
 INTRADEPARTMENTAL CORRESPONDENCE April 19, 2011 TO: FROM: Chief of Police SUBJECT: ANALYSIS OF JAY BEEBER'S REPORT ENTITLED "SAFER STREETS IN LOS ANGELES: WHY ENGINEERING COUNTERMEASURES ARE MORE EFFECTIVE
SPEED PROFILES APPROACHING A TRAFFIC SIGNAL
 SPEED PROFILES APPROACHING A TRAFFIC SIGNAL Robert L. Bleyl*, The University of New Mexico The objective of this study was to examine and compare the speed profiles of traffic approaching a traffic signal
POWELL BUTTE HIGHWAY/NEFF ROAD INTERSECTION Interim Report: Existing Conditions, Needs, and Alternatives Review
 POWELL BUTTE HIGHWAY/NEFF ROAD INTERSECTION Interim Report: Existing Conditions, Needs, and Alternatives Review Date: December 30, 2013 Project #: 13963.0 To: Chris Doty PE and George Kolb, Deschutes County
Road Safety Assessments. Lt. Bob McCurdy Williamson County Sheriff s s Office Marion, IL.
 Road Safety Assessments Lt. Bob McCurdy Williamson County Sheriff s s Office Marion, IL. Why Are We Here? 2005 US Traffic Fatalities = 43,443 1429 4329 1361 1616 1534 3504 1729 3543 Illinois Annual Fatallities
PLACEMENT OF SIGNS RECOMMENDED PRACTICES SUB-SECTION
 Page 1 of 6 RECOMMENDED PRACTICES PART SECTION SUB-SECTION HIGHWAY SIGNS GENERAL General Proper positioning of signs is an important element in the overall control of traffic within a roadway network.
Development of Left-Turn Operations Guidelines at Signalized Intersections
 TxDOT 0-5840-1 http://itri.tsu.edu/reports/txdot_5840-r1.pdf Development of Left-Turn Operations Guidelines at Signalized Intersections August 2008 By Lei Yu, Ph.D., P.E., Yi Qi, Ph.D. Hongxi Yu Lei Guo
Appendix A: Crosswalk Policy
 Appendix A: Crosswalk Policy Appendix A: Crosswalk Policy Introduction This citywide Crosswalk Policy is aimed at improving pedestrian safety and enhancing pedestrian mobility by providing a framework
Traffic Signal Redesign 50% Design Report
 Traffic Signal Redesign 50% Design Report Joseph Davis, Jace Elkins, Jordan Weyrauch and Zach Crimmins CENE 486 Capstone J3Z Engineering March 10 th, 2016 Table of Contents 1.0 Project Description...1
Complete Street Analysis of a Road Diet: Orange Grove Boulevard, Pasadena, CA
 Complete Street Analysis of a Road Diet: Orange Grove Boulevard, Pasadena, CA Aaron Elias, Bill Cisco Abstract As part of evaluating the feasibility of a road diet on Orange Grove Boulevard in Pasadena,
Project Report. South Kirkwood Road Traffic Study. Meadows Place, TX October 9, 2015
 Meadows Place, TX October 9, 2015 Contents 1 Introduction... 1 2 Data Collection... 1 3 Existing Roadway Network... 2 4 Traffic Volume Development... 2 5 Warrant Analysis... 3 6 Traffic Control Alternative
Evaluation of M-99 (Broad Street) Road Diet and Intersection Operational Investigation
 Road Diet and Intersection Operational Investigation") Evaluation of M-99 (Broad Street) Road Diet and Intersection Operational Investigation City of Hillsdale, Hillsdale County, Michigan June 16, 2016 Final Report Prepared for City of Hillsdale 97 North Broad
Evaluation of M-99 (Broad Street) Road Diet and Intersection Operational Investigation City of Hillsdale, Hillsdale County, Michigan June 16, 2016 Final Report Prepared for City of Hillsdale 97 North Broad
Effects of Traffic Signal Retiming on Safety. Peter J. Yauch, P.E., PTOE Program Manager, TSM&O Albeck Gerken, Inc.
 Effects of Traffic Signal Retiming on Safety Peter J. Yauch, P.E., PTOE Program Manager, TSM&O Albeck Gerken, Inc. Introduction It has long been recognized that traffic signal timing can have an impact
City of Elizabeth City Neighborhood Traffic Calming Policy and Guidelines
 City of Elizabeth City Neighborhood Traffic Calming Policy and Guidelines I. Purpose: The City of Elizabeth City is committed to ensure the overall safety and livability of residential neighborhoods. One
HEADWAY AND SAFETY ANALYSIS OF SPEED LAW ENFORCEMENT TECHNIQUES IN HIGHWAY WORK ZONES
 HEADWAY AND SAFETY ANALYSIS OF SPEED LAW ENFORCEMENT TECHNIQUES IN HIGHWAY WORK ZONES Ming-Heng Wang*, Ph.D. Post Doctoral Researcher Transportation Research Institute The University of Kansas 2160 Learned
EVALUATION OF DAYTIME VS. NIGHTTIME RED LIGHT RUNNING USING AN ADVANCED WARNING FOR END OF GREEN PHASE SYSTEM. A Thesis KWAKU ODURO OBENG-BOAMPONG
 EVALUATION OF DAYTIME VS. NIGHTTIME RED LIGHT RUNNING USING AN ADVANCED WARNING FOR END OF GREEN PHASE SYSTEM A Thesis by KWAKU ODURO OBENG-BOAMPONG Submitted to the Office of Graduate Studies of Texas
Recently Developed Intersection CMFs. Nancy Lefler, VHB ATSIP Traffic Records Forum, 2014
 Recently Developed Intersection CMFs Nancy Lefler, VHB ATSIP Traffic Records Forum, 2014 Overview General Methodology Treatments Installation of traffic signals - with and without left-turn lanes (NCDOT)
Access Location, Spacing, Turn Lanes, and Medians
 Design Manual Chapter 5 - Roadway Design 5L - Access Management 5L-3 Access Location, Spacing, Turn Lanes, and Medians This section addresses access location, spacing, turn lane and median needs, including
133 rd Street and 132 nd /Hemlock Street 132 nd Street and Foster Street MINI ROUNDABOUTS. Overland Park, Kansas
 133 rd Street and 132 nd /Hemlock Street 132 nd Street and Foster Street MINI ROUNDABOUTS Overland Park, Kansas September 1, 2017 TABLE OF CONTENTS 1. INTRODUCTION... 1 2. LITERATURE REVIEW... 1 3. CONCEPT
IMPROVING SAFETY AT SIGNALIZED INTERSECTIONS NEAR ERTICAL CURVES
 1. Report No. FHWA/TX-05/0-4084-1 4. Title and Subtitle 2. Government Accession No. 3. Recipient's Catalog No. IMPROVING SAFETY AT SIGNALIZED INTERSECTIONS NEAR ERTICAL CURVES Technical Report Documentation
A plan for improved motor vehicle access on Railroad Avenue in Provincetown
 A plan for improved motor vehicle access on Railroad Avenue in Provincetown February 2011 A plan for improved motor vehicle access on Railroad Avenue in Provincetown INTRODUCTION AND PROBLEM IDENTIFICATION
4/27/2016. Introduction
 EVALUATING THE SAFETY EFFECTS OF INTERSECTION SAFETY DEVICES AND MOBILE PHOTO ENFORCEMENT AT THE CITY OF EDMONTON Karim El Basyouny PhD., Laura Contini M.Sc. & Ran Li, M.Sc. City of Edmonton Office of
Engineering Countermeasures for Transportation Safety. Adam Larsen Safety Engineer Federal Highway Administration
 Engineering Countermeasures for Transportation Safety Adam Larsen Safety Engineer Federal Highway Administration 360-619-7751 Adam.Larsen@DOT.GOV Countermeasure Selection Resources Manual for Selecting
2009 Manual on Uniform Traffic Control Devices
 2009 Manual on Uniform Traffic Control Devices Tori Brinkly, PE Highway Safety Engineer WFL-FHWA April 20, 2010 Paragraphs are numbered. Standard Statements are bolded. Guidance statements are italicized.
Developed by: The American Traffic Safety Services Association (ATSSA) 15 Riverside Parkway, Suite 100 Fredericksburg, VA
 15 Riverside Parkway, Suite 100 Fredericksburg, VA") Addendum Developed by: The American Traffic Safety Services Association (ATSSA) 15 Riverside Parkway, Suite 100 Fredericksburg, VA 22406-1022 800-272-8772 This material is based upon work supported by
Addendum Developed by: The American Traffic Safety Services Association (ATSSA) 15 Riverside Parkway, Suite 100 Fredericksburg, VA 22406-1022 800-272-8772 This material is based upon work supported by
METHODOLOGY. Signalized Intersection Average Control Delay (sec/veh)
") Chapter 5 Traffic Analysis 5.1 SUMMARY US /West 6 th Street assumes a unique role in the Lawrence Douglas County transportation system. This principal arterial street currently conveys commuter traffic
Chapter 5 Traffic Analysis 5.1 SUMMARY US /West 6 th Street assumes a unique role in the Lawrence Douglas County transportation system. This principal arterial street currently conveys commuter traffic
Public Opinion, Traffic Performance, the Environment, and Safety After Construction of Double-Lane Roundabouts
 Public Opinion, Traffic Performance, the Environment, and Safety After Construction of Double-Lane Roundabouts TRB 93 rd Annual Meeting Washington, D.C. January 15, 2014 Wen Hu, Ph.D. Intersection crashes
Synthesis of Safety For Traffic Operations. Leanna Belluz Transport Canada. Gerry Forbes, M.Eng., P.Eng., P.T.O.E. Intus Road Safety Engineering Inc.
 Synthesis of Safety For Traffic Operations Leanna Belluz Transport Canada Gerry Forbes, M.Eng., P.Eng., P.T.O.E. Intus Road Safety Engineering Inc. Paper prepared for presentation at the Traffic Operations
Access Management in the Vicinity of Intersections
 Access Management in the Vicinity of Intersections FHWA-SA-10-002 Technical Summary Photo: Ralph Bentley (used with permission) 0 Access Management is: The design, implementation and management of entry
Modern Roundabouts: a guide for application
 Modern Roundabouts: a guide for application Kentucky Community Transportation Innovation Academy 2005 The contents of this booklet reflect the views of the authors who are responsible for the facts and
Traffic Impact Analysis Chatham County Grocery Chatham County, NC
 Chatham County Grocery Chatham County, NC TABLE OF CONTENTS 1. INTRODUCTION... 1 1.1. Location and Study Area... 1 1.2. Proposed Land Use and Access... 2 1.3. Adjacent Land Uses... 2 1.4. Existing ways...
Saturation Flow Rate, Start-Up Lost Time, and Capacity for Bicycles at Signalized Intersections
 Transportation Research Record 1852 105 Paper No. 03-4180 Saturation Flow Rate, Start-Up Lost Time, and Capacity for Bicycles at Signalized Intersections Winai Raksuntorn and Sarosh I. Khan A review of
M-58 HIGHWAY ACCESS MANAGEMENT STUDY Mullen Road to Bel-Ray Boulevard. Prepared for CITY OF BELTON. May 2016
 M-58 HIGHWAY ACCESS MANAGEMENT STUDY Prepared for CITY OF BELTON By May 2016 Introduction Missouri State Highway 58 (M-58 Highway) is a major commercial corridor in the City of Belton. As development has
INTERSECTION SAFETY STUDY State Route 57 / Seville Road
 INTERSECTION SAFETY STUDY State Route 57 / Seville Road City of Wadsworth, Medina County, Ohio Prepared For: City of Wadsworth Engineering Department 120 Maple Street Wadsworth, OH 44281 Prepared By: GPD
Traffic Signal Phasing Study Summary & Staff Recommendations
 Traffic Signal Phasing Study Summary & Staff Recommendations Consultant Study by Skipper Consulting, Inc. Staff Committee Recommendations by Randy Pewitt, Executive Director of Emergency Mgt. and Safety
REDUCING COLLISIONS AT HIGH CRASH LOCATIONS
 REDUCING COLLISIONS AT HIGH CRASH LOCATIONS Presented by Nazir Lalani P.E. Traffex Engineers Inc. N_lalani@hotmail.com ACCIDENTS AND SAFETY Why is safety important? Safety components Who is responsible?
Glenn Avenue Corridor Traffic Operational Evaluation
 Glenn Avenue Corridor Traffic Operational Evaluation PREPARED FOR: THE CITY OF AUBURN PREPARED BY: DECEMBER 2007 Glenn Avenue Corridor Study--Auburn, Alabama TABLE OF CONTENTS Introduction... 1 Background
Chapter Twenty-eight SIGHT DISTANCE BUREAU OF LOCAL ROADS AND STREETS MANUAL
 Chapter Twenty-eight SIGHT DISTANCE BUREAU OF LOCAL ROADS AND STREETS MANUAL Jan 2006 SIGHT DISTANCE 28(i) Chapter Twenty-eight SIGHT DISTANCE Table of Contents Section Page 28-1 STOPPING SIGHT DISTANCE
Truck Climbing Lane Traffic Justification Report
 ROUTE 7 (HARRY BYRD HIGHWAY) WESTBOUND FROM WEST MARKET STREET TO ROUTE 9 (CHARLES TOWN PIKE) Truck Climbing Lane Traffic Justification Report Project No. 6007-053-133, P 101 Ι UPC No. 58599 Prepared by:
ANALYSIS OF SIGNALISED INTERSECTIONS ACCORDING TO THE HIGHWAY CAPACITY MANUAL FROM THE POINT OF VIEW OF THE PROCESSES APPLIED IN HUNGARY
 2nd Int. Symposium in Civil Engineering 1998 Budapest ANALYSIS OF SIGNALISED INTERSECTIONS ACCORDING TO THE HIGHWAY CAPACITY MANUAL FROM THE POINT OF VIEW OF THE PROCESSES APPLIED IN HUNGARY István Styevola
Characteristics of Traffic Accidents in Highway Work Zones
 Characteristics of Traffic Accidents in Highway Work Zones A DETAILED ANALYSIS OF WORK ZONE ACCIDENTS REPORTED ON NEW YORK STATE DEPARTMENT OF TRANSPORTATION CONSTRUCTION PROJECTS ESTABLISHED THE PREDOMINANT
Appendix B Warrants, Standards, and Guidelines for Traffic Control Devices used at Senior Citizen and Disabled Person Crossings
 Appendix B Warrants, Standards, and Guidelines for Traffic Control Devices used at Senior Citizen and Disabled Person Crossings B.1 General Minnesota Statute 169.215 and Highway Traffic Regulation 169.222
Military Road Safety Improvements
 Military Road Safety Improvements 26 th Road North to 31 st Street North SUMMARY OF DATA REVIEW AND PRELIMINARY RECOMMENDATIONS Prepared for: Department of Environmental Services Traffic Engineering and
TRANSPORTATION ANALYSIS REPORT US Route 6 Huron, Erie County, Ohio
 TRANSPORTATION ANALYSIS REPORT US Route 6 Huron, Erie County, Ohio December 12, 2012 Prepared for: The City of Huron 417 Main Huron, OH 44839 Providing Practical Experience Technical Excellence and Client
Introduction 4/28/ th International Conference on Urban Traffic Safety April 25-28, 2016 EDMONTON, ALBERTA, CANADA
 4/28/2016 EVALUATING THE SAFETY EFFECTS OF INTERSECTION SAFETY DEVICES AND MOBILE PHOTO ENFORCEMENT AT THE CITY OF EDMONTON Karim El Basyouny PhD., Laura Contini M.Sc. & Ran Li, M.Sc. City of Edmonton
Chapter 4 Traffic Analysis
 Chapter 4 Traffic Analysis PURPOSE The traffic analysis component of the K-68 Corridor Management Plan incorporates information on the existing transportation network, such as traffic volumes and intersection
If you have any questions or comments, please feel free to contact Jillian Massey at ext. 246 or
 241 Main Street / Hartford / Connecticut / 06106 Phone (860) 522-2217 / Fax (860) 724-1274 www.crcog.org To: From: CRCOG Transportation Committee Jillian Massey, Senior Transportation Planner Date: November
Proven Safety Countermeasures. FHWA Office of Safety January 12, :00 p.m. to 2:00 p.m. Eastern Time
 Proven Safety Countermeasures FHWA Office of Safety January 12, 2012 1:00 p.m. to 2:00 p.m. Eastern Time Introduction and Background While States should still be considering the application of all of the
TRAFFIC ACCIDENT ANALYSIS
 TRAFFIC ACCIDENT ANALYSIS Westheimer at Chimney Rock and Westheimer at Dunvale Prepared for Prepared by Klotz Associates, Inc. 1160 Dairy Ashford, Suite 500 Houston, Texas 77079 The preparation of this
CITY OF LOS ANGELES INTER-DEPARTMENTAL MEMORANDUM
 CITY OF LOS ANGELES INTER-DEPARTMENTAL MEMORANDUM Date: April 1, 219 To: Honorable City Council c/o City Clerk, Room 395, City Hall Attention: Honorable Mike Bonin, Chair, Transportation Committee From:
MEMORANDUM. Date: 9/13/2016. Citywide Crosswalk Policy
 MEMORANDUM Date: 9/13/2016 Re: Citywide Crosswalk Policy Foreword Through the s Circulation Element and Complete Streets Policy, it is the City s goal to promote walking trips and provide safe facilities
Kansas Department of Transportation Strategic Highway Safety Plan. Intersections
 Kansas Department of Transportation Strategic Highway Safety Plan Intersections Introduction The Federal Highway Administration (FHWA) defines an intersection as a planned point of conflict in the roadway
Final Report November Sponsored by Iowa Department of Transportation Midwest Transportation Consortium (InTrans Project )
") Evaluating the Effectiveness of Red Light Running Camera Enforcement in Cedar Rapids and Developing Guidelines for Selection and Use of Red Light Running Countermeasures Final Report November 2011 Sponsored
Evaluating the Effectiveness of Red Light Running Camera Enforcement in Cedar Rapids and Developing Guidelines for Selection and Use of Red Light Running Countermeasures Final Report November 2011 Sponsored
Memorandum MAR or in part.
 Interim U.& Department of Transportation federal Highway Administration Memorandum Correction issued 3/21/2018 Subject: - INFORMATION: MUTCD Approval for Optional Use of Pedestrian-Actuated Rectangular
MANUAL ON UNIFORM TRAFFIC CONTROL DEVICES INTRODUCTION
 2011 Edition Page I-1 MANUAL ON UNIFORM TRAFFIC CONTROL DEVICES INTRODUCTION 01 Traffic control devices shall be defined as all signs, signals, markings, and other devices used to regulate, warn, or guide
What Engineering Can Do for You! Low Cost Countermeasures for Transportation Safety
 What Engineering Can Do for You! Low Cost Countermeasures for Transportation Safety Adam Larsen Safety Engineer Federal Highway Administration 360-619-7751 Adam.Larsen@DOT.GOV Adam Larsen TTP Safety Engineer
Annual Progress Report from VDOT on the Effect of the Aging Population on State Agencies
 Annual Progress Report from VDOT on the Effect of the Aging Population on State Agencies HB 110 (2006 GA Session) Report to the Governor and General Assembly of Virginia Virginia Department of Transportation
THE INSTALLATION OF PRE-SIGNALS AT RAILROAD GRADE CROSSINGS
 THE INSTALLATION OF PRE-SIGNALS AT RAILROAD GRADE CROSSINGS Lisa D. Sherman, Kenneth J. Petraglia, P.E. INTRODUCTION Each signalized intersection adjacent to a highway-rail grade crossing presents the
Traffic Signal Design
 Traffic Signal Design Instructor: S. M. Mahdi Amiripour m.amiripour@gmail.com 2 Introduction Intersection is an area shared by two or more roads Designated for the vehicles to turn to different directions
Township Signing Practices
 Township Signing Practices The average Minnesota township has approximately 30 miles of roadway with an average of 6 total traffic signs per mile (both directions) 1 At a replacement cost of approximately
Traffic Impact Analysis Walton Acres at Riverwood Athletic Club Clayton, NC
 Traffic Impact Analysis Walton Acres at Riverwood Athletic Club Clayton, NC 1. TABLE OF CONTENTS INTRODUCTION...1 1.1. Site Location and Study Area...1 1.2. Proposed Land Use and Site Access...2 1.3.
Every time a driver is distracted,
 Walking on the Wild Side: Distracted Pedestrians and Traffic Safety Brendan J. Russo, Emmanuel James, Christopher Y. Aguilar, Edward J. Smaglik Every time a driver is distracted, including by their cellphone,
FEDERAL HIGHWAY ADMINISTRATION APPLICATION
 FEDERAL HIGHWAY ADMINISTRATION APPLICATION REQUEST FOR PERMISSION TO EXPERIMENT WITH A BICYCLE BOX INTERSECTION TREATMENT Submitted by: City of Columbus Department of Public Service Date: June 26, 2009
Safety and Design Alternatives for Two-Way Stop-Controlled Expressway Intersections
 Safety and Design Alternatives for Two-Way Stop-Controlled Expressway Intersections Thomas H. Maze Center for Transportation Research and Education Iowa State University 2901 South Loop Drive, Suite 3100
Safety at Rural Non-Signalized Intersections in Delaware
 DCT 226 Safety at Rural Non-Signalized Intersections in Delaware By REBECCA FREY ARDESHIR FAGHRI Civil and Environmental Engineering University of Delaware September 2012 Delaware Center for Transportation