Safety at Rural Non-Signalized Intersections in Delaware
|
|
|
- Alexandra Sims
- 5 years ago
- Views:
Transcription
1 DCT 226 Safety at Rural Non-Signalized Intersections in Delaware By REBECCA FREY ARDESHIR FAGHRI Civil and Environmental Engineering University of Delaware September 2012 Delaware Center for Transportation University of Delaware 355 DuPont Hall Newark, Delaware (302)
2 The Delaware Center for Transportation is a university-wide multi-disciplinary research unit reporting to the Chair of the Department of Civil and Environmental Engineering, and is co-sponsored by the University of Delaware and the Delaware Department of Transportation. DCT Staff Ardeshir Faghri Director Jerome Lewis Associate Director Ellen Pletz Earl Rusty Lee Matheu Carter Sandra Wolfe Assistant to the Director T 2 Program Coordinator T² Engineer Event Coordinator DCT Policy Council Natalie Barnhart, Co-Chair Chief Engineer, Delaware Department of Transportation Babatunde Ogunnaike, Co-Chair Dean, College of Engineering Delaware General Assembly Member Chair, Senate Highways & Transportation Committee Delaware General Assembly Member Chair, House of Representatives Transportation/Land Use & Infrastructure Committee Ajay Prasad Professor, Department of Mechanical Engineering Harry Shenton Chair, Civil and Environmental Engineering Michael Strange Director of Planning, Delaware Department of Transportation Ralph Reeb Planning Division, Delaware Department of Transportation Stephen Kingsberry Executive Director, Delaware Transit Corporation Shannon Marchman Representative of the Director of the Delaware Development Office James Johnson Executive Director, Delaware River & Bay Authority Holly Rybinski Project Manager-Transportation, AECOM Delaware Center for Transportation University of Delaware Newark, DE (302)

3 Safety at Rural Non-Signalized Intersections in Delaware SEPTEMBER 15, 2012 By: Rebecca Frey
4 Table of Contents 1. Abstract 1 2. Introduction Project Overview and Methodology Delaware 15 & Delaware Site Overview and Site Visit Observations Intersection Trends and Reason for Crash Analysis Suggested Countermeasures and Projected Effectiveness Cost/ Benefit Analysis Delaware 15 & Barratts Chapel Road Site Overview and Site Visit Observations Intersection Trends and Reason for Crash Analysis Suggested Countermeasures and Projected Effectiveness Cost/ Benefit Analysis Delaware 15 & Andrews Lake Road Site Overview and Site Visit Observations Intersection Trends and Reason for Crash Analysis Suggested Countermeasures and Projected Effectiveness Cost/ Benefit Analysis Delaware 30 & Mount Joy Road Site Overview and Site Visit Observations Intersection Trends and Reason for Crash Analysis Suggested Countermeasures and Projected Effectiveness Cost/ Benefit Analysis Delaware 30 & Zoar Road Site Overview and Site Visit Observations Intersection Trends and Reason for Crash Analysis...61
5 8.3. Suggested Countermeasures and Projected Effectiveness Cost/ Benefit Analysis Overall Observations and Conclusions..71 References..72
6 List of Figures Figure 1. Intersection locations 3 Figure 2. Delaware 10 and Delaware 15 location map...8 Figure 3. Delaware 15 and Barratts Chapel Road location map 19 Figure 4. Lane narrowing concept one (Source: Federal Highway Administration).29 Figure 5. Field view of lane narrowing concept one (Source: Federal Highway Administration)...29 Figure 6. Lane narrowing concept two (Source: Federal Highway Administration)...30 Figure 7. Field view of lane narrowing concept two (Source: Federal Highway Administration)...30 Figure 8. Combined lane narrowing concept (Source: Federal Highway Administration)...31 Figure 9. Delaware 15 and Andrews Lake Road location map.36 Figure 10. Delaware 30 and Mount Joy Road location map..50 Figure 11. Delaware 30 and Zoar Road location map...60
7 List of Tables Table 1. Types of crash at Delaware 10 & Delaware Table 2. Reason for crash summary at Delaware 10 & Delaware Table 3. Approach of driver responsible for crash at Delaware 10 & Delaware Table 4. Crash severity summary at Delaware 10 & Delaware Table 5. Time of day of crash summary at Delaware 10 & Delaware Table 6. Period of day of crashes at Delaware 10 & Delaware Table 7. Day of week of crashes at Delaware 10 & Delaware Table 8. Month of crash summary at Delaware 10 & Delaware Table 9. Age of drivers responsible for crash at Delaware 10 & Delaware Table 10. Age of all drivers involved in crashes at Delaware 10 & Delaware Table 11. Weather conditions during crashes at Delaware 10 & Delaware Table 12. Road conditions during crashes at Delaware 10 & Delaware Table 13. Alcohol related crashes at Delaware 10 & Delaware Table 14. Crash reduction due to roundabout conversion at Delaware 10 & Delaware Table 15. Monetary value of crash reduction for roundabout conversion at Delaware 15 & Delaware Table 16. Cost benefit analysis for roundabout at Delaware 10 & Delaware Table 17. Type of crash summary for Delaware 15 & Barratts Chapel Road...20 Table 18. Reason for crash summary at Delaware 15 & Barratts Chapel Road 21 Table 19. Approach of driver responsible for crash at Delaware 15 & Barratts Chapel Road..21 Table 20. Crash severity summary at Delaware 15 & Barratts Chapel Road...22 Table 21. Time of day of crashes at Delaware 15 & Barratts Chapel Road.. 22 Table 22. Period of day of crashes at Delaware 15 & Barratts Chapel Road 23 Table 23. Day of the week of crashes at Delaware 15 & Barratts Chapel Road...23 Table 24. Month of year of crashes at Delaware 15 & Barratts Chapel Road...24 Table 25. Age of drivers responsible for crash at Delaware 15 & Barratts Chapel Road.24
8 Table 26. Ages of all drivers involved in crashes at Delaware 15 & Barratts Chapel Road.25 Table 27. Weather conditions during crashes at Delaware 15 & Barratts Chapel Road Table 28. Road conditions during crashes at Delaware 15 & Barratts Chapel Road...25 Table 29. Alcohol related crashes at Delaware 15 & Barratts Chapel Road. 26 Table 30. Expected crash reduction for conversion to all way stop control at Delaware 15 & Barratts Chapel Road...27 Table 31. Expected crash reduction for conversion to roundabout at Delaware 15 & Barratts Chapel Road 28 Table 32. Expected crash reduction for lane narrowing concept at Delaware 15 & Barratts Chapel Road 32 Table 33. Monetary value of crash reduction for all way stop conversion at Delaware 15 & Barratts Chapel Road...33 Table 34. Monetary value of crash reduction for conversion to a roundabout at Delaware 15 & Barratts Chapel Road...34 Table 35. Expected monetary value of crash reduction for lane narrowing concept at Delaware 15 & Barratts Chapel Road 34 Table 36. Cost to benefit ratio for proposed Delaware 15 & Barratts Chapel countermeasures.35 Table 37. Type of crash at Delaware 15 & Andrews Lake Road..38 Table 38. Reason for crashes at Delaware 15 & Andrews Lake Road..38 Table 39. Approach direction of vehicle responsible for crash at Delaware 15 & Andrews Lake Road.38 Table 40. Crash severity at Delaware 15 & Andrews Lake Road. 39 Table 41. Time of day of crashes at Delaware 15 & Andrews Lake Road 40 Table 42. Day and night crash summary for Delaware 15 & Andrews Lake Road..40 Table 43. Day of week of crashes at Delaware 15 & Andrews Lake Road Table 44. Month of year of crashes at Delaware 15 & Andrews Lake Road 42 Table 45. Age of drivers responsible for crash at Delaware 15 & Andrews Lake Road...42 Table 46. Age of all drivers involved in crashes at Delaware 15 & Andrews Lake Road...43 Table 47. Weather during crashes at Delaware 15 & Andrews Lake Road..43
9 Table 48. Road conditions during crashes at Delaware 15 & Andrews Lake Road..43 Table 49. Alcohol related crashes at Delaware 15 & Andrews Lake Road...44 Table 50. Expected crashes with reduction of skew angle 45 Table 51. Expected crash reduction for addition of intersection lighting..45 Table 52. Monetary value of crash reduction for removal of skew angle at Delaware 15 & Andrews Lake Road.47 Table 53. Monetary value of crash reduction for installation of intersection lighting at Delaware 15 & Andrews Lake Road Table 54. Cost estimate for intersection realignment at Delaware 15 & Andrews Lake Road.48 Table 55. Cost to benefit ratio for proposed Delaware 15 & Andrews Lake Road countermeasures.49 Table 56. Type of crash summary at Delaware 30 & Mount Joy Road.51 Table 57. Reason for crash summary at Delaware 30 & Mount Joy Road 52 Table 58. Approach of driver responsible for crashes at Delaware 30 & Mount Joy Road..52 Table 59. Crash severity at Delaware 30 & Mount Joy Road...52 Table 60. Time of day of crash at Delaware 30 & Mount Joy Road.53 Table 61. Period of day of crashes at Delaware 30 & Mount Joy Road 54 Table 62. Day of week of crashes on Delaware 30 & Mount Joy Road 54 Table 63. Month of crashes at Delaware 30 & Mount Joy Road...54 Table 64. Age of drivers responsible for crashes at Delaware 30 & Mount Joy Road..55 Table 65. Age of all drivers involved in crashes at Delaware 30 & Mount Joy Road..55 Table 66. Weather conditions during crashes at Delaware 30 & Mount Joy Road...56 Table 67. Road conditions during crashes at Delaware 30 & Mount Joy Road 56 Table 68. Alcohol related crashes at Delaware 30 & Mount Joy Road.56 Table 69. Conversion to all way stop control at Delaware 30 & Mount Joy Road Table 70. Monetary value of crash reduction due to conversion to an all way stop at Delaware 30 & Mount Joy Road Table 71. Cost to benefit ratio of converting Delaware 30 & Mount Joy Road to a four way stop...59
10 Table 72. Types of crash summary at Delaware 30 & Zoar Road. 61 Table 73. Reason for crash summary at Delaware 30 & Zoar Road.62 Table 74. Approach of drivers responsible for crashes on Delaware 30 & Zoar Road.62 Table 75. Crash severity at Delaware 30 & Zoar Road.63 Table 76. Time of day of crashes at Delaware 30 & Zoar Road...63 Table 77. Period of day of crashes at Delaware 30 & Zoar Road.64 Table 78. Day of week of crashes at Delaware 30 & Zoar Road Table 79. Month of year of crashes at Delaware 30 & Zoar Road Table 80. Age of drivers responsible for crashes at Delaware 30 & Zoar Road...65 Table 81. Age of all drivers involved in crashes at Delaware 30 & Zoar Road...66 Table 82. Weather during crashes at Delaware 30 & Zoar Road..66 Table 83. Road conditions during crashes at Delaware 30 & Zoar Road.. 66 Table 84. Alcohol related crashes at Delaware 30 & Zoar Road Table 85. Conversion to all way stop control at Delaware 30 & Zoar Road. 68 Table 86. Highway Safety Manual crash modification factors for overhead flashing beacons...69 Table 87. Monetary value of crash reduction due to conversion to an all way stop at Delaware 30 & Zoar Road.70 Table 88. Cost to benefit ratio for converting Delaware 30 & Zoar Road to a four way stop..70
11 1. Abstract Delaware Department of Transportation (DelDOT) has identified five unsignalized intersections in rural areas of Delaware as locations with higher than average crash rates over the past three years. These intersections are Delaware 10 & Delaware 15, Delaware 15 & Barratts Chapel Road, Delaware 15 & Andrews Lake Road, Delaware 30 & Mount Joy Road, and Delaware 30 & Zoar Road. While none of these intersections meet the requirements for signalization, the purpose of this study is to identify countermeasures that can be used to improve safety at these intersections. The methodology used in this study begins with identifying what types of crashes are occurring at each intersection and why the crashes are occurring through review and statistical analysis of crash reports as well as intersection site visits. Through completing a comprehensive literature review of other studies of rural unsignalized intersection and following the methods dictated in the American Association of State Highway and Transportation Officials (AASHTO) Highway Safety Manual, countermeasures were identified to address the unique safety concerns of each intersection. To compare the expected effectiveness of each countermeasure, cost-benefit ratios were calculated for each countermeasure based on the estimated construction cost for the countermeasure and the projected crash reduction potential over ten years. At Delaware 10 & Delaware 15, conversion to a roundabout was the primary option analyzed because of the equal distribution of inadequate gap acceptance crashes at this location, and because plans are already underway at DelDOT to convert this intersection to a roundabout. At Delaware 15 & Barratts Chapel Road, conversion to a four-way stop, conversion to a roundabout, and employing a lane narrowing concept to draw attention to the intersection and reduce travel speeds were considered. Converting the intersection to a four-way stop was found 1
12 to have the greatest cost-benefit ratio. Delaware 15 & Andrews Lake Road experiences a large proportion of crashes at night, so adding lighting to the intersection and realigning the intersection to reduce the skew angle were suggested. Other low cost and less invasive options including checking the retroreflectivity of signs and pavement markings could also be beneficial at this intersection. It was determined that adding lighting to the intersection has a higher costbenefit ratio than realignment of the intersection. In February 2012, DelDOT converted Delaware 30 & Mount Joy Road and Delaware 30 & Zoar Road to four-way stops. Since these intersections had a problem with inadequate gap acceptance crashes, the analysis of these intersections suggest that the four-way stop conversion will be beneficial. The goal for the outcome of this report is to provide DelDOT with a clear comparison of potential options for safety improvement at these intersections. 2

13 2. Introduction This report is the result of a safety study of five intersections that were identified by Delaware Department of Transportation (DelDOT) as locations which have experienced a higher than average crash rate over the past three years. The intersections are Delaware 10 & Delaware 15, Delaware 15 & Barratts Chapel Road, Delaware 15 & Andrews Lake Road, Delaware 30 & Mount Joy Road, and Delaware 30 & Zoar Road. See Figure 1 below for the locations of these intersections in Delaware. Figure 1. Intersection locations All of these intersections are rural, non-signalized intersections that do not meet the requirements for signalization. The first three intersections, Delaware 10 & Delaware 15, Delaware 15 & Barratts Chapel Road, and Delaware 15 & Andrews Lake Road are located in Kent County. Delaware 30 & Mount Joy Road and Delaware 30 & Zoar Road are located in 3
14 Sussex County. The purpose of this study is to identify the factors that are causing crashes and recommend countermeasures that can be used to reduce the crash rate at these intersections. 4
15 3. Project Overview and Methodology The first step in this study is to determine the cause for the increased crash frequency at each of the intersections which can be accomplished through visiting the site, reviewing crash reports, and studying literature publications. Visiting the site of each intersection is an important early step in the process to observe what conditions drivers experience at the intersection. The Highway Safety Manual served as guidance for conducting site visits. As part of collecting data about each intersection, the intersection was traversed from each direction and the experience was compared with crash trends for the intersection. For example, sight distance from each approach to the intersection was noted and objects that obscure the view of the oncoming traffic were identified. Another factor to observe when performing a site visit to the intersection was any advanced warning of the intersection and visibility when approaching the intersection. Advanced warning of intersections can consist of signs, pavement markings, rumble strips, or flashing beacons. It is necessary to note the advanced warning measures located on both the main road and the cross road. Gap acceptance can be a challenge at rural, non-signalized intersections if the volume on the main road is large enough. When performing a site visit, the driver can see first-hand what ordinary drivers must contend with in order to find an acceptable gap. If acceptable gaps are infrequent, this could cause drivers to become impatient and decide to enter the intersection when conditions are not safe. Observing driver behavior at the intersection can provide valuable insight to driving trends at a particular location. An observer can look at the travel speed of the vehicles in comparison to the posted speed limit, the queue of vehicles that backup at a stop sign, or any other notable driver behavior factors. Crash reports from each of the five intersections where provided from DelDOT for three years prior to the study. These reports reveal vital data in determining the reason for crashes. 5
16 From the crash reports, information regarding the type of crash, time of the crash, reason for crash, weather conditions, and severity of crash can be analyzed. Through this information, trends are examined. The time of the day, the week of the month, and the month of the year of the crashes can be searched for patterns. The crash reports also list the birthdate of the drivers involved in the crash, so the ages of the drivers involved can be calculated. The reason for a crash can be determined from the crash report through the crash narrative. If the drivers are unable or unwilling to describe to the police officer who produced the crash report, information about which direction the vehicles in the crash were travelling is still available and can be used to make educated assertions about the cause of the crash. It is also useful to draw a crash diagram using the instruction in the Highway Safety Manual to get a visual representation of where the crashes typically occur at the intersection. The data collected from the crash reports was organized into tables and graphs that highlight common trends at each intersection. Once the causes of the crashes at each intersection are determined through gathering and analyzing the data, countermeasures must be identified to mediate the problems occurring at the intersections. For this step it is vital to review literature and other published studies to determine what countermeasures can be used for each type of problem experienced at the intersections. While one countermeasure may be very effective at one intersection, if the conditions are different at another intersection or the reason for crash is different, the same countermeasure may not result in the same level of success. The literature reviewed for this project includes studies from sources such as the US Department of Transportation Federal Highway Administration, Kansas State University, Texas Department of Transportation, Minnesota Department of Transportation, the Highway Safety Manual, and the Washington State Department of Transportation. 6
17 After potential countermeasures were selected, calculations were done to estimate the effectiveness of the countermeasures in terms of predicted yearly crash reduction. These calculations were performed using the predictive method and crash modification factors (CMFs) listed in the Highway Safety Manual. The final step of the study was to calculate the cost for each proposed improvements and determine a cost-benefit ratio from the previously determined crash reduction values to evaluate the alternatives. In calculating the expected benefits of a countermeasure, the Highway Safety Manual has determined that the cost to society of a property damage only crash is $7,400 and the cost of a fatality/ injury crash is $158,200. The benefits of the countermeasure were calculated over a period of 10 years using the expected crash reduction for each countermeasure and with an assumed discount rate of 4%. In order to determine the present value of the annual series of expected benefits Equation 1 was used where i represents the discount rate Equation 1 7

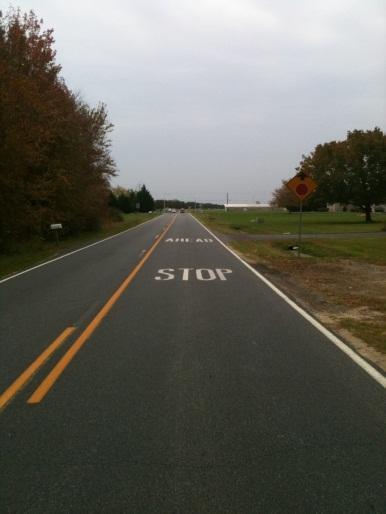
18 4. Delaware 10 & Delaware 15 Figure 2. Delaware 10 and Delaware 15 location map 4.1 Site Overview and Site Visit Observations Delaware 10 & Delaware 15 is a four way intersection located in Kent County south of Dover. Delaware 10 runs eastbound and westbound in the vicinity of the intersection and is named Willow Grove Road at this location. The northbound approach to the intersection on Delaware 15 is known as Dundee Road, and the southbound approach to the intersection on Delaware 15 is referred to as Moose Lodge Road. The major road is Delaware 10 which has an average annual daily traffic (AADT) value of 5,062 vehicles per day. Delaware 15 is stop controlled at the intersection and has an AADT value of 2,634 vehicles per day. The speed limit on Delaware 10 in the vicinity of the intersection is 50 miles per hour, and the speed limit on 8
19 Delaware 15 is 35 miles per hour. In the past three years, 25 crashes have occurred at this intersection. The site visit revealed that the volume of traffic on Delaware 10 is relatively fast moving and heavy which makes it difficult for drivers to safely cross the intersection. A short queue frequently builds up in the northbound and southbound approaches even at off peak hours due to drivers waiting to cross the intersection. The sight distance is limited from the southbound approach due to trees and signs to the left, and the sight distance is also obstructed from the northbound approach due to a silver utility box. The intersection appears roughly at grade with minimal horizontal curvature in the vicinity of the intersection. Lighting is installed at the intersection. Advanced warning for the intersection includes STOP AHEAD signs and pavement markings from the northbound and southbound approaches. The only warning of the approaching intersection from the eastbound and westbound approaches is a sign with the upcoming road names. There is one lane in each direction for all approaches. The eastbound and westbound approaches to the intersection have paved shoulders, but the northbound and southbound approaches do not have a paved shoulder. 4.2 Intersection Trends and Reasons for Crash Analysis The most common reason for crashes at Delaware 10 & Delaware 15 is drivers on a minor road approach who have difficulty selecting a safe gap in traffic when crossing the intersection, but rear end collisions are also common. Table 1 below shows the most common types of crashes at Delaware 10 & Delaware 15. 9
20 Table 1. Types of crash at Delaware 10 & Delaware 15 Type of Crash Frequency Percentage Failure to remain stopped 13 52% Rear end collision 5 20% Ran stop sign 3 12% Failure to yield right of way 2 8% Deer in roadway 1 4% Improper passing on right 1 4% The most common reasons for crashes cited by drivers at Delaware 10 & Delaware 15 were drivers who did approach the intersection from the northbound or southbound approaches and did not see the cross traffic or inattentive driving. Since the volume of traffic on Delaware 10 is high, inattentive drivers are likely to misjudge the amount of time needed to cross the intersection. See Table 2 below for a summary of the reasons for crashes at Delaware 10 & Delaware 15. Table 2. Reason for crash summary at Delaware 10 & Delaware 15 Reason for Crash Frequency Percentage Didn t see vehicle WB: 5 WB: 20% EB: 5 EB: 20% Inattentive driving 8 32% DUI 2 8% Unknown 2 8% Roadway conditions 1 4% Vehicle blocking view 1 4% Driver confusion 1 4% Table 3 shows a summary of the approach direction of drivers responsible for crashes. This information could identify significant issues with an approach to the intersection such as sight distance problems if a majority of crashes occurred from a specific approach. In the case of Delaware 10 & Delaware 15, a nearly equal amount of crashes occurred from the northbound 10
21 and southbound approach which suggests that there is not a particular problem at one approach to the intersection. Table 3. Approach of driver responsible for crash at Delaware 10 & Delaware 15 Approach Frequency Percentage Northbound 9 36% Southbound 10 40% Eastbound 5 20% Westbound 1 4% Table 4 below shows that more than half of the crashes occurring at the intersection of Delaware 10 & Delaware 15 are personal injury crashes. This is likely due to the fact that the speed limit on Delaware 10 is 50 mph so the traffic is moving quickly at the intersection and the majority of the crashes at the intersection are due to a collision of a vehicle entering the intersection from a minor road approach colliding with a vehicle on Delaware 10. Table 4. Crash severity summary at Delaware 10 & Delaware 15 Severity Frequency Percentage Property Damage Only 9 36% Personal Injury 16 64% Table 5 shows that crashes at Delaware 10 & Delaware 15 are occurring mainly during the daytime with higher rates during the traditional morning and afternoon peak hour periods. 11
22 Table 5. Time of day of crash summary at Delaware 10 & Delaware 15 Hour of Day Number Of Crashes Percentage 0:00-1:00 1 4% 1:00-2:00 2:00-3:00 3:00-4:00 4:00-5:00 5:00-6:00 6:00-7:00 7:00-8:00 2 8% 8:00-9:00 9:00-10:00 1 4% 10:00-11: % 11:00-12:00 1 4% 12:00-13:00 1 4% 13:00-14:00 2 8% 14:00-15:00 2 8% 15:00-16: % 16:00-17:00 17:00-18: % 18:00-19:00 1 4% 19:00-20:00 20:00-21:00 1 4% 21:00-22:00 1 4% 22:00-23:00 1 4% 23:00-24:00 Table 6 supports Table 5 in showing that the majority of the crashes at Delaware 10 & Delaware 15 occurred during the day. Table 6. Period of day of crashes at Delaware 10 & Delaware 15 Time of Day Number of Crashes Percentage Day 18 72% Night 5 20% Dusk 2 8% 12
23 Table 7 below shows that the highest number of crashes at this intersection occurred on Tuesday; however, the crashes appear to be roughly evenly distributed across all days of the week. Table 7. Day of week of crashes at Delaware 10 & Delaware 15 Day of Week Number of Crashes Percentage Sunday 2 8% Monday 3 12% Tuesday 6 24% Wednesday 2 8% Thursday 5 20% Friday 4 16% Saturday 3 12% Table 8 below shows that the months with the highest crash rate are June and August, but does not suggest any seasonal crash trends. Table 8. Month of crash summary at Delaware 10 & Delaware 15 Month of the Year Number of Crashes Percentage January 2 8% February 3 12% March 3 12% April 2 8% May 2 8% June 4 16% July 1 4% August 4 16% September 1 4% October November 2 8% December 1 4% Table 9 shows that younger drivers below the age of 30 are responsible for half of the crashes that occur at the intersection of Delaware 10 & Delaware 15. While this does appear to 13
24 be a significant trend, it is not specific to this intersection. Younger drivers are typically more inexperienced than older drivers and frequently have a higher crash rate than more experienced drivers. Elderly drivers do not appear to be causing a significant number of crashes at this intersection. Table 9. Age of drivers responsible for crash at Delaware 10 & Delaware 15 Age Number of Crashes Percentage % % % % % % 70 and older % Table 10 shows the ages of all people involved in the crashes. A higher proportion of the people involved in crashes are middle aged than are causing the crashes. Table 10. Age of all drivers involved in crashes at Delaware 10 & Delaware 15 Age Number of Crashes Percentage % % % % % % 70 and older % Unknown % clear. Table 11 demonstrates that the majority of the crashes occurred when the weather was 14
25 Table 11. Weather conditions during crashes at Delaware 10 & Delaware 15 Weather Number of Crashes Percentage Rainy 3 12% Cloudy 3 12% Clear 19 76% Table 12 shows that while a few of the crashes did occur when the roads were wet, road conditions do not appear to be a significant contributing factor to the cause of crash. Table 12. Road conditions during crashes at Delaware 10 & Delaware 15 Road Condition Number of Crashes Percentage Dry 20 80% Wet 5 20% Delaware 15. Table 13 shows that two crashes were attributed to alcohol impairment at Delaware 10 & Table 13. Alcohol related crashes at Delaware 10 & Delaware 15 Number of Crashes Percentage Alcohol Related 2 8% Not Alcohol Related 23 92% From the site visit and review of the crash reports at Delaware 10 & Delaware 15, it is suggested that gap acceptance problems resulting from the relatively heavy volume on both roads and due to inattentive driving and limited sight distance are the primary cause for crashes at the intersection. 15
26 4.3 Suggested Countermeasures and Projected Effectiveness DelDOT has proposed that the intersection of Delaware 10 & Delaware 15 be converted to a roundabout. Roundabouts are known to have a much lower crash rate than stop controlled intersections. In the case of Delaware 10 & Delaware 15, crashes are evenly distributed from both minor road approaches which supports the judgment that the volume and speed of traffic on Delaware 10 is one of the primary causes of inadequate gap acceptance crashes instead of poor roadway geometrics or sight distance at one approach. For a roundabout to be most effective, the traffic on both roads at the intersection should have similar volumes. While Delaware 10 has a greater volume than Delaware 15, Delaware 15 still has a significant volume given the rural location which should allow a roundabout at this location to function properly and achieve the desired safety improvements. According to the predictive method cited by the Highway Safety Manual, converting an intersection with minor road stop control into a rural, one lane roundabout has a CMF of 0.29 with a standard deviation of 0.04 for all crashes, and a CMF of 0.13 with a standard deviation of 0.01 for injury crashes. The main obstacles facing the roundabout conversion include public opposition to roundabouts because they are uncommon in the area, cost for construction, and expanded right-of-way needed. See Table 14 below for the expected crash reduction due to converting the intersection to a roundabout. Table 14. Crash reduction due to roundabout conversion at Delaware 10 & Delaware 15 Expected crashes per year with no treatment Expected crashes per year with roundabout conversion (95% confidence interval) All Crashes ( ) Injury ( ) 16
27 4.4 Cost/ Benefit Analysis Converting an intersection into a roundabout is an expensive and time consuming process, but the crash reduction potential is significant. Table 15 below shows the calculations of the expected monetary benefit to society per year from injury reduction resulting from converting the intersection to a roundabout. Table 15. Monetary value of crash reduction for roundabout conversion at Delaware 15 & Delaware 10 Type of Crash Fatality/ Injury Crashes Property Damage Only Crashes Current Crash Rate (per year) Crashes Prevented Through Countermeasure (per year) $734, $9,398 TOTAL $743,446 Monetary Benefit of Crash Reduction (per year) When applying the benefits over ten years using Equation 1, the expected benefit is calculated to be $6,030,013. The cost to convert a non-signalized intersection into a rural, one lane roundabout ranges from $200,000-$1,000,000. Since roundabouts require a greater amount of land than a typical four way intersection, it may be necessary to acquire additional right-of-way. If the center of the roundabout is landscaped it may require some yearly maintenance, but it is expected that a roundabout will have minimal maintenance costs over the first ten years following the construction. Therefore, the cost of the roundabout over ten years includes only the initial cost. See Table 16 for a summary of the monetary costs and benefits over ten years of converting Delaware 10 & Delaware 15 into a roundabout. 17
28 Table 16. Cost benefit analysis for roundabout at Delaware 10 & Delaware 15 Countermeasure Cost Benefits Cost: Benefit Ratio (Lower bound) Conversion to roundabout $200,000- $1,000,000 $6,030,013 1:6.0 1:30.2 Cost: Benefit Ratio (Upper Bound) As Table 16 shows, the benefits of converting Delaware 10 & Delaware 15 into a roundabout is expected to reap benefits of 6-12 times the initial cost of construction over a ten year period due to crash reduction. 18

29 5. Delaware 15 & Barratts Chapel Road Figure 3. Delaware 15 and Barratts Chapel Road location map 5.1 Site Overview and Site Visit Observations Delaware 15 & Barratts Chapel Road is located outside of Riverview, Delaware in Kent County. Delaware 15 is known as Canterbury Road in the vicinity of the intersection and runs in the north and south directions. Barratts Chapel Road is the westbound approach to the intersection, and the eastbound approach to the intersection is called Plymouth Road. Barratts Chapel Road and Plymouth Road have stop signs at the intersection with Delaware 15, but traffic on Delaware 15 does not stop at the intersection. The AADT on Delaware 15 is 4,333 vehicles per day, and the AADT on Barratts Chapel Road is 1,447 vehicles per day. The posted speed limit on the northbound and southbound approaches is 40 miles per hour, and the posted speed 19
30 limit on the eastbound and westbound approaches is 35 miles per hour. There have been fifteen crashes at the intersection of Delaware 15 & Barratts Chapel Road over the past three years. The intersection site visit revealed that sight distance from the eastbound and westbound approaches are less than ideal. Although the intersection is not lighted, there are flashing lights near the intersection. From the eastbound and westbound approaches, there are STOP AHEAD signs with yellow flashing lights and STOP AHEAD pavement markings as well as red flashing lights on the stop signs. From the northbound and southbound directions, there are intersection warning signs with red flashing lights. All approaches to the intersection are one lane in each direction with no turning lanes. Due to the relatively large volume of traffic on Delaware 15, finding an acceptable gap to cross or turn onto Delaware 15 proved difficult. 5.2 Intersection Trends and Reasons for Crash Analysis The most common type of crash at Delaware 15 & Barratts Chapel Road was the result of drivers stopped on the northbound or southbound approach stop signs who fail to wait for the cross traffic to clear before moving into the intersection. As Table 17 below indicates, the type of crashes at Delaware 15 & Barratts Chapel Road are diverse. Table 17. Type of crash summary for Delaware 15 & Barratts Chapel Road Type of Crash Frequency Percentage Failure to remain stopped % Ran off road % Driving on wrong side of road % Ran stop sign 1 6.7% Failure to yield right of way 1 6.7% Illegally parked vehicle 1 6.7% Careless driving 1 6.7% Improper turn 1 6.7% Unknown 1 6.7% 20
31 Table 18 shows the reasons for crash at Delaware 15 & Barratts Chapel Road. The most common reasons for crash are drivers who did not see the cross traffic which is in line with the most common crash type being failure to remain stopped at the stop sign. Similarly to Table 17, the reason for crashes is diverse with a considerable number of crashes with unknown causes. Table 18. Reason for crash summary at Delaware 15 & Barratts Chapel Road Reason for Crash Frequency Percentage Didn t see vehicle NB: % SB: % Driver thought gap was 1 6.7% acceptable DUI 1 6.7% Unfamiliar with road 1 6.7% Dark 1 6.7% Wet road 1 6.7% Driver fell asleep 1 6.7% Expected four way stop 1 6.7% Unknown % Table 19 below shows a summary of the approach direction of vehicles responsible for crashes. Nearly half of the crashes at this intersection occurred from the westbound approach. The number of crashes from the westbound approach is more than double the crashes from any of the other approaches. This data suggests that there may be a problem with the westbound approach to the intersection which is causing safety problems. Table 19. Approach of driver responsible for crash at Delaware 15 & Barratts Chapel Road Direction Frequency Percentage NB % SB 3 20% EB 3 20% WB % 21
32 Table 20 shows the severity of crashes at Delaware 15 & Barratts Chapel Road. More than half of the crashes resulted in only property damage. Table 20. Crash severity summary at Delaware 15 & Barratts Chapel Road Severity Frequency Percentage Property Damage Only % Personal Injury % Table 21 shows the distribution of the crashes over the hours of the day. A majority of the crashes occur during the afternoon, but this table does not appear to demonstrate any unexpected pattern. Table 21. Time of day of crashes at Delaware 15 & Barratts Chapel Road Time Number Of Crashes Percentage 0:00-1: % 1:00-2:00 2:00-3:00 3:00-4:00 4:00-5:00 5:00-6: % 6:00-7: % 7:00-8:00 8:00-9:00 9:00-10: % 10:00-11:00 11:00-12:00 12:00-13:00 13:00-14: % 14:00-15: % 15:00-16: % 16:00-17: % 17:00-18:00 18:00-19: % 19:00-20:00 20:00-21:00 21:00-22: % 22:00-23:00 23:00-24:00 22
33 Table 22 below shows that most of the crashes at Delaware 15 & Barratts Chapel Road occur during the day when the sun is out. This intersection is not lighted, so it could explain why over one quarter of the crashes occur during the night. The flashing beacons on the stop signs and intersection warning signs could help with night visibility. Table 22 indicates a slight problem with nighttime visibility at the intersection. Table 22. Period of day of crashes at Delaware 15 & Barratts Chapel Road Time of Day Number of Crashes Percentage Day 9 60% Night % Dawn % When examining the day of the week of crashes occurring at Delaware 15 & Barratts Chapel Road, it was discovered that 40% of the crashes occurred on Saturdays. This trend could be the result of land uses nearby. It is possible that there may be an event on Saturdays that attracts more traffic to the area and increased the crash rate as a result. See Table 23 below for a summary of the distribution of crashes at Delaware 15 & Barratts Chapel Road over the days of the week. Table 23. Day of the week of crashes at Delaware 15 & Barratts Chapel Road Day of Week Number of Crashes Percentage Sunday % Monday 0 0% Tuesday % Wednesday 3 20% Thursday % Friday % Saturday 6 40% 23
34 As shown in Table 24, the month with the greatest number of crashes at Delaware 15 & Barratts Chapel Road is January; however, it does not appear that there are noticeably more crashes during any one period of the year to suggest a trend. Table 24. Month of year of crashes at Delaware 15 & Barratts Chapel Road Month of the Year Number of Crashes Percentage January % February % March % April % May % June % July % August September October % November December % Table 25 shows the ages of the drivers responsible for crashes at Delaware 15 & Barratts Chapel Road. The age group with the greatest number of crashes is under 20. This trend is consistent with the expected tendency for younger drivers to have a higher crash rate than other drivers. Table 25. Age of drivers responsible for crash at Delaware 15 & Barratts Chapel Road Age Number of Crashes Percentage % % % % % % 70 and older % Unknown 3 20% 24
35 Table 26 shows that the age of all drivers involved in crashes at Delaware 15 & Barratts Chapel Road is roughly evenly distributed. Table 26. Ages of all drivers involved in crashes at Delaware 15 & Barratts Chapel Road Age Number of Crashes Percentage % % % % % % 70 and older % Unknown % As shown in Table 27, the majority of the crashes at Delaware 15 & Barratts Chapel Road occurred when the weather was clear. Table 27. Weather conditions during crashes at Delaware 15 & Barratts Chapel Road Weather Number of Crashes Percentage Clear % Cloudy % Rainy % Unknown % Table 28 shows the road conditions during crashes at Delaware 15 & Barratts Chapel Road. It does not appear that adverse road conditions greatly contributed to the frequency of crashes at this location. Table 28. Road conditions during crashes at Delaware 15 & Barratts Chapel Road Road Condition Number of Crashes Percentage Wet 3 20% Dry % Unknown % 25
36 As shown in Table 29, one crash at Delaware 15 & Barratts Chapel Road was caused by an impaired driver which does not suggest a significant problem. Table 29. Alcohol related crashes at Delaware 15 & Barratts Chapel Road Number of Crashes Percentage Alcohol Related % Not Alcohol Related % 5.3 Suggested Countermeasures and Projected Effectiveness One option considered for improving the safety of Delaware 15 & Barratts Chapel Road is changing the intersection from minor road stop controlled to all way stop controlled. This countermeasure was considered because drivers on the minor road approach are having difficulty judging when it is safe to enter the intersection. While stopping traffic on Delaware 15 at this intersection would delay traffic and could increase the number of rear-end collisions at the major road approach, the four-way stop would allow traffic on Barratts Chapel Road to have an easier and safer chance to turn or cross this intersection. Drivers travelling southbound on Delaware 15 pass through an all way stop controlled intersection shortly before reaching the intersection with Barratts Chapel Road, so these vehicles are likely travelling more slowly and could easily adapt to another stop sign at Barratts Chapel Road. The MUTCD has outlined specific guidelines for the warranting of multi-way stop that were consulted when considering the option of converting this intersection into a four way stop. Qualification B states that a multi-way stop is warranted if more than five crashes that could be prevented by a multi-way stop occur in a twelve month period. This intersection averages three crashes per year that could be corrected with a multi-way stop sign including four such crashes in 2010 alone. Qualification C states that a multi-way stop is warranted if the traffic on the major road exceeds 300 vehicles per hour and the traffic on the 26
37 minor road exceeds 200 vehicles per hour for more than eight hours. If the 85 th percentile speed is greater than 40 mph on the major road, the volume requirements can be decreased by 30%. Qualification D states that if qualifications B and C are completed to 80%, then a multi-way stop is warranted. According to the predictive method in the Highway Safety Manual, if an intersection meets the requirements in the MUTCD for conversion to a multi-way stop has a crash modification factor of 0.52 with a standard error of See Table 30 below for the expected number of crashes if the intersection were converted to an all way stop. Table 30. Expected crash reduction for conversion to all way stop control at Delaware 15 & Barratts Chapel Road Expected crashes per year Expected crashes per year with no treatment with all-way STOP conversion All Crashes ( ) A second way crashes could potentially be reduced at this intersection would be through increasing the sight distance from the westbound approach. The crash reports show that there are more crashes occurring from the westbound approach than the eastbound approach, so it indicates that there may be a problem with the visibility. This problem could be mitigated through increasing the sight distance. A third option for improving the safety of this intersection would be converting it to a roundabout. One of the main advantages of roundabouts are their ability to mitigate gap acceptance problems at intersections. Since the biggest cause of crashes at Delaware 15 & Barratts Chapel Road is drivers who fail to remain stopped at the minor road approach stop signs, it would be a good candidate to consider for roundabout conversion. As mentioned in the previous section, the crash reduction factor as identified by the Highway Safety Manual for 27
38 roundabouts is 0.29 with a standard deviation of 0.04 for all crashes and 0.13 with a standard deviation of 0.01 for injury crashes. See Table 31 below for the expected crash reduction if Delaware 15 & Barratts Chapel Road were converted to a roundabout. Table 31. Expected crash reduction for conversion to roundabout at Delaware 15 & Barratts Chapel Road Expected crashes per year with no treatment Expected crashes per year with roundabout conversion (95% confidence interval) All Crashes ( ) Injury ( ) A final suggestion for altering Delaware 15 & Barratts Chapel Road to improve safety would be to employ a lane narrowing concept designed to reduce travel speed at the intersection and draw greater attention to the intersection from the minor road approach. Traffic travelling north on Delaware 15 has a 50 mph speed limit until shortly before the intersection with Barratts Chapel Road. Vehicles that do not reduce their speeds to conform to the reduced speed limit are a hazard to vehicles on Barratts Chapel Road trying to turn onto or cross Delaware 15. Narrowing the lanes on a road is frequently used to reduce travel speeds, so this type of countermeasure could be particularly effective since the average vehicle speed on Delaware 15 is believed to be greater than the posted speed limit at this location. A study done by the Federal Highway Administration identified two possible configurations of lane narrowing at intersections as well as a combination of the two methods. The first method is to reduce the lane width on the major road to 9-10 feet through installing a painted median lined with rumble strips as shown in Figure 4. The purpose of reducing the lane width is to force drivers to slow down at the intersection. By creating a painted median with rumble strips, the drivers do not have the added 28
 When installed at an intersection, the first lane narrowing concept would appear to drivers as shown in Figure 5.")
39 hazard of a raised median that could potentially increase the crash rate. The use of a painted median also decreases project cost and construction time. Figure 4. Lane narrowing concept one (Source: Federal Highway Administration) When installed at an intersection, the first lane narrowing concept would appear to drivers as shown in Figure 5. Figure 5. Field view of lane narrowing concept one (Source: Federal Highway Administration) 29

 In the field, the second lane narrowing concept would look like Figure 7.")
40 The second lane narrowing concept, shown in Figure 6, involves creating a channelizing separator island on the minor road approach and adding an extra stop sign on the new median to draw more attention to the intersection from the minor road approach. This measure would increase intersection awareness and improve driver alertness. Figure 6. Lane narrowing concept two (Source: Federal Highway Administration) In the field, the second lane narrowing concept would look like Figure 7. Figure 7. Field view of lane narrowing concept two (Source: Federal Highway Administration) 30
41 The final option for intersection lane narrowing identified by the Federal Highway Administration study involves combining the two previous shown concepts into one design as shown in Figure 8. This third option combines both the modifications to the intersection from the major road and minor road approaches to maximize speed reduction and intersection awareness. Figure 8. Combined lane narrowing concept (Source: Federal Highway Administration) The study of the effectiveness of the lane narrowing concept at reducing speed was done using nine sites in Pennsylvania, Kentucky, Missouri, and Florida. The study revealed statistically significant results at a 95 th percentile confidence interval for reduction of speed on the major road through the implementation of lane narrowing concept one. A study of the effect of lane narrowing concept one on crash reduction showed mixed, but generally positive results. For the three sites in Pennsylvania, total crashes were reduced between 30% and 83%. Fatal crashes and related crashes were also reduced at all Pennsylvania 31
42 sites. However, the sites in Kentucky, Missouri, and Florida observed an increase in rear-end collisions. Overall, the sites experienced a 31% decrease in total crashes and a 20% decrease in fatal/injury crashes. Only one site in Virginia was studied for lane narrowing concept two on the minor road. This location experienced a decrease in both angle and rear-end collisions. Total crashes at this site decreased by 68% and fatal/ injury crashes decreased by 74%. While the number of trials in the sample of the Federal Highway Administration study is limited, the outcomes can still be used to estimate the crash decrease expected if lane narrowing concept one were implemented at Delaware 15 & Barratts Chapel Road. The Highway Safety Manual does not provide specific crash modification factors for this countermeasure treatment. See Table 32 for an estimation of the crash reduction at Delaware 15 & Barratts Chapel Road using the crash reduction values from the study of the nine sites used in the Federal Highway Administration study. Table 32. Expected crash reduction for lane narrowing concept at Delaware 15 & Barratts Chapel Road Expected crashes per year with no treatment Expected crashes per year with roundabout conversion All Crashes Injury See the Federal Highway Administration publication Two Low-Cost Safety Concepts for Two-Way STOP-Controlled, Rural Intersections on High-Speed Two-Lane, Two-Way Roadways cited in the references for more information regarding the study of the lane narrowing concepts. 32
43 5.4 Cost/ Benefit Analysis As demonstrated in the previous section, changing Delaware 15 & Barratts Chapel Road to an all way stop, the crash rate is expected to decrease. Table 33 below summarizes the calculations made to determine the monetary benefits to society for the expected crash reduction due to converting Delaware 15 & Barratts Chapel Road into an all way stop. Table 33. Monetary value of crash reduction for all way stop conversion at Delaware 15 & Barratts Chapel Road Type of Crash Fatality/ Injury Crashes Property Damage Only Crashes Current Crash Rate (per year) Crashes Prevented Through Countermeasure (per year) $101, $13,024 TOTAL $114,272 Monetary Benefit of Crash Reduction (per year) Using Equation 1, the present value of the expected monetary benefit over ten years from crash reduction due to converting Delaware 15 & Barratts Chapel Road into an all way stop is $926,848. Table 34 below summarizes the calculations for the monetary value of crash reduction projected to result from converting Delaware 15 & Barratts Chapel Road into a rural, one lane roundabout. 33
44 Table 34. Monetary value of crash reduction for conversion to a roundabout at Delaware 15 & Barratts Chapel Road Type of Crash Fatality/ Injury Crashes Property Damage Only Crashes Current Crash Rate (per year) Crashes Prevented Through Countermeasure (per year) $183, $17,686 TOTAL $201,198 Monetary Benefit of Crash Reduction (per year) Using Equation 1 to calculate the present value of the crash reduction due to roundabout conversion over ten years, the benefit is $1,631,896. Table 35 summarizes the calculations for the estimated monetary value of crash reduction due to using the lane narrowing concept at Delaware 15 & Barratts Chapel Road. Table 35. Expected monetary value of crash reduction for lane narrowing concept at Delaware 15 & Barratts Chapel Road Type of Crash Fatality/ Injury Crashes Property Damage Only Crashes Current Crash Rate (per year) Crashes Prevented Through Countermeasure (per year) $42, $9,472 TOTAL $52,186 Monetary Benefit of Crash Reduction (per year) The projected present value of the benefits from crash reduction using the lane narrowing concept at Delaware 15 & Barratts Chapel Road as calculated from Equation 1 are $423,275. As explained in the previous section, the cost of converting a rural intersection to a roundabout typically ranges from $200,000 to $1,000,000. Improving the sign and marking at the intersection to convert the intersection from a two-way stop into a four-way stop is estimated to 34
45 cost between $100 and $1,000. The intersection lane narrowing concept would require milling to remove the current pavement markings, rumble strips added to create the median, and new line painting. For the intersections in the study where this treatment was applied, the cost of installation ranged between $10,000 and $70,000. See Table 36 below comparing the cost to benefit ratios for the three suggested countermeasures at Delaware 15 & Barratts Chapel Road. Table 36. Cost to benefit ratio for proposed Delaware 15 & Barratts Chapel countermeasures Countermeasure Cost Benefits Cost: Benefit Ratio (lower bound) Conversion to $200,000- roundabout $1,000,000 Conversion to four-way stop Intersection lane narrowing $1,631,896 1:1.6 1:8.2 Cost: Benefit Ratio (upper bound) $100-$1,000 $926,848 1: : $10,000- $70,000 $423,275 1:6.0 1:42.3 As shown by Table 36, the countermeasure with greatest cost to benefit ratio is converting the intersection to a four way stop due to the very low cost of the countermeasure relative to the other suggested treatments. 35

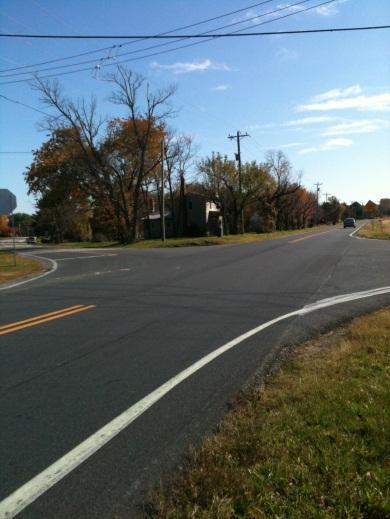
46 6. Delaware 15 & Andrews Lake Road Figure 9. Delaware 15 and Andrews Lake Road location map 6.1. Site Overview and Site Visit Observations The intersection of Delaware 15 & Andrews Lake Road is located outside of Riverview, Delaware in Kent County. This intersection is located three tenths of a mile south of Delaware 15 & Barratts Chapel Road. Delaware 15 is still known as Canterbury Road in this area and Andrews Lake Road is the name of the road from both the eastbound and westbound approaches to the intersection. The AADT on Delaware 15 at this intersection is 4,300 vehicles per day, and the AADT on Andrews Lake Road is 1,170. Andrews Lake Road has a stop sign at both the eastbound and westbound approaches, but the traffic on Delaware 15 from the northbound and southbound approaches does not stop. The posted speed limit on Delaware 15 is increased to 50 36
47 miles per hour at this intersection. Ten crashes have occurred at this intersection in the past three years with six crashes occurring in The site visit to Delaware 15 & Andrews Lake Road revealed many important characteristics of the intersection. Andrews Lake Road does not form a 90 degree angle with Delaware 15 at the intersection. It is difficult to see traffic travelling northbound from the westbound approach due to the angle of intersection, and making a left turn from the westbound direction is challenging due to the fact that the driver must turn greater than 90 degrees. Drivers were observed making the left turn from the southbound approach at a relatively rapid speed due to the angle of intersection which was cited as a common cause for crash at the intersection. All approaches to the intersection are one lane in each direction and no approaches have a paved shoulder. The intersection is not lighted which is an important fact to note when reviewing the time of day for the crashes. The topography is reasonably flat near the intersection, and there is a small horizontal curve from the northbound approach. STOP AHEAD signs are located from the eastbound and westbound approaches. From the northbound and southbound approaches, there is a sign designating the name of Andrews Lake Road Intersection Trends and Reasons for Crash Analysis Table 37 below summarizes the type of crashes that occurred at Delaware 15 & Andrews Lake Road. The most common types of crash were drivers on Andrews Lake Road who failed to wait for a large enough break in traffic to cross the road and drivers on Delaware 15 who turned in front of oncoming traffic. 37
48 Table 37. Type of crash at Delaware 15 & Andrews Lake Road Type of Crash Frequency Percentage Failure to remain stopped 4 40% Failure to yield right of way 2 20% Ran off road 1 10% Improper turn 1 10% Rear end collision 1 10% Unknown 1 10% As Table 38 shows, the cited reason for crashes at Delaware 15 & Andrews Lake Road was most commonly the driver did not see cross traffic at the intersection, but frequently the reason for the crash was unknown. Table 38. Reason for crashes at Delaware 15 & Andrews Lake Road Reason for Crash Frequency Percentage Didn t see vehicle SB: 2 SB: 20% NB: 1 NB: 10% Following too close 1 10% DUI 1 10% Unknown 5 50% Table 39 shows that crashes are evenly distributed between the eastbound and westbound minor road approaches. More crashes occurred from the southbound approach than the northbound approach. Many of the crashes that occurred from the southbound approach were the result of drivers making the turn onto Andrews Lake Road too quickly as a result of the roads not intersecting at 90 degrees. Table 39. Approach direction of vehicle responsible for crash at Delaware 15 & Andrews Lake Road Direction Frequency Percentage NB 1 10% SB 4 40% EB 2 20% WB 3 30% 38
49 As shown in Table 40, crash severity is evenly divided between crashes causing injury to the people involved and crashes that only involve property damage. Table 40. Crash severity at Delaware 15 & Andrews Lake Road Severity Frequency Percentage Property Damage Only 5 50% Personal Injury 5 50% Table 41 below shows the distribution of crashes at Delaware 15 & Andrews Lake Road over the time of the day. The clustering of crash times does not follow the expected trend of more crashes occurring during the traditional morning and afternoon peak hours when volume on the roads are typically the greatest. 39
50 Table 41. Time of day of crashes at Delaware 15 & Andrews Lake Road Time Number Of Crashes Percentage 0:00-1: % 1:00-2: % 2:00-3:00 3:00-4:00 4:00-5:00 5:00-6:00 6:00-7:00 7:00-8:00 8:00-9:00 9:00-10:00 10:00-11: % 11:00-12: % 12:00-13:00 13:00-14:00 14:00-15:00 15:00-16:00 16:00-17:00 17:00-18: % 18:00-19: % 19:00-20:00 20:00-21:00 21:00-22: % 22:00-23:00 23:00-24:00 Table 42 identifies a significant trend at this intersection. A majority of the crashes occurred at night, and the intersection is not lighted at night. Table 42: Day and night crash summary for Delaware 15 & Andrews Lake Road Time of Day Number of Crashes Percentage Day 4 40% Night 6 60% 40
51 Table 43 shows that Thursday and Saturday are the days on which the greatest number of crashes have occurred at Delaware 15 & Andrews Lake Road. However, this trend does not seem significant because crashes also occurred frequently on other days of the week. Table 43. Day of week of crashes at Delaware 15 & Andrews Lake Road Day of Week Number of Crashes Percentage Sunday 1 10% Monday 1 10% Tuesday 2 20% Wednesday Thursday 3 30% Friday Saturday 3 30% Table 44 demonstrates that 40% of the crashes at Delaware 15 & Andrews Lake Road happened during October. While this is a large percentage of the crashes, the data does not suggest a seasonal pattern in crashes that needs to be addressed at this intersection due to the fact that other fall months do not have the same high crash rate and inclement road conditions that could be a problem during the later fall months do not correlate to the increased crash rate in this circumstance. 41
52 Table 44. Month of year of crashes at Delaware 15 & Andrews Lake Road Month of the Year Number of Crashes Percentage January 1 10% February March 2 20% April May 1 10% June July August 1 10% September October 4 40% November December 1 10% Table 45 shows the distribution of the age of drivers who were determined to be responsible for the crashes at Delaware 15 & Andrews Lake Road. As is consistent with standard safety statistics, younger drivers were responsible for the greatest number of crashes at this intersection. Table 45. Age of drivers responsible for crash at Delaware 15 & Andrews Lake Road Age Number of Crashes Percentage % % % and older 2 20% Unknown 1 10% Table 46 below shows that the distribution of the ages of all drivers involved in crash is relatively evenly distributed with younger drivers being more represented due to their tendency to cause crashes as shown previously in Table
53 Table 46. Age of all drivers involved in crashes at Delaware 15 & Andrews Lake Road Age Number of Crashes Percentage % % % % % % 70 and older 2 10% Unknown 1 5% Table 47 shows that the weather was clear when most of the crashes occurred at Delaware 15 & Andrews Lake Road. During two of the crashes visibility was compromised by fog or rain. Table 47. Weather during crashes at Delaware 15 & Andrews Lake Road Weather Number of Crashes Percentage Rain 1 10% Cloudy 2 20% Clear 6 60% Fog 1 10% As shown in Table 48, the roads were dry during the vast majority of the crashes at Delaware 15 & Andrews Lake Road. Table 48. Road conditions during crashes at Delaware 15 & Andrews Lake Road Road Condition Number of Crashes Percentage Wet 1 10% Dry 9 90% Table 49 shows the occurrence of alcohol related crashes at Delaware 15 & Andrews Lake Road. It does not appear that impaired driving is a significant trend at this intersection. 43
54 Table 49. Alcohol related crashes at Delaware 15 & Andrews Lake Road Number of Crashes Percentage Alcohol Related 1 10% Not Alcohol Related 9 90% It became apparent that the likely reasons for the high crash rate at the intersection are a combination of the angle of intersection between Delaware 15 and Andrews Lake Road and a lack of visibility at night Suggested Countermeasures and Projected Effectiveness One possible countermeasure could be to reconfigure the intersection so that the two roads intersect at a 90 degree angle. When an roads at an unsignalized intersection do not meet at 90 degree angles, drivers are forced to turn their vehicle a greater angle than they would typically expect from some of the approaches. This motion is contrary to driver expectations and can result in drivers not allowing enough time to complete the movement in front of oncoming traffic or making the maneuver too quickly. The Highway Safety Manual recognizes the increased potential for danger at skewed intersections and suggests realigning the intersection in cases where the skew angle is very large or the intersection is frequently the location of crashes. The intersection currently has a skew angle of 40 degrees meaning that the roads intersect at a 50 degree angle, or 40 degrees away from 90 degrees. Given the 40 degree skew angle, the crash modification factor can be found using Equation 2. Equation 2 The crash modification factor is determined to be for all types and severity of crashes if the 40 degree skew angle were reduced to zero. See Table 50 below for the expected crash reduction for reduction of skew angle. 44
55 Table 50. Expected crashes with reduction of skew angle Expected crashes per year Expected crashes per year with no treatment with reduction of skew angle All Crashes Another countermeasure that would be effective at this intersection is installing lighting since a large percentage of crashes occur during the night. The calculation for the crash modification factor for adding lighting to an intersection is shown in Equation 3. Equation 3 The proportion of night crashes, P ni, for this intersection is 0.6 and the calculated crash modification factor is for all crashes. The Highway Safety Manual gives a CMF value of 0.62 and standard error of 0.04 for injury crashes when lighting is added to an intersection. See Table 51 below for the expected crash reduction with the addition of lighting to the intersection. The values in parenthesis represent a 95 percent confidence interval. Table 51. Expected crash reduction for addition of intersection lighting Expected crashes per year with no treatment Expected crashes per year with intersection lighting All Crashes Injury Crashes ( ) A third option to reduce the crash rate at this intersection would be to both reduce the skew angle of the intersection and add intersection lighting. While it has been proven that employing multiple countermeasures at an intersection typically reduces the crash rate beyond what any one of the countermeasures does on its own, the magnitude of the reduction is 45
56 uncertain. Therefore, the crash reduction potential of combining reducing the intersection skew angle with adding intersection lighting cannot be accurately quantified. A final suggestion to reduce the crash rate at this intersection is through checking the retroreflectivity, or visibility at night, of the signs and pavement marking in the area of the intersection. This option is much less expensive and less disruptive to traffic at the intersection than the previous countermeasures. If the signs or pavement markings are not visible at night, they can be replaced or refurbished in an effort to reduce the number of night crashes at Delaware 15 & Andrews Lake Road. Checking the night visibility also could be completed prior to pursuing the more costly improvements suggested earlier in this section. 6.4 Cost/ Benefit Analysis Crashes at Delaware 15 & Andrews Lake Road could be reduced through decreasing the skew angle of the intersection or by illuminating the intersection at night using intersection lighting. Table 52 below summarizes the calculations for the expected yearly monetary benefit of crash reduction at Delaware 15 & Andrews Lake Road through the realignment of the intersection to decrease the skew angle to zero. 46
57 Table 52. Monetary value of crash reduction for removal of skew angle at Delaware 15 & Andrews Lake Road Type of Crash Fatality/ Injury Crashes Property Damage Only Crashes Current Crash Rate (per year) Crashes Prevented Through Countermeasure (per year) $50, $2,368 TOTAL $52,992 Monetary Benefit of Crash Reduction (per year) Using Equation 1, the expected monetary benefit over ten years resulting from crash reduction at Delaware 15 & Andrews Lake Road due to removing the skew angle is $429,813. Table 53 summarizes the calculations of the monetary value of crash reduction for the countermeasure of adding lighting to the intersection at Delaware 15 & Andrews Lake Road. Table 53. Monetary value of crash reduction for installation of intersection lighting at Delaware 15 & Andrews Lake Road Type of Crash Fatality/ Injury Crashes Property Damage Only Crashes Current Crash Rate (per year) Crashes Prevented Through Countermeasure (per year) $99, $2,812 TOTAL $102,478 Monetary Benefit of Crash Reduction (per year) Using Equation 1 to calculate the present value of the monetary benefits of adding lighting at the intersection of Delaware 15 & Andrews Lake Road over ten years, the benefit to society through crash reduction was found to be $831,
58 The cost of installing lighting at an intersection ranges between $100,000 and $150,000. The variation is due to the specific characteristics of the site and whether electrical wires are already near the area. There is also a cost to power the lights that continues over the lifetime of the lights. Depending on electricity prices, the cost per month for electricity for an intersection is $20-$40. Over the course of a year this amounts to $240-$480. When converting that cost distributed over ten years to a present value using Equation 1, the additional maintenance cost of operating the lights range from $1,950 to $4,000. The cost of realigning an intersection is very site specific. In order to estimate the cost of realigning Delaware 15 & Andrews Lake Road, a planning level cost estimate was calculated using RS Means 2012 unit costs and estimated construction amount values. See Table 54 for a summary of the cost estimate calculations. Table 54. Cost estimate for intersection realignment at Delaware 15 & Andrews Lake Road Item Unit Cost Estimated Quantity Cost Clearing and grubbing $6,500/ acre 12 $78,000 Excavation $33/ CY 1000 $33,000 Subbase $12/ SY 1000 $12,000 Asphalt paving $23/ SY 1000 $23,000 Line striping $0.50/ LF 6000 $3,000 Removal of existing roadway $33/ CY 1000 $33,000 Top soil/ grass seed $12/ SY 10,000 $120,000 Mobilization $302,000*0.15 $45,300 Traffic Management Flaggers, cones, barrels, signs, etc $30,000 A total cost of $350,000 for realigning the intersection was estimated. Relocating utilities and drainage costs would escalate the price of intersection realignment to $500,000 to $1,000,000. This range was used in Table 55 below to calculate the cost to benefit ratio for realigning the intersection to remove the skew angle. 48
59 Table 55. Cost to benefit ratio for proposed Delaware 15 & Andrews Lake Road countermeasures lighting Reduce skew angle Countermeasure Cost Benefits Cost: Benefit Ratio (lower bound) Add intersection $100,000- $150,000 $500,000- $1,000,000 $831,188 1:5.5 1:8.3 $429,813 1:0.4 1:0.9 Cost: Benefit Ratio (upper bound) As shown in Table 55, adding intersection lighting is expected to have a greater cost to benefit ratio than reducing the skew angle of the intersection through a realignment of the intersection. 49

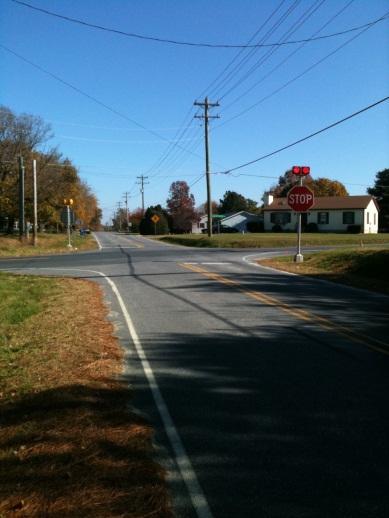
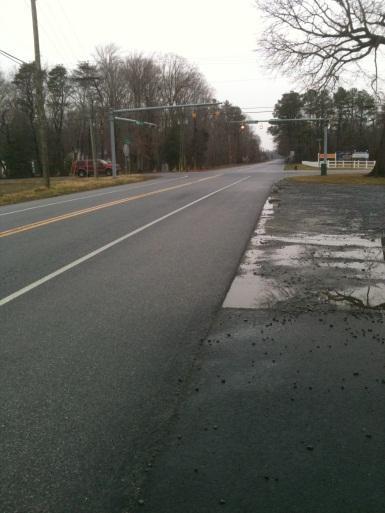
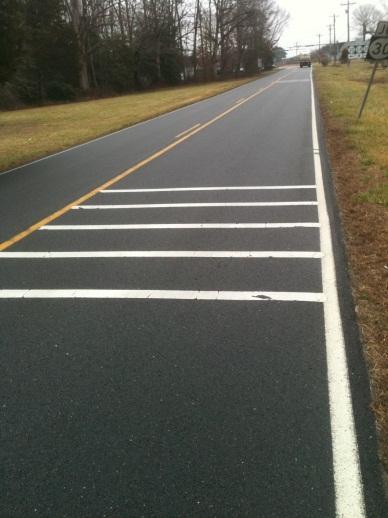
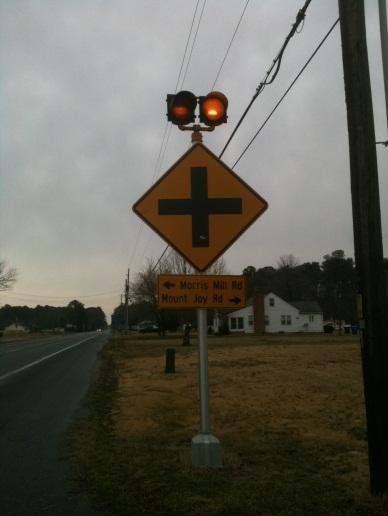
60 7. Delaware 30 & Mount Joy Road Figure 10. Delaware 30 and Mount Joy Road location map 7.1 Site Overview and Site Visit Observations Delaware 30 & Mount Joy Road is located outside of Millsboro, Delaware in Sussex County. Delaware 30 travels in the northbound and southbound directions and is known as Gravel Hill Road in the vicinity of the intersection. Mount Joy Road is the name of the crossroad from the westbound approach, and Morris Mill Road is the name of the street from the eastbound approach. The AADT value for Delaware 30 is 3,900 vehicles per day, and the AADT for Mount Joy Road is 2,600. As of January 2012, the traffic on Mount Joy Road had a stop sign at the intersection, but the traffic on Delaware 30 did not stop. Nine crashes occurred at this intersection over the past three years with five crashes occurring in One fatality was recorded at this intersection. 50
61 The site visit showed that sight distance from the eastbound and westbound approaches is slightly obscured by telephone poles. The northbound and southbound approaches to the intersection have an intersection warning sign with flashing yellow lights. The eastbound and westbound approaches have flashing red lights on the stop sign at the intersection with Delaware 30. There is one lane in each direction from each approach. The speed limit is 50 mph from all four approaches. There is passing permitted nearby in the northbound and southbound directions. There is a curve approaching the intersection from the westbound approach, but there are minimal vertical grades at the intersection. There is no lighting at the intersection. 7.2 Intersection Trends and Reasons for Crash Analysis The most common type of crash at Delaware 30 & Mount Joy Road is vehicles that fail to remain stopped on Mount Joy Road until Delaware 30 is clear to cross. As shown in Table 56 below, vehicles that fail to remain stopped account for two thirds of the crashes at the intersection. Table 56. Type of crash summary at Delaware 30 & Mount Joy Road Type of Crash Frequency Percentage Failure to remain stopped % Ran stop sign % Inattentive driving % While a significant proportion of the reasons for crashes at Delaware 30 & Mount Joy Road were determined to be unknown, the largest reason for crash at the intersection was drivers who did not see conflicting traffic before making an unsafe turning maneuver. Most frequently, the drivers did not see traffic approaching in the southbound direction. Table 57 summarizes the reasons for crash at Delaware 30 & Mount Joy Road. 51
62 Table 57. Reason for crash summary at Delaware 30 & Mount Joy Road Reason for Crash Frequency Percentage Didn t see vehicle NB: 1 NB: 11.1% SB: 3 SB: 33.3% Wet road % Unknown % As shown by Table 58, the crashes at Delaware 30 & Mount Joy Road were primarily caused by drivers from the eastbound and westbound minor road approaches. Of the crashes that occurred as a result of drivers entering the intersection from the minor road approaches, more crashes were due to drivers coming from the eastbound approach, but crashes were nearly evenly distributed between both the eastbound and westbound approaches. Table 58. Approach of driver responsible for crashes at Delaware 30 & Mount Joy Road Direction Frequency Percentage Northbound 0 0% Southbound % Eastbound % Westbound % Table 59 shows that Delaware 30 & Mount Joy Road has had a history of severe crashes. Nearly 80% of the crashes that occurred at this intersection resulted in personal injury or fatality. The fatal crash was due to a driver who failed to stop at the stop sign from the eastbound approach and struck a vehicle on Delaware 30. This is the only intersection in the study that has reported a fatality. Table 59. Crash severity at Delaware 30 & Mount Joy Road Severity Frequency Percentage Property Damage Only % Personal Injury % Fatality % 52
63 Table 60 shows that crashes at Delaware 30 & Mount Joy Road most frequently occur during the traditional afternoon peak hours. This trend does not represent anything out of the ordinary as traffic volumes also are typically greatest during this time period. Table 60. Time of day of crash at Delaware 30 & Mount Joy Road Time Number Of Crashes Percentage 0:00-1:00 1:00-2:00 2:00-3:00 3:00-4:00 4:00-5:00 5:00-6:00 6:00-7: % 7:00-8:00 8:00-9:00 9:00-10:00 10:00-11:00 11:00-12: % 12:00-13: % 13:00-14:00 14:00-15:00 15:00-16:00 16:00-17: % 17:00-18: % 18:00-19: % 19:00-20:00 20:00-21:00 21:00-22:00 22:00-23:00 23:00-24: % As shown in Table 61, the majority of the crashes at Delaware 30 & Mount Joy Road occur during the day which suggests that nighttime visibility at this intersection is not a problem. 53
64 Table 61. Period of day of crashes at Delaware 30 & Mount Joy Road Time of Day Number of Crashes Percentage Day % Night % Dawn % Table 62 below shows the distribution of crashes at Delaware 30 & Mount Joy Road over the days of the week. The number of crashes on each day are nearly evenly distributed. Table 62. Day of week of crashes on Delaware 30 & Mount Joy Road Day of Week Number of Crashes Percentage Sunday % Monday % Tuesday % Wednesday % Thursday % Friday Saturday % Table 63 demonstrates that crashes at Delaware 30 & Mount Joy Road tend to happen during the summer and fall months. Table 63. Month of crashes at Delaware 30 & Mount Joy Road Month of the Year Number of Crashes Percentage January February March April May June % July % August September % October % November December 54
65 During the past twenty years, southern Delaware has seen an increase in retirees moving to the area. Since elderly drivers are typically at a higher risk for crashes, the age of drivers involved in crashes was suspected to be a primary concern at Delaware 30 & Mount Joy Road. However, as Table 64 shows, elderly drivers were not the main cause of crashes. Drivers in the age group caused more crashes at this intersection than drivers 60 and older. Table 64. Age of drivers responsible for crashes at Delaware 30 & Mount Joy Road Age Number of Crashes Percentage % % % % % % 70 and older % Table 65 shows the distribution of the age of all drivers involved in crashes at Delaware 30 & Mount Joy Road. While middle aged drivers are underrepresented for causing crashes, it seems as though drivers of all ages are involved in crashes at this intersection. Elderly drivers do not appear to be involved in crashes at this location more frequently than drivers of other ages. Table 65. Age of all drivers involved in crashes at Delaware 30 & Mount Joy Road Age Number of Crashes Percentage % % % % % and older % 55
66 Table 66 shows the weather conditions at Delaware 30 & Mount Joy Road during crashes. Most of the crashes at this intersection occurred when the sky was clear. Table 66. Weather conditions during crashes at Delaware 30 & Mount Joy Road Weather Number of Crashes Percentage Cloudy % Rainy % Clear % Table 67 shows that the roads were dry during nearly all of the crashes at Delaware 30 & Mount Joy Road. Table 67. Road conditions during crashes at Delaware 30 & Mount Joy Road Road Condition Number of Crashes Percentage Wet % Dry % As shown in Table 68, no crashes at Delaware 30 & Mount Joy Road were attributed to impaired drivers. Table 68. Alcohol related crashes at Delaware 30 & Mount Joy Road Number of Crashes Percentage Alcohol Related 0 0% Not Alcohol Related 9 100% After reviewing, the crash reports and site visits it appears that crashes at Delaware 30 & Mount Joy Road were mainly due to drivers on Mount Joy Road who attempted to cross Delaware 30 when there was not a large enough gap in traffic. 56
67 7.3 Suggested Countermeasures and Projected Effectiveness As of February 2012, DelDOT converted the intersection from a two way stop to all way STOP. Employing this countermeasure makes sense for this intersection because many crashes at this intersection are the result of drivers on the minor road not waiting until a large enough gap is present to cross the intersection. A four way stop would eliminate the need for drivers on Mount Joy Road to determine when the gap between the traffic on Delaware 30 is large enough to enter the intersection. Drivers at the minor road approaches at this intersection also claimed to have difficultly seeing drivers on Delaware 30. If the traffic on Delaware 30 were forced to stop at the intersection with Mount Joy Road, these types of crashes could be reduced. Using the predictive method in the Highway Safety Manual, the crash modification factor for converting a rural, minor road stop controlled intersection to all-way stop control is 0.52 for all crashes with a standard error of Table 69 below shows the expected number of crashes per year at Delaware 30 & Mount Joy Road after the all way stop conversion. Table 69. Conversion to all way stop control at Delaware 30 & Mount Joy Road Expected crashes per year Expected crashes per year with no treatment with all-way STOP conversion All Crashes ( ) When observing the crash trends at Delaware 30 & Mount Joy Road, it is important to note that crashes at this location may increase slightly immediately following the conversion to all way stop control. Rear end crashes on Delaware 30 are likely to increase due to drivers who have driven through this intersection many times and do not expect a vehicle in front of them stopped at a stop sign. Likewise, it is also possible that a few inattentive drivers will run the stop sign on Delaware 30 prior to adjusting to the new stop signs. These transition consequences 57
68 could be mitigated through adding STOP AHEAD signs or drawing attention to the new stop signs using flashing lights. After a short period of time, crashes are expected to decrease to the values shown in Table Cost/ Benefit Analysis The conversion of Delaware 30 & Mount Joy Road to an all way stop controlled intersection has been shown through previous calculations to reduce the crash rate. Table 70 below shows the estimated monetary value of the expected crash reduction at this location using the Highway Safety Manual s methodology. Table 70. Monetary value of crash reduction due to conversion to an all way stop at Delaware 30 & Mount Joy Road Type of Crash Fatality/ Injury Crashes Property Damage Only Crashes Current Crash Rate (per year) Crashes Prevented Through Countermeasure (per year) $177, $2,368 TOTAL $179,552 Monetary Benefit of Crash Reduction (per year) Using Equation 1, the present value of the expected monetary value of crash reduction due to converting Delaware 30 & Mount Joy Road into an all way stop is $1,456,328. The estimated cost of converting Delaware 30 & Mount Joy Road to a four way stop and improving the pavement markings is $100-$1,000. Following the initial intersection remediation it is expected that little to no added maintenance cost would result. See Table 71 for a summary of the calculations for the cost to benefit ratio of converting the intersection to a four way stop. 58
69 Table 71. Cost to benefit ratio of converting Delaware 30 & Mount Joy Road to a four way stop Countermeasure Cost Benefits Cost: Benefit Ratio (lower bound) Conversion to four way stop Cost: Benefit Ratio (upper bound) $100-$1,000 $1,456,328 1:1, :14,563.3 As shown in Table 71, converting Delaware 30 & Mount Joy Road is expected to have substantial financial benefits over the next ten years. 59

70 8. Delaware 30 & Zoar Road Figure 11. Delaware 30 and Zoar Road location map 8.1 Site Overview and Site Visit Observations The intersection of Delaware 30 & Zoar Road is located approximately one mile north of Delaware 30 & Mount Joy Road also outside of Millsboro, Delaware in Sussex County. Delaware 30 is the northbound and southbound approaches to the intersection and is still referred to as Gravel Hill Road at the intersection of Zoar Road. Zoar Road is the name of the eastbound and westbound approaches to the intersection. The AADT on Delaware 30 is 3,900, and the AADT on Zoar Road is 2,800. As of January 2012, the traffic on Zoar Road stopped at a stop sign at the intersection with Delaware 30, and the traffic at Delaware 30 did not stop. Seventeen 60
71 crashes have occurred at the intersection of Delaware 30 and Zoar Road during the past three years. The site visit revealed that many intersection awareness measures have been installed at this location with limited success. There are overhead flashing beacons at the intersection which flash yellow lights in the northbound and southbound directions and red lights in the eastbound and westbound directions. There are rumble strips on the eastbound and westbound approaches, but the rumble strips seem to close to the intersection (especially from the westbound approach) and not very effective at alerting the vehicles as they pass over them. The speed limit is 50 mph for all approaches to the intersection. Passing is permitted in the vicinity of the intersection from all approaches. Signs block some of the sight distract from the westbound approach. The intersection is not lighted but the flashing beacons illuminate the intersection. 8.2 Intersection Trends and Reasons for Crash Analysis Table 72 summarizes the types of crashes that occurred at Delaware 30 & Zoar Road. Drivers who failed to remain stopped at the stop sign on Zoar Road before crossing the intersection comprised the largest percentage of type of crash at the intersection. A sign is located near the intersection to warn drivers of the presence of deer in the area since two of the crashes near this intersection involved collision with a deer. Table 72. Types of crash summary at Delaware 30 & Zoar Road Type of Crash Frequency Percentage Failure to remain stopped % Failure to yield right of way % Deer in roadway % Ran off road 1 5.9% Careless driving 1 5.9% Inattentive driving 1 5.9% 61
72 As shown in Table 73, the most frequent reason for crash at Delaware 30 & Zoar Road was drivers who did not see cross traffic, particularly from the northbound direction. It is also important to note that multiple drivers who had a crash at this intersection expected the intersection to be a four way stop. Table 73. Reason for crash summary at Delaware 30 & Zoar Road Reason for Crash Frequency Percentage Didn t see vehicle NB: 4 NB: 23.6% SB: 2 SB: 11.8% Expected four way stop % Sun blocked view 1 5.9% Large vehicle blocked view 1 5.9% Vehicle travelling in wrong 1 5.9% lane Driving too fast to turn 1 5.9% Debris on roadway 1 5.9% Driver wasn t paying attention 1 5.9% None % Unknown 1 5.9% Table 74 shows the approach direction of vehicles responsible for crashes at Delaware 30 & Zoar Road. More crashes occur due to vehicles from the minor road approaches from the eastbound and westbound directions than on the major road approaches. Crashes are evenly distributed between both minor road and both major road approaches. Table 74. Approach of drivers responsible for crashes on Delaware 30 & Zoar Road Direction Frequency Percentage NB % SB % EB % WB % 62
73 Table 75 shows that more than half of the crashes at Delaware 30 & Zoar Road cause only damage to property and no injury to passengers in the vehicle(s). Table 75. Crash severity at Delaware 30 & Zoar Road Severity Frequency Percentage Property Damage Only % Personal Injury % As shown by Table 76, crashes are mainly clustered around the typical morning and afternoon peak travel hours which is a common trend since traffic volumes are usually greatest during those hours. Table 76. Time of day of crashes at Delaware 30 & Zoar Road Time Number Of Crashes Percentage 0:00-1:00 1:00-2:00 2:00-3:00 3:00-4:00 4:00-5:00 5:00-6:00 6:00-7: % 7:00-8: % 8:00-9: % 9:00-10:00 10:00-11: % 11:00-12:00 12:00-13:00 13:00-14: % 14:00-15: % 15:00-16:00 16:00-17: % 17:00-18: % 18:00-19:00 19:00-20: % 20:00-21:00 21:00-22: % 22:00-23:00 23:00-24:00 63
74 Table 77 shows the division between crashes that occur during the day and crashes that occur at night. The majority of crashes at Delaware 30 & Zoar Road occurred during the day when the intersection was lit by natural sunlight. Table 77. Period of day of crashes at Delaware 30 & Zoar Road Time of Day Number of Crashes Percentage Day % Night % Table 78 shows that the most common day for crashes at Delaware 30 & Zoar Road is Thursday and no crashes occurred on Saturdays. However, this trend does not seem to be correlated to any other intersection trends or design features. Table 78. Day of week of crashes at Delaware 30 & Zoar Road Day of Week Number of Crashes Percentage Sunday % Monday % Tuesday % Wednesday % Thursday % Friday % Saturday Table 79 shows that the highest concentration of crashes occurs in the first months of the year with the greatest number of crashes occurring in March. 64
75 Table 79. Month of year of crashes at Delaware 30 & Zoar Road Month of the Year Number of Crashes Percentage January % February % March % April % May June % July % August % September October % November % December % As a result of the trend of elderly drivers moving to Sussex Count, it was considered probable that Delaware 30 & Zoar Road could have an increased occurrence of crashes due to elderly drivers. After analyzing the age of the drivers involved in crashes, it was determined that there is a large number of crashes occurring at this intersection involving elderly drivers. As illustrated by Table 80, over 40% of the crashes at Delaware 30 & Zoar Road were caused by drivers over age 60. Table 80. Age of drivers responsible for crashes at Delaware 30 & Zoar Road Age Number of Crashes Percentage % % % % % 70 and older % 65
76 Table 81 below shows the age of all drivers involved in crashes at Delaware 30 & Zoar Road. More middle aged drivers are involved in crashes and not determined to be responsible for the crashes than are the cause of the crashes as shown by comparing Table 81 with Table 80. Table 81. Age of all drivers involved in crashes at Delaware 30 & Zoar Road Age Number of Crashes Percentage % % % % % % 70 and older % As shown in Table 82, nearly all of the crashes at Delaware 30 & Zoar Road occurred with the weather was clear. Table 82. Weather during crashes at Delaware 30 & Zoar Road Weather Number of Crashes Percentage Clear % Rainy % Table 83 shows that poor road conditions do not greatly increase the crash rate at Delaware 30 & Zoar Road. Table 83. Road conditions during crashes at Delaware 30 & Zoar Road Road Condition Number of Crashes Percentage Wet % Dry % 66
77 As shown by Table 84, none of the crashes at Delaware 30 & Zoar road during the past three years were the result of impaired drivers. Table 84. Alcohol related crashes at Delaware 30 & Zoar Road Number of Crashes Percentage Alcohol Related 0 0% Not Alcohol Related % Other factors which could potentially impact the crash frequency at Delaware 30 & Zoar Road such as age of drivers, weather conditions, road conditions, approach of drivers, time of day, day of week, and month of year were also considered. None of these factors proved significant, but tables summarizing the analysis can be found in the Appendix. 8.3 Suggested Countermeasures and Projected Effectiveness In February 2012, DelDOT installed stop signs to convert the intersection to an all way stop. This countermeasure fits the crash trends at Delaware 30 & Zoar Road because many crashes were caused by drivers entering the intersection when there was not a large enough gap in the cross traffic. Also, other low cost improvements to the intersection including flashing overhead beacons and rumble strips were not effective at reducing crashes. Some drivers stated that they expected the traffic on Delaware 30 to stop prior to the February 2012 conversion to an all way stop intersection. Now that the intersection is an all way stop, it may be more in line with driver expectation. Using the predictive method in the Highway Safety Manual, the crash modification factor for converting a rural, minor road stop controlled intersection to all-way stop control is 0.52 for all crashes with a standard error of Table 85 below shows the expected number of crashes per year at Delaware 30 & Mount Joy Road after the all way stop conversion. 67
78 Table 85. Conversion to all way stop control at Delaware 30 & Zoar Road Expected crashes per year Expected crashes per year with no treatment with all-way STOP conversion All Crashes ( ) It is also important to note that the number of crashes experienced at this intersection could increase slightly right after the initial installation of the two new stop signs due to drivers who are familiar with the area, but not aware that the intersection has become an all way stop. However, after a short period of transition time, crashes at Delaware 30 & Zoar Road should reduce as per the calculations in Table 85. Delaware 30 & Zoar Road currently has flashing beacons above the intersection and rumble strips from the minor approaches that were implemented with the intention of reducing crashes. However, the site visit revealed that the rumble strips appeared to be too close to the stop sign and worn down. It is suggested that the spacing and location of the rumble strips be investigated to determine if they meet current standards. Retrofitting or replacing the rumble strips to restore quality and ensuring they meet the state standards could improve the safety of this intersection. Numerous studies have been performed regarding the impact of flashing beacons on crash reduction. It has been shown that overhead flashing beacons are more effective than flashing beacons above signs. However, the studies have shown that crash reduction from all types of flashing beacons is typically limited and highly variable due to multiple reasons. While flashing beacons attract attention to the intersection initially, over time, their effectiveness decreases as drivers get used to their presence. Also, the flashing yellow light often displayed overhead from on the major road approach like the ones at Delaware 30 & Zoar Road can encourage drivers to speed up in an effort to beat the yellow light as they might at a signalized 68
79 intersection. The Highway Safety Manual acknowledges the variability of flashing beacons when offering values for crash modification factors. Table 86 shows the values the Highway Safety Manual gives for crash modification factors for overhead flashing beacons. The term All Settings refers to locations in either rural or urban locations. Table 86. Highway Safety Manual crash modification factors for overhead flashing beacons Crash Modification Factor Standard Error All Settings, All Severities 0.95* 0.04 All Settings, Injury 0.90* 0.06 All Settings, Rear End 0.92* 0.1 All Settings, Angle Rural, Angle Crash modification factors marked with asterisks are identified as cases in which the addition of flashing beacons could result in an increase, decrease, or no change in the crash frequency at the intersection. In the case of rural locations, the crash rate is expected to decrease, but given the crash modification factor and large standard error, it is possible that the crash reduction experienced at an intersection such as Delaware 30 & Zoar Road be nearly negligible. 8.4 Cost-Benefit Analysis As shown in the table above, converting Delaware 30 & Zoar Road into an all way stop controlled intersection, is expected to reduce the crash rate at the intersection. Using the Highway Safety Manual methodology, the yearly monetary benefit of the expected crash reduction was calculated and shown in Table
80 Table 87. Monetary value of crash reduction due to conversion to an all way stop at Delaware 30 & Zoar Road Type of Crash Fatality/ Injury Crashes Property Damage Only Crashes Current Crash Rate (per year) Crashes Prevented Through Countermeasure (per year) $177, $11,840 TOTAL $189,024 Monetary Benefit of Crash Reduction (per year) Using Equation 1, the present value of the expected monetary value to society of the crash reduction at Delaware 30 & Zoar Road through the conversion of the intersection to an all way stop is $1,533,154 over ten years. The cost of converting Delaware 30 & Zoar Road into a four way stop controlled intersection through adding signs and improving the pavement markings is estimated to cost $100-$1,000. This improvement would have little to no maintenance costs following the initial improvement, so it is assumed that the initial cost will be the whole cost of the project over ten years. See Table 88 for a summary of the cost to benefit ratio calculations for this intersection. Table 88. Cost to benefit ratio for converting Delaware 30 & Zoar Road to a four way stop Countermeasure Cost Benefits Cost: Benefit Ratio (lower bound) Convert to four way stop Cost: Benefit Ratio (upper bound) $100-$1,000 $1,533,154 1:1, :15,331.5 The payoff expected from reducing the crash rate at this intersection is estimated to be between and times greater than the cost of the improvements to the intersection. 70
81 9. Overall Observations and Conclusions An overarching trend exhibited by all five of the intersections studied is that the main cause of crash was drivers who stopped at the stop sign as expected, but continued into the intersection when cross traffic was blocking the intended travel path of the vehicle. This driver error was due largely to the inattention of the drivers. In many cases, drivers on one of the minor road approaches failed to adequately observe vehicles on the major road. At all of the intersections studied besides Delaware 15 & Barratts Chapel Road, the major road has a speed limit of 50 mph. Therefore, the traffic on the major road is moving quickly and can cause serious crashes if a vehicle on the major road strikes a vehicle on the minor road. Also, drivers travelling quickly on the major road would likely not be able to avoid a driver entering or crossing the road from the minor approach. In the case of some of the intersections, passing is allowed on the major road which may encourage drivers to travel at speeds above the posted speed limit in the vicinity of the intersections. Another factor that could be influencing the recent increase in crashes at the intersections in this study could be due to an increase in traffic volume in the area. While all of the intersections are located in rural areas, new housing subdivisions continue to carve up rural land thereby increasing the volume of traffic on rural roads. Drivers who have lived near the intersections in this study for many years may not be aware of the increased traffic volume in recent years. As a result, the heightened danger that the increased traffic volume poses is discounted by drivers who have traversed the intersection safely countless times before. Similarly, drivers who are not familiar with the area could also underestimate the volume of traffic when crossing heavily travelled roads by not being as observant and alert as they should be. 71
82 References Highway Safety Manual. Washington, D.C.: American Association of State Highway and Transportation Officials, Print. Iowa Highway Research Board. "Strategies to Address Nighttime Crashes at Rural, Unsignalized Intersections." Iowa Department of Transportation, Feb Web. < %20Final.pdf>. "Low-Cost Safety Enhancements for Stop-Controlled and Signalized Intersections." - FHWA Safety Program. Federal Highway Administration. Web. 27 Apr < Manual on Uniform Traffic Control Devices. McLean, VA: United States. Department of Transportation. Federal Highway Administration, Print. Minnesota Department of Transportation, and Minnesota Local Road Research Board. "Safety Impacts of Street Lighting at Isolated Rural Intersections Part II, Year 1 Report." Center for Transportation Research and Education, Dec Web. < "Prediction of the Expected Safety Performance of Rural Two-Lane Highways." Federal Highway Administration. US Department of Transportation, Dec Web. < "Roundabouts: An Informational Guide." US Department of Transportation. Federal Highway Administration. Web. 27 Apr < "Rural Intersection Safety." FHWA Safety Program. US Department of Transportation. Web. 72
83 < Rys, Margaret J., Daniel E. Karkle, Arun Vijayakumar, Rohit Makarla, and Eugene Russell. "Promoting Centerline Rumble Strips To Increase Rural, Two-Lane Highway Safety." Kansas Department of Transportation, Dec Web. < SystemType=2&LogonId=36ff79ae6bc6de b3a5b24f57f&DocId= >. "Safety Evaluation of Center Two-Way Left-Turn Lanes on Two Lane Roads." Federal Highway Administration. US Department of Transportation, Mar Web. < Spencer, Eugene R. RSMeans Site Work and Landscape Cost Data: Earthwork Underground Utilities, Site Improvements, and Demolition. Norwell, Ma.: R S Means, Print. "Toolbox of Countermeasures and Their Potential Effectiveness for Intersection Crashes." Federal Highway Administration. US Department of Transportation, Sept Web. < "Two Low-Cost Safety Concepts for Two-Way Stop-Controlled, Rural Intersections on High- Speed Two-Lane, Two-Way Roadways." Federal Highway Administration. US Department of Transportation, Sept Web. < "Unit Costs for Non-State Highway Reconstructions with Federal Funds." Capital District Transportation Committee, 15 Jan Web. 30 Apr <Unit Costs for Non-State Highway Reconstructions with Federal Funds>. Wang, Yinhai, Ngan H. Nguyen, Atli Bjorn E. Levy, and Yao-Jan Wu. "Cost Effective Safety 73
84 Improvements for Two-Lane Rural Roads." Transportation Northwest, Mar Web. < Washington, Simon, and Ida Van Schalkwyk. "Cost Effective Safety Improvements on Two Lane Rural State Roads in Washington State." Washington State Department of Transportation. Arizona State University, Apr Web. < "Wright County Rural Intersection Street Lighting Policy." Wright County Board of Commissioners, 8 Jan Web. 27 Apr < ghting_policy.pdf>. 74

85 Delaware Center for Transportation University of Delaware Newark, Delaware AN EQUAL OPPORTUNITY/AFFIRMATIVE ACTION EMPLOYER To the extent permitted by applicable State and Federal laws, the University of Delaware is committed to assuring equal opportunity to all persons and does not discriminate on the basis of race, creed, color, sex, age, religion, national origin, veteran or handicapped status, or gender identity and expression, or sexual orientation in its educational programs, activities, admissions, or employment practices as required by Title IX of the Educational Amendments of 1972, Section 504 of the Rehabilitation Act of 1973, Title VII of the Civil Rights Act of 1964, and other applicable statutes. The University of Delaware has designated Karen Mancini, Director of the Office of Disabilities Support Services, as its ADA/Section 504 Coordinator under Federal law. Inquiries concerning Americans with Disabilities Act compliance, Section 504 compliance, campus accessibility, and related issues should be referred to Karen Mancini ( ) in the Office of Disabilities Support Services. Inquiries concerning Title VII and Title IX compliance and related issues should be referred to the Director of the Office of Equity and Inclusion, Becki Fogerty ( ).
Truck Climbing Lane Traffic Justification Report
 ROUTE 7 (HARRY BYRD HIGHWAY) WESTBOUND FROM WEST MARKET STREET TO ROUTE 9 (CHARLES TOWN PIKE) Truck Climbing Lane Traffic Justification Report Project No. 6007-053-133, P 101 Ι UPC No. 58599 Prepared by:
Recently Developed Intersection CMFs. Nancy Lefler, VHB ATSIP Traffic Records Forum, 2014
 Recently Developed Intersection CMFs Nancy Lefler, VHB ATSIP Traffic Records Forum, 2014 Overview General Methodology Treatments Installation of traffic signals - with and without left-turn lanes (NCDOT)
Pavement Markings (1 of 3)
") Pavement Markings (1 of 3) DESCRIPTION AND DEFINITION Disadvantages Relatively high cost (over typical Crash reduction as yet unknown painted edge line) No tactile effect The STOP AHEAD pavement marking
Pavement Markings (1 of 3) DESCRIPTION AND DEFINITION Disadvantages Relatively high cost (over typical Crash reduction as yet unknown painted edge line) No tactile effect The STOP AHEAD pavement marking
Chapter 5 DATA COLLECTION FOR TRANSPORTATION SAFETY STUDIES
 Chapter 5 DATA COLLECTION FOR TRANSPORTATION SAFETY STUDIES 5.1 PURPOSE (1) The purpose of the Traffic Safety Studies chapter is to provide guidance on the data collection requirements for conducting a
Roundabout Feasibility Memorandum
 Roundabout Feasibility Memorandum To From Gwen Pipkin Bill Howell Date June 18, 2013 Subject Roundabout Feasibility Study SR 29 PD&E Study From Oil Well Road to SR 82 Collier County, FL FPID 417540-1-22-01
Traffic Impact Analysis Walton Acres at Riverwood Athletic Club Clayton, NC
 Traffic Impact Analysis Walton Acres at Riverwood Athletic Club Clayton, NC 1. TABLE OF CONTENTS INTRODUCTION...1 1.1. Site Location and Study Area...1 1.2. Proposed Land Use and Site Access...2 1.3.
Route 28 (South Orleans Road)/Route 39 (Harwich Road)/Quanset Road Intersection
/Route 39 (Harwich Road)/Quanset Road Intersection") TRAFFIC FEASIBILITY STUDY Route 28 (South Orleans Road)/Route 39 (Harwich Road)/Quanset Road Intersection Orleans, Massachusetts Prepared for: Town of Orleans Prepared by: Fay, Spofford & Thorndike, LLC
TRAFFIC FEASIBILITY STUDY Route 28 (South Orleans Road)/Route 39 (Harwich Road)/Quanset Road Intersection Orleans, Massachusetts Prepared for: Town of Orleans Prepared by: Fay, Spofford & Thorndike, LLC
Lessons Learned from the Minnesota County Road Safety Plans. Richard Storm CH2M HILL
 Lessons Learned from the Minnesota County Road Safety Plans Richard Storm CH2M HILL May 21, 2014 Overview of the MN CRSP: Why Prepare Safety Plans for Local Systems? MAP-21: Requires states to address
Road Safety Audit Course Participant Guidebook. August 22 & 23, Cleveland Avenue Columbus, Ohio
 Road Safety Audit Course Participant Guidebook August 22 & 23, 2017 Cleveland Avenue Columbus, Ohio 1 2 Table of Contents Executive Summary... 5 Cleveland Avenue City of Columbus... 6 Road Location Details...
Traffic Control and Accidents at Rural High-Speed Intersections
 14 TRANSPORTATION RESEARCH RECORD 1160 Traffic Control and Accidents at Rural High-Speed Intersections KENNETH R. AGENT ln many Instances, when rural high-speed highways are constructed, there are a number
Chapter Twenty-eight SIGHT DISTANCE BUREAU OF LOCAL ROADS AND STREETS MANUAL
 Chapter Twenty-eight SIGHT DISTANCE BUREAU OF LOCAL ROADS AND STREETS MANUAL Jan 2006 SIGHT DISTANCE 28(i) Chapter Twenty-eight SIGHT DISTANCE Table of Contents Section Page 28-1 STOPPING SIGHT DISTANCE
Access Location, Spacing, Turn Lanes, and Medians
 Design Manual Chapter 5 - Roadway Design 5L - Access Management 5L-3 Access Location, Spacing, Turn Lanes, and Medians This section addresses access location, spacing, turn lane and median needs, including
Evaluation of M-99 (Broad Street) Road Diet and Intersection Operational Investigation
 Road Diet and Intersection Operational Investigation") Evaluation of M-99 (Broad Street) Road Diet and Intersection Operational Investigation City of Hillsdale, Hillsdale County, Michigan June 16, 2016 Final Report Prepared for City of Hillsdale 97 North Broad
Evaluation of M-99 (Broad Street) Road Diet and Intersection Operational Investigation City of Hillsdale, Hillsdale County, Michigan June 16, 2016 Final Report Prepared for City of Hillsdale 97 North Broad
Access Management in the Vicinity of Intersections
 Access Management in the Vicinity of Intersections FHWA-SA-10-002 Technical Summary Photo: Ralph Bentley (used with permission) 0 Access Management is: The design, implementation and management of entry
TRAFFIC SIGNAL WARRANT STUDY
 TRAFFIC SIGNAL WARRANT STUDY 5 th STREET & ENCHANTED PINES DRIVE JANUARY 2013 TRAFFIC OPERATIONS ENGINEERING SERVICES/PUBLIC WORKS DEPARTMENT TABLE OF CONTENTS INTERSECTION LOCATION MAP ii INTRODUCTION
TRANSPORTATION ANALYSIS REPORT US Route 6 Huron, Erie County, Ohio
 TRANSPORTATION ANALYSIS REPORT US Route 6 Huron, Erie County, Ohio December 12, 2012 Prepared for: The City of Huron 417 Main Huron, OH 44839 Providing Practical Experience Technical Excellence and Client
Traffic Circulation Study for Neighborhood Southwest of Mockingbird Lane and Airline Road, Highland Park, Texas
 ARIZONA TEXAS NEW MEXICO OKLAHOMA February 13, 2015 Mr. Meran Dadgostar P.E., R.S. Town of Highland Park 4700 Drexel Dr. Highland Park, Texas 75205 Re: Traffic Circulation Study for Neighborhood Southwest
Glenn Avenue Corridor Traffic Operational Evaluation
 Glenn Avenue Corridor Traffic Operational Evaluation PREPARED FOR: THE CITY OF AUBURN PREPARED BY: DECEMBER 2007 Glenn Avenue Corridor Study--Auburn, Alabama TABLE OF CONTENTS Introduction... 1 Background
CHAPTER 1 STANDARD PRACTICES
 CHAPTER 1 STANDARD PRACTICES OBJECTIVES 1) Functions and Limitations 2) Standardization of Application 3) Materials 4) Colors 5) Widths and Patterns of Longitudinal Pavement Marking Lines 6) General Principles
Figure 1: Vicinity Map of the Study Area
 ARIZONA TEXAS NEW MEXICO OKLAHOMA May 5, 2016 Mr. Anthony Beach, P.E. BSP Engineers 4800 Lakewood Drive, Suite 4 Waco, Texas 76710 Re: Intersection and Access Analysis along Business 190 in Copperas Cove
133 rd Street and 132 nd /Hemlock Street 132 nd Street and Foster Street MINI ROUNDABOUTS. Overland Park, Kansas
 133 rd Street and 132 nd /Hemlock Street 132 nd Street and Foster Street MINI ROUNDABOUTS Overland Park, Kansas September 1, 2017 TABLE OF CONTENTS 1. INTRODUCTION... 1 2. LITERATURE REVIEW... 1 3. CONCEPT
Traffic Impact Study. Westlake Elementary School Westlake, Ohio. TMS Engineers, Inc. June 5, 2017
 TMS Engineers, Inc. Traffic Impact Study Westlake Elementary School Westlake, Ohio June 5, 2017 Prepared for: Westlake City Schools - Board of Education 27200 Hilliard Boulevard Westlake, OH 44145 TRAFFIC
Engineering Countermeasures for Transportation Safety. Adam Larsen Safety Engineer Federal Highway Administration
 Engineering Countermeasures for Transportation Safety Adam Larsen Safety Engineer Federal Highway Administration 360-619-7751 Adam.Larsen@DOT.GOV Countermeasure Selection Resources Manual for Selecting
Traffic Impact Analysis Chatham County Grocery Chatham County, NC
 Chatham County Grocery Chatham County, NC TABLE OF CONTENTS 1. INTRODUCTION... 1 1.1. Location and Study Area... 1 1.2. Proposed Land Use and Access... 2 1.3. Adjacent Land Uses... 2 1.4. Existing ways...
MEMORANDUM. Charlotte Fleetwood, Transportation Planner
 MEMORANDUM Date: Updated August 22, 2017 To: Organization: Charlotte Fleetwood, Transportation Planner Boston Transportation Department From: Jason DeGray, P.E., PTOE, Regional Director of Engineering
What Engineering Can Do for You! Low Cost Countermeasures for Transportation Safety
 What Engineering Can Do for You! Low Cost Countermeasures for Transportation Safety Adam Larsen Safety Engineer Federal Highway Administration 360-619-7751 Adam.Larsen@DOT.GOV Adam Larsen TTP Safety Engineer
Toolbox of Countermeasures and Their Potential Effectiveness to Make Intersections Safer
 8 Toolbox of Countermeasures and Their to Make Intersections Safer Introduction Studies included in the NCHRP 17-18 (3), Guidance for Implementation of the AASHTO Strategic Highway Safety Plan, as well
DEPARTMENT OF ENVIRONMENTAL SERVICES. North Harrison Street (Lee Highway to Little Falls Road) Comparative Analysis. Prepared for:
 Comparative Analysis. Prepared for:") DEPARTMENT OF ENVIRONMENTAL SERVICES North Harrison Street (Lee Highway to Little Falls Road) Comparative Analysis Prepared for: Arlington County Department of Environmental Services 2100 Clarendon Boulevard,
DEPARTMENT OF ENVIRONMENTAL SERVICES North Harrison Street (Lee Highway to Little Falls Road) Comparative Analysis Prepared for: Arlington County Department of Environmental Services 2100 Clarendon Boulevard,
WEST AVENUE AND NEW ROAD TRAFFIC STUDY PART III WEST AVENUE CLOSURE ALTERNATIVES ANALYSIS
 WEST AVENUE AND NEW ROAD TRAFFIC STUDY PART III WEST AVENUE CLOSURE ALTERNATIVES ANALYSIS CITY OF LINWOOD ATLANTIC COUNTY, NEW JERSEY March 30, 2006 PREPARED FOR: City of Linwood 400 Poplar Avenue Linwood,
SCHOOL CROSSING PROTECTION CRITERIA
 CITY OF MADISON TRAFFIC ENGINEERING SCHOOL CROSSING PROTECTION CRITERIA January 2016 Adopted as Policy on August 31, 1976, by Common Council by Amended Resolution #29,540 Amended on September 14, 1976,
POWELL BUTTE HIGHWAY/NEFF ROAD INTERSECTION Interim Report: Existing Conditions, Needs, and Alternatives Review
 POWELL BUTTE HIGHWAY/NEFF ROAD INTERSECTION Interim Report: Existing Conditions, Needs, and Alternatives Review Date: December 30, 2013 Project #: 13963.0 To: Chris Doty PE and George Kolb, Deschutes County
CITY OF WEST LAKE HILLS. Forest View Neighborhood Traffic Calming Study
 CITY OF WEST LAKE HILLS 901 South Mopac Expressway Building V, Suite 220 Austin, Texas 78746 Texas P.E. Firm Registration No. F-929 Klotz Associates Final Report Submittal: March 20, 2015 Revised Final
TRAFFIC IMPACT ANALYSIS
 TRAFFIC IMPACT ANALYSIS FOR THE CHAMPAIGN UNIT#4 SCHOOL DISTRICT PROPOSED HIGH SCHOOL (SPALDING PARK SITE) IN THE CITY OF CHAMPAIGN Final Report Champaign Urbana Urbanized Area Transportation Study 6/24/2014
J-Turn An Intersection Safety Improvement Purdue Road School 2016 Tuesday, March 8, 2016 Brian Malone, INDOT & Josh Cook, HNTB
 J-Turn An Intersection Safety Improvement Purdue Road School 2016 Tuesday, March 8, 2016 Brian Malone, INDOT & Josh Cook, HNTB US 231 and SR 62 and SR 68 US 231 and SR 62 Intersection Traffic Data Traffic
INTERSECTION SAFETY STUDY State Route 57 / Seville Road
 INTERSECTION SAFETY STUDY State Route 57 / Seville Road City of Wadsworth, Medina County, Ohio Prepared For: City of Wadsworth Engineering Department 120 Maple Street Wadsworth, OH 44281 Prepared By: GPD
Edgemont Village Traffic and Parking Technical Report January 2014
 Edgemont Village Traffic and Parking Technical Report January 2014 In the fall of 2013, the District of North Vancouver engaged consultants to assess existing intersection and parking conditions in Edgemont
TRAFFIC CONTROL DEVICES ON EDGEWATER BOULEVARD AT PORT ROYAL AVENUE (NORTH)
") Attachment 2 DATE: August 6, 2012 TO: VIA: FROM: SUBJECT: Mayor and Members of the City Council James C. Hardy, City Manager Ramon Towne, Director of Public Works Leah Edwards, Assistant Engineer TRAFFIC
Attachment 2 DATE: August 6, 2012 TO: VIA: FROM: SUBJECT: Mayor and Members of the City Council James C. Hardy, City Manager Ramon Towne, Director of Public Works Leah Edwards, Assistant Engineer TRAFFIC
SCHOOL CROSSING PROTECTION CRITERIA
 CITY OF MADISON TRAFFIC ENGINEERING SCHOOL CROSSING PROTECTION CRITERIA AUGUST 1990 Adopted as Policy on August 31, 1976, by Common Council by Amended Resolution #29,540 Amended on September 14, 1976,
Proven Safety Countermeasures. FHWA Office of Safety January 12, :00 p.m. to 2:00 p.m. Eastern Time
 Proven Safety Countermeasures FHWA Office of Safety January 12, 2012 1:00 p.m. to 2:00 p.m. Eastern Time Introduction and Background While States should still be considering the application of all of the
ALLEY 24 TRAFFIC STUDY
 ALLEY 24 TRAFFIC STUDY in City of Frostburg, Maryland January 2013 3566 Teays Valley Road Hurricane, WV Office: (304) 397-5508 www.denniscorporation.com Alley 24 Traffic Study January 2013 Frostburg, Maryland
Acknowledgements. Mr. David Nicol 3/23/2012. Daniel Camacho, P.E. Highway Engineer Federal Highway Administration Puerto Rico Division
 Daniel Camacho, P.E. Highway Engineer Federal Highway Administration Puerto Rico Division Acknowledgements Mr. David Nicol Director, FHWA Office of Safety FHWA Office of Safety http://safety.fhwa.dot.gov/provencountermeasures/
Chapter 4 Traffic Analysis
 Chapter 4 Traffic Analysis PURPOSE The traffic analysis component of the K-68 Corridor Management Plan incorporates information on the existing transportation network, such as traffic volumes and intersection
Lincoln Avenue Road Diet Trial
 Lincoln Avenue Road Diet Trial Data Collection Report June 1, 2015 Department of Transportation Table of Contents I. Introduction...... 3 II. Data Collection Methodology & Results...... 5 A. Traffic Volume
Memorandum 1. INTRODUCTION. To: Cc: From: Denise Marshall Northumberland County
 255 Adelaide Street West Toronto, ON M5H 1X9 www.hdrinc.com File: 4.0 Memorandum To: Cc: From: Denise Marshall Northumberland County Tony Reitmeier HDR Guinevere Ngau HDR Andrew O Connor HDR Date: August
Safety at Unsignalized Intersections. Unsignalized Intersections
 Safety at FHWA Safety Focus Areas 2 National Statistics 3 National Statistics There were 41,059 highway fatalities in 2007. Where did they occur? Non-Intersections 79% About half of all crashes and half
METHODOLOGY. Signalized Intersection Average Control Delay (sec/veh)
") Chapter 5 Traffic Analysis 5.1 SUMMARY US /West 6 th Street assumes a unique role in the Lawrence Douglas County transportation system. This principal arterial street currently conveys commuter traffic
Chapter 5 Traffic Analysis 5.1 SUMMARY US /West 6 th Street assumes a unique role in the Lawrence Douglas County transportation system. This principal arterial street currently conveys commuter traffic
Addendum to SDDCTEA Pamphlet 55 17: Better Military Traffic Engineering Revision 1 Effective: 24 Aug Crosswalk Guidelines
 Addendum to SDDCTEA Pamphlet 55 17: Better Military Traffic Engineering Revision 1 Effective: 24 Aug 2017 Crosswalk Guidelines Warrants for Uncontrolled Crosswalk Locations Crosswalks at Midblock Locations
Existing Conditions. Date: April 16 th, Dan Holderness; Coralville City Engineer Scott Larson; Coralville Assistant City Engineer
 Date: April 16 th, 2015 To: From: Re: Dan Holderness; Coralville City Engineer Scott Larson; Coralville Assistant City Engineer Darian Nagle-Gamm, Traffic Engineering Planner Highway 6 (2 nd Street) /
Recent U.S. Research on Safety Evaluation of Low-Cost Road Engineering Safety Countermeasures Lessons for Canada
 Recent U.S. Research on Safety Evaluation of Low-Cost Road Engineering Safety Countermeasures Lessons for Canada Bhagwant Persaud Department of Civil Engineering, Ryerson University 350 Victoria Street,
Attachment No. 4 Approved by National Committee Council
 Attachment No. 4 Approved by National Committee Council The Signals Technical Committee distributed a technical committee recommendation to sponsors concerning pedestrian hybrid beacons following the January
Road Safety Assessments. Lt. Bob McCurdy Williamson County Sheriff s s Office Marion, IL.
 Road Safety Assessments Lt. Bob McCurdy Williamson County Sheriff s s Office Marion, IL. Why Are We Here? 2005 US Traffic Fatalities = 43,443 1429 4329 1361 1616 1534 3504 1729 3543 Illinois Annual Fatallities
Turn Lane Warrants: Concepts, Standards, Application in Review
 Turn Lane Warrants: Concepts, Standards, Application in Review David J. DeBaie P.E., P.T.O.E. 2004 ITE, District 1 Annual Meeting Burlington, Vermont Introduction Turning lanes at intersections reduce
Troutbeck Farm Development
 Troutbeck Farm Development Willistown Township, Chester County PA For Submission To: Willistown Township Last Revised: October, 4 TPD# INLM.A. 5 E. High Street Suite 65 Pottstown, PA 9464 6.36.3 TPD@TrafficPD.com
Traffic Study of Fuller Street, Cady Street, West Street and West Avenue. Final Report
 Traffic Study of Fuller Street, Cady Street, West Street and West Avenue Final Report July 2005 Prepared for: Town of Ludlow Prepared by: Pioneer Valley Planning Commission 26 Central Street West Springfield,
TRAFFIC SIGNALS OR ROUNDABOUT AT THIS UNUSUAL INTERSECTION?
 TRAFFIC SIGNALS OR ROUNDABOUT AT THIS UNUSUAL INTERSECTION? Presenting Author Phil Weber, P.Eng. GHD Inc. (The Home of Ourston Engineering) 11 Allstate Parkway, Suite 310 Markham, ON L3R 9T8 Phone (905)
Effects of Traffic Signal Retiming on Safety. Peter J. Yauch, P.E., PTOE Program Manager, TSM&O Albeck Gerken, Inc.
 Effects of Traffic Signal Retiming on Safety Peter J. Yauch, P.E., PTOE Program Manager, TSM&O Albeck Gerken, Inc. Introduction It has long been recognized that traffic signal timing can have an impact
Abstract. Background. protected/permissive operation. Source: Google Streetview, Fairview/Orchard intersection
 ITE 2015 Western District Annual Meeting Ada County Highway District s Flashing Yellow Arrow Initiative Primary Author: Tim Curns, PE Ada County Highway District Traffic Engineer Author: Andrew Cibor,
J Street and Folsom Boulevard Lane Conversion Project (T ) Before and After Traffic Evaluation
 Before and After Traffic Evaluation") J Street and Folsom Boulevard Lane Conversion Project (T15125400) Before and After Traffic Evaluation Prepared by Transportation Division June 2014 Executive Summary On February 12, 2013, the City of Sacramento
J Street and Folsom Boulevard Lane Conversion Project (T15125400) Before and After Traffic Evaluation Prepared by Transportation Division June 2014 Executive Summary On February 12, 2013, the City of Sacramento
2012 TOWN OF CASTLE ROCK MOTOR VEHICLE ACCIDENT FACTS PREPARED BY THE PUBLIC WORKS DEPARTMENT
 ATTACHMENT A 2012 TOWN OF CASTLE ROCK MOTOR VEHICLE ACCIDENT FACTS PREPARED BY THE PUBLIC WORKS DEPARTMENT ACKNOWLEDGEMENTS This report was assembled from data provided by the Castle Rock Police Department
City of Prince Albert Statement of POLICY and PROCEDURE. Department: Public Works Policy No. 66. Section: Transportation Issued: July 14, 2014
 Page: 1 of 8 1 POLICY 1.01 The City shall follow all of the specifications in the Manual of Uniform Traffic Control Devices for Canada, prepared by the National Committee of Uniform Traffic Control, and
Bureau of Planning and Research. Project No.: (C14) Phase II Final Report March 2, 2007 CMA
 Phase II Final Report March 2, 2007 CMA") Bureau of Planning and Research Safer Driver Actions at Stop Signs Project No.: 04-01 (C14) Phase II Final Report March 2, 2007 CMA Technical Report Documentation Page 1. Report No. 2. Government Accession
Bureau of Planning and Research Safer Driver Actions at Stop Signs Project No.: 04-01 (C14) Phase II Final Report March 2, 2007 CMA Technical Report Documentation Page 1. Report No. 2. Government Accession
INTERSECTION SAFETY AUDIT: STH 16/67 AND CTH Z
 WISCONSIN DEPARTMENT OF TRANSPORTATION INTERSECTION SAFETY AUDIT: STH 16/67 AND CTH Z OCONOMOWOC, WI WISCONSIN DEPARTMENT OF TRANSPORTATION INTERSECTION SAFETY AUDIT: STH 16/67 AND CTH Z OCONOMOWOC, WI
Lee Highway Corridor Analysis
 Arlington County, Virginia Prepared for: Arlington County Government Transportation Engineering and Operations Division April 6, 2004 Gorove/Slade Associates, Inc. 1140 Connecticut Avenue, Suite 700 1175
The Corporation of the City of Sarnia. School Crossing Guard Warrant Policy
 The Corporation of the City of Sarnia School Crossing Guard Warrant Policy Table of Contents Overview And Description... 2 Role of the School Crossing Guard... 2 Definition of a Designated School Crossing...
TRAFFIC IMPACT STUDY And A TRAFFIC SIGNAL WARRANT ANALYSIS FOR A SENIOR LIVING AND APARTMENT DEVELOPMENT
 TRAFFIC IMPACT STUDY And A TRAFFIC SIGNAL WARRANT ANALYSIS FOR A SENIOR LIVING AND APARTMENT DEVELOPMENT DEERFIELD TOWNSHIP, WARREN COUNTY, OHIO Nantucket Circle and Montgomery Road () Prepared for: ODLE
Traffic Impact Study WestBranch Residential Development Davidson, NC March 2016
 Traffic Impact Study WestBranch Residential Development Davidson, NC March 216 TRAFFIC IMPACT STUDY FOR THE WestBranch Residential Development LOCATED IN DAVIDSON, NC Prepared For: Lennar Carolinas, LLC
Characteristics of Traffic Accidents in Highway Work Zones
 Characteristics of Traffic Accidents in Highway Work Zones A DETAILED ANALYSIS OF WORK ZONE ACCIDENTS REPORTED ON NEW YORK STATE DEPARTMENT OF TRANSPORTATION CONSTRUCTION PROJECTS ESTABLISHED THE PREDOMINANT
BLOSSOM AT PICKENS SIGNALIZED INTERSECTION IMPROVEMENT STUDY
 BLOSSOM AT PICKENS SIGNALIZED INTERSECTION IMPROVEMENT STUDY Class Project Report for ECIV 542 Traffic Engineering Submitted by Omor Sharif Muchun Song Narges Kaveshgar Quyen Pham Chih-Yao Lin Submission
Donahue Drive Corridor Traffic Operational Evaluation
 Donahue Drive Corridor Traffic Operational Evaluation PREPARED FOR: THE CITY OF AUBURN PREPARED BY: JANUARY 2007 Donahue Drive Corridor Study--Auburn, Alabama TABLE OF CONTENTS Introduction... 1 Background
Harrah s Station Square Casino
 Transportation Analysis Harrah s Station Square Casino Pittsburgh, Pennsylvania Submitted To: City of Pittsburgh and Pennsylvania Gaming Control Board Prepared By: DKS Associates GAI Consultants December
Improving Pedestrian Safety at Unsignalized Crossings. Shawn Turner, P.E. Texas A&M Transportation Institute
 Improving Pedestrian Safety at Unsignalized Crossings Shawn Turner, P.E. Texas A&M Transportation Institute Overview of Presentation What are the issues/problems? Framework for crossing treatments Marked
ORANGE COUNTY PUBLIC WORKS TRAFFIC INVESTIGATIONS
 ORANGE COUNTY PUBLIC WORKS TRAFFIC INVESTIGATIONS STAFF REPORT OF: January 6, 2019 SUPERVISORIAL DISTRICT: 5 SUBJECT: LOCATION: INVESTIGATOR: O Neill Drive at Roanoke Drive; Ladera Ranch; TB 922-E6 Clever
Capital Region Council of Governments
 March 23, 2018 Capital Region Council of Governments PROJECT CONCEPT REPORT Realignment of Swamp and Northfield Road s approaches to Route 44 (Boston Turnpike) Town of Coventry SUMMARY: The Town of Coventry
City of Vestavia Hills Traffic Calming Policy for Residential Streets
 City of Vestavia Hills Traffic Calming Policy for Residential Streets PURPOSE: The purpose of the Traffic Calming Policy for Residential Streets is to address safety concerns related to vehicular traffic
Complete Street Analysis of a Road Diet: Orange Grove Boulevard, Pasadena, CA
 Complete Street Analysis of a Road Diet: Orange Grove Boulevard, Pasadena, CA Aaron Elias, Bill Cisco Abstract As part of evaluating the feasibility of a road diet on Orange Grove Boulevard in Pasadena,
A plan for improved motor vehicle access on Railroad Avenue in Provincetown
 A plan for improved motor vehicle access on Railroad Avenue in Provincetown February 2011 A plan for improved motor vehicle access on Railroad Avenue in Provincetown INTRODUCTION AND PROBLEM IDENTIFICATION
Designing for Pedestrian Safety
 Designing for Pedestrian Safety Treatments at Unsignalized Pedestrian Crossings Presented by: Charlie Zegeer PBIC Director August 17, 2010 Crossing Crashes Part 1: General Principles 3 2 Why do people
Roundabout Evaluations in Virginia: US 15/US 50 Gilberts Corner, VA SR 106/SR 634 Prince George County, VA
 Roundabout Evaluations in Virginia: US 15/US 50 Gilberts Corner, VA SR 106/SR 634 Prince George County, VA VDOT & FHWA Roundabout Workshop September 17, 2013 Chris Tiesler, PE Presentation Outline US 15/US
THE EFFECTIVENESS OF LOW-COST TRAFFIC CALMING APPLICATIONS APPROPRIATE FOR MAIN STREETS THROUGH RURAL COMMUNITIES
 THE EFFECTIVENESS OF LOW-COST TRAFFIC CALMING APPLICATIONS APPROPRIATE FOR MAIN STREETS THROUGH RURAL COMMUNITIES Eric R. Petersen Civil Engineering (M.S.) Student Iowa State University (515) 223-6534
Appendix A: Crosswalk Policy
 Appendix A: Crosswalk Policy Appendix A: Crosswalk Policy Introduction This citywide Crosswalk Policy is aimed at improving pedestrian safety and enhancing pedestrian mobility by providing a framework
1.3.4 CHARACTERISTICS OF CLASSIFICATIONS
 Geometric Design Guide for Canadian Roads 1.3.4 CHARACTERISTICS OF CLASSIFICATIONS The principal characteristics of each of the six groups of road classifications are described by the following figure
Project Report. South Kirkwood Road Traffic Study. Meadows Place, TX October 9, 2015
 Meadows Place, TX October 9, 2015 Contents 1 Introduction... 1 2 Data Collection... 1 3 Existing Roadway Network... 2 4 Traffic Volume Development... 2 5 Warrant Analysis... 3 6 Traffic Control Alternative
Bay to Bay Boulevard Complete Streets Project
 Bay to Bay Boulevard Complete Streets Project Dale Mabry Highway to Bayshore Boulevard February 08, 2018 Photo Source: Tampa Bay Times Alessandra Da Pra Meeting Format Introduction Resurfacing Information
ROUNDABOUTS/TRAFFIC CIRCLES
 GENERAL 1. Description This standard identifies minimum requirements that shall be met for Roundabouts and Neighborhood Traffic Circles in the design and construction of elements for Arlington County Horizontal
Findings on the Effectiveness of Intersection Treatments included in the Victorian Statewide Accident Black Spot Program
 Findings on the Effectiveness of Intersection Treatments included in the Victorian Statewide Accident Black Spot Program Nimmi Candappa, Jim Scully, Stuart Newstead and Bruce Corben, Monash University
MEMORANDUM. Date: 9/13/2016. Citywide Crosswalk Policy
 MEMORANDUM Date: 9/13/2016 Re: Citywide Crosswalk Policy Foreword Through the s Circulation Element and Complete Streets Policy, it is the City s goal to promote walking trips and provide safe facilities
Date: April 4, Project #: Re: A Street/Binford Street Traffic/Intersection Assessment
 To: Peter Cavanaugh General Electric From: David Bohn, PE Ryan White, PE Date: April 4, 217 Project #: 13421. Re: / Traffic/Intersection Assessment Consistent with the Cooperation Agreement between the
PINESTONE TRAFFIC IMPACT STUDY Travelers Rest, South Carolina
 PINESTONE TRAFFIC IMPACT STUDY Travelers Rest, South Carolina Prepared for Longbranch Development Prepared by January 13, 219 ii Table of Contents Subject Page Signature Page... i Table of Contents...
Traffic Signal Redesign 50% Design Report
 Traffic Signal Redesign 50% Design Report Joseph Davis, Jace Elkins, Jordan Weyrauch and Zach Crimmins CENE 486 Capstone J3Z Engineering March 10 th, 2016 Table of Contents 1.0 Project Description...1
INDUSTRIAL BUILDING 3009 HAWTHORNE ROAD CITY OF OTTAWA TRANSPORTATION OVERVIEW REVISED. Prepared for: Canada Inc.
 INDUSTRIAL BUILDING 3009 HAWTHORNE ROAD CITY OF OTTAWA TRANSPORTATION OVERVIEW REVISED Prepared for: 7849648 Canada Inc. Octiober 1, 2015 114-598 Overview_2.doc D. J. Halpenny & Associates Ltd. Consulting
INTERSECTION SITE SAFETY ASSESSMENTS DUBUQUE COUNTY, IOWA
 TECHNICAL MEMORANDUM To: Chandra Ravada, East Central Intergovernmental Association From: David Veneziano, Iowa LTAP Safety Circuit Rider and the RSA Team Date: August 6, 2018 Re: Safety Assessment Intersections
Draft North Industrial Area-Wide Traffic Plan
 Summary of North Industrial and Hudson Bay Industrial Recommended Improvements Table 1. Summary of s Item Location 1 2 3 4 5 6 7 8 9 10 11 12 Millar Ave north of 51st St Super 8 Motel back lane 400 Block
TRANSPORTATION FACILITY PLANNING Waugh Chapel Road Maytime Drive to New Market Lane
 July 24, 2018 TRANSPORTATION FACILITY PLANNING Waugh Chapel Road Maytime Drive to New Market Lane DPWandYOU.com Making a difference, together Meeting Agenda Purpose of the project Overview of work conducted
City of Albert Lea Policy and Procedure Manual 4.10 ALBERT LEA CROSSWALK POLICY
 4.10 ALBERT LEA CROSSWALK POLICY PURPOSE: Pedestrian crosswalks are an integral part of our transportation infrastructure. To be effective and promote safety, marked crosswalks must be installed after
Intersection Traffic Control Feasibility Study
 Intersection Traffic Control Feasibility Study CSAH 9 at CSAH 60 (185th Avenue) Prepared For: Dakota County Transportation Department Western Service Center 14955 Galaxie Avenue, 3rd Floor Apple Valley,
Intersection Control Evaluation Report Project: Alternative: Location: Evaluator:
 Report Project: Alternative: Location: Evaluator: Franklin/Interstate-15 Interchange City of Lake Elsinore, 33 40'13.08"N 117 18'34.30"W Jeffrey Hsu 1 Introduction Policy Directive 13-02 calls for the
Appendix A. Knoxville TPO Greenway Signage Guidelines. Appendix A: Knoxville TPO Greenway Signage Guidelines Knox to Oak Ridge Greenway Master Plan
 Appendix A Knoxville TPO Greenway Signage Guidelines 75 Overview: Adequate signing and marking are essential on shared-use paths, especially to alert bicyclists to potential conflicts and to convey regulatory
TRAFFIC STUDY. Birch Bluff Road / Pleasant Avenue 01/15/2018. City of Tonka Bay 4901 Manitou Road Tonka Bay, MN WSB PROJECT NO.
 TRAFFIC STUDY Birch Bluff Road / Pleasant Avenue 01/15/2018 City of Tonka Bay 4901 Manitou Road Tonka Bay, MN 55331 WSB PROJECT NO. 10805-000 Birch Bluff Road/ Pleasant Avenue Traffic Study For: City of
Monroe County Department of Transportation Vertical Curve Safety Study
 Monroe County, New York PREPARED FOR: Monroe County Department of Transportation 50 West Main Street Suite 6100 Rochester, NY 14614 PREPARED BY: 255 East Avenue Rochester, New York 14604 project # 434934
ENTUCKY RANSPORTATION C ENTER
 Research Report KTC-00-13 T K ENTUCKY RANSPORTATION C ENTER College of Engineering A-A HIGHWAY SAFETY STUDY Our Mission We provide services to the transportation community through research, technology