ANALYSIS OF TOWBOAT OPERATING AREAS
|
|
|
- Hilda McGee
- 5 years ago
- Views:
Transcription


1 The Navigation Economic Technologies Program March 6, 6 navigation economics technologies ANALYSIS OF TOWBOAT OPERATING AREAS US Army Corps of Engineers IWR Report 6-NETS-R-4
2 Navigation Economic Technologies The purpose of the Navigation Economic Technologies (NETS) research program is to develop a standardized and defensible suite of economic tools for navigation improvement evaluation. NETS addresses specific navigation economic evaluation and modeling issues that have been raised inside and outside the Corps and is responsive to our commitment to develop and use peer-reviewed tools, techniques and procedures as expressed in the Civil Works strategic plan. The new tools and techniques developed by the NETS research program are to be based on ) reviews of economic theory, ) current practices across the Corps (and elsewhere), ) data needs and availability, and 4) peer recommendations. The NETS research program has two focus points: expansion of the body of knowledge about the economics underlying uses of the waterways; and creation of a toolbox of practical planning models, methods and techniques that can be applied to a variety of situations. Expanding the Body of Knowledge NETS will strive to expand the available body of knowledge about core concepts underlying navigation economic models through the development of scientific papers and reports. For example, NETS will explore how the economic benefits of building new navigation projects are affected by market conditions and/or changes in shipper behaviors, particularly decisions to switch to non-water modes of transportation. The results of such studies will help Corps planners determine whether their economic models are based on realistic premises. Creating a Planning Toolbox The NETS research program will develop a series of practical tools and techniques that can be used by Corps navigation planners. The centerpiece of these efforts will be a suite of simulation models. The suite will include models for forecasting international and domestic traffic flows and how they may change with project improvements. It will also include a regional traffic routing model that identifies the annual quantities from each origin and the routes used to satisfy the forecasted demand at each destination. Finally, the suite will include a microscopic event model that generates and routes individual shipments through a system from commodity origin to destination to evaluate non-structural and reliability based measures. This suite of economic models will enable Corps planners across the country to develop consistent, accurate, useful and comparable analyses regarding the likely impact of changes to navigation infrastructure or systems. NETS research has been accomplished by a team of academicians, contractors and Corps employees in consultation with other Federal agencies, including the US DOT and USDA; and the Corps Planning Centers of Expertise for Inland and Deep Draft Navigation. For further information on the NETS research program, please contact: Mr. Keith Hofseth Dr. John Singley NETS Technical Director NETS Program Manager U.S. Department of the Army Corps of Engineers Institute for Water Resources Casey Building, 77 Telegraph Road Alexandria, VA The NETS program was overseen by Mr. Robert Pietrowsky, Director of the Institute for Water Resources.


3 March 6, 6 navigation economics technologies ANALYSIS OF TOWBOAT OPERATING AREAS Prepared by: Min Wook Kang Department of Civil and Environmental Engineering University of Maryland Paul Schonfeld Department of Civil and Environmental Engineering University of Maryland For the: Institute for Water Resources U.S. Army Corps of Engineers Alexandria, Virginia IWR Report 6-NETS-R-4
4
5 ANALYSIS OF TOWBOAT OPERATING AREAS Final Report Prepared for the Institute for Water Resources (IWR) By Min Wook Kang and Paul Schonfeld March 6, 6 Department of Civil and Environmental Engineering University of Maryland, College Park
6 TABLE OF CONTENTS EXECUTIVE SUMMARY...5. INTRODUCTION...6. ANALYTIC APPROACH Study Area Data..... Definition of Towboat Lockages Seasonal Variation of Towboat Lockages.... TOWBOAT MOVEMENTS Identification of Unique Towboats Using the UMR Locks during the Peak Tracking of Towboats during the UMR Off-peak Lock Use by Towboats in the Study Area CONCLUSIONS... ACKNOWLEDGEMENTS... REFERENCES... APPENDIX...6
7 LIST OF FIGURES Figure. Study Area... 8 Figure. Lock Names in the Study Area... Figure. Lock Numbers in the Study Area... Figure 4. Average Monthly Towboat Lockages by Districts (-4)... 4 Figure 5. Average Monthly Towboat Lockages for the UMR, Illinois, and Ohio (-4)... 5 Figure 6. Average Monthly Towboat-Locakges by the Unique Towboats Using the UMR Locks during the Peak (-4)... 6 Figure 7. Districts Visited by the 9% Unique Towboats during the UMR Off-peak... Figure 8. UMR Towboat Lockages during the Peak and Off-peak (-4)... 5 Figure 9. Illinois Towboat Lockages during the UMR Peak and Off-peak (-4)... 5 Figure. Ohio Towboat Lockages during the UMR Peak and Off-peak (-4)... 8 Figure. Tennessee Towboat Lockages during the UMR Peak and Off-peak (-4)... 8 Figure. Towboat Lockages on Gulf Intra-coastal Waterway during the UMR Peak and Offpeak (-4)... 9 Figure. Average Monthly Towboat Traffic of the 9% Unique Towboats at the UMR and IL Locks during the UMR Peak and Off-peak (-4)... 4 Figure 4 (a). Average Monthly Towboat Traffic of the 9% Unique Towboats at the Ohio Locks during the UMR Peak (-4)... 5 Figure 4 (b). Average Monthly Towboat Traffic of the 9% Unique Towboats at the Ohio Locks during the UMR Off-Peak (-4)... 6 Figure 5 (a). Average Monthly Towboat Traffic of the 9% Unique Towboats in the Lower MVD, SWD, and SAD during the UMR Peak (-4)... 7 Figure 5 (b). Average Monthly Towboat Traffic of the 9% Unique Towboats in the Lower MVD, SWD, and SAD during the UMR Off-Peak (-4)... 7
8 LIST OF TABLES Table. Analytic Tasks for Identifying the Impact of the UMR Seasonality... 6 Table. Districts in the Study Area... 7 Table. Locks in the Study Area... 9 Table 4. Three Notable States of UMR Towboat Traffic over Months... 5 Table 5. Tracking Results for the 9% Towboats during the UMR Off-Peak (-4)... 7 Table 6. Off-peak States of the 9% Unique Towboats... Table 7. Lock Use by Towboats in the UMR and Illiois Systems (-4)... 4 Table 8. Lock Use by Towboats in the Ohio and Its Tributaries (-4)... 6 Table 9. Lock Use by Towboats in the Lower MVD and SWD (-4)... Table. Lock Use by Towboats in the SAD, NAD, and NWD (-4)... 4
9 EXECUTIVE SUMMARY Towboats migrate to the Upper Mississippi River (UMR) during the early spring and out of it in late fall; thus, seasonal variation in the system use would be significant and also affect other river basins. Therefore, it should be noted that serious distortions could result in analyzing this waterway system unless we take such seasonal fluctuations into account. According to several studies on UMR lock operation (-), the seasonality is driven not only by the UMR s physical operating conditions (freezing during winter) but also by the seasonal variation in demand (e.g., grains and coal shipments). Among these, Sweeney (4) and Center for Transportation Studies (CTS) at the University of Missouri St. Louis (5), which largely motivated the present analysis, indicate that towboats which choose to operate on the UMR system during the peak period move outside that system and operate during the winter because they can thus earn greater profit. Those studies suggest that the towboats are always busy. However, it should be noted that some towboats may not operate during the winter due either to lack of demand or the freezing the UMR. In order to identify the fraction of the towboats that continue to operate during the winter and their winter operation areas, (i) three distinct UMR time frames are specified based on its monthly towboat traffic; peak (April through November), off-peak (January and February), and transition periods (December and March). In addition, (ii) we determine the unique towboats that contribute most UMR towboat lockages during the peak and (iii) try to track them during the off-peak. The tracking results during the winter for every unique towboat in the 9% group as well as lock use by towboats throughout the study area are the main outputs of the analysis. However, it should be noted that the tracking results may miss some vessels that operate without passing through locks since they depend on lock data (OMNI for -4) from the U.S. Army Corps of Engineers. The study area of this analysis includes all divisions of the U.S. waterway system to which the towboats serving the UMR can realistically shift in winters. It is found that during the UMR off-peak towboats hardly operate upstream of UMR Lock #5 and decrease their operation significantly in the segment bounded by UMR Locks #6 and #7. In addition, towboat lockages at the lower Illinois (IL) locks (#7 and #8) increase during the UMR off-peak due to towboats shifting from the UMR. Ohio (OH) towboat lockages decrease slightly during the UMR off-peak; however, towboats shifting from the UMR to Ohio during the off-peak have more Ohio lockages than those generated by towboats shifting during the peak. Finally, it seems that the UMR seasonality affects mostly the Illinois, Ohio and the UMR itself. Detailed results are summarized in the conclusions of this report. These results are intended to support the development of the NASS navigation simulation model and help improve the effectiveness of the U.S. inland waterways. 5
10 . INTRODUCTION The Upper Mississippi River (UMR), which has 9 lock and dam facilities along it, carries a large fraction of the cargo moving on the U.S. inland waterways. It periodically experiences severe congestion (particularly at the lower UMR locks) due to seasonal variations in system use as well as to the relatively short (6 ft) lock chambers provided at most locks. Many towboats now exceed the 6 ft length and require relatively slow double cut lockages. According to Sweeney (4) and the UMSL Center for Transportation Studies (CTS) (5), the UMR seasonality is evident because the operating conditions become extremely difficult or impossible in winter due to the freezing of the river and demand (e.g., grains and coal shipments) is seasonal as well. Many towboats migrate to the UMR during the early spring and out of it in late fall; cyclic influx and efflux of towboats to the UMR has been observed in the previous studies (-). The objective of this analysis is to understand characteristics of the UMR towboat operation and provide practical information about towboat use in the study area for the UMR navigation system simulation (NaSS) model, which is being developed by the U.S. Army Corps of Engineers. Some obvious questions that provide the major impetus for this analysis are listed below. When are the peak and off-peak seasons for the UMR towboat operation? What fractions of the towboats that normally operate on the UMR in summers continue to operate during in winters? Where else (if anywhere) do they go? What is the impact of the UMR seasonality on the other river systems? We hope the answer to the questions will help support the development of the NaSS model by identifying seasonal operating patterns and interactions among various rivers; furthermore, the analysis procedures presented in this study should help in developing demand and equipment assignment inputs for simulating waterways. Table presents the analytic tasks conducted in this study to resolve the questions. The study area, data, and definition of towboat lockages required for the analytic tasks are illustrated in the next sections. Table. Analytic Tasks for Identifying the Impact of the UMR Seasonality Task Identify seasonal variation of towboat lockages at the UMR system over months Task Determine the departing and entering periods of the towboats to the UMR system Task Identify the number and IDs of unique towboats required to account for most (9%) UMR towboat lockages during non-freezing condition Task 4 Determine the state of the unique towboats during the winter (whether they continue to use locks or not and where they operate) Task 5 Compare total towboat lockages and the lockages attributable to the unique towboats 6
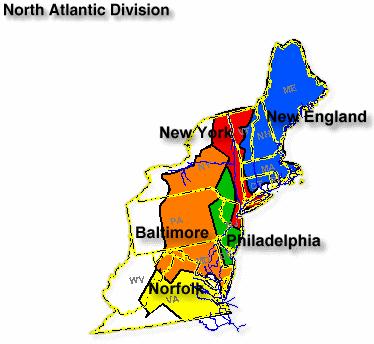
11 . ANALYTIC APPROACH.. Study Area The study area of this analysis includes all divisions of the U.S. waterway system in which the towboats serving the UMR locks can realistically operate. The Pacific Ocean Division (POD) is excluded in the study area since towboats are assumed to stay on inland waterways. Figure shows districts in the study area by divisions. The official symbol and Engineer Reporting Organization Code (EROC) of each district in the study area are shown in Table. Table. Districts in the Study Area Name Official Symbol EROC Mississippi Valley Division MVD B St. Paul District MVP B6 Rock Island District MVR B5 St. Louis District MVS B Memphis District MVM B Vicksburg District MVK B4 New Orleans District MVN B Great Lakes & Ohio River Division LRD H Huntington District LRH H Louisville District LRL H Nashville District LRN H Pittsburgh District LRP H4 Buffalo District LRB H5 Chicago District LRC H6 Detroit District LRE H7 North Atlantic Division NAD E Baltimore District NAB E New York District NAN E Norfolk District NAO E4 Philadelphia District NAP E5 New England District NAE E6 Southwestern Division SWD M Fort Worth District SWF M Galveston District SWG M Little Rock District SWL M4 Tulsa District SWT M5 South Atlantic Division SAD K Charleston District SAC K Jacksonville District SAJ K Mobile District SAM K5 Savannah District SAS K6 Wilmington District SAW K7 Northwestern Division NWD G Portland District NWP G Seattle District NWS G Walla Walla District NWW G4 Kansas City District NWK G5 Omaha District NWO G6 South Pacific Division SPD L Los Angeles District SPL L Sacramento District SPK L San Francisco District SPN L Albuquerque District SPA L4 7


12 Figure. Study Area Figures are quoted from the Navigation Data Center of the U.S. Army Corps of Engineers 8
13 In the current inland waterway system, locks are critical data-collection points at which various kinds of information about vessel movements are recorded, including unique ID, start and end of lockage time and travel direction of the vessel. Our analysis track vessels movements based on the information recorded at locks. Table shows the locks on various rivers in the districts of the study area. Many districts in the study area (e.g., all districts in the South Pacific Division (SPD) and Memphis (MVM), Baltimore (NAB), Philadelphia (NAP), New England (NAE), Fort Worth (SWF), Charleston (SAC), Kansas City (NWK), and Omaha (NWO) districts) have no locks on their rivers. Most locks in Table are shown in Figures and ; however, some locks shaded in the table are not presented in the figures since towboat lockages are never observed in such areas. It is noted that the unique lock numbers presented in Figure (rather than the lock names) are used throughout this report. Table. Locks in the Study Area Division MVD LRD District (EROC) MVP (B6) MVR (B5) MVS (B) MVK (B4) MVN (B) River (Code) # of Locks Names of Lock Mississippi River (MI),,, 4, 5, 5A, 6, 7, 8, 9,, Upper St. Anthony Falls, Lower St. Anthony Falls Illinois River (IL) 8 Lagrange, Peoria, Starved Rock, Marseilles, Dresden Island, Brandon Road, Lockport, Thomas J. O Brien Mississippi River (MI),,, 4, 5, 6, 7, 8, 9,,, Kaskaskia River (KS) Kaskaskia Mississippi River (MI) 4 4, 5, 6 (Melvin Price), 7 Ouachita and Black Rivers (OB) 6 Jonesville, Columbia, Felsenthal, H.K. Thatcher, 6, 8 Red River (RR) 5 L.C. Boggs, John H. Overton,, Russell B. Long, Joe D. Waggonner Pearl River (PR),, Old River (OD) Old River Atchafalaya River (AT) Berwick Gulf Intra-coastal Waterway (GI) Port Allen, Bayou Sorrel, Inner Harbor Navigation Canal, Algiers, Harvey, Bayou Boeuf, Leland Bowman, Calcasieu, Schooner Bayou Control Structure, Catfish Point Control Structure Bayou Tech (BT) Keystone Freshwater Bayou (FB) Freshwater Bayou Calcasieu River (CA) Calcasieu Salt Water Barrier LRH Kanawha River (KA) Winfield, Marmet, London (H) Ohio River (OH) 6 Willow Island, Belleville, Racine, Greenup, Robert C. Byrd, Capt. A. Meldahl, LRL Green & Barren R. (GB) 4, (H) Ohio R. (OH) 9 Olmsted, 5, 5, Smithland, J.T. Myers, Newburgh, Cannelton, McAlpine, Markland LRN Clinch River (CI) Melton Hill (H) Cumberland River (CU) 4 Barkley, Cheatham, Old Hickory LRP (H4) Tennessee River (TN) 9 Kentucky, Pickwick, Wilson, Wheeler, Guntersville, Nickajack, Chickamauga, Watts Bar, Ft. Loudon Allegheny River (AG) 8,, 4, 5, 6, 7, 8, 9 Monongahela River (MN),, 4, Maxwell, Grays Landing, 7, Point Marion, Morgantown, Hidebrand, Opekiska Ohio River (OH) 6 Hannibal, Pike Island, New Cumberland, Montgomery, Dashields, Emsworth 9
14 Division LRD SWD District (EROC) LRB (H5) LRE (H7) River (Code) # of Locks Names of Lock Black Rock Channel & Black Rock Tonawanda Harbor (BR) Fox River (FX). 9 De Pere, Litle Kaukauna, Rapide Croche, Kaukauna Guard, Kaukauna ~5, Little Chute Guard, Little Chute, Upper Little Chute Combined, Lower Little Chute Combined, Cedars, Appleton ~4, Menasha St. Marys River (SM) 4 Sabin, Davis, New Poe, MacArthur The Inland Route (IN) Alanson LRC (H6) Chicago Harbor Cha. Chicago SWL McClellan-Kerr Arkansas River (M4) Navigation System (MK) SWT (M5) McClellan-Kerr Arkansas River Navigation System (MK) Norrell,, Joe Hardin, Emmett Sander, 5, David D. Terry, Murray, Toad Suck Ferry, Arthur V. Ormond, Dardanelle, Ozark, James W. Trimble 5 W.D. Mayo, Robert S. Kerr, Webbers Falls, Chouteau, Newt Graham SAD SWG (M) SAM (K5) SAJ (K) Gulf Intra-coastal Waterway 4 Colorado River East, Colorado River West, Brazos East (GI) Gate, Brazos West Gate Alabama-Coosa River (AL) Claiborne, Millers Ferry, Robert F. Henry Black Warrior & Tombigee Rivers (BW) 6 Coffeeville, Demopolis, Selden, William Bacon Oliver, Holt, John Hollis Bankhead Tennessee Tombigbee Waterway (TT) Howell Heflin, Tom Bevill, John C. Stennis, Aberdeen, Amory, Glover Wilkins, Fulton, John Rankin, G.V. Sonny Montgomery, Jamie L. Whitten Apalachicola, and Jim Woodruff, George W. Andrews, Walter F. George Chattahoochee Flint Rivers (AP) Canaveral Harbor (CN) Canaveral Cross Florida Barge Canal (CF) Henry Holland Buckman, Eureka, Inglish Okeechobee Waterway (OK) 5 St. Lucie, Port Mayaca, Moore Have, Ortona, W.P. Franklin Lock and Control Structure Oklawaha River (OL) Moss Bluff SAS (K6) Savannah River (SV) New Savannah Bluff SAW (K7) Cape Fear River (FR),, William O. Huske NAD NWD NAN (E) Hudson River (HU) Troy NAO (E4) Atlantic Intra-Coastal Waterway (AI) Great Bride Lock (Albemarle & Chesapeak Canal) Dismal Swamp Canal Route Deep Creek, South Mills (DS) NWS Lake Washington Ship Canal Hiram M. Chittenden (G) (WS) NWP Willamette River (WI) Willamette Falls -4, Willamette Falls Guard (G) Columbia River (CO) Bonneville, The Dalles, John Day NWW Columbia River (CO) McNary (G4) Snake River (SN) 4 Ice Harbor, Lower Monumental, Little Goose, Lower Granite.. Data U.S. Army Corps of Engineers OMNI data compiled from through 4 are used to conduct this analysis; vessel IDs and types, locations of lockage (i.e., lock, river, and district codes), travel directions, and times of lockages are extracted from the OMNI data.
15 #8 Minneapolis/St. Paul LRE (H7) #7 #6 Upper and Lower St. Anthony Falls LRP (H4) #5 # # MVP (B6) #4 # #4 # #5 #5a # #6 #9 #8 Emsworth #7 LRC (H6) Dashields Pittsburgh # # Chicago # # # Montgomery # Chicago Maxwell #4 New Cumberland Grays Landing #5 #4 T. J. O'Brien Pont Marion Brandon Road Lockport Pike Island Morgantown Hildebrand Dresden Island Davenport Rock Island Opekiska Marseilles Hannibal #6 Starved Rock #7MVR (B5) Willow Island #8 # #9 Racine Belleville # Cincinnati Kansas City Peoria Capt. Anthony Markland Robert C. Byrd # #4 Winfield LaGrange Greenup #5 Louisville Marmet Melvin Price McAlpine Huntington #7 St. Louis Evansville Cannelton London Newburgh John T. Myers # LRL(H) Boomer Kaskaskia MVS (B) Smithland # #5 #5 Barkley Cheatham Cordell Hull Cairo LRH (H) N Kentucky Old Hickory Nashville Olmsted SWT (M5) Newt Graham Chouteau Webbers Falls Robert S. Kerr W.D. Mayo James W. Trimble Ozark Arthur V. Ormond Dardanelle Toad David D. Terry Murray Suck Ferry Emmett Sanders #5 SWF (M) SWG (M) Brazos East & West Gates Colorado River East & West SWL (M4) Joe Hardin # Norrell #8 Joe D. Waggonner #6 Russel B. Long # Memphis Columbia H.K. Thatcher Felsenthal John H. Overton L.C. Boggs Calcasieu Sault Water Barrier MVN (B) Calcasieu MVM (B) Catfish Point Jonesville Older River Freshwater Bayou Pickwick Landing Berwick Wilson Keystone Port Allen Leland Bowman Schooner Bayou MVK (B4) Bayou Boeuf Bayou Sorrel Harvey Algiers General Joseph Wheeler Jamie L. Whitten IHNC # # # John C. Stennis LRN (H) Melton Hill Knoxville Watts Bar Ft. Loudon G.V. Sonny Montgomery John Rankin Fulton Glover Wilkins Amory Tom Bevill Howell Heflin Chickamauga Nickajack Guntersville Aberdeen Demopolis Coffeville Holt Milliam Bacon Oliver Selden John Hollis Bankhead Millers Ferry Claiborne Robert F. Henry SAM (K5) Walter F. George George W. Andrews Jim Woodruff #9 S Locks Cities SAS (K6) SAJ (K) Figure. Lock Names in the Study Area Locks which are shaded in Table are not covered within Figure.
16 Calcasieu River (CA) #48 Minneapolis/St. Paul LRE (H7) #47 #46 #5 #5 LRP (H4)#45 # # MVP (B6) #44 # #4 #4 #5 #55 #4 #6 #9 #8 # # #7 LRC (H6) Pittsburgh # # Chicago # # # # # #4 Chicago #4 #5 #5 #4 #6 #4 # # # #8 #5 #9 # Davenport Rock Island #5 #7 # #6 #6 #7MVR (B5) #8 #7 # #9 # #7 Kansas City Cincinnati #5 # # # #8 #4 #4 #4 #6 # #5 Louisville #6 #4 Huntington # #7 St. Louis Evansville #76 #75 # LRL(H) MVS (B) # #77 # # Boomer #78 #5 #5 # Cairo # # # Olmsted #4 LRH (H) N SWT (M5) LRN (H) Mississippi River (MI) Missouri River (GB) Mississippi River (MI) McClellan-Kerr Arkansas River Navigation System (MK) SWF (M) SWG (M) # # #5 #4 # # # # # # #9 #8 #7 #6 #5 #4 # # # #8 #6 #45 #44 #4 # # #4 GI SWL (M4) Ouachita and Black River (OB) Red River (RR) MVN (B) White River #4 # #8 Kaskaskia River (KS) Memphis MVM (B) # Mississippi River (MI) # #4 #4 Bayou Teche (BT) #77 Vermilion River # # #4 Freshwater Bayou (FB) Atchafalya River (AT) Illinois River (IL) #5 # #6 Green & Barren River (GB) Nashville Cumberland River (CU) # Tennessee River (TN) # # #5 #4 # #4 Tennessee Tombigbee Waterway (TT) MVK (B4) GI Pearl River (PR) # Ohio River (OH) # # # #6 #5 #5 #49 #48 #47 #46 #45 #44 #4 #4 Pascugoula River (CI) Clinch River # #9 #8 #7 Big Sandy River Knoxville # # (KA) Kanawha River Alabama-Coosa River (AL) # Gulf Intracoastal Waterway (GI) #4 # # Muskingum River # #6 #5 #4 # Beaver River Black Warrior & Tombigee Rivers (BW) # # # Monongahela River (MN) SAM (K5) Apalachicola, & Chattahoochee Flint Rivers (AP) #49 (AG) Allegheny River Youghiogheny River S Locks Cities SAS (K6) SAJ (K) Figure. Lock Numbers in the Study Area Locks which are designated as in Figure
17 .. Definition of Towboat Lockages We try to identify all towboats passing through locks in the study area to track movements of the unique towboats utilizing the UMR locks. However, it is noted that the tracking process may miss some vessels that are operating but are not traveling through locks. In this study, towboat lockages at a lock are defined as lockages by towboats, whether in tow or light, that pass through the lock. For example, if one towboat carrying several barges and three other towboats moving as light boats pass through a certain lock together, the number of towboat lockages for this movement is counted as four. However, counting and identifying towboats at a lock may be difficult since some light boats are locked together with a towboat carrying barges, without being clearly identified. In the current data recording system (such as LPMS and OMNI) some records show that x number of light boats are locked with a specific towboat; however, the information about those light boats is not recorded. The limitations and quality of the data recording system are well summarized in a recent study by Lisney (5)..4. Seasonal Variation of Towboat Lockages As shown in Figure 4, towboat lockages are steadily distributed over months for most districts in the study area; however, those for the districts in the northern part of the Mississippi Valley Division (MVD) (i.e., Saint Paul (MVP), Rock Island (MVR), and Saint Louis (MVS)) fluctuate. This indicates that monthly towboat lockages in districts in the northern MVD are seasonal; however, those at the other districts are largely uniform. It is noted that the UMR, Illinois, and Ohio are three major rivers which are closely connected in the northern MVD (particularly in the MVS) so that towboats can easily shift among those rivers. Thus, seasonal use of towboats on one of those three rivers may affect the other two. Towboat operation in the UMR system is not stable; towboats enter the UMR system in the early spring and leave the system in late fall. According to Sweeney (5) and the CTS at the University of Missouri St. Louis (5), towboats that choose to operate on the UMR system during the peak period exit the UMR during the winter because they can earn higher profits elsewhere. Those studies imply that the towboats are always busy; however, some towboats may not operate during the winter due either to freezing of the river or lack of demand. In order to identify the fraction of the towboats that continue to operate during the winter, three distinct UMR time frames are specified based on its monthly towboat traffic over months. Based on the specified periods, we determine the unique towboats which contribute most UMR lockages during the peak period and then try to track them during the off-peak. Additionally, there are no recorded towboat lockages in the Buffalo (LRB), Chicago (LRC), Detroit (LRE), and New York (NAN) districts despite the presence of locks, as shown in Figure 4. This suggests that traffic in those districts is mostly recreational; hence, we disregard those districts in the study area.
18 9, 8, 7, 6, 5, 4,,,, Mississippi Valley Division (MVD) (a) Great Lakes and Ohio River Division (LRD) (b) 9, 8, 7, 6, 5, 4,,,, Month Month MVP MVR MVS MVK MVN Avg. Towboat-Lockages Avg. Towboat-Lockages LRN LRL LRH LRP LRB LRE LRC Southwestern and Northwestern Divisions (SWD & NWD) 4,,5,,5,,5, (c) South and North Atlantic Divisions (SAD & NAD) 4,,5,,5,,5, Month Month (d) SWG SWL SWT NWP NWS NWW SAJ SAM NAN NAO Avg. Towboat-Lockages per month per month Avg. Towboat-Lockages per month per month Figure 4. Average Monthly Towboat Lockages by Districts(-4) 4
19 Figure 5 presents average monthly towboat lockages over months for the three distinct rivers (the UMR, Illinois, and Ohio) during -4. As shown in Figure 5, the average monthly towboat lockages in the UMR system fluctuate seasonally while there is no significant seasonal variation in the Ohio and Illinois. In the UMR system, towboats generate steadily many lockages in April through November and steadily few lockages during January and February. Furthermore, distinct transition stages are evident between the peak and off-peak periods. We subdivide the UMR towboat traffic into three different stages (Peak, Off-Peak, and Transition) and summarize them in Table 4. It has been observed that 88 unique towboats operate in the UMR in a year, on average. Among them only 5% (49 towboats) operate during the off-peak while 96% (778 towboats) operate during the peak. This statistic shows that many peak-period towboats on the UMR would cease their operation or move elsewhere during the off-peak of the UMR. Towboat-lockages per month Avg.,, 8, 6, 4,, Towboat lockages during the transition periods Towboat lockages during the peak period Towboat lockages Month during the off-peak period UMR Illinois Ohio Figure 5. Average Monthly Towboat Lockages for the UMR, Illinois, and Ohio (-4) Table 4. Three Notable States of UMR Towboat Traffic over Months Peak Transition Off-Peak Entire Period Apr. through Nov. Mar. and Dec. Jan. through Feb. Jan. through Dec. Towboat Traffic High and Steady Fluctuating Low and Steady - Number of Operating Tows, on Average
20 . TOWBOAT MOVEMENTS.. Identification of Unique Towboats Using the UMR Locks during the Peak In section.4., we specified three distinct time frames for the UMR system (peak, offpeak, and transition periods). Now we try to determine unique towboats that normally operate in the UMR system during the peak and that contribute most peak-period UMR lockages. In order to identify the unique towboats having such characteristics, we define the unique towboats required to account for 9% of peak-period UMR towboat lockages. Figure 6 shows cumulatively the average towboat lockages generated by each unique towboat using the UMR locks during the peak period. The busiest towboats (starting with #) are on the left. It is noted that among the 778 unique towboats using the UMR locks during the peak period (refer to Table 4), the top towboats generate 9% of the peak-period UMR towboat lockages. These towboats are tracked during the off-peak period in the next section, using the observed lockage information from the UMR and other rivers..% Avg. Towboat-Lockages per month The No. of Unique Towboats Required to Account for 9% of Peak Period Towboat-Locakges in UMR Number of Unique Towboats No. of Lockages Cumulative % % 9.% 8.% 6.% 4.%.%.% Figure 6. Average Monthly Towboat Lockges Generated by the Unique Towboats Using the UMR Locks during the Peak Period (-4) 6
21 .. Tracking of Towboats during the UMR Off-peak (Jan. and Feb.) In this section the unique towboats in the 9% group ( in total) are tracked individually during the UMR off-peak. The tracked information for each unique towboat, including its observed off-peak lockages (average monthly) in different river systems, is presented in every line of Table 5. It is noted that during the off-peak period, the unique towboats are never observed outside the rivers presented in Table 5. In addition, numbers presented in the leftmost column of Table 5 specify the ranks of the busiest unique towboats during the UMR peak based on their observed lockages (in the second left column in Table 5). The shaded cells in Table 5 indicates whether each unique towboat is observed in corresponding rivers. This shows that the unique towboats are mostly observed in the UMR, Illinois, and Ohio systems during the off-peak and slightly in the Tennessee River (TN), McClellan-Kerr Arkansas River Navigation System (MK), and Gulf Intra-coastal Waterway (GI). More interestingly: (i) the top three unique towboats, which generate considerable UMR lockages during the peak, are not observed at any locks in the study area during the off-peak; furthermore, (ii) UMR lockages by most unique towboats decrease significantly during the off-peak (refer to left second and fourth columns in Table 5). Presumably, these are two of the main reasons why total UMR towboat lockages decrease significantly during the off-peak. Decrease overall Table 5. Tracking Results for the 9% Towboats during the UMR Off-Peak (-4) 45 Average Monthly Towboat Lockages Generated by the 9% Unique Towboats Unit: Towboat Lockages/month Rank 4 of the During the UMR Peak During the UMR Off-peak Unique Tows Outside In the UMR Outside the UMR 5 In the UMR the UMR (%of the peak) IL OH TN CU GB MN MK OD OB GI TT Total 5 (%) 58 (%) (%) 4 74 (6%) (%) (5%) (4%) (9%) 8 7 (7%) (4%) (8%) (9%) 4 67 (8%) (%) (5%) (%) (%) (%) (9%) (7%) (%) (%) The busiest unique towboats during the UMR peak (starting with # ) are on the top. 5 Refer to Table for river codes. The unique tows are never observed in the other rivers absent from Table 5. 7
22 Average Monthly Towboat Lockages Generated by the 9% Unique Towboats Unit: Towboat Lockages/month Rank of the During the UMR Peak During the UMR Off-peak Unique Tows Outside In the UMR Outside the UMR In the UMR the UMR (%of the peak) IL OH TN CU GB MN MK OD OB GI TT Total (%) (%) (%) (5%) (%) (%) (5%) (%) 58 7 (%) 58 6 (5%) (%) 58 4 (%) (%) (9%) (7%) (5%) (5%) (5%) (9%) (%) (5%) (%) (%) 45 5 (%) (5%) (%) (4%) (%) (8%) (5%) (6%) (%) (6%) (4%) (%) (%) (5%) (%) (7%) (%) (%) (7%) (9%) (5%) (4%) (%) (%) (8%) (5%) (%) (5%) (%) (6%) (%) (%) (9%) 78 5 (9%) 4 8 (%) 8 (%) (%) 8 5 (%) (6%)
23 Average Monthly Towboat Lockages Generated by the 9% Unique Towboats Unit: Towboat Lockages/month Rank of the During the UMR Peak During the UMR Off-peak Unique Tows Outside In the UMR Outside the UMR In the UMR the UMR (%of the peak) IL OH TN CU GB MN MK OD OB GI TT Total (9%) (4%) (%) (4%) (4%) (%) (%) 9 7 (%) 9 5 (%) (7%) (8%) (%) (%) 97 4 (%) (5%) 4 6 (5%) (5%) 9 6 (%) 9 9 (%) (%) (%) (%) (%) 4 9 (%) (%) (%) 8 (%) 8 (%) 7 (%) (4%) (9%) (9%) (6%) 7 6 (6%) 7 6 (%) 7 6 (%) (9%) (9%) (9%) (7%) (%) (7%) (%) (%) (%) 4 5 (7%) (%) 4 (7%) (%) 4 6 (7%) (%) 4 5 (%) (%) (%) 4 4 (%) 4 5 (7%) 4 6 (4%) 4 4 (%) (%) 4 (%) (%)
24 Average Monthly Towboat Lockages Generated by the 9% Unique Towboats Unit: Towboat Lockages/month Rank of the During the UMR Peak During the UMR Off-peak Unique Tows Outside In the UMR Outside the UMR In the UMR the UMR (%of the peak) IL OH TN CU GB MN MK OD OB GI TT Total 4 (%) 47 (%) 47 (%) 47 (%) 47 (%) 47 (%) 47 (%) 47 4 (%) 47 (7%) (5%) (%) (%) 47 (%) 47 (%) 6 8 (7%) (9%) (%) 6 (8%) 6 (%) 65 5 (%) (%) (8%) 65 (%) 65 (%) (%) (%) (%) (%) (%) (%) (%) 7 9 (%) (5%) (%) (%) (%) (5%) 78 8 (6%) (%) (%) (%) (88%) (%) (%) (%) (86%) (86%) (7%) (9%) (9%) (%) 9 7 (%) (9%) (%) (%) (%) (4%) (67%) Total 6,444,7 676 (%) 84, ,474 Decrease significantly Increase
25 In order to identify off-peak (winter) states of the unique towboats inside and outside the UMR system, four types of off-peak lockage levels are specified based on the judgment rules listed below. Negligible: at most observed off-peak lockages per month on average Light: to 6 observed off-peak lockages per month on average Moderate: 7 to 9 observed off-peak lockages per month on average Heavy: at least observed off-peak lockages per month on average It is noted here that according to Table 5 (left second column), every unique towboat in the 9% group generates at least 7 UMR towboat lockages (monthly average) during the peak period. Based on the minimum peak-period lockages in the UMR system, the off-peak lockages of unique towboats are classified into the above four levels. The unique towboats with less than 7 observed off-peak lockages are classified as having a light lockage level in the system. Moreover, the unique towboats with no or very few observed off-peak lockages (at most per month) are categorized as having a negligible lockage level while moderate and heavy levels are assigned to those unique towboats having 7 to 9 and more than off-peak lockages, respectively. Unique towboats off-peak states are summarized in Table 6. Table 6. Off-peak States of the 9% Unique Towboats Level Code Off-Peak Lockage Level at the UMR System Off-Peak Lockage Level at the Outside the UMR A B C D Negligible Light Moderate Heavy Fraction of the Unique Towboats % (No.) Negligible.% (4) Light 9.4% (9) Moderate.7% (4) 58% (7) Heavy 6.4% () Negligible.% (4) Light.% (6) Moderate.7% (4) 6% (5) Heavy.5% () Negligible.5% (5) Light.% () Moderate.8% (6) 6% () Heavy % () Negligible % () Light % () Moderate % () % () Heavy % () Total % ()
 are also not observed at any locks outside the UMR during the off-peak (i.e., about % of the unique towboats are never observed anywhere in the study area during the off-peak).")
26 As shown in Table 6, it has been observed that about 58% of the unique towboats practically do not use the UMR locks during the off-peak. Among them about 7% (4 unique tows) are also not observed at any locks outside the UMR during the off-peak (i.e., about % of the unique towboats are never observed anywhere in the study area during the off-peak). It is noted, however, that many unique towboats (about 7% of the unique tows) classified in level A operate actively at locks outside the UMR during the off-peak although their UMR off-peak lockage level is negligible. In addition, Table 6 shows that during the off-peak, about 6% (classified in level B) of the unique towboats reduce their UMR operation; instead, most of them (about 8% of the 6%) operate actively outside the UMR. These results are interpreted to indicate that considerable numbers of the 9% unique towboats cease operation or shift to outside UMR during the off-peak. Finally, it has been observed that only about 6% of the unique towboats operate actively in the UMR system as much as during the off-peak as during the peak and most of them also operate outside the system. No heavily operated unique towboats are observed at locks both inside and outside the UMR during the off-peak (e.g., the top three unique towboats are never observed at any locks in the system during the off-peak). Figure 7 shows the only districts visited by the 9% towboats during the UMR off-peak. The towboats operate actively in districts in the upper Mississippi Valley Division (MVD) and Great Lakes and Ohio River Division (LRD) during the off-peak and travel slightly to some rivers in New Orleans (MVN), Galveston (SWG), Little Rock (SWL), Tulsa (SWT), Mobile (SAM) districts. It is noted that many unique towboats of the 9% group must often pass through the Mississippi (MI) segment in the Memphis District (MVM), which has no locks. Figure 7. Districts Visited by the 9% Unique Towboats during the UMR Off-peak
27 .. Lock Use by Towboats in the Study Area In order to identify the impact of the UMR seasonal variation on the other waterways, we determine total towboat lockages as well as the lockages attributable to the 9% unique towboats by locks in the U.S. waterway system. Tables 7 through show the towboat use of locks by rivers. It is noted that there are no observed lockages by the 9% towboats in the North Atlantic Division (NAD) and Northwestern Division (NWD) for -4; thus, it seems that the UMR seasonality does not affect these areas. Towboat Lockages in the UMR and Illinois Systems As shown in the two rightmost columns for the UMR locks in Table 7, there is no significant difference in changes of the UMR towboat lockages generated by all vs. the 9% unique towboats in between the peak and off-peak; both drastically decrease during the off-peak. In particular, the towboat lockages significantly decrease upstream of Lock #5 during the offpeak; however, heavy towboat lockages still observed at Locks #7 and #6 (though the lockages at those locks also decrease significantly during the off-peak). Based on such findings, we conclude that many unique towboats, which normally operate in the UMR during the peak, hardly operate upstream of Lock #5 and would shift to other rivers (e.g., lower Mississippi, Illinois, and Ohio) or cease operating until the UMR thaws (refer to Table 6). Figure 8 presents the UMR lock use by all towboats and the 9% unique towboats for the peak and off-peak periods. Three key findings are identified from the lock use on the Illinois system, as presented in Table 7 and Figure 9. During the UMR off-peak (i) towboat lockages attributable to the 9% unique towboats increase at every Illinois lock; however, (ii) total towboat lockages at almost every lock in the Illinois decrease overall, except at Lock # and the lower Illinois (Locks #7 and #8). In addition, (iii) Lock # is hardly used by the 9% unique towboats either in the peak or off-peak of the UMR. Such findings can be interpreted to indicate that among the unique towboats engaging in most peak-period UMR lockages, some towboats shift to the Illinois and operate during the UMR freeze; however, they do not travel to Lock # 6. They operate mostly from Lock #8 upstream to Lock #5 during the UMR off-peak and significantly contribute to the increase of off-peak towboat lockages on the lower Illinois (Locks #7 and #8); their contributions to the off-peak towboat lockages at such locks are about 58% and 7%, respectively. However, an interesting question arising here is why do the off-peak towboat lockages at Locks # through #6 decrease overall despite an increase there of the off-peak lockages by the 9% unique towboats? A possible answer is that some towboats which normally operate on the Illinois are replaced with towboats shifting from the UMR during 6 Lock # in the Illinois system may be too small or too unimportant (at all times).
28 winters. We leave this important question to future studies. Table 7. Lock Use by Towboats in the UMR and Illinois Systems (-4) During the Peak (Apr. to Nov.) During the Off-Peak (Jan. to Feb.) towboat-lockages % of Total towboat-lockages % of Total River Lock Attributable to the Attributable to the % Change of Total Total By the 9% group 9% group Total By the 9% group 9% group unit: Towboat-Lockages/month % Change of Towboat-Lockages Between the Peak and Off-Peak % Change of Tow- Lockages by the 9% UMR MVP(#5) % - -.% -.% MVP(#5) 6 6 % - -.% -.% MVP(#) % - -.% -.% MVP(#) 8 94% - -.% -.% MVP(#) 9 95% - -.% -.% MVP(#4) 5 95% - -.% -.% MVP(#5) 7 95% - -.% -.% MVP(#55) 4 95% - -.% -.% MVP(#6) % - -.% -.% MVP(#7) % - -.% -.% MVP(#8) % - -.% -.% MVP(#9) % - -.% -.% MVP(#) % - -.% -.% MVR(#) 8 94% - -.% -.% MVR(#) 95% - -.% -.% MVR(#) % - -.% -.% MVR(#4) % 5% -99.% % MVR(#5) % % -99.6% -99.% MVR(#6) 96% 67% -99.4% -99.% MVR(#7) % 67% -98.9% -99.4% MVR(#8) % % % % MVR(#9) % % -98.9% % MVR(#) % 6 6 % % % MVR(#) % 9 9% -96.6% -96.7% MVR(#) % % % % MVS(#4) % 6 6 % % -94.5% MVS(#5) % % -94.% -94.% MVS(#6) % 7 6 7% -9.4% -4.7% MVS(#7) % % -6.6% -6.5% IL MVR(#) 9 % 9 % 5.6% -.% MVR(#) % % -4.%.% MVR(#) 56 5 % 97 6 % -.5%.% MVR(#4) % 8 7 4% -7.7% 5.87% MVR(#5) 9 74 % % -8.78% 5.68% MVR(#6) % % -5.% 9.76% MVR(#7) % % 9.8% 59.8% MVR(#8) 6 5% 9 7% 8.5% 67.8% Decrease overall Increase Avg. towboat-lockages per month MVP(#5) MVP(#5) MVP(#) MVP(#) MVP(#) MVP(#4) MVP(#5) MVP(#55) MVP(#6) MVP(#7) MVP(#8) MVP(#9) MVP(#) MVR(#) MVR(#) MVR(#) MVR(#4) MVR(#5) MVR(#6) MVR(#7) MVR(#8) MVR(#9) MVR(#) MVR(#) MVR(#) MVS(#4) MVS(#5) MVS(#6) MVS(#7) Locks on UMR Total(Peak) Total(Off-Peak) 9%GP(Peak) 9%GP(Off-peak) 4
29 Figure 8. UMR Towboat Lockages during the Peak and Off-peak (-4) 5 Avg. towboat-lockages per month MVR(#) MVR(#) MVR(#) MVR(#4) MVR(#5) MVR(#6) MVR(#7) MVR(#8) Locks on Illinois Total(Peak) Total(Off-Peak) 9%GP(Peak) 9%GP(Off-peak) Figure 9. Illinois Towboat Lockages during the UMR Peak and Off-peak (-4) Towboat Lockages in the Ohio and Its Tributaries During the UMR off-peak, towboat lockages attributable to the 9% unique towboats increase overall at every Ohio lock. This can be interpreted to indicate that among the unique towboats using the UMR locks, some towboats that normally operate on both the UMR and Ohio shift to the Ohio and generate more lockages during the off-peak while avoiding the freezing of the UMR; they operate mostly from Lock #5 upstream to Lock #4 downstream (refer to Table 8 and Figure for the Ohio locks). However, it is clearly noted that total towboat lockages at every Ohio lock are stable in between the UMR peak and off-peak periods although the 9% unique towboats affect more Ohio lockages during the off-peak. This raises some important questions such as: (i) why are the total towboat lockages at every Ohio lock stable despite increase of the towboat lockages by the 9% unique towboats during the off-peak period? (ii) Do some towboats that normally operate on the Ohio cease operation so that they are replaced by the shifted towboats from the UMR during the off-peak? We leave such questions to future studies. As shown in Figure, total towboat lockages at every Tennessee (TN) lock are also stable regardless of season and the contribution of the 9% unique towboats to the total lockages of the systems is insignificant and stable during both the UMR peak and off-peak periods. This indicates that the impact of the unique towboats, which operate in between the UMR and Tennessee systems, to the Tennessee is generally steady and low in spite of the seasonality in the UMR. For other Ohio tributaries, the 9% unique towboats hardly travel to there during both the UMR peak and off-peak periods; furthermore, total towboat lockages on most rivers slightly decrease during the UMR off-peak (see Table 8). Additionally, it should be noted that total 5
30 towboat lockages on the upper Allegheny (AG) (upstream of Lock #44) significantly decrease during the winter. It seems traffic on the upper Allegheny is also seasonal as in the UMR case since this river also freezes in winter. Table 8. Lock Use by Towboats in the Ohio and Its Tributaries (-4) Slightly decrease Increase overall 6
31 During the Peak (Apr. to Nov.) During the Off-Peak (Jan. to Feb.) unit: Towboat-Lockages/month % Change of Towboat-Lockages Between the Peak and Off-Peak River Lock towboat-lockages % of Total towboat-lockages % of Total % Change of Tow- Attributable to the Attributable to the % Change of Total Total By the 9% group Total By the 9% group Lockages by the 9% 9% group 9% group OH LRL(#5) 6 8 8% % -.46% 5.9% LRL(#5) % % -6.8% 4.86% LRL(#78) % 65 6 %.% 74.6% LRL(#77) % 5 6%.44% 77.% LRL(#76) 5 7 % % -5.% 77.4% LRL(#75) % 8 9% -7.97% 77.4% LRL(#4) % % -.74% 7.77% LRL(#4) 44 5 % % -4.46% 76.9% LRH(#5) % 4 8 9% -.87% 7.9% LRH(#4) % % -.64% 8.8% LRH(#6) % % -6.9% 7.4% LRH(#) % 44 8 % -9.% 58.% LRH(#) 58 6% 9 5 % -8.% 59.9% LRH(#7) 5 6% 6 % -4.7% 6.% LRP(#7) 8 5% 65 8% -4.7% 55.% LRP(#5) 4 7 4% % -.78% 7.59% LRP(#4) % 6 6 7% -.7% 7.% LRP(#) 4 5 % 89 8 % -8.4% 6.% LRP(#) 4 % 65 4 % -5.%.% LRP(#) 47 % 94 4 % -6.7%.% TN LRN(#) % 65 8% -.8% -.% LRN(#) 8 % 9 8 9% -.8% -5.7% LRN(#) 59 8% 54 6% -.4% -.8% LRN(#4) 45 8% 6 7% -6.% -6.67% LRN(#5) 94 % 8 8 % -4.89% -.% LRN(#6) 7 8 % 57 6 % -9.7% -5.% LRN(#7) 56 6 % 6 6% -5.7% % LRN(#8) 4 6 5% 7 7% -4.5% % LRN(#9) 6 6% 6 % -.4% % CI LRN(#) CU LRN(#) 9 5 5% 68 4% -7.6% -4.% LRN(#) 6 5% 9 % -.% % LRN(#4) 69 % 66 % -4.5% - LRN(#) GB LRL(#) 7 4 % 7 %.8% -5.% LRL(#) % % 8.9% - KA LRH(#) 45 % 6 % -7.76% - LRH(#) 7 % 54 % -4.84% - LRH(#) 9 % 56 %.% - MN LRP(#) 44 % 57 % -.6%.% LRP(#) % 58 % -.45% % LRP(#4) 466 % 9 % -5.88% - LRP(#5) 5 % 6 % -9.7% - LRP(#6) 58 % 4 % -.9% - LRP(#8) 5 % % -.6% - LRP(#9) 45 % % -7.% - LRP(#) % %.% - LRP(#) % %.% - AG LRP(#4) 6 % 4 % -9.5% - LRP(#4) % 7 % -.57% - LRP(#44) 7 % 4 % -66.4% - LRP(#45) 9 % 8 % -8.% - LRP(#46) 8 % 8 % % - LRP(#47) 7 % 6 % -64.7% - LRP(#48) 84 % - -.% - LRP(#49)
32 LRL(#5) LRL(#5) LRL(#78) LRL(#77) LRL(#76) LRL(#75) LRL(#4) LRL(#4) LRH(#5) LRH(#4) LRH(#6) LRH(#) LRH(#) LRH(#7) LRP(#7) LRP(#5) LRP(#4) LRP(#) LRP(#) LRP(#) LRL(#5) LRL(#5) LRL(#78) LRL(#77) LRL(#76) LRL(#75) LRL(#4) LRL(#4) LRH(#5) Avg. towboat-lockages per month LRH(#4) LRH(#6) LRH(#) LRH(#) LRH(#7) LRP(#7) LRP(#5) LRP(#4) LRP(#) LRP(#) LRP(#) Locks on on Ohio OH Total(Peak) Total(Off-peak) 9%GP(Peak) 9%GP(Off-peak) Avg. towboat-lockages per month Zoomed image Locks Locks on on OH Ohio River 9%GP(Peak) 9%GP(Off-peak) Figure. Ohio Towboat Lockages during the UMR Peak and Off-peak (-4) 9 8 Avg. towboat-lockages per month LRN(#) LRN(#) LRN(#) LRN(#4) LRN(#5) LRN(#6) LRN(#7) LRN(#8) LRN(#9) Locks ontennessee Total(Peak) Total(Off-peak) 9%GP(Peak) 9%GP(Off-peak) Figure. Tennessee Towboat Lockages during the UMR Peak and Off-peak (-4) 8
33 Towboat Lockages on the Lower MVD and Southwester Division (SWD) As shown in Figure and Table 9, total towboat lockages at every Gulf Intra-coastal Waterway (GI) lock decrease overall during the UMR off-peak, except at Lock #, and the fraction of the total lockages attributable to the 9% unique towboats is negligible (below %) during both the UMR peak and off-peak periods. These results indicate that towboats using the Gulf Intra-coastal Waterway reduce their operation during the winter; furthermore, among them some towboats which normally operate in between the UMR and Gulf Intra-coastal Waterway slightly affect Gulf Intra-coastal Waterway lockages with almost stable but insignificant rates during both the UMR peak and off-peak periods. Thus, it seems that the UMR seasonality hardly affects the Gulf Intra-coastal Waterway system. The same interpretation given for the Gulf Intra-coastal Waterway is also applicable to the McClellan-Kerr Arkansas River Navigation System (MK) since total towboat lockages of the McClellan-Kerr Arkansas River Navigation System also slightly decrease during the off-peak and lockages generated by the 9% unique towboats are low and fairly stable (less than 5 lockages per month on average) during both the peak and off-peak periods. Finally, the 9% unique towboats are never observed on the Red River (RR), Pearl River (PR), Atchafalaya River (AT), Bayou Tech (BT), Freshwater Bayou (FB), and Calcasieu River (CA).,4 Avg. towboat-lockages per month 8 6 4,, MVN(#) MVN(#) MVN(#) MVN(#4) MVN(#5) MVN(#6) MVN(#77) MVN(#8) SWG(#) SWG(#4) SWG(#) SWG(#) MVN(#) MVN(#) Locks on Gulf Intracoastal Waterway Locks on Gulf Intra-coastal Waterway Total(Peak) Total(Off-peak) 9%GP(Peak) 9%GP(Off-peak) Zoomed image MVN(#) MVN(#) MVN(#) MVN(#4) MVN(#5) MVN(#6) MVN(#77) MVN(#8) SWG(#) SWG(#4) Locks on Gulf Intracoastal Waterway Locks on Gulf Intra-coastal Waterway 9%GP(Peak) 9%GP(Off-peak) Figure. Towboat Lockages on Gulf Intra-coastal Waterway during the UMR Peak and Off-peak (-4) SWG(#) SWG(#) MVN(#) MVN(#) 9
Inland Marine Transportation System
 Inland Marine Transportation System Capital Investment Strategy Jeanine Hoey, PE, PMP Program Manager 15 December 2009 US Army Corps of Engineers 1 Inland Marine Transportation System (IMTS) Capital Investment
Northwestern Division COMMAND BRIEF
 Northwestern Division COMMAND BRIEF Colonel William Leady Deputy Commander Northwestern Division 2015 US Army Corps of Engineers USACE Mission Areas BUILDING STRONG USACE Supports the Army and the Nation
NAVIGATION NOTICE NO
 NAVIGATION NOTICE NO. 1-2012 Mississippi Valley Division Great Lakes and Ohio River Division January 2012 INTRODUCTION: 1. As a result of partnering efforts with navigation interests, a consolidated Notice
Final Waterborne Commerce Statistics
 Final Waterborne Commerce Statistics For Calendar Year 16 Waterborne Commerce National Totals And Selected Inland Waterways For Multiple Years Institute for Water Resources Navigation and Civil Works Decision
Inland Marine Transportation System Capital Investment Strategy
 Inland Marine Transportation System Capital Investment Strategy Jeanine Hoey, PE, PMP Program Manager 13 April 2010 US Army Corps of Engineers 1 Inland Marine Transportation System (IMTS) Capital Investment
NAVIGATION NOTICE NO
 NAVIGATION NOTICE NO. 1-2017 Mississippi Valley Division Great Lakes and Ohio River Division INTRODUCTION: February 2017 1. As a result of partnering efforts with navigation interests, a consolidated Notice
U.S. Army Corps of Engineers Navigation Fiscal Overview
 U.S. Army Corps of Engineers Navigation Fiscal Overview National Dredging Meeting Jeffrey A. McKee Chief, Navigation Branch US Army Corps of Engineers June 24-26, 2014 US Army Corps of Engineers 1 Corps
Click to edit Master title style
 Click to edit Master title style Dallas July 27, 2017 7/27/2017 1 1 Click to edit Master title style 7/27/2017 2 2 Click to edit Master title style 7/27/2017 3 3 Click to edit Master title style TAP Software
AKRON, UNIVERSITY OF $16,388 $25,980 $10,447 $16,522 $14,196 $14,196 $14,196 ALABAMA, UNIVERSITY OF $9,736 $19,902 N/A N/A $14,464 $14,464 $14,464
 AKRON, UNIVERSITY OF $16,388 $25,980 $10,447 $16,522 $14,196 $14,196 $14,196 ALABAMA, UNIVERSITY OF $9,736 $19,902 N/A N/A $14,464 $14,464 $14,464 ALBANY LAW SCHOOL OF UNION UNIVERSITY $35,079 $35,079
FOUR Revolutions: What Will the U.S. Do About Them? Brig. Gen. Duke DeLuca
 FOUR Revolutions: What Will the U.S. Do About Them? Brig. Gen. Duke DeLuca President, Miss River Commission Cmdg Gen, Miss Valley Division USACE 14 May 2014 U.S. Army Corps of Engineers San Francisco Portland
Indian Cowboy College Basketball Record. By Game Daily Season To Date Date Game / pick Score W / L Units $$$ Units $$$ Units $$$
 By Game Daily Season To Date Date Game / pick Score W / L Units $$$ Units $$$ Units $$$ 11/9/2011 Liberty +20.5 over Texas A&M 81 59 L 4 440 4 440 4 440 11/10/2011 No games 11/11/2011 Illinois State +2
2003 AAU Boys Basketball 14:Under/8th Grade National Tournament 1st Round 2nd Round 3rd Round 4th Round QuarterFinals SemiFinals
 1st Round 2nd Round 3rd Round 4th Round QuarterFinals SemiFinals FINALS Monday Monday Tuesday Tuesday Wednesday Wednesday Thursday A 1st Fl-Orlando Raptors69 2nd-Fox Valley-49 21 > 2:30-1 Orlando Raptors-49
watersafety.usace.army.mil Brochure created by CEMVR IM-I
 watersafety.usace.army.mil Brochure created by CEMVR IM-I Introduction We hope you find this information useful for boating on the Upper Mississippi River and Illinois Waterway. The purpose of this booklet
Texas Department of Transportation s Gulf Intracoastal Waterway Capacity Study. GICA 112 th Annual Seminar July 28, 2017
 Texas Department of Transportation s Gulf Intracoastal Waterway Capacity Study GICA 112 th Annual Seminar July 28, 2017 Study Purpose Determine if current levels of vessel activity on the Texas segment
1,385,500 $13,803,290 $15,008,620
 ALASKA ANCHORAGE 2015-2017 H 11/25/2014 1,100,000 $7,680,500 $8,437,400 MANSON CONSTRUCTION CO L 1 DILLINGHAM HARBOR 2017-2019 P 12/6/2016 110,000 $895,300 $690,100 ALASKA MARINE EXCAVATION, LLC S 2 HOMER
Sustainable Transportation Planning in the Portland Region
 Sustainable Transportation Planning in the Portland Region Jennifer Dill, Ph.D. Associate Professor School of Urban Studies & Planning jdill@pdx.edu http://web.pdx.edu/~jdill/ Outline Elements of a sustainable
Part A: Changes in Distance between Major League Baseball Franchises and their Triple-A Affiliates
 Five Themes of Geography: Movement Major and Minor League Baseball Team Affiliations, 1998 & 2011 Ezra Zeitler University of Wisconsin-Eau Claire Department of Geography & Anthropology Purpose: This exercise
Local Chapter Pictorial
 APA Local Chapter Pictorial Local Chapter Pictorial Alamo Chapter of the APA Albuquerque Chapter APA of Acadiana Atlanta Chapter Birmingham Payroll Association Buffalo-Niagara Chapter Cascade Payroll Association
APA Local Chapter Pictorial
 APA Local Chapter Pictorial Alamo Chapter of the APA Albuquerque Chapter APA of Acadiana Atlanta Chapter Broward County Association of Payroll Professionals Buffalo-Niagara Chapter Cascade Payroll Association
WILDCARD EVENT LISTINGS
 AMERICAN CHEER POWER San Antonio, TX 10/14/17 3 3 6 AMERICAN CHEER POWER Frisco, TX 10/28/17 3 3 6 SPIRIT CELEBRATION Shreveport, LA 10/28/17 3 3 6 UCA Pueblo, CO 10/28/17 3 3 6 UCA/UDA Southaven, MS 10/28/17
All-Time College Football Attendance (Includes all divisions and non-ncaa teams) No. Total P/G Yearly Change No. Total P/G Yearly Change Year Teams
 No. Total P/G Yearly Change No. Total P/G Yearly Change Year Teams") Attendance Records All-Time College Football Attendance... 2 All-Time NCAA Attendance... 2 Annual Conference Attendance Leaders... 4 Largest Regular-Season Crowds... 11 2010 Attendance... 11 Annual Team
Attendance Records All-Time College Football Attendance... 2 All-Time NCAA Attendance... 2 Annual Conference Attendance Leaders... 4 Largest Regular-Season Crowds... 11 2010 Attendance... 11 Annual Team
Tennessee Wildlife Resources Agency Fisheries Management Division Ellington Agricultural Center P. O. Box Nashville, TN 37204
 2001 Tennessee Wildlife Resources Agency Fisheries Management Division Ellington Agricultural Center P. O. Box 40747 Nashville, TN 37204 1 INTRODUCTION The Tennessee Wildlife Resources Agency (TWRA) initiated
THE TENNESSEE STREAM MITIGATION PROGRAM TSMP Annual Program Report. Reporting Period: January 1, 2014 through December 31, 2014
 THE TENNESSEE STREAM MITIGATION PROGRAM 2014 TSMP Annual Program Report Reporting Period: January 1, 2014 through December 31, 2014 Table of Contents Executive Summary 3 Financial Statement 3 Program Income
Sidewalkology A Path to Solving San Antonio s Sidewalk Problem
 1 Sidewalkology A Path to Solving San Antonio s Sidewalk Problem Introduction This memorandum proposes the creation a Pedestrian Mobility Officer (PMO) position and/or an active transportation program
Understanding the Regional Divergence in Adult Mortality in the United States
 Understanding the Regional Divergence in Adult Mortality in the United States Andrew Fenelon, PhD University of Maryland, College Park American Life Expectancy 77 76 75 Life Expectancy in Years 74 73 72
FEDERAL INLETS DATABASE
 To appear: Proceedings 2002 National Conference on Beach Preservation Technology, FSBPA. FEDERAL INLETS DATABASE Erica Eva Carr 1 and Nicholas C. Kraus 2 Abstract: The U.S. Army Corps of Engineers Coastal
State of Texas Operations and Maintenance
 State of Texas Operations and Maintenance Barbour Terminal Ship Channel The Barbour Terminal Channel and Turning Basin is a 1.7-mile-long deep draft waterway that extends from the Houston Ship Channel
2015 SEC Women s Tennis
 2015 SEC Women s Tennis Tammy Wilson, Director of Communica ons twilson@sec.org Twi er: SEC_Tammy Standings SEC Pct. All Pct. Home Away Neutral Streak Florida^ 12-1.923 24-4.857 14-0 7-1 3-3 L1 Georgia
Sears Directors' Cup Final Standings
 1 North Carolina 529.0 24.5 0 0.0 16 49.0 11 54.0 0 0 0 0 17 44.5 6 58.5 26 37.5 0.0 0 5 58.5 0 0.0 806.5 2 Stanford 507.5 40.5 36 24.5 7 58.0 1 64.0 0 0 2 63.0 2 63.0 18 47.0 0.0 0 0.0 0 0.0 0 0 0.0 786.5
USACE Water Safety Report August 2015
 USACE Water Safety Report August 2015 FOUO/Internal Audience U.S. ARMY CORPS OF ENGINEERS BUILDING STRONG HQUSACE National Operations Center (NOC) for Water Safety conducted a National Bilingual Subcommittee
Global Hotel Industry Outlook
 Global Hotel Industry Outlook NYU 2011 Mark V. Lomanno CEO STR www.hotelnewsnow.com Click on Industry Presentations Agenda Global Hotel Performance US Hotel Performance Chain Scales Group/Transient Distribution
Agricultural Weather Assessments World Agricultural Outlook Board
 Texas (8) Missouri (7) South Dakota (6) Kansas (5) Nebraska (5) North Dakota (5) Oklahoma (5) Kentucky (4) Montana (4) California (3) Minnesota (3) New York (3) Pennsylvania (3) Tennessee (3) Wisconsin
Agricultural Weather Assessments World Agricultural Outlook Board
 Texas (8) Missouri (7) South Dakota (6) Kansas () Nebraska () North Dakota () Oklahoma () Kentucky (4) Montana (4) California (3) Minnesota (3) New York (3) Pennsylvania (3) Tennessee (3) Wisconsin (3)
Eulachon: State of the Science and Science to Policy Forum
 Eulachon: State of the Science and Science to Policy Forum August 27, 2015 Robert Anderson Eulachon Recovery Coordinator National Marine Fisheries Service FCRPS, Dams, and Water Management in the Columbia
Hotel InduSTRy Overview What Lies Ahead
 Hotel InduSTRy Overview What Lies Ahead Vail R. Brown Vice President, Global Business Development & Marketing www.hotelnewsnow.com Click on Hotel Data Presentations U.S. In Review Demand Growth Strong.
THE TENNESSEE STREAM MITIGATION PROGRAM
 THE TENNESSEE STREAM MITIGATION PROGRAM 2013 TSMP Annual Program Report Reporting Period: January 1, 2013 through December 31, 2013 Table of Contents Executive Summary 3 Financial Statement 3 Program Income
MEN S GOLF SEASON STATS
 MEN S GOLF SEASON STATS 2017-18 TOURNAMENT AT OR UNDER PAR R.J. Keur...6 William Walker III...5 Murray Naysmith...2 John Hayden...1 John Racciatti...0 ROUNDS AT OR UNDER PAR R.J. Keur... 17 WIlliam Walker
Seasonal Summary. For The Great Lakes. Winter
 Seasonal Summary For The Great Lakes Winter 2007-2008 Produced by the North American Ice Service August 2008 Table of Contents General General overview of the past season...4 Lake Superior...9 Lake Michigan
HANDICAP ACTIVE AND INACTIVE SEASON SCHEDULE
 HANDICAP ACTIVE AND INACTIVE SEASON SCHEDULE The authorized golf association having jurisdiction in an area is responsible for declaring the duration of any inactive season. Any non-member club of an authorized
Date: 25 September Introduction
 To: David Clugston, USACE Portland District From: Matt Keefer, Eric Johnson, Tami Clabough, Mike Jepson, Chris Caudill, Mary Moser RE: Preliminary evaluation of radiotelemetry and half-duplex PIT tag data
Beyond Bullet Points: Statistics, Trends and Analysis
 Beyond Bullet Points: Statistics, Trends and Analysis Vail R. Brown VP, Global Business Development & Marketing Vail@str.com @vail_str 5 THINGS TO KNOW www.hotelnewsnow.com Click on Data Presentations
NVIC Feb NAVIGATION AND VESSEL INSPECTION CIRCULAR NO Electronic Version for Distribution Via the World Wide Web
 NVIC 1-83 10 Feb 1983 NAVIGATION AND VESSEL INSPECTION CIRCULAR NO. 1-83 Electronic Version for Distribution Via the World Wide Web Subj: Painters for Life Floats and Buoyant Apparatus 1. PURPOSE. This
EVALUATION OF METHODOLOGIES FOR THE DESIGN AND ANALYSIS OF FREEWAY WEAVING SECTIONS. Alexander Skabardonis 1 and Eleni Christofa 2
 EVALUATION OF METHODOLOGIES FOR THE DESIGN AND ANALYSIS OF FREEWAY WEAVING SECTIONS Alexander Skabardonis 1 and Eleni Christofa 2 1: University of California, Berkeley, Institute of Transportation Studies,
Fundamental Certainty
 Fundamental Certainty.or No? a presentation at: R. Mark Woodworth PKF Hospitality Research, LLC May 7, 2013 mark.woodworth@pkfc.com Hotel Horizons Forecasting Model Smith Travel Research Historical rooms
006 CARIBBEAN PFC % BOSTON PFC % SOUTHEAST NEW ENGLAND PFC
 USPS FIN 08-9904 AND PAID EMPLOYEE STATISTICS DATE 03/16/10 CASUAL COMPLIANCE UNION PROFILE REPORT PAGE 2 SUMMARY B/A 4B FDC SUB PP 06/2010 NORTHEAST AREA CASUAL ACTUAL ACTUAL NUMBER** LIMIT CASUALS DUAL/CASUALS
ENTRANCES USED AND PASSAGE THROUGH FISHWAYS FOR ADULT CHINOOK SALMON AND STEELHEAD
 ENTRANCES USED AND PASSAGE THROUGH FISHWAYS FOR ADULT CHINOOK SALMON AND STEELHEAD Part III of Final Report for MIGRATION OF ADULT CHINOOK SALMON AND STEELHEAD PAST DAMS AND THROUGH RESERVOIRS IN THE LOWER
** NEGATIVE INDICATES NUMBER OVER LIMIT
 USPS FIN 35-9904 B/A 4A FDC SUB AND PAID EMPLOYEE STATISTICS CASUAL COMPLIANCE UNION PROFILE REPORT SUMMARY PAGE 1 NY METRO AREA 100 NEW YORK PFC 19 CASUAL (BASED ON 6%) 1 CASUALS DUAL/CASUALS PERCENT
A Comparison of Highway Construction Costs in the Midwest and Nationally
 A Comparison of Highway Construction Costs in the Midwest and Nationally March 20, 2018 Mary Craighead, AICP 1 INTRODUCTION State Departments of Transportation play a significant role in the construction
SIMULATION OF THE ILLINOIS WATERWAY LOCKS SYSTEM
 Proceedings of the 1996 Winter Simulation Conference ed. J. M. Charnes, D. J. Morrice, D. T. Brunner, and J. J. Swain SIMULATION OF THE ILLINOIS WATERWAY LOCKS SYSTEM D. Brent Bandy Department of Infonnation
Purpose of the Efficiency Program Industry By State and Region Appendices and Limitations of Data
 Purpose of the Efficiency Program Industry By State and Region Appendices and Limitations of Data CEE collaborates with the American Gas Association (AGA) to survey and collect data in the United States
APPENDIX B Methodology for 2004 Annual Report
 APPENDIX B Methodology for 2004 Annual Report This appendix summarizes the methodology utilized to calculate many of the statistics shown in the Urban Mobility Report. The methodology is divided into eight
OREGON AND WASHINGTON DEPARTMENTS OF FISH AND WILDLIFE JOINT STAFF REPORT: SUMMER FACT SHEET NO. 1 Columbia River Compact June 13, 2012
 OREGON AND WASHINGTON DEPARTMENTS OF FISH AND WILDLIFE JOINT STAFF REPORT: SUMMER FACT SHEET NO. 1 Columbia River Compact June 13, 2012 Fisheries under consideration: Non-Indian commercial salmon Treaty
Preliminary survival estimates for the passage of spring-migrating juvenile salmonids through Snake and Columbia River dams and reservoirs, 2018
 UNITED STATES DEPARTMENT OF COMMERCE National Oceanic and Atmospheric Administration NATIONAL MARINE FISHERIES SERVICE Northwest Fisheries Science Center Fish Ecology Division 2725 Montlake Boulevard East
Riverside Rising Economic Outlook for the Region April 2015
 Analysis. Answers Riverside Rising Economic Outlook for the Region April 2015 Beacon Economics, LLC California fact versus fiction Looking back a few years (2009 / 2010) everyone was saying that CA would
Innovative Technologies for a Resilient Marine Transportation System
 Innovative Technologies for a Resilient Marine Transportation System Transportation Research Board MG John Peabody, P.E. Deputy Commanding General for Civil and Emergency Operations, U.S. Army Corps of
Active Travel and Exposure to Air Pollution: Implications for Transportation and Land Use Planning
 Active Travel and Exposure to Air Pollution: Implications for Transportation and Land Use Planning Steve Hankey School of Public and International Affairs, Virginia Tech, 140 Otey Street, Blacksburg, VA
The Port of Virginia and Economic Development
 The Port of Virginia and Economic Development RODNEY W. OLIVER, CHIEF FINANCIAL OFFICER VIRGINIA PORT AUTHORITY 1 EAST COAST / WEST TRADE BALANCE 2 AN IMPORT PARADIGM SHIFT The West Coast has traditionally
Greenup Lock Filling and Emptying System Study
 Fourth LACCEI International Latin American and Caribbean Conference for Engineering and Technology (LACCET 2006) Breaking Frontiers and Barriers in Engineering: Education, Research and Practice 21-23 June
Are Highways Crumbling? State Performance Summaries,
 Policy Summary 407 February 2013 Are Highways Crumbling? State Performance Summaries, 1989 2008 by David T. Hartgen, Ph.D., P.E., M. Gregory Fields and Elizabeth San José Project Director: Adrian T. Moore,
Table B-8: U.S. Medical School MD-PhD Applications and Matriculants by School, In-State Status, and Sex,
 MD-PhD and Table B-8: U.S. Medical School MD-PhD and, In-State Status, and Sex, 2017-2018 1 AL Alabama 283 4.9 95.1 45.6 54.4 9 22.2 77.8 44.4 55.6 South Alabama 14 28.6 71.4 50.0 50.0 0 0.0 0.0 0.0 0.0
Kevin Greene. Kevin Greene, a fifth-round draft pick of the Los Angeles Rams in the 1985 NFL Draft,
 Kevin Greene Kevin Greene, a fifth-round draft pick of the Los Angeles Rams in the 1985 NFL Draft, quickly developed into one of the most punishing pass rushers in league history. A walk-on at Auburn he
WELCOME Asian Carp Management and Control in the Ohio River and Upper Mississippi River Basins
 WELCOME Asian Carp Management and Control in the Ohio River and Upper Mississippi River Basins Thank you sponsors! Representative Mike Kelly (PA-3 rd ) Representative Ron Kind (WI-3 rd ) Collaborative
WY Black Hills Northwest Wyoming Gas Utility Company, LLC
 U.S. LDCs with Decoupling Mechanisms Attachment GHT/DECPL-1 Page 1 of 1 Northeast CT Connecticut Natural Gas Corporation MA Bay State Gas Company Boston Gas Company Colonial Gas Company Fitchburg Gas &
 Page 1 of 6 Nav-Aid Basics Unlike the roads and highways that we drive on, the waterways we go boating on do not have road signs that tell us our location, the route or distance to a destination, or of
Briefing on the State of the State. presented to the. SCAA Schuyler Center for Analysis and Advocacy
 Briefing on the State of the State presented to the SCAA Schuyler Center for Analysis and Advocacy Rae D. Rosen Assistant Vice President Federal Reserve Bank of New York November 16, 2006 Key Points: Economic
Cumberland River Flood Preparedness Mapping and Products
 Cumberland River Flood Preparedness Mapping and Products Barry P. Moran, P.E. Hydraulic Engineer Nashville District September 2013 US Army Corps of Engineers BUILDING STRONG Authority: As a result of the
Statistically Speaking
 Statistically Speaking NYU International Hospitality Investment Conference June 2018 Amanda W. Hite President & CEO ahite@str.com 2018 STR, Inc. All Rights Reserved. Any reprint, use or republication of
U.S. Economic and Apartment Market Overview and Outlook. July 15, 2014
 2014 U.S. Economic and Apartment Market Overview and Outlook July 15, 2014 U.S. Economic Overview U.S. GDP Growth Persistent Despite 1Q Polar Vortex Annualized Quarterly Percent Change 10% 5% 0% -5% -10%
Southern Lodging Summit 2018
 Southern Lodging Summit 2018 U.S. & Memphis Hotel Industry Performance Amanda W. Hite President & CEO ahite@str.com @HiteAmanda 2018 STR, Inc. All Rights Reserved. Any reprint, use or republication of
CAHABA RIVER Head of Lake Purdy PWS (Jefferson-Shelby Counties) Chattahoochee CHATTAHOOCHEE RIVER 14th Street Bridge between Columbus and Phenix City
 Chattahoochee CHATTAHOOCHEE RIVER 14th Street Bridge between Columbus and Phenix City") Alabama ALABAMA RIVER River Mile 131 Millers Ferry Lock and Dam Cahaba CAHABA RIVER Dam near U.S. Highway 280 Grant's Mill Road OAW/ Cahaba Oak Mountain State Park Lakes Cahaba Little Cahaba River CAHABA
Alabama ALABAMA RIVER River Mile 131 Millers Ferry Lock and Dam Cahaba CAHABA RIVER Dam near U.S. Highway 280 Grant's Mill Road OAW/ Cahaba Oak Mountain State Park Lakes Cahaba Little Cahaba River CAHABA
Division I Sears Directors' Cup Final Standings
 1 Stanford (Calif.) 747.5 112.5 4 61.0 4 61.0 34 29.5 0 0.0 0 0.0 0 0.0 0 0.0 1 64.0 1 64.0 12 52.5 11 53.5 1 64.0 1084.5 2 North Carolina 631.5 0 0.0 21 43.5 10 55.0 3 61.5 0 0.0 0 0.0 0 0.0 0 0.0 41
Orange County MPA Watch Program Quarterly Report (Jan 1 March 31, 2012)
") Orange County MPA Watch Program Quarterly Report (Jan 1 March 31, 2012) What is the OC MPA Watch Program? The Orange County Marine Protected Area (OC MPA) Watch Program enlists volunteers, community groups
Orange County MPA Watch Program Quarterly Report (Jan 1 March 31, 2012) What is the OC MPA Watch Program? The Orange County Marine Protected Area (OC MPA) Watch Program enlists volunteers, community groups
Weekly Peak Season Meeting
 Military Surface Deployment & Distribution Command Weekly Meeting 14-May- Current Week = 2 Data Source: DPS Analytics (11-May-15) Current Week Legend Week Ending Number Date 11 3/13 12 3/2 13 3/27 14 4/3
SURGE SUPPRESSION ACHIEVED BY DIFFERENT COASTAL SPINE (IKE DIKE) ALIGNMENTS. Bruce A. Ebersole, Thomas W. Richardson and Robert W.
 ALIGNMENTS. Bruce A. Ebersole, Thomas W. Richardson and Robert W.") SURGE SUPPRESSION ACHIEVED BY DIFFERENT COASTAL SPINE (IKE DIKE) ALIGNMENTS Abstract Bruce A. Ebersole, Thomas W. Richardson and Robert W. Whalin, Jackson State University, Jackson, Mississippi The primary
SURGE SUPPRESSION ACHIEVED BY DIFFERENT COASTAL SPINE (IKE DIKE) ALIGNMENTS Abstract Bruce A. Ebersole, Thomas W. Richardson and Robert W. Whalin, Jackson State University, Jackson, Mississippi The primary
Great Lakes Shipping Across The Country & Around The World Great Lakes Floor Map: Shipping and Receiving Cargo on the Great Lakes
 Lesson #1 Lesson #2 Great Lakes Shipping Across The Country & Around The World Great Lakes Floor Map: Shipping and Receiving Cargo on the Great Lakes Laura Mikesell Laura.Mikesell@gpschools.org Parcells
2011 Final Point Standings ~ Clubs
 2011 Final Point Standings ~ Clubs PLACE CLUB NAME 1 CORNHUSKER CORVETTE CLUB WR-095 27968 7 2 OKLAHOMA CITY CORVETTE CLUB SW-131 13718 7 3 MICHIGAN AUTOCROSS GROUP MI-362 13010 7 4 CORVETTE CLUB OF MICHIGAN
Renewals Complete as of 1/23/2018 9:14 AM
 CAROLINA CORVETTES CA-014 12/7/17 CORVETTE CHARLESTON CA-161 12/2/17 CORVETTES INTERNATIONAL CA-174 12/7/17 SPARTANBURG CORVETTE CLUB CA-177 12/7/17 CHEVY S UNDER GLASS CA-203 12/2/17 FREE WHEELING CORVETTE
BENEFIT-COST ANALYSIS OF HARBOR DREDGING ON THE GREAT LAKES
 Middle States Geographer, 997,30:55-6 BENEFT-COST ANALYSS OF HARBOR DREDGNG ON THE GREAT LAKES Raymond W. Waxmonsk:y Department of Geography & Planning Buffalo State College Buffalo, NY 4222 ABSTRACT:
BIG RIVER COALITION Advocating for a Mightier Mississippi River NATIONAL WATERWAYS CONFERENCE 91318
 BIG RIVER COALITION Advocating for a Mightier Mississippi River NATIONAL WATERWAYS CONFERENCE 91318 Sean M. Duffy, Sr. Executive Director sean.duffy@bigrivercoaltiio n.org MARITIME NATION ENGINEER S WEEK
STRUCTURE S-65 PURPOSE SPILLWAY OPERATION
 STRUCTURE S-65 This structure is a reinforced concrete, gated spillway with discharge controlled by three cable operated, vertical lift gates, and a reinforced concrete lock structure with two pairs of
Diocese Self-Audit? Frequency
 Diocese Self-Audit? Frequency Albany, N Parishes: 3 years; Schools: Annually Alexandria, LA N N/A Allentown, PA 3 years Altoona-Johnstown, PA N N/A Amarillo, TX As needed Anchorage, AK As needed Arlington,
SECTION 2 HYDROLOGY AND FLOW REGIMES
 SECTION 2 HYDROLOGY AND FLOW REGIMES In this section historical streamflow data from permanent USGS gaging stations will be presented and discussed to document long-term flow regime trends within the Cache-Bayou
Auto Parts Retail Industry Report February 2018
 Auto Parts Retail Industry The Auto Parts retail industry is a $58B industry, which has historically experienced single digit growth year over year. Online auto part sales accounted for $8.89 billion of
UBCM Community Excellence Awards 2007 Submission
 UBCM Community Excellence Awards 2007 Submission Formatted: Left: 2.54 cm Category: Partnerships Project: Implementation of False Creek Anchoring Management System 1. A one-paragraph summary of the project/program
Traffic Safety Facts. State Traffic Data Data. Overview
 Traffic Safety Facts 2015 Data June 2017 DOT HS 812 412 State Traffic Data Key Findings Traffic fatalities increased by 7 percent from 2014 to 2015 (32,744 to 35,092) for the United States. The fatality
Towed Barge Standard of Care
 Lower Columbia Region Harbor Safety Committee Towed Barge Standard of Care Page 1 of 6 A. 1. Purpose The Columbia River is intended to eliminate conflicts between towing vessels conducting astern towing
REGION B ONLY. Figure Figure Figure Figure Figure Figure Figure Figure 10.60
 221 REGION B ONLY 10.5 LATERAL MARKS 10.5.1 Description of Lateral marks Port hand marks Shape: pillar buoy (Figures 10.53 and 10.54), can lighted buoy (Figures 10.55 and 10.56) or not lighted (Figures
5 THINGS TO KNOW IN Vail R. Brown, STR
 5 THINGS TO KNOW IN 2014 Vail R. Brown, STR VAIL R. BROWN Vice President of Global Business Development and Marketing for STR. Mrs. Brown is responsible for the overall coordination, functional management
DRAFT VMS Corridor Analysis updated for November meetings
 DRAFT VMS Corridor Analysis updated for November meetings Alternatives Currently DAS are allocated to the limited access fishery based on an estimate of projected catch in open areas divided by an estimate
Preliminary survival estimates for the passage of spring-migrating juvenile salmonids through Snake and Columbia River dams and reservoirs, 2017
 UNITED STATES DEPARTMENT OF COMMERCE National Oceanic and Atmospheric Administration NATIONAL MARINE FISHERIES SERVICE Northwest Fisheries Science Center Fish Ecology Division 2725 Montlake Boulevard East
Public Notice. Corps File No. LRE Date: March 19, 2017 Expires: March 18, 2022
 US Army Corps of Engineers Detroit District Public Notice Corps File No. LRE-2016-00006-100 Date: March 19, 2017 Expires: March 18, 2022 PUBLIC NOTICE ANNOUNCING REGIONAL CONDITIONS AND WATER QUALITY CERTIFICATIONS
MONTGOMERY COUNTY PLANNING DEPARTMENT THE MARYLAND-NATIONAL CAPITAL PARK AND PLANNING COMMISSION
 MONTGOMERY COUNTY PLANNING DEPARTMENT THE MARYLAND-NATIONAL CAPITAL PARK AND PLANNING COMMISSION MCPB Item No. 3 Date: 01-19-12 Worksession: Countywide Transit Corridors Functional Master Plan Larry Cole,
OPERATIONS Western Gulf Coast Edition TX DOT Ports & Waterways Conference 2009
 Click to edit Master title style 1 OPERATIONS Western Gulf Coast Edition TX DOT Ports & Waterways Conference 2009 Section 5 Click to edit Master title style 5.1 Towing 2 5.1 Towing Click to edit Master
847 NE 19 th Avenue, #250, Portland, OR Phone: (503) Fax: (503) us at
 Fax: (503) us at") FISH PASSAGE CENTER 847 NE 19 th Avenue, #250, Portland, OR 97232 Phone: (503) 833-3900 Fax: (503) 232-1259 www.fpc.org/ e-mail us at fpcstaff@fpc.org MEMORANDUM TO: Charlie Morrill (WDFW) FROM: Michele
FISH PASSAGE CENTER 847 NE 19 th Avenue, #250, Portland, OR 97232 Phone: (503) 833-3900 Fax: (503) 232-1259 www.fpc.org/ e-mail us at fpcstaff@fpc.org MEMORANDUM TO: Charlie Morrill (WDFW) FROM: Michele
2007 Adult Returns and 2008 Expectations Columbia River
 2007 Adult Returns and 2008 Expectations Columbia River Preliminary Draft December 11, 2007 (updated ) Adult Returns Willamette Spring Upriver Spring Upriver Summer Sockeye Upriver Summer Steelhead Bright
Intracoastal Waterway and other Federal Shallow Draft Inlets
 Intracoastal Waterway and other Federal Shallow Draft Inlets Shelley Trulock Project Manager 904-232-3292 Navigation 900 miles of Inland Waterways 6 navigation locks Atlantic Intracoastal Waterway (AIWW)
Section 1: Introduction
 Date: October 18, 2016 Regarding: Vehicle Thefts with Keys in the United States - (Public Dissemination) Prepared By: Olivia Ortiz, Strategic Analyst and Josh Cahill, Strategic Analyst Section 1: Introduction
Inlet Specific and Seasonal Variation in Vessel Use Patterns: The case of the Northeast Florida Region
 Inlet Specific and Seasonal Variation in Vessel Use Patterns: The case of the Northeast Florida Region Nancy Montes Robert Swett University of Florida Automatic Identification System (AIS) Ships 300 or
Compression Study: City, State. City Convention & Visitors Bureau. Prepared for
 : City, State Prepared for City Convention & Visitors Bureau Table of Contents City Convention & Visitors Bureau... 1 Executive Summary... 3 Introduction... 4 Approach and Methodology... 4 General Characteristics
Target Shooting by Hunters and Their Use of Shooting Ranges: 1975, 1991, and 2011
 U.S. Fish & Wildlife Service Target Shooting by Hunters and Their Use of Shooting Ranges: 1975, 1991, and 2011 Addendum to the 2011 National Survey of Fishing, Hunting, and Wildlife-Associated Recreation