How the Pueblo Area Stacks Up:
|
|
|
- Jessie Evan McCarthy
- 5 years ago
- Views:
Transcription


1 How the Pueblo Area Stacks Up: An Evaluation of U.S. Metropolitan Area to Account for Relative Differences Prepared by Pueblo Area Council of Governments, MPO/TPR Urban Transportation Planning Division Don R. Vest Senior Socioeconomic Planner October, 2005
2 SUMMARY OF FINDINGS: Puebloans have long felt that their community s low ranking in federal surveys of wages have been unduly prejudicial to a fair assessment of quality of life locally. Wage rates should be evaluated in the context of the relative cost of living in a community. A city that has high wages but which is also an expensive place in which to live is not as attractive as one with more modest wages but inexpensive costs for commodities and services. This report attempts to compare wages within U.S. metropolitan areas before and after adjusting for relative differences in cost of living. It reveals that after cost differences have been taken into account, Pueblo has a somewhat improved standing relative to other communities. The argument that the community is unfairly maligned if only wage rankings are considered appears to have at least some validity. This report attempts to quantify what has been understood intuitively as being true. The conclusions which can be drawn from this report are outlined below: Before adjustment for wage differences, Pueblo ranked 174 th of the 212 U.S. metropolitan areas where cost of living data permitted an analysis of wages; After adjustment for cost of living differences, Pueblo s wage rank relative to the other metropolitan areas was 131/212; Pueblo s unadjusted wage was $28,452. After wage adjustment for cost of living differences, it was $31,933, almost $3,500 greater; Before wage adjustment, Pueblo s wage was over $4,500 less than the mean U.S. metropolitan wage; After adjustment for wages differences, Pueblo s wage level was still below the average National value, but only by $1,400. The reader is encouraged to at least glance at the appendices, which show the relative ranking of communities by their respective wage rates. Three tables are included in the appendices: The communities, sorted alphabetically by name, numerically by rank, and numerically by adjusted wage rank. 1
3 INTRODUCTION: For many years, the U.S. Bureau of Labor Statistics has released data showing wage rankings for U.S. metropolitan areas. This information provides a useful means of gauging the relative economic affluence of U.S. communities, but it reveals only part of the picture. The figures do not take into account relative cost of living differences between cities. Housing costs in particular vary widely between different geographic areas. The value of amenities which can be afforded is directly related to disposable income, which in turn is influenced by the amount of wages which must be spent to provide for basic goods and services. The overall quality of life in communities is directly impacted not only by wages, but also by the cost of living within these localities. This report has been prepared to provide a more realistic assessment of the relative affluence of communities by adjusting wage rates using relative cost of living information. Two data sources are the basis of the report: the U.S. Bureau of Labor Statistics issues wage rankings for U.S. metropolitan areas. For this report, annual data were used, as this was the latest which was available. The American Chamber of Commerce Researcher s Association (), issues a report that indicates the relative cost of living within various communities. While not all of the 362 U.S. metropolitan areas listed in the Bureau of Labor Statistics wage report are included, a fair sampling of them are shown. Preparation of this document was funded, in part, with a planning grant from the Federal Highway Administration and the Federal Transit Administration. FHWA and FTA are not, however, responsible for the content of the document Questions or comments about this study can be sent to Don Vest, PACOG MPO/TPR, 211 East D. St., Pueblo, CO 81003, or by to dvest@pueblo.us. 2
4 METHODOLOGY: The American Chamber of Commerce Researcher s Association () releases information on a quarterly basis which shows the relative cost of living in U.S. communities. Through a voluntary effort of organizations within the participating communities, information is collected on the cost of goods and services within these respective areas. Once the information has been tabulated, it is assigned a weighted value based on expenditure patterns of executive and professional households. The information for each community is given a ranking. An index value of is established as the cost of living in a typical U.S. community. It costs more to live in a community with an index value of greater than 100; less than what is typical for the U.S. in communities having an index value of less than In addition to its overall rank, each community is evaluated on six separate categories, namely: groceries, housing, utilities, transportation, health care and miscellaneous goods and services. The metropolitan area wage data from the U.S. Bureau of Labor Statistics is comprehensive in listing all U.S. metropolitan statistical areas. The data on relative cost of living, available from the report does not include the universe of metropolitan areas, but nonetheless provides a fair sample of metropolitan areas which are available for analysis. The unadjusted metro area wage is divided by its relative cost of living to derive an adjusted wage. Two examples will show how the process works: Abilene, TX has an unadjusted wage rate of $26,013, and a relative cost of living index value of 90.2; (it costs less to live in Abilene than the U.S. average). Dividing the first number by the second (.902), yields the adjusted wage value of $28,839. This makes sense. Because it costs less to live in Abilene the adjustment of wages should give a value which is higher than the unadjusted rate. This accounts for the comparative advantage Abilene has in terms of its cost of living. Now consider the example of a community where the cost of living is greater than the U.S. value Albuquerque, NM. Albuquerque has a relatively high wage rate of $33,406, but also it costs more to live there than true Nationally. Its cost of living figure was Dividing the first value by the second, (1.063), gives an adjusted wage of $28,001. The relative affluence of Albuquerque is offset by its relatively high cost of living. Again, this is reasonable, since a community with higher than average cost of living would be expected to have an adjusted wage rate that is less than the unadjusted value. The results of the unadjusted and adjusted metropolitan wage values are then sorted and ranked from highest to lowest. The balance of this report contains tables and graphics that attempt to gauge the implications of these rankings. 3
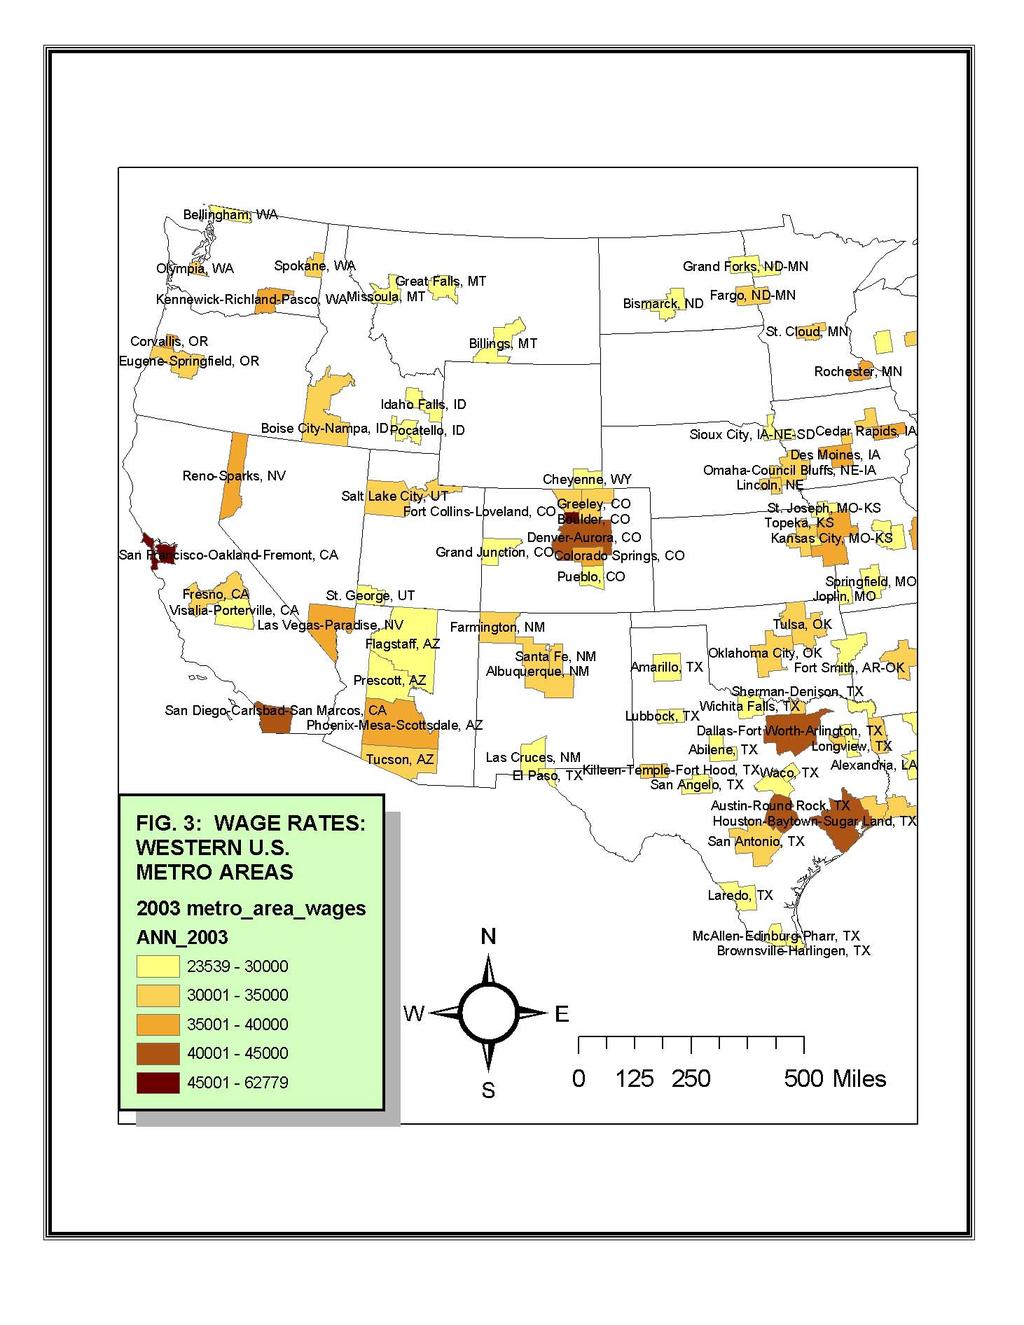
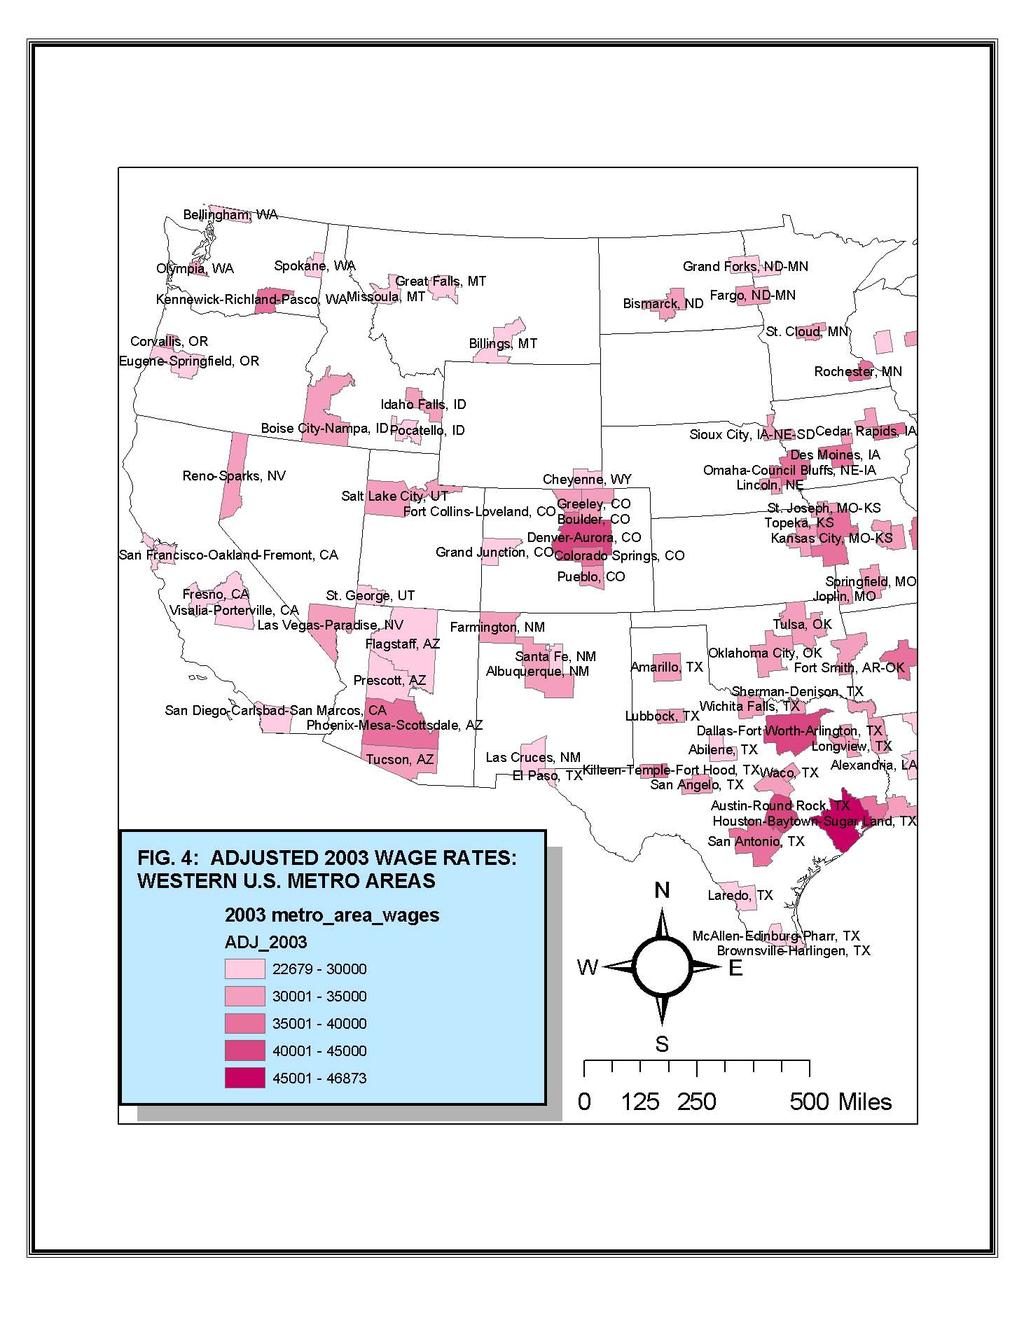
5 ANALYSIS: In terms of the unadjusted wage values, the range was from a high of $62,779 in Bridgeport-Stamford-Norwalk, CT MSA to a low of $23,539 in Brownsville-Harlingen, TX MSA. The mean (average) value was $32,989. Pueblo s wage was $28,452, and it ranked 174 th of the 212 communities. In terms of the adjusted wage rates, the high value was $46,873 in Houston-Baytown- Sugarland, TX MSA to a low value of $22,679 in Honolulu, HI MSA. Though wages in Honolulu are relatively high, the high cost of living ensures that wage levels cannot compensate for the expense of living there (although other intangible factors may come into play). The table below shows summary statistics for the unadjusted and adjusted distribution of wages: TABLE 1: FREQUENCY DISTRIBUTION* Unadjusted CLASS Number Percent CLASS Number Percent $0 - $27, % $0 - $29, % $27,208 - $32, % $29,175 - $33, % $32,989 - $38, % $33,352 - $37, % > $38, % > $37, % TOTAL % TOTAL % BY QUARTILES BY QUARTILES Q1 $29,141 Q1 $30,545 Q2 $31,633 Q2 $33,134 Q3 $35,384 Q3 $35,894 Q4 $62,779 Q4 $46,873 SKEWNESS KURTOSIS *NOTE: Distribution by classes represents 1 standard deviation above and below the mean. An ancient Chinese proverb states that a picture is worth a thousand words. For purposes of this report, two pictures are worth two-thousand words. These are shown on the following two pages. The maps (following the graphs) augment these conclusions. 4
6 FIG. 1: U.S. METRO AREA WAGES, (UNADJUSTED)* San Francisco-Oakland-Fremont, CA MSA Washington-Arlington-Arlington-Alexandria, DC-VA-MD-WV MSA Trenton-Ewing, NJ MSA Boulder, CO MSA Durham, NC MSA Denver-Aurora, CO MSA Los Angeles-Long Beach-Santa Ana, CA MSA Houston-Baytown-Sugar Land, TX MSA Atlanta-Sandy Springs-Marietta, GA MSA New Haven-Milford, CT MSA San Diego-Carlsbad-San Marcos, CA MSA Charlotte-Gastonia-Concord, NC-SC MSA Norwich-New London, CT MSA* Rochester, MN MSA Springfield, IL MSA Cincinnati-Middletown, OH, KY MSA St. Louis, MO-IL MSA Indianapolis, IN MSA Corvallis, OR MSA Phoenix-Mesa-Scottsdale, AZ MSA Fairbanks, AK MSA Memphis, TN-MS-AR MSA Burlington-South Burlington, VT MSA Reno-Sparks, NV MSA Dayton, OH MSA Grand Rapids-Wyoming, MI MSA Akron, OH MSA Colorado Springs, CO MSA Las Vegas-Paradise, NV MSA Cedar Rapids, IA MSA Fort Collins-Loveland, CO MSA Holland-Grand Haven, MI MSA Toledo, OH MSA Charlottesville, VA MSA Salt Lake City, UT MSA Omaha-Council Bluffs, NE-IA MSA Beaumont-Port Arthur, TX MSA York-Hanover, PA MSA Green Bay, WI MSA Orlando, FL MSA Fort Wayne, IN MSA Sheboygan, WI MSA Midland, TX MSA Charleston, WV MSA Lafayette, IN MSA Tulsa, OK MSA Little Rock-North Little Rock, AR MSA* Baton Rouge, LA MSA Virginia Beach-Norfolk-Newport News, VA-NC MSA Appleton, WI MSA Champaign-Urbana, IL MSA Ames, IA MSA Greeley, CO MSA Jackson, TN MSA Savannah, GA MSA Roanoke, VA MSA Oklahoma City, OK MSA Tallahassee, FL MSA Tuscaloosa, AL MSA Lincoln, NE MSA Rome, GA MSA Youngstown-Warren-Boardman, OH-PA MSA Sherman-Denison, TX MSA Lake Charles, LA MSA Farmington, NM MSA Sarasota-Bradenton-Venice, FL MSA Eugene-Springfield, OR MSA Cleveland, TN MSA Shreveport-Bossier City, LA MSA Morristown, TN MSA Muncie, IN MSA Waco, TX MSA Danville, IL MSA Cheyenne, WY MSA Columbus, GA-AL MSA Bowling Green, KY MSA Glens Falls, NY MSA Columbia, MO MSA Wilmington, NC MSA Panama City-Lynn Haven, FL MSA Pensacola-Ferry Pass-Brent, FL MSA Asheville, NC MSA Jefferson City, MO MSA Williamsport, PA MSA Gainesville, FL MSA Fayetteville, NC MSA Pueblo, CO MSA Gulfport-Biloxi, MS MSA Springfield, MO MSA Idaho Falls, ID MSA Killeen-Temple-Fort Hood, TX MSA Johnstown, PA MSA Florence-Muscle Shoals, AL MSA Wichita Falls, TX MSA Joplin, MO MSA Fort Smith, AR-OK MSA Lawrence, KS MSA Visalia-Porterville, CA MSA Prescott, AZ MSA Jonesboro, AR MSA Abilene, TX MSA Sumter, SC MSA Punta Gorda, FL MSA Laredo, TX MSA McAllen-Edinburg-Pharr, TX MSA Brownsville-Harlingen, TX MSA* *NOTE For clarity, only every 2nd name shown PUEBLO $0 $10,000 $20,000 $30,000 $40,000 $50,000 $60,000 $70,000 5
7 FIG. 2: U.S. METRO AREA WAGES, (ADJUSTED FOR RELATIVE COST OF LIVING)* Detroit-Warren-Livonia, MI MSA Austin-Round Rock, TX MSA* Huntsville, AL MSA Bridgeport-Stamford-Norwalk, CT MSA* Denver-Aurora, CO MSA Indianapolis, IN MSA Rochester, MN MSA Nashville-Davidson--Murfreesburo, TN MSA Minneapolis-St. Paul-Bloomington, MN MSA Des Moines, IA MSA Raleigh-Cary, NC MSA Kansas City, MO-KS MSA San Antonio, TX MSA* Winston-Salem, NC MSA Louisville, KY-IN MSA Knoxville, TN MSA Cedar Rapids, IA MSA Pittsburgh, PA MSA Beaumont-Port Arthur, TX MSA Milwaukee-Waukesha-West Allis, WI MSA Cleveland-Elyria-Mentor, OH MSA Peoria, IL MSA Midland, TX MSA Omaha-Council Bluffs, NE-IA MSA Jackson, TN MSA Lexington-Fayette, KY MSA Toledo, OH MSA Kennewick-Richland-Pasco, WA MSA Philadelphia-Camden-Wilmington, PA-NJ- Colorado Springs, CO MSA Augusta-Richmond County GA/SC MSA Syracuse, NY MSA Sheboygan, WI MSA York-Hanover, PA MSA Chattanooga, TN-GA MSA Tucson, AZ MSA Lafayette, IN MSA Corvallis, OR MSA Rome, GA MSA Davenport-Moline-Rock Island, IL MSA Odessa, TX MSA Lynchburg, VA MSA Montgomery, AL MSA Amarillo, TX MSA Appleton, WI MSA Roanoke, VA MSA Tyler, TX MSA New Orleans-Metairie-Kenner, LA MSA Boise City-Nampa, ID MSA Champaign-Urbana, IL MSA Youngstown-Warren-Boardman, OH-PA MSA Topeka, KS MSA Salt Lake City, UT MSA Cleveland, TN MSA Waco, TX MSA Lima, OH MSA Columbus, GA-AL MSA Savannah, GA MSA Fargo, ND-MN MSA Greeley, CO MSA Burlington-South Burlington, VT MSA Lake Charles, LA MSA Shreveport-Bossier City, LA MSA Baton Rouge, LA MSA PUEBLO Waterloo-Cedar Falls, IA MSA Fort Smith, AR-OK MSA Greenville, NC MSA Bowling Green, KY MSA Huntington-Ashland, WV-KY-OH MSA Florence-Muscle Shoals, AL MSA Tuscaloosa, AL MSA Albuquerque, NM MSA St. Joseph, MO-KS MSA Sioux City, IA-NE-SD MSA Columbia, MO MSA Fort Walton Beach-Crestview-Destin MSA Tallahassee, FL MSA Wichita Falls, TX MSA San Angelo, TX MSA St. Cloud, MN MSA Killeen-Temple-Fort Hood, TX MSA Johnstown, PA MSA Gulfport-Biloxi, MS MSA Alexandria, LA MSA Poughkeepsie-Newburgh-Middletown, NY Burlington, NC MSA Grand Junction, CO MSA Wilmington, NC MSA Asheville, NC MSA Los Angeles-Long Beach-Santa Ana, CA MSA El Paso, TX MSA Hattiesburg, MS MSA Glens Falls, NY MSA Williamsport, PA MSA Punta Gorda, FL MSA Grand Forks, ND-MN MSA Goldsboro, NC MSA Gainesville, FL MSA Las Cruces, NM MSA McAllen-Edinburg-Pharr, TX MSA Fresno, CA MSA Valdosta, GA MSA Brownsville-Harlingen, TX MSA* Santa Fe, NM MSA Visalia-Porterville, CA MSA Honolulu, HI MSA $0 $5,000 $10,000 $15,000 $20,000 $25,000 $30,000 $35,000 $40,000 $45,000 $50,000 *NOTE: For clarity, only every 2nd metro name shown 6
8 7
9 8
10 CONCLUSIONS: Figures 1 shows that in terms of its wages, Pueblo ranks far down the list. After wages are adjusted to account for cost of living differences, Pueblo s rank shows a marked improvement, though not to the extent of bringing wages to the level of the average U.S. metropolitan area. This is depicted in Figure 2. The maps show that the most significant impact that adjustment for cost of living differentials has (for Colorado at least) is to lower the relative rank of Boulder, which ranked high in terms of its unadjusted wage ranking, but also has a high cost of living. Accounting for cost of living differences does produce some real differences in the level of wages in a community. These factors have some validity in assessing economic affluence. Indeed, they are vital in evaluating the overall quality of life in a community. 9
11 APP. 1: U.S. METROPOLITAN AREA WAGES (Sorted by ) Q3 Abilene, TX MSA $26, $28, Akron, OH MSA $35, $37, Albuquerque, NM MSA $33, $31, Alexandria, LA MSA $27, $29, Amarillo, TX MSA $29, $33, Ames, IA MSA $31, $32, Appleton, WI MSA $32, $33, Asheville, NC MSA $29, $29, Atlanta-Sandy Springs-Marietta, GA MSA $41, $43,301 5 Auburn-Opelika, AL MSA $27, $30, Augusta-Richmond County GA/SC MSA $32, $35, Austin-Round Rock, TX MSA* $40, $43,808 4 Baltimore-Towson, MD MSA $39, $42,476 7 Baton Rouge, LA MSA $32, $32, Beaumont-Port Arthur, TX MSA $33, $37, Bellingham, WA MSA $29, $27, Billings, MT MSA $29, $29, Bismarck, ND MSA $29, $31, Boise City-Nampa, ID MSA $32, $33, Boston-Cambridge-Quincy, MA-NH MSA $49, $36, Boulder, CO MSA $45, $38, Bowling Green, KY MSA $29, $31, Bridgeport-Stamford-Norwalk, CT MSA* $62, $41,825 8 Brownsville-Harlingen, TX MSA* $23, $25, Buffalo-Niagara Falls, NY MSA $33, $33, Burlington, NC MSA $28, $29, Burlington-South Burlington, VT MSA $36, $32, Cedar Rapids, IA MSA $35, $37, Champaign-Urbana, IL MSA $31, $33, Charleston, WV MSA $32, $35,
12 APP. 1: U.S. METROPOLITAN AREA WAGES (Sorted by ) Q3 Charleston-North Charleston, SC MSA $31, $32, Charlotte-Gastonia-Concord, NC-SC MSA $40, $41,668 9 Charlottesville, VA MSA $34, $32, Chattanooga, TN-GA MSA $31, $34, Cheyenne, WY MSA $29, $28, Chicago-Naperville-Joliet, IL-IN-WI MSA $43, $33, Cincinnati-Middletown, OH, KY MSA $37, $39, Clarksville, TN-KY MSA* $27, $31, Cleveland, TN MSA $30, $33, Cleveland-Elyria-Mentor, OH MSA $37, $36, Colorado Springs, CO MSA $35, $35, Columbia, MO MSA $29, $31, Columbia, SC MSA $31, $32, Columbus, GA-AL MSA $29, $32, Corvallis, OR MSA $37, $34, Dallas-Fort Worth-Arlington, TX MSA $42, $43,975 3 Danville, IL MSA $29, $31, Davenport-Moline-Rock Island, IL MSA $32, $34, Dayton, OH MSA $35, $38, Decatur, AL MSA $31, $35, Decatur, IL MSA $34, $36, Denver-Aurora, CO MSA $43, $40, Des Moines, IA MSA $36, $38, Detroit-Warren-Livonia, MI MSA $44, $44,654 2 Durham, NC MSA $43, $38, Eau Claire, WI MSA $29, $29, El Paso, TX MSA $27, $28, Eugene-Springfield, OR MSA $30, $27, Evansville, IN-KY MSA $33, $33, Fairbanks, AK MSA $36, $29, Fargo, ND-MN MSA $30, $32,
13 APP. 1: U.S. METROPOLITAN AREA WAGES (Sorted by ) Q3 Farmington, NM MSA $30, $31, Fayetteville, NC MSA $28, $30, Fayetteville-Springdale-Rogers, AR-MO MSA $31, $33, Flagstaff, AZ MSA $28, $26, Florence-Muscle Shoals, AL MSA $27, $31, Fort Collins-Loveland, CO MSA $34, $33, Fort Smith, AR-OK MSA $27, $31, Fort Walton Beach-Crestview-Destin MSA $29, $31, Fort Wayne, IN MSA $33, $37, Fresno, CA MSA $30, $26, Gainesville, FL MSA $28, $27, Glens Falls, NY MSA $29, $28, Goldsboro, NC MSA $26, $27, Grand Forks, ND-MN MSA $26, $28, Grand Junction, CO MSA $29, $29, Grand Rapids-Wyoming, MI MSA $35, $36, Great Falls, MT MSA $26, $27, Greeley, CO MSA $31, $32, Green Bay, WI MSA $33, $35, Greenville, NC MSA $29, $31, Gulfport-Biloxi, MS MSA $28, $30, Hartford-West Hartford-East Hartford, CT MSA $45, $37, Hattiesburg, MS MSA $26, $28, Holland-Grand Haven, MI MSA $34, $35, Honolulu, HI MSA $35, $22, Houston-Baytown-Sugar Land, TX MSA $42, $46,873 1 Huntington-Ashland, WV-KY-OH MSA $29, $31, Huntsville, AL MSA $40, $43,126 6 Idaho Falls, ID MSA $28, $31, Indianapolis, IN MSA $37, $40, Jackson, MS MSA $31, $33,
14 APP. 1: U.S. METROPOLITAN AREA WAGES (Sorted by ) Q3 Jackson, TN MSA $31, $36, Jacksonville, FL MSA $35, $38, Janesville, WI MSA $34, $35, Jefferson City, MO MSA $28, $31, Johnson City, TN MSA $27, $30, Johnstown, PA MSA $27, $30, Jonesboro, AR MSA $26, $30, Joplin, MO MSA $27, $31, Kansas City, MO-KS MSA $37, $38, Kennewick-Richland-Pasco, WA MSA $36, $35, Killeen-Temple-Fort Hood, TX MSA $27, $30, Kingsport-Bristol-Bristol-Bristol, TN-VA MSA $31, $35, Knoxville, TN MSA $33, $37, Lafayette, IN MSA $32, $34, Lafayette, LA MSA $32, $33, Lake Charles, LA MSA $30, $32, Laredo, TX MSA $25, $29, Las Cruces, NM MSA $26, $27, Las Vegas-Paradise, NV MSA $35, $33, Lawrence, KS MSA $26, $27, Lexington-Fayette, KY MSA $34, $36, Lima, OH MSA $31, $32, Lincoln, NE MSA $31, $31, Little Rock-North Little Rock, AR MSA* $32, $37, Longview, TX MSA $28, $32, Los Angeles-Long Beach-Santa Ana, CA MSA $43, $29, Louisville, KY-IN MSA $34, $37, Lubbock, TX MSA $28, $32, Lynchburg, VA MSA $29, $34, Manchester-Nashua, NH MSA $41, $39, McAllen-Edinburg-Pharr, TX MSA $23, $27,
15 APP. 1: U.S. METROPOLITAN AREA WAGES (Sorted by ) Q3 Memphis, TN-MS-AR MSA $36, $40, Miami-Fort Lauderdale-Miami Beach, FL MSA $36, $31, Midland, TX MSA $32, $36, Milwaukee-Waukesha-West Allis, WI MSA $37, $36, Minneapolis-St. Paul-Bloomington, MN MSA $43, $39, Missoula, MT MSA $28, $28, Mobile, AL MSA $30, $34, Monroe, LA MSA $27, $28, Montgomery, AL MSA $31, $33, Morristown, TN MSA $29, $34, Muncie, IN MSA $29, $32, Myrtle Beach-Conway-North Myrtle Beach, SC MSA $25, $26, Nashville-Davidson--Murfreesburo, TN MSA $36, $39, New Haven-Milford, CT MSA $41, $34, New Orleans-Metairie-Kenner, LA MSA $33, $33, New York-Northern NJ-Island,NY-NJ-PA MSA* $52, $23, Norwich-New London, CT MSA* $39, $34, Odessa, TX MSA $30, $34, Oklahoma City, OK MSA $31, $33, Olympia, WA MSA $34, $34, Omaha-Council Bluffs, NE-IA MSA $33, $36, Orlando, FL MSA $33, $33, Panama City-Lynn Haven, FL MSA $29, $30, Pensacola-Ferry Pass-Brent, FL MSA $29, $30, Peoria, IL MSA $35, $36, Philadelphia-Camden-Wilmington, PA-NJ-DE- MD MSA $43, $35, Phoenix-Mesa-Scottsdale, AZ MSA $37, $38, Pittsburgh, PA MSA $36, $37, Pocatello, ID MSA $25, $28, Portland-Vancouver-Beaverton, OR-WA MSA $38, $34,
16 APP. 1: U.S. METROPOLITAN AREA WAGES (Sorted by ) Q3 Poughkeepsie-Newburgh-Middletown, NY MSA $35, $29, Prescott, AZ MSA $26, $25, Pueblo, CO MSA $28, $31, Punta Gorda, FL MSA $25, $28, Raleigh-Cary, NC MSA $37, $38, Reno-Sparks, NV MSA $36, $34, Richmond, VA MSA $37, $37, Roanoke, VA MSA $31, $33, Rochester, MN MSA $38, $39, Rome, GA MSA $31, $34, Salt Lake City, UT MSA $34, $33, San Angelo, TX MSA $27, $30, San Antonio, TX MSA* $32, $38, San Diego-Carlsbad-San Marcos, CA MSA $40, $29, San Francisco-Oakland-Fremont, CA MSA $52, $29, Santa Fe, NM MSA $31, $25, Sarasota-Bradenton-Venice, FL MSA $30, $28, Savannah, GA MSA $31, $32, Sheboygan, WI MSA $33, $34, Sherman-Denison, TX MSA $30, $33, Shreveport-Bossier City, LA MSA $30, $32, Sioux City, IA-NE-SD MSA $29, $31, South Bend-Mishawaka, IN-MI MSA $32, $33, Spartanburg, SC MSA $33, $36, Spokane, WA MSA $30, $29, Springfield, IL MSA $37, $39, Springfield, MO MSA $28, $32, St. Cloud, MN MSA $30, $30, St. George, UT MSA $23, $25, St. Joseph, MO-KS MSA $28, $31, St. Louis, MO-IL MSA $37, $36,
17 APP. 1: U.S. METROPOLITAN AREA WAGES (Sorted by ) Q3 Sumter, SC MSA $25, $27, Syracuse, NY MSA $34, $35, Tallahassee, FL MSA $31, $30, Tampa-St Petersburg-Clearwater,FL MSA $33, $35, Terre Haute, IN MSA $29, $32, Texarkana, TX-Texarkana, AR MSA $28, $31, Toledo, OH MSA $34, $35, Topeka, KS MSA $30, $33, Trenton-Ewing, NJ MSA $49, $38, Tucson, AZ MSA $32, $34, Tulsa, OK MSA $32, $34, Tuscaloosa, AL MSA $31, $31, Tyler, TX MSA $31, $33, Valdosta, GA MSA $24, $26, Vero Beach, FL MSA $29, $30, Virginia Beach-Norfolk-Newport News, VA-NC MSA $32, $32, Visalia-Porterville, CA MSA $26, $25, Waco, TX MSA $29, $32, Washington-Arlington-Arlington-Alexandria, DC-VA-MD-WV MSA $50, $36, Waterloo-Cedar Falls, IA MSA $30, $32, Wausau, WI MSA $31, $33, Wichita Falls, TX MSA $27, $30, Williamsport, PA MSA $28, $28, Wilmington, NC MSA $29, $29, Winston-Salem, NC MSA $35, $38, Worcester, MA MSA $39, $34, York-Hanover, PA MSA $33, $34, Youngstown-Warren-Boardman, OH-PA MSA $31, $33,
18 APP. 2: U.S. METROPOLITAN AREA WAGES (Sorted by Unadjusted ) Q3 Bridgeport-Stamford-Norwalk, CT MSA* $62, $41,825 SEE San Francisco-Oakland-Fremont, CA MSA $52, $29,218 NEXT New York-Northern NJ-Island,NY-NJ-PA MSA* $52, $23,942 TABLE Washington-Arlington-Arlington-Alexandria, DC-VA-MD-WV MSA $50, $36,658 APP.3 Boston-Cambridge-Quincy, MA-NH MSA $49, $36,955 Trenton-Ewing, NJ MSA $49, $38,320 Hartford-West Hartford-East Hartford, CT MSA $45, $37,542 Boulder, CO MSA $45, $38,792 Detroit-Warren-Livonia, MI MSA $44, $44,654 Durham, NC MSA $43, $38,300 Chicago-Naperville-Joliet, IL-IN-WI MSA $43, $33,029 Denver-Aurora, CO MSA $43, $40,981 Philadelphia-Camden-Wilmington, PA-NJ-DE-MD MSA $43, $35,738 Los Angeles-Long Beach-Santa Ana, CA MSA $43, $29,175 Minneapolis-St. Paul-Bloomington, MN MSA $43, $39,020 Houston-Baytown-Sugar Land, TX MSA $42, $46,873 Dallas-Fort Worth-Arlington, TX MSA $42, $43,975 Atlanta-Sandy Springs-Marietta, GA MSA $41, $43,301 Manchester-Nashua, NH MSA $41, $39,890 New Haven-Milford, CT MSA $41, $34,873 Austin-Round Rock, TX MSA* $40, $43,808 San Diego-Carlsbad-San Marcos, CA MSA $40, $29,338 Huntsville, AL MSA $40, $43,126 Charlotte-Gastonia-Concord, NC-SC MSA $40, $41,668 Baltimore-Towson, MD MSA $39, $42,476 Norwich-New London, CT MSA* $39, $34,296 Worcester, MA MSA $39, $34,801 Rochester, MN MSA $38, $39,656 Portland-Vancouver-Beaverton, OR-WA MSA $38, $34,400 Springfield, IL MSA $37, $39,524 Milwaukee-Waukesha-West Allis, WI MSA $37, $36,
19 APP. 2: U.S. METROPOLITAN AREA WAGES (Sorted by Unadjusted ) Q3 Cincinnati-Middletown, OH, KY MSA $37, $39,441 Cleveland-Elyria-Mentor, OH MSA $37, $36,950 St. Louis, MO-IL MSA $37, $36,059 Richmond, VA MSA $37, $37,278 Indianapolis, IN MSA $37, $40,396 Raleigh-Cary, NC MSA $37, $38,588 Corvallis, OR MSA $37, $34,498 Kansas City, MO-KS MSA $37, $38,420 Phoenix-Mesa-Scottsdale, AZ MSA $37, $38,093 Des Moines, IA MSA $36, $38,855 Fairbanks, AK MSA $36, $29,424 Miami-Fort Lauderdale-Miami Beach, FL MSA $36, $31,632 Memphis, TN-MS-AR MSA $36, $40,932 Pittsburgh, PA MSA $36, $37,289 Burlington-South Burlington, VT MSA $36, $32,234 Kennewick-Richland-Pasco, WA MSA $36, $35,808 Reno-Sparks, NV MSA $36, $34,514 Nashville-Davidson--Murfreesburo, TN MSA $36, $39,503 Dayton, OH MSA $35, $38,467 Poughkeepsie-Newburgh-Middletown, NY MSA $35, $29,680 Grand Rapids-Wyoming, MI MSA $35, $36,322 Jacksonville, FL MSA $35, $38,899 Akron, OH MSA $35, $37,320 Winston-Salem, NC MSA $35, $38,223 Colorado Springs, CO MSA $35, $35,505 Peoria, IL MSA $35, $36,786 Las Vegas-Paradise, NV MSA $35, $33,202 Honolulu, HI MSA $35, $22,679 Cedar Rapids, IA MSA $35, $37,408 Syracuse, NY MSA $34, $35,128 Fort Collins-Loveland, CO MSA $34, $33,
20 APP. 2: U.S. METROPOLITAN AREA WAGES (Sorted by Unadjusted ) Q3 Louisville, KY-IN MSA $34, $37,953 Holland-Grand Haven, MI MSA $34, $35,489 Lexington-Fayette, KY MSA $34, $36,006 Toledo, OH MSA $34, $35,862 Olympia, WA MSA $34, $34,630 Charlottesville, VA MSA $34, $32,098 Decatur, IL MSA $34, $36,773 Salt Lake City, UT MSA $34, $33,175 Janesville, WI MSA $34, $35,356 Omaha-Council Bluffs, NE-IA MSA $33, $36,487 Tampa-St Petersburg-Clearwater,FL MSA $33, $35,617 Beaumont-Port Arthur, TX MSA $33, $37,132 Knoxville, TN MSA $33, $37,459 York-Hanover, PA MSA $33, $34,841 Buffalo-Niagara Falls, NY MSA $33, $33,790 Green Bay, WI MSA $33, $35,094 Spartanburg, SC MSA $33, $36,792 Orlando, FL MSA $33, $33,748 Albuquerque, NM MSA $33, $31,426 Fort Wayne, IN MSA $33, $37,441 New Orleans-Metairie-Kenner, LA MSA $33, $33,696 Sheboygan, WI MSA $33, $34,972 Evansville, IN-KY MSA $33, $33,829 Midland, TX MSA $32, $36,695 Tucson, AZ MSA $32, $34,666 Charleston, WV MSA $32, $35,828 Davenport-Moline-Rock Island, IL MSA $32, $34,319 Lafayette, IN MSA $32, $34,609 Augusta-Richmond County GA/SC MSA $32, $35,457 Tulsa, OK MSA $32, $34,
21 APP. 2: U.S. METROPOLITAN AREA WAGES (Sorted by Unadjusted ) Q3 South Bend-Mishawaka, IN-MI MSA $32, $33,603 Little Rock-North Little Rock, AR MSA* $32, $37,119 San Antonio, TX MSA* $32, $38,304 Baton Rouge, LA MSA $32, $32,097 Lafayette, LA MSA $32, $33,884 Virginia Beach-Norfolk-Newport News, VA-NC MSA $32, $32,876 Boise City-Nampa, ID MSA $32, $33,585 Appleton, WI MSA $32, $33,856 Tyler, TX MSA $31, $33,780 Champaign-Urbana, IL MSA $31, $33,430 Chattanooga, TN-GA MSA $31, $34,715 Ames, IA MSA $31, $32,417 Fayetteville-Springdale-Rogers, AR-MO MSA $31, $33,530 Greeley, CO MSA $31, $32,367 Montgomery, AL MSA $31, $33,989 Jackson, TN MSA $31, $36,291 Kingsport-Bristol-Bristol-Bristol, TN-VA MSA $31, $35,992 Savannah, GA MSA $31, $32,631 Decatur, AL MSA $31, $35,773 Roanoke, VA MSA $31, $33,822 Columbia, SC MSA $31, $32,913 Oklahoma City, OK MSA $31, $33,956 Wausau, WI MSA $31, $33,265 Tallahassee, FL MSA $31, $30,941 Charleston-North Charleston, SC MSA $31, $32,018 Tuscaloosa, AL MSA $31, $31,463 Jackson, MS MSA $31, $33,093 Lincoln, NE MSA $31, $31,719 Santa Fe, NM MSA $31, $25,918 Rome, GA MSA $31, $34,
22 APP. 2: U.S. METROPOLITAN AREA WAGES (Sorted by Unadjusted ) Q3 Lima, OH MSA $31, $32,907 Youngstown-Warren-Boardman, OH-PA MSA $31, $33,310 Mobile, AL MSA $30, $34,361 Sherman-Denison, TX MSA $30, $33,315 Topeka, KS MSA $30, $33,256 Lake Charles, LA MSA $30, $32,210 Odessa, TX MSA $30, $34,248 Farmington, NM MSA $30, $31,436 Spokane, WA MSA $30, $29,921 Sarasota-Bradenton-Venice, FL MSA $30, $28,978 St. Cloud, MN MSA $30, $30,531 Eugene-Springfield, OR MSA $30, $27,915 Waterloo-Cedar Falls, IA MSA $30, $32,006 Cleveland, TN MSA $30, $33,081 Fresno, CA MSA $30, $26,793 Shreveport-Bossier City, LA MSA $30, $32,109 Fargo, ND-MN MSA $30, $32,446 Morristown, TN MSA $29, $34,105 Lynchburg, VA MSA $29, $34,001 Muncie, IN MSA $29, $32,760 Amarillo, TX MSA $29, $33,906 Waco, TX MSA $29, $32,955 Greenville, NC MSA $29, $31,735 Danville, IL MSA $29, $31,426 Sioux City, IA-NE-SD MSA $29, $31,289 Cheyenne, WY MSA $29, $28,557 Huntington-Ashland, WV-KY-OH MSA $29, $31,649 Columbus, GA-AL MSA $29, $32,854 Vero Beach, FL MSA $29, $30,649 Bowling Green, KY MSA $29, $31,
23 APP. 2: U.S. METROPOLITAN AREA WAGES (Sorted by Unadjusted ) Q3 Bismarck, ND MSA $29, $31,665 Eau Claire, WI MSA $29, $29,649 Glens Falls, NY MSA $29, $28,749 Columbia, MO MSA $29, $31,196 Fort Walton Beach-Crestview-Destin MSA $29, $31,035 Wilmington, NC MSA $29, $29,328 Bellingham, WA MSA $29, $27,522 Panama City-Lynn Haven, FL MSA $29, $30,986 Billings, MT MSA $29, $29,770 Pensacola-Ferry Pass-Brent, FL MSA $29, $30,389 Grand Junction, CO MSA $29, $29,406 Asheville, NC MSA $29, $29,217 Terre Haute, IN MSA $29, $32,223 Jefferson City, MO MSA $28, $31,076 Burlington, NC MSA $28, $29,579 Williamsport, PA MSA $28, $28,617 Texarkana, TX-Texarkana, AR MSA $28, $31,835 Gainesville, FL MSA $28, $27,663 Longview, TX MSA $28, $32,456 Fayetteville, NC MSA $28, $30,099 Flagstaff, AZ MSA $28, $26,611 Pueblo, CO MSA $28, $31,933 Lubbock, TX MSA $28, $32,256 Gulfport-Biloxi, MS MSA $28, $30,067 St. Joseph, MO-KS MSA $28, $31,401 Springfield, MO MSA $28, $32,170 Missoula, MT MSA $28, $28,186 Idaho Falls, ID MSA $28, $31,223 Alexandria, LA MSA $27, $29,870 Killeen-Temple-Fort Hood, TX MSA $27, $30,
24 APP. 2: U.S. METROPOLITAN AREA WAGES (Sorted by Unadjusted ) Q3 Johnson City, TN MSA $27, $30,941 Johnstown, PA MSA $27, $30,263 Auburn-Opelika, AL MSA $27, $30,458 Florence-Muscle Shoals, AL MSA $27, $31,599 Clarksville, TN-KY MSA* $27, $31,369 Wichita Falls, TX MSA $27, $30,727 San Angelo, TX MSA $27, $30,635 Joplin, MO MSA $27, $31,468 Monroe, LA MSA $27, $28,631 Fort Smith, AR-OK MSA $27, $31,867 El Paso, TX MSA $27, $28,965 Lawrence, KS MSA $26, $27,853 Hattiesburg, MS MSA $26, $28,827 Visalia-Porterville, CA MSA $26, $25,687 Grand Forks, ND-MN MSA $26, $28,174 Prescott, AZ MSA $26, $25,930 Goldsboro, NC MSA $26, $27,901 Jonesboro, AR MSA $26, $30,550 Las Cruces, NM MSA $26, $27,566 Abilene, TX MSA $26, $28,839 Great Falls, MT MSA $26, $27,197 Sumter, SC MSA $25, $27,611 Pocatello, ID MSA $25, $28,791 Punta Gorda, FL MSA $25, $28,348 Myrtle Beach-Conway-North Myrtle Beach, SC MSA $25, $26,241 Laredo, TX MSA $25, $29,209 Valdosta, GA MSA $24, $26,525 McAllen-Edinburg-Pharr, TX MSA $23, $27,364 St. George, UT MSA $23, $25,891 Brownsville-Harlingen, TX MSA* $23, $25,
25 APP. 3: U.S. METROPOLITAN AREA WAGES (Sorted by - ) Q3 Houston-Baytown-Sugar Land, TX MSA $42, SEE $46,873 1 Detroit-Warren-Livonia, MI MSA $44, PREV. $44,654 2 Dallas-Fort Worth-Arlington, TX MSA $42, TABLE $43,975 3 Austin-Round Rock, TX MSA* $40, APP.2 $43,808 4 Atlanta-Sandy Springs-Marietta, GA MSA $41, $43,301 5 Huntsville, AL MSA $40, $43,126 6 Baltimore-Towson, MD MSA $39, $42,476 7 Bridgeport-Stamford-Norwalk, CT MSA* $62, $41,825 8 Charlotte-Gastonia-Concord, NC-SC MSA $40, $41,668 9 Denver-Aurora, CO MSA $43, $40, Memphis, TN-MS-AR MSA $36, $40, Indianapolis, IN MSA $37, $40, Manchester-Nashua, NH MSA $41, $39, Rochester, MN MSA $38, $39, Springfield, IL MSA $37, $39, Nashville-Davidson--Murfreesburo, TN MSA $36, $39, Cincinnati-Middletown, OH, KY MSA $37, $39, Minneapolis-St. Paul-Bloomington, MN MSA $43, $39, Jacksonville, FL MSA $35, $38, Des Moines, IA MSA $36, $38, Boulder, CO MSA $45, $38, Raleigh-Cary, NC MSA $37, $38, Dayton, OH MSA $35, $38, Kansas City, MO-KS MSA $37, $38, Trenton-Ewing, NJ MSA $49, $38, San Antonio, TX MSA* $32, $38, Durham, NC MSA $43, $38, Winston-Salem, NC MSA $35, $38, Phoenix-Mesa-Scottsdale, AZ MSA $37, $38, Louisville, KY-IN MSA $34, $37,
26 APP. 3: U.S. METROPOLITAN AREA WAGES (Sorted by - ) Q3 Hartford-West Hartford-East Hartford, CT MSA $45, $37, Knoxville, TN MSA $33, $37, Fort Wayne, IN MSA $33, $37, Cedar Rapids, IA MSA $35, $37, Akron, OH MSA $35, $37, Pittsburgh, PA MSA $36, $37, Richmond, VA MSA $37, $37, Beaumont-Port Arthur, TX MSA $33, $37, Little Rock-North Little Rock, AR MSA* $32, $37, Milwaukee-Waukesha-West Allis, WI MSA $37, $36, Boston-Cambridge-Quincy, MA-NH MSA $49, $36, Cleveland-Elyria-Mentor, OH MSA $37, $36, Spartanburg, SC MSA $33, $36, Peoria, IL MSA $35, $36, Decatur, IL MSA $34, $36, Midland, TX MSA $32, $36, Washington-Arlington-Arlington-Alexandria, DC-VA-MD-WV MSA $50, $36, Omaha-Council Bluffs, NE-IA MSA $33, $36, Grand Rapids-Wyoming, MI MSA $35, $36, Jackson, TN MSA $31, $36, St. Louis, MO-IL MSA $37, $36, Lexington-Fayette, KY MSA $34, $36, Kingsport-Bristol-Bristol-Bristol, TN-VA MSA $31, $35, Toledo, OH MSA $34, $35, Charleston, WV MSA $32, $35, Kennewick-Richland-Pasco, WA MSA $36, $35, Decatur, AL MSA $31, $35, Philadelphia-Camden-Wilmington, PA-NJ- DE-MD MSA $43, $35, Tampa-St Petersburg-Clearwater,FL MSA $33, $35, Colorado Springs, CO MSA $35, $35,
27 APP. 3: U.S. METROPOLITAN AREA WAGES (Sorted by - ) Q3 Holland-Grand Haven, MI MSA $34, $35, Augusta-Richmond County GA/SC MSA $32, $35, Janesville, WI MSA $34, $35, Syracuse, NY MSA $34, $35, Green Bay, WI MSA $33, $35, Sheboygan, WI MSA $33, $34, New Haven-Milford, CT MSA $41, $34, York-Hanover, PA MSA $33, $34, Worcester, MA MSA $39, $34, Chattanooga, TN-GA MSA $31, $34, Tulsa, OK MSA $32, $34, Tucson, AZ MSA $32, $34, Olympia, WA MSA $34, $34, Lafayette, IN MSA $32, $34, Reno-Sparks, NV MSA $36, $34, Corvallis, OR MSA $37, $34, Portland-Vancouver-Beaverton, OR-WA MSA $38, $34, Rome, GA MSA $31, $34, Mobile, AL MSA $30, $34, Davenport-Moline-Rock Island, IL MSA $32, $34, Norwich-New London, CT MSA* $39, $34, Odessa, TX MSA $30, $34, Morristown, TN MSA $29, $34, Lynchburg, VA MSA $29, $34, Fort Collins-Loveland, CO MSA $34, $33, Montgomery, AL MSA $31, $33, Oklahoma City, OK MSA $31, $33, Amarillo, TX MSA $29, $33, Lafayette, LA MSA $32, $33, Appleton, WI MSA $32, $33,
28 APP. 3: U.S. METROPOLITAN AREA WAGES (Sorted by - ) Q3 Evansville, IN-KY MSA $33, $33, Roanoke, VA MSA $31, $33, Buffalo-Niagara Falls, NY MSA $33, $33, Tyler, TX MSA $31, $33, Orlando, FL MSA $33, $33, New Orleans-Metairie-Kenner, LA MSA $33, $33, South Bend-Mishawaka, IN-MI MSA $32, $33, Boise City-Nampa, ID MSA $32, $33, Fayetteville-Springdale-Rogers, AR-MO MSA $31, $33, Champaign-Urbana, IL MSA $31, $33, Sherman-Denison, TX MSA $30, $33, Youngstown-Warren-Boardman, OH-PA MSA $31, $33, Wausau, WI MSA $31, $33, Topeka, KS MSA $30, $33, Las Vegas-Paradise, NV MSA $35, $33, Salt Lake City, UT MSA $34, $33, Jackson, MS MSA $31, $33, Cleveland, TN MSA $30, $33, Chicago-Naperville-Joliet, IL-IN-WI MSA $43, $33, Waco, TX MSA $29, $32, Columbia, SC MSA $31, $32, Lima, OH MSA $31, $32, Virginia Beach-Norfolk-Newport News, VA-NC MSA $32, $32, Columbus, GA-AL MSA $29, $32, Muncie, IN MSA $29, $32, Savannah, GA MSA $31, $32, Longview, TX MSA $28, $32, Fargo, ND-MN MSA $30, $32, Ames, IA MSA $31, $32, Greeley, CO MSA $31, $32,
29 APP. 3: U.S. METROPOLITAN AREA WAGES (Sorted by - ) Q3 Lubbock, TX MSA $28, $32, Burlington-South Burlington, VT MSA $36, $32, Terre Haute, IN MSA $29, $32, Lake Charles, LA MSA $30, $32, Springfield, MO MSA $28, $32, Shreveport-Bossier City, LA MSA $30, $32, Charlottesville, VA MSA $34, $32, Baton Rouge, LA MSA $32, $32, Charleston-North Charleston, SC MSA $31, $32, Waterloo-Cedar Falls, IA MSA $30, $32, Pueblo, CO MSA $28, $31, Fort Smith, AR-OK MSA $27, $31, Texarkana, TX-Texarkana, AR MSA $28, $31, Greenville, NC MSA $29, $31, Lincoln, NE MSA $31, $31, Bowling Green, KY MSA $29, $31, Bismarck, ND MSA $29, $31, Huntington-Ashland, WV-KY-OH MSA $29, $31, Miami-Fort Lauderdale-Miami Beach, FL MSA $36, $31, Florence-Muscle Shoals, AL MSA $27, $31, Joplin, MO MSA $27, $31, Tuscaloosa, AL MSA $31, $31, Farmington, NM MSA $30, $31, Albuquerque, NM MSA $33, $31, Danville, IL MSA $29, $31, St. Joseph, MO-KS MSA $28, $31, Clarksville, TN-KY MSA* $27, $31, Sioux City, IA-NE-SD MSA $29, $31, Idaho Falls, ID MSA $28, $31, Columbia, MO MSA $29, $31,
30 APP. 3: U.S. METROPOLITAN AREA WAGES (Sorted by - ) Q3 Jefferson City, MO MSA $28, $31, Fort Walton Beach-Crestview-Destin MSA $29, $31, Panama City-Lynn Haven, FL MSA $29, $30, Tallahassee, FL MSA $31, $30, Johnson City, TN MSA $27, $30, Wichita Falls, TX MSA $27, $30, Vero Beach, FL MSA $29, $30, San Angelo, TX MSA $27, $30, Jonesboro, AR MSA $26, $30, St. Cloud, MN MSA $30, $30, Auburn-Opelika, AL MSA $27, $30, Killeen-Temple-Fort Hood, TX MSA $27, $30, Pensacola-Ferry Pass-Brent, FL MSA $29, $30, Johnstown, PA MSA $27, $30, Fayetteville, NC MSA $28, $30, Gulfport-Biloxi, MS MSA $28, $30, Spokane, WA MSA $30, $29, Alexandria, LA MSA $27, $29, Billings, MT MSA $29, $29, Poughkeepsie-Newburgh-Middletown, NY MSA $35, $29, Eau Claire, WI MSA $29, $29, Burlington, NC MSA $28, $29, Fairbanks, AK MSA $36, $29, Grand Junction, CO MSA $29, $29, San Diego-Carlsbad-San Marcos, CA MSA $40, $29, Wilmington, NC MSA $29, $29, San Francisco-Oakland-Fremont, CA MSA $52, $29, Asheville, NC MSA $29, $29, Laredo, TX MSA $25, $29, Los Angeles-Long Beach-Santa Ana, CA MSA $43, $29, Sarasota-Bradenton-Venice, FL MSA $30, $28,
31 APP. 3: U.S. METROPOLITAN AREA WAGES (Sorted by - ) Q3 El Paso, TX MSA $27, $28, Abilene, TX MSA $26, $28, Hattiesburg, MS MSA $26, $28, Pocatello, ID MSA $25, $28, Glens Falls, NY MSA $29, $28, Monroe, LA MSA $27, $28, Williamsport, PA MSA $28, $28, Cheyenne, WY MSA $29, $28, Punta Gorda, FL MSA $25, $28, Missoula, MT MSA $28, $28, Grand Forks, ND-MN MSA $26, $28, Eugene-Springfield, OR MSA $30, $27, Goldsboro, NC MSA $26, $27, Lawrence, KS MSA $26, $27, Gainesville, FL MSA $28, $27, Sumter, SC MSA $25, $27, Las Cruces, NM MSA $26, $27, Bellingham, WA MSA $29, $27, McAllen-Edinburg-Pharr, TX MSA $23, $27, Great Falls, MT MSA $26, $27, Fresno, CA MSA $30, $26, Flagstaff, AZ MSA $28, $26, Valdosta, GA MSA $24, $26, Myrtle Beach-Conway-North Myrtle Beach, SC MSA $25, $26, Brownsville-Harlingen, TX MSA* $23, $25, Prescott, AZ MSA $26, $25, Santa Fe, NM MSA $31, $25, St. George, UT MSA $23, $25, Visalia-Porterville, CA MSA $26, $25, New York-Northern NJ-Island,NY-NJ-PA MSA* $52, $23, Honolulu, HI MSA $35, $22,
Diocese Self-Audit? Frequency
 Diocese Self-Audit? Frequency Albany, N Parishes: 3 years; Schools: Annually Alexandria, LA N N/A Allentown, PA 3 years Altoona-Johnstown, PA N N/A Amarillo, TX As needed Anchorage, AK As needed Arlington,
WILDCARD EVENT LISTINGS
 AMERICAN CHEER POWER San Antonio, TX 10/14/17 3 3 6 AMERICAN CHEER POWER Frisco, TX 10/28/17 3 3 6 SPIRIT CELEBRATION Shreveport, LA 10/28/17 3 3 6 UCA Pueblo, CO 10/28/17 3 3 6 UCA/UDA Southaven, MS 10/28/17
APPENDIX B Methodology for 2004 Annual Report
 APPENDIX B Methodology for 2004 Annual Report This appendix summarizes the methodology utilized to calculate many of the statistics shown in the Urban Mobility Report. The methodology is divided into eight
Source: HUD National LIHTC Database (for projects placed in service 1995 to 2003) and Census Data were presented in report Appendix A1.
 and Census Data were presented in report Appendix A1.") Appleton--Oshkosh--Neenah, WI MSA 96.0 Colorado Springs, CO MSA 94.9 Nassau--Suffolk, NY PMSA 89.5 Galveston--Texas City, TX PMSA 80.4 Albany--Schenectady--Troy, NY MSA 79.1 Fort Wayne, IN MSA 77.5 Allentown--Bethlehem--Easton,
Appleton--Oshkosh--Neenah, WI MSA 96.0 Colorado Springs, CO MSA 94.9 Nassau--Suffolk, NY PMSA 89.5 Galveston--Texas City, TX PMSA 80.4 Albany--Schenectady--Troy, NY MSA 79.1 Fort Wayne, IN MSA 77.5 Allentown--Bethlehem--Easton,
Scarborough Delivery Schedule Release 1, 2017 Release 1, 2018 Release 2, 2018
 Abilene, TX Mid Tier Legacy 1 Not measured 20-Jul-18 Not measured Albany-Schenectady-Troy, NY Top Tier 2 19-Oct-17 26-Apr-18 25-Oct-18 Albuquerque, NM Top Tier 2 22-Nov-17 31-May-18 29-Nov-18 Allentown,
Utility Monitoring Central Archive
 Utility Monitoring Central Archive Note that the UMC Archive files mainly cover defunct stations. Some stations may however still be active and some of the info may still be valid. FEMA - FEDERAL EMERGENCY
Sustainable Transportation Planning in the Portland Region
 Sustainable Transportation Planning in the Portland Region Jennifer Dill, Ph.D. Associate Professor School of Urban Studies & Planning jdill@pdx.edu http://web.pdx.edu/~jdill/ Outline Elements of a sustainable
COLORADO 1200 COLORADO (5H) 4.95R UPC # ISBN # TITLES IN RED ARE FIVE STAR PAPER FOLD MAPS
 4.95R UPC # ISBN # TITLES IN RED ARE FIVE STAR PAPER FOLD MAPS") TITLES IN RED ARE FIVE STAR PAPER FOLD MAPS ALABAMA 1002 ALABAMA (5H) 4.95R UPC #7-68306-11340-3 ISBN #978-1-59214-061-9 1010 HUNTSVILLE, AL (SEG-5H ) 4.95R UPC #7-68306-11346-5 ISBN #978-1-59214-088-6
TITLES IN RED ARE FIVE STAR PAPER FOLD MAPS ALABAMA 1002 ALABAMA (5H) 4.95R UPC #7-68306-11340-3 ISBN #978-1-59214-061-9 1010 HUNTSVILLE, AL (SEG-5H ) 4.95R UPC #7-68306-11346-5 ISBN #978-1-59214-088-6
THE 2004 URBAN MOBILITY REPORT
 THE 2004 URBAN MOBILITY REPORT David Schrank Associate Research Scientist and Tim Lomax Research Engineer Texas Transportation Institute The Texas A&M University System http://mobility.tamu.edu September
THE 2005 URBAN MOBILITY REPORT
 THE 2005 URBAN MOBILITY REPORT David Schrank Associate Research Scientist and Tim Lomax Research Engineer Texas Transportation Institute The Texas A&M University System http://mobility.tamu.edu May 2005
Final Report. Comparing Perceptions and Measures of Congestion. Minh Le, Shawn Turner, Tim Lomax, John Wikander, and Chris Poe
 Improving the Quality of Life by Enhancing Mobility University Transportation Center for Mobility DOT Grant No. DTRT06-G-0044 Comparing Perceptions and Measures of Congestion Final Report Minh Le, Shawn
April 2017, Volume 26 Issue 4 Q State Review
 April 2017, Volume 26 Issue 4 Q1 2017 State Review ALN OnLine For Asset/Fee Managers, Owners, Brokers, Lenders, Appraisers, Developers Independently owned, ALN began with the inception of our Locator Program
Game 1 - Tape Delayed to Wednesday 9/28/11 at 8:00 PM Game 2 - LIVE Game 3 - LIVE Albany, GA Comcast Sports Southeast Game 3 - Tape delayed TBD
 2011 CIAA FOOTBALL SYNDICATION LIST Game 1 - September 24, 2011 - Bowie State at Virginia Union 1:00pm Game 2 - October 08, 2011 - Virginia State at Fayetteville State 1:00pm Game 3 - November 12, 2011
HAMPTON ROADS REGIONAL TRANSIT BENCHMARKING STUDY
 HAMPTON ROADS REGIONAL TRANSIT BENCHMARKING STUDY Agenda Item # 13 Presented by: John V. Mihaly Transportation Analyst II Hampton Roads Transportation Planning Organization February 16, 2017 2 Outline
Connect. Brand. Everywhere!
 Connect. Brand. Everywhere! Digital Out Of Home Disney-Owned Sports Assets Live Simulcasts Special Events ABC s Times Square Footprint Featuring 4 of the most dynamic screens in Times Square, covering
Minimum Wages By State, Municipality and County
 Compliance Alert January 21 st, 2019 Minimum Wages By State, Municipality and County AL N/A N/A AK $9.89 AZ $11.00 $12.00 - January 1, 2020 Flagstaff $12.00 $13.00 - January 1, 2020 $15.00 - January 1,
Understanding the Regional Divergence in Adult Mortality in the United States
 Understanding the Regional Divergence in Adult Mortality in the United States Andrew Fenelon, PhD University of Maryland, College Park American Life Expectancy 77 76 75 Life Expectancy in Years 74 73 72
Section 1: Introduction
 Date: October 18, 2016 Regarding: Vehicle Thefts with Keys in the United States - (Public Dissemination) Prepared By: Olivia Ortiz, Strategic Analyst and Josh Cahill, Strategic Analyst Section 1: Introduction
The City and the Dynamics of Inequality. John Mollenkopf, City University of New York Robert Sampson, Harvard University Wesley G.
 The City and the Dynamics of Inequality John Mollenkopf, City University of New York Robert Sampson, Harvard University Wesley G. Skogan, IPR Introductory Comments 1 brief description of crime research
DANGEROUS BY DESIGN MARYLAND. Solving the Epidemic of Preventable Pedestrian Deaths (And Making Great Neighborhoods)
") DANGEROUS BY DESIGN 2011 MARYLAND Solving the Epidemic of Preventable Pedestrian Deaths (And Making Great Neighborhoods) DANGEROUS BY DESIGN 2011 Maryland T4AMERICA.ORG Between 2000 and 2009, 1,057 people
DANGEROUS BY DESIGN 2011 MARYLAND Solving the Epidemic of Preventable Pedestrian Deaths (And Making Great Neighborhoods) DANGEROUS BY DESIGN 2011 Maryland T4AMERICA.ORG Between 2000 and 2009, 1,057 people
SEASON FINAL REGISTRATION REPORTS
 Materials Included: 2015-2016 SEASON FINAL REGISTRATION REPORTS 2014-15 & 2015-16 Comparison by Group 2 2015-16 USA Hockey Member Counts 3 2015-16 8 and Under Report 4 2015-16 Players & Girls/Women by
February 2017, Volume 26 Issue 2. Introduction: Ohio
 February 2017, Volume 26 Issue 2 Introduction: Ohio ALN OnLine For Asset/Fee Managers, Owners, Brokers, Lenders, Appraisers, Developers Independently owned, ALN began with the inception of our Locator
WISCONSIN ATHLETICS WINTER POST-SEASON TICKET GUIDE CONFERENCE TOURNAMENT TICKETS
 WISCONSIN ATHLETICS -13 CONFERENCE TOURNAMENT TICKETS Please refer to this ticket guide for information on how you can follow the Badgers during post-season competition. For the latest post-season ticket
Where the Money Is. Ports to Plains. Consumptive or dependent industries use and consume this money. Primary or contributory industries import money.
 Where the Money Is Ports to Plains Presented by William H. Fruth POLICOM Corporation 2740 SW Martin Downs Blvd. #279 Palm City, FL 34990 772-781-5559 fruth@policom.com www.policom.com Primary or contributory
Real Estate: Investing for the Future. Sponsored By:
 Real Estate: Investing for the Future Sponsored By: Percent Change, Year Ago 6 5 4 3 2 1 Real GDP Growth United States, 2000 Prices 0 1994 1995 1996 1997 1998 1999 2000 2001 2002 2003 2004 U.S. Employment
THE SUMMIT BID EVENT LISTINGS
 American Cheer Power - Halloween Holiday Championship San Antonio, TX 10/12/19 3 USA - Santa Cruz Beach Boardwalk Santa Cruz, CA 10/12/19 3 American Cheer Power - Halloween Holiday Championship Frisco,
Overview of the Regional Economy
 Overview of the Regional Economy Jason Bram, Research Officer Presentation to the Community Depository Institutions Advisory Council (CDIAC) October 13, 2017 The views expressed here are those of the presenter
Portland Bike Share PORTLANDOREGON. GOV/TRANSPORTATION 2
 Portland Bike Share PORTLANDOREGON. GOV/TRANSPORTATION 2 Our Partners PORTLANDOREGON. GOV/TRANSPORTATION 3 600 Bikes 30 Stations Service area will cover entire central city PORTLANDOREGON. GOV/TRANSPORTATION
Keep Both Hands on the Wheel: Cities with the Bumpiest Rides and Strategies to Make our Roads Smoother
 Keep Both Hands on the Wheel: Cities with the Bumpiest Rides and Strategies to Make our Roads Smoother May 2003 The Road Information Program 1726 M Street, NW, Suite 401 Washington, DC 20036 Phone: (202)
USATF Masters Hall of Fame Class of 2013
 Masters Track & Field Actives USATF Masters Hall of Fame Class of 2013 Magdalena Kuehne: 82 Tajunga, Accomplishments: World Record: W60 triple jump 1994 American Record: W55 triple jump 1987 group Athlete
D2 SUMMIT BID EVENT LISTINGS
 American Cheer Power - Halloween Holiday Championship San Antonio, TX 10/13/18 3 USA - USA Santa Cruz Beach Boardwalk Santa Cruz, CA 10/13/18 3 American Cheer Power - Halloween Holiday Championship Frisco,
Part A: Changes in Distance between Major League Baseball Franchises and their Triple-A Affiliates
 Five Themes of Geography: Movement Major and Minor League Baseball Team Affiliations, 1998 & 2011 Ezra Zeitler University of Wisconsin-Eau Claire Department of Geography & Anthropology Purpose: This exercise
APA Local Chapter Pictorial
 APA Local Chapter Pictorial Alamo Chapter of the APA Albuquerque Chapter APA of Acadiana Atlanta Chapter Broward County Association of Payroll Professionals Buffalo-Niagara Chapter Cascade Payroll Association
D2 SUMMIT BID EVENT LISTINGS
 American Cheer Power - Halloween Holiday Championship San Antonio, TX 10/13/18 3 USA - USA Santa Cruz Beach Boardwalk Santa Cruz, CA 10/13/18 3 American Cheer Power - Halloween Holiday Championship Frisco,
HISTORIC PROPERTY LIST Monday, March 17, 2008
 HISTORIC PROPERTY LIST Monday, March 17, 2008 43 States State Prop Type Property List: State, City -- Name Fund Owned Total GLA Invest Date Sold 1 AL PA AL Huntsville Coventry 2 Retail 54,200 54,200 08/22/2006
Demographic Characteristics and Trends of Bexar County and San Antonio, TX
 Demographic Characteristics and Trends of Bexar County and San Antonio, TX Leadership San Antonio Understand Infrastructure. Prepare for Growth. May 2, 2012 San Antonio, TX Select Growing States, 2000-2010
Table B-8: U.S. Medical School MD-PhD Applications and Matriculants by School, In-State Status, and Sex,
 MD-PhD and Table B-8: U.S. Medical School MD-PhD and, In-State Status, and Sex, 2017-2018 1 AL Alabama 283 4.9 95.1 45.6 54.4 9 22.2 77.8 44.4 55.6 South Alabama 14 28.6 71.4 50.0 50.0 0 0.0 0.0 0.0 0.0
Population of Puerto Rico (Millions of people)
") Dr. Mario Marazzi-Santiago Instituto de Estadísticas Executive Director August 15, 2015 Population of Puerto Rico (Millions of people) 4.5 4 3.5 3 2.5 2 1.5 1 0.5 1950 1955 1960 1965 1970 1975 1980 1985
Dr. Mario Marazzi-Santiago Instituto de Estadísticas Executive Director August 15, 2015 Population of Puerto Rico (Millions of people) 4.5 4 3.5 3 2.5 2 1.5 1 0.5 1950 1955 1960 1965 1970 1975 1980 1985
U.S. Army Corps of Engineers Navigation Fiscal Overview
 U.S. Army Corps of Engineers Navigation Fiscal Overview National Dredging Meeting Jeffrey A. McKee Chief, Navigation Branch US Army Corps of Engineers June 24-26, 2014 US Army Corps of Engineers 1 Corps
TV CHANNEL LINEUP THE MATCH UP. NATIONWIDE - See pages 2 & 3. MONARCHS at WKU. The ODU InGame Fan app provides:» OCTOBER 22, p.m.
 THE MATCH UP MONARCHS at WKU OCTOBER 22, 2016 7p.m. ET TV CHANNEL LINEUP Broadcast Nationwide on Locally on WTVZ (MyTV) IN HAMPTON ROADS CHANNEL Cox 2 & 1002 (HD) Verizon FIOS 11 & 511 (HD) Direct TV 33
Local Chapter Pictorial
 APA Local Chapter Pictorial Local Chapter Pictorial Alamo Chapter of the APA Albuquerque Chapter APA of Acadiana Atlanta Chapter Birmingham Payroll Association Buffalo-Niagara Chapter Cascade Payroll Association
New and Renewing Bicycle Friendly Businesses Awarded in Fall 2018
 Business Name Current Award Level BFB Since Type of Business Number of Employees City State Fall 2018 Status PLATINUM Facebook Platinum 2012 Technology & Information 19,000 Menlo Park CA Renewed Stanford
Presented by: Keith Nichols, PE Principal Transportation Engineer, TTAC Agenda Item #14 October 7, 2015
 TTI URBAN MOBILITY SCORECARD 2015 Report Presented by: Keith Nichols, PE Principal Transportation Engineer, TTAC Agenda Item #14 October 7, 2015 INTRODUCTION The TTI Urban Mobility Scorecard report evaluates
More of the Same; Or now for Something Completely Different?
 More of the Same; Or now for Something Completely Different? C2ER Place cover image here Richard Wobbekind Chief Economist and Associate Dean for Business and Government Relations June 14, 2017 Real GDP
Hotel InduSTRy Overview What Lies Ahead
 Hotel InduSTRy Overview What Lies Ahead Vail R. Brown Vice President, Global Business Development & Marketing www.hotelnewsnow.com Click on Hotel Data Presentations U.S. In Review Demand Growth Strong.
The 20 th Annual Stellar Gospel Music Awards. Alabama. Arkansas. California. Connecticut. Alaska. District of Columbia. Air Dates and Time Periods
 Alabama The 20 th Annual Stellar Gospel Music Awards Air Dates and Time Periods Anniston WABM-68-UPN 1/29 3:00 PM Birmingham WABM-68-UPN 1/29 3:00 PM Decatur WYLE-26-IND 1/23 8:00 PM Florence WYLE-26-IND
2009 URBAN MOBILITY REPORT
 2009 URBAN MOBILITY REPORT David Schrank Associate Research Scientist and Tim Lomax Research Engineer Texas Transportation Institute The Texas A&M University System http://mobility.tamu.edu July 2009 DISCLAIMER
Auto Parts Retail Industry Report February 2018
 Auto Parts Retail Industry The Auto Parts retail industry is a $58B industry, which has historically experienced single digit growth year over year. Online auto part sales accounted for $8.89 billion of
Chapter Recruitment 2014, Members recruited as of 12/24/2014
 Chapter Category Chapter Code Chapter Name Chapter Members Added Receiving Incentives for Category - 01 (1 to 49) AR12 Gen William O Darby Rangers Chapter 4 4 CA36 San Francisco Chapter 3 3 FL37 St Johns
THE SUMMIT BID EVENT LISTINGS
 JAMfest Europe Liverpool, England 6/23-24/18 2 1 American Cheer Power Halloween Holiday Championship San Antonio, TX 10/13/18 3 USA Santa Cruz Beach Boardwalk Santa Cruz, CA 10/13/18 3 American Cheer Power
HAMPTON ROADS REGIONAL TRANSIT BENCHMARKING STUDY DRAFT REPORT
 HAMPTON ROADS REGIONAL TRANSIT BENCHMARKING STUDY DRAFT REPORT Agenda Item # 18 Presented by: John V. Mihaly Transportation Analyst II Hampton Roads Transportation Planning Organization January 4, 2017
5 THINGS TO KNOW IN Vail R. Brown, STR
 5 THINGS TO KNOW IN 2014 Vail R. Brown, STR VAIL R. BROWN Vice President of Global Business Development and Marketing for STR. Mrs. Brown is responsible for the overall coordination, functional management
D2 SUMMIT BID EVENT LISTINGS
 American Cheer Power - Halloween Holiday Championship San Antonio, TX 10/12/19 3 USA - Santa Cruz Beach Boardwalk Santa Cruz, CA 10/12/19 3 American Cheer Power - Halloween Holiday Championship Frisco,
Regional Economic Conditions
 Regional Economic Conditions Jason Bram, Research Officer Community Advisory Group Meeting June 27, 2017 The views expressed here are those of the presenter and do not necessarily represent those of the
SUMMARY MEMBERSHIP ANALYSIS FOR THE STATE OF. Trends of first-time 4 to 8 year-old male ice hockey players to
 SUMMARY MEMBERSHIP ANALYSIS FOR THE STATE OF Rhode Island Trends of first-time 4 to 8 year-old male ice hockey players 1997-98 to 27-8 p.2 -Background and Methodology p.3 -National Acquisition and Retention
March 2017, Volume 26 Issue 3. Introduction: Michigan, Wisconson, & Minnesota
 March 2017, Volume 26 Issue 3 Introduction: Michigan, Wisconson, & Minnesota ALN OnLine For Asset/Fee Managers, Owners, Brokers, Lenders, Appraisers, Developers Independently owned, ALN began with the
PAGE 1 OF 5 DATE OF ORDER CUSTOMER ORDER NO. TERMS SALESMAN NO. SHIP WHEN VIA MAGNETIC COLLECTION ORDER ORDER ORDER ORDER ORDER
 MINIMUM $100.00 - ASSORTED PRODUCTS PURCHASE NO. PAGE 1 OF 5 DATE OF CUSTOMER NO. TERMS SALESMAN NO. SHIP WHEN VIA 77 STYLES 1-102. 1-162. 2-207. 3-405. () WORLD'S DAD 1-103. 1-163. 2-211. 3-420. (BROWN)
THE SUMMIT BID EVENT LISTINGS
 JAMfest Europe Liverpool, England 6/23-24/18 2 1 American Cheer Power Halloween Holiday Championship San Antonio, TX 10/13/18 3 USA Santa Cruz Beach Boardwalk Santa Cruz, CA 10/13/18 3 American Cheer Power
Colorado Counties Treasurers Association
 Colorado Counties Treasurers Association Place cover image here Richard Wobbekind Executive Director, Business Research Division June 21, 2016 Real GDP Growth Quarterly and Annualized Real GDP 1990-2016
Golf Participation in the U.S Edition
 Golf Participation in the U.S. 2016 Edition Golf Participation in the U.S. 2016 Edition Published by National Golf Foundation 501 N Highway A1A Jupiter, Florida 33477 (561) 744-6006 www.ngf.org April 2016
SUMMARY MEMBERSHIP ANALYSIS FOR THE STATE OF. Trends of first-time 4 to 8 year-old male ice hockey players to
 SUMMARY MEMBERSHIP ANALYSIS FOR THE STATE OF New York Trends of first-time 4 to 8 year-old male ice hockey players 1997-98 to 27-8 p.2 -Background and Methodology p.3 -National Acquisition and Retention
SUMMARY MEMBERSHIP ANALYSIS FOR THE STATE OF. Trends of first-time 4 to 8 year-old male ice hockey players to
 SUMMARY MEMBERSHIP ANALYSIS FOR THE STATE OF New Mexico Trends of first-time 4 to 8 year-old male ice hockey players 1997-98 to 27-8 p.2 -Background and Methodology p.3 -National Acquisition and Retention
Anatomy of a Jackpot: Characteristics of Purchasers of Large Jackpot Lottery Tickets
 Anatomy of a Jackpot: Characteristics of Purchasers of Large Jackpot Lottery Tickets The 15 th International Conference on Gambling & Risk Taking May 27-31, 2013 Todd Maki & Don Feeney 1 Although not shown
Fundamental Certainty
 Fundamental Certainty.or No? a presentation at: R. Mark Woodworth PKF Hospitality Research, LLC May 7, 2013 mark.woodworth@pkfc.com Hotel Horizons Forecasting Model Smith Travel Research Historical rooms
2009 National Pharmacist Workforce Study. Visual Data
 2009 National Pharmacist Workforce Study Visual Data Figure 1.1: National Aggregate g Demand Index Values http://www.pharmacymanpower.com/ 5 4 3 4.28 4.07 Shortage Surplus 4.19 4.07 4.02 3.97 3.92 4.21
What is Going on with Complete Streets
 What is Going on with Complete Streets DFP Design Committee AD HOC Committee MWCOG Introduction to Complete Streets Multiple Presentations Blended Together Materials and Data Sources Our Next Steps Your
SUMMARY MEMBERSHIP ANALYSIS FOR THE STATE OF. New Hampshire. Trends of first-time 4 to 8 year-old male ice hockey players to
 SUMMARY MEMBERSHIP ANALYSIS FOR THE STATE OF New Hampshire Trends of first-time 4 to 8 year-old male ice hockey players 1997-98 to 27-8 p.2 -Background and Methodology p.3 -National Acquisition and Retention
Zions Bank Municipal Conference Economic Overview August 13, 2015
 Zions Bank Municipal Conference Economic Overview August 13, 2015 Overview National Economic Conditions Utah Economic Conditions Utah is One of the Fastest Growing CA 0.9% States in the Country Percent
Division I Sears Directors' Cup Final Standings
 1 Stanford (Calif.) 747.5 112.5 4 61.0 4 61.0 34 29.5 0 0.0 0 0.0 0 0.0 0 0.0 1 64.0 1 64.0 12 52.5 11 53.5 1 64.0 1084.5 2 North Carolina 631.5 0 0.0 21 43.5 10 55.0 3 61.5 0 0.0 0 0.0 0 0.0 0 0.0 41
Overview of the Regional Economy
 Overview of the Regional Economy Jason Bram, Research Officer Presentation to the Community Depository Institutions Advisory Council (CDIAC) March 5, 2019 The views expressed here are those of the presenter
Click to edit Master title style
 Click to edit Master title style Dallas July 27, 2017 7/27/2017 1 1 Click to edit Master title style 7/27/2017 2 2 Click to edit Master title style 7/27/2017 3 3 Click to edit Master title style TAP Software
How To Remove Beat Speeding Ticket Defense Fresh Data-- Traffic Ticket Lawyer High Point Nc
 Additional information >>> HERE
Zions Bank Economic Overview Meridian Chamber of Commerce. May 2, 2017
 Zions Bank Economic Overview Meridian Chamber of Commerce May 2, 2017 National Economic Conditions Dow 20,000 The Trump Bump Dow Reaches New Heights Following U.S. Presidential Election Source: Wall Street
GEOGRAPHY LESSON 1: PRE-VISIT - SAFE AT HOME LOCATION, PLACE AND BASEBALL BASEBALL COAST TO COAST HOUSTON ASTROS IN PARTNER WITH THE NBHOF
 PRE-VISIT - SAFE AT HOME LOCATION, PLACE AND BASEBALL OBJECTIVE: Students will be able to: Define location and place, two of the five themes of geography. Give reasons for the use of latitude and longitude.
Sidewalkology A Path to Solving San Antonio s Sidewalk Problem
 1 Sidewalkology A Path to Solving San Antonio s Sidewalk Problem Introduction This memorandum proposes the creation a Pedestrian Mobility Officer (PMO) position and/or an active transportation program
ATTACHMENT II FHA LOAN LIMITS BETWEEN FLOOR AND CEILING
 AK NON-METRO VALDEZ-CORDOVA 99999 0 261 271400 347450 419950 521900 AK NON-METRO NORTH SLOPE 99999 0 185 307050 393050 475150 590500 AK NON-METRO WRANGELL-PETERS 99999 0 280 307050 393050 475150 590500
Target Shooting by Hunters and Their Use of Shooting Ranges: 1975, 1991, and 2011
 U.S. Fish & Wildlife Service Target Shooting by Hunters and Their Use of Shooting Ranges: 1975, 1991, and 2011 Addendum to the 2011 National Survey of Fishing, Hunting, and Wildlife-Associated Recreation
TABLE 3: LOCAL HOUSING MARKET AREAS WITH ONE- BEDROOM RENTS ABOVE 100% OF MONTHLY SSI BENEFITS 2016
 : LOCAL HOUSING MARKET AREAS WITH ONE- BEDROOM RENTS ABOVE 100% OF MONTHLY SSI BENEFITS 2016 ALABAMA Birmingham-Hoover 103% Daphne-Fairhope-Foley 116% ALASKA Aleutians West Census Area 116% Bethel Census
The Burden of HPV Related Cancers in Kentucky
 The Burden of HPV Related Cancers in Kentucky Presented on November 15, 2017 by Katie Bathje, Kentucky Cancer Consortium Many thanks to: Thomas C. Tucker, PhD, MPH Jaclyn Nee, DrPH 1 % coverage Adolescent
Zions Bank Economic Overview
 Zions Bank Economic Overview UAFS & NAIB Convention September 14, 2017 National Economic Conditions Dow Breaks 22,000 The Trump Bump Dow Reaches New Heights Following U.S. Presidential Election Source:
Naples, Marco Island, Everglades Convention and Visitors Bureau May 2018 Visitor Profile
 RESEARCH DATA SERVICES, INC. 777 SOUTH HARBOUR ISLAND BOULEVARD SUITE 260 TAMPA, FLORIDA 33602 TEL (813) 254-2975 FAX (813) 223-2986 Naples, Marco Island, Everglades Convention and Visitors Bureau May
Take Me Out to the Ball Game. By: Sarah Gates
 Take Me Out to the Ball Game By: Sarah Gates Geographic Question: How does the location of major league sports teams correlate to population patterns of the U.S.? Overview: At the middle to high school
Traffic Safety Facts. State Traffic Data Data. Overview
 Traffic Safety Facts 2015 Data June 2017 DOT HS 812 412 State Traffic Data Key Findings Traffic fatalities increased by 7 percent from 2014 to 2015 (32,744 to 35,092) for the United States. The fatality
Making a Community Bicycle Friendly November 3 rd, 2011
 Making a Community Bicycle Friendly November 3 rd, 2011 Dorian Grilley, Executive Director Nick Mason, Program Manager Mission To provide leadership and a unified voice for bicycle education, advocacy
Produce Safety Alliance Course and Trainer Totals through September 19, 2018
 Course and Trainer Totals through 19, 218 Totals: 216 218 Train-the-Trainer Courses Domestic 58 Total TTT Courses since Sept. 216 International 12 Total 7 2,27 Total Trainer Participants 1,716 (Domestic)
Bologna Performing Arts Center - Delta State University Cleveland, MS. EACC Fine Arts Center, East Arkansas Community College Forrest City, AR
 Angelina Arts Alliance Inc Lufkin, TX Sun, Sep 24, 2017 Sun, Sep 24, 2017 2:00PM Bologna Performing Arts Center - Delta State University Cleveland, MS Wed, Sep 27, 2017 Wed, Sep 27, 2017 9:30A & 11:30A
Zions Bank Economic Overview
 Zions Bank Economic Overview Intermountain Credit Education League May 10, 2018 Dow Tops 26,000 Up 48% Since 2016 Election Jan 26, 2018 26,616 Oct 30, 2016 17,888 Source: Wall Street Journal Dow Around
Finals Brackets. Finals Brackets... 73
 Finals Brackets Finals Brackets... 73 VOLLEYBALL FINALS - FINALS BRACKETS 73 1981 Finals Bracket San Diego St. (37-6) UCLA (33-10) Pacific (27-11) Southern California (25-10) UCLA 4-15, 15-8, 15-9, 15-8
MEAN STREETS HOW FAR HAVE WE COME? A Publication of the Surface Transportation Policy Project
 MEAN STREETS 2004 HOW FAR HAVE WE COME? A Publication of the Surface Transportation Policy Project Acknowledgements Mean Streets 2004 was written by Michelle Ernst, with editorial and analytical assistance
Zions Bank Economic Overview
 Zions Bank Economic Overview WIB Education Summit September 19, 2017 National Economic Conditions Dow Breaks 22,000 The Trump Bump Dow Reaches New Heights Following U.S. Presidential Election Source: Federal
Zions Bank Economic Overview
 Zions Bank Economic Overview Kenworth National Dealers Conference November 8, 2018 1 National Economic Conditions 2 Volatility Returns to the Stock Market 27,000 Dow Jones Industrial Average October 10,
International Trade Economic Forecasts An Overview of Orange County and Southern California Exports
 International Trade Economic Forecasts An Overview of Orange County and Southern California Exports Mira Farka Adrian R. Fleissig Institute for Economic and Environmental Studies Orange County / Inland
Zions Bank Economic Overview Logan Rotary Club. March 16, 2017
 Zions Bank Economic Overview Logan Rotary Club March 16, 2017 National Economic Conditions Dow 20,000 The Trump Bump Dow Reaches New Heights Following U.S. Presidential Election Source: Wall Street Journal
Zions Bank Economic Overview Cache Valley Home Builders Association. April 12, 2017
 Zions Bank Economic Overview Cache Valley Home Builders Association April 12, 2017 National Economic Conditions Dow 20,000 The Trump Bump Dow Reaches New Heights Following U.S. Presidential Election Source:
Zions Bank Economic Overview
 Zions Bank Economic Overview National Assoc of Credit Managers Member Seminar December 12, 2017 National Economic Conditions Dow Breaks 24,000 The Trump Bump Dow Reaches New Heights Following U.S. Presidential
Kevin Thorpe Financial Economist & Principal Cassidy Turley
 Kevin Thorpe Financial Economist & Principal Cassidy Turley Economic & Commercial Real Estate Outlook Kevin Thorpe, Chief Economist 2012 Another Year Of Modest Improvement 2006Q1 2006Q3 2007Q1 2007Q3 2008Q1
UNITED 2026 BID: TRAINING SITE AGREEMENT. Park Board Committee Meeting Monday, February 19, 2018
 UNITED 2026 BID: TRAINING SITE AGREEMENT Park Board Committee Meeting Monday, February 19, 2018 Purpose Present and review Vancouver s participation in the United 2026 bid process Seek Board approval to
Chapter 2: Visual Description of Data
 Chapter 2: Visual Description of Data El Mechry El Koudous Fordham University January 24, 2018 Meshry (Fordham University) Chapter 2 January 24, 2018 1 / 35 Introduction In this chapter we will cover:
Zions Bank Economic Overview West Point Economic Summit. March 30, 2017
 Zions Bank Economic Overview West Point Economic Summit March 30, 2017 National Economic Conditions Dow 20,000 The Trump Bump Dow Reaches New Heights Following U.S. Presidential Election Source: Wall Street
INVOICE $1, Thank you for being a valued client! $0.00 $1,076.08
 INVOICE ATTN: KYLE BECKER Invoice Date: 02/03/2017 11845 NE 85TH STREET Invoice Cycle: 01/01/2017-01/31/2017 KIRKLAND, WA 98033 Due Date: : Payment due upon receipt Invoice Number: 00167863 PREVIOUS BALANCE