Highway Safety Manual Lite Woodside, DE March 20 and 21, 2012
|
|
|
- Aileen Hamilton
- 5 years ago
- Views:
Transcription
1 Highway Safety Manual Lite Woodside, DE March 20 and 21, 2012 Hillary Isebrands, PE and John McFadden, PE FHWA Resource Center Safety and Design Technical Service Team
2 Some of the Questions We Will Answer What is the HSM (and what it is not)? Why do we need an HSM? What is the content within the HSM? How do we apply the HSM? 2

3 What are the safety issues and challenges specific to local agencies? 3
4 Self Introductions Name Employer What do you do? How is safety related to your job? Knowledge of the Highway Safety Manual (HSM)? 4

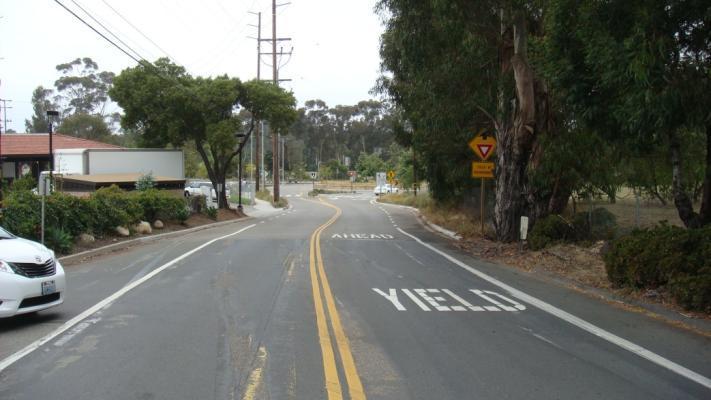
5 HSM Lite: Common Sense Safety Measures 5
6 HSM Lite The Skinny Intended to assist government agencies with a discussion about roadway safety within their jurisdictions - who may or may not have a safety program and who may or may not have a strong sense of their crash data, traffic volumes or inventory of roadway characteristics The release of the HSM, was seen as an opportunity to engage local government agencies in safety on the front end of the State DOT s HSM implementation process. And even though there is a higher potential for a lack of safety and roadway data for many local jurisdictions, the Crash Modification Factors for various roadway features (Part C) and other safety countermeasures (Part D) provide high quality take aways from the Highway Safety Manual and the Crash Modification Clearinghouse that, in many cases, can be implemented as low cost safety countermeasures HSM Lite is intended to convey this message in a straightforward manner. Common sense safety measures should be done as a healthy balance between reacting to existing safety problems/locations and proactively implementing treatments that are known to provide safer roadways and intersections. 6
7 Safety Problem (or Opportunity) Areas Fatal Crash Statistics (2009 Preliminary) United States Delaware Rhode Island Total Fatalities 33, Fatality Rate(HMVMT) Population 311,591, ,000 1,051,302 Roadway Departure 18,087 (53%) 56 (48%) 38 (46%) Intersection 7,043 (21%) 26 (22%) 16 (19%) Pedestrians 4,092(12%) 15 (13%) 16 (19%) Speeding Related 10,591 (31%) 44 (38%) 28 (34%) Alcohol Related 10,848 (32%) 45 (39%) 34 (41%) Rural Road Fatality Rate (HMVMT) Urban Road Fatality Rate (HMVMT)
8 Highway Safety Philosophy There is no such thing as absolute safety - There is safety risk in all highway facilities Agencies try to operate and improve roads to the highest level that funding limitations allow - Safety risk is also due to factors over which transportation agencies have little control - User behavior - Environmental conditions 8
9 Formidable Safety Challenges Fatal and serious injury crashes are geographically dispersed making traditional hot-spot treatment approaches less effective Finding effective systematic treatments with ever tighter fiscal constraints 9
10 Reactive vs Proactive Approach to Safety Reactive an agency reacts to a crash or history of crashes and implements a countermeasure Proactive an agency seeks out locations that may be a higher risk (i.e. rural roads, curves, intersections) for crashes implements countermeasures to prevent crashes 10


11 Safety Trade-Offs? Safety Public Opinion Costs Capacity Environment Right-of-Way What Do You Do?
12 Roadway Safety Road safety management is in transition. The transition is from action based on experience, intuition, judgment, and tradition, to action based on empirical evidence, science, and technology


13 The Highway Safety Manual 13


14 The Highway Safety Manual Provides a synthesis of validated highway safety research Facilitates explicit consideration of safety throughout the project development process Provides analytical tools for predicting the impact of decisions on road safety Provides a set of tools for Prediction of Crash Frequency and for Analysis of safety 14


15 The Highway Safety Manual is a Tool HSM is like the Highway Capacity Manual The HSM describes the mathematical relationships for safety performance based upon exposure and roadway conditions The HSM is an analysis tool only; just like the HCM HSM is not Like the MUTCD & Green Book The HSM does not establish a legal standard of care The HSM does not create a public duty The HSM does not set any requirements or mandates, or tell you what to do The HSM does not contain Warrants, Standards nor Best Practice guidance The HSM does not supersede other publications that do. 15

16 Legal Context Use is Protected Under Federal Law 23 USC Section 409: Discovery and admission as evidence of certain reports and surveys The HSM was reviewed by the AASHTO Subcommittee on Legal Affairs and the TRB Committee on Tort Liability and Risk Management 16


17 Highway Safety has Two Dimensions Nominal Safety Substantive Safety Standards Compliance Expected or Actual Crash Frequency and Severity

18 CRASH RISK Unlike Nominal Safety, Substantive Safety is a Continuum CRASH RISK Nominal Safety Substantive Safety DESIGN DIMENSION Lane Width, Radius of Curve, Stopping Sight Distance, etc. DESIGN DIMENSION Lane Width, Radius of Curve, Stopping Sight Distance, etc. Meeting standards does not necessarily make a highway safe


19 Substantive Safety may Vary when Nominal Safety Does Not Existing Conditions Alternative 1 Alternative 2 Alternative 3
20 Highway Safety Manual Organization Part A Part B Part C Part D Introduction & Fundamentals Safety Management Process Predictive Methods Crash Modification Factors
21 HSM Vol 1 (Part A) Introduction, Human Part A Part B Part C Part D Factors, and Fundamentals Introduction and Overview (Ch. 1) Human Factors (Ch. 2) Fundamentals (Ch. 3) Knowledge Building Internal staff, consultants, and FLMA partners Safety partners (law enforcement, medical) External stakeholders General public Elected officials

22 Chapter 1 Relating the HSM to the Project Development Process 22
23 Chapter 1 Relating the HSM to the Project Development Process 23
24 Chapter 2 - Human Factors Role of Human Factors in Road Safety Driving Task Model Driver Characteristics and Limitations Impacts of Road Design on the Driver 24


25 Chapter 2 - Contributing Crash Factors Judgment errors Distractions Information overload Driver expectation violations Rules of the road violations Vehicle Roadway Human 25
26 Chapter 2 - Human Factors Common to all Road Users: Information Processing Driver Limitations: Perceive 2 or more events per second Make 1 to 3 decisions per second Take 30 to 120 actions per minute Commit at least one error every 2 minutes Are Involved in a hazardous situation every 2 hours Have 1 or 2 near collisions per month Average 1 crash every 6 years 26


27 Chapter 2 - Positive Guidance Primacy Which information is the most important? Spreading Provide information in small & manageable chunks Coding Uniform traffic control devices predictable shapes and colors Redundancy Say the same thing in different ways 27


28 Clarify and Simplify Examples 28
29 Chapter 3 - Fundamentals Introduces basic concepts for understanding Roadway Safety Management Techniques Crash estimation methods 29
 Procedures Slide courtesy: Dan Turner")
30 Chapter 3 Definition of Terms Crash Frequency (not rate) KABCO (Crash severity scale) Safety Performance Functions Crash Modification Factors Standard Error Regression to the Mean Crash Frequency = Crashes/Year Empirical Bayes (EB) Procedures Slide courtesy: Dan Turner 30
31 Part A Part B Part C Part D HSM Vol 1 (Part B) Road Safety Management Process Network Screening (Ch. 4) Diagnosis and Countermeasure Selection (Ch. 5 & 6) Economic Appraisal and Prioritization (Ch. 7 & 8) Safety Effectiveness Evaluation (Ch. 9) 31

32 Chapter 4 - Network Screening Network screening is a process for reviewing a transportation network to identify and rank sites from most likely to least likely to realize a reduction in crash frequency with implementation of a countermeasure. 32

33 Chapter 5 - Diagnosis Evaluating crash data and field conditions to identify crash patterns using: Crash data Historic site data Field conditions Other information 33

34 Chapter 5 - Diagnosis How often do you look at crash data? How often do you look at crash diagrams? How often do you look at police/crash reports? 34

35 What can we Learn from a Crash Diagram? 35
36 Chapter 6 Select Countermeasures Identify contributing factors of crashes at a site Identify and select associated countermeasures to reduce crash frequency 36
37 Chapter Contributing Factors for Consideration Crashes on Roadway Segments Crashes at Signals 37

38 Chapter 7 Economic Appraisal Evaluate benefits and costs of countermeasures Identify projects that are: Cost-effective Economically justified 38
39 Chapter 7 - Economic Appraisal Process 39
 Evident (B) Disabling (A) Fatal (K) $158,200 $79,000 $216,000 $4,008,900 COMPREHENSIVE CRASH")
40 Chapter 7 - Societal Crash Cost Estimates by Crash Severity CRASH SEVERITY LEVEL PDO (O) Possible Injury (c) $7,400 $44,900 Fatal & Injury (KAB) Evident (B) Disabling (A) Fatal (K) $158,200 $79,000 $216,000 $4,008,900 COMPREHENSIVE CRASH COST 40
41 Chapter 8 - Prioritize Projects Evaluate economically justified improvements At specific sites Across multiple sites Identify a set of improvement projects to meet objectives Cost Mobility Environmental impacts 41
42 Chapter 8 - Prioritize Projects Example 42


43 Chapter 9 - Safety Effectiveness Evaluating effectiveness of a countermeasure at one or more sites Crash reduction Frequency Severity 43
44 Chapter 9 - Safety Effectiveness Evaluation Evaluating a single project at a specific site to determine the safety effectiveness of that specific project, Evaluating a group of similar projects to document the safety effectiveness of those projects, Evaluating a group of similar projects for the specific purpose of quantifying a CMF for a countermeasure, Assessing the overall safety effectiveness of specific types of projects or countermeasures in comparison to their costs. 44
45 HSM Vol 2 (Part C) Predictive Methods Part A Part B Part C Part D Part C introduces techniques for predicting crashes on two-lane rural highways, multilane rural highways, and urban and suburban arterials. This material is particularly useful for estimating expected average crash frequency of new facilities under design and of existing facilities under extensive re-design. It facilitates a proactive approach to considering safety before crashes occur. 45


46 HSM Vol 2 (Part C) Predictive Methods Part A Part B Part C Rural Two-lane Roads (Ch. 10) Rural Multi-lane Roads (Ch. 11) Urban Suburban Arterials (Ch. 12) Part D 46


47 Key Components to Applying the Predictive Methods Traffic volumes (AADT) Roadway characteristics Crash data 47
48 Divide Road Into Homogeneous Segments Segment 2 (Tangent) Length = 0.21 mi Segment 4 (Curve) Length = 0.28 mi Intersection 2 Intersection 1 Segment 1 (Curve) Length = 0.30 mi Segment 3 (Tangent + Grade) Length =.23 mi 48
49 Predicted Crash Frequency (Crash Prediction Model) N predicted = SPF x (CMF 1 x CMF 2 x.) x C where: Npredicted = crashes per year SPF = Safety Performance Function CMF = Crash Modification Factors C = Local Calibration Factor 49
50 Predictive Methods Safety Performance Functions What are Safety Performance Functions (SPF)? An equation used to estimate or predict the expected average crash frequency per year at a location as a function of traffic volume and in some cases roadway or intersection characteristics Mathematical Regression Models for Roadway Segments and Intersections: Developed from data for a number of similar sites Developed for specific site types and base conditions Function of only a few variables, primarily AADT Used to calculate the expected crash frequency (crashes/year) for a set of base geometric and traffic control conditions 1-50
51 Crashes per Year Safety Performance Function (SPF) X X X X X X X X X X X X X X X X X X X X X X X X X X X X X X X X X X X X X X SPF = Best Fit Line 1,000 2,000 3,000 4,000 5,000 Annual Average Daily Traffic 6,000 51
52 Two lane rural road - Segment SPF: N SPF rs = AADT x L x (365 x 10-6 ) x e AADT = Annual Average Daily Traffic L = Length of Segment Rural Multi-lane Road - 4 legged, minor leg stop control Intersection SPF: N SPF int = e [a + b ln(aadtmaj) + c ln(aadtmin)] Where a, b and c vary for intersection type and traffic control and are given in the HSM Slide Courtesy of Dan Turner 52
53 Predictive Methods Crash Modification Factors What is the Purpose of Crash Modification Factors (CMF)? Crash modification factor (CMF) an index of how much crash experience is expected to change following a modification in design or traffic control. CMF is the ratio between the number of crashes per unit of time expected after a modification or measure is implemented and the number of crashes per unit of time estimated if the change does not take place. Adjusts the calculated SPF predicted value for base conditions to actual or proposed conditions Accounts for the difference between base conditions and site specific conditions 53
54 Crash Modification Factors (CMFs) Crash Modification Factors are used to adjust the calculated SPF predicted value for base conditions to actual or proposed conditions CMF = 1.0: Meets base conditions or the treatment has no effect on the expected crash frequency CMF < 1.0: The treatment may reduce the expected crash frequency CMF > 1.0: The treatment may increase the expected crash frequency CMF = 1 CRF 54
55 Adjust HSM SPF-derived crash estimates to reflect local conditions Provide method to address for local variations such as: Climate, Driver populations, Animal populations, Calibration of SPFs Local Calibration Factor (C r or C i ) Crash Reporting Thresholds, and Crash Reporting System Procedures
56 Appendix A Specialized Procedures Empirical Bayes (EB) Methodology - method used to combine observed crash frequency data for a given site with predicted crash frequency data from many similar sites to estimate its expected crash frequency. Reduces effects of regression-to-the-mean (if we do not account for RTM, we cannot say the crash difference is due to the treatment) Pairs predicted crashes with observed crashes to improve the reliability of the crash frequency estimate (corrects for unusual crash trends) Both SPF and crash data must be available See HSM Part C - Appendix A
57 Observed Crash Frequency Observed Crash Frequency Natural Variability in Crash Frequency Short Term Average Short Term Crash Average Frequency Crash Expected Average Expected Crash Average Crash Frequency Short Short Term Average Average Crash Frequency Short Term Average Crash Frequency Years Years
58 Observed Crash Frequency Regression to the Mean Example Site Selected for Treatment due to Short-Term Trend RTM Reduction Expected Average Crash Frequency (Without Treatment) BEFORE AFTER Perceived Effectiveness of Treatment Actual Reduction due to Treatment
59 Chapter 10 Rural Two-Lane Road Segments and Intersections 59
60 Chapter 10 Base Conditions for Rural Two-Lane Segments Base Condition Measurement CMF Lane Width (LW) 12 ft 1.00 Shoulder Width (SW) 6 ft 1.00 Shoulder Type paved 1.00 Roadside Hazard Rating (1-7) Driveway Density (DD) 5 per mile 1.00 Horizontal Curves None 1.00 Vertical Curves None 1.00 Passing Lane None 1.00 Centerline Rumble Strips None 1.00 Grade None 1.00 TWLTL None 1.00 Lighting None 1.00 Automated Speed Enforcement None
61 Chapter 10 Base Conditions for Rural Two-Lane Road Intersections Base Condition Measurement CMF Skew Angle none 1.00 Presence of Left Turn Lane none 1.00 Presence of Right Turn Lane none 1.00 Lighting none
62 Step 1 Calculate SPF: N (Rural 2-lane) = AADT x L x (365 x 10-6 ) x e AADT = Annual Average Daily Traffic L = Length of Segment AADT range from zero to 17,800 vehicles per day AADT = 2,000 Length of Segment = 2 miles N spf rs = 2,000 x 2 x 365 x 10-6 x e = 1.07 crashes/year or ~ 1 crash every year 62

63 Applying the HSM Step 2 Identify the Roadway Characteristics and find Applicable CMF in HSM Base Condition Existing Roadway 12 ft Lane Width 10 ft 6 ft Shoulder Width 4 ft Paved Shoulder Type Gravel 63
64 CMF for Lane Width on Roadway Segments (CMF ra ) 64
65 CMF for Shoulder Width on Roadway Segments 65
66 Applying the HSM Step 3 Find/Calculate CMF s and Apply to SPF: AADT = 2,000 and Length of Segment = 2 miles Base Condition Existing Roadway 12 ft Lane Width 10 ft 6 ft Shoulder Width 2 ft Paved Shoulder Type Gravel CMF = 1.30 CMF = 1.30 CMF = 1.01 N predicted = 1.07 crashes/year x 1.17 a x 1.18 a = 1.48 crashes/year a Each of these CMF s were adjusted to reflect total crashes This is potentially a 41% increase in total crashes for the existing cross section. Over a 10 year period that is potentially 4 more crashes with one of those crashes likely being a fatal or injury crash. 66
67 Some Insights from Review of CMFs for Lane Width and Shoulders for Rural Two-Lane Roads Not much difference between 11- and 12-ft lanes Lane width is less important for very low volume roads Incremental width for shoulders is much more sensitive than for lanes Shoulder width effectiveness increases significantly as volume increases 67

68 Applying the HSM for an Intersection Project Integrating Safety into Decision Processes It would cost my agency about $50,000 to construct turn lanes at this two-lane rural road intersection how can I quantify the expected safety benefits in order to convince my leadership that this is a wise public investment? 68

69 Chapter 12 Urban and Suburban Road Segments and Intersections 69
70 Crash Frequency Prediction Models for Urban/Suburban Roadway Segments Base Models and Adjustment Factors addresses five types of Roadway Segments: (2U) Two-lane undivided arterials (3T) Three-lane arterials including a center two-way Left Turn Lane (4U) Four-lane undivided arterials (4D) Four-lane divided arterials (including a raised or depressed median) (5T) Five-lane arterials including a center TWLTL 70
71 Vehicle-Ped Crashes at Signalized Intersections Multiple Vehicle and Single Vehicle Crashes at Intersections Roadway Segments Chapter 12 Base Conditions for Urban/Suburban Roadways Base Condition Measurement CMF On Street Parking None 1.00 Roadside Fixed Objects None 1.00 Median Width 15 ft 1.00 Lighting None 1.00 Automated Speed Enforcement None 1.00 Left Turn Lanes None 1.00 Left Turn Signal Phasing Permissive 1.00 Right Turn Lanes None 1.00 Right Turn on Red Permitted 1.00 Lighting None 1.00 Red Light Cameras None 1.00 Bus Stops None 1.00 Schools None 1.00 Alcohol Sales Establishment None
72 Predicting Crash Frequency of Suburban/Urban Multilane Streets N predicted rs = (N br + N pedr + N biker ) x C r Where: N predicted rs = Predicted number of total roadway segment crashes per year N br = Predicted number of total roadway segment crashes per year with CMFs applied N pedr = Predicted number of vehicle-pedestrian collisions per year N biker = Predicted number of vehicle-bicycle collisions per year C r = calibration factor for a particular geograhical area 72
73 Predicting Crash Frequency of Suburban/Urban Where: Multilane Streets N br = N spf rs x (CMF 1r x CMF 2r x.. CMF nr ) N br = Predicted number of total roadway segment crashes per year with CMFs applied (excluding ped and bike collisions) N spf rs = Predicted number of total roadway segment crashes per year for base conditions CMF 1r CMF 2r,.. CMF nr = Crash Modification Factors for roadway segments 73
74 Predicting Crash Frequency of Suburban/Urban Multilane Streets Where: N spf rs = N brmv + N brsv + N brdwy N spf rs = Predicted number of total roadway segment crashes per year for base conditions N brmv = Predicted number of multiple-vehicle non-driveway crashes per year for base conditions N brsv = Predicted number of single-vehicle collision and nondriveway crashes per year for base conditions N brdwy = Predicted number of multiple-vehicle driveway related crashes per year 74

 Special facilities and geometric situations")
75 HSM Vol 3 (Part D) Crash Modification Factors Part A Part B Part C Part D Roadway segments (Ch. 13) Intersections (Ch. 14) Interchanges (Ch. 15) Special facilities and geometric situations (Ch. 16) 75
76 PART D - Crash Modification Factors Part A Part B Part C Part D Some Part D CMFs are included in Part C and for use with specific Safety Performance Functions (SPFs). Other Part D CMFs are not presented in Part C but can be used in the methods to estimate change in crash frequency. Part D presents information regarding the effects of various safety treatments (i.e., countermeasures). Standard error in Part D is important because more accurate and precise CMFs lead to more cost effective decisions. 76
77 CMF Standard Error Expressed as: CMF ± SE SE = standard error Used to determine low (SE), medium (2 SE) and high (3 SE) confidence interval for CMF 77
78 Standard Error The most reliable (i.e., valid) CMFs have a standard error of 0.1 or less, and are indicated with bold font. Reliability indicates that the CMF is unlikely to change substantially with new research. Less reliable CMFs have standard errors of 0.2 or 0.3 and are indicated with italic font. All quantitative standard errors presented with CMFs in Part D are less than or equal to
79 Confidence Intervals (CI) for CMFs CI (x%) = CMF ± (SE MSE) where: SE = Standard Error for the particular CMF Desired Level of Confidence Confidence Interval Multiple of Standard Error (MSE) Low 65% - 70% 1 Medium 95% 2 High 99.9% 3 79
80 CMF for Red Light Running Automated Enforcement 80

81 81
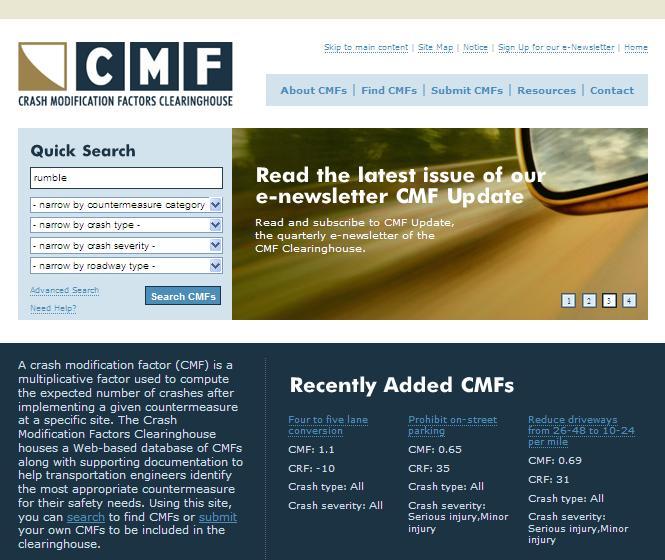
82 HSM Companion Software HSM Part Part B: Roadway Safety Management Process Part C: Predictive Methods Part D: Crash Modification Factors SafetyAnalyst Supporting Tool IHSDM FHWA CRF/CMF Clearinghouse 82
83 83

84 84
85 BREAK 85


86 Applying the HSM Low Cost Safety Improvements Crash Modification Factors 86
87 How can I use the HSM if I have limited traffic volume and/or crash data? Knowing where crashes are most likely to occur on your roadway (i.e. horizontal curves, intersections, undivided facilities) Understanding the effect of various geometric and roadway features can be used to design safer roadways (i.e. turn lanes, driveway density, shoulder width, fixed objects, etc.) Becoming familiar with countermeasures that potentially reduce crashes and their CMF s (i.e. roundabouts, lighting, rumble strips) and implementing. 87

88 2008 FHWA 9 Proven Safety Countermeasures Safety Edge Road Safety Audits (RSAs) Rumble Strips and Rumble Stripes Median Barriers Roundabouts Left-and Right-Turn Lanes Yellow Change Intervals Median and Pedestrian Refuge Areas Walkways 88

89 2012 FHWA Proven Safety Countermeasures 89

90 Low Cost Safety Enhancements for Stop- Controlled and Signalized Intersections Signing and Pavement Marking J-Turns on multi-lane facilities Lighting High Friction Surfaces Speed Reduction 90

91 Low-Cost Treatments for Horizontal Curves Enhanced signing Shoulder widening Lighting 91

92 Manuals for Local Rural Road Owners Roadway Departure Intersections Safety Analysis 92

93 Case Study 93
94 Case Study Q. Can we influence safety on this roadway without any funds to do so? A. Yes, with the HSM we can examine different lane/shoulder width combination to determine the best design with respect to safety performance? In investigating this project, is striping this section of roadway with 2 lanes of 12-feet widths more effective than striping with 2 lanes of 11-feet lane widths and 1 foot shoulders? The HSM allows us to perform such analyses. Let scenario 1 be the existing condition which involves striping the roadway with 12 feet lane widths and no shoulders and scenario 2 has 11 feet lane widths and 1 foot shoulders. Below are the CMFs for these 2 scenarios. Scenario # 1CMFs for Existing Conditions: CMFs for Scenario #2: 12 ft lane width, CMF= ft lane width, CMF = 1.03 No shoulders, CMF = ft shoulder width, CMF = 1.22 Combined CMFs = 1.00x1.29x=1.29 Combined CMFs = 1.03x1.22=1.26 Using the SPF for 2 lane rural highways for a 10 mile segment with 10,000 vpd we would estimate a base number of crashes to be crashes per year. Scenario 1 conditions yield an expected * 1.29 = crashes per year or crashes in 10 years. Scenario 2 conditions yield an expected * 1.26 = crashes per year or crashes in 10 years. A difference of = 8.1 crashes saved in 10 years. 94
95 Case Study RESULTS: The combined CMFs for scenario #1 (existing conditions) and scenario #2 (proposed conditions) are 1.29 and 1.26 respectively, which represents a 2.3% reduction in crashes. After 10 years assuming constant AADT data provided for this 10 mile section of roadway if we change the striping to reflect scenario #2 conditions, approximately 8.1 say 8 total crashes would be reduced. Of these 8 crashes (using severity split of 2/3 PDO and 1/3 F+I for segment) we would expect 5.3 of the crashes are expected to be PDO and 2.7 Fatal/Injury crashes. Assuming the average cost of a fatal/injury crash is $100,000 and the average cost of a PDO crash of $1,000, we would expect a benefit of $275,300. The cost associated with this change is the time it took to conduct this analysis. The additional construction costs for this project are $0, yielding an infinite benefit-cost ratio! 95
96 Examples Using the HSM with Limited Data Intersections Geometrics/Roadside Curves 96
97 97 Turn Lanes


98 Intersection Conflict Points

 are eliminated Large speed")
99 Roundabouts are Alternatives to Conventional Intersections Number of conflicts is reduced Severe conflicts (angle) are eliminated Large speed differentials are reduced 99
100 CMF s for Conversion of 2-Way Stop Intersection to a Roundabout 100
101 CMF s for Converting a Signalized Intersection to a Modern Roundabout 101


102 Rural Multilane Intersections Positive Offset Left Turn Lanes NCHRP 650: Before and After studies of crashes identified up to a 100% reduction in left turn crashes; one study found an increase in rear-end crashes; typical crash reduction in left turn crashes is 70%. 102


103 Positive Offset Left Turn Lanes Angled positive offset Parallel positive offset Florida DOT very wide offsets Ohio DOT 103
104 Change Plus Clearance Interval 104
 CRF 32% (Angle Crashes) CRF 50% (Red Light Running Frequency)")
105 Signal Backplates Enhance Traffic Signal Visibility Add Backplates: CRF 2% to 24% (All Crashes) CRF 32% (Angle Crashes) CRF 50% (Red Light Running Frequency) 105

 CRF 16% (Injury/Fatal")
106 Retroreflectorized Border Enhance Traffic Signal Visibility Retroreflectorized Border: CRF 24% (All Crashes) CRF 16% (Injury/Fatal Crashes) 106

107 Retroreflectorized Border Enhance Traffic Signal Visibility 107
108 Modification of Left Turn Phase at Urban Signal 108
109 Flashing Beacons Lighting 6-109
 CMF 0.")

110 Centerline Rumble Strips Milled-In around Pavement Markings Milled-In over Pavement Markings Centerline Rumble Strips on Two-Lane Rural Roads: CMF 0.85 (All Injury/Fatal Crashes) CMF 0.75 (Head-On & Sideswipe Injury/Fatal Crashes) 1. Crash Reduction Following Installation of Centerline Rumble Strips on Rural Two-Lane Roads, Persaud, et al 2. Evaluation of the Effects of Centerline Rumble Strips on Lateral Vehicle Placement and Speed, Porter, et al 110


111 Edgeline Rumble Strips Night + Rain Conditions NCHRP 500 Volume 6 Guide for Addressing Run-Off-Road Collisions 111

112 Safety Edge 112

113 Widened/Stabilized Lane or Shoulder on Inside of Curves NCHRP 500 Volume 7 Guide for Collisions on Horizontal Curves 113

114 Lighting 114

115 Safety Effects of Installing Combination Horizontal Alignment Warning + Advisory Speed Signs 115


116 Chevrons CMF = 0.65 *CMF Clearinghouse 116
 Pay particular attention to roadside design adjacent to curves Avoid long, sharp curves Adjust alignment design to reflect expected speeds on")
117 Overview of Good Alignment Design Practice (suggested by safety research) Curves and grades are necessary features of alignment design (reflect the topography, terrain, and context ) Pay particular attention to roadside design adjacent to curves Avoid long, sharp curves Adjust alignment design to reflect expected speeds on curves 117

118 Overview of Good Alignment Design Practice (cont d) Minimize grades within terrain context Widen lanes and shoulders through curves Pay attention to access points related to horizontal and vertical curve locations 118
119 LOCAL CASE STUDY DE Route DE Route
120 DE Route DE Route 82 Intersection Data Posted Speed Limit 50mph High Profile Location 15,000 ADT Protected-permissive left-turn phasing (lead/lag operation) on the NB and SB 52 approaches and split phasing on the EB SR 82 and WB Kirk Road approaches. 120
121 accidents o 17 southbound rear end o 7 northbound rear end o 3 northbound/eastbound angle SR 52/SR 82 - Crash Data crashes o 22 southbound rear end crashes (6 crashes resulted in injuries; 2 crashes involved a left-turning vehicle) o 3 southbound left-turn crashes o 2 northbound sideswipe crashes o 2 eastbound right-turn rear end crashes o 1 southbound/westbound angle crash (resulted in two fatalities) o 1 southbound/eastbound angle crash o 1 westbound left-turn crash o 1 northbound rear end crash o 1 northbound left-turn crash o 1 northbound/eastbound angle crash o 1 northbound/westbound angle crash o 1 northbound motorists struck a fixed object just north of the intersection o 1 eastbound rear end crash o 1 eastbound vehicle struck a deer 121

122 Intersection Countermeasures o Exclusive Left Turn Lane o Protected Left Turn Phase o Lighting (CMF 0.89) o Roundabout 122


123 123 Countermeasure Crash Modification Factors 123
124 Countermeasure Crash Modification Factors 124

125 HSM Lite Summary 125
126 Achieving Safety is a Balance of Many Factors We routinely balance safety in many decisions we make Tradeoffs we routinely make: Economics versus safety Stakeholder preferences Environmental impacts Capacity or speed versus safety Ease of maintenance versus safety 126
127 Safety Design Key Concepts Achieving appropriate balance requires information, evaluation, risk assessment, and a decision process The level of evaluations should reflect the scope of the project, the extent of safety problems, and the potential opportunities to reduce crashes and their severity Nominal safety and substantive safety have different, but related, goals 127
128 Look for Opportunities Look for opportunities to decrease number and severity of crashes Use available data Cause of crashes on crash reports? Roadway and environment? Driver error? Vehicle? Look for opportunities to reduce driver errors Consider the proven safety countermeasures 128
129 Local Delaware Contacts Earl "Rusty" Lee, Ph.D. T2 Coordinator Delaware Center for Transportation Assistant Professor Department of Civil and Environmental Engineering University of Delaware 355 A Dupont Hall, Newark, DE Telephone: (302) elee@udel.edu Adam Weiser DelDOT Adam.Weiser@state.de.us Patrick Kennedy, P.E. Traffic Operations & Safety Engineer FHWA - DelMar Division Delaware Office (302) Patrick.Kennedy@dot.gov 129

130 HSM Contacts Highway Safety Manual Website AASHTO Kelly Hardy: AASHTO Safety Mgmt Subcommittee, Task Group Don Vaughn, ALDOT, Priscilla Tobias, IDOT, FHWA Mike Griffith, Ray Krammes, Gene Amparano, Hillary Isebrands, TRB Highway Safety Performance Committee John Milton, WSDOT, 130
131 Resources & Contacts AASHTO HSM Information FHWA HSM Information SafetyAnalyst Information IHSDM Information CMF Clearinghouse Information Future HSM Development and Feedback Kelly Hardy, AASHTO Esther Strawder, FHWA Vicki Schofield, AASHTO Clayton Chen, FHWA Karen Yunk, FHWA Rick Pain, TRB
132 Questions and Discussion 132
133 Highway Safety THE END Hillary Isebrands, PE FHWA Resource Center Safety and Design TST
HSM Practitioners Guide to Urban and Suburban Streets. Prediction of Crash Frequency for Suburban/Urban Streets
 HSM Practitioners Guide to Urban and Suburban Streets Prediction of Crash Frequency for Suburban/Urban Streets Predicting Crash Frequency of Suburban/Urban Multilane Streets Learning Outcomes: Describe
IHSDM- HSM Predictive Methods. Slide 1
 IHSDM- HSM Predictive Methods Slide 1 Presentation Outline IHSDM Overview Relationship between HSM and IHSDM Crash Prediction Models and Data Needs IHSDM HSM Predictive Method 2011 Release Preview Questions
Chapter 5 DATA COLLECTION FOR TRANSPORTATION SAFETY STUDIES
 Chapter 5 DATA COLLECTION FOR TRANSPORTATION SAFETY STUDIES 5.1 PURPOSE (1) The purpose of the Traffic Safety Studies chapter is to provide guidance on the data collection requirements for conducting a
Performance-Based Approaches for Geometric Design of Roads. Douglas W. Harwood MRIGlobal 3 November 2014
 Performance-Based Approaches for Geometric Design of Roads Douglas W. Harwood MRIGlobal 3 November 2014 Traditional Approaches to Highway Geometric Design Based on established geometric design criteria
Acknowledgements. Mr. David Nicol 3/23/2012. Daniel Camacho, P.E. Highway Engineer Federal Highway Administration Puerto Rico Division
 Daniel Camacho, P.E. Highway Engineer Federal Highway Administration Puerto Rico Division Acknowledgements Mr. David Nicol Director, FHWA Office of Safety FHWA Office of Safety http://safety.fhwa.dot.gov/provencountermeasures/
Recently Developed Intersection CMFs. Nancy Lefler, VHB ATSIP Traffic Records Forum, 2014
 Recently Developed Intersection CMFs Nancy Lefler, VHB ATSIP Traffic Records Forum, 2014 Overview General Methodology Treatments Installation of traffic signals - with and without left-turn lanes (NCDOT)
CE576: Highway Design and Traffic Safety
 CE576: Highway Design and Traffic Safety Predicting Crash Frequency for Two-Lane Rural Highway Segments Cross Sectional Elements Ahmed Abdel-Rahim, Ph.D., P.E. Civil Engineering Department University of
Effects of Traffic Signal Retiming on Safety. Peter J. Yauch, P.E., PTOE Program Manager, TSM&O Albeck Gerken, Inc.
 Effects of Traffic Signal Retiming on Safety Peter J. Yauch, P.E., PTOE Program Manager, TSM&O Albeck Gerken, Inc. Introduction It has long been recognized that traffic signal timing can have an impact
HIGHWAY SAFETY MANUAL USER GUIDE
 HIGHWAY SAFETY MANUAL USER GUIDE National Cooperative Highway Research Program 17-50 Lead States Initiative for Implementing the Highway Safety Manual Highway Safety Manual User Guide National Cooperative
Engineering Countermeasures for Transportation Safety. Adam Larsen Safety Engineer Federal Highway Administration
 Engineering Countermeasures for Transportation Safety Adam Larsen Safety Engineer Federal Highway Administration 360-619-7751 Adam.Larsen@DOT.GOV Countermeasure Selection Resources Manual for Selecting
Designing for Pedestrians: An Engineering Symposium. Rutgers University March 21, 2013
 Designing for Pedestrians: An Engineering Symposium Rutgers University March 21, 2013 The Problem 2 Pedestrian Fatalities Pedestrian Fatalities by Year in US (1994-2010) 6000 5000 4000 3000 2000 1000 0
HSM Tables, Case Studies, and Sample Problems Table of Contents
 HSM Tables, Case Studies, and Sample Problems Table of Contents Chapter 10 Tables: HSM Default Tables Local Values (Michigan)... 1 Chapter 11 Tables: HSM Default Tables Local Values (Michigan)... 5 Chapter
Proven Safety Countermeasures. FHWA Office of Safety January 12, :00 p.m. to 2:00 p.m. Eastern Time
 Proven Safety Countermeasures FHWA Office of Safety January 12, 2012 1:00 p.m. to 2:00 p.m. Eastern Time Introduction and Background While States should still be considering the application of all of the
What Engineering Can Do for You! Low Cost Countermeasures for Transportation Safety
 What Engineering Can Do for You! Low Cost Countermeasures for Transportation Safety Adam Larsen Safety Engineer Federal Highway Administration 360-619-7751 Adam.Larsen@DOT.GOV Adam Larsen TTP Safety Engineer
NCHRP Improved Prediction Models for Crash Types and Crash Severities. Raghavan Srinivasan UNC Highway Safety Research Center
 1 NCHRP 17-62 Improved Prediction Models for Crash Types and Crash Severities Raghavan Srinivasan UNC Highway Safety Research Center 2 The Project Team University of Connecticut Persaud & Lyon, Inc. University
Access Management in the Vicinity of Intersections
 Access Management in the Vicinity of Intersections FHWA-SA-10-002 Technical Summary Photo: Ralph Bentley (used with permission) 0 Access Management is: The design, implementation and management of entry
Safety Effectiveness of Pedestrian Crossing Treatments
 Portland State University PDXScholar TREC Friday Seminar Series Transportation Research and Education Center (TREC) 10-13-2017 Safety Effectiveness of Pedestrian Crossing Treatments Christopher Monsere
Benefits of Center Line Rumble Strips on Rural 2-Lane Highways in Louisiana
 Benefits of Center Line Rumble Strips on Rural 2-Lane Highways in Louisiana Xiaoduan Sun, Ph.D., P.E. University of Louisiana at Lafayette 2018 Louisiana Transportation Conference Baton Rouge, February
HR 20-7(332) User s Guide to Develop Highway Safety Manual Safety Performance Function Calibration Factors
 User s Guide to Develop Highway Safety Manual Safety Performance Function Calibration Factors") National Cooperative Highway Research Program (NCHRP) HR 20-7(332) User s Guide to Develop Highway Safety Manual Safety Performance Function Calibration Factors Requested by: American Association of State
National Cooperative Highway Research Program (NCHRP) HR 20-7(332) User s Guide to Develop Highway Safety Manual Safety Performance Function Calibration Factors Requested by: American Association of State
THE FUTURE OF THE TxDOT ROADWAY DESIGN MANUAL
 THE FUTURE OF THE TXDOT ROADWAY DESIGN MANUAL Kenneth Mora, P.E. (Design Division) 10/10/2017 Table of contents 1 2 Reduction in FHWA design controlling criteria Innovative Intersection Guidance 3-7 8-42
Toolbox of Countermeasures and Their Potential Effectiveness to Make Intersections Safer
 8 Toolbox of Countermeasures and Their to Make Intersections Safer Introduction Studies included in the NCHRP 17-18 (3), Guidance for Implementation of the AASHTO Strategic Highway Safety Plan, as well
Safety Impacts: Presentation Overview
 Safety Impacts: Presentation Overview The #1 Theme How Access Management Improves Safety Conflict Points The Science of Access Management By Treatment Studies Themes for Texas Access Management Improve
HSM PREDICTIVE METHODS IN PRELIMINARY ENGINEERING
 HSM PREDICTIVE METHODS IN PRELIMINARY ENGINEERING 2017 ILLINOIS THE CONFERENCE Filiberto Sotelo & Steven Schilke, P.E. OUTLINE Safety & Transportation Management Process What is HSM? Illinois HSM Predictive
FHWA Safety Performance for Intersection Control Evaluation (SPICE) Tool
 Tool") FHWA Safety Performance for Intersection Control Evaluation (SPICE) Tool Virginia Section ITE Annual Meeting Virginia Beach June 217 Pete Jenior Kittelson & Associates, Inc. 1 Intersection Control Evaluation
FHWA Safety Performance for Intersection Control Evaluation (SPICE) Tool Virginia Section ITE Annual Meeting Virginia Beach June 217 Pete Jenior Kittelson & Associates, Inc. 1 Intersection Control Evaluation
Recent U.S. Research on Safety Evaluation of Low-Cost Road Engineering Safety Countermeasures Lessons for Canada
 Recent U.S. Research on Safety Evaluation of Low-Cost Road Engineering Safety Countermeasures Lessons for Canada Bhagwant Persaud Department of Civil Engineering, Ryerson University 350 Victoria Street,
Integrating Safety into the Transportation Decision Making Process
 Wednesday, February 17th, 2016 Integrating Safety into the Transportation Decision Making Process Priscilla Tobias, PE State Safety Engineer Illinois Department of Transportation Increased Focus of Safety
Access Location, Spacing, Turn Lanes, and Medians
 Design Manual Chapter 5 - Roadway Design 5L - Access Management 5L-3 Access Location, Spacing, Turn Lanes, and Medians This section addresses access location, spacing, turn lane and median needs, including
RURAL HIGHWAY SHOULDERS THAT ACCOMMODATE BICYCLE AND PEDESTRIAN USE (TxDOT Project ) June 7, Presented by: Karen Dixon, Ph.D., P.E.
 June 7, Presented by: Karen Dixon, Ph.D., P.E.") RURAL HIGHWAY SHOULDERS THAT ACCOMMODATE BICYCLE AND PEDESTRIAN USE (TxDOT Project 0-6840) June 7, 2016 Presented by: Karen Dixon, Ph.D., P.E., TTI Team: Kay Fitzpatrick, Raul Avelar, & Subasish Das Project
RURAL HIGHWAY SHOULDERS THAT ACCOMMODATE BICYCLE AND PEDESTRIAN USE (TxDOT Project 0-6840) June 7, 2016 Presented by: Karen Dixon, Ph.D., P.E., TTI Team: Kay Fitzpatrick, Raul Avelar, & Subasish Das Project
Highway Safety Manual (HSM) Focused Training Course
 Focused Training Course") Highway Safety Manual (HSM) Focused Training Course HSM Focused Training Agenda I. Introductions (15 min) 9:00 to 9:15 II. Intro and Fundamentals of AASHTO HSM (60 min) 9:15 to 10:15 Break 10:15 to 10:30
Highway Safety Manual (HSM) Focused Training Course HSM Focused Training Agenda I. Introductions (15 min) 9:00 to 9:15 II. Intro and Fundamentals of AASHTO HSM (60 min) 9:15 to 10:15 Break 10:15 to 10:30
Phase I-II of the Minnesota Highway Safety Manual Calibration. 1. Scope of Calibration
 TECHNICAL MEMORANDUM Phase I-II of the Minnesota Highway Safety Manual Calibration PREPARED FOR: PREPARED BY: Minnesota Department of Transportation Richard Storm, CH2M HILL Veronica Richfield, CH2M HILL
Road Safety Assessments. Lt. Bob McCurdy Williamson County Sheriff s s Office Marion, IL.
 Road Safety Assessments Lt. Bob McCurdy Williamson County Sheriff s s Office Marion, IL. Why Are We Here? 2005 US Traffic Fatalities = 43,443 1429 4329 1361 1616 1534 3504 1729 3543 Illinois Annual Fatallities
Appendix A: Safety Assessment
 Appendix A: Safety Assessment Safety Assessment Appendix A A Statement of Philosophy The efficient and responsible investment of resources in addressing safety problems is a difficult task. Since crashes
Crash Data Analysis for Converting 4-lane Roadway to 5-lane Roadway in Urban Areas
 Crash Data Analysis for Converting 4-lane Roadway to 5-lane Roadway in Urban Areas Xiaoduan Sun, University of Louisiana at Lafayette Nicholas P. Fruge, LADOTD District 3 Subasish Das, University of Louisiana
Multimodal Analysis in the 2010 Highway Capacity Manual
 Multimodal Analysis in the 2010 Highway Capacity Manual It s not just cars anymore! Jamie Parks, AICP HCAT Conference May 9-10, 2011 Multimodal LOS in the 2010 HCM History and background Overview of methods
Collision Estimation and Cost Calculation
 Collision Estimation and Cost Calculation Table of Contents Introduction... 3 Rates Based Method... 4 20-Year Collision Cost Procedure... 4 Safety Performance Function Method... 7 Important notes when
Lessons Learned from the Minnesota County Road Safety Plans. Richard Storm CH2M HILL
 Lessons Learned from the Minnesota County Road Safety Plans Richard Storm CH2M HILL May 21, 2014 Overview of the MN CRSP: Why Prepare Safety Plans for Local Systems? MAP-21: Requires states to address
Safety and Operational Effects of Geometric Design Features for Multilane Highways Workshop
 Safety and Operational Effects of Geometric Design Features for Multilane Highways Workshop Safety and Operational Effects of Highway Design Features for Multilane Highways REGISTRATION (7:45am 8:00 a.m.)
4/27/2016. Introduction
 EVALUATING THE SAFETY EFFECTS OF INTERSECTION SAFETY DEVICES AND MOBILE PHOTO ENFORCEMENT AT THE CITY OF EDMONTON Karim El Basyouny PhD., Laura Contini M.Sc. & Ran Li, M.Sc. City of Edmonton Office of
Geometric Design, Speed, and Safety
 Portland State University PDXScholar TREC Friday Seminar Series Transportation Research and Education Center (TREC) 4-10-2015 Geometric Design, Speed, and Safety Richard J. Porter University of Utah Let
Guidelines for Integrating Safety and Cost-Effectiveness into Resurfacing, Restoration, and Rehabilitation Projects
 Guidelines for Integrating Safety and Cost-Effectiveness into Resurfacing, Restoration, and Rehabilitation Projects NCHRP Project 15-50 July 2017 1 Research Objective Develop guidelines for safe and cost-effective
Application of the Highway Safety Manual to Predict Crash Frequency
 Application of the Highway Safety Manual to Predict Crash Frequency Application of the Highway Safety Manual to Predict Crash Frequency Elizabeth Wemple, Nick Foster, and Casey Bergh 610 SW Alder St, Ste
Strategies for Making Multimodal Environments Safer. Kim Kolody Silverman, CH2M
 Strategies for Making Multimodal Environments Safer Kim Kolody Silverman, CH2M Kim.kolody@ch2m.com 800 Fatalities in Illinois: Rural versus Urban Fatalities 700 600 500 400 300 200 100 0 2004 2005 2006
Safety in the Geometric Design of Highways
 Safety in the Geometric Design of Highways Corresponding Author: Richard Coakley CH2M HILL 135 South 84 th Street Suite 400 Milwaukee WI. 53214 414 847 0423 Richard.coakley@ch2m.com Abstract This project
Multimodal Level of Service (MMLOS) and the Highway Safety Manual (HSM)
 and the Highway Safety Manual (HSM)") Multimodal Level of Service (MMLOS) and the Highway Safety Manual (HSM) Transportation Education Series July 17, 2012 City of San Luis Obispo Council Chambers Transportation Education Series Presenters
Multimodal Level of Service (MMLOS) and the Highway Safety Manual (HSM) Transportation Education Series July 17, 2012 City of San Luis Obispo Council Chambers Transportation Education Series Presenters
Rational road safety management Practice and Theory. Bhagwant Persaud Ryerson University Toronto, Canada
 Rational road safety management Practice and Theory Bhagwant Persaud Ryerson University Toronto, Canada Overview Road infrastructure safety management process Evolution of road infrastructure safety management
2014 FHWA Aging Road User Handbook. Recommendations to Accommodate Aging Pedestrians. Lifesaver National Conference. What is the Handbook?
 2014 FHWA Aging Road User Handbook Recommendations to Accommodate Aging Pedestrians Lifesaver National Conference March 17, 2015 Revised June 2014 1 What is the Handbook? 1998 1st Edition 2001 2nd Edition
Truck Climbing Lane Traffic Justification Report
 ROUTE 7 (HARRY BYRD HIGHWAY) WESTBOUND FROM WEST MARKET STREET TO ROUTE 9 (CHARLES TOWN PIKE) Truck Climbing Lane Traffic Justification Report Project No. 6007-053-133, P 101 Ι UPC No. 58599 Prepared by:
Safety and Design Alternatives for Two-Way Stop-Controlled Expressway Intersections
 Safety and Design Alternatives for Two-Way Stop-Controlled Expressway Intersections Thomas H. Maze Center for Transportation Research and Education Iowa State University 2901 South Loop Drive, Suite 3100
Making Great Urban Streets Confessions of a Highway Engineer. Timothy R. Neuman.. P.E. Chief Highway Engineer CH2M HILL
 Making Great Urban Streets Confessions of a Highway Engineer Timothy R. Neuman.. P.E. Chief Highway Engineer CH2M HILL Isn t this a Great Street? Characteristics of a Great Street It is a transportation
Pavement Markings (1 of 3)
") Pavement Markings (1 of 3) DESCRIPTION AND DEFINITION Disadvantages Relatively high cost (over typical Crash reduction as yet unknown painted edge line) No tactile effect The STOP AHEAD pavement marking
Pavement Markings (1 of 3) DESCRIPTION AND DEFINITION Disadvantages Relatively high cost (over typical Crash reduction as yet unknown painted edge line) No tactile effect The STOP AHEAD pavement marking
Introduction 4/28/ th International Conference on Urban Traffic Safety April 25-28, 2016 EDMONTON, ALBERTA, CANADA
 4/28/2016 EVALUATING THE SAFETY EFFECTS OF INTERSECTION SAFETY DEVICES AND MOBILE PHOTO ENFORCEMENT AT THE CITY OF EDMONTON Karim El Basyouny PhD., Laura Contini M.Sc. & Ran Li, M.Sc. City of Edmonton
Roadway Safety Design
 Roadway Safety Design An Engineer s Guide to Evaluating the Safety of Design Alternatives Course Notes Product 5-4703-01-P3 SAFETY BY DESIGN Multilane Highways and Freeways Workshop July 2009 Published:
A Traffic Operations Method for Assessing Automobile and Bicycle Shared Roadways
 A Traffic Operations Method for Assessing Automobile and Bicycle Shared Roadways A Thesis Proposal By James A. Robertson Submitted to the Office of Graduate Studies Texas A&M University in partial fulfillment
Relationship of Road Lane Width to Safety for Urban and Suburban Arterials
 Relationship of Road Lane Width to Safety for Urban and Suburban Arterials Phd. Alma AFEZOLLI Polytechnic University of Tirana Construction and Infrastructure Department of Civil Engineering Faculty Tirana,
1.3.4 CHARACTERISTICS OF CLASSIFICATIONS
 Geometric Design Guide for Canadian Roads 1.3.4 CHARACTERISTICS OF CLASSIFICATIONS The principal characteristics of each of the six groups of road classifications are described by the following figure
Desktop Reference for Crash Reduction Factors
 Page 68 Desktop Reference for Crash Reduction Factors Report No. FHWA-SA-07-015 U.S. Department of Transportation Federal Highway Administration September 2007 Page 69 THIS PAGE LEFT INTENTIONALLY BLANK
Emerging Methods for Evaluating Transportation Systems Multimodal LOS and Highway Safety Manual
 Emerging Methods for Evaluating Transportation Systems Multimodal LOS and Highway Safety Manual November 8, 2012 Lake Merritt Tower in Oakland Transportation Education Series 1 Presenters Mark Bowman,
PEDESTRIAN SAFETY IMPROVEMENT EVALUATION GUIDELINE FOR UNCONTROLLED CROSSINGS
 PEDESTRIAN SAFETY IMPROVEMENT EVALUATION GUIDELINE FOR UNCONTROLLED CROSSINGS Traffic Safety Engineering Division Updated: April 2018 EXECUTIVE SUMMARY NDOT Traffic Safety Engineering Division developed
Roundabout Feasibility Memorandum
 Roundabout Feasibility Memorandum To From Gwen Pipkin Bill Howell Date June 18, 2013 Subject Roundabout Feasibility Study SR 29 PD&E Study From Oil Well Road to SR 82 Collier County, FL FPID 417540-1-22-01
Highway Safety Improvement
 Highway Safety Improvement Tracy Turpin, PE. Highway Safety Improvement Program Manager Virginia Department of Transportation Presented at Chesapeake and Virginia Chapters of ATSSA Meeting October 13 th,2016
Driveway Design Criteria
 Design Manual Chapter 5 - Roadway Design 5L - Access Management 5L-4 Driveway Design Criteria A. General For efficient and safe operations, access drives and minor public street intersections can be improved
METHODOLOGY. Signalized Intersection Average Control Delay (sec/veh)
") Chapter 5 Traffic Analysis 5.1 SUMMARY US /West 6 th Street assumes a unique role in the Lawrence Douglas County transportation system. This principal arterial street currently conveys commuter traffic
Chapter 5 Traffic Analysis 5.1 SUMMARY US /West 6 th Street assumes a unique role in the Lawrence Douglas County transportation system. This principal arterial street currently conveys commuter traffic
CHAPTER 1 STANDARD PRACTICES
 CHAPTER 1 STANDARD PRACTICES OBJECTIVES 1) Functions and Limitations 2) Standardization of Application 3) Materials 4) Colors 5) Widths and Patterns of Longitudinal Pavement Marking Lines 6) General Principles
Synthesis of Safety For Traffic Operations. Leanna Belluz Transport Canada. Gerry Forbes, M.Eng., P.Eng., P.T.O.E. Intus Road Safety Engineering Inc.
 Synthesis of Safety For Traffic Operations Leanna Belluz Transport Canada Gerry Forbes, M.Eng., P.Eng., P.T.O.E. Intus Road Safety Engineering Inc. Paper prepared for presentation at the Traffic Operations
INDEX. Geometric Design Guide for Canadian Roads INDEX
 Acceleration lane, see Lanes, Acceleration Access, 8.1 Access Management and Functional Classification 8.2 Access Management by Design Classification 8.3 Access Configuration 8.4 Building Set-Back Guidelines
WYDOT DESIGN GUIDES. Guide for. Non-NHS State Highways
 WYDOT DESIGN GUIDES Guide for Non-NHS State Highways 2014 GUIDE FOR Non-NATIONAL HIGHWAY SYSTEM (Non-NHS) STATE HIGHWAYS PRESERVATION REHABILITATION RECONSTRUCTION INTRODUCTION This Guide is directed to
Geometric Design Strategic Research Program
 Geometric Design Strategic Research Program J OINT M EETING OF TRB COMMITTEES ON G EOMETRIC D ESIGN AND O PERATIONAL E FFECTS OF G EOMETRICS and AASHTO TECHNICAL C OMMITTEE ON G EOMETRIC D ESIGN I RVINE,
Enhancing NDOT s Traffic Safety Programs
 NDOT Research Report Report No. 339-12-803 Enhancing NDOT s Traffic Safety Programs October 2013 Nevada Department of Transportation 1263 South Stewart Street Carson City, NV 89712 Disclaimer This work
Texas Intersection Safety Implementation Plan Workshop JUNE 2, 2016
 Texas Intersection Safety Implementation Plan Workshop JUNE 2, 2016 Why Intersection Safety? A small part of overall highway system, but Each year roughly 50% of all crashes estimated 3 million involve
Safety at Unsignalized Intersections. Unsignalized Intersections
 Safety at FHWA Safety Focus Areas 2 National Statistics 3 National Statistics There were 41,059 highway fatalities in 2007. Where did they occur? Non-Intersections 79% About half of all crashes and half
Appendix A: Crosswalk Policy
 Appendix A: Crosswalk Policy Appendix A: Crosswalk Policy Introduction This citywide Crosswalk Policy is aimed at improving pedestrian safety and enhancing pedestrian mobility by providing a framework
Closing Plenary Session
 TRAFFIC SAFETY CONFERENCE Closing Plenary Session June 9, 2017 Las Colinas, TX Order of Report Out June 9, 2017 Las Colinas, TX Distracted Driving Prioritized Countermeasures Countermeasure 4a Systemically
POWELL BUTTE HIGHWAY/NEFF ROAD INTERSECTION Interim Report: Existing Conditions, Needs, and Alternatives Review
 POWELL BUTTE HIGHWAY/NEFF ROAD INTERSECTION Interim Report: Existing Conditions, Needs, and Alternatives Review Date: December 30, 2013 Project #: 13963.0 To: Chris Doty PE and George Kolb, Deschutes County
Defining Purpose and Need
 Advanced Design Flexibility Pilot Workshop Session 4 Jack Broz, PE, HR Green May 5-6, 2010 Defining Purpose and Need In your agency s project development process, when do design engineers typically get
Title. Authors. Safety Benefits of Highway Infrastructure Investments (May 2017)
") Title Safety Benefits of Highway Infrastructure Investments (May 2017) Authors Douglas W. Harwood 1, Jessica M. Hutton 1, Zachary N. Hans 2, Reginald R. Souleyrette 3, Michael A. Fields 3 1MRIGlobal 2Iowa
Title Safety Benefits of Highway Infrastructure Investments (May 2017) Authors Douglas W. Harwood 1, Jessica M. Hutton 1, Zachary N. Hans 2, Reginald R. Souleyrette 3, Michael A. Fields 3 1MRIGlobal 2Iowa
Florida s Intersection Safety Implementation Plan (ISIP)
") Florida Department of TRANSPORTATION Florida s Intersection Safety Implementation Plan (ISIP) Alan El-Urfali, PE State Traffic Engineering and Operations Office March 28, 2017 Intersection Safety Implementation
Florida Department of TRANSPORTATION Florida s Intersection Safety Implementation Plan (ISIP) Alan El-Urfali, PE State Traffic Engineering and Operations Office March 28, 2017 Intersection Safety Implementation
Evaluation of M-99 (Broad Street) Road Diet and Intersection Operational Investigation
 Road Diet and Intersection Operational Investigation") Evaluation of M-99 (Broad Street) Road Diet and Intersection Operational Investigation City of Hillsdale, Hillsdale County, Michigan June 16, 2016 Final Report Prepared for City of Hillsdale 97 North Broad
Evaluation of M-99 (Broad Street) Road Diet and Intersection Operational Investigation City of Hillsdale, Hillsdale County, Michigan June 16, 2016 Final Report Prepared for City of Hillsdale 97 North Broad
Primer on the Joint Use of the HSM and HFG for Road Systems Using Human Factors to Guide Data-Driven Decision-Making
 Est. Dec. 2014 Primer on the Joint Use of the HSM and HFG for Road Systems Using Human Factors to Guide Data-Driven Decision-Making Presented by: Contributors: John Campbell, Battelle John Milton, Washington
TODAY S WEBINAR AGENDA
 TODAY S WEBINAR AGENDA 3:00 pm: Introduction 3:05 pm: Presentation 3:45 pm: Questions 4:00 pm: Webinar Ends For technical assistance during the webinar: 1-800-263-6317 Choose these prompts: 1, 1, 1 CONTINUING
Multimodal Design Guidance. October 23, 2018 ITE Fall Meeting
 Multimodal Design Guidance October 23, 2018 ITE Fall Meeting Introductions Jessica Wilson TDOT Multimodal Division Office of Multimodal Planning Program Supervisor Jessica.L.Wilson@tn.gov Ali Hangul TDOT
Safety Assessment of Installing Traffic Signals at High-Speed Expressway Intersections
 Safety Assessment of Installing Traffic Signals at High-Speed Expressway Intersections Todd Knox Center for Transportation Research and Education Iowa State University 2901 South Loop Drive, Suite 3100
Introduction to Highway Safety Course
 Introduction to Highway Safety Course Introduction to Crash Analysis Prepared by Robert K. Seyfried, PE, PTOE Northwestern University Center for Public Safety Introduction to Highway Safety Series Course
Safety Performance of Two-Way Stop-Controlled Expressway Intersections
 Safety Performance of Two-Way Stop-Controlled Expressway Intersections UNDERSTANDING THE SAFETY PERFORMANCE OF TWO-WAY STOP- CONTROLLED RURAL EXPRESSWAY INTERSECTIONS WILL HELP CORRIDOR PLANNERS AND DESIGNERS
Safety at Rural Non-Signalized Intersections in Delaware
 DCT 226 Safety at Rural Non-Signalized Intersections in Delaware By REBECCA FREY ARDESHIR FAGHRI Civil and Environmental Engineering University of Delaware September 2012 Delaware Center for Transportation
Highway 49, Highway 351 and Highway 91 Improvements Feasibility Study Craighead County
 Highway 49, Highway 351 and Highway 91 Improvements Feasibility Study Craighead County Executive Summary March 2015 Highway 49, Highway 351 and Highway 91 Improvements Feasibility Study Craighead County
Glenn Avenue Corridor Traffic Operational Evaluation
 Glenn Avenue Corridor Traffic Operational Evaluation PREPARED FOR: THE CITY OF AUBURN PREPARED BY: DECEMBER 2007 Glenn Avenue Corridor Study--Auburn, Alabama TABLE OF CONTENTS Introduction... 1 Background
WYDOT DESIGN GUIDES. Guide for. NHS Arterial (Non-Interstate)
") WYDOT DESIGN GUIDES Guide for NHS Arterial (Non-Interstate) 2014 GUIDE FOR NATIONAL HIGHWAY SYSTEM (NHS) HIGHWAYS (NHS ARTERIALS, Non-Interstate) PRESERVATION REHABILITATION RECONSTRUCTION INTRODUCTION
WYDOT DESIGN GUIDES Guide for NHS Arterial (Non-Interstate) 2014 GUIDE FOR NATIONAL HIGHWAY SYSTEM (NHS) HIGHWAYS (NHS ARTERIALS, Non-Interstate) PRESERVATION REHABILITATION RECONSTRUCTION INTRODUCTION
US Hwy. 64/264 Pedestrian Crossing at the Little Bridge Alternatives Analysis Public Meeting
 Town of Nags Head US Hwy. 64/264 Pedestrian Crossing at the Little Bridge Alternatives Analysis Public Meeting Prepared by: Department of Public Works August 8, 2013 Where traffic-control signals are not
To Illuminate or Not to Illuminate: Roadway Lighting as It Affects Traffic Safety at Intersections
 To Illuminate or Not to Illuminate: Roadway Lighting as It Affects Traffic Safety at Intersections Mark Rea Lighting Research Center Rensselaer Polytechnic Institute Eric Donnell Dept. of Civil and Environmental
Crash Reduction Factors. Desktop Reference. for. Federal Highway Administration. U.S. Department of Transportation. Publication No.
 Desktop Reference for Reduction Factors U.S. Department of Transportation Federal Highway Administration Publication No. FHWA-SA-07-015 September 2007 THIS PAGE LEFT INTENTIONALLY BLANK Notice This document
Monroe County Department of Transportation Vertical Curve Safety Study
 Monroe County, New York PREPARED FOR: Monroe County Department of Transportation 50 West Main Street Suite 6100 Rochester, NY 14614 PREPARED BY: 255 East Avenue Rochester, New York 14604 project # 434934
Desktop Reference for Crash Reduction Factors
 Desktop Reference for Reduction Factors Report No. FHWA-SA-08-011 U.S. Department of Transportation Federal Highway Administration September 2008 THIS PAGE LEFT INTENTIONALLY BLANK Notice This document
Road Diets. Presented by: Cristine Gowland, P.E. LADOTD District 62 March 2, 2016
 Road Diets Presented by: Cristine Gowland, P.E. LADOTD District 62 March 2, 2016 FHWA s 9 Proven Safety Countermeasures 1. Safety Edge 2. Roundabouts 3. Corridor Access Management 4. Backplates with Retroreflective
TRAFFIC SIGNAL WARRANT STUDY
 TRAFFIC SIGNAL WARRANT STUDY 5 th STREET & ENCHANTED PINES DRIVE JANUARY 2013 TRAFFIC OPERATIONS ENGINEERING SERVICES/PUBLIC WORKS DEPARTMENT TABLE OF CONTENTS INTERSECTION LOCATION MAP ii INTRODUCTION
Designing Complete Streets: What you need to know
 Designing Complete Streets: What you need to know Getting from this to this. Continuous sidewalk Buffer w/trees Bicycle lane Raised median Buildings close to the street Flexibility in design Design and
General References Definitions. (1) Design Guidance. (2) Supporting Information
 Design Guidance. (2) Supporting Information") Chapter 1240 Turning Roadways 1240.01 General 1240.02 References 1240.03 Definitions 1240.04 Turning Roadway Widths 1240.05 Documentation 1240.01 General The roadway on a curve may need to be widened to
Chapter 1240 Turning Roadways 1240.01 General 1240.02 References 1240.03 Definitions 1240.04 Turning Roadway Widths 1240.05 Documentation 1240.01 General The roadway on a curve may need to be widened to
Sponsored by the Office of Traffic and Safety of the Iowa Department of Transportation NOVEMBER 2001 CTRE
 PAVED SHOULDERS ON PRIMARY HIGHWAYS IN IOWA: AN ANALYSIS OF SHOULDER SURFACING CRITERIA, COSTS, AND BENEFITS EXECUTIVE SUMMARY Sponsored by the Office of Traffic and Safety of the Iowa Department of Transportation
Transportation Research Forum
 Transportation Research Forum Applying the Highway Safety Manual to Two-Lane Road Curves Author(s): Daniel Findley, Charles Zegeer, Carl Sundstrom, Joseph Hummer, and William Rasdorf Source: Journal of
TRB/AASHTO Geometric Design Research Efforts Supplemental Information
 TRB/AASHTO Geometric Design Research Efforts Supplemental Information Status Report on Ongoing Projects Wed, June 14, 3:45 pm - 4:45 pm Overview The TRB Committee on Geometric Design (AFB10) is seeking
Planning Guidance in the 2012 AASHTO Bike Guide
 Planning Guidance in the 2012 AASHTO Bike Guide Presentation by: RJ Eldridge Peter Lagerwey August 22, 2012 WEBINAR 2: PLANNING GUIDANCE IN THE 2012 AASHTO BIKE GUIDE Today s Webinar Significant Updates