Multimodal Level of Service (MMLOS) and the Highway Safety Manual (HSM)
|
|
|
- Dorcas Paul
- 5 years ago
- Views:
Transcription
1 Multimodal Level of Service (MMLOS) and the Highway Safety Manual (HSM) Transportation Education Series July 17, 2012 City of San Luis Obispo Council Chambers
2 Transportation Education Series Presenters Jim Damkowitch, Sacramento Kamala Parks, Oakland Brian Ray, Portland
3 Presentation Overview Introductions Design Flexibility and Performance Based Evaluation Multimodal Level of Service Highway Safety Manual Discussion 3
4 Presentation overview Introductions Design Flexibility and Performance Based Evaluation A Guide for Achieving Flexibility in Highway Design Designing Walkable Urban Thoroughfares: A Context Sensitive Approach MMLOS (HCM 2010) Highway Safety Manual Caltrans Initiatives Multimodal Level of Service Highway Safety Manual Discussion 4


5 A Guide for Achieving Flexibility in Highway Design Institutionalizes CSS into transportation project development. Allows designers to think flexibly for the particular situation or context. Flexible design can be integrated into the existing transportation culture. 5

6 Designing Walkable Urban Thoroughfares: A Context Sensitive Approach Funded by EPA and FHWA in partnership with the Congress for the New Urbanism Guidance for walkable and bikeable communities, compact development, and mixed land uses Specific design criteria, and case studies ITE recommended practice 6


7 Caltrans: Flexibility in Design and Operations Performance Measures Lower speeds & improved Level of Service Reduced congestion levels & reduction of motorist delay Improved pedestrian access and mobility Improved access to schools and businesses Improved safety Improved bicycle accessibility and mobility Protecting and preserving scenic and historic qualities and attributes 7
8 Why Complete Streets Matter to Caltrans SAFETY and risk management Commitment to the Three E s: Environment, Economy, and Equity (AB 857, 2002) Help meet GHG reduction targets (AB 32, 2006) Help partners meet local complete streets requirements (AB 1358, 2008) Manage capacity and expand options for travel on the State Highway System Be proactive, avoid legislative mandates Support State policy to improve public health outcomes Courtesy to Daniel Kopulsky Caltrans, District 8 8


9 Performance Based Analysis Tools HCM 2010 Multimodal Level of Service Facility operations from the traveler s perspective Provides LOS thresholds Highway Safety Manual Safety prediction tools Akin to the Highway Capacity Manual Support planning and design decisions 9
10 Presentation Overview Introductions Design Flexibility and Performance Based Evaluation Multimodal Level of Service Introduction Brief history of HCM multimodal analysis Development of the HCM methodology Bicyclist LOS model Pedestrian LOS model Transit Passenger LOS model MMLOS Case Study Lodi, CA Highway Safety Manual Discussion 10


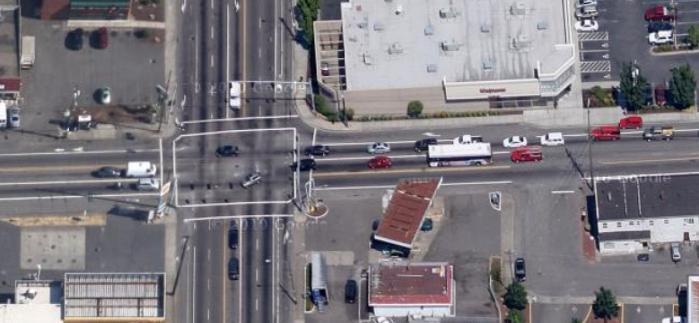
11 Why Multimodal Level of Service (MMLOS) Vehicle LOS analysis methods Often used as the only measure of effectiveness for roadway operations Promote only improvements for vehicles Encourage sprawl Don t reflect all operational or safety issues for roadways Images Source: Google Earth Professional 11

 Images Source: Google Earth")
12 Uses of MMLOS MMLOS can help: Quantify the operational tradeoffs among modes for a given streetscape design feature or strategy Help prioritize transit, bicycle, and pedestrian improvements Assist and inform the public involvement process Begin to document compliance with the California Complete Streets Act (AB 1358) Images Source: Google Earth Professional 12
 SJCOG Regional CMP Update Designation of multimodal corridors and baseline analysis")
13 Sample Applications of MMLOS Oakland Community-based transportation plan Pasadena Traffic impact analysis and road diet City of San Pablo General Plan and Specific Plan City of Goleta Roadway redesign (Hollister Avenue) SJCOG Regional CMP Update Designation of multimodal corridors and baseline analysis 13
14 Presentation Overview Introductions Design Flexibility and Performance Based Evaluation Multimodal Level of Service Introduction Brief history of HCM multimodal analysis Development of the HCM methodology Bicyclist LOS model Pedestrian LOS model Transit Passenger LOS model MMLOS Case Study Lodi, CA Highway Safety Manual Discussion 14


 4 Transit LOS measures, expanded pedestrian and")
15 Brief History of Highway Capacity Manual (HCM) Multimodal Analysis Transit and pedestrian impacts on motor vehicle capacity Level of Service concept and bus transit chapter Expanded bus transit chapter, new pedestrian chapter (density), and new bicycle chapter (vehicle hindrance) 4 Transit LOS measures, expanded pedestrian and bicycle chapters 15


16 Brief History of Highway Capacity Manual (HCM) Multimodal Analysis Issues with HCM 2000: Pedestrian and bicyclist LOS measures reflected a motorist perspective of density Transit measures reflected a traveler s perspective, but the multiple LOS measures created issues with results interpretation HCM 2000: Ped LOS A HCM 2000: Ped LOS D 16

17 HCM 2010 Multimodal Philosophy Integrate multimodal analysis methods into appropriate chapters Road user perspective No separate bicyclist, pedestrian, or transit passenger chapters Methodologies for all modes presented together and intertwined Encourage software developers to add multimodal analysis features 17
18 Presentation Overview Introductions Design Flexibility and Performance Based Evaluation Multimodal Level of Service Introduction Brief history of HCM multimodal analysis Development of the HCM methodology Bicyclist LOS model Pedestrian LOS model Transit Passenger LOS model MMLOS Case Study Lodi, CA Highway Safety Manual Discussion 18
19 Methodology Selection NCHRP Report 616 method Designed specifically for the HCM LOS measures based on traveler perceptions Modal LOS scores can be directly compared to each other and reflect average traveler satisfaction by mode Model developed and tested based on national conditions 19

20 Methodology Development Pedestrian, bicyclist, and motorist: 90 typical street segments recorded Video labs in four cities around the U.S. 120 Participants rated conditions on a 1 6 scale, 20
21 Methodology Development Transit passenger: Video lab not feasible On-board surveys conducted in 4 cities However, results showed too wide a range to fit a model to Final model was based on national traveler response data to changes in transit service quality For example, when service frequency or travel time is improved, ridership increases 21
 LOS thresholds were the same for all modes 22")
22 Methodology Characteristics All models generated a perception score that was generally in the range of 1 to 6 All models had multiple service quality factors as inputs Traditional HCM service measures are based on a single factor (e.g., delay) LOS thresholds were the same for all modes 22
23 LOS Score Interpretation Adopted in the 2010 HCM LOS models developed in the NCHRP report for pedestrians, bicyclists, and transit passengers LOS LOS Score A 2.00 B > C > D > E > F >

24 LOS Score Interpretation Changes to motorist LOS on arterials Based on percent of free-flow speed Travel Speed / Base Free Flow Speed LOS by Critical V/C < 1.0 > 1.0 > 85% A F 68% to 85% B F 51% to 67% C F 41% to 50% D F 31% to 40% E F < 30% F F The critical volume-to-capacity ratio is based on the through movement in the analysis direction at the downstream intersection 24

25 LOS Score Interpretation LOS is reported individually by mode and is directional No combined LOS for the street Auto volumes would typically dominate an LOS weighted by number of travelers Combined LOS would potentially mask important deficiencies for a given mode Measures the degree to which urban streets meet the need of all users 25
26 Treatment of Safety in Multimodal LOS HCM 2010 does not explicitly include safety in LOS calculations Crash history does not affect LOS However, HCM 2010 does include Traveler Perceived Safety elements Speed of traffic % heavy vehicles Sidewalk buffers Lateral separation of bicyclists and pedestrians from the traffic stream 26

27 Urban Street System Elements: Link link Between two signalized intersections Roundabout or all-way stop could also be an end point Perception score for bicyclists and pedestrians 27

28 Urban Street System Elements: Intersection link int. Signalized intersection, roundabout, or allway stop that terminates a link Perception score for bicyclists and pedestrians 28
29 Urban Street System Elements: Segment segment link int. Segment = link + downstream intersection Perception scores for all modes Pedestrian & bicylist scores based on combination of link, intersection, and additional factors 29
30 Urban Street System Elements: Facility segment link int. facility Facility = 2 or more consecutive segments Perception scores available for all modes Length-weighted average of the segment scores 30
31 Presentation Overview Introductions Design Flexibility and Performance Based Evaluation Multimodal Level of Service Introduction Brief history of HCM multimodal analysis Development of the HCM methodology Bicyclist LOS model Pedestrian LOS model Transit Passenger LOS model MMLOS Case Study Lodi, CA Highway Safety Manual Discussion 31
32 Bicycle LOS: Links 32
 Bicycle lane presence (+) Bicycle lane, shoulder, and outside lane widths (+) On-street parking utilization ( )")
33 Bicycle LOS: Links Model Factors Factors included: Vehicle traffic in outside travel lane ( ) Volume Speed Heavy vehicle percentage ( ) Pavement condition (+) Bicycle lane presence (+) Bicycle lane, shoulder, and outside lane widths (+) On-street parking utilization ( ) 33
34 Bicycle LOS: Signalized Intersections 34
35 Bicycle LOS: Signalized Intersections Model Factors Factors included: Width of lanes (+) Outside through vehicle lane Bicycle lane Cross-street width ( ) Motor vehicle traffic volume in the outside lane ( ) 35
36 Bicycle LOS: Segments 36
37 Bicycle LOS: Segments Model Factors Factors included: Bicycle link LOS (+) Bicycle intersection LOS, if signalized (+) Number of access points on right side ( ) Includes driveways and unsignalized street intersections Judgment required on how low-volume residential driveways are treated 37
38 Bicycle LOS: Segments Model Form I b, seg Bike Segment LOS Score I b, link Bike Link LOS Score F bi e I b, int Number of access points on right side Nap, s ( L / 5280) Indicator Bike Segment length Constant Variable Intersection (mi) LOS Score F bi = 1 if signalized F bi = 0 if unsignalized 38
39 Bicycle LOS: Facility Length-weighted average of segment LOS scores Can mask deficiencies in individual segments Consider also reporting segment LOS score for the worst segment in the facility 39
40 Presentation Overview Introductions Design Flexibility and Performance Based Evaluation Multimodal Level of Service Introduction Brief history of HCM multimodal analysis Development of the HCM methodology Bicyclist LOS model Pedestrian LOS model Transit Passenger LOS model MMLOS Case Study Lodi, CA Highway Safety Manual Discussion 40
41 Pedestrian LOS: Links 41
42 Pedestrian LOS: Links Model Factors Factors included: Outside travel lane width (+) Bicycle lane/shoulder width (+) Buffer presence (e.g., on-street parking, street trees) (+) Sidewalk presence and width (+) Volume and speed of motor vehicle traffic in outside travel lane ( ) Pedestrian density considered separately Worse of (density LOS, link LOS score) used in determining overall link LOS 42
43 Pedestrian LOS: Signalized Intersections 43
44 Pedestrian LOS: Signalized Intersections Model Factors Factors included: Permitted left turn and right-turn-on-red volumes ( ) Cross-street motor vehicle volumes and speeds ( ) Crossing length ( ) Average pedestrian delay ( ) Right-turn channelizing island presence (+) 44
45 Pedestrian LOS: Segments 45
46 Pedestrian LOS: Segments Model Factors Factors included: Pedestrian link LOS (+) Pedestrian intersection LOS (+) Street-crossing difficulty ( /+) Delay diverting to signalized crossing Delay crossing street at legal unsignalized location 46
47 Pedestrian LOS: Facility Length-weighted average of segment LOS scores Can mask deficiencies in individual segments Consider also reporting segment LOS score for the worst segment in the facility 47
48 Presentation Overview Introductions Design Flexibility and Performance Based Evaluation Multimodal Level of Service Introduction Brief history of HCM multimodal analysis Development of the HCM methodology Bicyclist LOS model Pedestrian LOS model Transit Passenger LOS model MMLOS Case Study Lodi, CA Highway Safety Manual Discussion 48
 Wait for transit (frequency) Riding transit (perceived travel time")
49 Transit LOS: Overview Only segment and facility LOS models Transit facility LOS is a length-weighted average of segment LOS Transit includes buses, streetcars, and street-running light rail Three main model components: Access to transit (pedestrian link LOS) Wait for transit (frequency) Riding transit (perceived travel time rate) 49
50 Transit LOS: Perceived Travel Time Components Factors included: Actual bus travel speed (+) Bus stop amenities (+) Excess wait time due to late bus/train arrival ( ) On-board crowding ( ) Default value of time data and average passenger trip lengths used to convert actual times into perceived times For example, the trip seems to take longer when one has to stand 50
51 Presentation Overview Introductions Design Flexibility and Performance Based Evaluation Multimodal Level of Service Introduction Brief history of HCM multimodal analysis Development of the HCM methodology Bicyclist LOS model Pedestrian LOS model Transit Passenger LOS model MMLOS Case Study Lodi, CA Highway Safety Manual Discussion 51


52 MMLOS Case Study SR-12 Kettleman Lane, Lodi State Highway is Main Street Pedestrian, transit and bicycle use Mostly commercial uses Provides access to residential areas Congestion Management Program System 52


53 Case Study SR-12 Kettleman Lane, Lodi Data Collection March 2012 in AM and PM Mostly infrastructure Roadway Conditions 4 to 5 through lanes 35 MPH posted speed Raised median Hourly vehicle volumes (from counts) Peak-Hour Vehicles AM PM Eastbound 1,000 to 1,850 1,700 to 2,600 Westbound 745 to 1,600 1,300 to 2,500 53


54 Case Study SR-12 Kettleman Lane, Lodi Existing Conditions - Pedestrian 4 to 8 foot wide sidewalks Lack of sidewalk buffers Some shoulders / parking lanes Low on-street parking occupancies Eastbound 0% to 3% Westbound 0% to 14% Source: Recordnet.com 54


55 Case Study SR-12 Kettleman Lane, Lodi Existing Conditions - Bicyclist 5 to 6 foot bike lanes through most of corridor Some shoulders / parking lanes Low on-street parking occupancies Eastbound 0% to 3% Westbound 0% to 14% Source: Lodinews.com 55


56 Case Study SR-12 Kettleman Lane, Lodi Existing Conditions Transit Passenger Variety of bus service on corridor Lodi Grape Line San Joaquin Regional Transit District Multiple routes Long headways Lack of bus stop amenities Benches only on 3 segments in westbound direction No shelters Source: Transitunlimited. com 56

57 Case Study SR-12 Kettleman Lane, Lodi 57
58 1 Case Study SR-12 Kettleman Lane, Lodi Segment From To HWY-99 SB Ramps Westbound AM Auto Transit Bicycle Pedestrian Segment Segment Intersection Link Segment Intersection Link Segment Cherokee Lane 29.0% (F) 4.94 (E) 4.09 (D) 4.08 (D) 4.52 (E) 2.66 (B) 2.50 (B) 3.32 (C) 2 Cherokee Lane Central Avenue 47.2% (D) 3.21 (C) 0.93 (A) (A) 2.80 (C) 2.14 (B) 2.56 (B) 3.25 (C) 3 Central Avenue Stockton Street 41.6% (D) 3.75 (D) 2.42 (B) 1.88 (A) 3.55 (D) 2.32 (B) 2.60 (B) 3.29 (C) 4 Stockton Street Church Street 50.7% (C) 4.84 (E) 1.83 (A) 1.96 (A) 3.33 (C) 1.95 (A) 2.74 (B) 3.26 (C) 5 Church Street Hutchins Street 36.0% (E) 5.23 (F) 1.12 (A) (A) 3.29 (C) 2.40 (B) 2.74 (B) 3.34 (C) 6 Hutchins Street 7 Crescent Avenue Crescent Avenue 43.2% (D) 4.87 (E) 2.07 (B) 1.47 (A) 3.33 (C) 1.95 (A) 2.75 (B) 3.26 (C) Ham Lane 56.1% (C) 5.25 (F) 2.75 (C) 2.13 (B) 3.62 (D) 2.77 (C) 2.61 (B) 2.76 (C) 8 Ham Lane Mills Avenue 68.5% (B) 2.61 (B) 0.88 (A) (A) 2.86 (C) 2.12 (B) 2.43 (B) 2.65 (B) 9 Mills Avenue Tienda Drive 61.5% (C) 2.07 (B) (A) (A) 2.07 (B) 2.29 (B) 2.11 (B) 2.62 (B) 10 Tienda Drive Lower Sacramento Road 49.5% (D) 2.21 (B) 0.82 (A) (A) 2.43 (B) 2.96 (C) 1.88 (A) 2.66 (B) 58
59 1 Case Study SR-12 Kettleman Lane, Lodi Segment From To Lower Sacramento Road Eastbound AM Auto Transit Bicycle Pedestrian Segment Segment Intersection Link Segment Intersection Link Segment Tienda Drive 50.9% (C) 2.19 (B) 0.04 (A) (A) 2.63 (B) 2.13 (B) 1.99 (A) 2.58 (B) 2 Tienda Drive Mills Avenue 60.2% (C) 2.57 (B) (A) (A) 1.93 (A) 1.94 (A) 2.17 (B) 2.58 (B) 3 Mills Avenue Ham Lane 67.9% (B) 2.61 (B) 0.44 (A) (A) 2.35 (B) 2.71 (B) 2.29 (B) 2.70 (B) 4 Ham Lane 5 Crescent Avenue Crescent Avenue 55.6% (C) 5.04 (F) 0.65 (A) (A) 2.94 (C) 1.94 (A) 2.47 (B) 2.64 (B) Hutchins Street 38.5% (E) 5.12 (F) 1.41 (A) (A) 2.92 (C) 2.64 (B) 2.56 (B) 3.33 (C) 6 Hutchins Street Church Street 32.5% (E) 4.90 (E) 0.94 (A) (A) 3.03 (C) 1.96 (A) 2.67 (B) 3.25 (C) 7 Church Street Stockton Street 50.2% (C) 5.10 (F) 2.25 (B) 3.01 (C) 3.54 (D) 2.53 (B) 3.03 (C) 3.42 (C) 8 Stockton Street Central Avenue 43.5% (D) 3.79 (D) 1.35 (A) (A) 3.02 (C) 1.96 (A) 2.93 (C) 3.31 (C) 9 Central Avenue Cherokee Lane 44.7% (D) 5.14 (F) 3.47 (C) 1.62 (A) 3.74 (D) 2.61 (B) 2.87 (C) 3.40 (C) 10 Cherokee Lane HWY-99 SB Ramps 35.1% (E) 4.97 (E) 2.63 (B) 4.00 (D) 3.96 (D) 1.85 (A) 2.88 (C) 3.28 (C) 59
60 Case Study SR-12 Kettleman Lane, Lodi Eastbound AM Transit Passenger LOS 60


61 Ham Ln Case Study SR-12 Kettleman Lane, Lodi Eastbound AM Improvements between Ham Ln and Crescent Ave Reduce Ham Lane width from 108 feet to 80 feet Install 7-foot sidewalk buffer Install bus shelter Kettleman Ln 61

62 Case Study SR-12 Kettleman Lane, Lodi Eastbound AM Ham Ln to Crescent Ave Compare Existing to Improved for Transit Headway Factor Perceived Travel Time Factor Transit Wait Ride Score Pedestrian Link LOS Score Transit LOS Score Transit LOS Existing F Improved E All Modes Auto Transit Bicycle Pedestrian Segment Segment Intersection Link Segment Intersection Link Segment Existing 55.6% (C) 5.04 (F) 0.65 (A) (A) 2.94 (C) 1.94 (A) 2.47 (B) 2.64 (B) Improved 55.6% (C) 4.98 (E) 0.65 (A) (A) 2.94 (C) 1.94 (A) 2.33 (B) 2.61 (B) 62
63 Presentation Overview Introductions Design Flexibility and Performance Based Evaluation Multimodal Level of Service Highway Safety Manual What is the HSM? & How can it be used Example Applications of the HSM Example Application of HSM and MMLOS Discussion 63
64 What is the HSM? Safety prediction tools developed through research Akin to the Highway Capacity Manual: Definitive Widely-accepted Science-based From qualitative descriptivebased analysis to quantitative prediction 64
65 What is the HSM? Part A Introduction and Fundamentals 1: Introduction 2: Human Factors 3: Fundamentals Part B Roadway Safety Management Process 4: Network Screening 5: Diagnosis 6: Select Countermeasures 7: Economic Evaluation 8: Prioritization 9: Safety Effectiveness Evaluation Part C Predictive Method 10: Rural Two-Lane Highways 11: Rural Multilane Highways 12: Urban and Suburban Arterials Part D Crash Modification Factors 13: Roadway Segments 14: Intersections 15: Interchanges 16: Special Facilities 17: Networks Glossary 65

66 Photo Courtesy of Yolanda Takesian How can the HSM be used? Estimate Crashes per Year for Today and Future Condition 1 Condition 2 66
67 Why use the HSM? Able to measure safety objectively (i.e., quantitatively) New tools build on and enhance current practice Improve reliability Provide new capabilities (e.g., predicting crashes) Able to quantify safety and compare with other project advantages and disadvantages Opportunities to incorporate new tools and methods in the near-term and plan for further integrating them in the long-term No need to do everything at once New tools/methods can provide value to decision making now 67
68 Part A Review of Key HSM Concepts Driver Factors Influencing Crashes Nominal vs. Substantive Safety Objective vs. Subjective Safety Randomness of Crashes 68
69 Driver Factors Influencing Crashes 69

70 Nominal vs. Substantive Safety Source: NCHRP
71 Objective and Subjective Safety Objective Measured Subjective - Perceived SUBJECTIVE Downtown is difficult as it is without having a roundabout death trap in it. - Chico Enterprise - Record Posted: 03/08/2011 OBJECTIVE Converting a traffic signal in an urban area to a roundabout reduces injury/fatal crashes by about 60%. HSM
72 Crashes Preferred Measure of Safety: Long Term Expected Average Crashes Considered more reliable measure minimizing influence of the randomness of crashes Years Crashes Average 72
73 Crashes are Rare and Random Events 73
74 Crashes are Rare and Random Events Crashes, as rare random events, tend to regress to long-term average Looking at short-term crash frequencies can be misleading 74

75 Crashes are Rare and Random 75
76 Crashes Per Year How is the randomness compensated for? Safety Performance Functions (SPFs) Predicts the average number of crashes per year It is generally a nonlinear regression equation Safety Performance Function N spf,x AADT Crashes Per Year 76
77 How to compensated for randomness? Empirical Bayes A process to develop a weighting between observed and predicted crashes A means to calculate a refined prediction called the expected number of crashes Observed Number of Crashes Expected Number of Crashes Predicted Number of Crashes 77
78 Part B Content Highlights Part A Introduction and Fundamentals 1: Introduction 2: Human Factors 3: Fundamentals Part B Roadway Safety Management Process 4: Network Screening 5: Diagnosis 6: Select Countermeasures 7: Economic Evaluation 8: Prioritization 9: Safety Effectiveness Evaluation Part C Predictive Method 10: Rural Two-Lane Highways 11: Rural Multilane Highways 12: Urban and Suburban Arterials Part D Crash Modification Factors 13: Roadway Segments 14: Intersections 15: Interchanges 16: Special Facilities 17: Networks Glossary 78


79 Part B Content Highlights Network Screening What sites have potential for improvement? Safety Effectiveness Evaluation How effective were countermeasures? Diagnosis What pattern do crashes follow? Prioritize Projects What projects meet program objectives? Select Countermeasures What factors contribute to crashes? Economic Appraisal What countermeasures are cost-effective? 79

80 Part B Content Highlights Chapter 4 Network Screening SafetyAnalyst Software Implements Part B Chapters including Network Screening 80
81 Part C Content and Application Part A Introduction and Fundamentals 1: Introduction 2: Human Factors 3: Fundamentals Part B Roadway Safety Management Process 4: Network Screening 5: Diagnosis 6: Select Countermeasures 7: Economic Evaluation 8: Prioritization 9: Safety Effectiveness Evaluation Part C Predictive Method 10: Rural Two-Lane Highways 11: Rural Multilane Highways 12: Urban and Suburban Arterials Part D Crash Modification Factors 13: Roadway Segments 14: Intersections 15: Interchanges 16: Special Facilities 17: Networks Glossary 81

82 Part C - Content and Application 82
83 Part C - Content and Application Method to predict safety performance of alternative designs N predicted = SPF *(CMF 1 CMF 2 )*C N expected w x N Predict Expected Safety Performance Select homogeneous analysis segments Select SPF and estimate base conditions for each analysis segment Apply CMFs to modify base conditions to site specific conditions Apply calibration factor predicted Apply EB when appropriate (1 - w) x N observed 83
84 Overview of Steps 1. Categorize Homogenous Sites 2. Estimate base prediction 3. Modify to reflect local conditions 4. Apply Calibration Factor 5. Apply EB, if appropriate 84

85 Categorize Homogenous Sites Categorize facilities by intersection and segment Intersections Signalized Unsignalized Number of Approaches Segments Divided Undivided Number of lanes 85
86 Part D Content and Application Part A Introduction and Fundamentals 1: Introduction 2: Human Factors 3: Fundamentals Part B Roadway Safety Management Process 4: Network Screening 5: Diagnosis 6: Select Countermeasures 7: Economic Evaluation 8: Prioritization 9: Safety Effectiveness Evaluation Part C Predictive Method 10: Rural Two-Lane Highways 11: Rural Multilane Highways 12: Urban and Suburban Arterials Part D Crash Modification Factors 13: Roadway Segments 14: Intersections 15: Interchanges 16: Special Facilities 17: Networks Glossary 86
87 What is a Part D CMF? Ratio showing the change in the number of crashes between two conditions Usually a comparison of a proposed condition to an existing condition Existing Traffic Signal Control Proposed Single Lane Roundabout CMF Crash frequency for proposed condition ' p' Crash frequency for existing condition ' e' E E p e 87
88 Sources of Crash Modification Factors Part C contains CMFs applied in the predictive method Part D presents CMFs for: Chapter 13: Roadway Segments Chapter 14: Intersections Chapter 15: Interchanges Chapter 16: Special Facilities and Geometric Situations Chapter 17: Road Networks FHWA CMF Clearinghouse 88
89 Russell Street Corridor Study Project Context Update of traffic analysis for widening of 1.5-mile long corridor in Missoula, MT Public opposition to original corridor study One advocacy group formed specifically to fight this project Bike/pedestrian groups uneasy Opinion that safety was not sufficiently quantified in the initial study 89 89

90 Russell Street Corridor Study Basic Project Question Which alternative best accommodates projected traffic volumes without compromising the safety of roadway users? Project Activities Conducted Safety and MMLOS evaluations Quantified predicted safety trade-offs between concepts 90
91 Russell Street Corridor Study One of five river crossings Two and three-lane crosssection Important route for bicycle commuters AADT of 20,000 to 25,000 91
 Mixture of cross-sections and traffic control 92")
92 Russell Street Corridor Study Six alternatives (Alternative 1 is no build) Mixture of cross-sections and traffic control 92 92
93 Russell Street Corridor Study Good Performance Alternative 2 Alternative 3 Alternative 5R Fair Performance Alternative 4 Alternative 6 Alternative 7 93 Poor Performance Alternative 1 No Build Condition 93
94 Russell Street Corridor Study Key Characteristics of Well-Performing Alternatives Raised Medians Roundabouts Left-turn Lanes at Intersections 94 94
95 Russell Street Corridor Study Value of Analysis Allowed City and State to consider quantified safety information in selection process. Comprehensive assessment of alternatives created a better understanding of tradeoffs. Allowed City and State staff to communicate to the public and elected officials that the preferred alternative is an improvement over existing conditions
96 US 97 Study Bend, Oregon Corridor Study Access Management Considerations Traffic Operations Considerations Long term solutions are a long way out but near term development goals remain Use safety evaluation criteria to specifically measure the relative merits of various project considerations Identify strategic improvements to improve safety performance that buy time until long range solutions are in place 96

97 US 97 Study 97
 Predicted crashes 2020 no improvements ~ 8 crashes/year (3 injury,")
98 US 97/Cooley Intersection Safety Current annual crashes ~ 6 crashes/year (2 injury, 4 PDO) Predicted crashes 2020 no improvements ~ 8 crashes/year (3 injury, 5 PDO)
99 Potential Targeted Countermeasures Need for detailed review of crash type, location, approach, severity, time of day, etc. Example options Intersection Control (e.g., modern roundabout) Reduction of Conflict Points (e.g., grade separation) Additional design elements (e.g., add right-turn lanes on US 97) Warning treatments (e.g., flashing beacons, stop ahead signals) 99
100 Potential Safety Benefits Countermeasure Options Multilane Roundabout Mid-Term (2 intersections w fewer conflict points) Potential Annual Crash Reduction 0 (all crashes) 2 (injury crashes) 1 Right Turn Lanes on US 97 1 Advanced Warning N/A Stop Ahead Warning Signs 4 (all crashes) 1-2 (injury crash) 100
101 US 97 Study Value of Analysis Identify near term solutions that could address existing crash experience concerns Consider near term improvements that are within reasonable City budget ranges Create ways for economic development to continue versus being stunted by uncertainty about long term solutions
102 US 26 Corridor Study Portland, Oregon Corridor considering cross section changes Access management study Pedestrian/bike facilities Rural roadway evolving to urbanized features Basic corridor capacity improvement Project where traffic operations are not clear differentiators High volume considerations Low volume considerations Safety and Multi Modal Level of Service are supplemental performance measures to traditional vehicular operational evaluations 102

103 US 26 (Powell Boulevard) Context
104 US 26 (Powell Boulevard) Corridor Study Originally had 22 specific alternatives Organized alternatives into five primary groups Tested alternatives using the HSM predictive method Group Description 1 Access Management and Intersection Modifications at 122nd 2 Different locations of left-turn lanes along SE Powell Boulevard 3 Three-lane (TWLTL) roadway with different roadway element widths 4 Three-lane (raised median) roadway with different roadway elements 5 Existing conditions with different pedestrian features 104
105 US 26 (Powell Boulevard) Corridor Study Safety Analysis Results Two groups of alternatives emerged with clear safety benefits Alt Group Description 1 Access management and intersection modifications near 122nd % Crash Reduction 0% 1 2 Varying locations of left-turn lanes along US % 2 3 Three-lane (TWLTL) roadway with varying roadway element widths 4 Three-lane (raised median) roadway with varying roadway elements 21% 19-27% 3 5 Existing conditions with different pedestrian features 0% 1 105
106 US 26 (Powell Boulevard) Corridor Study MMLOS Analysis Results Similar performance relative to no-build Alternative Group Bicycle Facility LOS Pedestrian Facility LOS Eastbound Westbound Eastbound Westbound Existing/No Build E E E E 1 E E D D 2 E E D D 3 E/F E/F D/E D 4 E/F E/F D/E D/E 5 E E D D Alternative focused on Pedestrian Treatments 106
107 US 26 (Powell Boulevard) Corridor Study MMLOS Analysis Results What else could be done to improve MMLOS performance? Landscape buffer between roadway and sidewalk improves Pedestrian LOS to C Rectangular Rapid Flashing Beacons at uncontrolled pedestrian crossings (improve yield rate) AND refuge island Greater consolidation of driveways and wider bicycle lanes are needed to improve Bicycle LOS 107
108 US 26 (Powell Boulevard) Corridor Study Value of Analysis Allowed ODOT to consider quantified safety information in their selection process. Comprehensive assessment of alternatives created a better understanding of tradeoffs. Allowed ODOT to communicate to the public the benefit of doing more than sidewalks. 108
109 Presentation Overview Introductions Design Flexibility and Performance Based Evaluation Multimodal Level of Service Highway Safety Manual Discussion 109
110 Questions/Comments Jim Damkowitch Kamala Parks Brian Ray 110
Emerging Methods for Evaluating Transportation Systems Multimodal LOS and Highway Safety Manual
 Emerging Methods for Evaluating Transportation Systems Multimodal LOS and Highway Safety Manual November 8, 2012 Lake Merritt Tower in Oakland Transportation Education Series 1 Presenters Mark Bowman,
Multimodal Analysis in the 2010 Highway Capacity Manual
 Multimodal Analysis in the 2010 Highway Capacity Manual It s not just cars anymore! Jamie Parks, AICP HCAT Conference May 9-10, 2011 Multimodal LOS in the 2010 HCM History and background Overview of methods
Moving Towards Complete Streets MMLOS Applications
 Moving Towards Complete Streets MMLOS Applications Transportation Education Series May 18 th, 2012 It s not just for cars! Presentation Overview The Complete Streets Movement What is Multi-Modal Level
Complete Street Analysis of a Road Diet: Orange Grove Boulevard, Pasadena, CA
 Complete Street Analysis of a Road Diet: Orange Grove Boulevard, Pasadena, CA Aaron Elias, Bill Cisco Abstract As part of evaluating the feasibility of a road diet on Orange Grove Boulevard in Pasadena,
Columbia Pike Implementation Team (CPIT) Meeting
 Meeting") Columbia Pike Implementation Team (CPIT) Meeting November 30, 2010 Agenda Introductions / Purpose of Meeting Review of project goals Multimodal project: 10% street design between the curbs Discussion Multimodal
Columbia Pike Implementation Team (CPIT) Meeting November 30, 2010 Agenda Introductions / Purpose of Meeting Review of project goals Multimodal project: 10% street design between the curbs Discussion Multimodal
Performance-Based Approaches for Geometric Design of Roads. Douglas W. Harwood MRIGlobal 3 November 2014
 Performance-Based Approaches for Geometric Design of Roads Douglas W. Harwood MRIGlobal 3 November 2014 Traditional Approaches to Highway Geometric Design Based on established geometric design criteria
A Traffic Operations Method for Assessing Automobile and Bicycle Shared Roadways
 A Traffic Operations Method for Assessing Automobile and Bicycle Shared Roadways A Thesis Proposal By James A. Robertson Submitted to the Office of Graduate Studies Texas A&M University in partial fulfillment
FHWA Safety Performance for Intersection Control Evaluation (SPICE) Tool
 Tool") FHWA Safety Performance for Intersection Control Evaluation (SPICE) Tool Virginia Section ITE Annual Meeting Virginia Beach June 217 Pete Jenior Kittelson & Associates, Inc. 1 Intersection Control Evaluation
FHWA Safety Performance for Intersection Control Evaluation (SPICE) Tool Virginia Section ITE Annual Meeting Virginia Beach June 217 Pete Jenior Kittelson & Associates, Inc. 1 Intersection Control Evaluation
Road Diets FDOT Process
 Florida Department of TRANSPORTATION Road Diets FDOT Process Humberto Castillero, PE, PTOE Roadway Design Office Purpose of Guide Develop a statewide lane elimination review process Balance state & local
MEMORANDUM. Charlotte Fleetwood, Transportation Planner
 MEMORANDUM Date: Updated August 22, 2017 To: Organization: Charlotte Fleetwood, Transportation Planner Boston Transportation Department From: Jason DeGray, P.E., PTOE, Regional Director of Engineering
Clackamas County Comprehensive Plan
 ROADWAYS The County s road system permits the movement of goods and people between communities and regions, using any of a variety of modes of travel. Roads provide access to virtually all property. They
Corridor Advisory Group and Task Force Meeting #10. July 27, 2011
 Corridor Advisory Group and Task Force Meeting #10 July 27, 2011 1 Agenda Recap CAG/TF #9 Public Meeting #2 Summary Single Mode Alternatives Evaluation Results Next Steps 2 3 CAG/TF #9 Recap CAG /TF #9
Dr. M.L. King, Jr. Street North Complete Streets Resurfacing Opportunities HOUSING, LAND USE, AND TRANSPORTATION COMMITTEE MARCH 22, 2018
 Dr. M.L. King, Jr. Street North Complete Streets Resurfacing Opportunities HOUSING, LAND USE, AND TRANSPORTATION COMMITTEE MARCH 22, 2018 What s Happening The City plans to mill and resurface Dr. M.L.
Implementing Complete Streets in Ottawa. Project Delivery Process and Tools Complete Streets Forum 2015 October 1, 2015
 Implementing Complete Streets in Ottawa October 1, 2015 The Essentials Complete Streets Implementation Framework will become part of the routine delivery of City transportation projects Approach uses every
Route 7 Corridor Study
 Route 7 Corridor Study Executive Summary Study Area The following report analyzes a segment of the Virginia State Route 7 corridor. The corridor study area, spanning over 5 miles in length, is a multi
Defining Purpose and Need
 Advanced Design Flexibility Pilot Workshop Session 4 Jack Broz, PE, HR Green May 5-6, 2010 Defining Purpose and Need In your agency s project development process, when do design engineers typically get
Chapter 5 DATA COLLECTION FOR TRANSPORTATION SAFETY STUDIES
 Chapter 5 DATA COLLECTION FOR TRANSPORTATION SAFETY STUDIES 5.1 PURPOSE (1) The purpose of the Traffic Safety Studies chapter is to provide guidance on the data collection requirements for conducting a
4. ENVIRONMENTAL IMPACT ANALYSIS 9. TRANSPORTATION AND TRAFFIC
 4. ENVIRONMENTAL IMPACT ANALYSIS 9. TRANSPORTATION AND TRAFFIC 4.9.1 INTRODUCTION The following section addresses the Proposed Project s impact on transportation and traffic based on the Traffic Study
TRAFFIC IMPACT ANALYSIS
 TRAFFIC IMPACT ANALYSIS FOR THE CHAMPAIGN UNIT#4 SCHOOL DISTRICT PROPOSED HIGH SCHOOL (SPALDING PARK SITE) IN THE CITY OF CHAMPAIGN Final Report Champaign Urbana Urbanized Area Transportation Study 6/24/2014
AMATS Complete Streets Policy
 AMATS Complete Streets Policy Table of Contents: Section 1. Definition of Complete Streets Section 2. Principles of Complete Streets Section 3. Complete Streets Policy Section 4. Consistency Section 5.
APPENDIX A: Complete Streets Checklist DRAFT NOVEMBER 2016
 APPENDIX A: Complete Streets Checklist DRAFT NOVEMBER 2016 Complete Streets Checklist MetroPlan Orlando s Complete Streets Checklist is an internal planning tool for staff to further implementation of
Acknowledgements. Mr. David Nicol 3/23/2012. Daniel Camacho, P.E. Highway Engineer Federal Highway Administration Puerto Rico Division
 Daniel Camacho, P.E. Highway Engineer Federal Highway Administration Puerto Rico Division Acknowledgements Mr. David Nicol Director, FHWA Office of Safety FHWA Office of Safety http://safety.fhwa.dot.gov/provencountermeasures/
Safety Effectiveness of Pedestrian Crossing Treatments
 Portland State University PDXScholar TREC Friday Seminar Series Transportation Research and Education Center (TREC) 10-13-2017 Safety Effectiveness of Pedestrian Crossing Treatments Christopher Monsere
Planning Study SR 976. Project Advisory Team Meeting May 24, 2017
 ` SR 976 BIRD ROAD/SW 40TH STREET FROM SR 821/HEFT TO SR 5/US-1 Miami-Dade County, Florida FPID No.: 434845-4-22-01 Planning Study Project Advisory Team Meeting May 24, 2017 1 Agenda Introductions Project
Multimodal Arterial Level of Service
 Multimodal Arterial Level of Service DOUGLAS S. MCLEOD Florida Department of Transportation, USA ABSTRACT The concept of quality of service from a user perspective of a transportation facility or service
TRANSPORTATION ANALYSIS REPORT US Route 6 Huron, Erie County, Ohio
 TRANSPORTATION ANALYSIS REPORT US Route 6 Huron, Erie County, Ohio December 12, 2012 Prepared for: The City of Huron 417 Main Huron, OH 44839 Providing Practical Experience Technical Excellence and Client
appendix b BLOS: Bicycle Level of Service B.1 Background B.2 Bicycle Level of Service Model Winston-Salem Urban Area
 appendix b BLOS: B.1 Background Winston-Salem Urban Area Bicycle Level of Service Level of Service (LOS) is a framework that transportation professionals use to describe existing conditions (or suitability)
Omaha s Complete Streets Policy
 Omaha s Complete Streets Policy (Adopted August 2015) VISION To create great places and enhance our quality of life, the City of Omaha will provide safe, accessible streets for all users. Complete Streets
4.12 TRANSPORTATION Executive Summary. Setting
 4.12 TRANSPORTATION 4.12.1 Executive Summary This section is based on the Multimodal Transportation Impact Study (TIS; 2016) prepared by Omni-Means, Ltd. to evaluate projected transportation impact conditions
Bay to Bay Boulevard Complete Streets Project
 Bay to Bay Boulevard Complete Streets Project Dale Mabry Highway to Bayshore Boulevard February 08, 2018 Photo Source: Tampa Bay Times Alessandra Da Pra Meeting Format Introduction Resurfacing Information
Balancing Operation & Safety for Motorized and Non-Motorized Traffic
 Balancing Operation & Safety for Motorized and Non-Motorized Traffic Brian Willham, PE, PTOE Iowa Director - MOVITE June 30, 2014 Learning Objectives: When & Why should we measure the performance of complete
COMPLETE STREETS DESIGN STATE OF THE PRACTICE
 COMPLETE STREETS DESIGN STATE OF THE PRACTICE Marshall Elizer, PE, PTOE, Senior Principal Michael Sewell, P.E., Senior Vice President Gresham, Smith and Partners (GS&P) SDITE, Monday, March 27, 2017 Acknowledgments
HSM Practitioners Guide to Urban and Suburban Streets. Prediction of Crash Frequency for Suburban/Urban Streets
 HSM Practitioners Guide to Urban and Suburban Streets Prediction of Crash Frequency for Suburban/Urban Streets Predicting Crash Frequency of Suburban/Urban Multilane Streets Learning Outcomes: Describe
I-105 Corridor Sustainability Study (CSS)
") I-105 Corridor Sustainability Study (CSS) Metro Streets and Freeways Subcommittee March 21, 2019 Gary Hamrick Cambridge Systematics, Inc. I-105 CSS Project History & Background Funded by Caltrans Sustainable
I-105 Corridor Sustainability Study (CSS) Metro Streets and Freeways Subcommittee March 21, 2019 Gary Hamrick Cambridge Systematics, Inc. I-105 CSS Project History & Background Funded by Caltrans Sustainable
Safety Impacts: Presentation Overview
 Safety Impacts: Presentation Overview The #1 Theme How Access Management Improves Safety Conflict Points The Science of Access Management By Treatment Studies Themes for Texas Access Management Improve
IHSDM- HSM Predictive Methods. Slide 1
 IHSDM- HSM Predictive Methods Slide 1 Presentation Outline IHSDM Overview Relationship between HSM and IHSDM Crash Prediction Models and Data Needs IHSDM HSM Predictive Method 2011 Release Preview Questions
Crash Data Analysis for Converting 4-lane Roadway to 5-lane Roadway in Urban Areas
 Crash Data Analysis for Converting 4-lane Roadway to 5-lane Roadway in Urban Areas Xiaoduan Sun, University of Louisiana at Lafayette Nicholas P. Fruge, LADOTD District 3 Subasish Das, University of Louisiana
Effects of Traffic Signal Retiming on Safety. Peter J. Yauch, P.E., PTOE Program Manager, TSM&O Albeck Gerken, Inc.
 Effects of Traffic Signal Retiming on Safety Peter J. Yauch, P.E., PTOE Program Manager, TSM&O Albeck Gerken, Inc. Introduction It has long been recognized that traffic signal timing can have an impact
Access Location, Spacing, Turn Lanes, and Medians
 Design Manual Chapter 5 - Roadway Design 5L - Access Management 5L-3 Access Location, Spacing, Turn Lanes, and Medians This section addresses access location, spacing, turn lane and median needs, including
HARRISON STREET/OAKLAND AVENUE COMMUNITY TRANSPORTATION PLAN
 HARRISON STREET/OAKLAND AVENUE Community Workshop #4: Draft Plan Review December 3, 2009 D E S I G N, C O M M U N I T Y & E N V I R O N M E N T INTRODUCTIONS Key Project Staff: Alisa Shen, Project Manager,
Multimodal Through Corridors and Placemaking Corridors
 68 Multimodal Through Corridors and Placemaking Corridors Corridors have different functions in a region. Some corridors are used to get smoothly and rapidly through a region or to get quickly to major
Access Management in the Vicinity of Intersections
 Access Management in the Vicinity of Intersections FHWA-SA-10-002 Technical Summary Photo: Ralph Bentley (used with permission) 0 Access Management is: The design, implementation and management of entry
Chapter 4 Traffic Analysis
 Chapter 4 Traffic Analysis PURPOSE The traffic analysis component of the K-68 Corridor Management Plan incorporates information on the existing transportation network, such as traffic volumes and intersection
BICYCLE LEVEL OF SERVICE for URBAN STREETS. Prepared by Ben Matters and Mike Cechvala. 4/16/14 Page 1
 BICYCLE LEVEL OF SERVICE for URBAN STREETS Prepared by Ben Matters and Mike Cechvala 4/16/14 Page 1 Introduction The methodology used for the Bicycle (BLOS) analysis is from the Highway Capacity Manual
Long Island Rail Road Expansion Project Floral Park to Hicksville
 Long Island Rail Road Expansion Project Floral Park to Hicksville Final Environmental Impact Statement Appendix 1-D Complete Streets Policy Checklist April 2017 0902ML PIN: Project Location: 18A-4 Floral
SECTION 1 - TRAFFIC PLANNING
 SECTION 1 - TRAFFIC PLANNING 1.1 TRAFFIC OPERATIONS 1.1.1 Roadway Functional Classification The Multnomah County Comprehensive Framework Plan s Policy 34: Trafficways and the Functional Classification
ALLEY 24 TRAFFIC STUDY
 ALLEY 24 TRAFFIC STUDY in City of Frostburg, Maryland January 2013 3566 Teays Valley Road Hurricane, WV Office: (304) 397-5508 www.denniscorporation.com Alley 24 Traffic Study January 2013 Frostburg, Maryland
In station areas, new pedestrian links can increase network connectivity and provide direct access to stations.
 The Last Mile Planning for Pedestrians Planning around stations will put pedestrians first. Making walking to stations safe and easy is important; walking will be a part of every rapid transit Accessible
HIGHWAY CAPACITY MANUAL
 HISTORY OF THE HIGHWAY CAPACITY MANUAL TexITE - Houston Chapter November 10, 2010 Michael Y. Ereti City of Houston Department of Public Works & Engineering THE NEW GUY (Michael Ereti) Consultant (10 years)
Complete Streets Training. Georgia Municipal Association June 27, 2016
 Complete Streets Training Georgia Municipal Association June 27, 2016 Overview What are CS? GDOT s Policy Case Study 2 What are Complete Streets? According to the National Complete Streets Coalition, complete
Pedestrian & Bicycle Safety Innovations & Applications
 Pedestrian & Bicycle Safety Innovations & Applications County Engineers Association of Maryland Spring, 2017 Conference May 25, 2017 George Branyan Pedestrian Program Coordinator District Department of
Roadways. Roadways III.
 Introduction 97 Roadway Design Principles 98 Safe Speeds 99 Optimizing of Street Space 00 Minimum Lane Widths in the City of Boston 02 Design Features that Reduce Operating Speeds 05 Travel Lanes Transit
Designing Complete Streets: What you need to know
 Designing Complete Streets: What you need to know Getting from this to this. Continuous sidewalk Buffer w/trees Bicycle lane Raised median Buildings close to the street Flexibility in design Design and
San Jose Transportation Policy
 San Jose Transportation Policy Protected Intersections in LOS Policies to Support Smart Growth Presented by: Manuel Pineda City of San Jose Department of Transportation Bay Area Map San Francisco Oakland
NJDOT Complete Streets Checklist
 Background The New Jersey Department of Transportation s Complete Streets Policy promotes a comprehensive, integrated, connected multi-modal network by providing connections to bicycling and walking trip
Zlatko Krstulich, P.Eng. City of O9awa
 Zlatko Krstulich, P.Eng. City of O9awa 1. Introduction to the Ontario Traffic Manual Series 2. What is OTM Book 18: Bicycle Facilities? 3. Study / Committee Team Members 4. Brief overview of the content
City of Jacksonville Mobility Fee Update
 City of Jacksonville Mobility Fee Update 2017 Preliminary Analysis May 3, 2017 Carnival Cruise lines photo credit Presentation Overview Public Outreach Process Pedestrian and Bicycle Master Plan Study
ACTIVE TRANSPORTATION
 ACTIVE TRANSPORTATION Mobility 2040 Supported Goals Improve the availability of transportation options for people and goods. Support travel efficiency measures and system enhancements targeted at congestion
TRANSPORTATION TRAINING TOPICS. April 6, 2010
 TRANSPORTATION TRAINING TOPICS April 6, 2010 Roles of Transportation Providers Context and Policy Makers Division of Transportation and Traffic Other City Operations Other Transportation Operators CMA
HCM Sixth Edition. Plus More. Rahim (Ray) Benekohal University of Illinois at Urban Champaign,
 Benekohal University of Illinois at Urban Champaign,") HCM Sixth Edition What s New in the HCM Sixth Edition Plus More Rahim (Ray) Benekohal University of Illinois at Urban Champaign, 65 th Traffic Engineering and Safety Conference October 19 20, 2016 Institute
HCM Sixth Edition What s New in the HCM Sixth Edition Plus More Rahim (Ray) Benekohal University of Illinois at Urban Champaign, 65 th Traffic Engineering and Safety Conference October 19 20, 2016 Institute
Safety in the Geometric Design of Highways
 Safety in the Geometric Design of Highways Corresponding Author: Richard Coakley CH2M HILL 135 South 84 th Street Suite 400 Milwaukee WI. 53214 414 847 0423 Richard.coakley@ch2m.com Abstract This project
Bicycling and Walking
 Bicycling and Walking Performance Measures Traditional, the new Highway Capacity Manual, and beyond A New Game. Balanced transportation. Multi-modal Complete Streets Livability Sustainable Whatever Economically-Efficient
CITY OF COCOA BEACH 2025 COMPREHENSIVE PLAN. Section VIII Mobility Element Goals, Objectives, and Policies
 CITY OF COCOA BEACH 2025 COMPREHENSIVE PLAN Section VIII Mobility Element Goals, Objectives, and Policies Adopted August 6, 2015 by Ordinance No. 1591 VIII MOBILITY ELEMENT Table of Contents Page Number
SELECTED ROADWAY CAPACITY ANALYSIS
 CHAPTERFOUR SELECTED ROADWAY CAPACITY ANALYSIS 4.1 SELECTED ROADWAY CAPACITY ANALYSIS Introduction Capacity analysis was performed on six selected roadways within the Dearborn County study area using the
Roundabout Feasibility Memorandum
 Roundabout Feasibility Memorandum To From Gwen Pipkin Bill Howell Date June 18, 2013 Subject Roundabout Feasibility Study SR 29 PD&E Study From Oil Well Road to SR 82 Collier County, FL FPID 417540-1-22-01
MCTC 2018 RTP SCS and Madera County RIFP Multi-Modal Project Eval Criteria GV13.xlsx
 MCTC 8 RTP SCS and Madera County RIFP Multi-Modal Project Eval Criteria GV.xlsx Madera County Transportation Commission Regional Transportation Plan / Sustainable Communities Strategy Multi-Modal Project
PEDESTRIAN SAFETY IMPROVEMENT EVALUATION GUIDELINE FOR UNCONTROLLED CROSSINGS
 PEDESTRIAN SAFETY IMPROVEMENT EVALUATION GUIDELINE FOR UNCONTROLLED CROSSINGS Traffic Safety Engineering Division Updated: April 2018 EXECUTIVE SUMMARY NDOT Traffic Safety Engineering Division developed
Project Report. South Kirkwood Road Traffic Study. Meadows Place, TX October 9, 2015
 Meadows Place, TX October 9, 2015 Contents 1 Introduction... 1 2 Data Collection... 1 3 Existing Roadway Network... 2 4 Traffic Volume Development... 2 5 Warrant Analysis... 3 6 Traffic Control Alternative
FINAL DESIGN TRAFFIC TECHNICAL MEMORANDUM
 FINAL DESIGN TRAFFIC TECHNICAL MEMORANDUM July 2014 FINAL (SR 43) Project Development and Environment Study From State Road 60 (Adamo Drive) to I-4 (SR 400) Hillsborough County, Florida Work Program Item
Access Management Regulations and Standards
 Access Management Regulations and Standards Efficient highway operation Reasonable property access Concept of Access Management The way to manage access to land development while simultaneously preserving
5.0 Roadway System Plan
 Southwest Boise Transportation Study Page 16 5.0 Roadway System Plan The Roadway System Plan outlines roadway improvements in the Initial Study Area. It forecasts future deficiencies on the arterial system,
What Is a Complete Street?
 Session 5 Charleen Zimmer, AICP, Zan Associates May 5-7, 2010 What Is a Complete Street? May 2010 5-1 Not a Complete Street More of a Complete Street May 2010 5-2 Benefits of Complete Streets Safety for
Application of the Highway Safety Manual to Predict Crash Frequency
 Application of the Highway Safety Manual to Predict Crash Frequency Application of the Highway Safety Manual to Predict Crash Frequency Elizabeth Wemple, Nick Foster, and Casey Bergh 610 SW Alder St, Ste
PRESS RELEASE San Joaquin Council of Governments
 PRESS RELEASE San Joaquin Council of Governments For Immediate Release February 23, 2018 Contact: Nicole Gorham, 235-0582 gorham@sjcog.org SJCOG Board Awards $19.63 Million in Measure K Bicycle, Pedestrian,
BETHEL ROAD AND SEDGWICK ROAD CORRIDOR STUDY
 DRAFT PLAN City Council Meeting August 14, 2017 STUDY AREA Sedgwick Corridor State Route 160, principal arterial with Class 3 access management designation, commuter and freight route, connection to SR
Classification Criteria
 SCHEDULE D TO RECOMMENDED OFFICIAL PLAN AMENDMENT NO. 40 SCHEDULE C-4 Road Criteria Criteria Traffic Service Objective Land Service/Access Typical Daily Traffic Volume Flow characteristics Travel Speed
2018 AASHTO BIKE GUIDE
 2018 AASHTO BIKE GUIDE Your presenters Jessica Fields, PE Denver Office Director Sagar Onta, PE, PTOE Denver Engineering Director 35 years of combined experience street design, transportation planning,
City of Wayzata Comprehensive Plan 2030 Transportation Chapter: Appendix A
 A1. Functional Classification Table A-1 illustrates the Metropolitan Council s detailed criteria established for the functional classification of roadways within the Twin Cities Metropolitan Area. Table
WELCOME. Stakeholder Involvement Group Meeting #2 Round Lake Public Works October 24, 2018
 WELCOME Stakeholder Involvement Group Meeting #2 Round Lake Public Works October 24, 2018 MEETING AGENDA 1. Welcome and Introductions 2. Study Progress Update 3. Problem Statement 4. Technical Analysis
Active Transportation Facility Glossary
 Active Transportation Facility Glossary This document defines different active transportation facilities and suggests appropriate corridor types. Click on a facility type to jump to its definition. Bike
THE FUTURE OF THE TxDOT ROADWAY DESIGN MANUAL
 THE FUTURE OF THE TXDOT ROADWAY DESIGN MANUAL Kenneth Mora, P.E. (Design Division) 10/10/2017 Table of contents 1 2 Reduction in FHWA design controlling criteria Innovative Intersection Guidance 3-7 8-42
Southview Blvd & 3 rd Avenue Improvement Project. Public Open House December 4, to 7pm
 Southview Blvd & 3 rd Avenue Improvement Project Public Open House December 4, 2014 5 to 7pm Southview Blvd & 3 rd Avenue Public Information Meeting Agenda Presentation 5:30 to 6:15 pm Purpose of Project
Young Researchers Seminar 2011
 Young Researchers Seminar 2011 Young Researchers Seminar 2011 DTU, Denmark, 8 10 June, 2011 DTU, Denmark, June 8-10, 2011 Methods for assessing the pedestrian level of service: International experience
LTAP Fact Sheet. Abuzz word among transportation professionals. Kansas. Smarter, Safer Roadways: Road Diets for Rural Communities.
 Spring 2009 Kansas LTAP Fact Sheet A Service of Kansas University Transportation Center for Road, Street & Bridge Agencies Smarter, Safer Roadways: Road Diets for Rural Communities By Mehrdad Givechi,
FDOT Bicycle/Pedestrian Focused Initiative & Complete Streets
 Florida Department of TRANSPORTATION FDOT Bicycle/Pedestrian Focused Initiative & Complete Streets Billy L. Hattaway, PE District One Secretary Secretary s Pedestrian Safety Initiative Dangerous by Design
MOBILITY WORKSHOP. Joint City Council and Transportation Commission May 5, 2014
 MOBILITY WORKSHOP Joint City Council and Transportation Commission May 5, 2014 Review of General Plan M-1 Develop world-class transit system M-3 Maintain/enhance pedestrian-oriented City M-4 Create comprehensive
Updated Roundabout Analysis Methodology
 Updated Roundabout Analysis Methodology In 1998, the Transportation Planning Analysis Unit (TPAU) working as part of the Roundabout Task Group selected the interim roundabout methodologies of the SIDRA
Strategies for Making Multimodal Environments Safer. Kim Kolody Silverman, CH2M
 Strategies for Making Multimodal Environments Safer Kim Kolody Silverman, CH2M Kim.kolody@ch2m.com 800 Fatalities in Illinois: Rural versus Urban Fatalities 700 600 500 400 300 200 100 0 2004 2005 2006
Chapter 2: Standards for Access, Non-Motorized, and Transit
 Standards for Access, Non-Motorized, and Transit Chapter 2: Standards for Access, Non-Motorized, and Transit The Washtenaw County Access Management Plan was developed based on the analysis of existing
List of Exhibits...ii
 One Brickell Traffic Study TABLE OF CONTENTS List of Exhibits...ii EXECUTIVE SUMMARY...1 1. INTRODUCTION...2 1.1 Study Area...2 1.2 Study Objective...5 2. EXISTING TRAFFIC CONDITIONS...6 2.1 Data Collection...6
Executive Summary Route 30 Corridor Master Plan
 Route Corridor Master Plan Project Overview The Route Corridor Master Plan is a coordinated multimodal transportation and land use plan for the entire stretch of Route through East Whiteland Township,
REGIONAL BICYCLE AND PEDESTRIAN DESIGN GUIDELINES
 REGIONAL BICYCLE AND PEDESTRIAN DESIGN GUIDELINES November 16, 2011 Deb Humphreys North Central Texas Council of Governments Bicycle and Pedestrian Advisory Committee Snapshot of the Guide 1. Introduction
5.3 TRAFFIC, CIRCULATION AND PARKING
 5.3 TRAFFIC, CIRCULATION AND PARKING This section is based upon the Downtown Lancaster Specific Plan Traffic Impact Analysis (April 2, 2008) and the Downtown Lancaster Specific Plan Parking Analysis (May
Introduction Roundabouts are an increasingly popular alternative to traffic signals for intersection control in the United States. Roundabouts have a
 HIGH-CAPACITY ROUNDABOUT INTERSECTION ANALYSIS: GOING AROUND IN CIRCLES David Stanek, PE and Ronald T. Milam, AICP Abstract. Roundabouts have become increasingly popular in recent years as an innovative
PennDOT ICE Policy An Introduction
 PennDOT ICE Policy An Introduction January 2018 What is Intersection Control Evaluation (ICE)? Purpose: To consistently consider and screen among many proven combinations of geometry and traffic control
City of Elizabeth City Neighborhood Traffic Calming Policy and Guidelines
 City of Elizabeth City Neighborhood Traffic Calming Policy and Guidelines I. Purpose: The City of Elizabeth City is committed to ensure the overall safety and livability of residential neighborhoods. One
Florida s Intersection Safety Implementation Plan (ISIP)
") Florida Department of TRANSPORTATION Florida s Intersection Safety Implementation Plan (ISIP) Alan El-Urfali, PE State Traffic Engineering and Operations Office March 28, 2017 Intersection Safety Implementation
Florida Department of TRANSPORTATION Florida s Intersection Safety Implementation Plan (ISIP) Alan El-Urfali, PE State Traffic Engineering and Operations Office March 28, 2017 Intersection Safety Implementation
Planning Guidance in the 2012 AASHTO Bike Guide
 Planning Guidance in the 2012 AASHTO Bike Guide Presentation by: RJ Eldridge Peter Lagerwey August 22, 2012 WEBINAR 2: PLANNING GUIDANCE IN THE 2012 AASHTO BIKE GUIDE Today s Webinar Significant Updates
David DiPierro, John Amberson. Steering Committee Meeting #4 Overview
 IBI GROUP 18401 Von Karman Avenue Suite 110 Irvine CA 92612 USA tel 949 833 5588 fax 949 833 5511 ibigroup.com Memorandum To/Attention Steering Committee Members Date February 17, 2016 From IBI Group Project
Road Diets: Reconfiguring Streets for Multi-Modal Travel
 Road Diets: Reconfiguring Streets for Multi-Modal Travel Tom Grant, P.E., PTOE What is a Road Diet? Reconfiguration of travel lanes to benefit all roadway users (i.e., Complete Street) Reclaiming the space