Table of Contents. 1.0 Executive Summary Introduction Goals and Policies Existing Conditions... 11
|
|
|
- Dominick Dorsey
- 5 years ago
- Views:
Transcription
1
2 June 1996 Woodburn Transportation S ;m Plan Table of Contents Table of Contents 1.0 Executive Summary Transportation Plan 2.0 Introduction Goals and Policies Existing Conditions lntroduction 4.2 Transportation Facilities 4.3 Traffic Operations 5.0 Roadway System Alternatives Analysis Methodology 5.2 Travel Demand Model Development 5.3 Roadway System Evaluation Criteria 5.4 Description of Roadway System Alternatives 5.5 Evaluation of Alternatives 6.0 Transit System Alternatives Analysis Transit Demand 6.2 Major Activity Centers 6.3 lntracity Fixed-Route Bus Alternatives 6.4 lntracity Paratransit Service 6.5 Intercity Transit Service 7.0 Alternate Pedestrian/Bicycle/TDM Strategies lntroduction 7.2 Pedestrian Strategies 7.3 Bicycle Facilities 7.4 Transportation Demand Management 8.0 Highway 219/214 & 99E Access Management Analysis lntroduction 8.2 State Highway Access Management Plan Guidelines 8.3 ODOT/City of Woodburn Access Management Agreement 8.4 Methodology 8.5 Highway 219/214 Analysis 8.6 Highway 99E Analysis 9.0 Transportation System Plan lntroduction 9.2 Roadway Plan 9.3 Transit Plan 9.4 Pedestrian Facilities Plan 9.5 Bicycle Facilities Plan 9.6 Golf Cart Facilities Plan 9.7 Rail Facilities Plan 9.8 Air, Water, and Pipeline Transport Facilities Plan 9.9 Transportation Demand Management Plan 1 Kittelson & Associates. Inc. i
3 Table of Contents (continued) Woodbu, June 1996 ransportation System Plan Table of Contents (continued) 10.0 Transportation Financing Plan lntroduction 10.2 Existing Transportation Funding in Woodburn 10.3 Summary Of Outlook For Existing Transportation Funding Sources 10.4 Cost Estimates for Transportation System lmprovements 10.5 Financing Needed Transportation lmprovements 11.0 Land Use Ordinance Modifications lntroduction 11.2 Requirements of the Transportation Planning Rule 11.3 Suitability of Existing Ordinances 11.4 Recommendations - General Issues 11.5 Recommendations - Protection of Transportation Facilities, Corridors, and Sites 11.6 Recommendations - Land Use And Subdivision Regulations 11.7 Recommendations-Other Modes 12.0 Compatibility with State Transportation Planning Rule & Other Policies State Transportation Planning Rule 12.2 ODOT Bypass and Major Improvement Planning Policy Appendix A Level of Service Analysis Concepts Appendix B Travel Demand Model Appendix C Year 2015 Traffic Flow Maps - Roadway System Alternatives Appendix D Year 2015 Ramp/lntersection Volumes Interchange Alternatives Appendix E Proposed Woodburn PladOrdinance Text Modifications Kittelson & Associates, Inc.
4 June 1996 Woodburn Transportation S- :m plan List of Figures List of Figures Figure 1 Figure 2 Figure 3 Figure 4 Figure 5 Figure 6 Figure 7 Figure 8 Figure 9 Figure 10 Figure 11 Figure 12 Figure 13 Figure 14 Figure 15 Figure 16 Figure 17 Figure 18 Figure 19 Figure 20 Figure 21 Existing Functional Classification Plan Existing Pedestrian and Bicycle Facilities Existing Transit System (Fixed-Route) Woodburn Transit System Ridership Trends (FY July 1. June 30)... Woodburn Paratransit System Ridership trends (FY July 1. June 30) ExistingRailserviceRoadwayGradeCrossings Existing lntersection Traffic Control/Channelization Recent 24-Hour Traffic Counts Existing lntersection Weekday PM Peak hour Volumes Existing lntersection Levels of Service (Weekday PM Peak Hour).. High Accident Locations ( ) Road Alt. #1: 1-5 Split Diamond Interchange with South Arterial Road Alt. #2: Second 1-5 Interchange with South Arterial Road Alt. #3: Improve Existing 1-5 lnterchange & Hwy 214/South Arterial with 1-5 Overpass Weekday P.M. Peak Hour Level of Congestion. No-Build Alternative 2015 Weekday P.M. Peak Hour Level of Congestion. Road Alt. #I. 1-5 Split Diamond lnterchange Weekday P.M. Peak Hour Level of Congestion. Road Att. #2 Second 1-5 lnterchange with South Arterial Weekday P.M. Peak Hour Level of Congestion. Road Alt. #3 I mprove Existing 1-5 lnterchange Population Distribution Major Activity Centers Fixed-Route Bus Alt. #1: Increase Frequency on Existing Route (One Way) Figure 22 Fixed-Route Bus Alt. #2: Single Route with Two-way Operation.. ~ Figure 23 Figure 24 Fixed-Route Bus Alt. #3: Two Routes with One-way Operation.... Fixed-Route Bus Alt. #4: Two routes with Two-way Operation.... Kittelson & Associates. lnc.
5 List of Figures (continued) Woodbut June 1996,'ansportation System Plan List of Figures (continued) Figure 25 Figure 26 Figure 27 Figure 28 Figure 29 Figure 30 Figure 31 Figure 32 Figure 33 Figure 34 Figure 35 Access Management Study Corridors Highway 219/214 Existing Access- West City Limits to Oregon Way.. 69 Highway 214 Existing Access- Oregon Way to Settlemier Ave./ Boones Ferry Rd , Highway 99E Existing Access - Lincoln Street to South City Limits Street Functional Classification Plan Street Typical Cross Sections Example of Crossover Easement & Conditional Access Policy/Process. 95 Public Transportation Plan Pedestrian Facility Plan Bicycle Facility Plan Golf Cart Facility Plan List of Tables Table 1 Table 2 Table 3 Table 4 Table 5 Table 6 Table 7 Table 8 Table 9 Table 10 Table 11 Existing Street Functional Classification Standards Year 2015 Average Weekday Traffic for Roadway System Alternatives.. 33 summary of Traffic Operations Performance Measures Summary of Level of Service Analysis Southbound 1-5 Freeway Operation Weekday PM Peak Hour Interchange Ramp Terminal Operation Weekday PM Peak Hour 41 Summary of Land Use/Environmental/Cost Impacts Comparison of lntracity Fixed- Route Bus Alternatives ComparisonoflntercityShuttleBusAlternatives Comparison of Transportation Demand Management Strategies Oregon State Highway Access Management Classification System iv Kittelson & Associates, Inc.
6 June 1996 Woodburn Transportation S. :m Plan List of Tables (cont.) List of Tables (cont.) Table 12 Table 13 Table 14 Table 15 Table 16 Table 17 Table 18 Table 19 Table 20 Table 21 Table 22 Table 23 Driveway Spacing Summary Road-Related Funding in Woodburn Transit Funding in Woodburn Proposed Transportation Improvements: Next 5 Years Proposed Transportation Improvements: Next 6-10 Years Proposed Transportation Improvements: Next Years Proposed Transportation Improvements: Next 214 Years. 116 Summary of Transportation Funding Programs: Federal Sources Summary of Transportation Funding Programs: State Sources Summary of Transportation Funding Programs: Local Sources. 124 Evaluation of Woodburn TSP With State Transportation Planning Rule. 138 Evaluation of Woodburn TSP With ODOT Bypass/Major Improvement Planning Policy Kittelson & Associates. Inc. 1

7 Section 1 Executive Summary
8 June 1996 Woodburn Transporlation System Plan 1.0 Executive Summary 1.0 Executive Summary Using a combination of funds from the Oregon Department of Transportation (ODOT) Transportation & Growth Management Program and the City of Woodburn, the City in sponsored the development of an updated Woodburn Transportation System Plan. The plan has a planning horizon to the year 2015, and represents for the first time a comprehensive, multi-modal transportation plan to guide transportation investment in the City over the next 20 years. As an input into the plan, an assessment of existing conditions was conducted, as well as an assessment of highway and transit system alternatives, and potential financing mechanisms. To aid the alternatives analysis and plan development, an updated year 2015 traffic forecasting model was developed, using year 2015 population and employment projections. The highway system alternatives analysis, in addition to a no-build alternative, focused on an assessment of three 1-5 access alternatives: 1. develop a split diamond interchange; 2. develop a second interchange at Butteville Road; and 3. improve the existing interchange, including an option to convert to a partial cloverleaf configuration. Included in all three "build" alternatives was the development of the South Arterial from Highway 214 on the west to Highway 99E on the east, as well as improvements to other minor arterials and collectors on the City street system. The alternatives analysis included an assessment of different intracity and intercity bus service configurations to serve Woodburn. Improvements to the existing single fixed-route, one-way bus service in the city were assessed, including making the route two-way, increasing the service frequency, and/or establishing separate east and west side bus routes. Intercity shuttle bus service transportation plan options from Woodburn to Portland and Salem were also examined. Finally, alternate pedestrian and bicycle facility and Transportation Demand Management (TDM) strategies were evaluated to further reduce vehicle trip marking in Woodburn. Transportation Plan The final Transportation System Plan includes recommended facilities, standards, and improvements for the following modes of transportation: 1. roadway; 2. transit; 3. pedestrian; 4. bicycle; 5. golf cart; and 6. rail. - Kittelson & Associates, Inc.
9 1.0 Executive Summary June 7996 Woodburn Transportation System Plan Roadway There are four critical elements to the roadway plan. The first is the designation of an 1-5 interchange improvement, the specific configuration to be identified in a future Refinement Plan. The second is the development of a South Arterial facility between Highways 219 and 99E. The third is the reclassification of the collector street system into two categories: service collector and access street. Several streets are identified for minor widening to provide bike lanes and sidewalk treatments in the future. The fourth is the identification of potential local street connections within and between neighborhood areas. Transit The transit plan proposes initially converting the existing intercity bus route to two-way operation, with possible improvement in service frequency over time to 30 minutes, at least during weekday peak periods. Intercity shuttle bus service to downtown Portland (with an intermediate stop at the Tualatin park-n-ride), and to downtown Salem is also proposed. In the longer-term, a downtown transportation center should be considered if an intercity passenger rail stop is developed, and/or there is sufficient transit demand to warrant both east and west side routes. The existing paratransit and taxi services in the City are recommended to be maintained as well. A more detailed Transit Development Program study is recommended to detail specific operating strategies and associated maintenance and capital requirements and funding sources. Pedestrian The pedestrian facility plan identifies providing sidewalks on all arterial and collector streets in Woodburn in the future. The plan also shows the development of an off-street pathways system along the Mill Creek and Goose Creek corridors. Bicycle The bicycle facility plan calls for an expansion of the existing system of bike lanes on City streets into a comprehensive system of bike routes and lanes. All arterials and service collectors are identified bike routes, with bike lanes desired where physically possible. The off-street pathways plan would include bike trails either combined or separated from pedestrian trails. Golf Carts To improve accessibility of golf cart users to central Woodburn, certain streets between Senior Estates and downtown Woodburn would be designated for golf cart use, using widened shoulder areas which would also be used by bicycles. Golf carts would also be allowed on certain segments of the off-street pathways system, combined with bicycle use where allowed. Rail The rail plan recognizes the continued presence of the Southern Pacific Railroad through Woodburn, including spur tracks serving local businesses. All existing at-grade railroadlhigh- Kittelson & Associates, Inc. --
10 June 1996 Woodburn Transportation System Plan 1.0 Executive Summary way crossings are proposed to be maintained. In the longer-term, improvements to trackage and crossings could occur if intercity passenger rail service were implemented, with a possible stop in Woodburn. A 20-year program for transportation improvements in Woodburn is an integral part of the TSP. Improvements needed in the 0-5, 5-10, 10-20, and 20+ year time frame have been identified. The current estimated cost of all identified improvements (in 1995 dollars) is about $62 million. Over $20 million of this is in the construction of an 1-5 interchange improvement and the South Arterial. Potential funding sources include federal funding through the Intermodal Surface Transportation Efficiency Act (ISTEA), state gas and lottery funds, and local gas tax, traffic impact fee, bonding revenues, developer participation and other funding sources that may be developed during the effective time of the plan. Kittelson & Associates, Inc. 3
11 Section 2 Introduction
12 June 1996 Woodburn Transportation System Plan 2.0 Introduction 2.0 Introduction In April 1991, the Land Conservation and Development Commission (LCDC), with the concurrence of the Oregon Department of Transportation (ODOT), adopted the Transportation Planning Rule (TPR), OAR 660 Division 12. The TPR requires local jurisdictions to prepare and adopt a Transportation System Plan (TSP) by May The Transportation Planning Rule requires ODOT, Metropolitan Planning Organizations, and each county and city to prepare and adopt a transportation system plan (TSP) and implementing regulations (OAR ). For a city with the population of the City of Woodburn, the TSP must include: 1. determination of transportation needs, 2. road plan for arterials and collectors, 3. public transportation plan, 4. bicycle and pedestrian plan, 5. air, rail, water and pipeline transportation plan, 6. policies and land use regulations for implementing the TSP as provided in OAR , 7. transportation financing plan, and 8. ordinances to assure coordinated planning of transportation facilities. With a partial grant from the Oregon Department of Transportation, the City of Woodburn initiated its transportation system plan in November of As part of this process the City's Transportation Task Force (which previously existed), City Staff, ODOT, and Marion County provided guidance and review of preliminary products in the development of this plan. In addition three public open houses were held. The purpose of these open houses was to ensure that the recommended transportation system plan would reflect the local needs of the citizens of Woodburn. The development of the Woodburn Transportation System Plan began with the Transportation Task Force, Woodburn, ODOT, and Marion County staff working together to develop the transportation system plan goals and objectives which are presented in Section 3. The transportation analysis began in Section 4 with an assessment of existing traffic conditions and operations in the city of Woodburn. In this section of the document, among other issues, existing average daily traffic, traffic operations at key intersections, transit, pedestrian and bicycle routes are summarized. To determine transportation needs in the future, a travel demand model was developed which forecasted year 2015 weekday PM peak hour traffic volumes. In Section 5 these forecast volumes were analysed on alternative roadway transportation system improvements. The results of this analysis indicated which alternatives would provide for the best traffic operations in the future. Kittelson & Associates. Inc. 5
13 2.0 Introduction June 1996 Woodburn Transporlation System Plan Section 6 presents options for improving the public transportation system in Woodburn, including both intra city ind inter city bus service improvements. Section 7 presents options for improving pedestrian and bicycle facilities in Woodburn, as well as Transportation Demand Management strategies. Section 8 presents the results of the access management analysis performed on Highway 2 14 between Woodland Road and Settlemier Avenue, and on Highway 99E between Lincoln Street and the south city limits. In this analysis, public road, traffic signal and private access spacing was analyzed to determine the need for consolidating access in order to develop safer, more efficient State highways through Woodburn. The next step, as summarized in Section 9, involved the development of the individual elements of the Woodburn Transportation System Plan. Included are the highway plan, transit plan, pedestrianhicycle facility plans, golf cart facility plan, and a TDM plan. In Section 10 the transportation finance plan is developed. This plan identifies alternatives available to the City of Woodburn to fund transportation system improvements which would provide adequate capacity and access for all users of the Woodburn transportation system. In Section 11, land use ordinances necessary to facilitate implementation of the Transportation System Plan are summarized. This document concludes with Section 12 which lists the requirements and recommendations of the Oregon Transportation Planning Rule (OAR 660 Division 12) and outlines how the Woodburn Transportation System Plan complies with the TPR. This project is partially funded by a grant from the Transportation and Growth Management (TGM) Program, a joint program of the Oregon Department of Transportation and the Oregon Department of Land Conservation and Development. TGM grants rely on federal Intermodal Surface Transportation Efficiency Act and Oregon Lottery Funds. The contents of this document do not necessarily reflect views or policies of the State of Oregon. 6 Kittelson & Associates. Inc.
14 Section 3 Goals and Policies
15 June 1996 Woodburn Transportation System Plan 3.0 Goals and Policies 3.0 Goals and Policies The Woodburn Transportation Task Force in concert with City of Woodburn staff developed five principal goals (and associated policies) which guided the development and implementation of the Transportation System Plan. These goals are identified below: Goal 1 Develop a multi-modal transportation system that avoids or reduces a reliance upon one form of transportation, and minimizes energy consumption and air quality impacts. Policies Develop an expanded intracity bus transit system which will provide added service and route coverage to improve the mobility and accessibility of the transportation disadvantaged, and to attract traditional auto users to use the system. Develop a plan for providing travel options between Woodburn and Portland and/or Salem, including intercity bus service and potential bus/carpool park-n-ride facilities. Develop a plan for accommodating golf cart travel in Senior Estates, Tukwila, and other new golf course residential communities and for connectivity between residential and commercial areas in the Woodburn area. Develop a bikeway system which will provide routes and facilities to allow bicyclists to travel from residential areas to schools, parks, places of employment and commercial areas. Off-street facilities in City greenway/park areas will be identified. Insure all new collector and arterial streets are constructed with bike lanes. Identify sidewalk and off-street pathway improvements to improve pedestrian mobility within neighborhoods and between residential areas and schools, parks, places of employment and commercial areas. Insure all new collector and arterial streets are constructed with sidewalks. Goal 2 Develop a street system which will handle projected year 2015 traffic demands in the Woodburn area, and interconnects residential areas with employment centers, schools, parks, churches and regional transportation facilities. Policies 1. Develop an updated roadway functional classification plan for the Woodburn area, that reflects the desired function of different roadways, and is consistent with current federal guidelines for the designation of major streets in an urban area. Kittelson & Associates, lnc. 7
16 3.0 Goals and Policies June 1996 Woodburn Transportation System Plan Develop a strategy for providing improved access to 1-5 from the Woodburn area, through either improvements to the existing Highway 214 interchange andlor a new interchange in the Woodburn vicinity (with supporting local roadway improvements). This strategy will be developed following a refinement study as outlined in the Transportation Planning Rule. Develop a strategy for improving Highways ,211, and 99E through Woodburn, including added travel lanes, signalization, and access management. Identify new east-west and north-south collectorlminor arterial streets within the City to relieve traffic demands on Highways , 2 1 1, and 99E. Develop updated street design standards for arterials, collectors, and local streets. Identify a final strategy for paving current unimproved streets in the City. Identify the need for added public parking provisions in Woodburn, including park and ride, as well as a plan to support increased carpooling and transit use in the future. Develop a capital improvement program that will fulfill the transportation goals established by the community. Goal 3 Develop transportation improvements that will improve overall traffic safety in the Woodburn area. Policies 1. Develop access management strategies for Highways , 2 11 and 99E through Woodburn, particularly focusing on the section of Highway 214 between 1-5 and Cascade Drive, and Highway 99E south of Lincoln Avenue. 2. Develop a plan for improving pedestrian and bicycle safety for travel tolfrom local schools. 3. Identify streetlrailroad crossings in need of improvement, and those that should be closed or relocated. 4. Develop a plan for designated truck routes through the City, and a plan to handle truck and rail hazardous cargoes. Goal 4 Develop a set of reliable funding sources that can be applied to fund future transportation improvements in the Woodburn area. Policies 1. Evaluate the feasibility of the full range of funding mechansims for transportation improvements. 8 Kittelson & Associates, Inc.
17 June 1996 Woodburn Transportation System Plan 3.0 Goals and Policies 2. Evaluate the feasibility of instituting an added City gas tax for transportation improvements. 3. Identify a traffic impact fee structure associated with new developments in the Woodburn area to fund transportation improvements. Goal 5 Develop amendments to City land use standards and ordinances to reduce travel demand and promote use of modes of transportation other than the automobile. Policies 1. Identify changes in the Woodburn Zoning Ordinance to encourage implementation of Transportation Demand Management (TDM) strategies by local businesses. TDM strategies should include bicycle and carpool parking provisions, and allowable overall parking reductions for employer institution of TDM strategies, including transit fare subsidies, carpool matching programs, and flexible work hours. 2. Identify changes in the Woodburn Zoning ordinance to encourage transit and pedestrian-oriented development. This includes proper building orientation to improve access for transit users and patrons, direct pedestrian connections, and bus stop provisions where appropriate. 3. Identify changes in the Woodburn Subdivision Standards to encourage neo-traditional development patterns and adequate local street standards to accommodate all modes of transportation. 4. Adopt traffic impact analysis guidelines to be used by the City and developers to identify the impact of new development on street system improvement needs. Kittelson & Associates, lnc.

18 Section 4 Existina Conditions
19 June 1996 Woodburn Transportation System Plan 4.0 Existing Conditions 4.0 Existing Conditions 4.1 Introduction This section of the Woodburn Transportation System Plan provides a summary of existing transportation conditions within the Woodburn Urban Growth Boundary. The section is divided into two categories: transportation facilities, and traffic operations. The transportation facilities section summarizes the existing: street functional classification system; pedestrian and bicycle facilities; rail servicelroadway grade crossings; air transport facilities; and water transport facilities. In the existing traffic operations section, the principal issues are: intersection traffic control and lane configuration; recent 24-hour traffic counts; intersection PM peak hour traffic volumes; intersection PM peak hour traffic level of service; and high accident locations. 4.2 Transportation Facilities Functional Classification The 1985 Woodburn Transportation Plan identifies five categories of road facilities. Those categories are: freeway, principal arterial, minor arterial, collector, and local street. The adopted functional classification plan is shown in Figure 1, and the roadway standards are summarized in Table 1. Kittelson & Associates. Inc. 11

20 LEGEND - aaaoa FREEWAY ~IBPWPI MINOR ARTERIAL MAJOR ARTERIAL ~.rr ; COLLECTOR I STREET FUNCTIONAL CLASSIFICATION PLAN CIN OF WOODBURN TRANSPORTATION SYSTEM PLAN JUNE 1996
21 June 1996 Woodburn Transportation System Plan 4.0 Existing Conditions Table 1 Existing Street Functional Classification Standards Freeway Principal Arterial I Minor Arterial ,000 / 9.8 I /lane 12lIane >30,000 >10, Pedestrian and Bicycle Facilities Figure 2 shows the location of pedestrian and bicycle facilities, and their relationship to major activity centers. Overall, the existing pedestrian and bicycle facility system is deficient due to lack of connectivity and incompleteness (particularly the overall lack of off-street pathways and bike routes). The majority of the sidewalks in Woodburn are provided on local streets. With the exception of Senior Estates (north and south of Highway 214) sidewalks are provided in most of the residential areas and also in downtown Woodburn. Similarly, sidewalks are provided on the principal and minor arterials in Woodburn, although in many locations on only one side of the street. There are also sidewalks on Highway 214 between Interstate 5 and Meridian Drive, and from Progress Way through Highway 99E. In addition, there are sidewalks on Highway 99E from the northern city limits south to Lincoln Street. Finally, there are sidewalks on Settlemier Avenue from Garfield Street to Parr Road. There are very few off-street pathways. Figure 2 also shows the location of existing bike routes within the City of Woodburn. As shown in this figure, there are three designated bike routes within the City: Highway 214 between Settlemier Avenue and Highway 99E; Highway 99E between the northern City limits, and Lincoln Road; and West Hayes Street from Nellie Muir School to Settlemier Avenue. There are no current off-street bicycle facilities in Woodburn. Kittelson & Associates, Inc. 13

22 /I \ LEGEND 1 6 = RECREATION * = DOWNTOWN l " ' ; p = RETAIL - 1 = GOLF COURSE I :TH CURBS 63 = SCHOOL = EMPLOYMENT NODES 0 = GOVERNMENT CENTER
 CIN OF WOODBURN TRANSPORTATION SYSTEM PLAN")
23 L I/ / * 0 = RECREATION = DOWNTOWN * DIRECTION OF TRAVEL e = SCHOOL = EMPLOYMENT NODES 0 = RETAIL 0 = GOVERNMENT SCHEDULE TlYE POINTS LEGEND 8 = GOLF COURSE JUNE 1996 lb EXISTING TRANSIT SERVICE (FIXED- ROUTE) CIN OF WOODBURN TRANSPORTATION SYSTEM PLAN 1373FBUS
24 June Existing Conditions Woodburn Transportation System Plan Woodburn Transit and Paratransit System The City of Woodbum operates two transit systems: one is a single, fixed route system called the Woodbum Transit System; the other, the Woodburn Paratransit System, is a dial-a-ride system. The Woodburn Transit System operates from 9:00 AM to 5:00 PM Monday through ~rida~l. Figure 3 shows the 15.3 mile fixed-route of the Woodbum Transit System. As shown in the figure, there are thirteen scheduled time points on this system. That is, there are thirteen locations where patrons can expect the bus to be at scheduled times. These locations are identified in Figure 3. Besides these locations, the bus will stop anywhere that it is safe to pick up or drop off passengers. In 1994, the adult fare was 75 cents, and children under the age of six could ride for free when accompanied by an adult. As shown in Figure 4, the peak transit patronage for the Woodburn Transit System occurred in fiscal year (FY) 1985 (July 1 - June 30), most likely due to the introduction of Saturday service. From FY 1986 to FY 1992 patronage declined. Since 1992 transit patronage has been increasing. In 1994, approximately 28,000 people rode the Woodburn Transit System. There are three part time drivers for the Woodburn Transit System, and the City owns two buses. The primary bus is a 1993 El Dorado 22-passenger bus which is lift equipped. The backup bus, which operates when the primary bus needs maintenance, is a 1987 Champion 23-passenger bus which is also lift equipped. In fiscal year , the City budgeted $130,525 for total operating expenses. The Woodbum Paratransit System provides transportation for disabled persons who can not utilize the fixed route system. The City owns one van which operates Tuesday, Thursday and Friday from 9:00 AM to 5:00 PM. The service provides door-to-door transportation; reservations must be made 24 hours in advance. There is a $2 charge for each round trip. As shown in Figure 5, transit patronage on the Woodbum Paratransit System has increased since FY In FY 1994, approximately 3,400 people used the Woodbum Paratransit System. The City also sponsors a free volunteer driver service to transport elderly and disabled citizens from their homes to medical appointments in Woodburn, Salem, and Portland. The volunteers use their own vehicles. The City provides support through municipal tax dollars, personnel, office space and other materials. Donations are a main source of program funding. In addition to the City-operated paratransit service, the privately-owned Woodburn Taxi company operates within a 100 mile radius of Woodburn. This service, which is seven years old, carries about 500 passengers per month, comprised primarily of Senior Citizens and the Hispanic population in the City. A lot of the trips are out-of-town, including trips to Portland Airport. One vehicle is used to provide the service. The operating hours for the service are 7 AM to 6 PM Monday through Saturday. The fare is an initial $2.40 at the start of a trip, plus $1.50 per mile thereafter. If the service is maintained over the long-term, the owners are contemplating expanding the service into the Canby area. 1 Saturday service was provided between 1985 and Kittelson & Associates, Inc.
25 Rou1.e Service. Salurday Service was incl~lded 19U5- -1'390 ITiscal Year Iznding WOODBURN TRANSIT SYSTEM RIDERSHIP TRENDS (fy JULY 1 -JUNE 30) CITY OF WOODBURN TRANSPORTATION SYSTEM PLAN JUNE 1996
26 Fiscal Year Ending [* Door - to - Door service; provided 1 three days per week. 1 WOODBURN PARATRANSIT SYSTEM RIDERSHIP TRENDS (FY JULY I-JUNE 30) CIN OF WOODBURN TRANSPORTATION SYSTEM PLAN JUNE 1996
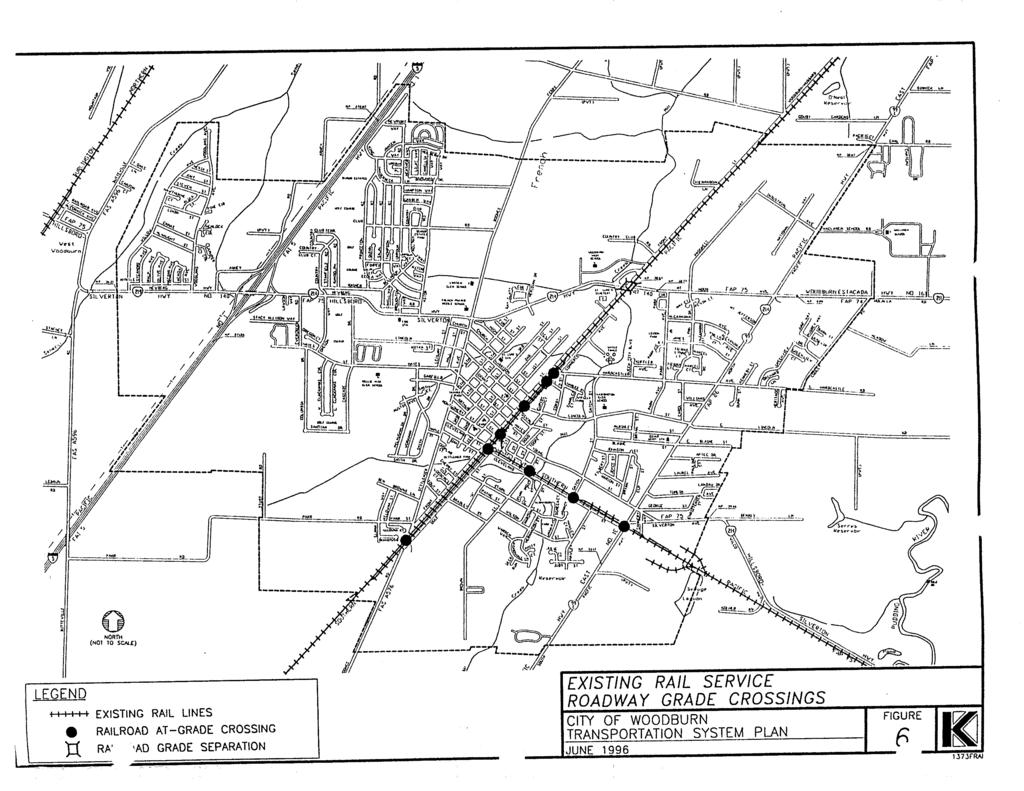
27 June 1996 Woodburn Transportation System Plan 4.0 Existing Conditions Rail Service/Roadway Grade Crossings Figure 6 shows that there are nine at-grade railway crossings of the Southern Pacific Line in Woodburn. Freight trains run principally on the tracks along Front Street, with local businesses being served by the spur lines along Cleveland Street. There are no passenger train stops in the City. In 1994, freight trains traveled through the City of Woodburn on average 25 times per day. The maximum allowable speed of freight trains within Woodburn is 45 miles per hour. Outside of the city limits trains can travel up to 70 miles per hour Air Transport Facilities There are no air transport facilities within the Woodburn Urban Growth Boundary Pipeline Transport Facilities There are no pipline transport facilities within the Woodburn Urban Growth Boundary Water Transport Facilities There are no water transport facilities within the Woodburn Urban Growth Boundary. 4.3 Traffic Operations Intersection Traffic Control and Lane Channelization Figure 7 shows the existing intersection traffic control and lane channelization for the major intersections within the City of Woodburn. As shown in this map, of the eleven major intersections, eight are controlled with a traffic signal. Only the intersections of Highway 214lNorthbound 1-5 Ramps, Parr RoadISettlemier Avenue and Front Street/Settlemier Avenue are controlled with stop signs Hour Traffic Counts Figure 8 shows the recent 24-hour traffic counts in woodburn3. This traffic is called average daily traffic (ADT). As shown in this map, ADT in the City of Woodburn is highest on Interstate 5, Highway 214 east of 1-5, and Highway E south of Highway 211. Traffic volumes are also relatively high on Highway 214 from 1-5 west to Willow Avenue, Settlemier Avenue from Highway 214 south to West Hayes Street, and on Young Street from Highway E to Front Street. I 2 Source: Southern Pacific Rallroad 3 Source: City of Woodburn Kittelson & Associates, Inc. 19
28
29 0 (wr " Pom~ \ tv TRAFFIC SIGNAL EXISTING INTERSECTION TRAFFIC CONTROL/CHA NNELIZATION CITf OF WOODBURN TRANSPORTATION SYSTEM PLAN JUNE ~~

30 RECENT WEEKDAY 24-HOUR TRAFFIC COUNTS (7 99 7) CITY OF WOODBURN TRANSPORTATION SYSTEM PLAN JUNE FN
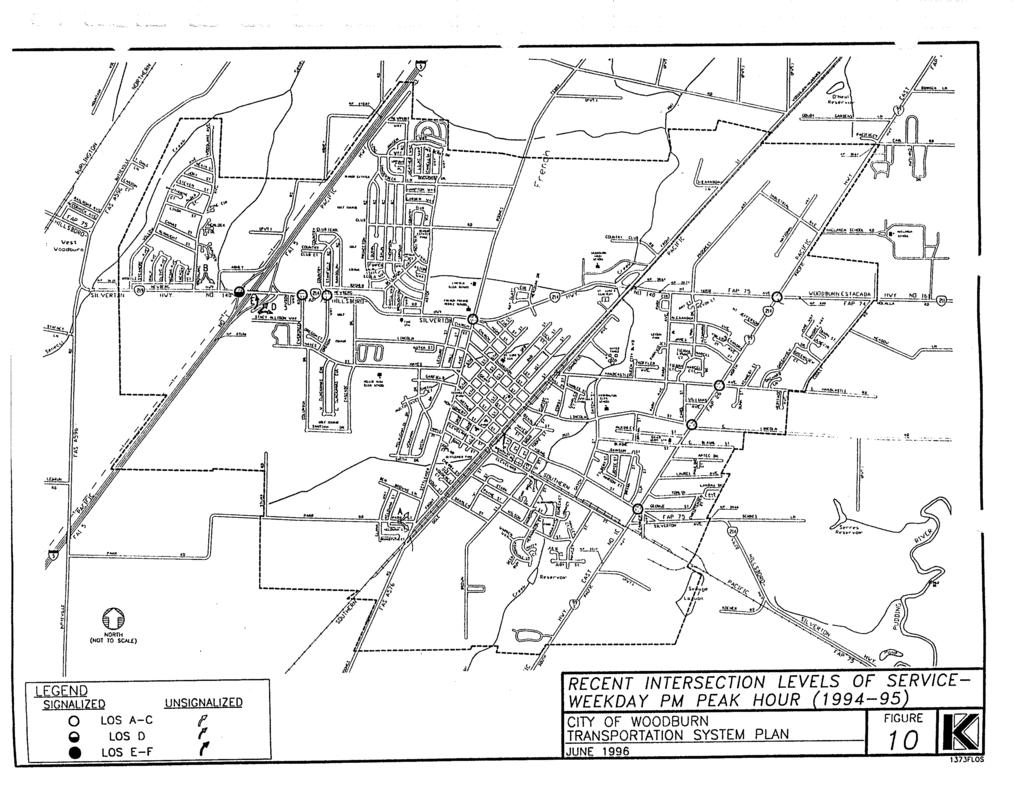
31 June 1996 Woodburn Transportation System Plan 4.0 Existing Conditions lntersection PM peak Hour Traffic Volumes Traffic counts were obtained from ODOT and from a private traffic survey firm during a typical weekday PM peak hour. The traffic count by ODOT was performed in August of 1994, and the traffic count by the private traffic survey firm was performed in January of This data is summarized in Figure 9. This data will be used in coordination with the intersection traffic control and lane channelization information to calculate traffic level of service lntersection Levels of Service (Weekday PM Peak Hour) Traffic level of service (LOS) is measured on a scale of LOS A to LOS F. At intersections, LOS A means that drivers experience no delay or relatively low amounts of delay while traveling through the intersection; while LOS F means that drivers experience a great deal of delay while traveling through the intersection. Appendix A presents a detailed review of intersection traffic level of service concepts. The LOS analysis performed for this study for the typical weekday PM peak hour revealed that traffic operations at the major intersections in Woodburn are generally acceptable (See Figure 10). All of the major study intersections operate at LOS C or better except for the Highway interchange. At this interchange, the intersection of the northbound 1-5 ramps with Highway 214 operates at LOS E for motorists turning left from the off-ramp onto westbound Highway 214, and operates at LOS D for motorists turning right from the off-ramp onto eastbound Highway 214. Also, during the PM peak hours, vehicle queues can form at the intersections of southbound 1-5 ramps1highway 214, northbound 1-5 ramps1highway 214, Highway 214Evergreen Road, Highway 214lCountry Club Road, and Highway 21410regon Way High Accident Locations Figure 11 summarizes the incidence of accidents at the major Woodburn intersections over the following three years: 1992, 1993, and As shown on this map, and as expected, the most accidents occur at the highest volume intersections: Highway El2 1 1 ; Highway 99EIYoung Street; and Interstate 51Highway 214. Other high accident locations include the intersections of Highway 214lSettlemier Avenue, Front StreetIHighway 214, and Young StreetIFront Street. Again, these are also locations with relatively high traffic volumes. Kittelson & Associates, Inc. 23
32
33

34 ( ) CIN OF WOODBURN TRANSPORTATION SYSTEM PLAN JUNE FA
35 Section 5 Roadway System Alternatives Analysis
36 June 1996 Woodburn Transportation System Plan 5.0 Roadway System Alternatives Analysis Roadway System Alternatives Analysis 5.1 Methodology In this phase of the transportation system plan development, future travel demand (year 2015) was tested on four different roadway systems. The analysis period was the weekday PM peak hour. To forecast future travel patterns, a year 2015 weekday PM peak hour travel demand model was developed and future traffic volumes were assigned to each of the roadway system alternatives (described below). Following the assignment, an operations analysis was performed to evaluate the effectiveness of each of the alternative roadway improvement systems. This analysis is summarized below. 5.2 Travel Demand Model Development As part of the roadway systems analysis, a year 2015 EMME12 travel demand model was developed (see Appendix B for a description of the travel demand model). This model reflects future population and employment projections as provided by the City of Woodburn Community Development Department and was used to forecast future weekday PM peak hour traffic volumes. By the year 2015, it is anticipated that the population of Woodburn will grow from the current 15,000 to about 30,000. It is also projected that employment will grow from the current 5,000 employees to 14,000 employees. The population and employment projections include some development areas outside the existing Woodburn Urban Growth Boundary (UGB) with the expectation that the UGB will need to be expanded before year 2015 to handle anticipated growth. 5.3 Roadway System Evaluation Criteria Several, evaluation criteria for the roadway system alternatives analysis were established: Traffic Operations Average Daily Traffic (ADT), which is the forecast 24 hour traffic volume at a specific location on a given road. The model forecasts ADT for all roads on the network. With ADT, it is possible to compare 24 hour traffic volumes on the same road under different transportation alternatives. Daily Vehicle Miles Traveled (VMT), which is the forecast total number of vehicle miles traveled on the road system over a 24 hour period. For example, if the model forecasts that over a 24 hour period, 1,000 vehicles will travel on the road system and there are 20 miles of roads, the VMT is equal to 20,000 (1000 multiplied by 20). The lower the VMT the better, as this implies people do not have to travel as far for different trip purposes and thus less fuel is consumed and less pollution is created. Daily Vehicle Hours of Travel (VHT), which is the forecast number of hours that people spend traveling from their trip origin to their destination and back. For example, if, over a 24 hour period, there are 1,000 vehicles traveling on the road system and the model shows that it would take on average 30 hours for one vehicle to travel from its origin to its destination and back. the forecast VHT is equal to 30,000 (1,000 multiplied Kittelson & Associates, Inc
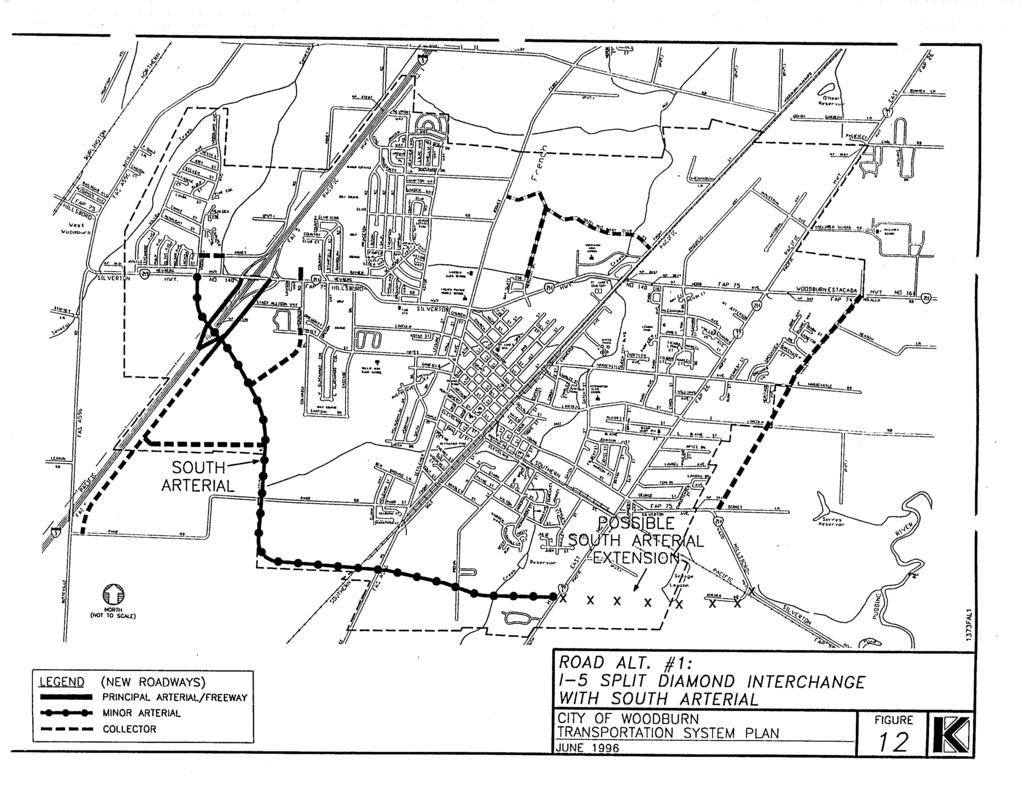
37 5.0 Roadway System Alternatives Analysis June 1996 Woodburn Transportation System Plan by 30). VHT is a measure of system wide road congestion. The higher the VHT, the more congestion there is, as it takes vehicles longer to travel from their origins to their destinations. Lane Miles Over Capacity, which is the forecast number of lane miles operating over capacity. For example, if there is one four lane segment of road operating over capacity and that section of road is two miles long, the forecast lane miles over capacity is eight (two lane miles over capacity multiplied by four lanes). The fewer lane miles over capacity the less road congestion exists on the network. In addition, on a microscopic level, the intersection traffic operations were evaluated based on a forecast weekday PM peak traffic level of service analysis. Land Use Impact The general land use impact of each alternative reflects the impact of roadway improvements to guide the location of and serve added development in the Woodburn area in the future. Critical to this analysis was the ability to develop roadway improvements within the existing Woodburn Urban Growth Boundary. This impact assessment also addressed right-of-way acquisition needs. Environmental Impact The general environmental impact of each roadway system alternative involves an assessment of how roadway improvements might impact environmentally sensitive areas, such as wetland and habitat areas. Cost The general cost of constructing the major roadway system improvements in each alternative was identified. The cost estimates are very conceptual and are based on assumed costs per mile for different types of facility improvements. Cost estimates are in 1995 dollars. 5.4 Description of Roadway System Alternatives Traffic operations under four roadway alternatives were evaluated. These alternatives are: No-Build Alternative: In this alternative future traffic volumes are assigned to the existing roadway system. No substantial roadway improvements would be made. Alternative #1: 1-5 Split Diamond Interchange with South Arterial The major features of this alternative, shown in Figure 12, include converting the existing I-5IHighway 2 14 interchange to a split diamond interchange, extending Woodland Road south to connect with the south end of the new split diamond interchange, constructing a South Arterial to connect with the new interchange, and developing a frontage road on the east side of Interstate Kittelson & Associates, lnc.
38
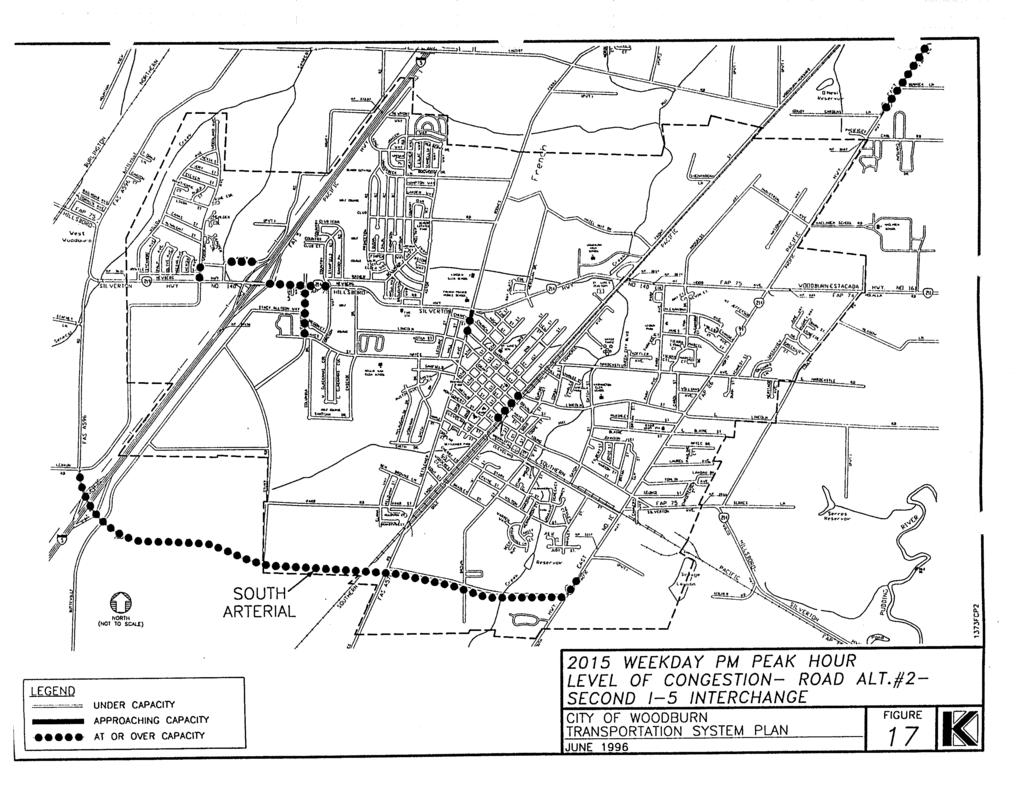
39 June Roadway System Alternatives Analysis Woodburn Transporlation System Plan Also shown in Figure 12 is an alternative to extend the South Arterial east of Highway 99E to connect with Highway 214. Alternative #2: Second 1-5 lnterchange with South Arterial In this alternative, shown in Figure 13, a new Interstate 5 interchange would be constructed south of the existing Urban Growth Boundary just north of the existing Butteville Road over-crossing, with a South Arterial developed as an extension of Butteville Road to the east to connect with Highway 99E. Also in this alternative Woodland Road would be extended south to Butteville Road to connect with the interchange, with a frontage road constructed on the east side of 1-5 between Highway 214 and the South Arterial. Associated with this alternative is a possible extension of the South Arterial east of Highway 99E to connect with Highway 214. Alternative #3: Improve Existing 1-5 lnterchange and Widen Highway 214/ South Arterial with 1-5 Overpass This alternative is shown in Figure 14 and does not include a new 1-5 interchange. Instead in this alternative, the existing interchange would be improved by widening Highway 214 over Interstate 5, from Woodland Drive on the west to Highway 99E. In addition, a South Arterial would be constructed within the Urban Growth Boundary extending from Woodland Drive on the west to Highway 99E on the east, with an overpass of 1-5. Similar to Alternatives #I and #2, shown in Figures 12 and 13, the South Arterial could be extended east from Highway 99E to connect with Highway 214. This alternative was analyzed for two improvement options to the existing 1-5 Highway 214 interchange: 1. Improvements to the existing diamond configuration and, 2. Conversion to partial cloverleaf configuration. 5.5 Evaluation of Alternatives Transportation System Performance Following the development of three alternatives, and the incorporation of these alternatives (separately) into the travel demand model, the alternatives were evaluated using the previously described performance measures. Table 2 compares forecast average daily traffic (ADT) volumes at specific locations for the different roadway system alternatives (Appendix C presents year 2015 traffic flow maps for each alternative). As shown in the table, if no improvements were made to the road system, 2015 traffic volumes on Highway 214 east of the northbound Interstate 5 ramps would increase to 39,000 vehicles per day. This volume would decrease under each of the alternative road systems. Similarly at Highway 214 east of Settlemier Avenue, West Hayes Street west of Settlemier Avenue. and Young Street west of Highway 99E, the 2015 traffic volumes under any of the Build Alternatives would be less than the No-Build Alternative. This is not true on Highway 99E south of Lincoln Street. At this 30 Kittelson & Associates, Inc.

40 COLLECTOR PRINCIPAL ARTERIAL/FREEWAY MINOR ARTERIAL ROAD ALT. #2 SECOND 1-5 INTERCHANGE/SOUTH CITY OF WOODBURN TRANSPORTATION SYSTEM PLAN JUNE 1996 ARTERIAL

41 9661 3NW NVld W31SAS NOllVltiOdSNVtll Ntifl8OOOM A 0 MI3 SSVd83AO 5-1 HllM 7V18318V H~~OS/PI Z-6 LZ AMH 4' 33NVHH3t13lNI 5-1 3NllSIX3 3AO?ldWI :c# '1 7V UV08 - lv1t131tlv ~(ONIW ~~~3383/1~18318~ lvdl3nltld (SAVM~VO~ M~N) a m
42 June 1996 Woodburn Transportation System Plan 5.0 Roadway System Alternatives Analysis Table 2 Year 2015 Average Weekday Traffic for Roadway System Alternatives No-Build 39,000 26,000 12,000 23,000 10,000 I I I I I I Alternative # 1 ' 30,000 20,000 5,000 18,000 6,000, I I South Bypass or Parr Road extension east to Highway 99E. location, under Alternative #1 forecast daily traffic volumes decrease relative to the No-Build Alternative; under Alternative #2 the forecast traffic volumes remain essentially the same relative to the No-Build Alternative; and under Alternative #3 the forecast traffic volumes increase relative to the No-Build Alternative. In Table 3, lane miles over capacity (weekday p.m. peak hour), weekday vehicle hours of travel (VHT), and weekday vehicle miles of travel (VMT) for each of the three study alternatives are compared. These measures are interrelated and are thus best evaluated together rather than individually. As shown in this table, daily VMT, VHT, and the number of lane miles over capacity would increase dramatically between now and year VMT would increase approximately 80 percent, and VHT would increase approximately 185 percent. This dramatic increase in VHT relates directly to the increase of lane miles over capacity. Under existing conditions, there are no lane miles operating over capacity; however in the future, if no road improvements were made, there would be 1.1 lanes miles of road over capacity. The over-capacity roads would be: Table 3 Summary of Traffic Operations Performance Measures. South Arterial east to Highway 99E.. South Arterial east to Highway 214. Kittelson & Associates, Inc. 33
43 5.0 Roadway System Alternatives Analysis June 1996 Woodburn Transportation System Plan Highway 214 between the northbound Interstate 5 ramps, and Evergreen Road, Evergreen Road between Highway 214 and its terminus, and Settlemier Avenue just south of West Hayes Street. Figures 15 through 18 show which roadway segments are under, near, or over capacity for the no-build condition and roadway system alternatives #I, #2, and #3. Compared to the No-Build Alternative, Alternative #1 (1-5 Split Diamond Interchange with South Arterial) would have the lowest number of lane miles over capacity of all three alternatives. In this alternative only 0.26 lane miles of Woodburn roads would be operating over capacity. This would be Woodland Road just north of Highway 219, which is likely a result of restricting the Arney Road access to Highway 219 to right-in, right-out only movements. Also, in this alternative Highway 214 would be operating near capacity for almost its entire length between Interstate 5 and Settlemier Avenue. Alternative #2 has the greatest effect of reducing congestion on Highway 214; however, it does have more lane miles over capacity than either Alternative #1 or #3. Congestion would occur on Parr Road in the vicinity of Interstate 5. On a daily basis, VHT is the lowest in Alternative #2. VMT is most significantly reduced, relative to the No-Build alternative, by implementing Alternative #3 (South Arterial; Interstate 5 over crossing). However, both of these alternatives introduce more traffic congestion than Alternative #1 (1-5 Split Diamond Interchange) Major lntersection Improvement Needs An initial year 2015 level of service (LOS) analysis was performed at five major intersections assuming no improvements to the City of the Woodburn street system in the future. The critical intersections are southbound I-5lHighway 214, northbound I-51Highway 214, Highway 214lSettlemier Avenue, Highway E and Highway 99EIYoung Street. A new signal was assumed at the northbound 1-5 ramp intersection. As shown in Table 4, under the No-Build Intersection Table 4 Summary of Level of Service Analysis Alt. #3' (Irnpr. Existing Interchange1 Hwy. 21 4) With South Arterial extension to Highway 99E 34 Kittelson & Associates, Inc.

44 - LEGEND -- UNDER CAPACITY APPROACHING CAPACITY AT OR OVER CAPACIM.." WEEKDAY PM PEAK HOUR LEVEL OF CONGESTION- NO-BUILD ALTERNATIVE I CITY OF WOODBURN TRANSPORTATION SYSTEM PLAN ll lhlc 1 OOG

45 UNDER CAPACIM AT OR OVER CAPACIM 2' ,,d 2075 WEEKDAY PM PEAK HOUR LEVEL OF CONGESTION- ROAD ALT.# I SPLIT DIAMOND INTERCHANGE CITY OF WOODBURN TRANSPORTATION SYSTEM PLAN JUNE 1996
46

47 - LEGEND UNDER CAPACIN APPROACHING CAPACIN *OOO(t AT OR OVER CAPACIN I 2015 WEEKDAY PM PEAK HOUR LEVEL OF CONGESTION- ROAD ALT.#3- IMPROVE EXISTING 1-5 INTERCHANGE CIN OF WOODBURN TRANSPORTATION SYSTEM PLAN JUNE 1996
48 June 1996 Woodburn Transportation System Plan 5.0 Roadway System Alternatives Analysis alternative, future PM peak hour traffic level of service degrades to LOS F at all five intersections. LOS E is the typical minimum acceptable level of service at signalised intersections in an urban area such as Woodburn ("A" representing the best and "F" the worst level of service). Thus, all five identified intersections have an unacceptable level of service. Given these unacceptable levels of service, a mitigation analysis was performed on the 2015 PM peak hour No-Build scenario in order to determine what intersection improvements at the five critical intersections would be necessary to restore acceptable operating conditions. The necessary improvements are as follows: Southbound I-S/Highway 214: Add a second left turn and right turn lane on the southbound 1-5 ramp; re-stripe the eastbound intersection approach to include a through lane and a right turn lane; add a second left turn lane to the westbound approach. Northbound I-S/Highway 214: Signalize; add a second right turn lane on the northbound 1-5 ramp; add a second left turn lane to the eastbound intersection approach; add a second through lane to the westbound approach. Highway 214/Settlemier Avenue: Optimize the signal timing to minimize delay; add a second left turn lane at the northbound approach; and restripe the southbound approach to the intersection to include one left turn, one right turn, and one through lane. Highway 214/Highway 99E: Add a second left turn lane to the eastbound intersection approach; restripe the westbound intersection approach to include one left turn lane, one through lane and one right turn lane; add a second left turn lane to the northbound approach to the intersection. Highway 99ENoung Street: Construct an exclusive right turn lane for vehicles to turn from westbound Young Street to northbound Highway 99E. With these improvements all of the critical intersections will operate at LOS E or better in the future PM peak hour. Next a PM peak hour traffic level of service analysis was performed on each of the identified road system alternatives. The intersection improvements identified above were included in this analysis. Under Alternative #I, the above mitigations will provide for acceptable operating conditions at all of the study intersections except the intersection of soutthbound Interstate 5/Highway 214. At this intersection it is necessary to add a second right turn lane to the southbound approach to the intersection. As shown in Table 4, in Alternative #2 and #3 the above mitigation measures developed for the no-build alternative level of service analysis are sufficient to provide acceptable intersection operations in the future Operations Analysis of 1-5 Interchange Alternatives An additional analysis of year 2015 traffic conditions related to the various 1-5 access alternatives under consideration in the Woodburn Transportation System Plan was undertaken. Appendix D identifies the traffic volumes and lane configurations assumed in the analysis to improve the I-51Woodburn interchange operation. Kittelson & Associates. Inc. 39
49 5.0 Roadway System Alternatives Analysis June 1996 Woodburn Transportation System Plan Freeway Operation The purpose of this evaluation was to develop a comparison of the expected freeway operationflevel of service between the three interchange alternatives considered in the roadway system alternatives analysis. The three alternatives include: Existing diamond interchange; Split diamond interchange; and Two interchanges, with new interchange in the vicinity of the existing Butteville Road overcrossing. A partial cloverleaf configuration at the existing Highway 214 interchange was also analyzed primarily to determine the benefits which might be achieved in the operation of Highway 214 through the signalized intersections. The results of this analysis along with the three alternatives are shown in Table 5. Table 5 Southbound 1-5 Freeway Operation Weekday PM Peak Hour Interchange Configuration I I Diverse Ramp Volume (vph) I Freeway Volume (Lane 1,2)'(v~h)~ / 3,578 3,578 3,379 3,490 3,578 Level of Service D D C D D ensi it^^ Speed (mph) Merae Level of Service 1 lanes 1 and 2 are two right-most lanes on freeway 2 vph - vehicles per hour 3 density - vehicles per mile per lane 2015 PM peak hour traffic volumes were used for this analysis, as this period was considered the highest overall traffic period and most appropriate for design purposes. The PM peak hour volumes were derived from the daily EMME12 model traffic projections by applying existing peak hour and intersection turning movement percentages. Southbound 1-5 operations were analyzed as this represents the peak direction of traffic on 1-5 during the PM peak hour. 40 Kittelson & Associates, lnc.
50 June 1996 Woodburn Transportation System Plan 5.0 Roadway System Alternatives Analysis The 1994 Highway Capacity Manual (HCM) procedures for freeway mergeldiverge operation was applied for this analysis. This particular operational analysis procedure on 1-5 represents a mergeldiverge condition on the freeway rather than a weave since no added lanes between interchanges is proposed by any of the alternate interchange configurations. As shown in Table 5, although there is a measurable change in calculated freewaylramp junction level of service, there is no measurable change in the lane density or the operating speed of the freeway. This alone should not be used as criteria to select one alternative design over another. lnterchange Operation The 2015 PM peak traffic volumelturn movement was assigned to the interchange configurations under consideration. A level of service analysis was performed for each ramp terminal with the cross street using the SIGCAPprocedure, with a determination of the lane requirements at each intersection location to provide a balanced roadway section with adjacent intersections. The results of this analysis is shown in Table 6. This provides a comparison of the volume to capacity ratio and level of service calculated for each alternative. Table lnterchange R amp Terminal Operation Weekday PM Peak Hour Diamond Split Diamond Northbound OffIOn- ram^ I E- F I 98% I Southbound OfWOn-Ramp I E 1 96% I North Off-Ramp (Hwy 214) C-D 75% South Off-Ramp (South Arterial) D-E 87% I North On-Ramp (Hwy 214) I D I 82% 1 South On-Ramp (South Arterial) D-E 88% Parr RoadIButteville Road Two Interchanges I Northbound Off/On-Ramp E 97% Partial t I I The analysis revealed that the best intersection level of service would be provided with the two interchange configuration, due to the dispersal of traffic. With this configuration, a three-lane section on the South Arterial at the interchange would be adequate. Kittelson & Associates. Inc. 41
51 5.0 Roadway System Alternatives Analysis June 1996 Woodburn Transportation System Plan The mitigation required at the south ramp terminals of the split diamond interchange is to provide a five-lane roadway section in the vicinity of the interchange. The extremely poor level of service forecast for the diamond interchange includes separate right turn lanes on Highway 214 as well as double left turn lanes from Highway 214 to the on-ramps. This would represent the maximum possible "build" for a diamond interchange design. Even with this configuration, it is very likely that the level of service will be significantly worse since it would be difficult to achieve the lane balance assumed in the analysis because of the influence of the upstream and downstream signalized intersections. Possible variation to the diamond interchange design is to construct of a partial cloverleaf at Highway 214. A very important consideration in any interchange design is the potential lane balance which will be accommodated by the design. Lane balance is determined by evaluating the design to ensure traffic is distributed equally in all lanes as assumed by the intersection analysis program or to make the appropriate adjustment in the calculation to reflect the influence of the upstream and downstream traffic signal and roadway. Analysis of the year 2015 PM peak hour westbound traffic volumes on Highway 214 reveals that 1900 vehicles per hour will approach 1-5 in the westbound direction. This traffic would pass through the Evergreen Road traffic signal which is located 800 feet east of the northbound 1-5 ramp terminal. In order to accommodate the 1900 vehicles per hour through the Evergreen traffic signal, the two westbound lanes must equally share the total westbound traffic. This is equivalent to 950 vehicles per hour per lane in order to access either 1-5 northbound or 1-5 southbound. Since the location is no greater than 800 feet east of 1-5, all the traffic to northbound 1-5 and a majority of the traffic must be in the right lane. Even with a right turn lane, traffic will not be able to move out of the through lane until the platoon approaches the traffic signal and if this traffic is provided signal progression, which is required to minimize the queue on this approach, only 470 vehicles of the 840 vehicles desiring to enter 1-5 southbound can be in the right lane at the northbound ramp terminal. This requires a total of nearly 400 vehicles to shift two lanes immediately after passing through the northbound ramp terminal signal and prior to entering the loop ramp to 1-5 southbound. Similar conditions will be created for eastbound traffic approaching the southbound ramp terminal traffic signal. The total volume of 1450 vehicles per hour would leave the WoodlandII-Iighway 214 traffic signal. With the southbound on-ramp followed by a northbound on-ramp to I-5,930 of the 1450 vehicles per hour must be in the right lane to avoid lane shifts on the 1-5 structure. When these conditions of poor lane balance occur downstream of a signalized intersection, the assumed lane balance as provided with the intersection level of service calculation will not be achieved. If lane balance is achieved as assumed in the calculation, congestion will occur downstream of the traffic signal, at the diverge point resulting in delay and safety problems extending back to the adjacent intersection. This lane balance may be alleviated somewhat by increasing the distance between the adjacent traffic signal and the downstream diverge point. Conclusions Based on the freeway and ramp intersection operations analysis conducted for the different 1-5 interchange alternatives, the following conclusions can be drawn: 42 Kittelson & Associates, Inc.
52 June 1996 Woodburn Transportation System Plan 5.0 Roadway System Alternatives Analysis All of the alternatives would have similar operating characteristics on 1-5, ranging from level of service C to D. The proximity of a second interchange at Butteville Road would not have an adverse impact on Highway 214 interchange ramp operations, and vice versa. The existing diamond interchange would experience very poor level of service E to F at the ramp terminal intersections, even with added through and left turn lanes at the northbound and southbound ramp intersections. The overall cross-section of Highway 2 14 would be a 6-7 lane roadway. The split diamond interchange would improve level of service at the Highway 214 ramp intersection from C to D, with only five lanes required on the 1-5 overpass structure. At the south interchange, five lanes on the South Arterial would be required to provide level of service D or better. The best intersection ramp terminal level of service (C-D) is achieved with two interchanges, due to the dispersal of traffic with this configuration. However, Highway 214 would still have to widen to a five-lane section on the 1-5 overpass. The South Arterial could operate as a three-lane facility at the south interchange. The partial cloverleaf interchange would operate very similarly to the diamond interchange or the split diamond interchange for freeway merge/diverge conditions. Analysis of the ramp intersection level of service as shown in Table 6, reveals the overall operation very similar to the diamond interchange. This is due to the extremely poor lane balance which would result at the interchange traffic signals because of the lane balance required at the adjacent signalized intersections at Woodland Road and Evergreen Road to achieve level of service D. Kittelson & Associates, Inc. 43
53 5.0 Roadway System Alternatives Analysis June 1996 Woodburn Transportation System Plan Land Use/Environmental/Cost lmpacts Table 7 summarizes the general land use, environmental and cost impacts of the highway system alternatives. A discussion of each impact area follows. Table 7 Summary of Land Use/Environmental/Cost Impacts Impact Category Alternative #1 Alternative #2 Serves Overall Development in Promotes Development Inside Current UGB I Right-of-way Requirements Positive impact 0 Minimal impact or not applicable - Negative impact Land Use The no-build and three roadway system improvement alternatives would have different impacts on future land development patterns within the Woodburn area. The no-build alternative would severely limit added development potential in the City, as most of the current undeveloped area within the existing Urban Growth Boundary is in the southwest portion of the City, which has virtually no street system currently developed. The absence of improved 1-5 access and a South Arterial facility under this alternative would limit the ability to develop this area in the future, without having significant traffic infiltration impacts through the Senior Estates area south of Highway 214. The development of an 1-5 split diamond interchange with a northerly South Arterial alignment would improve access to the undeveloped southwest portion of the City, but the South Arterial facility east of 1-5 would bisect the proposed Woodburn Crossing mixed-use development area and potentially have a negative impact on the master plan for this development. The development of a second 1-5 interchange in the vicinity of Butteville Road, with a southerly South Arterial alignment, would provide the best overall access to the southwest portion of the City, but could stimulate development pressures outside the existing Urban Growth Boundary, as the new interchange and a portion of the South Arterial would be located outside the UGB. With a northerly South Arterial option, the road could be developed entirely within the existing urban growth boundary. Kittelson & Associates, Inc.
54 June 1996 Woodburn Transportation System Plan 5.0 Roadway System Alternatives Analysis Finally, the alternative to improve the existing I-5/Highway 214 interchange without a direct connection to the South Arterial (which would have a separate overpass of 1-5 under this alternative) would provide only limited improved access to the southwest portion of the City. This alternative (assuming a partial cloverleaf ramp improvement were developed) would also require the taking of some existing businesses in the northwest and southeast quadrants of the interchange. The other interchange build alternatives would be developed in existing undeveloped areas and not have as great an impact on existing businesses. Also the widening of Highway under this alternative would probably require significant right-of-way from existing businesses along this roadway. Under any of the build alternatives, other collector and local street extensions and widening would result in some right-of-way acquisition thus impacting adjacent development to some extent. Environmental Under any of the build highway system alternatives, the potential alignments for new interchange and street construction appear to result in limited impact on environmentally-sensitive areas in the Woodburn area. The South Arterial could be aligned south of the small reservoir on the south side of the City, and be potentially located around the south side of the sewage lagoon east of Highway 99E if eventually connected to Highway 214. Cost The difference in cost of the different highway system alternatives is primarily associated with the different 1-5 interchange configurations. The 1-5 split diamond interchange configuration is estimated to cost as much as $15 million, while a second 1-5 interchange at Butteville Road could cost as much as $20 million (pending the final location of the 1-5 over-crossing and the extent of frontage road development between the existing Highway 214 interchange to the north and the new interchange). Improvements to the existing interchange (assuming conversion to a partial cloverleaf configuration with a new bridge) could be up to $10 million, and possibly more pending the level of 1-5 frontage road development south of Highway 214. The South Arterial improvement cost (from Highway 219 to Highway 99E) would probably range from $5-10 million for the split diamondhew interchange alternatives, being of lesser cost with the second 1-5 interchange at Butteville Road due to the shorter length of new roadway to be constructed. The cost of other street improvements in each highway system alternative would be similar, with the possible exception of street improvements in the current undeveloped southwest portion of the City, whose configuration will be dependent on a final master plan for that area as well as the eventual 1-5 interchange1south Arterial improvement configuration. Improvements to arterial and collector streets could total up to $40 million. Kittelson & Associates. Inc. 45

55 Section 6 Transit Systems Alternatives Analysis
56 June 1996 Woodburn Transportation System Plan 6.0 Transit System Alternatives Analysis 6.0 Transit System Alternatives Analysis 6.1 Transit Demand In fiscal year 1994 (July 1, 1993 through June 30, 1994), the Woodburn fixed-route bus service had an annual ridership of 28,998 passengers. The paratransit system only had an annual ridership of 3,159 passengers. The combined 32,157 annual ridership on the two systems related to 2.11 transit trips per resident in Over the past ten years, annual ridership has stayed about the same on the transit system. Figure 19 shows the 1994 population distribution in Woodburn, for nine zones within the city. For each zone, the population associated with more transit-dependent persons and over 60 years of age - is identified. The map reveals a high concentration of elderly in the Senior Estates area just east of 1-5. In central and east Woodburn, there are more youngsters and younger and middle age adults. By year 2015, population in Woodburn is projected to increase by 100 percent, to 30,000 persons. Assuming transit ridership would grow in proportion to the population increase, and assuming increased transit service were provided to handle the added population, an annual ridership of about 65,000 would be expected combined on the city fixed-route and paratransit services. With the increasing number of people moving to Woodburn and commuting to either the Portland metro area or Salem, there appears to be some potential demand for shuttle bus service between Woodburn and these two areas. There currently is no transit service serving this demand. 6.2 Major Activity Centers There are several trip attractions in Woodburn which should be served by public transit service. Figure 20 identifies these attractions, which comprise retail centers, employment concentrations, parks, golf courses, schools, retail centers, downtown Woodburn, and city offices. The existing fixed-route bus route serves most of these attractions, with the notable exception of not serving the employment area along Progress Way north of Highway 214 and west of Highway 99E. 6.3 lntracity Fixed-Route Bus Alternatives Four fixed route bus alternatives were identified to the existing condition, which is a single, one-way loop route. The existing route and alternatives are illustrated in Figures 21 through 24, and are compared in Table 8. A description of each alternative follows: Alternative #1: Increase Service Frequency on Existing Route With this alternative (see Figure 21), the existing 15.3 mile one-way loop route would be maintained, with service extended to a 12-hour period from 7 a.m. to 7 p.m., with buses operating every 30 minutes. An expansion of the hours of operation of the fixed route service should be considered, to include the a.m. and p.m. peak commuting times. To achieve the Kittelson & Associates, Inc. 47

57 I LEGEND 1994 POPULATION: 0-17 YEARS OLD POPULATION: YEARS OLD 1994 POPULATION: 60+ YEARS OLD - ZONE BOUNDARY FOR POPULATION ( TABULPT W 1994 POPULATION DISTRIBUTION CIN OF WOODBURN TRANSPORTATION SYSTEM PLAN JUNE 1996 FIGURE
58

59 LEGEND 1 I I FIXED-ROUTE BUS ALT. #I: '+b BUS ROUTE AND DIRECTION OF TRAVEL INCREASE SERVICE FREQUENCY ON EXISTING ROUTE (ONE-WAY) CIN OF WOODBURN TRANSPORTATION SYSTEM PLAN JUNE 1996
60 June 1996 Woodburn Transportation Sys tem Plan 6.0 Transit System Alternatives Analysis Table 8 Fixed-Route Bus Alternative 1 Frequency Service (min.) Comparison of lntracity Fixed- Route Bus ~lternatives' Route Miles (one-way) Avg. Bus Travel Speed # of Buses Requirea Vehicle MilesNeal 1. Increase Service Frequency on Existing Route 13 mph 2 80, Convert 60 Single (7a.m.- Route to 7p.m.) 2-way Operation 13 rnph 3. Create 2 30 Routes (7a.m.- (EastWest) 7p.m.) with 1-way o~eration 13 mph 4. Create 2 Routes (EastWest) with 2-way Operation 13 mph 13 mph 1 Assumes bus operation only on weekdays for 51 weeks per year (thus accounting for no service on holidays). 2 Based on Woodbum Transit System operating cost of $1.80/vehicle mile. increased bus service, a second bus would need to be added to the fleet. Transit system operating costs are estimated to increase to $145,000 from the existing $73,000, assuming the operating costs would increase in proportion to the increase in vehicle miles and hours of travel (a somewhat conservative assumption as this also assumes a doubling of administrative costs). Also an added bus would be required, at a cost of about $1 10,000 (if the bus were similar to the existing 23-seat bus being operated). A major problem with the one-way loop operation is that the bus service does not efficiently serve travel oriented in the opposite direction of the bus operation, particularly for short trips. Alternative #2: Convert Single Route to Two-way Operation Overall passenger accessibility along the bus route could be improved by preserving the loop route, but modifying the service to have buses operating in both directions at the same time (see Figure 22). This service alternative was evaluated preserving the existing 60 minute service frequency, in each direction of travel. Service would be expanded to 7 AM to 7 PM on weekdays. This service concept would require two buses, with operating costs similar to increasing service frequency on the existing one-way loop route. Overall transit operating costs Kittelson & Associates, Inc. 51

61 I LEGEND --C--) BUS ROUTE AND DIRECTION OF TRAVEL --- OPTIONAL BUS ROUTING I I FIXED-ROUTE BUS ALT. #2: SINGLE ROUTE WITH TWO-WAY CIN OF WOODBURN TRANSPORTATION SYSTEM PLAN JUNE 1996 OPERATION FIGURE
62 June 1996 Woodburn Transportation System Plan 6.0 Transit System Alternatives Analysis ($143,000) would be similar to increasing service frequency on the existing one-way loop route, with an added bus required ($110,000). The basic route evaluated for this alternative is similar to the existing route, with the exception of focusing the service on one street as opposed to two closely parallel streets in certain areas (e.g. service east of downtown is focused on Young Street, while along the existing route buses operate on both Young Avenue and Cleveland Street, one block to the south). Areconfiguration of the bus route through Senior Estates north of Highway 214 is also proposed with this alternative, to operate along Astor Way instead of Umpqua Road, and not operate north of Vanderbeck Lane. This provides better spacing of the service in that particular area. The route would also extend north of Highway 214 west of Highway 99E to serve the industrial area along Progress Way, thus linking residential areas of the community with this employment area. There are also several route options within this alternative. Northwest of the 1-5 interchange, the bus service initially might be oriented to the residential development along Woodland Drive. In the future, if commercial development occurs along Arney Road, the bus route might make a loop through that area using Arney Road and Woodland Drive. Also as the Tukwila and other residential subdivisions develop along Boones Ferry Road, it could be desirable to extend the bus route operating through north Senior Estates east of Astor Way to access Boones Ferry Road. Alternative #3: Create Two Routes (EasWest) with One-way Operation This alternative would preserve the basic one-way bus route that operates today, but splitting the route into two routes: 1) a 9.15 mile west side route operating on the west side of the Southern Pacific Railroad tracks, and a 6.1 mile east side route operating on the east side of the railroad tracks (see Figure 23). This service concept was evaluated with an increased service frequency of 30 minutes, again between 7 a.m. and 7 p.m. on weekdays. The bus service on each route would be scheduled so that buses would have coordinated arrivals in downtown Woodburn, at a so-called transit center, to facilitate transfers between routes. The major disadvantage of this alternative is that cross-city transit commuting would require transferring to another route in downtown Woodburn. The advantages of this alternative are two-fold: 1. It improves service frequency with a minimum increase in buses (only two buses are required - one for each route), with reverse commute trips along a particular route (trips in the opposite direction of the service would be accommodated more conveniently due to the more frequent bus service and shorter bus route); and 2. The downtown transit center concept for bus transferring purposes could serve as a stimulus for downtown redevelopment, particularly if tied into an intercity bus andlor rail station. With this alternative, both transit operating and capital costs would be higher than the other two alternatives previously described, as a total of three buses would be required (two on the west route, and one on the east route). Operating costs are estimated to be about $175,000 per year, while an added two buses would cost $220,000. Kittelson & Associates, lnc

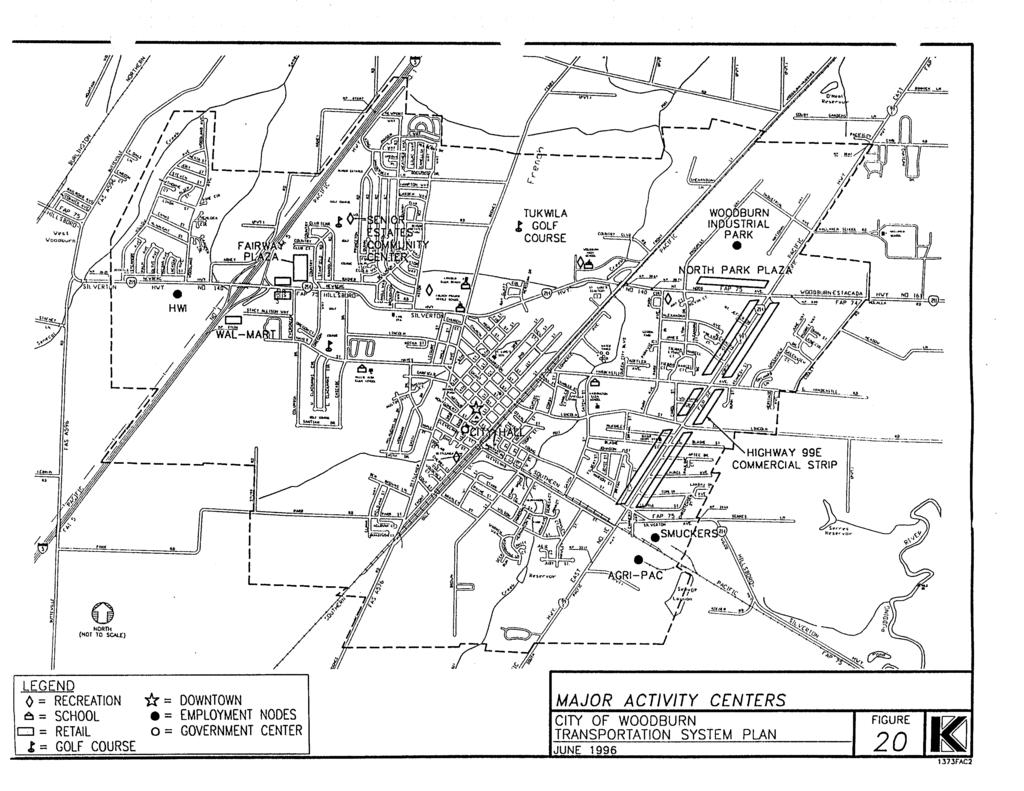
63 /I LEGEND I - ROUTIN. /,,,7J ' / L------g o-o-o EAST SIDE BUS ROUTE AND -WEST SIDE BUS ROUTE AND FIXED-ROUTE BUS ALT. #3: DIRECTION OF TRAVEL DIRECTION OF TRAVEL TWO ROUTES WITH ONE-WAY OPERATION 0 0 OPTIONAL EAST SIDE BUS OPTIONAL WEST SIDE BUS ROUTING I CIN OF WOODBURN DRAFT TRANSPORTATION SYSTEM PLAN JUNE 1996 FIGURE
64 June 1996 Woodburn Transportation System Plan 6.0 Transit System Alternatives Analysis Alternative #4: Create Two Routes (EastANest) with Two-way Operation Finally, this fixed-route alternative would operate two-way bus service on both west and east side routes, at a 30 minute service frequency (7 a.m. to 7 p.m. on weekdays) (see Figure 24). This is the most intensive service option, with operating costs increasing to about $290,000, and with six buses being required (four buses on the west route, and two on the east route). The five added buses over the existing single bus operation would cost $550,000. This service concept could operate with a 60 minute service frequency, which would reduce operating costs by about 50 percent (similar to alternatives #2 and #3). 6.4 lntracity Paratransit Service If fixed-route bus service is improved, the City would have the option of reducing the provision of special paratransit service. However, the paratransit system, with door-to-door service, provides the only transit service option for many elderly and handicapped persons in the community, and thus some level of paratransit service will be desirable. In addition, the Americans with Disabilities Act (ADA) requires providers of fixed-route transit to provide complementary paratransit service. 6.5 Intercity Transit Service As mentioned previously, the Woodburn Transit System currently does not provide shuttle bus service between Woodburn and the Portland metro area or Salem. For direct service to the Portland Metropolitan area the City of Woodburn could either: provide service to Tualatin Park-n-Ride - transfer to Tri-Met bus routes to access downtown Portland and rest of system; or provide direct service to downtown Portland. To Salem, the City of Woodburn could provide direct service to downtown Salem and the state office building area. Table 9 identifies the estimated operating and capital costs for these three options. For all options, a weekday-only service was assumed to a particular destination, with two bus runs during the AM and PM peak hours, and a midday bus run. The same vehicle operating costs per mile ($1.80) were assumed for the intercity shuttle service as for the intracity bus service within Woodburn. The intercity bus service concepts in Table 9, for comparison purposes, were assumed to originate in the vicinity of the I-51Highway 214 interchange, at a new park-n-ride facility. The service could.be expanded further east into central Woodburn to either circulate through the city or terminate at a park-n-ride more central to the city. With a park-n-ride some distance away from the interchange, there would be less potential for this facility to be used by Salem to Portland commuters, thus increasing the available spaces for Woodburn commuters. If a park-n-ride were located in the vicinity of the interchange, it would be desirable to keep the park-n-ride east of 1-5 so that commuter traffic accessing the park-n-ride would not have to travel through the I-51Highway 214 interchange. Given current land availability, this would most likely result in the park-n-ride being developed in the southeast quadrant of the interchange, where there is still substantial undeveloped property. Further east in central Woodburn, there are more limited potential sites. Kittelson & Associates, lnc. 55

65 I LEGEND EAST SIDE BUS ROUTE AND + < WEST SIDE BUS ROUTE AND DIRECTION OF TRAVEL DIRECTION OF TRAVEL OPTIONAL EAST SIDE BUS ---- OPTIONAL WEST SIDE BUS ROUTING ROUTING FIXED-ROUTE BUS ALT. #4: TWO ROUTES WITH TWO-WAY GIN OF WOODBURN TRANSPORTATION SYSTEM PLAN JUNE 1996 OPERATION FIGURE
66 June 1996 Woodburn Transportation System Plan 6.0 Transit System Alternatives Analysis Table 9 Comparison of Intercity Shuttle Bus ~lternatives' Intercity Shuttle Bus Alternative Service Frequency (weekday) Route Miles (one-wayl2 Added Buses I I Vehicle I Year I Year I ",":it$ lequired Vehicle Operating Cost/ year6 Estimated Annual Ridership 1. Service to 2 Trips Tualatin (AM & PM) Park-n-Ride 1 trip (Mid-day) i 2. Service to 2 Trips Downtown (AM & PM) Portland 1 trip (Mid-day) 1 Assumes bus operation only on weekdays, for 51 weekslyear (thus accounting for no service on holidays). 2 Assumes Woodbum Park-n-Ride within 0.5 miles of 1-5 interchange. 3 Assumes one hour round-trip travel time to Tualatin Park-n-Ride or central Salem during peak hours (50 minutes during mid-day). 4 Assumes 2.25 hours round-trip travel time to downtown Portland during peak hours (90 minutes during mid-day). 5 Assumes purchase of 45 passenger buses. 6 Based on Woodburn Transit System operating cost of $1.80/vehicle mile. Assuming that larger 45-passenger buses are used for the intercity shuttle, and under the maximum service scenario of two peak hour and one midday bus runs, and service to both Portland and Salem, the largest number of spaces anticipated for a park-n-ride would be 225. If a park-n-ride were developed, consideration should be given to provide more spaces than the anticipated transit demand to accommodate carpooling to Portland andlor Salem. Thus a maximum-sized park-n-ride of closer to 300 spaces could be applicable. If intercity bus service is provided to only one destination, and/or the level of service is curtailed, then the park-n-ride can be proportionally smaller. To accommodate 300 parking spaces, about a three acre site would be required. Such a facility could cost up to $1 million. Recently as part of the preparation of the Marion County Transportation System Plan, the concept of extending the Salem area bus service (CHERRIOTS) to serve Woodburn has been discussed. This service extension could replace or supplement any City of Woodburn - provided fixed route bus service to Salem. To the north, it is highly unlikely that Tri-Met (the public transit provider in the Portland metro area) would ever extend their service to Woodburn as they are attempting to limit their service to the Portland area. Kittelson & Associates, Inc. 5 7

67 Section 7 Alternate PedestriatVBicycle TDM Strategies
68 June 1996 Woodbum Transporlation System Plan 7.0 Alternate Pedestrian/BicycleflDM Strategies Alternate Pedestrian/Bicycle/TDM Strategies 7.1 Introduction In addition to a set of highway and transit system alternatives for the City of Woodburn, there are also alternate strategies for pedestrian and bicycle facility development and Transportation Demand Management (TDM) measures which should be evaluated toward developing a truly multi-modal Woodburn Transportation System Plan. This section identifies and evaluates facility and policy alternatives with respect to these important transportation system components. 7.2 Pedestrian Strategies As discussed in Section 4, there is a fairly discontinuous system of sidewalks along existing streets within Woodburn, as well as an absence of off-street pathways. Many sections of arterial and collector streets do not have sidewalks at all or only on one side. There are several locations where pedestrian connections between adjoining neighborhoods or subdivisions have not been developed or are circuitous. There appear to be two alternate strategies to added pedestrian facility development within Woodburn. These strategies differ by the degree of on-street vs. off-street development of sidewalks and pathways. Alternative #I: Focus on Added Sidewalk Development The first alternative would focus pedestrian facility development on adding sidewalks to all sections of existing arterial and collector streets, preferably with sidewalks on both sides of these streets. All new streets, including local streets, would also include sidewalks on both sides. There would be no or very little off-street pathway development. The major disadvantage of this alternative is that this strategy would be fairly expensive, and probably not the most cost-effective means of improving pedestrian access to major activity centers in the City or to connect adjoining neighborhoods and subdivisions. Alternative #2: Balanced Program of Sidewalks on Major Streets and Off-Street Pathways The second alternative would be to develop a balance between added on-street sidewalk development and the development of an off-street pathways system. In particular, a trail system would be developed along the Mill and Goose Creek corridors in the City, totaling over seven miles of trails. In addition, off-street pathways connecting adjoining neighborhoods and subdivisions would be developed where local street connections are not possible. This would be supplemented by more limited sidewalk development, focusing on having sidewalks on at least one side of all arterial and collector streets, but not necessarily on both sides of these streets. The Mill and Goose Creek corridors through Woodburn provide an opportunity to integrate pedestrian facilities into open space areas, thus enhancing access to these areas by the public Kittelson & Associates, Inc. -
69 7.0 Alternate Pedestrian/Bicycle/TDM Strategies June 1996 Woodburn Transportation System Plan as well as providing more direct pedestrian connections to many activity centers in the City. The Mill and Goose Creek corridors are located next to or in close proximity to all of the schools in Woodburn, thus providing an opportunity to have school children use of safer off-street trails. to access the schools. The on-street sidewalk system could be focused to some extent, at least through signage, on directing pedestrians to the trailheads for the off-street pathway system. 7.3 Bicycle Facilities Also as discussed in Section 4, the absence of dedicated bicycle facilities in Woodburn is even more critical than the discontinuity of the current sidewalk system. The alternatives for improved bicycle facilities mirrors the alternatives for pedestrian facility development. Alternative #1: Focus on On-Street Bike Lane Development This alternative would focus on developing designated bicycle routes and adding bicycle lanes on existing arterial and collector streets, with no or very limited off-street bicycle trail development. Preferably dedicated shoulder bicycle lanes on all arterial and collector streets would be developed, with portions of this system designated as bicycle routes serving different portions of the City andlor major activity centers. While this alternative would make strides in separating bicycles from motor vehicles on the Woodburn street system, bicycle safety would not be as high as if some off-street bike trails were developed to supplement on-street bicycle lanes. And along many existing streets bicycle lanes can only be developed by widening these streets and possibly requiring added right-ofway. Alternative #2: Balanced Program of On-Street Bike Lanes and Off-Street Bike Trails As for the pedestrian facilities, the Mill and Goose Creek corridors provide an opportunity for developing bicycle trails along these corridors, thus separating bicycle from motor vehicle traffic. This alternative would supplement the development of on-street bicycle routes and lanes by developing pathways for bicycles in these creek corridors. Options would exist on the degree of separation between bicycles and pedestrians in these corridors. Either a single pathway in each corridor could be developed to accommodate both bicycles and pedestrians (typically 8-10 feet wide), vs. developing separate pedestrian and bicycle trails (most likely on different sides of the creek corridors due to their limited width). With off-street bicycle trails in the creek corridors, school access by students would be tremendously enhanced. 7.4 Transportation Demand Management The concept of Transportation Demand Management, or TDM, denotes the implementation of programs and policies to attract people to use modes of travel other than the single occupant auto for their travel, at least to their workplace. This strategy is an integral component of the Oregon State Transportation Planning Rule. Many TDM strategies are instituted or are suppported by employers. There is very limited application of TDM strategies by existing employers or businesses in Woodburn. 60 Kittelson & Associates, Inc.
70 June 1996 Woodburn Transportation System Plan 7.0 Alternate Pedestrian/Bicycle/TDM Strategies There are several potential TDM strategies that could have greater application in Woodburn. The characteristics of each strategy are discussed below (refer to Table 10 for a summary) Transit Fare Subsidies With the current transit system in Woodburn, and the potential for transit system expansion in the future, there will be an opportunity for employers to encourage their employees to ride transit tolfrom work by helping subsidize bus passes. Woodburn Transit today has no subsidy program for regular riders. Many jurisdictions or transit agencies operating bus services have instituted a partial subsidy program, with employees either receiving discounted bus passes or being reimbursed by their employer for actual bus fares Carpool Matching Programs Likewise employers can sponsor carpool matching programs where a service is provided to match employees who live close to one another and on the same shift such that they can carpool together to and from work. In some cases, employers might actually purchase company vans which can be issued to certain employees who become designated vanpool drivers Carpool Parking Programs An employer can also designate certain close up parking spaces to their building for recognized carpools or vanpools. The City of Woodburn could carry this a step further by instituting an ordinance that would reduce parking requirements for new developments if a certain number of parking spaces were reserved for carpoolslvanpools. This parking limitation concept typically would encompass an overall employer ridesharing program including carpool matching programs and transit subsidies Flexible Work Hours As most of the traffic congestion in an urban area occurs during commuter peak hours, employer provisions for flexible work hours will allow spreading of the peak hour during a weekday thus reducing congestion for any given peak period Telecommuting Finally with the development of computers and communication software, including the Internet, it is becoming increasingly attractive for employers and businesses to allow their employees opportunities for telecommuting on their jobs, or to conduct other business. This in general reduces the number of vehicle trips on the street system Pedestrian/Transit-Oriented Development The development of more pedestrian and transit-oriented developments, through added and direct sidewalk connections, bus stop provisions, and proper building orientation, can attract more local trip making to these developments via non-auto modes, thus serving as TDM strategies to an extent. Kittelson & Associates. lnc. 61
71 7.0 Alternate Pedestrian/Bicycle/TDM Strategies June 1996 Woodburn Transportation System Plan Table 10 Comparison of Transportation Demand Management Strategies TDM Strategy Transit Fare Subsidies Carpool Matching Program CarpoolIBicyclc Parking Program Flexible Work Hours Development Applicability C, s, 0, I Site Developer1 Design Employer :onsideration Employer Parking Policy Reduction Incentives NO YES YES )act Category Cost Could be substantial pending employer interest & level of subsidy NO YES YES Minimal Minimal if tied to parking reduction strategy Potential lmpact on Trip Reduction Limited until bus service is expanded Fairly high if combined with preferential carpool parking Fairly high if combined with carpool matching program NO 1 YES I YES Minimal Impact on reducing peak hour congestion Telecommuting NO 1 YES I MAYBE Minimal Limited Direct PedestrianIBus Stop Connections from Adjacent Development C - Commercial, S - Se~ices, 0 - Office, I - Industrial I I YES NO YES Minimal with proper site planning currently Fairly high if tied to other TDM measures 62 Kittelson & Associates. Inc.

72 Section 8 Highway 219/214 & 99E Access Management Analysis
73 June 1996 Woodburn Transportation System Plan Highway 219/214 & 99E Access Management Analysis Highway & 99E Access Management Analysis 8.1 Introduction The Oregon Highway Plan (OHP), adopted in June 199 1, contains policies and strategies that will guide the Oregon State Highway Division's (OSHD) operating and fiscal activities during the period. With implementation of the plan, the State will be able to maintain quality highways and bridges that are safe and cost-effective and provide efficient access throughout the state. One component of the Plan is the Access Management Policy, which is a long range policy intended to develop guidelines for the control of access (driveways, public roads and traffic signals) onto State facilities. This section of the TSP describes the Access Management Analysis performed on Highway between the west city limits and Settlemier Avenue, and on Highway 99E between Lincoln Street, and the south terminus of the previous ODOT road improvement project on Highway 99E. The access management analysis includes a description of: the State Highway Access Management Guidelines; the methodology used to evaluate existing access conditions; and an analysis of existing access to Highway and Highway 99E. 8.2 State Highway Access Management Plan Guidelines The Access Management Policy guidelines of the OHP address the fact that, as communities have developed adjacent to state highways, the highways are no longer serving simply regional or interstate travel. In addition, some state facilities are serving a relatively high volume of local trips traveling to and from local services. The higher intensity of driveways, intersections, and traffic signals providing access to these local services has affected the safety, efficiency, and capacity of state highways. The Access Management Policy guidelines categorize all state highways, including Highway 99E and Highway , based on a functional hierarchy in terms of Level of Importance (LOI). The four LO1 categories are: Interstate: Providing connections between major cities, regions of the state, and other states. Statewide Highways: Providing access to larger urban areas, recreational areas, and the interstate system. Regional Highways: Providing connections to areas within regions of the state, between small urban areas and larger urban areas, as well as connections to higher level facilities. District Highways: Serving local traffic and land access, and having a relatively low level of significance from a statewide perspective. The Access Management Policy guidelines also define for each LO1 category guidelines for the management of access and traffic control. Table 11 summarizes the Access Management Policy. Kittelson & Associates. Inc. 63
74 Highway 219/214 & 99E Access Management Analysis June 1996 Woodburn Transportation System Plan - Table 11 Oregon State Highway Access Management Classification System -- Intersection Cat. Access Treatment Full Control (Freeway) Full Control (Expressway) Limited Control (Expressway) Limited Control Partial Control Level of Importance Interstate1 Statewide Statewide Statewide I I Urban1 Rural U R U R U Gzq- Regional District / : 1 Partial Control District Source: Oregon Highway Plan, ODOT, adopted 1991, pg. B-6 Public Road Type / Spacing Interchange Interchange 2-3 Mi. 3-8 Mi. At gradelintch At gradelintch Mi. 1-5 Mi. At gradelintch At gradelintch Mi. 1-3 Mi. At gradelintch 114 Mi. At gradelintch 1 Mi. Private Drive I Type / Spacing ;:;; 1 ;; None Turns 300' LVRt Turns Signal Spacing None None Mi. None 112 Mi. None 112 Mi. None 114 Mi. 112 Mi. 114 Mi. 112 Mi. For each of these categories, the Access Management Policy guidelines also differentiate between Urban and Rural roadways. For both Urban and Rural roadways in each category, the guidelines specify the minimum spacing of public roads, private driveway spacing, and traffic signals along state highways. The Access Management Policy also addresses the type of intersections which can be built (at grade or interchange), and whether or not a median can be installed on the state highway. The state expects that these guidelines will be implemented as part of land development/redevelopment projects or roadway improvements projects on state highway corridors. Also, the Access Management Policy guidelines will be implemented to ensure that every property has access to a public road facility. As an outcome of discussions between ODOT, and the city of Woodburn staff, it was determined that Highway between the west city limits and Settlemier Avenue, and Highway 99E between Lincoln Street and the south city limits do "provide for efficient and safe medium to high-volume traffic movements on intercity, intracity, and inter-community routes. There is a reasonable balance between direct access and mobility needs within this categoryw1. Thus, these facilities should be categorized as Category 5 Urban. According to Table 10, on Category 5 Urban roadways: public roads should be spaced at least 114 mile apart; private driveways should be spaced at least 300 feet apart (which converts to approximately 18 drivewayslmile on one side of the roadway); and 1 ODOT, Oregon Highway Plan, 1991, p. B-4 64 Kittelson & Associates, Inc.
75 June 1996 Woodburn Transportation System Plan Highway 219/214 & 99E Access Management Analysis traffic signals should be spaced at least 114 mile apart. 8.3 ODOT/City of Woodburn Access Management Agreement In 1991, ODOT and the City of Woodburn entered into an agreement to implement an access management policy for state highway facilities within the City of Woodburn. The policy focused on three sections of roadway: Highway 99E from the north City limits to Lincoln Avenue; Highway 214 from the Front Street overpass to Highway 99E; and Highway 21 1 from Highway 99E to Cooley Street. The purpose of the policy was to identify standards and procedures to preserve the capacity of state highway facilities in Woodburn, to carry traffic efficiently at a high level of service under safe conditions. The policy addressed criteria for public street intersection and driveway spacing and access restrictions, shared access between properties, and access design standards. The policy also included specific access management objectives for different undeveloped or partially developed properties along these roadways, including appropriate number of access points for these parcels, and the location of these access points. This access management policy and objectives provided guidance on the structure of the access management analysis conducted as part of the Woodburn TSP preparation for the other sections of Highways and 99E through the City. 8.4 Methodology The first step in the access management analysis for the Highway and 99E segments addressed in the Woodburn TSP was a review of traffic operations characteristics (level of service, accidents, intersection) and roadway intersection improvements identified in Woodburn Transportation System Plan (TSP) Technical Memorandums #2 (Existing Conditions) and #4 (AlternativesNeeds Analysis). This information was considered in conjunction with the access and signal spacing data in order to learn if there are any locations with unacceptable levels of service, or a high incidence of accidents which may be caused by the improper location of existing driveways, public roads, or traffic signals. Next, in order to assess compliance with the guidelines of the potential access management classifications for Highways and 99E, an existing conditions analysis was performed. In this analysis, a field survey of the study roadways was undertaken (April 1995) which identified the location of: existing driveways; existing public roads; and existing traffic signals. Table 12 summarizes existing driveway spacing on these two roadways. The spacing of these facilities was evaluated and compared to the guidelines developed in the Oregon Highway Plan, as well as the previously developed traffic operations and safety data. The intent of this analysis Kittelson & Associates, lnc. 65
76 Highway 219/214 & 99E Access Management Analysis June 1996 Woodburn Transpottation System Plan Table 12 Driveway Spacing Summary -- - Highway 99E 1 Additional consolidation should occur with redevelopment of the area. was to develop aplan for managing access to Highway 214 and Highway 99E such that regional and local trips can be made in a safe and efficient manner. 8.5 Highway 219/214 Analysis Access to Highway was studied between the west city limits, and Settlemier Avenue. This section of roadway is approximately 1.6 miles long. Highway 219 extends west of 1-5, and Highway 214 east of 1-5. In this section, Highway is primarily a three-lane roadway consisting of one travel lane in each direction and a median lane for left turns. The Highway study segments are summarized in Figure 25. Currently there are traffic signals at: the southbound 1-5 ramp terminal; Evergreen Road; Oregon Way; and Settlemier Avenue/Boones Ferry Road. For the purposes of the analysis, this segment of Highway was divided into six subsections: Segment 1: West city limits to Woodland Road; Segment 2: Woodland Road to Interstate 5; Segment 3: Segment 4: Interstate 5 to Evergreen Road; Evergreen Road to Oregon Way; 66 Kittelson & Associates, Inc.

77 LEGEND I L v////////a - LIMITS OF ACCESS MANAGEMENT ANALYSIS I URBAN GROWTH BOUNDARY I ACCESS MANAGEMENT STUDY CORRIDORS
78 Highway 219/214 & 99E Access Management Analysis June 1996 Woodburn Transpotiation System Plan Segment 5: Segment 6: Oregon Way to Broughton Way; and Broughton Way to Settlemier AvenuefBoones Ferry Road. A review of ODOT accident data ( ) showed that, on average, eight accidents per year occurred on Highway 214 between the west City limits and 1-5 (0.58 miles). This equates to an accident rate of 6.0 accidents per million vehicle miles. The statewide average for similar types of roads is 3.6 accidents per million vehicle miles. Between 1-5 and Boones Ferry Road (1.06 miles), the accident rate for the same period is 3.3 accidents per million vehicle miles. This rate is lower because of the longer roadway section, and the low incidence of accidents east of Evergreen Road. The majority of the accidents occurred in the westerly one-half mile of this segment Segment 1: West City Limits to Woodland Road Traffic Operations Under existing conditions, the intersection of Woodland RoadMighway 219 operates at LOS B. Over the three year study period summarized in Technical Memorandum #2 (1992, 1993, and 1994), there were five accidents at both the intersections of Woodland and Willow Avenues. In the future (2015) it is expected that approximately 15,000 vehicles per day will travel on this segment of Highway 219. Currently, approximately 9,500 vehicles per day travel on this section of roadway. Because of this higher volume of traffic, and in order to maintain acceptable traffic operations, the City plans to extend Arney Road to Woodland Road, with the existing Arney Road intersection converted to a right-in right-out intersection, and a traffic signal installed at Woodland Road. Access Issues and Potential Modifications Existing access conditions in this road segment are shown in Figure 26. The segment of Highway 219 between the west city limits and Woodland Road is approximately 114 mile in length and is in the early stages of light industrial/warehouse development on the south side of Highway 219, west of Woodland Road. Access to this 100+ acre industrial site is via Woodland Road south of Highway As this area develops, an internal road system should be created to provide access to the parcels and circulation to Woodland Road. It appears that a curb cut could be provided at the westerly end of this property, approximately 1,200 feet west of Woodland Road to provide a secondary access into and out of the industrialfwarehousing area. The area to the north of Highway 219, between Woodland Road and the west city limits, is primarily residential. As this area redevelops, care must be taken to control access along this portion of Highway 219 and provide the major access to this area via Woodland Road. Since in this section of roadway, with the exception of the public roadways, there is no direct private access onto Highway 219, the driveway density is equal to zero. Thus, related to driveway density, there are no issues in developing compliance with the Oregon Highway Plan Access Management Policy. 68 Kittelson & Associates, lnc.

79 HIGHWA Y 219/214 EXISTING ACCESS WEST ClTY LIMITS TO OREGON - - WAY ClTY OF WOODBURN TRANSPORTATION SYSTEM PLAN JUNE 1996 FFt la. 1373F002 CDR
80 June 1996 Woodburn Transportation System Plan Highway 219/214 & 99E Access Management Analysis Segment 2: woodland Road to interstate 5 Traffic Operations Under existing conditions, approximately 9,500 vehicles per day use this section of roadway. In the future it is forecast that 23,000 vehicles per day will use this segment. In order to accommodate this volume of traffic, it is expected that in the future, Arney Road will be extended to Woodland Road, and the existing Arney Road intersection will be converted to a right-in-right-out intersection. The previous alternativeslneeds analysis (Technical Memorandum #4) also showed that in the future, if the existing diamond interchange configuration is maintained, the southbound 1-5 ramp and Highway 2 14 bridge over 1-5 will need to be widened to include second left turn lanes on the southbound and westbound approaches, with the Highway 214 eastbound approach also widened to include an additional through lane and a right turn lane. Considering the OHP Access Management Policy, it is important to note that signals at the Woodland RoadHighway 214 and southbound I-51Highway 219 intersection, will be approximately 1,150 feet apart. This separation is slightly less than the 1,320 foot (l/4 mile) separation called for in Category 5 of the Access Management Policy (see Table 11). Given the signal spacing in this section, and in other sections of Highway 214, as traffic signals are installed on Highway it will be necessary to perform a detailed corridor operations analysis to verify that traffic operations with the traffic signals will be acceptable, in particular accommodating vehicle progression through a series of signals east and west of 1-5. Access issues and Potential Modifications Highway 219 between Woodland Road and 1-5 is approximately 1,150 feet in length with no private driveways in this segment. The only access in this section of roadway is Arney Road, which intersects from the north approximately equal distance between the southbound 1-5 ramp intersection and Woodland Road. Arney Road serves some freeway commercial development north of Highway 2 19 and a significant amount of undeveloped commercially-zoned land north of Highway As there are no existing driveways in this section, the driveway density is equal to zero, which clearly meets the guidelines for Category Urban 5 of less than 18 driveways per mile (see Figure 26). It is expected that no driveways will be added in this segment in the future Segment 3: Interstate 5 to Evergreen Road Traffic Operations Under existing conditions. during the peak traffic periods. this is a very congested section of Highway 2 14, with one of the poorest intersections within the City of Woodburn identified at the intersection of the northbound 1-5 ramps and Highway Significant vehicle queuins occurs at this intersection as well as at the intersection of Highway 214 with Evergreen Road. Currently approximately 19,500 vehicles per day travel on this section of roadway. In the future it is forecast that as many as 35,000 vehicles per day will travel on this segment Kittelson & Associates, Inc 71
81 Highway 219/214 & 99E Access Management Analysis June 1996 Woodburn Transportation System Plan In the near future, it is recommended that the northbound Interstate 5 rampsfhighway 214 intersection will be signalized. A signal is warranted at this location based on existing traffic volume. This intersection is approximately 900 feet west of the intersection of Evergreen RoadfHighway 2 14, which is currently signalized. In this case, these two traffic signals would be spaced closer than the 114 mile spacing standard called for in Category 5 of the OHP Access Management Policy. In addition, a traffic signal at the northbound 1-5 ramps would be spaced approximately 750 feet from the existing traffic signal at the 1-5 southbound ramps. This spacing is also less than the 1/4 mile spacing specified in the Access Management Policy guidelines. Adetailed signal operations analysis in this corridor (Evergreen Road to Woodland Road) is necessary to verify that with traffic signals installed at Woodland Road, and the northbound 1-5 ramps, acceptable traffic progression can be maintained. The accident analysis revealed that there were 29 accidents during the three year study period at the 1-5 ramps onto and off of Highway 214. This incidence of accidents is most likely caused by the congestion, queuing, and low sight distance for vehicles turning onto northbound 1-5 from westbound Highway 214. With an improved interchange, it is ikely that the incidence of accidents will decrease. Access Issues and Potential Modifications This segment of Highway 214 is approximately 900 feet in length and i: s highly developed with freeway commercial uses. On the south side of Highway 2 14, there are five driveway locations along this segment serving three businesses (see Figure 26). Two of the three businesses are service stations which, as currently developed, require two driveways at each site for circulation. The public street access located approximately 200 feet east of the northbound 1-5 ramp intersection, serving the property south of Highway 214, should be closed, with an internal street connection to Stacy Allison Way to direct site traffic to Oregon Way. On the north side of Highway 2 14 through this section, there are six driveways serving three businesses adjacent to Highway 214. In addition, there are two major access points serving development located feet north of Highway 214. It is recommended that two of the six driveways along this segment of Highway 214 be closed. The public access serving the property to the north of Highway 2 14 was recently realigned to intersect Highway 2 14 directly across from Evergreen Road. With this local access relocation complete, it would be possible to develop an easuwest roadway parallel to Highway 2 14 on the north side to intersect with the new roadway being constructed opposite Evergreen Road (see Figure 26). Consideration should be given to extending this access road east of Evergreen Road parallel to Highway 214 to intersect with Country Club Road. Under existing conditions, on the north side of Highway 214, there are approximately 35 driveways per mile); on the south side of Highway 2 14 there are approximately 29 driveways per mile (see Table 10). In both cases the driveway density exceeds the guidelines outlined in the Access Management Classification System. On the north side of Highway 2 14, if driveways are consolidated as described. driveway density would decrease to 33 driveways per mile which is closer to the Access Management Policy guidelines. 72 Kittelson & Associates, lnc. --
82 June 1996 Woodburn ~ransporlation System Plan Highway 219/214 & 99E Access Management Analysis Segment 4: Evergreen Road to Oregon Way Traffic Operations This section of Highway 214 operates in a similar fashion to the previously described section. During the peak period there is a great deal of congestion and vehicle queuing at the major intersections. The Highway 21410regon WayICountry Club Road is a signalized intersection, separated from Evergreen Road by 650 feet. As previously shown in Table 11, this spacing is less than the Oregon Highway Plan guidelines of 1,320 feet for a Category 5 Urban roadway. Over the three year accident analysis period, there were 12 accidents at Evergreen Road, eleven accidents at Country Club Road, and five accidents at Oregon Way. These accidents were most likely caused by the close proximity of the intersections, the offset alignment of Country Club Road and Oregon Way, as well as the congestion in the area. The recent realignment of Country Club Road and Oregon Way into a single intersection should reduce the incidence of accidents in this segment in the future. Access'lssues and Potential Modifications This segment of Highway 2 14 is approximately 650 feet in length and is developed with freeway commercial uses. Traffic signals are located at the Evergreen Road and Oregon WayICountry Club Road intersections. On the south side of Highway 214 there are six driveways serving four separate properties. There is one shared driveway between a service station and the Dairy Queen on the south side of Highway 214. The most easterly driveway on this segment of Highway 214 should be consolidated with the adjacent driveway in order to remove this driveway from the influence of the Country Club RoadiOregon Way intersection. On the north side of Highway 214 through this segment, Country Club Road was recently realigned to intersect Highway 214 at Oregon Way. There are two private driveways along this segment of Highway 214. In addition to these two driveways the Old Country Club Way intersection should be closed associated with the Country Club Road realignment. This public street intersection is within 150 feet of Oregon Way and is well within the influence of the Highway 21410regon Way intersection. In addition, the driveway which currently exists between the Old Country Club Way intersection and the new realigned Country Club Road intersection should also be closed. This property is best served from the north realigned off of Country Club Road. No other driveway relocations are recommended at this time. Figure 23 shows the existing driveway spacing in this section of Highway Under existing conditions, as shown again in Table 12, driveway density on the north side of Highway 214 is 25 driveways per mile; and on the south side the driveway density is approximately 50 driveways per mile. In the future, if driveways are consolidated as identified, the north side driveway density would decrease to eight driveways per mile which would meet Access Management Policy guidelines. The south side driveway density would decrease to 42 driveways per mile, which is still relatively high. Kittelson & Associates. Inc. - --
83 Highway 219/214 & 99E Access Management Analysis June 1996 Woodburn Transportation System Plan Segment 5: Oregon Way to Broughton Way Traffic Operations Under existing conditions, average daily traffic (ADT) on this segment of roadway is 17,000 vehicles per day. In the future, it is forecast that average daily traffic will grow to 33,000 vehicles per day. The recent accident analysis showed no accidents in this segment during the three year study period. Access Issues and Potential Modifications This segment of Highway 214 is approximately 1,800 feet in length and is well defined with curbing on both the north and south sides of the road (see Figure 27). There is a sidewalk along the entire south side. Within this section, the only access to Highway 214 is Cascade Drive, located on the south side of the road approximately 700 feet east of Oregon Way. It is expected that when the now vacant commercially-zoned parcel at the southwest comer of the intersection of Highway 214lCascade Drive develops, access to this property will be provided via Cascade Drive. In the 600 feet of Highway 214 just east of Cascade Drive, there are four driveways on the south side of Highway 214. Three of these driveways serve the Woodburn Fire Station, with a fire truck-actuated signal at one driveway. One of these access points is a curb cut to vacant commercially-zoned land. The north side of Highway 214 between Oregon Way and Broughton Way has no local access except for a 50 foot curb cut approximately 280 feet east of Cascade Drive (see Figure 27). This 50 foot curb cut serves a small triangular vacant commercially-zoned property which is land-locked because of residential development directly to the north. Although this driveway meets the current standards for driveway spacing, care must be taken as this property develops to ensure adequate sight distance and internal circulation on the property. Under existing and future conditions, driveway density in this section of Highway 214 satisfies the OHP Access Management Policy (see Table 12) Segment 6: Broughton Way to Settlemier AvenueIBoones Ferry Road Traffic Operations The average daily traffic on this segment, under existing and future conditions it approximately the same as the previous section. Currently the average daily traffic is 17,000 vehicles per day, and this is expected to grow to 33,000 vehicles per day. Under existing conditions the intersection of Highway 2 14Kettlemier Avenue/Boones Ferry Road operates at level of service C. It is anticipated that in the future, with improvements made to the signal timing and lane channelization, this intersection will operate at LOS E. The traffic signal spacing between this intersection and those traffic signals adjacent to it is greater than the quarter mile spacing called for in the Access Management Policy guidelines. The accident review showed that during the three year study period, , there were 18 accidents at this intersection. Compared to other intersections in Woodburn, this is a relatively high incidence of accidents. Most likely, the incidence of accidents can be reduced by restriping

84 HlGHWA Y 214 EXISTING ACCESS OREGON WAY TO SETTLEMIER AVE./BOONES FERRY RD. CITY OF WOODBURN.TRANSPORTATION SYSTEM PLAN JUNE 1996
85 ~ - June 1996 Woodburn Transportation Sfitem Plan Highway 219/214 & 99E Access Management Analysis the southbound approach to the intersection to include one left turn lane, one through lane and one right turn lane (as recommended in Woodburn TSP Technical Memorandum #4). Access Issues and Potential Modifications This segment of Highway 214 is over 1,700 feet in length and includes one public street access, Astor Street, on the north side of Highway 214, and one public street access, Leisure Street, on the south side of Highway 214 (see Figure 27). In addition to Leisure Street on the south side of Highway 214, there are nine private driveways in this 1,700 foot section. There are four single family residential units in this section, one office building, a children's day care center and an apartment complex. As the south side of the road develops in the future, it could be possible to eliminate four of the five residential driveways in the vicinity of Leisure Street. In addition, the two driveways serving single family homes across from Astor Way could be consolidated into one driveway in the future. Prior to redevelopment, driveway density will remain at 28 driveways per mile (see again Table 12), which exceeds the Access Management Policy guidelines. On the north side of Highway 214 between Broughton Way and Settlemier AvenueBoones Ferry Road, there are two private driveways. Generally, the area is developed with residential properties which front on a street parallel to Highway 214, and with the remaining portion of Highway 214 fronting on the golf course. One single family residential driveway exists near Astor Street near the north side of Highway 214, and a second driveway serving commercial property is located 110 feet east of Leisure Way. As the driveway density is six driveways per mile (which is less than the guidelines), no additional access schemes are recommended for this segment of Highway Highway 99E Analysis Access to Highway 99E was studied between Lincoln Street, the south terminus of the previous ODOT road improvement project along Highway 99E, to the south city limits (see again Figure 25). This section of roadway is approximately 4,000 feet long. Through this section, the highway consists of undefined driveway locations with a few short sections recently reconstructed with curb and sidewalks. Also through this section, Highway 99E is a five-lane roadway section with scattered older commercial development along its entire length. This area is expected to redevelop in the future. As this redevelopment occurs, care must be taken to improve the delineation of driveways, and in some cases, consolidate or close existing driveways. Currently there are traffic signals at the intersections of Highway 99E with: Lincoln Street, and Young Street (Highway 214). For the purposes of this access analysis, Highway 99E was divided into five subsections: Segment 1: Segment 2: Lincoln Street to Aztec Street, Aztec Street to Laurel Street, Segment 3: Laurel Street to Highway 214, Kittelson & Associates, lnc. 77
86 Highway 219/214 & 99E Access Management Analysis June 1996 Woodbur,., ransportation System Plan Segment 4: Segment 5: Highway 214 to Cleveland Street, and Cleveland Street to South City Limits. Highway 99E between Highway 161lHighway 214 and Highway 214 is 1.17 miles long (longer than the limits of the access management study corridor). In this segment of roadway, the ODOT accident data for the period ( ) showed a steady decline in the number of accidents per year in this segment of roadway. The calculated accident rate for 1993 was 2.6 accidents per million vehicle miles. This rate is below the statewide average rate for similar road segments of 3.6 accidents per million vehicle miles Segment 1: Lincoln Street to Aztec Drive Traffic Operations Under existing conditions, average daily traffic on this segment is approximately 21,000 vehicles per day. In the future it is forecast that average daily traffic will grow only slightly to 22,000 vehicles per day. Currently the intersection of Lincoln StreetIHighway 99E operates at LOS C or better. The traffic signal at Lincoln Street is approximately 3,000 feet away from the traffic signal at Young Street which exceeds the 1/4 mile spacing guideline in the Access Management Policy guidelines. The accident analysis showed that over the three year study period, there were 14 accidents at the Lincoln Street intersection. Compared to other intersections in Woodburn, this intersection has an intermediate-level accident history. Access Issues and Potential Modifications This segment of Highway 99E is approximately 1,000 feet in length (see Figure 28). There are seven private driveways along the west side of Highway 99E through this segment. These seven access locations should be consolidated into no more than four private driveways in this segment. As shown in Table 12, this would decrease driveway density from 37 driveways per mile to 21 driveways per mile. In addition, there are two public street accesses. There is little opportunity for developing parallel streets or frontage roads along the west side of Highway 99E through this segment. On the east side of Highway 99E there are ten private driveways (53 driveways per mile) which vary in curb cut widths of 12 feet to 82 feet. The two driveways on the northeast corner of Highway 99ELincoln Street should be closed. One of these driveways is located within the curb return of the Highway 99E/Lincoln Street intersection which results in a very hazardous and confusing circulation for motorists in the area. The 82 foot curb cut located on the east side of Highway 99E is not usable and therefore should be closed. In addition to the two driveways on the north end of Highway 99E near Lincoln Street, two driveways in the location of Aztec Drive should be closed. If the driveway consolidation were implemented, driveway density in this section would decrease from 53 driveways per mile to 3 1 driveways per mile, which exceeds the Access Management Policy guideline of 18 driveways per mile Kittelson & Associates, Inc.

87 * "-- HlGHWA Y 99E EXISTING ACCESS LINCOLN STREET TO SOUTH ClTY LIMITS ClTY OF WOODBURN TRANSPORTATION SYSTEM PLAN JUNE F002 CDR
88 June 1996 Woodburn Transporlation System Plan Highway 219/214 & 99E Access Management Analysis The East Blaine Drive intersection exists approximately midway between Lincoln Street and Aztec Drive on the east side of Highway 99E. This street could be improved and extended to the east, intersecting a possible parallel frontage road to Highway 99E located approximately feet east of Highway 99E between Lincoln Street and Aztec Drive Segment 2: Aztec Drive to Laurel Street Traffic Operations Existing ADT in this section of roadway is 16,000 vehicles per day. In the future it is forecast that traffic volumes will grow to 22,000 vehicles per day. Access Issues and Potential Modifications This segment of Highway 99E is approximately 1,100 feet in length with a majority of the west side of Highway 99E recently reconstructed with new curbs and a full sidewalk. There are three private driveways on the west side of Highway 99E in this segment. The only modification recommended in this section is possible consolidation of one driveway on the north end. Regardless of whether or not this consolidation is made, the future driveway density would satisfy the Access Management Policy guidelines (see Table 12). Nearly 300 feet of frontage on the east side of Highway 99E, south of Aztec Drive, has been reconstructed with a new curb and sidewalk. No private driveways exist in this segment. South of the end of the new curb and sidewalk to Laurel Street, there are four private driveways in this approximately 700 foot section. Two of the four driveways could be closed and access to the properties provided via Laurel Street. If, as properties redevelop, driveways were consolidated, the driveway density could decrease from 19 driveways per mile to ten driveways per mile, which would satisfy the OHP Access Management Policy guidelines. In addition, there is potential for developing an east side frontage road parallel to Highway 99E between Aztec Drive and Laurel Street. This frontage road would be a definite benefit to the area, particularly as the area redevelops Segment 3: Laurel Street to Highway 214 Traffic Operations Existing average daily traffic in this area is 16,000 vehicles per day. Similar to the previous segment, it is expected that this traffic volume will grow to 22,000 vehicles per day. Under existing conditions, the intersection of Highway 99EMighway 214Noung Street operates at LOS C or better. In the future it will be necessary to construct an extended exclusive westbound right turn lane in order to ensure acceptable traffic operations. With the modified lane striping, it is forecast that the intersection will operate at LOS D. The incidence of accidents at this intersection is relatively high. During the study period there were 41 accidents at this intersection; second only to the intersection of Highway 99ElHighway 214lHighway 21 1 where there were 58 accidents during the three year study period. Kittelson 8 Associates, Inc
89 Highway & 99E Access Management Analysis June 1996 Woodburn Transpottation System Plan The intersection of Highway 99EIHighway 214Noung Street is a signalized intersection. This intersection is located approximately 3,000 feet south of the Lincoln Street traffic signal. Access Issues and Potential Modifications This section of Highway 99E is approximately 900 feet in length. Much of the curb and curb cuts in this area are in disrepair or non-existent. There are eleven private driveways on the west side of Highway 99E between Laurel Street and Highway 214. These private driveways vary in width from 25 to 84 feet. Five of the eleven driveways could be eliminated or consolidated by means of a shared access. There is adequate set back in many of the businesses through this area that will allow some internal circulation between properties. This study section has the highest driveway density of all the study segments: there are 65 driveways per mile. In the future, if driveways are consolidated the driveway density could decrease to 35 driveways per mile (Table 12). There are ten private driveway locations on the east side of Highway 99E between Laurel Street and Highway 214. In addition, Tomlin Street exists approximately midway between Laurel Street and Highway 214. The curb cuts for the private driveways vary between ten and 35 feet in width. Five of the ten driveways could be closed or consolidated with adjacent driveways without major impact to the business operation in this area. In addition, some curb and sidewalk installation is required on Highway 214, east of Highway 99E. The curbing is required to delineate and reduce the wide access that exists east of Highway 99E and north of Highway 214. Consideration should be given to developing a parallel frontage road to Highway 99E between Highway 214 and Laurel Street in the future as this area begins to redevelop. This section has the second highest driveway density of all study segments. Currently, there are 59 driveways per mile. If the driveways were consolidated in the future, the density could decrease to 29 driveways per mile, which still exceeds Access Management Policy guidelines for Category 5 roadways Segment 4: Highway 214 to Cleveland Street Traffic Operations Currently, no accident, or traffic level of service problems have been identified in this segment. Existing average daily traffic is 11,000 vehicles per day. In the future, average daily traffic will grow to approximately 18,000 vehicles per day. If the South Arterial is constructed, it can be expected that there will be still higher traffic volumes in this segment. Access lssues and Potential Modifications This section of Highway 99E is approximately 550 feet in length. The only development on the west side of Highway 99E in this section consists of a card lock gas station at the southwest corner of Highway 99E and Highway 214 and a converted motellapartment complex immediately south of the gas station. There is some vacant developable land between the motel/apartments and the railroad. There are five private driveways on this 550 foot section of Highway 99E. One private access, to the gas station, is not usable with the current layout in the area. In addition, there are two accesses to the vacant portion of land just north of the.82 Kittelson & Associates, Inc.
90 June 1996 Woodburn Transportation System Plan Highway 219/274 & 99E Access Management Analysis railroad track. As this land develops it appears reasonable that the major access should be across from Silverton Avenue. However, this may result in some safety problems due to the close spacing between the access and the railroad. There are three private driveways located on the east side of Highway 99E between Highway 214 and Cleveland Street. These three driveways occur between Highway 214 and Silverton Avenue, and they serve commercial development. Two of these three driveways could be closed without impacting existing commercial operations. A formal curb should be developed on Silverton Avenue east of Highway 99E providing some separation between Highway 99E and the access to this property Segment 5: Cleveland Street to South City Limits Traffic Operations Similar to the previous study segment, currently no traffic level of service or safety problems have been identified in this segment of roadway. The existing and future average daily traffic volumes are similar to the previous section: 11,000 and 18,000 vehicles per day respectively. It can be expected that with the construction of the South Arterial, more traffic will use this segment of roadway and traffic conditions will change. Access issues and Potential Modifications This section of Highway 99E is approximately 550 feet in length. The only development on the west side of Highway 99E in this section consists of a card lock gas station at the southwest corner of Highway 99E and Highway 214Noung Street and a converted motel/apartment complex immediately south of the gas station. There is some vacant developable land between the motel/apartments and the railroad. There are five private driveways on this 550 foot section of Highway 99E. One private access, to the gas station, is not usable with the current layout in the area. In addition, there are two accesses to the vacant portion of land just north of the railroad. As this land develops it appears reasonable that the major access should be across from Silverton Avenue. However, this may result in some safety problems due to the close spacing between the access and the railroad. There are three private driveways located on the east side of Highway 99E between Highway 214 and Cleveland Street. These three driveways occur between Highway 214 and Silverton Avenue, serving commercial development. Two of these three driveways could be closed without impacting existing commercial operations. A formal curb should be developed on Silverton Avenue east of ~ighway- 99E providing some separation between Highway 99E and the access to this property. Kittelson & Associates, Inc. 83

91 Section 9 Transportation Syste m Pla
92 June 1996 Woodburn Transportation System Plan 9.0 Transportation System Plan 9.0 Transportation System Plan 9.1 Introduction This section of the city of Woodburn Transportation System Plan recommends the transportation improvements needed to carry the city forward into the future. The improvements have been identified as an outcome of the existing conditions analysis, alternatives analysis, and access management analysis. In all cases the recommendations are sensitive to the adopted goals and policies of the City of Woodburn staff and Transportation Task Force. 9.2 Roadway Plan A critical component of the Woodburn TSP is an updated roadway plan, identifying an appropriate functional classification of streets and associated design standards, and new and improved streets to meet future capacity and circulation needs Functional Classification For the updated Woodburn Transportation System Plan, the major change from the street functional classification plan in the 1985 plan was dividing the collector street designation into two categories. The first designation is a service collector, those collector streets which tend to provide more mobility than land access and thereby would tend to carry a larger volume of traffic. The second class of collector is the access street. These streets tend to provide more land access and less mobility. The traffic volume on these streets would tend to be less than on a service collector. Specific definitions for the different street classifications in the updated functional classification plan for Woodburn is as follows: Arterials -Streets which provide for traffic flows between activity centers. Major Arterial-Streets and highways which provide service to traffic entering and leaving the area and traffic to major activity centers in Woodburn. Minor Arterial-Streets which feed the major arterial system and support moderate length trips and service to activity centers. Collectors-Streets which link local streets with the arterial system. Service Collector-Streets which provide significant linkages with arterials and tend to accommodate a higher volume of traffic. Access Street-Streets which provide primarily single family residential local street access and tend to accommodate lower volumes of traffic. Local Streets-Streets whose primary function is to provide access to abutting land uses. Figure 29 shows the functional classification plan for each of the roads within the Woodburn Urban Growth Boundary. The major street designations are as follows: - -- Kittelson & Associates, Inc. 85 -
93 9.0 Transportation System Plan June 1996 Woodbum ~i-ansportation System Plan Major Arterial Highway Highway 99E Highway 2 11 Minor Arterial South Arterial Boones Ferry RoadISettlemier Avenue Front Street Hardcastle Avenue Young Avenue (Highway 99E to Front Street) Service Collector Parr Road Lincoln Street (East City limits to Front Street) Evergreen Road West Hayes Street (Settlemier Avenue to Evergreen Road) Arney Road Progress Way/Industrial Avenue Park Avenue (Lincoln Street to Highway 214) Gatch Avenue (Young Street to Lincoln Street) Cleveland Street (Highway 99E to Front Street) Woodland Drive (Amey Road to Highway 219) Access Street Woodland Drive (Amey Road to Willow Avenue) Cascade Drive (Highway 214 to West Hayes Street) Astor Way (Country Club Road to Highway 214) Country Club Road (Astor Way to Boones Ferry Road) Hazelnut Drive Brown Street (Cleveland Street to South Arterial) Truck traffic should be focused on Highways ,211,99E and the future South Arterial. Any hazardous materials routing should be focused on 1-5 in the north-south direction, and the South Arterial in the east-west direction. The specific alignment of the South Arterial (north or south alignment) will be determined as part of a refinement study to identify a final location and configuration for an 1-5 interchange improvement. Figure 29 also shows potential local street connections in the future to provide better neighborhood access and circulation. This includes extending existing dead-end streets where possible as well as developing connected local street systems within new developments. 86 Kittelson & Associates, Inc.

94 INSET SPLIT DIAMOND INTERCHANGE ROADWAY SYSTEM OPTION NORTH (NOT TO SC*LE) - 1. INCOMPLETE FUNDING PLAN. NO CONSTRUCTION DATE SCHEDULE FOR 1-5 INTERCHANGE. HIGHWAY MAJOR ARTERIAL ---- SERVICE COLLECTOR 2 14/2 19. AND SOUTH ARTERIAL IMPROVEMENTS. MINOR ARTERIAL ACCESS STREET 2. CONFIGURATION FOR 1-5 INTERCHANGE AND SOUTH ARTERIAL IMPROVEMENTS TO BE RESOLVED I) POTENTIAL LOCAL IN REFINEMENT STUDY. FREEWAY SOUTH ARTERIAL/^^- (FUTURE ROAD) INSET 2 2nd 1-5 INTERCHANGE ROADWAY SYSTEM OPTION STREET FUNCnONA L CLASS1 FICA TI0 N PLAN CITY OF WOODBURN TRANSPORTATION SYSTEM PLAN JUNE 1996
95 June 1996 Woodburn Transportation System Plan 9.0 Transportation System Plan Street Standards Figure 30 presents typical cross sections for the different street functional classifications. The cross sections reflect the desire to develop multi-modal roadway facilities in Woodburn in the future, incorporating sidewalks and bike lanes where possible. The identified cross sections are intended for planning and design purposes for new road construction, and where it is physically and economically feasible to improve existing streets. The typical street sections present standards for both traditional subdivision width local residential streets, as well as "skinny" streets with restricted width. A developer would have the prerogative of developing skinny streets in their development to reduce cost and provide more of a pedestrian environment, particularly applicable to more compact residential areas (often referred to as neo-traditional development). Skinny street sections also could serve as a deterrent to through or speeding traffic on local streets. The identified skinny street sections are consistent with similar standards adopted by the City of Portland and Washington County. The widest road sections are associated with major and minor arterials, with five travel lanes desirable on new or improved major arterials (two through lanes in each direction plus a center left turn lane), and three lanes on minor arterials (one through lane in each direction plus a center left turn lane). These roads could have raised median development in lieu of a center left turn lane in certain locations, per final access management plans developed for such facilities. A service collector could have either two or three lanes, while all access streets would be two lane facilities. On-street parking would be discouraged on arterial and service collector streets, but allowed on access streets. Bike lanes would be an integral part of all new arterial and service collector streets. Sidewalks on both sides of all new arterial and collector streets will be required. Major reconstruction of existing arterials and collectors will include sidewalks and bikeways if right-of-way conditions permit Required Street Upgrades Freeways An element of the TSP is an improvement to the existing I-YHighway 2 14 interchange. In the short-term, the following improvements are required: Southbound 1-5 RampIHighway 214 Intersection: Add a second left turn and right turn lane on the southbound 1-5 off-ramp; restripe the eastbound intersection approach to include a through lane and a right turn lane; add a second left turn lane to the westbound approach. Northbound 1-5 RampIHighway 214 Intersection: Signalize; add a second right turn lane on the northbound 1-5 off-ramp; add a second left turn lane to the eastbound approach; add a second through lane to the westbound approach. In the longer-term, a reconfiguration of the interchange is proposed. A specific improvement (including but not limited to the following: improve existing interchange, split diamond interchange or second interchange at Butteville Road) will be identified through a follow-up interchange refinement study to the TSP. The specific alignment for the western portion of the South Arterial will also be identified in this study. The South Arterial will have a grade separation with 1-5, and have a direct connection to 1-5 under either the split diamond or second Kittelson & Associates, Inc. 89
96 9.0 Transportation System Plan June 1996 Woodburn Transportation System Plan interchange alternatives. The alignment of the South Arterial will need to be coordinated with site development plans on both sides of 1-5. For the purposes of illustrating how the South Arterial and connecting roadways would tie into the overall street, transit, pedestrian, bicycle, and golf cart facilities, the existing interchange with a northerly alignment for the South Arterial is used to illustrate the functional classification and associated pedestrian and bicycle facilities along this roadway and connecting streets. The 1-5 split diamond interchange option (with a north alignment for the South Arterial) and the second plan configurations with 1-5 interchange (with a south alignment for the south alignment for the South Arterial are shown as plan insets). Major Arterials Highway 219/214 Highway 214 is proposed to be widened to a fiv cility from Woodland Ave :nue on the west to Highway 99E on the east, with the potential for such widening extending east of Highway 99E to the east city limits. A final access management plan for this roadway should be developed associated with future project development studies for such improvements, based on the access management concepts identified in the access management analysis conducted as part of the Woodburn TSP development. Improved signal coordination along this roadway is also proposed. In addition to the before-mentioned improvements to the 1-5 ramp intersections, there are two other major intersection improvements required along Highway 214 in the short-term, irrespective of this roadway being widened to five lanes. These improvements include: Highway 214lSettlemier Avenue-Optimize the signal timing to minimize delay; add a second left turn lane on the northbound approach; and restripe the southbound approach to the intersection to include one left turn, one right turn, and one through lane. Highway 214lHighway 99E-Add a second left turn lane to the eastbound intersection approach; restripe the westbound intersection approach to include one left turn lane, one through lane and one right turn lane; and add a second left turn lane to the northbound intersection approach. Highway 99E Highway 99E would remain a five-lane facility, with access management and sidewalk improvements on the section south of Lincoln Street. A final access management plan should be developed for this section as part of future project development studies, based on the acdcess management concepts developed as part of the Woodburn TSP study. As for Highway 2 14, improved signal coordination on this roadway is proposed. At the Highway 99E/Young Street intersection, the reconfiguration of the east approach to the intersection is required, in particular realigning Cannery and George Streets away from the intersection. A westbound right turn lane on this approach is also required. 90 Kittelson & Associates, Inc.
97 MAJOR ARTERIAL.MINOR ARTERIAL loo' ROW J 74' PUBUC UnUrr I I PUBUC t~tilll7 WEYUtrj PARKWAY STRIP PARKWAY STRIP SIDEWALK BIKE W E TRAVEL M E S LEFT NRN M E (UIR W SIDEWALK 20.' ( 8' 1 4.5' 1 6' 12' I 12' 1 14' 1 2 ' ' ( 6 ' ( 4. 5 '!. 8 ' 1 4 I I I - I - 1 I - I I 1 I I WBUC MUTT WEVEHTL P I 74' ROW I PARKWAY PARKWAY STRIP TRAVEL TRAVEL STRIP SIOEWALK BlKE W E M E LEFT TURN M E W E BlKE W E SIOEWALK PUBUC UTILITY I WEYENT LOCAL RESl DENTlAL W/PARKING BOTH SIDES - "SKINNY" STREET, PUeW mutt t-, M' ROW PARKWAY STRIP SIDEWALK PARKING %YL PARKINC SIDEWALK I PUBLIC mutt fe SERVICE COLLECTOR I t- PUBLIC UTILITY 1 PUBLIC UTIUTY PARKWAY PARKWAY TRAVEL STRIP WEYENT L LANE LLFT NRN LANE %? BIKE M E SIOEWALK,! 12' I 12' 1 6' 14.5'1 6'.( - I I I 1 t PARKWAY 50' ROW TRAVEL W E PARKWAY STRIP PUBLIC LmUTY fweuehr ACCESS W/BIKE STREET LANES t- 60' ROW -- I x*. I P U B unun ~ ~ i -i I PUBLIC unm PARKWAY PARKWAY WEYEHT\ STRIP TRAVEL STRIP EASEMENT. SIDEWALK BIKE M E M E %? BIKE UNE SIDEWALK LOCAL RESIDENTIAL W/PARKlNG ONE SIDE - "SKINNY" STREET I 70' ROW -1 50' ROW PUBW MUlY PARKWAY PARKWAY PUBLIC unm STRIP OJEYENT\ TRAVEL ACCESS STREET W/PARKING OR I I GOLF CARTS PUBLIC mutg PUBLIC unm WEYENTL PARKWAY PMKWAY STRIP STRIP f-zgg-.. nomu TRAVEL ME SIDEWALK.. LOCAL RESIDENTIAL STREET W/PARKING BOTH SIDES I 60' ROW. I 34' WBUC unm I t 4 PARKWAY PARKWAY &T\ STRIP TRAVEL TRAVEL SFRIP 5. SlOEWALK PARKINC UNE UNE PARKING SIOEWALK I 4.5' 1 7' 1 10', 10' 1 7' 1 4.5'1-5. I - I I I I I I I /WEYEHT LOCAL RESIDENTIAL W/ NO PARKING,STREET TYPICAL CROSS SECTION CITY OF WOODBURN TRANSPORTATION SYSTEM PLAN JUNE 1996
98 June 1996 Woodburn Transportation Sya'ern Plan 9.0 Transportation System Plan Highway 211 Highway 21 1 is envisioned to be either a three or five lane section east of Highway 99E in the future, pending the level of development along the roadway and the increase in traffic volumes. Minor Arterials The major minor arterial improvement in the TSP is the construction of a South Arterial between Highway 219 on the west and Highway 99E on the east. This roadway could tie into a new or modified 1-5 (pending the results of an interchange refinement study). The road would be five lanes between Highway 219 and Evergreen Road, and three lanes east of Evergreen Road. This roadway would promote infill of existing vacant residentially zoned land in the southern part of the City within the UGB. Front Street from Boones Ferry Road to Cleveland Street, from Hardcastle Avenue to Highway 214, and north of Woodburn High School is proposed to be improved to a widened 2-3 lane section. Likewise, Boones Ferry Road north of Highway 214 is envisioned to be improved to a three lane facility. Service Collectors Evergreen Road would be extended to the south to intersect the South Arterial wherever it is located. Service collector improvements are proposed along certain existing streets to create minor widening to develop bike lanes and sidewalks. In particular, West Hayes Street, Parr Road, and Arney Road should be widened. Also Cooley Road should be extended south of Lincoln Avenue to create a new north-south road east of Highway 99E. Access Streets Access streets in need of widening to accommodate bike lanes include Woodland Avenue north of an extended Arney Road, and Brown Street south of Bradley Street State Highway Access Management Strategies There are operational and policy approaches to meeting the OHP Access Management Policy guidelines. From an operational perspective, the City of Woodburn and ODOT could (where appropriate) consider: planning for and developing a parallel road system which would provide local access to businesses adjacent to Highways and 99E and reduce local traffic volumes on Highway 99E; planning for and developing intersection improvement programs in order to regularly monitor intersection operations and safety problems; purchasing right-of-way and closing driveways; installing median barrier and driveway access controls; and/or installing two-way left turn lanes. Kittelson & Associates. Inc. 93
99 9.0 Transportation System Plan June 1996 Woodburn Transportation System Plan Purchasing right-of-way and closing driveways, without a parallel road system and/or other local access can seriously effect the viability of the businesses impacted. Thus, if this approach is taken, either a parallel road system, or shared access needs to be developed prior to "land-locking" a business. There are also trade offs which need to be considered when considering the advantages and disadvantages of installing a median or two-way left turn lane. A median will prevent motorists from crossing the highway mid-block in order to access businesses on the opposite side of the street. But a median could also increase the volume of left turning or U-turning traffic at the signalized intersections, which could have a negative effect on intersection operations. Alternately research has shown that two-way left turn lanes have a greater effect on reducing accidents than medians1. However there are obviously conflicts and confusion which can occur when motorists are using two-way left turn lanes in areas with a high driveway density. To assess the need for median access control, driveway density, average daily traffic, queuing information, and detailed mid-block accident data is needed. As the mid-block accident data was not available for this study, the assessment was not performed. From a policy perspective, as part of every land use action, the City of Woodburn and ODOT should evaluate the potential need for conditioning development with the following items in order to maintain andlor improve traffic operations and safety along Highways and 99E in Woodburn: Crossover easements should be provided on all compatible parcels (topography, access, and land use) to facilitate future access between adjoining parcels. Figure 3 1 shows how this process would, in the long run, facilitate compliance with the ODOT Access Management Classification System. Conditional access permits should be issued on developments which have proposed access points that do not meet the designated access spacing policy andlor have the ability to align with opposing driveways. With a conditional access permit, when there is an opportunity to rectify this condition, the ODOT would have the right to require this correction. Right-of-way dedications should be provided to facilitate the future planned roadway system in the vicinity of the proposed development. Half-street improvements (sidewalks, curb and gutter, bike lanedpaths, and/or travel lanes) should be provided along site frontages which do not have full-buildout improvements in place at the time of development City Street Access Management Strategies From a policy perspective, the City of Woodburn will manage access on new arterial and collector streets within its jurisdiction to provide efficient traffic movement and enhance safety. Policies would include criteria for street and driveway access, design of access and utilization of shared access when feasible. The City also intends to implement these policies along existing arterial and collector streets when significant redevelopment takes place. 1 FHWA, Technical Guidelines for the Control of Direct Access to Arterial Highways, August, Kittelson & Associates, Inc.


100 Proposed Access Management Strategy Joint and Crossover Easement Access Management Strategy LOTA I LOT B I LOT C I LOT D / LOTA 1 LOTB I LOTC I LOTD 1 I Minimum &cas Spa5mg = 5LU R. Step 1 Existing / / Joint and Crossover Easement Access Management Strategy I 1 LOTA I LOTB I LOTC I LOTD 1 i Step 2 Joint and Croswer Easement Access Management Strategy LOTA 1 LOT B I LOTC I LOT D 1 Step 3 Step 4 j Joiit and Crossover Easement Access Management Strategy i I I M A I LOT8 I LOTC I LOT D! 1 Joint and Crossover Easement Access Management Strategy i I LOT A / LOT B 1 LOTC ( LOTD Step 5 Step 6 CITY OF WOODBURN TRANSPORTATION SYSTEM PLAN APRIL 1996!273E'223! C!X
101 9.0 Transportation System Plan June 1996 Woodburn 1 ransportation System Plan 9.3 Transit Plan The transit plan for the City of Woodburn includes both improved intracity transit service as well as developing an intercity shuttle bus service. Pending long-terms for intercity passenger rial service in the future, there is also the possibility of developing a downtown transportation center. Figure 32 illustrates the basic fixed route transit services in the plan lntracity Transit Service The existing Woodburn fixed route transit system, operated by the.city of Woodburn, is recommended to be initially expanded by converting the existing single bus route to two-way operation. Service frequency would be every 60 minutes, with service expanded to weekends. Over time, as ridership develops, service frequency could be expanded to every 30 minutes, at least during peak periods. As the residential area along north Boones Ferry Road, and the commercial area along Arney Road develop, minor deviations from the existing route should be considered to serve these areas. Bus service should also be extended to the Woodburn Industrial Park via Progress Way and Industrial Avenue. To operate a two-directional bus route at 60 minute headways, one added bus will have to be acquired. If service is increased to every 30 minutes, three added buses will be required. In addition to the fixed route bus service, the existing paratransit service provided by the City should continue to be provided, as well as a continuation of the Woodburn Taxi operation. In the longer-term, as Woodburn continues to develop, and particularly if the City obtains an intercity passenger rail stop, consideration should be given to expanding the fixed route bus system to include two routes: east and west of the railroad tracks. Both routes would be oriented to a downtown transportation center, where intercity bus (and possibly) rail service would connect with the local system. A downtown transportation center should be located along Front Street, with at the minimum an auto passenger dropofflpickup area provided. A limited park-n-ride facility could also be provided Intercity Transit Service An added component of the Woodburn transit plan is the initiation of shuttle bus service between Woodburn and Portland and Salem. Top priority should be given to establishing service to downtown Portland, with an intermediate stop at the Tualatin park-n-ride. The second priority would be to establish service from Woodburn to downtown Salem, also serving the state office building area east of downtown. For each service, two round trips during both weekday AM and PM peak periods should be provided, with one midday round trip. 45-passenger buses are recommended for these intercity services, with two buses required for the Portland route, and one bus required for the Salem route. Consideration should be given to start-up of the Portland service with only one bus, with adding a second bus if ridership for this service develops. To access the intercity shuttle bus service, a park-n-ride should be established in Woodburn, with a maximum of 300 spaces. The park-n-ride ideally should be located in the vicinity of the I-SIHighway 214 interchange, such that local traffic from both sides of the interchange could easily access this facility. To reduce park-n-ride-oriented traffic through the interchange, this facility might best be located off the proposed South Arterial, where there is vacant land 96 Kittelson & Associates, Inc.
 POSSIBLE IN LONG-TERM, POSSIBLY CONNECTED TO DOWNTOWN TRANSPORTATION CENTER.")
102 NORM (NOT TO S M ) INSET SPLIT DIAMOND INTERCHANGE - ROADWAY SYSTEM OPTION 0 NORM (NOT TO SCKE) LEGEND INTERCITY BUS ROUTE AND DIRECTION OF TRAVEL OPTIONAL BUS ROUTING IN FUTURE AS AREA DEVELOPS INTERCITY SHUllLE BUS SERVICE NOTES; 1. TWO INTERCITY BUS ROUTES (EAST US WEST SIDE OF SOUTHERN PACIFIC RAILROAD) POSSIBLE IN LONG-TERM, POSSIBLY CONNECTED TO DOWNTOWN TRANSPORTATION CENTER. 2. PARK-IN-RIDE FOR INTERCIM SHUTTLE BUS SERVICE IN VICINITY OF I-5/HIGHWAY 214 INTERCHANGE. 3. INCOMPLETE FUNDING PUN. NO CONSTRUCTION DATE SCHEDULE FOR 1-5 INTERCHANGE. HIGHWAY 2 14/21 9. AND SOUTH ARTERIAL IMPROVEMENTS. 4. CONFIGURATION FOR 1-5 INTERCHANGE AND SOUTH ARTERIAL IMPROVEMENTS TO BE RESOLED IN REFINEMENT STUDY. INSET 2 2nd 1-5 INTERCHANGE PUBLIC TRANSPORTAUON PLAN CITY OF WOODBURN TRANSPORTATION SYSTEM PLAN!I INF lqq6
103 June 1996 Woodburn Transporlation System Plan 9.0 Transportation System Plan currently available. If a downtown transportation center is eventually developed, with the intracity bus service transfers at that location, consideration should be given to extending the intercity shuttle service into the city to serve this center as well. An extension of Salem Transit bus service to Woodburn could replace or supplement the need for intercity shuttle bus service between Woodburn and Salem Further Study The transit system analysis conducted as part of the Woodburn TSP study was a fairly cursory analysis, based on generalized transit demand assumptions in the future, and with no consideration on long-term vehicle maintenance and system administrative facility requirements. Modifications to the existing City paratransit system were also not explored. It is recommended that the City of Woodburn conduct a more detailed study of transit system improvements, by pursuing a separate "Transit Development Program" study. Funds for such studies are available from Federal Transit Administration Section 18 funding grants (administered by the ODOT Public Transit Division). An alternate funding source could be the ODOT TGM program, if extended beyond the next two years. 9.4 Pedestrian Facilities Plan The recommended pedestrian facility plan is shown in Figure 33. As shown in this figure it is recommended that sidewalks be constructed throughout the City to develop and maintain a comprehensive sidewalk system. Most importantly it is recommended that as new developments are constructed or as road improvements are made existing sidewalks be connected to new sidewalks. Sidewalks should be included in any.reconstruction of arterials or collectors. In addition it is recommended that an off-street pathway system be developed along existing creek corridors to facilitate non-automotive travel to schools and recreational, commercial and employment areas within Woodburn. 9.5 Bicycle Facilities Plan As shown in Figure 34, the recommended bicycle facility plan includes constructing bicycle lanes on most all roadways classified as service collector roads or higher. The figure also shows the existing bicycle lanes. When constructed this bicycle facility plan will provide a comprehensive system of bicycle lanes throughout Woodburn. This system will also interconnect with the recommended off-street pathway system allowing cyclists to travel off the main roadways to gain access to schools and recreational commercial, and employment facilities in Woodburn. Bike lanes should be incorporated into any arterial or collector reconstruction projects. 9.6 Golf Cart Facilities Plan The recommended golf cart facility plan is shown in Figure 35. This plan was developed to allow golf carts access to downtown Woodburn, the retail development west of Senior Estates in the southeast quadrant of the interchange, and the off-street pathway system. - - Kittelson & Associates, lnc. 99
104 9.0 Transportation System Plan June 1996 Woodburn Transportation System Plan 9.7 Rail Facilities Plan As part of the transit facilities plan, and in order to encourage intermodal travel, it is recommended that as the opportunity arises, the City of Woodburn strive toward the developmet of a passenger rail stop in downtown Woodburn. This would facilitate the development of a multi-modal transportation facility in the downtown area which would encourage travelers to use Woodburn Transit to travel to the rail station and the train to travel to other destinations outside of Woodburn. Regarding rail grade crossings, the city will make every effort to ensure that when appropriate rail grade crossings will be modified to ensure safe crossings for motorized and non-motorized modes of transportation. Modifications will be made in accordance with the guidelines described in the Manual on Uniform Traffic Control Devices (published by the United States Federal Highway Administration). 9.8 Air, Water, and Pipeline Transport Facilities Plan As there are no significant, air, water or pipeline transportation facilities in Woodburn, no transportation system planning was performed for these modes. 9.9 Transportation Demand Management Plan To encourage a reduction in the use of motor vehicles in the future, the City should adopt in its zoning ordinance requirements by developers to provide bicycle/carpool parking and carpool matching services, as well as incentives to employers to provide transit fare subsidies and flexible work hours, as well as promote telecommuting opportunities. Possible text modifications to the ordinance to incorporate these provisions is presented in Section 11. Institution of improved intracity bus service as well as new intercity bus service as identified in the Woodburn TSP also serve as TDM strategies. 100 Kittelson & Associates, lnc.

105 NOftTW (NOT TO W) 1-5 SPLIT DIAMOND INTERCHANGE ROADWAY SYSTEM OPTION NORTH (Nor TO W) 2nd 1-5 INTERCHANGE ROADWAY SYSTEM OPTION I LEGEND 1. INCOMPLETE FUNDING PLAN. NO CONSTRUCTION DATE FOR 1-5 INTERCHANGE, HIGHWAY 219/214, AND SOUTH ARTERIAL IMPROVEMENTS. EXISTING SIDEWALKS PEDESTRIAN 2. CONFIGURATION FOR 1-5 INTERCHANGE AND SOUTH ARTERlAL ~MPROVEMENTS TO BE RESOLVED = NEW SIDEWALKS IN REFINEMENT STUDY. cz,z2 NEW OFF-STREET PATHWAYS FACILITY PLAN CIP( Of WOODBURN.TRANSPORTATION JUNE 1996 SYSTEM PLAN
106 4'- 1-5 SPLIT DIAMOND INTERCHANGE ROADWAY SYSTEM OPTION NOTFS; 1. INCOMPLETE FUNDING PLAN. NO CONSTRUCTION DATE FOR 1-5 INTERCHANGE. HIGHWAY 219/214, AND SOUTH ARTERIAL IMPROVEMENTS. 2nd 1-5 INTERCHANGE ROADWAY SYSTEM OPTION 2. CONFIGURATION FOR 1-5 INTERCHANGE AND SOUTH ARTERIAL IMPROMMENTS TO BE RESOLVED IN REFINEMENT STUDY.
107 NORTH (NOT TO SCALE) 1-5 SPLIT DIAMOND INTERCHANGE ROADWAY SYSTEM OPTION NORTH (NOT r0 SCALE) 1. INCOMPLETE FUNDING PLAN, NO CONSTRUCTION DATE FOR 1-5 INTERCHANGE. HIGHWAY 219/Z 14. AND SOUTH ARTERIAL IMPROVEMENTS. 2nd 1-5 INTERCHANGE ROADWAY SYSTEM OPTION - NEW I I LEGEND I 2. CONFIGURATION FOR 1-5 INTERCHANGE AN0 SOUTH ARTERIAL IMPROVEMENTS TO BE RESOLVED IN REFINEMENT STUDY. GOLF CART FACILITY PLAN AREA WHERE GOLF CARTS PERMITTED ON LOCAL STREETS STREETS/PATHWAYS WITH CITY OF WOODBURN TRANSPORTATION SYSTEM PLAN JUNE 1996

108 Section 10 Transportation Financing Plan
109 June 1996 Woodburn Transportation System Plan 10.0 Transportation Financing Plan 10.0 Transportation Financing Plan 10.1 Introduction The Goal 12 Transportation Planning Rule (OAR ) requires that Transportation Systems Plans for cities with populations over 2,500 persons include a transportation financing program. Transportation financing programs must include a list of planned transportation facilities and improvements, and an estimate of the timing and costs of proposed projects. They must also include an analysis of the ability of existing and potential funding mechanisms to fund proposed transportation improvements. According to the 1993 Oregon Roads Finance Study, nearly one-third of Oregon's road miles are in poor condition. City transportation financing needs for the next 20 years total nearly $8 billion. Over 40 percent of this need is unfunded at this time. Woodburn almost certainly shares some of this unfunded transportation need. Growth pressures combined with the general anti-tax sentiment of Oregon voters make the development of adequate and equitable funding mechanisms an important part of an overall transportation strategy. The City of Woodburn will probably need to find new financing mechanisms to address transportation systems maintenance and improvements over the next 20 years. This memorandum provides an analysis of transportation financing options for the City of Woodburn. It describes transportation financing mechanisms used by the City, identifies and evaluates potential financing alternatives and programs, and describes funding guidelines associated with selected programs. The analysis of financing options began with a review of the City's budget and Capital Improvement Plans. This review identified the current status of transportation financing in Woodburn. To identify existing and potential funding programs existing studies were reviewed and phone interviews were conducted with people knowledgeable about transportation finance. Existing and potential funding mechanisms were evaluated against standard criteria: 1. Legal authority; i 2. Financial capacity; 3. Administrative cost; 4. Equity; 5. Political acceptability; and 6. Stability. Transportation funding sources are summarized in Chapter 3 In the financing program the termsfiinding andfinancing are distinguished. Funding describes any mechanism that generates revenue for transportation-related projects. Financing more narrowly refers to ways to spread out the impact of collecting funds through the issuance of debt obligations that are repaid over time, with interest. In other words, all transportation projects are funded by some means; some funding is financed by borrowing money to pay for the projects. Funding can occur on a pay-as-you-go basis or through various financing mechanisms. Kittelson & Associates, Inc. 107
110 10.0 Transportation Financing Plan June 1996 Woodburn Transportation System Plan 10.2 Existing Transportation Funding in Woodburn Transportation-related expenditures in Woodburn, including transit, are $1.4 million (approximately 17%) of Woodburn's proposed budget of $20 million Road-Related Funding Table 13 summarizes recent road-related transportation funding in Woodburn, for the last five fiscal years ( to ). This table consolidates revenues and expenditures tracked by separate funds in the City of Woodburn budget. Table 13 reports on the State Revenue Sharing, Street, City Gas Tax, Special Assessment, Streedstorm Drain Capital Improvement, and Transportation Impact Fee Funds. Table 13 Road-Related Funding in Woodburn ) Fees and Assessments 1 156, , , , ,028 1 A Bond Proceeds 0 0 Other Revenues 43,415 9,008 Total Revenues 1,102,278 1,224,687 I ,773 29,877 36,383 1,255,166 1,212,652 1,604,534 I Personal Services 192,676 Expenditures 217, , , ,507 Materials and Services 179, , , , ,551 r Capital Outlay Bond & Assessment 335, , , , ,692 0 Source: City of Woodburn Budget, , , , and Kittelson & Associates, lnc.
111 June 1996 Woodburn Transportation System Plan 10.0 Transportation Financing Plan Table 13 also reports as expenses transfers to the Street Equipment Replacement Reserve, Transit Equipment Replacement Reserve, and the Technical and Environmental Service Funds (these funds accumulate minor amounts of interest revenue that is not included in Table 13). Transit fund revenues and expenditures are reported separately in Table 14. Table 13 shows that the State Highway Trust Fund and other shared state revenue is the largest contributor to road-related revenue in Woodburn, contributing $486,000-$690,000, or about 50% of total road-related revenue. Locally-generated revenue includes the city's $O.Ol/gallon gas tax, LID bonds funded by assessments to property owners that benefit from improvements, Transportation Impact Fees paid by new development, and a gas and electrick utility privilege tax. Together, these revenues contribute 11-26% of road-related revenue. The city's gas tax is a stable source of revenue, ranging from $95, ,000 in the past five fiscal years, an average annual increase of 2.5%. LID assessments and Transportation Impact Fees (TIFs) vary widely with construction of specific projects and the amount of new development that pay impact fees. The City's TIF is a System Development Charge designed to assess new development for the costs of off-site transportation infrastructure needed to meet increased demand generated by the new development. A consultant developed a method for allocating the cost of road improvements to new development. The City Council adopted the TIF at 25% of the level recommended by the consultant; the fee will increase 1% per year for five years. At the end of the five year period the City Council will re-evaluate the TIF; FY96 is the third year of this five-year period. Capital Outlay expenditures typically account for 2341% of total annual city expenditures. Recent projects funded by LIDS include the K-Martmi-Mart traffic signal on Highway 214 ($123,000) and Cleveland Street improvements ($308,000). Capital improvements to the Woodland DriveMighway 214 intersection ($394,000) were funded by an Economic Development grant and property owner reimbursements. Remaining capital expenditures are for road resurfacing and various other improvements. Expenditures for Personal Services (wages, salaries, and benefits) and Materials and Services typically account for 45-58% of total annual city expenditures. The largest line item included in Materials and Services is for Street Light Installation and Operation, followed by Road Supplies and Materials. Materials and Services also includes a wide variety of smaller expenditure items, such as gasoline, uniforms, office supplies, insurance, and paint. Transfers/Contingencies/unappropriated funds are largely transfers to Technical and Environmental Services, for management of the Public Works Department and Garage, and to the Street Equipment Replacement Fund, which accumulates money to replace street equipment. Remaining expenditures are for administration of bond sales and property owner assessments, transfers to the Street Equipment Replacement Reserve Fund and the Technical and Environmental Services Fund, contingency set-asides, or unappropriated expenses. Kittelson & Associates, lnc. 109
112 10.0 Transportation Financing Plan June 1996 Woodburn Transportation System Plan Transit-Related Funding The Transit System Fund accounts for 4% of Woodburn's $3.4 million General Fund budget proposed for FY Table 14 summarizes revenues and expenditures in the Transit System Fund over the past five fiscal years ( to ), which reports separate accounts for the city's fixed-route transit and dial-a-ride services. Property tax typically provides 24-37% of total transit revenue in Woodburn. State grants and a special transportation grant (reported as Revenue From Other Agencies) are the second largest revenue source, typically providing 17-22% of total revenue. Transit fares, reported in Other Revenues, account for about 7-14% of annual transit revenue, reaching the highest percentage in FY Working Capital Carryover Table 14 Transit Funding in Woodburn [1990")1GT / Received Received Received Received Recei Revenues I Property Taxes 1 40, , , , ,385 /1 Interest from Investments Revenue from Other Agencies 49,175 5,010 61,862 53,776 3,747 33,688 63,392 3, ,577 69,615 68,782 2,469 31,019 4,072 30,656 Source: City of Woodburn Budget, , , , , and The $104,984 capital outlay in FY was for a bus that provides most of the transit service in Woodburn; this purchase was primarily funded by a state grant. In other years, expenditures for Personal Services and Materials and Services account for almost all transit expenditures. 110 Kittelson & Associates, Inc.

113 June 1996 Woodburn Transportation System Plan 10.0 Transportation Financing Plan 10.3 Summary Of Outlook For Existing Transportation Funding Sources The State Highway Fund should be a relatively stable source of revenue for Woodburn. Because these funds are distributed to cities based on population, Woodburn's share could increase or decrease depending on whether its population increases faster or slower than the state average. It is expected that Woodburn's population will grow at a rate greater than the state average. Nonetheless, Woodburn's share of state funds will probably not increase as fast as its street maintenance requirements will, as the system expands to serve the growing population and through traffic. State Revenue Sharing funds are likely to decrease gradually in real terms. ODOT's forecast of ISTEA revenue available to the state shows funds are not expected keep pace with inflation. Revenue from the City's $O.Ol/gallon Gas Tax may also gradually erode by increasing less than inflation. Since the tax is based on quantity rather than price, tax revenues will not increase with as gasoline prices rise. In fact, a large increase in gasoline prices could decrease tax revenue by reducing demand. Population growth and increased through traffic may cause Gas Tax revenue to increase faster than inflation in some years. Actual change in real Gas Tax revenues depends on the inflation rate, population growth, gasoline demand, and changes in the tax rate. We do not have enough information about these variables to accurately forecast the change in Gas Tax revenue relative to inflation. Bonds financed by Local Improvement Districts (LIDs) and fees from the Systems Development Charge (SDC) will remain important sources of transportation revenue in Woodburn. Future bond revenue depends on the willingness of property owners to form LIDs to levy assessments. Typically, LIDs are formed to finance projects that benefit existing or new commercial development, while SDCs are assessed only to new residential and commercial development. Population growth in Woodburn will increase SDC revenue and should contribute to continued support for LIDs because growth will increase the value of existing commercial property and create demand for new commercial development. To the extent that these funding sources charge the full cost of the transportation improvements, they should allow Woodburn to construct capital improvements to serve commercial and residential development. ODOT's forecast of ISTEA revenue available to small cities shows funds are not expected to keep pace with inflation. The actual amount Woodburn receives depends on whether the City has projects that qualify for ISTEA funding, the extent to which the City pursues the funds, and the level of competition for the funds from other small cities in Oregon. Since Woodburn has only occasionally received ISTEA funds in the past, it is not expected a significant increase in the share these funds contribute to transportation revenue. Property tax revenue to the City General Fund should increase faster than inflation due to continued rapid appreciation of real property values and new development in Woodburn. Property tax revenue will likely remain a significant source of revenue for transit operations. The forecast decline in the state's Special Transportation Fund should be offset by continued ISTEA funding for transit capital improvements and increasing revenues available for state matching grants. Woodburn has been successful in securing these funds for equipment purchases in the past and should continue to do so. State funds available for transit operation are expected to decline in real terms over the next 20 years unless taxes for transit are increased. The current Statewide Transportation Improvement Program (STIP) includes state revenue for transit operations in Woodburn-$86,700 in FY95 and $16,700 annually in the following three fiscal years. The STIP also includes $65,000 for Woodburn to purchase a transit vehicle in -- Kitteison & Associates, Inc. 111
114 June Transportation Financing Plan Woodburn Transportation System Plan FY96. Farebox revenue will probably continue to provide only a small share of transit revenues. In summary, it is expected that federal and state sources of transportation revenue to gradually decline in real terms over the next 20 years. Revenues from ISTEA and the State Highway Fund, even under the optimistic forecast of ODOT, are not expected keep pace with inflation. Woodburn's gas tax and utility privilege tax should remain a relatively stable source of revenue in this period, particularly if it is raised a few cents as gas prices rise. Population growth should help provide continued support for LID-financed improvements; SDCs assessed on new development will allow the City to put some money toward future improvements, and population growth will give the City a slightly bigger share of the State Highway Fund, which should remain at a near-constant level statewide Cost Estimates for Transportation System lmprovements Needed transportation improvements in the City of Woodburn were identified in the Transportation System plan presented in Section 9. Estimated costs for these improvements, were developed, with improvements grouped by the time period in which they should be constructed; 0 to 5 years, 5 to 10 years, 10 to 20 and 20+ years (Tables 15-18). In all, about $62 million (in 1995 dollars) of road and transit service improvements for the City of Woodburn over the next 20 years have been identified. Transportation improvements include changing the functional classification of some city streets and bringing certain streets up to the City standards for their classification. This process includes adding sidewalks and bike lanes to some streets. Tables present the total cost estimate for bringing certain streets up to City standards, including sidewalks and bike lanes and also identify the cost for adding only sidewalks to certain streets with physical constraints to pavement widening. In addition to costs for transportation improvements, the City of Woodburn envisions future operation and maintenance costs for street overlay, drainage, and lighting to be $750,000 annually over the next 20 years Financing Needed Transportation Improvements Potential federal sources of transportation funding are listed in Table 19 and state sources are listed in Table 20. The projects identified represent an ambitious program of roadway and transit capital improvements for the City of Woodburn. Constructing these improvements will require a significantly higher level of transportation expenditures than Woodburn has spent in the past. In the past five fiscal years, Woodburn spent a total of $935,216-1,310,745 each year for road improvements and transit service. Including $750,000 as the average annual operation and maintenance costs, the improvements identified will require Woodburn to spend per year in the next five years, per year in the following five years, and per year in the following ten years. It is expected that Woodburn will want to pursue funding sources for transportation improvements from the following sources: 112 Kittelson & Associates, Inc.
115 June 1996 Woodburn Transportation System pian 10.0 Transportation Financing Plan Table 15 Proposed Transportation Improvements: Next 5 Years Roadway System Capacity lmprovements 1-5 Interchange-Reconn. Study 1 $300,000 1 w, s, c Realign Arney Road to Intersect Woodland DriveIRestrict Arney Road Access $365,000 D on Highway 214 Extend Meridian Drive to Intersect Hazelnut Drive $700,000 D lmprovements to Meet Woodburn Street Design Standards Arney Road - Existing Arney Road to UGB ( $1,480,000 1 D Boones Ferry Road - Highway 214 to UGB Country Club Road - Boones Ferry Road to Astor Way 1 $590,000 1 D Front Street - Hardcastle Avenue to Hiqhwav $950,000 1 W Intersection/Access Management lmprovements Added Signal - Highway 214lNB 1-5 Ramp I $100,000 ( W Added Signal - Highway 214NVoodland Drive 1 $120,000 1 D Added Signal - Highway 214lFront Street $120,000 D Intersection Channelization - I-5lHighway $500,000 1 W, D lntersection Channelization - Settlemier AvenueIFront StreetIParr Road 1 $440,000 1 W Intersection Channelization - Hiahwav 214lSettlemier Avenue 1 $ W Signal Coordination Along Highway 214-Woodland Drive to Cascade Drive 1 $100,000 1 D Sidewalks West Hayes Street - Evergreen Road to Cascade Drive 1 $60,000 1 W Park Avenue - Lincoln Street to Hardcastle Avenue Brown Street - Cleveland Street to Bradley Street 1 $25,000 1 W Off-Street Pathways Mill Creek Corridor - Hazelnut Drive to Young Street 1 $620,000 1 W, D Public Transit System Improvements Increase lntracity Bus Service Frequency - Additional Vehicle $1 10,000 w. s Increase lntracity Bus Sewice Frequency - Operating Cost (2 years) $280,000 I I I I I I Funding Sources: S - State. W - City of Woodburn, C - Marion County, D - Developer Kittelson & Associates, lnc. 113
116 10.0 Transporta tion Financing Plan June 1996 Woodburn Transportation System Plan Table 16 Proposed Transportation Improvements: Next 6-10 Years Project Title Estimated Cost (1995 $) Potential Funding Source Roadway System Capacity improvements South Arterial - Woodland Drive to Boones Ferry Road 1 $6,550,000' 1 W, D 1-5 Interchange - Design/Environrnental Studies $1,000,000 Widen Highway Woodland Drive to Cascade Drive $2,460,000 Extend Evergreen Road to South Arterial $1,100,000 D Improvements to Meet Woodburn Street Design Standards Front Street - High School to UGB Brown Street - Bradley Street to South Bypass Evergreen Road - Highway 214 to Stacy Allison Way Parr Road - Front Street to UGB West Hayes Street - Cascade Drive to Settlernier Avenue I $1,800,000 $1,030,000 $550,000 $1,370,000 W, S, D W, S, D w, D D W, D w, D, C $800,000 W t I lntersectionlaccess Management lmprovements Funding Sources: S - State, W - City of Woodbum, C - Marion County, D - Developer 1 Cost estimate of northerly South Arterial alignment (with split diamond or existing interchange). I I 114 Kittelson & Associates, lnc.
117 June 1996 Woodburn Transportation System Plan 10.0 Transportation Financing Plan Table 17 Proposed Transportation Improvements: Next Years 1-5 Interchange Project Title Estimated Cost Potential (1995 $) Funding Source Roadway System Capacity Improvements Widen Highway Cascade Drive to Park Avenue South Arterial - Boones Ferry Road to Highway 99E $1,520,000 $3,070,000 w, S w, S Hardcastle Avenue - Cooley Road to Front Street Intersection Channelization - Highway 2141Highway 211lHighway 99E Sidewalks Astor Way - Highway 214 to Country Club Road $100,000 1 W I) Lincoln Street - Highway 99E to Gatch Street Various Local Streets (0-20 Years) Off-Street Pathways $75,000 $100,000 W W Mill Creek Corridor - Young Street to South Arterial I West Mill Creek Corridor - Mill Creek to UGB 1 $440,000 ( W I 1 Public Transit System Improvements 1 lntracity Bus System - Added Vehicles lntracity Bus System - Operating Cost (1 0 years) $360,000 1 Intercity Bus Service Phase 2 (to Salem) - Additional Vehicles 1 $150,000 1 W, S 1 lntercitv Bus Service Phase 2 (to Salem) - O~eratinq Cost (10 years) 1 $800,000 1 W, S 1 Intercity Bus Service Phase 1 - Operating Cost (1 0 years) Park-n-Ride - Phase 2 (100 spaces) Total Cost $330,000 $2,900,000 $300,000 $31,995,000 W w, s w, s W Funding Sources: S - State, W - City of Woodburn, C - Marion County, D - Developer 1 Cost estimate for 1-5 split diamond interchange. Kittelson & Associates, Inc. 115
118 10.0 Transportation Financing Plan June 1996 Woodburn Transportation System Plan Table 18 Proposed Transportation Improvements: Next 21+ Years Project Title (Time Period) Estimated Cost Potential (1995 $) Funding Source Improvements to Meet Woodburn Street Design Standards Cascade Street - West Hayes Street to Highway 21 4 / $ W Cleveland Street - Brown Street to Highway 99E $920,000 W I Woodland Avenue - Highway 214 to Willow Avenue 1 $940,000 1 W Total Cost 1 $2,360, Funding Sources: S- State, W-City of Woodburn. C - Marion County, D - Developer Kittelson & Associates, Inc.

119 I Program Name lntermodal Surface Transportation Efficiency Act (ISTEA) Surface Transportation Program Transportation Enhancement Program (Part of STP) Highway Enhancement System YES) Table 19 Summary of Transportation Funding - Programs: - Federal Sources Description ISTEA is designed to provide flexibility in federal funding of transportation projects, ISTEA established several funding programs including teh: 1) National Highway System; 2) Interstate Program; 3) Surface Transportation Program; 4) Congestion Management and Air Quality Improvements Program; and 5) National Scenic Byways Program. Federal funding for transity under ISTEA is discussed with the Special Transportation Grant Program under State Sources because these federal funds are combined with state and local funds. The Surface Transportation Program was uathorized by Title I of the ISTEA. The STP funds are allocated to the State and suballocated to cities and counties on a formula basis by the Oregon Transportation Commission. STP funds may be used for any road that is not functionally classified as a local or rural minor collector and must be included in the Transportation lmprovement Program to receive STP funds. The ISTEA includes provisions that require the State to set aside a portion of its Surface Transportation Program (STP) funds for projects that will enhance the cultural and environmental value of the State's transportation system. Eligible transportation enhancement projects must be directly related to the intermodal transportation system. This program funds enhancements including pedestrian and bicycle facilities; preservation of abandoned railway corridors; landscaping and other scenic beautification; control and removal of outdoor advertising; acquisition of scenic easements and scenic or historic sites; scenic or historic highway programs; historic preservation: rehabilitiation and ooeration of historic iran~~ortatioin buildings, structure's, or facilities; archaeoloaocial plannina and research: and mitiaation - of water pollution die to highwayrunoff. The FHWA Highway Enhancmeent System Program provides funding for safety improvement projects on public roads. Safety improvement projects may occur on any public road and must be sponsored by a county or city. To be eligible for Federal aid, a project should be part of either the annual element of a Regional Transportation Plan or the annual listing of rural projects by ODOT, although they do not have to be part of the approved State Highway lmprovement Program to receive HES funding. Potential for Woodburn Urban Area As a granvtransfer program, ISTEA provides opportunities to fund selected projects meeting the program's funding criteria. As with all grants, cost to local residents are low, political acceptability is high, and financial capacity and stability are less predictable than for many local funding sources. Woodburn should coordinate with the ODOT Region2 planner, and the Mid-Willamette Valley Council of Governments to identify projects that are suitable for funding under ISTEA. Each eligible city is suballocated as a portion of the State's STP funds. Cities can propose projects through their regional ODOT offices. The project sponsor (County, City, or State) must request inclusion of the project in the annual Statewide Transportation lmprovement Program. The STP provides opportunities to fund selected projects that meet program criteria. Woodburn should coordinate with the ODOT Region 2 planner, and the Mid-Willamette Valley Council of Governments to identify projects that are suitable for funding under ISTEA. Enhancement project applications are submitte dto the applicant's ODOT Region Manaaer. Proposed proiects are then screened and p$oritized bythe b ran sport at ion Enhancement Committee. Approved projects receive funding under the State's transportation enhancement activities program. Transportation enhancement projects are selected as part of the State Transportation lmprovement Program (STIP) development This program provides opportunities to fund selected projects that meet program criteria. Woodburn should coordinate with the ODOT Region 2 planner, and the Mid-Willamette Valley Council of Governments to identify projects that are suitable for funding under ISTEA. The HES provides opportunities to fund selected projects that meet program criteria. Woodburn should coordinate with the ODOT Region 2 planner, and the Mid-Willamette Valley Council of Governments to identify projects that are suitable for funding under ISTEA.
120 Table 19 Summary of Transportation Funding Programs: Federal Sources (continued) Program Name Timber Receipts (USFS) Community Deveiopment Block Grants (CDBG) Description The United States Forest Service shares 25 percent of national forest receipts with counties. By Oregon law (ORS ), Marion County then allocates 75 percent of the national forest receipts to the road fund and 25 percent to local school districts. Marion County has received an average of $3.5 million per year in timber revenues between FYB6 - FY90. The County Share of forest revenues is a gradual decline due to the "spotted owl compromise" under which counties are guaranteed revenues on a schedule set by Congress that gradually reduces this support over the next decade, reaching $2.1 million in FY03. Community Deveiopment Block Grants (CDBG) are administered by the Department of Housing and Urban Development (HUD) and could potentially be used for transportation improvements in eligible areas. I Potential for Woodburn Urban Area U.S. Forest Service revenues have permitted Marion County to make significant capital improvements to its road system. With respect to Woodbutn, timber revenues get mixed in with other sources to the Marion County Road Fund. Marion County has occasionally participated in cost-sharing with the city on project within Woodburn's city limits. Opportunities for county cost-sharing are discussed on a project-by-project basis, and Woodburn should continue to seek county cost-sharing where possible. Though its political feasibility has not been explored, there is an argument to be made that part of the County's allocation of federal timber receipts should be spent inside Woodburn because residents of Woodburn are also residents of Marion County. To some extent that already occurs: County Road Funds are used on County roads inside the UGB. They could also be used, however, on major city streets. CDBG has the potential to provide funding for eligible projects, but, the prospects for increased municipal revenues for CDBG are limited. Long-term stability of this source is uncertain. Cities have traditionally used CDBG funds for projects other than transportation. Although CDBG funds could be used for transportation, the City may have other priorities for this funding source. Overall potential of this source for transoortation fundina is low. Source:Conipiled by ECO Northwest
121 Program Name State Highway Fund Table 20 Summary of Transportation Fundinn Pronrams: State Sources Description The State Highway Fund composed of gas taxes, vehicle registration fees, and weight-mile taxes assessed on freight carriers. In 1994, the state gas tax was $0.24 per gallon. Vehicle registration fees were $15 annually. Revenues are divided as follows: percent to cities, percent to counties, and percent to the State Highway Division. The city share of the State Highway Fund is allocated based on population. Both Marion County and Woodburn use their allocations to fund street maintenance. ORS requires at least one percent of the State Highway Fund received by the State Highway Division, counties and cities be expended for the development of footpaths and bikeways. The Highway Division adminsiters the bicycle funds, handles bikeway planning, design, engineering and construction, and provides technical assistance and advice to local governments concerning bikeways. - Potential for Woodburn Urban Area Woodburn has received an average of about $569,000 annually from this source in recent years Marion County will receive about $12.2 million in FY95. Revenues from this source are relatively stable, but, because the State Highway Fund is not indexed for inflation, the relative share could decrease if taxes are not increased. The per capita allocation of state Highway Fund revenues will probably not increase significantly. The City should continue to use this source to fund street maintenance. Though its political feasibility has not been explored, there is an argument to be made that part of the County's allocation from the Oregon Highway Fund should be spent inside Woodburn because vehicle registrations inside Woodburn help generate those revenues, and Woodburn roads are used substantially by vehicles registered elsewhere in Marion County. To some extent that already occurs: County Road Funds are used on County roads inside the UGB. They could also be used, however, on major city streets. Special Public Works Fund (SPWF) Transportation Access Charges The State of Oregon allocates a portion of revenues form the state lottery for economic development. The Oregon Economic Development Department provides grants and loans through the SPWF program to construct, improve and repair infrastructure to support local economic development and create new jobs. The SPWF provides a maximum grant of $500,000 for projects that will help create a minimum of 50 jobs. The most familiar form of a transportation access charge is a bridge or highway toll. Transportation access charges are most appropriate for high-speed, limited access corridors; service in high-demand corridors; and bypass facilities to avoid congested areas. Congestion pricing, where drivers are charged electronically for the trips they make based on location and time of day, is the most efficient policy for dealing with urban congestion. It not only generates revenue for maintenance and improvements, but also decreases congestion and the need for capital improvements by increasing the cost of trips during peak periods. The Oregon Revised Statutes allow ODOT to construct toll bridges to connect state highways and improve safety and capacity. The Statues also allow private development of toll bridges. Recent actions by the Oregon legislature provide authority for developing toll roads. State authority for congestion pricing does not exist; new legislation would be required. The bikeway program provides opportunities to fund bicycle and pedestrian projects that meet program criteria. The City should work with ODOT Region 2 Planner identify projects that are suitable for funding under this program. Cities and counties can use SPWF funds for transportation projects. One potential use for SPWF funds is to develop infrastructure in office or industrial parks. As with all grant programs, stability and long-term potential of this source is uncertain. Woodburn should contact OEDD to pursue funding from this source. Toll roads are relatively uncommon in Oregon and would not receive public support unless the benefits 'improved access, safety, or decreased travel times) were clearly perceived by users. Despite its clear benefits, congestion pricing will be a tough sell in Woodburn. Congestion pricing, if pursured by the City of Woodburn, should cover all major roads and be viewed first as a congestion management strategy, and only secondarily as a revenue source.
122 Table 20 Summary of Transportation Funding Programs: State Sources (continued) Description The State maintains a ~olicv of sharina isntallation maintenance, and ope;ational costs f& traffic signals and luminaire units at intersections between State highway and city streets (or county roads), Intersections involvinga state highway and a city street (or county road) which are included on the state-wide priority list are eligible to aprticipate in the cost sharing policy. Potential for Woodburn Urban Area The Traffic Control Projects program provides opportunities to fund projects that meet programcriteria. Woodburn should coordinate with the ODOT Region 2 planner, and the Mid-Willamette Valley Council of Governments to identify projects that are suitable for funding under ISTEA. The Oregon State Highway Division establishes a statewide priority list for traffic signal installations on the State Highway Ssytem. The priority system is based on warrants outlined in the Manual for Uniform Traffic Control Devices. Local agencies are responsible for coordinating the statewide signal priority list with lcoal road requirements. The Community Transportation Program (CTP) provides grants for passenger transportation services for senior citizens, people with disabilities, and the general public. The CTP combines two programs that were previously run separately; the Special Transportation Grants (STG) program, the Small and Rural Area Capital Assistance Program. The Special Transportation Fund (STF) program provides ongoing revenue to transportation districts to finance transportation services for people over 60 years of age or people with disabilities. The fund may be used for the creation, maintenance or expansion of transportation services for the elderly and disabled. Counties, transportation districts, cities and nonprofit organizations are eligible for these funds. Private passenger transportation companies may also participate through service agreements with local governments. Eligible activities include planning, capital investments, operating assistance, system development, and transportation demand management projects. The Community Transportation Program is financed by a combination of State, Federal, and local matching funds. The program has two matching ratios. The matching ratio for capital purchase/construction projects and planning projects is: CTP Financing, 80 percent; and grant recipient 20 percent. The matching ratio for net operating expenses of an operating assistance proposal is; CTP Financing, 50 percent, and recipient, 50 percent. The Special Transportation Fund is distributed to eligible districts and counties in the following ways: - Three-fourths of the fund on the basis of population - A minimum allcoation of $1 5,000 - Annual adminsitrative allotment of $2, Remaining funds deposited in the State STG account. The CTP program provides opportunities to fund pbulic transportation services to senior citizens and disable individuals.
123 June 1996 Woodburn Transportation System Plan 10.0 Transportation Financing Plan 1. State or Marion County funds. Obtain more projects or funds from the State for improvements to state highway facilities. Options for cost sharing with the County for mutually beneficial projects should be explored. 2. For the projects that are needed as a result of proposed development, the property owners or developers that directly benefit where appropriate should fund all or a portion of the project cost. 3. For projects that do not tie directly to new development or directly benefit property ' owners that are willing to pay for the project, spread the cost should be provided from existing transportation funding sources such as TIF fees. 4. Use general obligation bonds backed by property tax revenue, where this source is determined by City staff and the governing body to be fair and viable. The likely funding sources for transportation improvements in Woodburn by jurisdiction level: (state, county, and local) are presented below. Following this discussion are three tables that describe specific transportation funding sources at the federal, state, and local level, and the potential for these sources to fund projects in Woodburn Federal and State Sources For a small city like Woodburn, a key point to understand about federal funding is that the State passes through much of the funding to local jurisdictions. Woodburn would access those funds primarily by working with ODOT, especially ODOT planners in Region 2. The key factor for major transportation improvements is getting them included as part of the State Transportation Improvement Plan that gets adopted every two years. ODOT maintains interstate and state highways-in Woodburn, 1-5 and Highways 99E, 21 1, 2 14, and Therefore, state and federal funds administered through ODOT are the primary sources of funding for improvements to 1-5 and Highways 99E, 2 11, 2 14, and 2 19-projects that involve these highways account for $1.3 million in the next 5 years, $11.3 million in the following 5 years, and $15 million in the following 10 year period. In addition, the City may be able to secure federal or state funding for improvements that would reduce congestion or otherwise improve traffic flow on state-maintained roadways. The City should take an active role in representing the transportation priorities of Woodburn to ODOT during its process of formally incorporating priorities into its State Transportation Improvement Program. ODOT typically funds half of the traffic signals on state highways. If this arrangement can be made for each of the traffic signals identified in the Woodburn Transportation Improvement program, ODOT would provide $320,000 for traffic signals. State funding is available for funding bike lane modifications in Woodburn. State law requires 1% of the State Highway Fund received by cities be expended for the development of footpaths and bikeways-for Woodburn this amounts to $4,800-6,250 annually. Another state source of revenue is lottery funds that are allocated to the Special Public Works Fund and the Immediate Opportunity Fund. These funds provide grants and loans to construct and improve infrastructure that supports local economic development. Woodburn should pursue lottery funding through the Oregon Economic Development Department. Kittelson & Associates, Inc. 121
124 10.0 Transportation Financing Plan June 1996 Woodburn Transportation System Plan Federal ISTEA programs fund selected transportation projects that meet program criteria. The Surface Transportation Program provides funds for any street that not classified as a local or rural minor collector. The Transportation Enhancement Program provides funds for enhancing pedestrian and bicycle facilities, landscaping and other scenic beautification, and improvements to scenic or historic sites. This program may be a source of funds for projects that include adding bike lanes, sidewalks, and/or off-street paths, and possibly for projects in historic areas such as downtown Woodburn. The Highway Enhancement Program provides funds for safety improvement projects on public roads. To receive ISTEA funding from these programs, a project must meet the criteria and be included in the Statewide Transportation Improvement Program. Woodburn should work with Region 2 planners at ODOT to identify projects eligible for ISTEA funds and to have these projects included in the Transportation Improvement Program. Woodburn should continue to seek federal and state grants for transit operation and equipment purchases. Given Woodburn's past success at securing grants for equipment purchases, the City may be able to fund all of the equipment purchases identified in this chapter with federal and state grants. ODOT's forecast of funds in the Special Transportation Fund indicates that state funds available for local transit operations will dwindle over the next 20 years County Sources The City of Woodburn and Marion County occasionally participate in cost sharing on individual projects. There is no formal process for the City to seek cost sharing-decisions are made on a project-by-project basis. Woodburn may be able to secure an occasional cost-sharing arrangement or grant from Marion County. Currently, Marion County maintains roadways outside the city limits but inside the UGB. Woodburn should seek to coordinate with Marion County on transportation improvements in this area to direct County funds to identified transportation projects where possible Local Sources Woodburn should continue to pursue federal, state, and county funds for transportation projects. External funding sources are not likely to fund all the improvements identified in the list of transportation improvement needs. Woodburn will need to find local sources to fund some if not most of the transportation improvements. Woodburn should continue to seek funds from property owners that directly benefit from transportation improvements and from new development. Roadway system capacity Improvement projects may place new streets near properties that currently lack automobile access-access that is necessary for the properties to develop. In these cases there is a very direct benefit to property owners and a direct relationship to future development on the properties, making these improvements eligible for funding through Local Improvement Districts and Transportation Impact Fees (TIF). Other roadway improvements should help improve access to existing businesses; in these cases Woodburn should pursue LID financing. When the Woodburn City Council evaluates the TIF after its five-year trial, they should consider increasing the fee to cover more of the full cost of projects needed to serve new development. Woodburn may want to issue revenue bonds backed by TIF revenue to construct projects in advance of new development it will serve. 122 Kittelson & Associates, Inc.
125 June 1996 Woodburn Transportation System Plan 10.0 Transportation Financing Plan If additional local revenue sources are needed, Table 21 shows the range of possibilities that the City could consider. Increasing the "local option" gas tax may be politically attractive because it places some of the burden on non-residents. At current levels of gasoline consumption, every l$ cent per gallon increase will generate around $100,000 in annual revenue. Given the high level of annual expenditures needed to construct the transportation projects identified, it is likely that existing sources of transportation revenue will fall short. In this case Woodburn should carefully evaluate projects to look for lower-cost alternatives and to make sure the projects are needed. If additional funding sources are still needed, Woodburn may want to consider implementing the Street Utility Fee described in Table 19. While this fee charges residents and local businesses based on the transportation demand they generate, it will probably not have strong political support. The City may use property tax revenue and/or issue General Obligation bonds backed by property tax revenue to finance transportation improvements. Given population growth in Woodburn, there will likely be many competing uses for property tax revenue. Increases in property values and continued development in Woodburn should increase property tax revenues available to the City General Fund for transit operation funding. This increased revenue should come close to meeting the increased operating costs associated with improvements in transit service. Improvements in transit service will have to compete with other City services such as police, library, and parks for property tax revenues. Significant increases in service will probably be tied to identification or implementation of supplemental funding sources. Farebox revenue will probably continue to contribute only a small share of transit funding in Woodburn. Kittelson & Associates, Inc
126 Table 21 Summary of Transportation Funding Programs: Local Sources Program Name Special AssessmentslLocal lmprovement Districts Systems Development Charges (Impact Fees) Local Gas Tax Local Parking Fees Description Special assessments are charges levied on property owners for neighborhood public facilities and services, with each property assessed a portion of total project cost. They are commonly used for such public works projects as street paving, drainage, parking facilities, and sewer lines. The justification for such levies is that many of thes epublic works activities provide services to or directly enhance the value of nearby land, thereby providing direct andlor financial benefit to its owners. Local lmprovement Districts (LIDs) are legal entities established by the City to levy special assessments designed to fund improvements that have local benefits. Through a local improvement district (LID), streets or other tranpsortation improvements are constructed and a fee is assessed to adjacent property owners. The City of Woodburn has generated an average of $29,000 annually from special assessments in the last four fiscal years. Systems Development Charges (SDCs) are fees paid by land developers intended to reflect the increased capital costs incurred by a municipality or utility as a result of a development. Development charges are calculated to include the costs of impacts on adjacent areas or services, such as increased shcool enrollment, parks and recreation use, or traffic congestion. Numerous Oregon citiefs and counties presently use SDCs to fund transportation capacity improvements. SDCs are authorized and limited by ORS The City of Woodburn generated $14,000 in FY93-94 from transportation impact fees, and over $200,000 in FY95. A local gas tax is assessed at the pump and added to existing state and federal taxes. Tillamook and The Dalles are two Oregon cities that have a local gas tax. Multnomah and Washington Counties also have gas taxes. Woodburn currently has a $.01 per gallon gas tax that has aenerated an averaae - of $103,000. per vear. ove rhte last five fiscal years. Parking fees are a common means of generating revenue for public parking maintenance and development. Most cities have some public parking and many charge nominal fees for use of public parking. Cities also generate revenues from parking citations. These fees are generally used for parking-related maintenance and improvements. Potential for Woodburn Urban Area Special assessments require property owners pay assessments for transportation infrastructure. If based on trip generation rates, this approach is somewhat equitable; however, individuals have different transportation needs and habits. Designing a fee structure that recognizes these differences would be difficult to administer. With respect to LIDs, as long as the projects directly benefit the local residents, LIDS are a relatively equitable means of funding tranpsortation improvements. Woodburn should continue to use special assessments to finance transportation improvements wherever property owner support appears possible. The basic principle for setting a transportation SDC is to charge each new development its proportional share of the cost of constructing enough new road and other system improvements to accommodate traffic from all new development causing the need for improvement. The financial capacity of a systems development charge depends on the volume of development and the amount of the SDC. Fees are seldom set to recover the full cost of developing off-site road capacity ot accommodate the new development. Woodburn should continue to use transportation imapct fees to finance transportation improvements. The TIF is currently 26% of the level recommended by the consultant that developed the mothod for assessing the fee; a 100% TIF would have aenerated $ in FY Local gas taxes typically range from $.01 to $.03. Woodburn could expect to generate about $100,000 annually per penny increase in the gas tax, based on recent gas tax revenue. A gas tax increase may require city-wide voter approval. Parking fees are a reasonable means of paying for a scare resource (parking spaces) in densely developed areas. The City's ability to generate enough additional revenue from this course to address unfunded transportation needs is limited.
127 Program Name Table 21 Summary of Transportation Funding Programs: Local Sources (continued) - Description Potential for Woodburn Urban Area Street Utility Fee Vehicle Registration Fees Property Taxes Revenue Bonds Most city residents pay water and sewer utility fees. Street user fees apply the same concepts to city streets. A fee would be assessed to all businesses and households in the city for use of streets based on the amount of use typically generated by a particular use. For example, a single-family residence might, on average, generate 10 vehicle trips per day compared to 130 trips per 1,000 square feet of floor area for retail uses. Therefore, the retail use would be assessed a higher fee based on higher use. Street service fees differ from water and sewer fees because usage cannot be easily monitored. Street user fees are typically used to pay for maintenance more than for capital projects. A street utility fee currently generates about $1.3 million annually in Medford. The amount of the fee is based on the type of land use which relates to trip generation. Single-family residences pay $2.00 per month in Medford. In Ashland, a fee of $1.60 per month generates $200,000 per vear. Counties can implement a local vehicle registration fee. The fee would operate similar to the state vehicle registration fee. A portion of the County fee would be allocated to Woodburn. Local property taxes could be used to fund transportation. The City policy, however, has been to use property taxes to fund public safety, libraries, parks, transit and other miscellaneous services. Revenue Bonds are bonds whoe debt service is financed by user charges, such as service charges, tolls, admissions fees, and rents. If revenues from user charges are not sufficient to meet the debt service payments, the issuer generally is not legally obligated to levy taxes to avoid default, unless they are also backed by the full faith and credit of the issuing governmental unit. In that case, they are called indirect general obligation bonds. Revenue bonds could be secured by a local gas tax, street utility fee, or other transportation-related stable revenue stream. Woodburn could expect from $208,800 to $261,000 in revenue from a street user fee of $2.00 per month for residences. With about 5,441 residences, the residential share would be $130,500 (1 2'2'5,441) and the commercial share would probably produce between 60 to 100 percent of the amount paid by residential properties, or $78,300-$130,500 (information on the square feet of non-residential development in the City is not available). Street user fees would be a vely stable revenue source. They could be expected to increase at a rate comparable to population in Woodburn. Street utility fees could provide a substantial, stable revenue stream for the City. This is a relatively equitable approach that assesses fees based on trip generation. A vehicle registration fee would produce a relatively reliable revenue stream. A vehicle registration fee would be a stable and equitable approach to funding transportation improvements. In Oregon and Woodburn, Ballot Measure 5 places a $15 per $1,000 in assessed value ceiling on property taxes. The potential for using property tax revenues for transportation purposes is limited in Woodburn more by the need for voter approval than by Ballot Measure 5. The City could sell revenue bonds using one of several income streams pledged to repay the bonds. Bond underwriters analyze the reliability of the revenue stream when rating the bonds and assigning an interest rate. The city should use or develop an income stream that is indexed to transportation facility use before using revenue bonds to fund transportation projects.
128 Section I1 Land Use Ordinance Modifications
129 June 1996 Woodburn Transportation System Plan 11.0 Land Use Ordinance Modifications 11.0 Land Use Ordinance Modifications 11.1 Introduction The Transportation Planning Rule (OAR Chapter 660, Division 12) stipulates that each local jurisdiction in the State of Oregon adopt an approved transportation plan and make amendments to its land use regulations in order that transportation plans be properly implemented. The primary goal of the required ordinance amendments is to make future developments more pedestrian and transit friendly. The Rule was originally adopted by the Land Conservation and Development Commission (LCDC) in April In 1993, an amendment to the rule extended the implementing measures compliance deadline for local jurisdictions to May, In May, 1995, the urban portions of the Transportation Planning Rule were updated to include greater emphasis on bicycle, pedestrian, changed building orientation, and transit friendly developments. This section introduces proposed land use ordinance concepts designed to bring the City of Woodburn into compliance with the rule. Sources used to prepare this report include recommendations of the American Planning Association (APA) Transportation Rule Working Group, the Oregon Department of Transportation's (ODOT) Best Management Practices manual (August 1992 draft), the City of Newberg's Pedestrian Oriented Commercial Development Workbook, and Tri-Met's Planning and Design for Transit. This section outlines the state-mandated land use regulations to implement the Woodburn Transportation System Plan, and recommends methods for satisfying those requirements. Specific Woodburn plan and ordinance text modifications are in Appendix E Requirements of the Transportation Planning Rule Section of the Transportation Planning Rule sets forth several land use regulation issues that must be addressed to implement a Transportation Systems Plan. Key issues are discussed below. Protection Of Transportation Facilities And Corridors Ordinance regulations are required to protect transportation facilities and corridors including: access control measures; standards to protect future operations; a process for coordinated review; a process for providing notice to public agencies; and regulations assuring that development standards are consistent with transportation system capacity. Land Use And Subdivision Regulations Land use and subdivision regulations are required for the following: bicycle parking for multifamily, commercial, and institutional development; Kittelson & Associates, Inc. 127
130 11.0 Land Use Ordinance Modifications June 1996 Woodburn Transportation System Plan sidewalks and bikeways that provide safe and convenient access within new development and from it to nearby residential areas, transit stops, and activity centers; and internal pedestrian connections provided in new office parks and commercial development Transit Facilities Land use and subdivision regulations are required for transit facilities. Ordinances shall provide: bus stops and other facilities where appropriate; preferential access to transit through building orientation and clustering for new retail, office, and institutional buildings near planned transit stops; preferential parking for carpools and vanpools; opportunities to redevelop parking areas for transit-oriented use; road systems that include pedestrian and bicycle access to identified transit routes; and designation of types and densities of land use adequate to support transit. Reduced Reliance On The Automobile In Metropolitan Planning Organization (MPO) areas, local governments are required to adopt regulations that reduce reliance on automobiles including: allowing transit-oriented development along transit routes; adopting a demand management program; adopting a parking plan; and requiring major industrial institutional retail and office uses to provide a transit stop along transit trunk routes. Improvements For Bicycle And Pedestrian Travel Identification of improvements to facilitate bicycle and pedestrian travel in developed areas are required, including: improvements providing direct, convenient, and safe bicycle and pedestrian travel within and between residential areas and activity centers Suitability of Existing Ordinances The Transportation Planning Rule requires that cities and counties reduce reliance on the automobile and promote alternative modes of travel, such as walking, cycling, and transit. The rule also stipulates that local development ordinances be consistent with the objectives of the rule. Generally, this requirement has required that new standards and policies be added to local ordinances to assure that new development and new facilities are pedestrian and transit friendly. As in other communities, new standards have been developed in Woodburn to address street widths, sidewalks, connections between buildings and developments and other related design 128 Kittelson & Associates, Inc.
131 June 1996 Woodburn Transportation System Plan 11.0 Land Use Ordinance Modifications concepts. These concepts are implemented through site review procedures and through subdivision and partitioning procedures. There are sections of the Woodburn Zoning Ordinance that need to be made more clear and objective to avoid staff use of discretion. Planning Commission review and the opportunity for a de novo hearing provide a check for the discretionary process, however this review can result in procedural delays. Establishment of more clear and objective standards and streamlining the staff-level review process could simplify the development review process Recommendations - General Issues The following sections address the specific requirements of the Transportation Planning Rule. Each section provides background information of relevant issues, recommendations, and a reference to proposed amendments to the Comprehensive Plan, Zoning Ordinance, Subdivision Standards, or other amendments as deemed necessary. Issue: Incorporation Of New Standards In Zoning And Land Division Ordinances Background/Options: The Woodburn Zoning Ordinance needs to incorporate the development standards that are currently outlined in the Woodburn Draft Transportation System Plan. Some of the standards, notably those pertaining to street widths, cul-de-sacs, alley ways, block widths, block lengths, and related development issues need to be updated. The Zoning Ordinance needs to make more references to the Subdivision Standards document. Recommendation: Amend the zoning ordinance by adding a new Section Transportation Planning Design Standards and Procedures. Revise the Subdivision Standards by modifying Section 12. See Appendix E: New Zoning Ordinance, Section Transportation Planning Design Standards and Procedures and Appendix E: Subdivision Standards Amendments, Section 12J Recommendations - Protection of Transportation Facilities, Corridors, and Sites Issue: Access Control Measures and Standards to Protect System Operation and Airports Rule ~e~uirernents: OAR (2) (a-c) Backgrozuzd/options: Access control is a critical component of maintaining operation of the transportation system. The Oregon Department of Transportation (ODOT) manages access control on State Highways 21 1, 2 14, and 99E through Woodburn. Currently, ODOT relies on ORS (3) and OAR (2) and -065 to manage access. Guidelines for access are provided in the Access Management Classification System of the 1991 Oregon Highway Plan. The City of Woodburn accepts dedicated rights-of-way as part of the subdivision or partition plan review process. Standards for right-of way widths are specified for each street classification in the Subdivision Standards but such standards need to be included in the Zoning Ordinance and as part of the site plan review process. Kittelson & Associates, Inc. 129
132 11.0 Land Use Ordinance Modifications June 1996 Woodburn Transportation System Plan Recommendation: Apply the standards and include them in the site plan review section of the Zoning Ordinance (Appendix E). See Appendix E: New Zoning Ordinance Section, Section (i)-access Control Standards and Guidelines Recommendations - Land Use And Subdivision Regulations Regulations Issue: Bicycle Parking For Multifamily, Commercial And lnstituional Development Rule Requirements: OAR (3)(a). Background/options: Bicycle parking requirements can either be tied directly to the number of automobile parking spaces or to a separate list. It is generally simpler to tie the requirements to existing parking requirements. Key issues include: 1. Applicability The rule requires parking for buildings containing four units or more. Exemptions for temporary uses and land extensive uses should be provided. 2. Number and Type Some jurisdictions provide standards for both short and long term bicycle parking. This results in relatively complex standards. Standards may be applied as a percentage of auto parking. Typical ranges include 5% (Portland) to 20% (Ashland), with aminimum number. 3. Location The location of a bicycle parking facility influences how often it is used. Typical standards include: 4. Amenities within 50 feet of a main entrance closer to the entrance than the nearest auto space direct access to the right-of-way dispersed parking for multiple entrances. Amenities also influence how often a facility is used. Amenity standards should specify the type of rack to be provided and whether racks are lighted and openly visible. In addition standards should address covered parking typical standards including: covered bicycle parking when auto parking is covered covering SO%, if more than 10 spaces are required Recommendation: Include the bicycle parking standards as part of Section Parking and Loading Area Development Requirements of the Zoning Ordinance. Bicycle parking 730 Kittelson & Associates, lnc.
133 June 1996 Woodburn Transportation System Plan 17.0 Land Use Ordinance Modifications standards also need to be included in the Woodburn Bicycle Plan. Apply the concepts listed above and tie to 10% of the auto parking standard. See Appendix E: Amendments to the Parking and Loading Area Development Requirements Section of the Zoning Ordinance for Bicycle Parking, Section Bicycle Parking. Issue: Sidewalks and Bikeways that Provide Safe and Convenient Access Within and From NewDevelopment to Nearby Residential Areas, Transit Stops, and Activities Centers Rule Requirements: OAR (3)(b) Background/options: A primary purpose of the Transportation Planning Rule is to reduce reliance on automobiles and make other forms of transportation, such as walking and bicycling, more accessible. To this end, the rule requires sidewalks and bikeways on arterials and collectors and separate accessways, where appropriate. 1. Sidewalks Some streets in Woodburn do not have sidewalks. Although the Transportation Planning Rule requires sidewalks only on collectors and arterials (which is current policy for the City of 'woodburn), provision of sidewalks on all city streets, including local streets, would further enhance access linkages for pedestrians. The Senior Estates area would be exempt from this requirement, and as such would constitute a special area in the pedestrian plan. With this requirement, it is assumed that neighborhoods of the city currently lacking sidewalks would participate in local improvement districts to provide the facilities. The standard width for all existing sidewalks (on local, collector, or arterial streets) is five feet. Standards recommended by the APA Transportation Rule Working Group range from a five-foot width for a setback residential sidewalk on a local street to a ten-foot width for a commercial curbed sidewalk on an arterial (an eight-foot width for sidewalks along major arterials has been proposed). It should be noted that for pedestrian safety and comfort sidewalks should be set back from the curb. 2. Bikeways The rule requires bikeways on arterials and collectors. Bikeways should meet minimum American Association of State Highway Officials (AASHTO) standards and the standards of the 1992 Oregon Bicycle Plan. To provide five-foot to six-foot-wide bikeways, right-of-way standards should be adjusted where on street parking is desired. It may be appropriate to identify bikeways on certain local streets. Appropriate right-of-way dedications will be needed on those streets. Street connections and accessways between developments are important links that promote, rather than prevent, cycling and walking. One way to create these connections is to limit the use of cul-de-sacs and to require new streets to connect with the existing street network. Changes in the Woodburn Subdivision Standards are needed to include: a requirement to submit a future street plan, which includes all land located within 400 feet of the subdivision: Kittelson 8 Associates, Inc. 131
134 11.0 Land Use Ordinance Modifications June 1996 Woodburn Transportation System Plan a limit or prevention for the use of cul-de-sacs and a restriction on cul-de-sac length; a provision for pedestrian accessways at a minimum of 600-foot intervals; and a requirement that pedestrian accessways to be a minimum of 15 feet wide with a 10 foot-wide paved surface. 4. Block and Street Spacing Block length and spacing between streets influences access through a neighborhood. Generally, shorter block lengths provide easier access. Currently, Woodburn Subdivision Standard limit block length to 1,200 feet. The APA Working Group recommends that block perimeters not exceed 1,500 feet (i.e. 550 foot block lengths with 100 foot deep lots). As an alternative, a 1,600-foot perimeter would allow 600-foot block lengths with 100-foot-deep lots. Recommendations: Provide sidewalks on all streets consistent with the APA Working Group recommendations. Amend city standards and the land division ordinance, as appropriate. Develop bikeways consistent with AASHTO standards. Discourage the use of cul-de-sacs and limit their length to a maximum of 400 feet; cul-de-sacs shall serve no more than eighteen single-family dwellings. Each cul-de-sac shall have a circular end with a minimum diameter of right-of-way width. Develop new standards for block length and accessways, as noted above. Block length shall not exceed 1,200 feet. In addition, when necessary for public convenience and safety, the Planning Commission may require a land divider to dedicate to public access ways to connect to cul-de-sacs, to pass through oddly shaped or unusually long blocks, to provide networks for public paths according to adopted plans, or to provide access to schools, parks, or other public areas. Establish platting standards for alleys. The width of right-of-way and paving design for alleys should not be less than 20 feet, except in the case where an alley abuts land not located in the subdivision or partition. In this case, a lesser width may be allowed at the discretion of the Planning Commission, but the pavement width should not be less than 16 feet. Where two alleys intersect, 10 feet corner cutoffs are recommended. Unless otherwise approved by the Planning Commission, grades should not exceed 12 percent. See Appendix E: New Plan Policies, Policy 4, Appendix E: New Zoning Ordinance Section, Section Sidewalks, Section Bikeways, and Section Street Standards Appendix E: Subdivision Standards, Section 12(J). Issue: Carpool Matching Programs and Preferential Parking for Carpools and Vanpools Rule Requirements: OAR (4)(c) Background/options: The Transportation Planning Rule (TPR) requires that demand management measures be included as a component for evaluation of transportation system alternatives. Transportation demand management measures help improve the performance of transportation facilities and reduces the need for additional roadway capacity. Methods include but are not limited to alternatives to single-occupancy vehicle travel, such as carpooling, vanpooling, cycling, walking, and other trip reduction measures Kittelson & Associates, Inc.
135 June 1996 Woodburn Transportation System Plan 11.0 Land Use Ordinance Modifications The APA Working Group recommends that 10 percent of required parking, but not less than one parking space, be reserved for carpool and vanpool parking. An alternative is to apply the requirement only to new developments with 50 or more employees. 1. Carpool Matching Programs Transportation demand management is primarily addressed through the provision of programs to encourage alternative modes for work related trips. In Woodburn, carpool programs are a possibility. The City should consider a program to encourage businesses with more than fifty employees to set up carpool matching programs, based on employees' residential location and work shift. 2. Parking Reductions Parking reductions need to be incorporated into approved transportation demand management (TDM) plans for new developments and redevelopment. Parking reductions of up to 10 percent would be appropriate in proposed high density areas to encourage alternatives to single-occupancy automobile travel, (i.e., carpools, vanpools, walking, and cycling). Parking should be made available on a preferential basis. Bicycle parking should be more accessible to buildings than parking for single-occupancy automobile travelers. Parking subsidies for carpool and vanpool users could also be implemented to discourage single-occupancy automobile travel. Alternatively, parking for single-occupancy vehicle travelers could be reduced in number or percentage or made to be more inaccessible to buildings. Recommendations: Provide TDM measures to encourage carpooling, vanpooling, and reduce parking requirements. See Appendix E: New Comprehensive Plan Policies and Appendix E: Section of the Zoning Ordinance - Carpool and Vanpool Parking Recommendations-Other Modes issue: Improvements to Facilitate Bicycle and Pedestrian Travel Rule Requirements: OAR (6) Background/Options: The Transportation Planning Rule requires identification of improvements to facilitate bicycle and pedestrian travel in undeveloped areas. Improvements should provide more direct, convenient, and safe bicycle and pedestrian travel within and between residential areas and activity centers. Specific improvements should be part of the Transportation System Plan. The standards discussed above will help facilitate development of improvements. One method that has been used in other jurisdictions to create more pedestrian friendly streets is to narrow street width along local streets. Narrowing street widths has the effect of slowing traffic and creating a more compact and efficient development pattern. Currently, the required paved street width for local commercial and industrial streets is 36 feet. Typical widths for narrower pedestrian friendly streets range from 24 to 28 feet. Kittelson & Associates, Inc,
136 11.0 Land Use Ordinance Modifications June 1996 Woodburn Transportation System Plan Recommendation: Include the improvements as part of the City's Transportation Systems Plan. Sidewalks shall be provided on both sides of local, collector, and arterial streets. See Appendix E: New Plan Policies, Policy 1. Section of the Zoning Ordinance Minimum Street Width. Issue: Internal Pedestrian Connections - Walkway Connections Within Commercial and Office Park Development Rule Requirements: Recent amendments to the Transportation Rule deleted this requirement, but it is recommended that it be included in the City of Woodburn's Zoning Ordinance. Background/options: The TPR requires provision of internal pedestrian connections in new office parks and commercial developments. Methods for meeting this provision include: At least one sidewalk connection between abutting developments should be provided. Walkways should be provided to the street for every 300 feet of frontage. Connections should all be direct and driveway crossings minimized. Connections should be linked to the internal circulation of the building. Walkways should be at least five feet wide. Where possible, walkways should be raised, have curbing, or have different paving material when crossing driveways. Recommendation: Amend the zoning ordinance by adopting the design standards noted above. Walkway connections should not be less than five feet in width. See Appendix E: New Zoning Ordinance Section, Section Internal Connections. Issue: Golf Carts Background/Options: Approximately 25 percent of population in the City of Woodburn is over the age of sixty-five. This sector of the population is often mobility disadvantaged. Allowing residents to use golf carts in designated sections of the City or on designated streets would help alleviate the mobility challenges that these people encounter. Woodburn Ordinance Number officially defines golf carts, and allows those vehicles fitting this description to use all streets in Senior Estates, and those streets providing access to Fairway Plaza. The Ordinance prohibits the use of golf carts on Highway The Ordinance does not require that golf carts be registered with the State of Oregon. The City is interested in developing more off-street and on-street designated routes for golf cart travelers. Recommendation: Amend the Zoning Ordinance to allow golf carts as an outright use in designated sections and on designated streets of the City, particularly along West Hayes Street from the area of Senior Estates (See Section 6.3-Golf Cart Facility Plan of the TSP) to downtown Woodburn, and Country Club Road for access to the Tukwila residential area and golf course. Golf carts could also use the off-street trail system developed along Mill Creek. With this expanded system, golf cart travelers would have access to downtown Woodburn, future new development in the vicinity of the I-5IHighway 2 14 interchange, and to the proposed off-street pathway system, which would circulate back to Senior Estates. Parking should be required along any expanded golf cart routes outside the Senior Estates area. 134 Kittelson & Associates, lnc.
137 June 1996 Woodburn Transpodation System Plan 11.0 Land Use Ordinance Modifications Amend the Zoning Ordinance to modify road widths in areas where golf carts are permitted, to provide exclusive lanes for the use of such vehicles. See Appendix E: New Zoning Ordinance Section Golf Carts. Modify Zoning Ordinance Section Street Widths. Appendix E: New Section Golf Cart Parking. Kittelson & Associates, Inc.

138 Section 12 Compatibility with State ~rans~ortation planning Rule & Other Policies
139 June 1996 Woodburn Transportation System Plan /mpatibility with State Transportation Planning Rule & Other Policies 12.0 Compatibility with State Transportation Planning Rule & Other Policies 12.1 State Transportation Planning Rule In April 1991, the Land Conservation and Development Commission (LCDC), with the concurrence of the ODOT, adopted the Transportation Planning Rule (TPR), OAR 660 Division 12. The TPR requires local jurisdictions to prepare and adopt a Transportation System Plan (TSP) by May Table 22 is a list of requirements and recommendations (designated by italics) for a Transportation System Plan for an Urban Area with a population between 2,500 and 25,000, and how each of those were addressed in the Woodburn TSP. The comparison shows that the Woodburn TSP is in compliance with the provisions in the TPR ODOT Bypass and Major Improvement Planning Policy In 1995, the Oregon Transportation Commission adopted a policy on the development of bypasses and other major improvements to state transportation facilities in local comprehensive plans. The intent was to identify a framework that would promote new facility development only as a last resort, after improvements to the existing transportation system, including TDM measures and operational improvements, were implemented. Major improvements to a state transportation facility could only be identified as a short-range project (0-5 years) if the project was already identified in the construction section of ODOT's State Transportation Improvement Program (STIP). Such improvements could only be identified in a local comprehensive plan as a long-range project (5-20+) years only if: the improvement is needed to satisfy a state transportation objective or objectives; the scope of the project is reasonably justified, considering the long-range projection of need; the improvement was identified through a planning process that include public involvement, evaluation of reasonable transportation alternatives including measures to manage the existing transportation system, and sufficient environmental analysis to determine if there is a reasonable likelihood the improvement can be built; transportation management measures will not satisfy identified transportation needs during the planning period or there is a need to preserve a future transportation corridor for future needs beyond the planning period; the improvement would be a cost-effective means to achieve the objective(s); the proposed timing of the improvement is consistent with priorities established in corridor plans and regional transportation plans and if the financing program identified construction is dependent on the future availability of funds; funding for the project can be reasonably expected at the time the project is ready for development and construction; and the plan includes measures to effectively manage the existing transportation infrastructure and services in accordance with Policy G of the OTP; Kittelson & Associates, Inc. 137
140 Compatibil~ty with State Transportati Planning Rule & Other Policies June 1996 Woodburn Transportation System Plan Table 22 Evaluation of Woodburn TSP With State Transportation Planning Rule TPR RecommendationslRequirements Woodburn TSP Compliance Public and Interagency Involvement Establish Advisory Committee Develop informational material Schedule informational meetings, review meetings and public hearings throughout the planning process. Involve the community Coordinate plan with other agencies A Transportation Task Force (TTF) previously existed in Woodburn. This Task Force reviewed the development of the Transportation System Plan. Transportation Task Force members are listed in the acknowledgements at the beginning of the document. Materials (including technical memoranda, charts and maps) were prepared for public and agency review illustrating and defining critical components of the Woodburn TSP. Eight TTF meetings and four open houses were held in developing the Draft TSP. In addition, the TTF meetings were video recorded for airing on the local cable access. Representatives from Marion County, ODOT, FHWA and other agencies were apprised of the TSP development and participated when appropriate at the TTF. Review Existing Plans, Policies, Standards, and Laws Review and evaluate existing comprehensive plan Land use analysis - existing land usehacant lands inventory Review existing ordinance - zoning, subdivision, engineering standards Forecast population and employment Determination of transportation capacity needs (cumulative analysis, transportation gravity model) Develop and evaluate alternatives (no-build system, all build alterantives, transportation system amangment, transit alternative/feasibility, improvements/additions to roadway system, land use alternatives, combination alternatives) The 1985 Woodburn Comprehensive Plan was reviewed and evaluated as part of the TSP development. The Woodburn Comprehensive Plan served as the basis for all population/employment forecasts, inventory of vacant lands, and initial location and type of collector/arterial streets serving the Woodburn Comprehensive Plan land uses. Existing City ordinances and engineering standards were reviewed and incorporated where the appropriate development of the Woodburn TSP. The Woodburn Comprehensive Land Use Plan served as the basis for forecasting future year 2015 population and employment (see Section 5 of the Woodburn TSP). Future p.m. peak hour traffic assignments were calculated using the travel demand model which was previously developed by Kittelson & Associates and updated for this project. The travel demand model includes the use of a gravity model. Section 5 identifies three roadway system alternatives to assess long-term transportation needs. These alternatives principally focused on identifying the impacts of differnt 1-5 access scenarios and on South Arterial. lntra city and intercity transit system alternatives were also evaluated. 138 Kittelson & Associates, Inc.
141 June 1996 Woodburn Transporlation System Plan.,npatibility with State Transportation Planning Rule & Other Policies Table 22 Evaluation of Woodburn TSP with State Transportation Planning Rule (continued) I I Determine Transportation Needs Select recommended alternative Produce a Transportation System Plan Transportation goals, objectives, and policies Streets plan element (functional street classification and deign standards; proposed facility improvements, access management plan, truck plan, 1 safety improvements) I Airport If I I L I Public transportation element (transit route service, transit facilities, special transit services, intercity bus and passenger rail) Bikeway system element Pedestrian system element element (land use compatibility, future improvements, accessibility/connections/conflicts with other modes) Freight rail element (terminals, safety) Water transportation element (terminals) Parking Plan Transportation System Management Element Transportation Demand Management Element Review existing significant transportation studies program/spublic facilities plans Americans with Disabilities Act requirements I The recommended roadway, transit, pedestrian, bicycle, and golf cart transportation facilities are summarized in Section 9 of the TSP. Specific recommendations regarding transportation goals and policies are outlined in Section 3 (Goals and Policies), Section 7 (Access Management), and Section 11 (Land Use Ordinances) of the documents. The streets plan element is outlined in Section 8 of the TSP. The public transportation element is outlined in Section 9 of the TSP. The bicycle plan is outlined in Section 9 of the TSP. The pedestrian plan is outlined in Section 9 of the TS P. An air transportation element is not relevant in Woodburn. The rail element is outlined in Section 9 of the TSP. A water transportation element is not relevant in Woodburn. A parking plan was not identified as an issue in the Woodburn TSP. TSM element not applicable per OAR (2)(f) and (9). TDM element not applicable per OAR (2)(f) and (g) Significant transportation studies were reviewed as part of the Woodburn TSP including the Interstate 5lHighway 214 Interchange Study, Woodburn Crossing Traffic Impact Analysis, Woodburn High School Pedestrian Study, and the West Hayes Street Closure traffic analysis. Woodburn's most recent CIP was included as part of the TSP development. The ADA requirements were reviewed and incorporated where appropriate into the Woodburn TSP development. Kittelson & Associates, Inc. 139
142 Compatibility with State Transportati~ Planning Rule & Other Policies June 1996 Woodburn Transportation System Plan Table 22 Evaluation of Woodburn TSP with State Transportation Planning Rule (continued) I Inventory Existing Transportation System Street system (number of lanes, lane widths, traffic volumes, level of service, traffic signal location and jurisdiction, pavement conditions, structure locations and conditions, functional classification and jurisdiction, truck routes, number and location of accesses, safety, substandard geometry) t An inventory of the existing street network, traffic volumes, traffic control devices and levels of service is provided in Section 4 of the TSP. Bicycle ways (type, location, width, condition, o wnershipjurisdiction) A summary of the existing bicycle route system is given in Section 4 of this TSP. d Pedestrian ways (location, width, condition, o wnership/jurisdiction) Public Transportation Services (transit ridership, volumes, route, frequency, stops, fleet, intercity bus, passenger rail, special transit services) An inventory of existing sidewalks in Woodburn is included in Section 4 of the TSP. A summary of Woodburn public transit and paratransit is presented in Section 4 of this TSP. Intermodal and private connections No significant intermodal and private carrier transportation services andfor connections currently exist within Woodburn. Air transportation No air transportation facilities exist within Woodburn; as summarized in Section 4 of this document. Freight rail transportation Southern Pacific Railroad freight service is summarized in Section 4. Water transportation No significant water transport facilities exist within Woodburn; as summarized in Section 4 of this document. Pipeline transportation No significant pipeline transportation facilities exist within Woodburn; as sumamrized in Section 4 of this document. Environmental constraints With the development of the recommended off-street pathway system, special attention should be given to any environmental constraints that exist in the creek easements. Existing population and employment As outlined in Section 5 of the TSP and Technical Memorandum #3, the current population of Woodburn is approximately 15,000 people employment was approxiamtely 5,045 jobs. Plan Review and Coordination I I I Consistent with ODOT and other applicable plans Adoption forthcoming I Is it adopted? 1 forthcoming Implementation Ordinances (facilities, services and improvements; 1 See Section 11 land use or subdivision regulations) Transportation financinglcapital improvements See Section 10 I Kittelson & Associates, lnc.
143 June 1996 Woodburn Transportation System Plan, npa tibility with State Transports tion Planning Rule & Other Policies the plan includes policies and implementing measures which protect the corridor and its intended function; and any maps showing a new alignment include a note stating "Incomplete funding plan, no construction date established". Related to the Woodburn Transportation System Plan, this new policy relates to the development of 1-5 interchange improvements and widening of Highway 219/214. It is important to note that the South Arterial is not intended to be a state facility. It would function as much of a local access road in the south Woodburn area as it would serve as a reliever facility to Highways 219,214 and 99E. Table 23 compares the policy criteria with respect to three different transportation improvements. The need for all three improvements over the 20+ year planning period is based on existing traffic operating conditions, projected traffic growth, and the extent to which a reasonable level of transit, TDM, and traffic operational improvements can be implemented to relieve the need for street capacity improvements. For the undeveloped southwest portion of Woodburn, some level of highway development to provide adequate access and circulation is needed. The City of Woodburn's ultimate goal is to implement a balanced, multi-modal set of transportation improvements to meet the needs of the community. Kittelson & Associates, Inc.
144 Compatibil~ty with State Transporfat, Planning Rule & Other Policies June 1996 Woodburn Transportation System Plan Table 23 Evaluation of Woodburn TSp With ODOT Bypass/Major lmprovement Planning Policy Policy 1. Proper Transportation Priorities 2. Short-Term lmprovement to State Transportation Facility (0-5 years) Must be in STlP (Applicable to 1-5 and Highway improvements). 3. Longer-Term lmprovement to State Transportation Facility (5-20+ years) Must Meet Following Criteria (Applicable to 1-5 and Highway improvements). Satisfy Transportation Objectives Needed Based on Travel Demand/Congestion ldentified Through Planning Process TDM Will Not Satisfy ldentified Transportation Needs, or Need to Preserve Corridor Cost-Effective Solution Timing Consistent with ODOT Corridor and Regional Transportation Plans Project Funding Expected at Time Project is Ready for Development and Construction Includes Measures to Manage Existing Transportation Infrastructure in Accordance with OTP Policy 4G Plan lncludes Policies and Implementing Measures Which Protect Corridor and Its Intended Function Any Maps Showing a New Alignment Include a Note Stating "Incomplete Funding Plan, No Construction Date Established" Evaluation Project and program emphasis on improving existing transportation system. 1-5 interchange improvement shown as longer-term (11-20 year) need. Widening of portion of existing Highway 21 4 before South Arterial identified. Balanced multi-modal TSP presented. Improvements to 1-5 interchange and Highways programmed beyond five years. South Arterial not to be a designated state transportation facility, or planned to be a designated bypass facility. 1-5 Interchanae & Hiahwav?19/?14 Improvements Consistent with Woodburn TSP goals and policies. Needed to serve projected traffic demand without Highways 21 9, 214 & 99E going substantially over capacity. Developed as part of Woodburn TSP, which included public and agency involvement. No significant environmental impacts anticipated (will be assessed in follow-up refinement studies). TDM will not meet projected need, even with substantial transit and pedestrianlbicycie facility improvements. Most cost-effective solution given road capacity improvement need. Marion County TSP is showing need for improved 1-5 access in Woodburn area. Project development (beyond initial 1-5 interchange reconnaissance study) will not proceed until a framework for funding construction is identified (as part of reconnaissance study). Access management strategies for Highways a part of Woodburn TSP. Access management strategies for Highways a part of Woodburn TSP. Included on all Woodburn TSP modal plan maps. 142 Kittelson & Associates, Inc.

145 Appendix A Level of Service Analysis Concepts
146 June 1996 Woodburn Transportation 5,.em Plan Appendix A Appendix A Level of Service Concept Level of service (LOS) is a concept developed to quantify the degree of comfort (including such elements as travel time, number of stops, total amount of stopped delay, and impediments caused by other vehicles) afforded to drivers as they travel through an intersection or roadway segment. Six grades are used to denote the various LOS from A to F.' Signalized Intersections The six LOS grades are described qualitatively for signalized intersections in Table Al. Additionally, Table A2 identifies the relationship between level of service and average stopped delay per vehicle. Using this definition, LOS D is generally considered to represent the minimum acceptable design standard. Table A1 Level of Service Definitions (Signalized Intersections) Level of Service Average Delay per Vehicle I A I Average Very low average stopped delay, less than five seconds per vehicle. This occurs when progression is extremely favorable, and most vehicles arrive during the green phase. Most vehicles do not stop at all. Short cycle lengths may also contribute to low delay. stop delay is in the range of 5.1 to 15.0 seconds per vehicle. This generally occurs with good progression and/or short cycle.lengths. More vehicles stop than for a LOS A, causing higher levels of average delay. Average stopped delay is in the range of 15.1 to 25.0 seconds per vehicle. These higher delays may result from fair progression and/or longer cycle lengths. Individual cycle failures may begin to appear at this level. The number of vehicles stopping is significant at this level, although many still Dass throuah the intersection without sto~pina. Average stopped delays are in the range of 25.1 to 40.0 seconds per vehicle. The influence of congestion becomes more noticeable. Longer delays may result from some combination of unfavorable progression, long cycle length, or high volume/capacity ratios. Many vehicles stop, and the proportion of vehicles not stopping declines. lndividual cycle failures are noticeable. E Average stopped delays are in the range of 40.1 to 60.0 seconds per vehicle. This is considered to be the limit of acceptable delay.these high delay values generally indicate poor progression, long cycle lengths, and high volume/capacity ratios. lndividual cycle failures are frequent occurrences. Average stop delay is in excess of 60 seconds per vehicle. This is considered to be unacceptable to most drivers. This condition often occurs with oversaturation. It may also occur at high le failures. Poor progression and long 1 Most of the material in this appendix is adapted from the Transportation Research Board. Highway Capacity Manual, Special Report 209 (1 994). Kittelson & Associates, lnc. A-1
147 Appendix A June 1996 Woodbur,. "ansportation System Plan Table A2 Level-of-Service Criteria for Signalized lntersections Unsignalized lntersections Unsignalized intersections include two-way stop-controlled (TWSC) and all-way stop-controlled (AWSC) intersections. The 1994 Highway Capacity Manual provides new models for estimating total vehicle delay at both TWSC and AWSC intersections. Unlike signalized intersections, where LOS is based on stopped delay, unsignalized intersections base LOS on total vehicle delay. A qualitative description of the various service levels associated with an unsignalized intersection is presented in Table A3. A quantitative defination of LOS for unsignalized intersections is presented in Table A4. Using this definition, LOS E is generally considered to represent the minimum acceptable design standard. Table A3 General Level-of-Service Descriptions for Unsignalized lntersections Average Delay per Vehicle to Minor Street A B I Some drivers begin to consider the delay an inconvenience. Occasionally there is more than one vehicle in the queue. r C 1 Manv times there is more than one vehicle in the queue. II I ~osi D E Nearly all drivers find freedom of operation. Very seldom is there more than one vehicle in the queue drivers feel restricted. but not obiectionablv so. Often there is more than one vehicle in the queue. Drivers feel quite restricted. Represents a condition in which the demand is near or equal to the probable maximum number of vehicles that can be accomodated by the movement. There is almost always more than one vehicle in the queue. Drivers find the delays approaching intolerable levels. Forced flow. Represents an intersection failure condition that is caused by A-2 Kittelson & Associates, Inc.'
148 June 1996 Woodburn Transportation S,...em Plan Appendix A Table A4 Level-of-Service Definitions (Unsignalized Intersections) I A I < 5 Seconds 1 B I 5 to 10 Seconds I C I 10 to 20 Seconds I -- I E 20 to 30 Seconds 30 to 45 Seconds I > 45 Seconds It should be noted that the LOS criteria for unsignalized intersections are somewhat different than the criteria used for signalized intersections. The primary reason for this difference is that drivers expect different levels of performance from different kinds of transportation facilities. The expectation is that a signalized intersection is designed to carry higher traffic volumes than an unsignalized intersection. Additionally, there are a number of driver behavior considerations that combine to make delays at signalized intersections less onerous than at unsignalized intersections. For example, drivers at signalized intersections are able to relax during the red interval, while drivers on the minor street approaches to TWSC intersections must remain attentive to the task of identifying acceptable gaps and vehicle conflicts. Also, there is often much more variability in the amount of delay experienced by individual drivers at unsignalized intersections than signalized intersections. For these reasons, it is considered that the total delay threshold for any given LOS is less for an unsignalized intersection than for a signalized intersection. While overall intersection LOS is calculated for AWSC intersections, LOS is only calculated for the minor approaches and the major street left turn movements at TWSC intersections. No delay is assumed to the major street through movements. For TWSC intersections, the overall intersection LOS is defined by the movement having the worst LOS (typically a minor street left turn). Kittelson & Associates, Inc. A-3
149 Appendix B Travel Demand Model
150 June 1996 Woodburn Transporlation System Plan Travel Demand Model Development Travel Demand Model Development 1.0 PREPARATION FOR THE MODEL The Woodburn Travel Forecasting Model is designed to estimate and forecast major arterial and collector street travel flows; and to test future land useltransportation system alternatives in the Woodburn urban area. The EMME12 transportation modeling software package was used for the purposes of estimating trip generation, trip distribution and trip assignment. This modeling software was developed by INRO Consultants, Inc. in Montreal, Canada and is available for use on PC-computers as well as mini-computers. Output from the model developed in EMME12 includes both black and white and color plots as well as tabular print-outs from the various modeling steps (trip generation, distribution, and assignment). A QRS-I1 based model was originally created by the Oregon Department of Transportation (ODOT) for the Woodburn urban area. The basic simulation network (nodes and links) were converted to EMME12 format by Kittelson and Associates, Inc.. Currently, ODOT is in the process of standardizing all of the modeling efforts throughout the state into EMME12 format. Creation of the Transportation Analysis Zone System To facilitate development of travel forecasts, the household and employment data were assembled by the City of Woodburn and ODOT into 97 Transportation Analysis Zones (TAZ's # 1-20 are "external station" zones, TAZ's # are zones internal to the urban area). Boundaries for these TAZ's were established in an attempt to meet the following criteria: homogenous land use; conformance with major boundaries major transportation corridors physical boundaries which prevent continuous development; and homogenous access of land use to transportation system (collector/arterial street system). Figure 1 illustrates the Woodburn TAZ system. Creation of the Roadway Network All of the Woodburn urban areas' arterial and collector street intersection locations were converted from the QRS-I1 software in order to develop a computerized roadway network in the EMME12 software. The EMME12 database contains 97 centroids (TAZs and external stations), 21 8 regular nodes (intersections) and 732 links (roadway segments). All links in the study area were assigned the following characteristics based upon their existing function: distance (in hundredths of miles); travel speed (average free-flow, off-peak travel speed which includes potential delays at intersections); Kittelson & Associates, Inc. B-1

151 LEGEND TRANSPORTATION ANALYSIS TRANSPORTATION ANALYSIS ZONES CITY OF WOODBURN TRANSPORTATION SYSTEM PLAN FEBRUARY 1995
152 June 1996 Woodburn Transportation Sysrern Plan Tiavel Demand Model Development Link Type link type (all links were assigned a link type based on functional classification for arterials and collectors); and link capacity (peak hour roadway capacities were assigned based upon roadway functional classification). Many of the travel speeds, link types, and link capacities were copied directly from the original QRS-I1 database. A detailed explanation of the link classes is provided in Table 1. Table 1 Definition Existing Roadway Network EMMEM Link Class Speed # of Lanes Link Cap:city (m~h) (one Direction) (v~h) # of One-way Links 1 1 I Centroid Connector , Principle Arterials ,100-2, Minor Arterials Minor Arterials Minor Arterials Collectors I Collectors Collectors , Local Roads ' As defined in original QRS-I1 network provided by ODOT. Special note should be made in the handling of centroid connectors. The distance assigned to centroid connectors was computed by measuring the distance from the centroid to the nearest node in the collector/arterial network via the local street network. Centroid connectors are theoretically representative of the local access systems, and thus were considered to have adequate capacity to handle any volumes anticipated. Thus, centroid connectors were assigned a very high p.m. peak hour capacity of 9,999 vehicles per hour, per direction. The travel model was designed to model vehicle trips only. Therefore, all trips made using other modes (i.e. bicycle, walk, bus) were not considered in this model. It is understood that, in the future, transit, bicycles, and pedestrian modes of travel will play a more significant role within the overall area transportation system, but it was deemed that the effort involved in developing a separate non-auto mode model would not yield sufficient results to warrant a full mode-split model development. It was assumed that, given the high proportion of elderly and minority (Hispanic) residents in the community today and expected to continue in the future (who traditionally have less auto ownership), that there is and will be an unmet travel demand by these residents. Added transit, carpooling, and bicyclelpedestrian facilities would serve to a large extent to meet this Kittelson & Associates, Inc. 6-3
153 Travel Demand Model Development June 1996 Woodburn liansportation System Plan latent demand, without having a major impact on vehicle trip generation. Hence, the current vehicle trip generation characteristics in the community were used for the year 2015 travel modeling effort on reducing vehicle trip demand. 2.0 CALIBRATION OF THE MODEL The performance of a model to forecast future travel is measured by its ability to accurately estimate existing conditions. Thus, the first major step is developing a model that estimates existing travel demand based on land use inputs (i.e. existing households and employment) for trip generation, distribution, and the assignment of trips to the simulation network, then comparing volume estimates to measured traffic flows on the arterial/collector street system. The base year for calibration of the Woodburn model was as substantial traffic counts and population/employment estimates were available for that year. 2.1 Land-Use Assumptions ODOT provided estimates of households and employees in each TAZ in the study area for A summary of the results is provided below: Housing Type 1991 Housing Units Single Family 4,463 Multi-Family 1,103 Mobile Home 495 TOTAL 6,061 Employment Type Retail Industrial Service Education Government Other TOTAL 1991 Employees 1,277 1, ,045 In addition, there were 49 motel rooms and 148 recreation vehicle park spaces in the Woodburn urban area in Trip Generation The number of trips entering or leaving a transportation analysis zone is dependent on the trip-making characteristics of residents and land use in that zone. Therefore, trip generation is divided into two categories based on land use including trips produced by the home and trips attracted by employment. Three basic trip types were developed for the Woodburn urban area to reflect basic travel patterns of existing residents and workers including: home-based-work (HBW), home- 8-4 Kittelson & Associates, lnc.
154 June 1996 Woodburn Transportation System Plan Travel Demand Model Development based-other (HBO), and non-home-based (NHB), and were supplemented with special external travel behavior trip purposes. Basic trip generation rates and equations established by ODOT during the development of the Woodburn QRS-I1 model were used as the basis to calculate the HBW, HBO, and NHB trips. The daily trip production equations for each trip purpose are shown below: HBWPR~D=[O.~~X(SFHHX ~O+MFHHX~+MHX~)] Where: HBW, HBO, NHB - Trip Purpose - Daily Vehicle Trip Productions PROD SFHH - Number of Single-Family Households MFHH - Number of Multi-family Households MH - Number of Mobile Homes Trip attraction equations were calculated to ensure that total daily attractions within the study area matched total daily productions. The resultant daily vehicle trip attraction equations are shown below: HBWAn= [O. 16 x (RETAILEMp x 20 + INDUSTRIALEMp x SERVICEEMp x 15 + MOTEL ROOM X RV PARK X 3)J HBOAm = [O.6 1 x (RETAIL x 20 + INDUSTRIALEMp x SERVICEEMp x 15 + EDUCATIONEMP x 11 + GOVERNMENTEMP X 8 + OTHER EMP x MOTEL ROOM X RV PARK X 3)] NHBAT, = [0.23 x (RETAIL x 20 + INDUSTRIALEMp x SERVICE EMP x 15 + EDUCATION EM^ x 11 + GOVERNMENTEMP x 8 + OTHER EMP x MOTEL ROOM X RV PARK X 3)] Where: HBW, HBO, NHB - Trip Purpose ATT - Daily Vehicle Trip Attractions EMP - Number of Employees by Type During the development and calibration of the QRS-I1 model, ODOT made the following adjustments to the production and attraction equations to account for special generators in specific zones. The trip production equations were reduced in zones 3 1,38,55,56,63, and 97 to account for lower trip-making characteristics by the residents in the Senior Estates. Specifically, Kittelson & Associates, Inc. 5-5
155 Travel Demand Model Development June 1996 Woodbum Transportation System Plan the home-based work productions in those zones were set equal to zero, the home-based other productions were calculated at 72 percent of the total productions in the zone, and the non-home based productions were calculated at 28 percent of the total productions in the zone. In addition, the total number of trip productions by household type in these zones were reduced from 10 to 5.6 daily trips per single family unit and from 6 to 5.6 daily trips per mobile home. The trip production equations were increased in zones 68 and 76 to account for increased trip making in the densely populated residential areas (apartments). Specifically, the number of trips produced by a single family home were increased from 10 to 15 daily trips and the number of trips produced by a multi-family unit were increased from 6 to 10 daily trips. The trip attraction equations were increased in zones 43,48, and 57 to account for the greater trip generation characteristics of large discount stores. The trip production and attraction equations were then applied to 1991 Woodburn population and employment. Based upon the above trip generation equations, the Woodburn area currently produces an estimated 67,800 daily HBW, HBO and NHB vehicle trips. 2.3 Trip Distribution Home-Based Work, Home-Based Other, and Non Home-Based Trip Purposes This section describes the calculations and eventual validation process which was used in the development of the trip distribution model. The standard gravity model was employed to distribute trips between "producers" (households) and "attractors" (employment). The fundamental principle upon which the gravity model is based assumes that the volume of travel between two places is directly related to the size of these places, and inversely related to the distance between the places. The basic form of the gravity model used in the Woodburn model is: Where: Tij trips produced in zone i and attracted to zone j trips produced in zone i trips attracted to zone j Friction factors derived from zone-to-zone travel times that are a function of the spatial separation between zones i and j and the area wide effect of this separation on the level of trip interchange. Specific zone-to-zone adjustment factor to account for the effect on travel patterns of defined social or economic linkages not otherwise incorporated in the gravity model formu- 0-6 Kittelson & Associates, Inc.
156 June 1996 Woodburn Transportation Sysrern Plan I ravel Demand Model Development lations (none were applied in the Woodburn model data set). The calibration of a gravity model is the process of determining appropriate travel time factors which adequately reflect the effect of spatial separation between unique locations (zones). To calculate travel times factors by purpose for the Woodburn EMME12 model, the exponential function outlined below was used. The beta values, calculated as the inverse of the average trip lengths, by purpose, were borrowed from the original QRS-I1 assignment, and are outlined below. After calculating the appropriate travel time factors, an initial set of daily trip tables (HBW, HBO and NHB) were developed based on a set of zone-to zone travel costs (travel times). The resulting daily trip tables were added to the "external" trips (copied from ODOT's QRS-I1 model) to determine total new travel generated in the study area. The number and distribution pattern of "external" trips were calculated based upon existing travel volumes. 2.4 Trip Assignment The total existing daily trip table was assigned to the network using an equilibrium assignment algorithm. The calibration process of the daily volume trip assignment required relatively minor adjustments of travel speeds on a limited number of links to yield a proper balance of roadway volumes as compared to observed traffic counts. Tables 2 and 3 compare the resulting EMMEl2 travel assignment volumes to existing traffic counts on each collector/arterial facility across east-west and north-south screenlines. As shown in the tables, the overall model screenline volumes are generally within percent of the observed volumes, thereby indicating that calibration is achieved. A comparison of the modeled volumes vs. the observed volumes is also shown by the Regression Line in Figure 2. As shown in the Figure, the correlation coefficient (R~) is equal to 0.87, also indicating calibration (A value of 1 indicates that the assigned volume on each road is exactly equal to the observed volume). The resulting 1991 daily travel volumes are shown in Figure 3. Kittelson & Associates, Inc

157 Travel Demand Model Development June 1996 Woodburn Transportation System Plan Table 2 Observed vs. Modeled Volumes-East-West Screenlines 1991 Model Assignment 1 East-West Screenline #1: North of Highway I Woodland 4,085 4,400 I4 rl 47% Arney I Country Club Rd. I I Highway 99E I Total EW #I I 35,930 I 35,445 I 98.7% I East- West Screenline #2: South of High way 214 I Total EW #2 I I I 97.6% 1 Table 3 Observed vs. Modeled Volumes-North-South Screenlines 1991 Model Assignment I North-South Screenline #I: West of Highway 99E 2-Way Daily Volumes vs. Modeled (%) 1 Total NS #I I 26, I 90.5% 1 North-South Screenline #2: East of Highway 99E 1 B-8 Kittelson & Associates, Inc.
158 June 1996 Woodburn Transportation System Plan Travel Demand Model Development Roadway Way I / 1991 Model Assignment Observed Segment Daily Traffic 2-Way Daily Volumes I "8. Modeled (%I Kittelson & Associates, Inc.
159 LINK SCATTERGRAM VOLAU LINKS:! u 1 3~0 46 LINKS I0000 UL3 EMME/2 PROJECT CITY OF WOOOBURN TSP SCENRR I Network Calibration Figure 2: Observed Vokurnes vs. Assigned VoLurnes : 45 MODULE: 2.43 KAINC...j ak
160 LINKS: t yp= SCALE: 2000 EMME/2 PROJECT: CITY OF WOODBURN TSP SCENARIO 2: 1991 Network Calibration Figure 3: 1991 Daily Volumes WINDOW: 18,4/-457,' / : 18 MODULE: 6-12 KAINC,..,,,jak
161 WOODBURN LAND USE DATA INPUT REQUIRMENTS TAZ I RETAIL MDUST EMPLOYEES SERVICE EDUC GOVT OTHER MOTEL RVPARK SF HOUSEHOLDS 1 MF MH I I I I I I I 1
162 WOODBURN 1991 LAND USE DATA INPUT REQUIRMENTS RETAIL 37 0 INDUST EMPLOYEES SERVICE EDUC GOVT OTHER MOTEL RVPARK SF HOUSEHOLDS MF MH - - TOTAL 94 (
163
164
165
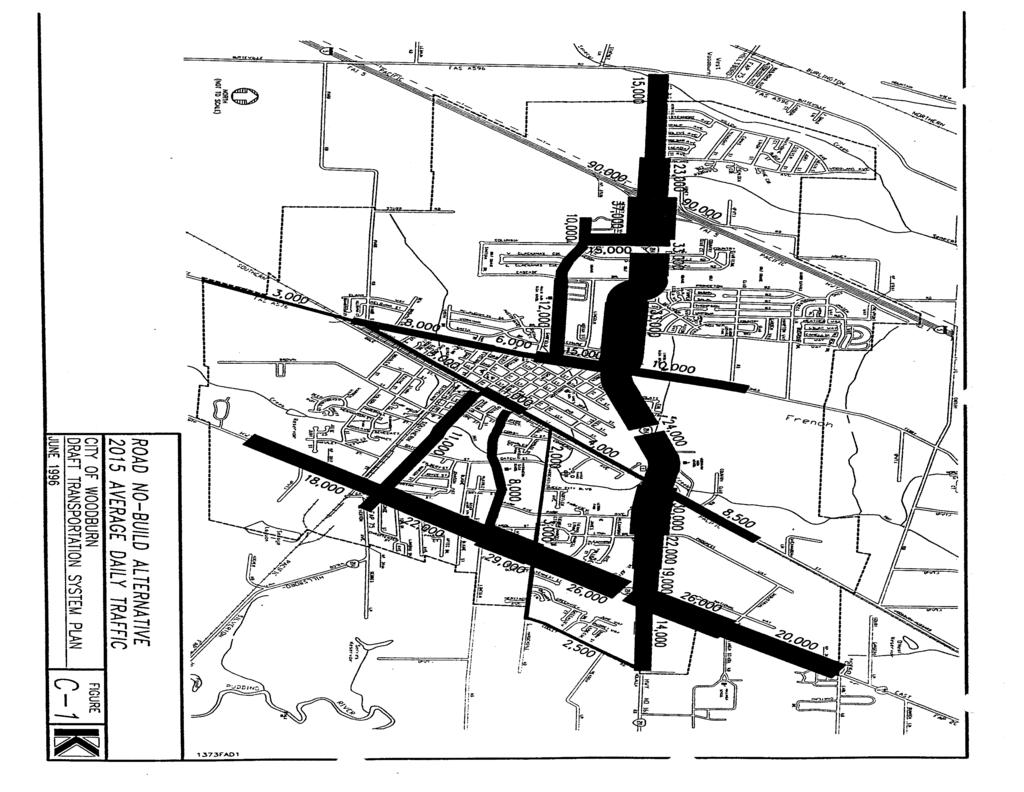
166
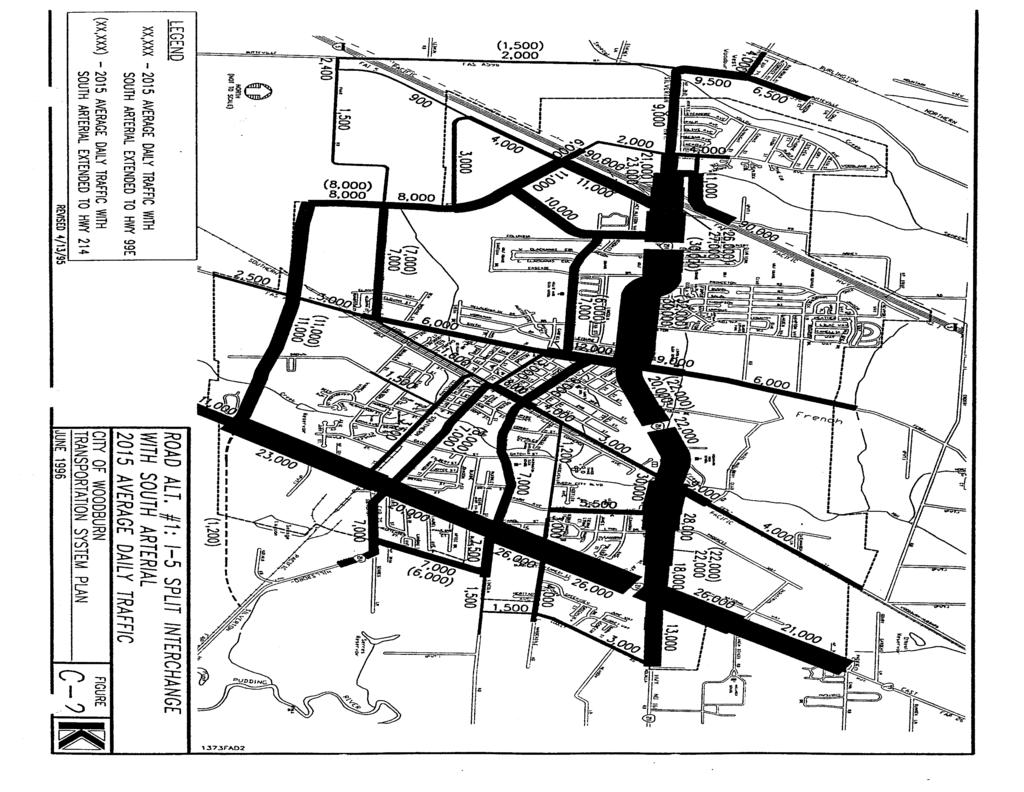
167
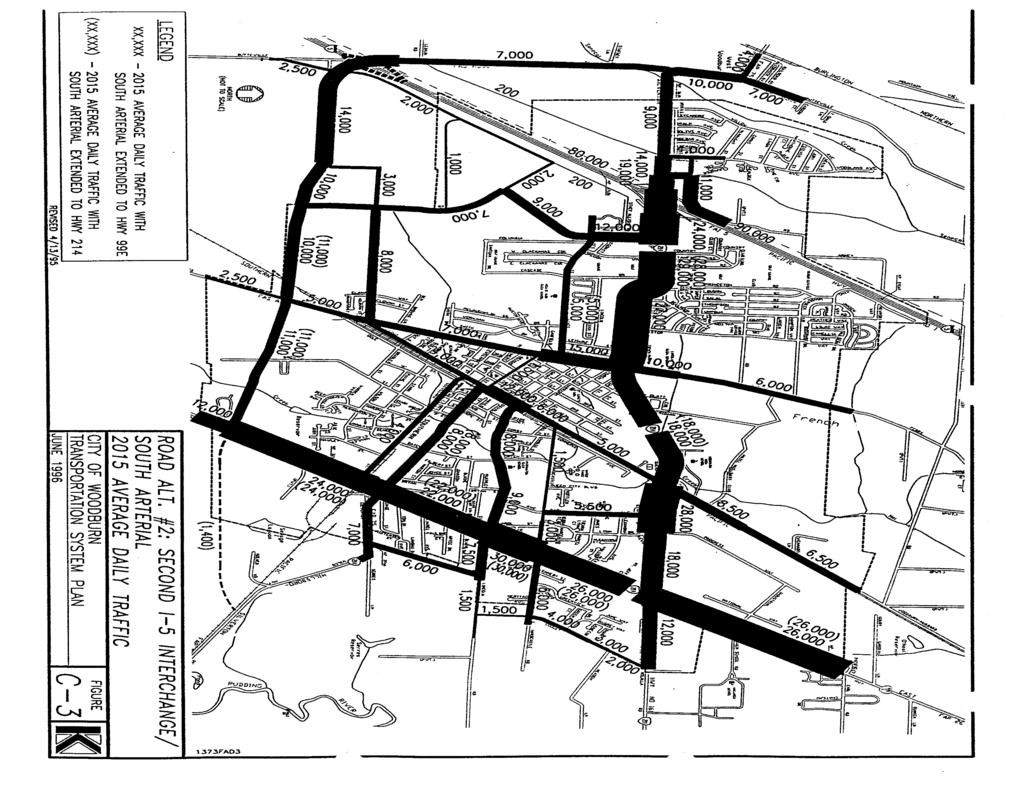
168
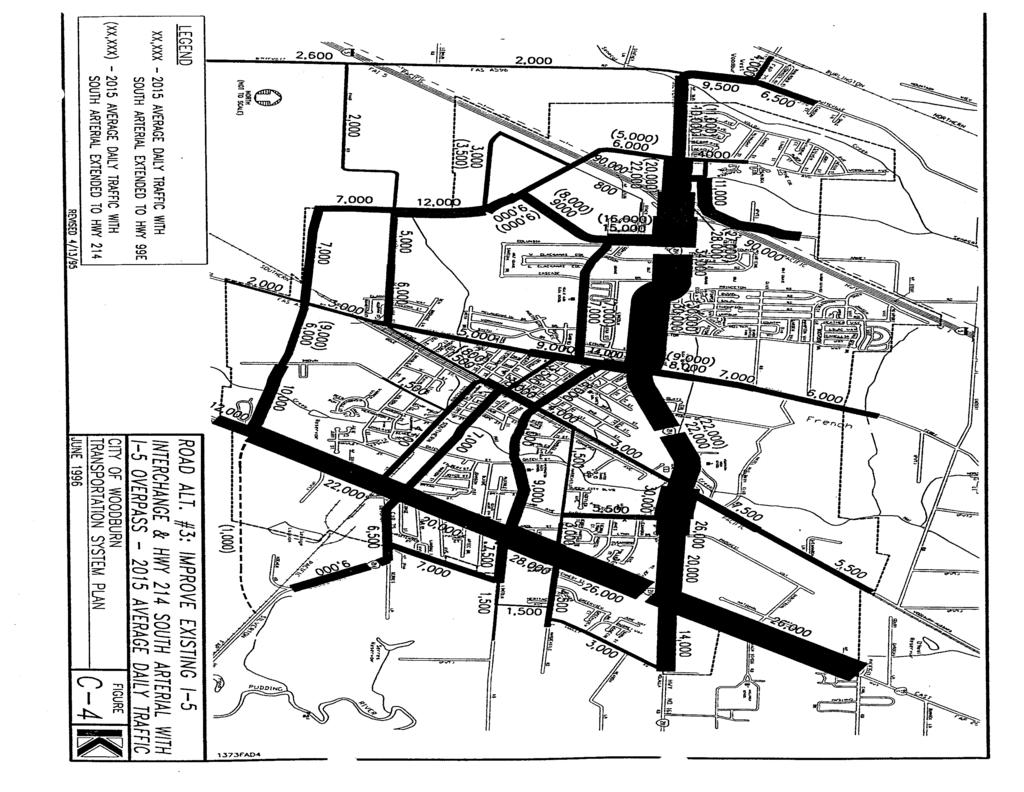
169
Clackamas County Comprehensive Plan
 ROADWAYS The County s road system permits the movement of goods and people between communities and regions, using any of a variety of modes of travel. Roads provide access to virtually all property. They
Highway 217 Corridor Study. Phase I Overview Report
 Highway 217 Corridor Study Phase I Overview Report November 3, 24 BACKGROUND AND OVERVIEW Study purpose The Highway 217 Corridor Study is developing multi-modal transportation solutions for traffic problems
4. ENVIRONMENTAL IMPACT ANALYSIS 9. TRANSPORTATION AND TRAFFIC
 4. ENVIRONMENTAL IMPACT ANALYSIS 9. TRANSPORTATION AND TRAFFIC 4.9.1 INTRODUCTION The following section addresses the Proposed Project s impact on transportation and traffic based on the Traffic Study
Highway 49, Highway 351 and Highway 91 Improvements Feasibility Study Craighead County
 Highway 49, Highway 351 and Highway 91 Improvements Feasibility Study Craighead County Executive Summary March 2015 Highway 49, Highway 351 and Highway 91 Improvements Feasibility Study Craighead County
JONESBORO HIGHWAY 63 HIGHWAY 18 CONNECTOR STUDY
 JONESBORO HIGHWAY 63 HIGHWAY 18 CONNECTOR STUDY Craighead County May 2007 JONESBORO HIGHWAY 63 HIGHWAY 18 CONNECTOR STUDY Craighead County May 2007 Prepared by Planning and Research Division Arkansas State
Los Altos Hills Town Council - June 18, 2015 Palo Alto City Council June 22, AGENDA ITEM #2.B Presentation
 Los Altos Hills Town Council - June 18, 2015 Palo Alto City Council June 22, 2015 AGENDA ITEM #2.B Presentation Previous Presentations Los Altos Hills Town Council in May 2014 and February 2015 Palo Alto
TRANSPORTATION ANALYSIS REPORT US Route 6 Huron, Erie County, Ohio
 TRANSPORTATION ANALYSIS REPORT US Route 6 Huron, Erie County, Ohio December 12, 2012 Prepared for: The City of Huron 417 Main Huron, OH 44839 Providing Practical Experience Technical Excellence and Client
Chapter 4 Traffic Analysis
 Chapter 4 Traffic Analysis PURPOSE The traffic analysis component of the K-68 Corridor Management Plan incorporates information on the existing transportation network, such as traffic volumes and intersection
Route 7 Corridor Study
 Route 7 Corridor Study Executive Summary Study Area The following report analyzes a segment of the Virginia State Route 7 corridor. The corridor study area, spanning over 5 miles in length, is a multi
Appendix C. NORTH METRO STATION AREA TRAFFIC IMPACT STATEMENT 88th Avenue Station
 Appendix C NORTH METRO STATION AREA TRAFFIC IMPACT STATEMENT 88th Avenue Station Prepared for: Regional Transportation Department and URS Corporation as part of the North Metro EIS David Evans and Associates,
Corpus Christi Metropolitan Transportation Plan Fiscal Year Introduction:
 Introduction: The Safe, Accountable, Flexible, Efficient Transportation Equity Act: A Legacy for Users (SAFETEA-LU) has continued the efforts started through the Intermodal Surface Transportation Efficiency
WELCOME TO OPEN HOUSE # 1 June 14, 2017
 Langstaff Road Weston Road to Highway 7 Class Environmental Assessment Study WELCOME TO OPEN HOUSE # 1 June 14, 2017 Please sign in and join our mailing list Purpose of Open House #1 & Study Area York
Magnolia Place. Traffic Impact Analysis. Prepared for: City of San Mateo. Prepared by: Hexagon Transportation Consultants, Inc.
 Magnolia Place Traffic Impact Analysis Prepared for: City of San Mateo Prepared by: Hexagon Transportation Consultants, Inc. Updated January 4, 2010 Table of Contents 1. Introduction...1 2. Existing Conditions...6
New Measure A Expenditure Categories DEFINITIONS OF ELIGIBLE EXPENDITURES Adopted March 8, 2007
 New Measure A Expenditure Categories DEFINITIONS OF ELIGIBLE EXPENDITURES Adopted March 8, 2007 City Street and County Road Maintenance Program The preservation and keeping of public street and road rights-of-way
Basalt Creek Transportation Refinement Plan Recommendations
 Basalt Creek Transportation Refinement Plan Recommendations Introduction The Basalt Creek transportation planning effort analyzed future transportation conditions and evaluated alternative strategies for
APPENDIX G: INTERSECTION NEEDS AT OKEECHOBEE BOULEVARD
 APPENDIX G: INTERSECTION NEEDS AT OKEECHOBEE BOULEVARD INTERSECTION NEEDS AT SR 7 and OKEECHOBEE BOULEVARD SR 7 Extension Project Development and Environment (PD&E) Study From Okeechobee Boulevard (SR
ROUTES 55 / 42 / 676 BUS RAPID TRANSIT LOCALLY PREFERRED ALTERNATIVE
 ROUTES 55 / 42 / 676 BUS RAPID TRANSIT LOCALLY PREFERRED ALTERNATIVE April, 2012 1 INTRODUCTION The need for transit service improvements in the Routes 42/55/676 corridor was identified during the Southern
MOUNTAIN HOUSE SPECIFIC PLAN I 9.1 INTRODUCTION ASSUMPTIONS TRANSPORTATION FACILITIES TRANSPORTATION IMPROVEMENTS PHASING 9.
 CHAPTER NINE: TRANSPORTATION AND CIRCULATION 9.1 INTRODUCTION 9.1 9.2 ASSUMPTIONS 9.1 9.3 TRANSPORTATION FACILITIES 9.1 9.4 TRANSPORTATION IMPROVEMENTS PHASING 9.3 LIST OF FIGURES LIST OF TABLES Figure
TRAFFIC IMPACT ANALYSIS
 TRAFFIC IMPACT ANALYSIS FOR THE CHAMPAIGN UNIT#4 SCHOOL DISTRICT PROPOSED HIGH SCHOOL (SPALDING PARK SITE) IN THE CITY OF CHAMPAIGN Final Report Champaign Urbana Urbanized Area Transportation Study 6/24/2014
City of Wayzata Comprehensive Plan 2030 Transportation Chapter: Appendix A
 A1. Functional Classification Table A-1 illustrates the Metropolitan Council s detailed criteria established for the functional classification of roadways within the Twin Cities Metropolitan Area. Table
Figure 1: East West Connector Alignment Alternatives Concept Drawing
 Page 2 of 9 Figure 1: East West Connector Alignment Alternatives Concept Drawing The Montebello Drive extension will run north south and connect Wilsonville Road to the Boones Ferry Road to Brown Road
EXECUTIVE SUMMARY OF CALEDON TRANSPORTATION NEEDS STUDY
 EXECUTIVE SUMMARY OF CALEDON TRANSPORTATION NEEDS STUDY The Caledon Transportation Needs Study has been undertaken as a joint project by the Town of Caledon and the Region of Peel to determine the existing
Preliminary Transportation Analysis
 Preliminary Transportation Analysis Goals of a Robust, Multimodal Transportation Network Safe Accessible/Connected Efficient Comfortable Context-Sensitive Motor Vehicle: Continue to analyze the data to
Operational Comparison of Transit Signal Priority Strategies
 Operational Comparison of Transit Signal Priority Strategies Revision Submitted on: November, 0 Author: Adriana Rodriguez, E.I Assistant Engineer Parsons Brinckerhoff 0 South Orange Avenue, Suite 00 Orlando,
TRASBURG RANSPORTATION
 TRASBURG RANSPORTATION LAN DEVELOPED BY THE TRANSPORTATION PLANNING DIVISION OF THE VIRGINIA DEPARTMENT OF TRANSPORTATION IN COOPERATION WITH THE U.S. DEPARTMENT OF TRANSPORTATION, FEDERAL HIGHWAY ADMINISTRATION
Chapter 6 Transportation Plan
 Chapter 6 Transportation Plan Transportation Plan Introduction Chapter 6 Transportation Plan Transportation Plan Introduction This chapter describes the components of Arvada s transportation system, comprised
Solana Beach Comprehensive Active Transportation Strategy (CATS)
") Solana Beach Comprehensive Active Transportation Strategy (CATS) 3.0 Goals & Policies The Solana Beach CATS goals and objectives outlined below were largely drawn from the Solana Beach Circulation Element
Solana Beach Comprehensive Active Transportation Strategy (CATS) 3.0 Goals & Policies The Solana Beach CATS goals and objectives outlined below were largely drawn from the Solana Beach Circulation Element
Exhibit 1 PLANNING COMMISSION AGENDA ITEM
 Exhibit 1 PLANNING COMMISSION AGENDA ITEM Project Name: Grand Junction Circulation Plan Grand Junction Complete Streets Policy Applicant: City of Grand Junction Representative: David Thornton Address:
Traffic Impact Study. Westlake Elementary School Westlake, Ohio. TMS Engineers, Inc. June 5, 2017
 TMS Engineers, Inc. Traffic Impact Study Westlake Elementary School Westlake, Ohio June 5, 2017 Prepared for: Westlake City Schools - Board of Education 27200 Hilliard Boulevard Westlake, OH 44145 TRAFFIC
Recommended Roadway Plan Section 2 - Land Development and Roadway Access
 Recommended Roadway Plan Section 2 - Land Development and Roadway Access SECTION 2 Land Development and Roadway Access 2.1 Land Use and Access Management The Federal Highway Administration (FHWA) defines
MCTC 2018 RTP SCS and Madera County RIFP Multi-Modal Project Eval Criteria GV13.xlsx
 MCTC 8 RTP SCS and Madera County RIFP Multi-Modal Project Eval Criteria GV.xlsx Madera County Transportation Commission Regional Transportation Plan / Sustainable Communities Strategy Multi-Modal Project
Circulation in Elk Grove includes: Motor vehicles, including cars and trucks
 Circulation, as it is used in this General Plan, refers to the many ways people and goods move from place to place in Elk Grove and the region. Circulation in Elk Grove includes: Motor vehicles, including
City of Homewood Transportation Plan
 City of Homewood Transportation Plan Prepared for: City of Homewood, Alabama Prepared by: Skipper Consulting, Inc. May 2007 TABLE OF CONTENTS INTRODUCTION... 1 BACKGROUND INFORMATION... 1 EXISTING TRANSPORTATION
SECTION 1 - TRAFFIC PLANNING
 SECTION 1 - TRAFFIC PLANNING 1.1 TRAFFIC OPERATIONS 1.1.1 Roadway Functional Classification The Multnomah County Comprehensive Framework Plan s Policy 34: Trafficways and the Functional Classification
Executive Summary June 2015
 Executive Summary June 2015 Highway 112 Corridor Study Benton and Washington Counties Executive Summary June 2015 Prepared by Transportation Planning and Policy Division Arkansas State Highway and Transportation
Transportation Master Plan Advisory Task Force
 Transportation Master Plan Advisory Task Force Network Alternatives & Phasing Strategy February 2016 BACKGROUND Table of Contents BACKGROUND Purpose & Introduction 2 Linking the TMP to Key Council Approved
SANTA CLARA COUNTYWIDE BICYCLE PLAN August 2008
 SANTA CLARA COUNTYWIDE BICYCLE PLAN August 2008 To assist VTA and Member Agencies in the planning, development and programming of bicycle improvements in Santa Clara County. Vision Statement To establish,
5858 N COLLEGE, LLC N College Avenue Traffic Impact Study
 5858 N COLLEGE, LLC nue Traffic Impact Study August 22, 2016 Contents Traffic Impact Study Page Preparer Qualifications... 1 Introduction... 2 Existing Roadway Conditions... 5 Existing Traffic Conditions...
Regional Transportation Needs Within Southeastern Wisconsin
 Regional Transportation Needs Within Southeastern Wisconsin #118274 May 24, 2006 1 Introduction The Southeastern Wisconsin Regional Planning Commission (SEWRPC) is the official areawide planning agency
DRAFT BUENA VISTA 2020 TRANSPORTATION PLAN
 DRAFT BUENA VISTA 2020 TRANSPORTATION PLAN DEVELOPED BY THE TRANSPORTATION PLANNING DIVISION OF THE VIRGINIA DEPARTMENT OF TRANSPORTATION IN COOPERATION WITH THE U.S. DEPARTMENT OF TRANSPORTATION, FEDERAL
Rochester Downtown Bicycle Study 2009
 Rochester Downtown Bicycle Study 2009 Relationship of ROCOG Long Range Transportation Plan to Rochester Comprehensive Plan Regional Long Range Transportation Plan (LRTP) is prepared under the auspices
D.13 Transportation and Traffic
 This section addresses transportation and traffic issues and impacts related to the Proposed Project. Section D.13.1 provides a description of the affected environment for the Proposed Project. Applicable
Portland International Airport Bicycle and Pedestrian Plan (October 2003) Staff Acknowledgements
 Staff Acknowledgements") Portland International Airport Bicycle and Pedestrian Plan (October 2003) Staff Acknowledgements Scott King, Senior Aviation Planner Jason Gately, Senior Aviation Planner Preston Beck, Associate Planner
Portland International Airport Bicycle and Pedestrian Plan (October 2003) Staff Acknowledgements Scott King, Senior Aviation Planner Jason Gately, Senior Aviation Planner Preston Beck, Associate Planner
University Hill Transportation Study Technical Memorandum Alternatives Modeling and Analysis May 2007
 Technical Memorandum May 2007 Syracuse Metropolitan Transportation Council Edwards and Kelcey with Wallace Roberts and Todd Alta Planning and Design CONTENTS SECTION ONE- INTRODUCTION...1 SECTION TWO-
ARTINSVILLE ENRY OUNTY REA RANSPORTATION TUDY
 ARTINSVILLE ENRY OUNTY REA RANSPORTATION TUDY DEVELOPED BY THE TRANSPORTATION AND MOBILITY PLANNING DIVISION OF THE VIRGINIA DEPARTMENT OF TRANSPORTATION IN COOPERATION WITH THE U.S. DEPARTMENT OF TRANSPORTATION,
Glenn Avenue Corridor Traffic Operational Evaluation
 Glenn Avenue Corridor Traffic Operational Evaluation PREPARED FOR: THE CITY OF AUBURN PREPARED BY: DECEMBER 2007 Glenn Avenue Corridor Study--Auburn, Alabama TABLE OF CONTENTS Introduction... 1 Background
ROADSOADS CONGESTION HAMPTON SYSTEMYSTEM MANAGEMENT. Part II Roadway Congestion Analysis Mitigation Strategies and Evaluation
 HAMPTON ROADSOADS CONGESTION MANAGEMENT SYSTEMYSTEM Part II Roadway Congestion Analysis Mitigation Strategies and Evaluation Presented by: Dwight Farmer, PE Deputy Executive Director, Transportation April
METHODOLOGY. Signalized Intersection Average Control Delay (sec/veh)
") Chapter 5 Traffic Analysis 5.1 SUMMARY US /West 6 th Street assumes a unique role in the Lawrence Douglas County transportation system. This principal arterial street currently conveys commuter traffic
Chapter 5 Traffic Analysis 5.1 SUMMARY US /West 6 th Street assumes a unique role in the Lawrence Douglas County transportation system. This principal arterial street currently conveys commuter traffic
CITY OF COCOA BEACH 2025 COMPREHENSIVE PLAN. Section VIII Mobility Element Goals, Objectives, and Policies
 CITY OF COCOA BEACH 2025 COMPREHENSIVE PLAN Section VIII Mobility Element Goals, Objectives, and Policies Adopted August 6, 2015 by Ordinance No. 1591 VIII MOBILITY ELEMENT Table of Contents Page Number
TRAFFIC IMPACT STUDY COMPREHENSIVE UPDATE TOWN OF THOMPSON S STATION, TENNESSEE PREPARED FOR: THE TOWN OF THOMPSON S STATION
 TRAFFIC IMPACT STUDY COMPREHENSIVE UPDATE TOWN OF THOMPSON S STATION, TENNESSEE PREPARED FOR: THE TOWN OF THOMPSON S STATION Transportation Consultants, LLC 1101 17 TH AVENUE SOUTH NASHVILLE, TN 37212
INTERMODAL TRANSPORTATION PLAN
 INTRODUCTION INTERMODAL TRANSPORTATION PLAN Effective intermodal transportation implies a public policy for actively decreasing the demand for automobile trips and consequently reducing automobile related
TRAFFIC ASSESSMENT River Edge Colorado
 TRAFFIC ASSESSMENT River Edge Colorado Submitted by: Fehr & Peers 621 17th Street, Ste. 231 Denver, CO 8293 (33) 296-43 December, 21 App. M-2 Traffic Assessment River Edge Colorado December 21 TABLE OF
Abrams Associates. Transportation Impact Analysis. City of Rocklin. Prepared for: David Mohlenbrok City of Rocklin 4081 Alvis Court Rocklin, CA 95677
 Transportation Impact Analysis Sierra College Boulevard Commercial Project City of Rocklin Prepared for: David Mohlenbrok City of Rocklin 081 Alvis Court Rocklin, CA 95677 Prepared by: 1875 Olympic Boulevard,
Third Street Bridge & Corridor Project
 Third Street Bridge & Corridor Project Preparation for the FY2018 budget to commence October 1, 2017, includes funding to address a project that has been considered since 1994. The Third Street bridge
City of Novi Non-Motorized Master Plan 2011 Executive Summary
 City of Novi Non-Motorized Master Plan 2011 Executive Summary Prepared by: February 28, 2011 Why Plan? Encouraging healthy, active lifestyles through pathway and sidewalk connectivity has been a focus
ARRENTON RANSPORTATION
 ARRENTON RANSPORTATION LAN DEVELOPED BY THE TRANSPORTATION PLANNING DIVISION OF THE VIRGINIA DEPARTMENT OF TRANSPORTATION IN COOPERATION WITH THE U.S. DEPARTMENT OF TRANSPORTATION, FEDERAL HIGHWAY ADMINISTRATION
City of Gainesville Transportation/Roadway Needs PROJECT SUMMARY
 A1 Roadway Resurfacing $23,846,000 TYPE: Preservation of existing system Roadway resurfacing A2 Signal Replacement $6,000,000 TYPE: Preservation of existing system Replace traffic signals. B1 W 6th St
5. RUNNINGWAY GUIDELINES
 5. RUNNINGWAY GUIDELINES These guidelines should be considered collectively when making runningway decisions. A runningway is the linear component of the transit system that forms the right-of-way reserved
Chapter 7. Transportation. Transportation Road Network Plan Transit Cyclists Pedestrians Multi-Use and Equestrian Trails
 Chapter 7 Transportation Transportation Road Network Plan Transit Cyclists Pedestrians Multi-Use and Equestrian Trails 7.1 TRANSPORTATION BACKGROUND The District of Maple Ridge faces a number of unique
Sixth Line Development - Transit Facilities Plan
 Memorandum Date: November 13, 2012 To: From: c.c. Subject: Rob Freeman (Freeman Planning) Kevin Phillips Sixth Line Development - Transit Facilities Plan 33016631 This memo was prepared to review the transit
Southwest Bus Rapid Transit (SW BRT) Functional Planning Study - Executive Summary January 19 LPT ATTACHMENT 2.
 Functional Planning Study - Executive Summary January 19 LPT ATTACHMENT 2.") Southwest Bus Rapid Transit (SW BRT) Functional Planning Study - Executive Summary 2011 January 19 1 of 19 Introduction This executive summary presents the results of the Southwest Bus Rapid Transit (SW
Southwest Bus Rapid Transit (SW BRT) Functional Planning Study - Executive Summary 2011 January 19 1 of 19 Introduction This executive summary presents the results of the Southwest Bus Rapid Transit (SW
SELECTED ROADWAY CAPACITY ANALYSIS
 CHAPTERFOUR SELECTED ROADWAY CAPACITY ANALYSIS 4.1 SELECTED ROADWAY CAPACITY ANALYSIS Introduction Capacity analysis was performed on six selected roadways within the Dearborn County study area using the
TRANSPORTATION TRAINING TOPICS. April 6, 2010
 TRANSPORTATION TRAINING TOPICS April 6, 2010 Roles of Transportation Providers Context and Policy Makers Division of Transportation and Traffic Other City Operations Other Transportation Operators CMA
City of Hamilton s Transportation Master Plan (TMP) Public Consultation 3 December 2015
 Public Consultation 3 December 2015") City of Hamilton s Transportation Master Plan (TMP) Public Consultation 3 December 2015 McPhail Transportation Planning Services Ltd. AGENDA 6:00 7:00 pm Viewing Boards / Q & A with the Team 7:00 7:50
City of Hamilton s Transportation Master Plan (TMP) Public Consultation 3 December 2015 McPhail Transportation Planning Services Ltd. AGENDA 6:00 7:00 pm Viewing Boards / Q & A with the Team 7:00 7:50
Donahue Drive Corridor Traffic Operational Evaluation
 Donahue Drive Corridor Traffic Operational Evaluation PREPARED FOR: THE CITY OF AUBURN PREPARED BY: JANUARY 2007 Donahue Drive Corridor Study--Auburn, Alabama TABLE OF CONTENTS Introduction... 1 Background
3.0 PROJECT DESCRIPTION
 The following section of the Draft EIR contains a description of the proposed Elk Grove Boulevard/SR 99 Interchange Modification project, consistent with the requirements of CEQA Guidelines Section 15124.
Intersection Traffic Control Feasibility Study
 Intersection Traffic Control Feasibility Study CSAH 9 at CSAH 60 (185th Avenue) Prepared For: Dakota County Transportation Department Western Service Center 14955 Galaxie Avenue, 3rd Floor Apple Valley,
Purpose and Need. Chapter Introduction. 2.2 Project Purpose and Need Project Purpose Project Need
 Chapter 2 Purpose and Need 2.1 Introduction The El Camino Real Bus Rapid Transit (BRT) Project (Project) would make transit and other transportation improvements along a 17.6-mile segment of the El Camino
Access Management Regulations and Standards
 Access Management Regulations and Standards Efficient highway operation Reasonable property access Concept of Access Management The way to manage access to land development while simultaneously preserving
3.0 Future Conditions
 3.0 Future Conditions In order to be able to recommend appropriate improvements to the transportation system of the Town, it is important to first understand the nature and volume of traffic that is expected
NM-POLICY 1: Improve service levels, participation, and options for non-motorized transportation modes throughout the County.
 Transportation PRINCE WILLIAM COUNTY 2008 COMPREHENSIVE PLAN NON-MOTORIZED PLAN CONTENTS Goals, Policies, and Action Strategies Table 4 (Bike Facility Classifications and Descriptions) Table 5 (Bike Facility
Multimodal Analysis in the 2010 Highway Capacity Manual
 Multimodal Analysis in the 2010 Highway Capacity Manual It s not just cars anymore! Jamie Parks, AICP HCAT Conference May 9-10, 2011 Multimodal LOS in the 2010 HCM History and background Overview of methods
o n - m o t o r i z e d transportation is an overlooked element that can greatly enhance the overall quality of life for the community s residents.
 N o n - m o t o r i z e d transportation is an overlooked element that can greatly enhance the overall quality of life for the community s residents. 84 Transportation CHAPTER 11 INTRODUCTION Transportation
Bridge Street Corridor Study Report
 Bridge Street Corridor Study Report Prepared for: Prepared by: BRIDGE STREET CORRIDOR STUDY REPORT PREPARED FOR: CITY OF ARROYO GRANDE COMMUNITY DEVELOPMENT DEPARTMENT 300 EAST BRANCH STREET ARROYO GRANDE,
# Southeastern Wisconsin Regional Freeway System Reconstruction Study and Preliminary Recommended Plan
 #70421 Southeastern Wisconsin Regional Freeway System Reconstruction Study and Preliminary Recommended Plan Public Information Meetings and Hearings May June 2002 1 Reason for Freeway System Study 270-mile
STUDY ADVISORY COMMITTEE. October 8, 2015
 STUDY ADVISORY COMMITTEE October 8, 2015 Study Purpose evaluate the long-term transportation strategies and investments needed to sustain the county s economic health and quality of life in the coming
Tulsa Metropolitan Area LONG RANGE TRANSPORTATION PLAN
 Tulsa Metropolitan Area LONG RANGE TRANSPORTATION PLAN Indian Nations Council of Governments August 2005 CONTACTING INCOG In developing the Destination 2030 Long Range Transportation Plan, INCOG s Transportation
Main-McVay Transit Study: Phase 2 Options Definition and High Level Constraints Evaluation
 Main-McVay Transit Study: Phase 2 Options Definition and High Level Constraints Evaluation APRIL 2016 A collaborative study between: For Additional Information or to Comment If you would like additional
Summary: Mercer County Princeton Avenue & Spruce Street Study January 2009
 Summary: Several recent studies have assessed potential development and redevelopment opportunities in the Mercer Crossing area of Trenton, Ewing, and Lawrence. This Princeton Avenue and Spruce Street
Non-Motorized Transportation 7-1
 Non-Motorized Transportation 7-1 Transportation facilities no longer mean just accommodating a vehicle powered by a combustion engine. Pedestrian and non-motorized facilities are important modes of travel
Highway 111 Corridor Study
 Highway 111 Corridor Study June, 2009 LINCOLN CO. HWY 111 CORRIDOR STUDY Draft Study Tea, South Dakota Prepared for City of Tea Sioux Falls Metropolitan Planning Organization Prepared by HDR Engineering,
TRANSPORTATION & MOBILITY
 TRANSPORTATION & MOBILITY ROADWAY SYSTEM There are approximately 40 miles of roadways in Manitou Springs. For planning purposes, roadways are typically assigned a functional classification which defines
Chapter 5. Complete Streets and Walkable Communities.
 Chapter 5. Complete Streets and Walkable Communities. 5.1 Description of Complete Streets. Cities throughout the world, and specifically the United States, are coming to embrace a new transportation and
Governor s Transportation Vision Panel
 Office of Governor Kate Brown Governor s Transportation Vision Panel JLA Public Involvement Project Overview The is a yearlong effort to develop a series of recommendations for the Governor that address
Prepared For: Shieldbay Developments Inc. c/o Matson, McConnell Ltd. 2430A Bloor Street West Toronto, Ontario M6S 1P9.
 Prepared For: Shieldbay Developments Inc. c/o Matson, McConnell Ltd. 2430A Bloor Street West Toronto, Ontario M6S 1P9 Prepared By: URS Canada Inc. 4 th Floor, 30 Leek Crescent Richmond Hill, Ontario L4B
Truck Climbing Lane Traffic Justification Report
 ROUTE 7 (HARRY BYRD HIGHWAY) WESTBOUND FROM WEST MARKET STREET TO ROUTE 9 (CHARLES TOWN PIKE) Truck Climbing Lane Traffic Justification Report Project No. 6007-053-133, P 101 Ι UPC No. 58599 Prepared by:
ENHANCED PARKWAY STUDY: PHASE 2 CONTINUOUS FLOW INTERSECTIONS. Final Report
 Preparedby: ENHANCED PARKWAY STUDY: PHASE 2 CONTINUOUS FLOW INTERSECTIONS Final Report Prepared for Maricopa County Department of Transportation Prepared by TABLE OF CONTENTS Page EXECUTIVE SUMMARY ES-1
Subject: Solberg Avenue / I-229 Grade Separation: Traffic Analysis
 MEMORANDUM Transportation Bill Troe, AICP Jason Carbee, AICP 12120 Shamrock Plaza Suite 300 Omaha, NE 68154 (402) 334-8181 (402) 334-1984 (Fax) To: Project File Date: Subject: Solberg Avenue / I-229 Grade
2045 Long Range Transportation Plan. Summary of Draft
 2045 Long Range Transportation Plan Summary of Draft Fredericksburg Area Metropolitan Planning Organization The George Washington Region includes the City of Fredericksburg and the counties of Caroline,
CONNECTING PEOPLE TO PLACES
 CONNECTING PEOPLE TO PLACES 82 EAST BENCH MASTER PLAN 07 Introduction The East Bench transportation system is a collection of slow moving, treelined residential streets and major arteries that are the
CITY OF OAKLAND. 27th Street Bikeway Feasibility and Design. Final Report (v3) March 23, Kimley-Horn and Associates, Inc.
 March 23, Kimley-Horn and Associates, Inc.") CITY OF OAKLAND 27th Street Bikeway Feasibility and Design Final Report (v3) March 23, 2007 PREPARED BY: Kimley-Horn and Associates, Inc. Table of Contents 1. Introduction 3 2. 27 th Street/Bay Place Corridor
CITY OF OAKLAND 27th Street Bikeway Feasibility and Design Final Report (v3) March 23, 2007 PREPARED BY: Kimley-Horn and Associates, Inc. Table of Contents 1. Introduction 3 2. 27 th Street/Bay Place Corridor
Proposed Action, Purpose and Need Technical Memorandum
 Proposed Action, Purpose and Need Technical Memorandum MoPac (State Loop 1) Intersections, Austin District From North of Slaughter Lane to South of La Crosse Avenue CSJ: 3136-01-015 Travis County, Texas
Transportation Impact Study for Abington Terrace
 Transportation Impact Study for Abington Terrace Abington Township, Montgomery County, PA Sandy A. Koza, P.E., PTOE PA PE License Number PE059911 Prepared by McMahon Associates, Inc. 425 Commerce Drive,
ACTIVE TRANSPORTATION/NONMOTORIZED TRANSPORTATION
 ACTIVE TRANSPORTATION/NONMOTORIZED TRANSPORTATION BACKGROUND Active transportation, also known as nonmotorized transportation, is increasingly recognized as an important consideration when planning and
CHAPTER 4 TRANSPORTATION IMPACT STUDY TABLE OF CONTENTS
 CHAPTER 4 TRANSPORTATION IMPACT STUDY TABLE OF CONTENTS Section Title Page 4.1 Introduction... 4-1 4.1.1 General... 4-1 4.1.2 Applicant Responsibility... 4-1 4.1.3 Capacity and Safety Issues... 4-1 A.
In station areas, new pedestrian links can increase network connectivity and provide direct access to stations.
 The Last Mile Planning for Pedestrians Planning around stations will put pedestrians first. Making walking to stations safe and easy is important; walking will be a part of every rapid transit Accessible
South King County High-Capacity Transit Corridor Study
 HIGH-CAPACITY TRANSIT CORRIDOR STUDY South King County Corridor South King County High-Capacity Transit Corridor Study Corridor Report August 2014 South King County High Capacity Transit Corridor Report
NEIGHBORHOOD TRAFFIC CALMING POLICY
 NEIGHBORHOOD TRAFFIC CALMING POLICY I. PURPOSE The City of Kent continually strives to strengthen and protect its neighborhoods by improving the quality of life in residential areas. Traffic conditions
Access Management Regulations and Standards
 Access Management Regulations and Standards January 2014 Efficient highway operation Reasonable property access Concept of Access Management The way to manage access to land development while preserving
STREET AND HIGHWAY PLAN
 STREET AND HIGHWAY PLAN Introduction The street and highway system in the Winston-Salem Urban Area consists of thousands of miles of traffic carrying facilities, ranging from short local residential streets