SETTLEMENT & SLOPE STABILITY ANALYSES
|
|
|
- Naomi Davidson
- 5 years ago
- Views:
Transcription
1 Appendix A Settlement and Slope Stability Analyses
2 SETTLEMENT & SLOPE STABILITY ANALYSES Saugus RESCO Landfill Saugus, Massachusetts Prepared for: June, 2008 Prepared by: 11 Northeastern Boulevard Salem, NH Project
3 Table of Contents List of Tables...ii List of Attachments...ii 1.0 Introduction General Subsurface Conditions Settlement Analysis General Settlement Model Calculations Static and Seismic Slope Stability Analyses General Method of Analyses Slope Stability Analyses Permanent Displacement Analysis for Seismic Conditions Cross-Section Across Phase III Critical Slope Stability Cross-Section Subsurface Conditions for Analysis Shear Strength of Boston Blue Clay Results of Slope Stability Analyses Static Slope Stability Assuming No Consolidation of BBC Static Slope Stability Assuming Consolidation of BBC Slope Stability under Seismic Conditions Cross-Section Across Phase IV Critical Slope Stability Cross-Section Soil Parameters Results of Static Slope Stability Analysis Results of Seismic Slope Stability Analysis Conclusions and Recommendations Settlement Slope Stability Bibliography N:\projects\119504\2008\VF FEP Docs\Global Stability i
4 List of Tables Table 1 Table 2 Table 3 Table 4 Table 5 Boston Blue Clay Consolidation Calculations Undrained Shear Strength of Boston Blue Clay Under Partial Consolidation Undrained Shear Strength of Boston Blue Clay Under 100% Consolidation Summary of Slope Stability Analyses Results Cross Section Across Phase III Summary of Slope Stability Analyses Results Cross Section Across Phase IV List of Attachments Attachment A Settlement Analysis Attachment B Results of Static and Seismic Slope Stability Analyses Cross-Section Across Phase III B-1 Location of Slope Stability Cross-Section and Test Boring B-2 Results of Static Slope Stability Analysis B-3 Probabilistic Seismic Hazard Based on USGS B-4 Pseudo-Static Slope Stability Analysis to Determine Yield Acceleration B-5 Permanent Displacement Calculations Attachment C Results of Static and Seismic Slope Stability Analyses Cross-Section Across Phase IV C-1 Results of Static Slope Stability Analysis C-2 Results of Seismic Slope Stability Analysis N:\projects\119504\2008\VF FEP Docs\Global Stability ii
5 1.0 Introduction Refuse Energy Systems Company (RESCO), now known as Wheelabrator Saugus, J.V. (Wheelabrator), owns and operates a waste-to-energy plant and the adjacent ash residue disposal site, known as the Saugus RESCO Landfill (Landfill), in Saugus, Massachusetts. The Landfill accepts municipal solid waste (MSW) ash residue from the waste-to-energy plant located adjacent to the Landfill. The currently approved final grading plan for the Landfill consists of a ridge and valley configuration with a maximum elevation of 50 feet mean sea level (MSL) along the ridges. In all, there are five valley lines and six ridge lines. In addition, the Landfill consists of five phases, I through V. Phases I and II have been filled to the currently approved final grading, and Phases III, IV, and V are currently uncapped and either active or dormant covered with a layer of intermediated cover. In accordance with the 2008 Revisions to the Final Engineering Plan (2008 FEP), additional ash residue will be placed within the area between ridges by flattening the cross-slope (this is referred to as the valley fill ). The minimum cross-slope will be decreased from a five percent to a two percent slope, with a side slope of three horizontal to one vertical immediately adjacent to the valley line and in the perimeter areas. The slope along the length of the valley line will be maintained at one percent. The maximum Landfill elevation will remain at 50 feet MSL. This report presents the results of analyses performed by Shaw Environmental, Inc. (Shaw) to determine the impact of the valley fill on landfill settlement and global slope stability of the Landfill Phases III, IV, and V. The settlement analysis was performed using an idealized cross section taken at a critical cross section located within Phases III and IV. The slope stability was analyzed using two cross sections. The first slope stability cross section was taken perpendicular to the western perimeter of Phase III. The second slope stability cross section was taken perpendicular to the northwestern perimeter of Phase IV. N:\projects\119504\2008\VF FEP Docs\Global Stability 1-1
6 2.0 General Subsurface Conditions Boring logs of existing test borings and monitoring wells were used to interpret the general subsurface conditions at the Landfill. No field investigation or laboratory tests were performed as part of this study. A review of these logs shows that the Landfill is underlain by the following strata, starting from the top: Existing municipal solid waste (MSW) ash residue Municipal solid waste A layer of peat (not encountered at all locations) A layer of sand Boston Blue Clay (BBC) Glacial till In general, ash residue deposits vary from 0 to 40 feet in thickness to a maximum elevation of 50 feet MSL overlying the MSW. The bottom of MSW is at an approximate elevation of 0 feet MSL with a maximum thickness of approximately 25 to 30 feet. The thickness of peat varies from 0 to 7 feet. The thickness of sand is between 5 to 10 feet. The thickness of the BBC varies from 20 to 80 feet. The BBC consists of an over-consolidated upper crust which has a medium stiff consistency. The lower part of the BBC is soft, and it is normally consolidated. N:\projects\119504\2008\VF FEP Docs\Global Stability 2-1
7 3.0 Settlement Analysis 3.1 General The purpose of the settlement analysis performed was to determine whether the proposed two percent cross-slope will be adequate to accommodate any differential settlements in the Landfill that may occur in the future. If excessive differential settlement were to occur, surface water runoff to the valleys would be impeded which could result in ponding of surface water. The settlement analysis was performed for an idealized cross-section taken between a critical ridge and valley identified based on the subsurface conditions. 3.2 Settlement Model The MSW ash residue is relatively incompressible due to its cementing properties. Similarly, the settlement of the sand layer can be assumed to be very small because it is dense and its thickness is small. Therefore, the only strata that would contribute to landfill settlement include the following: MSW, peat layer, and the BBC. There are two settlement components associated with all of these three strata: (i) primary compression, and (ii) secondary compression. The potential contribution of each of these two components to differential settlement is discussed below. Primary Compression: The primary compression or primary consolidation of peat and BBC occur when the surcharge load is transferred to the soil skeleton as the excess pore pressure dissipates with time. Although the primary compression mechanism is different for MSW, the state-of-practice is to model its primary compression similar to primary consolidation of peat or clay. The magnitudes of the final value of primary compression of all three strata are proportional to: (i) the thickness of each stratum, and (ii) the magnitude of the surcharge loading. Although the subsurface condition (i.e., thicknesses of the various strata) under the site may vary with location, it is reasonable to assume that such change would be minimal over the length of settlement cross-section taken between any adjacent ridges and valleys because of the relatively short length. Therefore, it can be assumed that the change in subsurface conditions would have very little impact on differential settlement between adjacent ridges and valleys. Accordingly, only the differential settlement due to change in surcharge loading between two points is considered. Also, since the final value of the primary compression (i.e., at 100 percent consolidation) is of interest, the time rate of settlement is not of importance. Secondary Compression: Secondary compression within peat and BBC occur due to an internal rearrangement of the soil skeleton with time, which is independent of surcharge loading. This is a time dependent phenomenon. The secondary compression of MSW occurs due to biological decomposition of the waste with time. Again, the state-of-practice is to model the secondary N:\projects\119504\2008\VF FEP Docs\Global Stability 3-1
8 compression of MSW similar to the secondary consolidation of peat or clay. Also, only the final value of the secondary compression for all three strata is of interest. Since it is not dependent on surcharge loading, the secondary compression can contribute to differential settlement between two adjacent points only if the strata thicknesses between the two points vary. Since it is assumed that the thicknesses of strata are relatively uniform between adjacent ridges and valleys, the contribution of secondary compression to differential settlement should be negligible. It should also be noted that since the MSW is relatively old, it is very likely that almost all of the secondary settlement has already taken place. Accordingly, contribution of differential settlement due to secondary compression has been discounted in the settlement analysis. Based on the above discussion, it can be seen that only the primary compressions of MSW, peat, and BBC due to the difference in surcharge loading between two points need to be computed to estimate the differential settlement between those two points. The critical settlement points are selected along a cross-section taken perpendicular to the critical ridge and valley. 3.3 Calculations The settlement analysis is presented in Attachment A. Based on a review of the existing test boring logs, Shaw developed a typical cross-section along with an idealized subsurface profile. The calculations estimated a slope reduction of approximately 0.24 percent (i.e., post-settlement slope of 1.76 percent) between the critical ridge and valley. A long-term post-settlement slope of 1.76 percent would be adequate to promote surface run-off. N:\projects\119504\2008\VF FEP Docs\Global Stability 3-2
9 4.0 Static and Seismic Slope Stability Analyses 4.1 General In accordance with the 2008 FEP, ash residue placement will continue in Phases III, IV, and V. To analyzed the global slope stability of Phases III, IV, and V, the following two cross sections were used: The first cross section is perpendicular to the western perimeter of Phase III where the thickness of the underlying BBC is inferred to be the greatest within Phases III, IV, and IV. This is referred to as Cross Section Across Phase III in this report. At this location, a significant thickness of MSW and ash residue is already present; therefore, consolidation of the BBC from the existing surcharge loading was considered in the slope stability analysis of this cross section. The second cross section is perpendicular to the northwestern perimeter of Phase IV. This is referred to as Cross Section Across Phase IV in this report. At this location, the thickness of the BBC is relatively small. However, the thickness of the existing ash residue is minimal; therefore, the slope stability analysis for this cross section was performed assuming no consolidation of the BBC. Also, the slurry wall at this location is closest to the toe of the Landfill slope; therefore, sliding block type failure surfaces through the slurry wall were analyzed at this cross section location to determine the potential impact of the Landfill slope on the slurry wall. 4.2 Method of Analyses Slope Stability Analyses The slope stability analysis for the Landfill was performed using the computer program GSTABL7 (Version 2.0) developed by Gregory Geotechnical Software (GGS 2001) in conjunction with the user interface program STEDwin (Version 3.56) developed by Annapolis Engineering Software. The GSTABL7 computer program is an advanced version of the original STABL computer program developed at Purdue University (Purdue 1988). GSTABL7 performs two-dimensional limit equilibrium analysis using the method of slices to compute factors of safety against slope instability based on any of the following four analysis procedures: The modified Bishop method for circular failure surfaces (this method satisfies only moment equilibrium) The simplified Janbu method for circular, random, or sliding block failure surfaces (this method satisfies only force equilibrium) The Spencer method for circular, random, or sliding block failure surfaces (this method satisfies both force and moment equilibrium) N:\projects\119504\2008\VF FEP Docs\Global Stability 4-1
10 The Morgenstern-Price method for circular, random, or sliding block failure surfaces (this method also satisfies both force and moment equilibrium) Because they satisfy both force and moment equilibrium, the factors of safety computed from the Spencer and the Morgenstern-Price methods are more accurate than those obtained from the other two methods. However, the factors of safety computed from the modified Bishop method for circular failure surfaces are typically very close to those computed from Spencer or Morgenstern-Price methods. The simplified Janbu method typically yields conservative factors of safety. The slope stability analyses presented in this report were performed using the modified Bishop method for circular failure surfaces. To be conservative, the simplified Janbu method with the active and passive wedges generated according to the Rankine theory were used for sliding-block failure surfaces Permanent Displacement Analysis for Seismic Conditions The likely magnitude of the seismically-induced paramagnet displacement has been estimated using the simplified charts published by Makdisi and Seed (1978). These charts make use of the ratio of the yield acceleration to the maximum horizontal acceleration (k y /k max ) to provide an estimate of the likely permanent displacement. The yield acceleration value is the horizontal acceleration that results in a pseudo-static factor of safety of 1. The yield acceleration was determined using pseudo-static slope stability analysis using GSTABL. The maximum acceleration is the maximum of the acceleration values averaged over the entire failure surface. 4.3 Cross-Section Across Phase III Critical Slope Stability Cross-Section As noted previously, based on a review of the existing subsurface information in conjunction with the existing and designed ash residue grading at the landfill, a cross-section perpendicular to the western perimeter of Phase III is the most critical for slope stability of the three remaining phases. The location of this critical cross-section is shown in Attachment B-1. The design slope of the ash residue along the landfill perimeter is 3H:1V from elevation 20 feet to elevation 50 feet MSL at this cross-section Subsurface Conditions for Analysis The subsurface conditions at this cross-section location have been determined based on existing test boring logs (Wehran 1989; The IT Group 2000). Test boring PTB-8, monitoring well PMW- 5D, and piezometer PZ-00-4 are located in the vicinity of the selected critical slope stability cross-section; boring logs for these locations are used to approximate the subsurface conditions under the selected slope stability cross section. Based on these logs (see Attachment B-1) and literature from the 1976 MIT test site along I-95 in Saugus, the following thicknesses have been N:\projects\119504\2008\VF FEP Docs\Global Stability 4-2
11 assumed for the various layers/strata underlying the existing ash residue (listed in a descending order): Existing MSW = 20 feet Peat = 7 feet Sand/Silt = 5 feet Medium Boston blue clay = 18 feet Soft Boston blue clay = 60 feet A till or bedrock was assumed below El. 90 (NGVD) Shear Strength of Boston Blue Clay A short-term analysis for the end-of-filling stage using undrained shear strengths (S u ) for the BBC represents the most critical slope stability condition. Therefore, the most critical soil parameter for slope stability is the undrained shear strength of the BBC. To our knowledge, no site-specific shear strength testing of the BBC is available for the Landfill. Therefore, Shaw has used the soil testing information from the Massachusetts Institute of Technology (MIT) research work performed in 1976 for the I-95 embankment in Saugus. This information was provided to Wehran Engineering (now Shaw) by Prof. Charles Ladd of MIT in A method developed by Ladd and Foott (1974), known as SHANSEP (stress history and normalized soil engineering properties), was used to estimate the undrained shear strength of the BBC with depth. Because of the presence of sandy strata both above and below the BBC stratum, it is assumed that the BBC has two-way drainage. Since the S u of the BBC varies with depth, the BBC was subdivided into vertical layers to assign varying S u values with depth. To account for the varying surcharge loading from the varying ash residue height across the cross section, the BBC was also subdivided horizontally. It should be noted that the BBC has been gaining shear strength with time due to its consolidation from the weight of the MSW and the ash residue. To simplify shear strength gain computations, the consolidation due to the MSW and the ash residue have been computed separately and added (i.e., a linear superposition was used). The shear gain due to the MSW has been computed through 2008 assuming that the MSW was placed linearly between 1955 and The degree of consolidation calculations in Table 1 show that the BBC is almost fully consolidated under the weight of the MSW placed prior to The shear strength gain due to weight of the ash residue has been computed assuming that the ash residue was placed linearly between 1985 and The calculations presented in Table 1 show that the consolidation of the BBC varies with depth from 59 to 83 percent. The shear strength calculations are shown in Table 2. This table also shows the SHANSEP equation and parameters used to estimate the S u. The left part of Table 2 shows the estimated original S u of the BBC corresponding to pre-landfill conditions assuming the original ground N:\projects\119504\2008\VF FEP Docs\Global Stability 4-3
12 elevation to be at 0 feet MSL. The estimated S u values in Table 2 have been used in the static slope stability analysis. Table 3 shows the S u values assuming full consolidation of the BBC under both the MSW and the ash residue. These S u values have been used in the seismic slope stability analysis Results of Slope Stability Analyses Static Slope Stability Assuming No Consolidation of BBC The initial slope stability analysis was performed using the original shear strength of the BBC corresponding to the original ground elevation (assumed to be 0 feet MSL) prior to any waste placement at the Landfill. Therefore, this analysis ignores the consolidation and resulting strength gain within the BBC from the waste/ash residue placement above elevation 0 feet MSL. As noted previously, the computed S u values for the BBC are shown in Table 2. The slope stability analysis using these original S u values for the BBC yielded a minimum factor of safety of 1.36, which less than the acceptable factor of safety of 1.5. This shows that consolidation of the BBC should be considered in the slope stability analysis. The slope stability analysis results are included in Attachment B Static Slope Stability Assuming Consolidation of BBC This slope stability analysis accounts for the likely shear strength gain within the BBC from the weight of the MSW and ash residue. The shear strength gain calculations are discussed in Section 4.3; the estimated S u values corresponding to this condition are shown in Table 3. The static slope stability analysis assuming consolidation of the BBC through 2008 yielded a minimum factor of safety 1.6, which is greater than the acceptable value of 1.5. The slope stability analysis results are included in Attachment B Slope Stability under Seismic Conditions General Subtitle D regulations require that landfills located within seismic impact zones 1 be designed to withstand peak ground acceleration (PGA) value having a ten percent probability of exceedance in 250 years (which is equivalent to two percent probability of exceedance in 50 years). Based on the United States Geological Survey (USGS) website, the PGA having a two percent probability of exceedance in 50 years for this site is determined to be 0.16g; the corresponding moment magnitude of the earthquake is 6. Printouts of the USGS based probabilistic seismic hazard are included in Attachment B-3. Since the PGA value is greater than 0.1g, this Landfill is located within a seismic impact zone and, therefore, requires a seismic slope stability analysis. 1 Seismic impact zones are areas where the peak ground acceleration having a 10 percent probability of exceedance 250 years is greater than 0.10g. N:\projects\119504\2008\VF FEP Docs\Global Stability 4-4
13 Because the seismic loading is cyclic in nature (i.e., loading magnitude and direction change rapidly with time), an allowable factor of safety criterion is not appropriate for seismic slope stability. Instead, the state-of-practice is to use the concept of an acceptable permanent displacement. According to the U.S. Environmental Protection Agency (USEPA 1995), 12 inches is considered as the maximum allowable limit of seismically-induced permanent displacement for landfill slopes. Based on Newmark (1965), the potential for permanent displacement exists only if the maximum of the average horizontal accelerations induced within the slope stability cross-section exceeds the yield acceleration. The yield acceleration is the horizontal acceleration that results in a pseudo-static factor of safety of 1, which corresponds to an incipient state of slope movement. Therefore, the first step in the seismic slope stability analysis is to determine the yield acceleration value for the cross-section analyzed. Yield Acceleration An iterative pseudo-static slope stability analysis was performed using the GSTABL7 computer program to determine the minimum yield acceleration for the critical slope stability cross section analyzed. The iterative analysis involved repeating the pseudo-static slope stability analysis by varying the input horizontal acceleration value until the resulting factor of safety is 1. The PGA value corresponding to a ten percent probability on 250 years has a recurrence interval of 2,475 years. Therefore, it is reasonable to assume that the BBC has gained 100 percent consolidation when the site is subjected to the design PGA value. Accordingly, the S u values from Table 3 that correspond to 100 percent consolidation under the MSW and ash residue were assigned to the BBC while determining the yield acceleration. The iterative analysis showed that the minimum yield acceleration value for the critical cross section analyzed is 0.081g. The results of the final iterations of the pseudo-static slope stability analyses are included in Attachment B-4. Since the computed yield acceleration value is less the PGA value (i.e., 0.16g), a permanent displacement analysis was performed as discussed below. Permanent Displacement In the absence of seismic response analysis (e.g., SHAKE) to determine the time history of average accelerations within the critical failure surface, it is assumed that the maximum of the average acceleration values (k max ) within the critical failure surface (corresponding to the yield acceleration value) is equal to the PGA value. This assumption is conservative since the magnitudes of horizontal acceleration values at different points within the failure plane would be different, and all of these values would be less than or equal to the PGA value; therefore, the N:\projects\119504\2008\VF FEP Docs\Global Stability 4-5
14 average accelerations at different time durations (and hence the k max ) would be typically less than the PGA value. The permanent displacement calculations performed using the Makdisi and Seed (1978) chart is presented in Attachment B-5. These calculations estimate a maximum permanent displacement of approximately 4 inches. Since this is less than the maximum allowable limit of 12 inches, it is acceptable. The results of both static and seismic slope stability analyses for this cross-section are summarized in Table Cross-Section Across Phase IV Critical Slope Stability Cross-Section Since the existing ash residue elevations within Phase IV are significantly lower than 50 feet, it is concluded that slope stability along the outer perimeter of Phase IV could be critical, at this stage of the landfill operation. Accordingly, this second cross-section taken perpendicular to the northwestern perimeter of Phase IV (next to Route 107) was analyzed for slope stability. The location of this cross-section is shown in Attachment C-1. The subsurface condition at this cross-section location was interpreted based on the log for test boring PTB-6 (the boring log is included in Attachment C-1) Soil Parameters Again, a short-term analysis for the end-of-filling stage using undrained shear strength for the BBC represents the most critical slope stability condition. Therefore, as noted previously, the critical soil parameter for slope stability is the undrained shear strength of the soft BBC. The shear strength calculations along with the SHANSEP parameters used are presented in Attachment C-1. The initial average undrained shear strength of the BBC at the analyzed cross-section location, assuming no consolidation, is conservatively estimated to be 1,015 pounds per square foot (psf) Results of Static Slope Stability Analysis Slope stability of the Landfill slope with both circular and sliding-block type failure surfaces was analyzed. The sliding-block type failure surface was also used to analyze potential failure surfaces that pass through the slurry wall. As noted previously, a short-term analysis using undrained shear strength for the BBC represents the most critical slope stability condition. To be conservative 2, this analysis was performed 2 It should be noted that the shear strength of the BBC will increase with time due consolidation from the ash to be placed in the future. Therefore, the analyses performed are conservative. N:\projects\119504\2008\VF FEP Docs\Global Stability 4-6
15 assuming the current undrained shear strength for the BBC which is estimated to be 1015 psf. This analysis yielded a static factor of safety of 2.15 for the circular failure mode and 1.87 for the sliding-block type failure mode. A sliding-block failure surface passing through the slurry wall yielded a higher factor of safety of Therefore, all the computed factors of safety values are greater than the acceptable value of 1.5. The results of slope stability analyses for static conditions are included in Attachment C-1. A summary of the results is presented in Table Results of Seismic Slope Stability Analysis The yield acceleration was determined using the GSTABL7 computer program. Again, the estimated original undrained shear strength was assigned to the BBC in this analysis, which is conservative because it ignores consolidation and strength gain within the BBC. The analysis shows a minimum yield acceleration value of 0.151g for a sliding-block type failure mode through the slurry wall. Since this value is very close to the PGA, the anticipated permanent displacement would be very small. A permanent displacement analysis using the Makdisi and Seed (1978) chart estimated a permanent displacement of only 0.1 inches, which is significantly lower than the allowable limit of 12 inches. The GSTAB7 plots and printouts of the pseudo-static slope stability analyses are included in Attachment C-2. The permanent displacement analysis is also presented in Attachment C-2. A summary of the computed yield acceleration values and the estimated permanent displacement is shown in Table 5. It should be noted that these results are conservative because: (i) they ignore the consolidation of the BBC during filling, and (ii) the slope stability analyses were performed using the Janbu method. N:\projects\119504\2008\VF FEP Docs\Global Stability 4-7
16 5.0 Conclusions and Recommendations 5.1 Settlement The settlement analysis discussed herein demonstrates that a minimum slope of two percent over the valley fill areas of the Landfill would be adequate to accommodate future differential settlements. The settlement analysis is a predictive assessment of the anticipated settlement based on idealized subsurface conditions and assumed settlement model and parameters. It is possible that actual subsurface conditions may not be as uniform as inferred from the limited test borings and settlement parameters could vary, which could result in a few localized depressions. Therefore, provisions are included in the Closure and Post-Closure Plan for the Landfill for inspection and re-grading of the final cover if detrimental differential settlements are observed in the field. 5.2 Slope Stability The slope stability analysis for the Landfill shows adequate factors of safety under static conditions for both circular and sliding-block type failure surfaces, including failure surfaces through the slurry wall. The seismic analysis shows that the potential for excessive permanent displacement during the design earthquake does not exist. N:\projects\119504\2008\VF FEP Docs\Global Stability 5-1
17 6.0 Bibliography Bray, J.D., Rathje, E.M., Augello, A.J., and Merry, S.M. (1998). "Simplified Seismic Design Procedure for Geosynthetic-Lined, Solid-Waste Landfills." Geosynthetics International, Vol. 5, Nos Code of Federal Regulations, Title 40, Part 258. Gregory Geotechnical Software (GGS). (2001). GSTABL7 with STEDwin Slope Stability Analysis System, Program Manual, Version 2.0, dated September Kavazanjian, Jr., E., Matasovic, N., Bonaparte, R., and Schmertmann, G.R. (1996). "Evaluation of MSW Properties for Seismic Analysis." Geoenvironment 2000, Geotechnical Special Publication No. 46, pp Ladd, C.C. and Foott, R. (1974). New Design Procedures for Stability of Soft Clays, Journal of the Geotechnical Engineering Division, Proceedings of the American Society of Civil Engineers, Vol. 100, GT 7, July, pp Makdisi, F.I., and H.B. Seed. (1978). Simplified Procedure for Estimating Dam and Embankment Earthquake-Induced Deformations." Journal of the Geotechnical Engineering Division, ASCE, Vol. 104, No. GT7. Newmark, N.M. (1965). "Effects of Earthquakes on Dams and Embankments." Geotechnique, Volume 5, No. 2. Purdue University. (1988). User Guide for PC STABL 5M. Schiffman R.L. (1958). "Field Applications of Soil Consolidation: Time-Dependent Loading and Varying Permeability, Highway Research Board, Bulletin 248. U.S. Environmental Protection Agency (EPA). (1995). RCRA Subtitle D (258) Seismic Design Guidance for Municipal Solid Waste Landfill Facilities by Gregory N. Richardson, Edward Kavazanjian, Jr., and Neven Matasovic, Report No. EPA 600/R-95/051. USGS website: N:\projects\119504\2008\VF FEP Docs\Global Stability 6-1
18 Tables
19 Table 1 Boston Blue Clay Consolidation Calculations Cross Section Across Phase III Saugus RESCO Landfill 1. Consolidation from Existing MSW Based on ash residue filling at 3H:1V to elevation 50 feet MSL Approximate year the MSW filling started = 1955 Approximate year MSW filling ended = 1985 Assuming the waste filling took place linearly t 0 = 30 years Year when percent of consolidation required 2008 t = 53 years Based on the 1999 analysis, Cv for the clay c v = 0.2 ft2/day Total thickness of clay 2H = 78 ft2/day Assuming two-way drainage H = 39 ft T 0 = C v. t 0 /H 2 T 0 = 1.44 T = C v. t/h 2 T = 2.54 T-T 0 = 1.10 Soil Nos. z z/h u p /u 0 (T) u p /u 0 (T-T 0 ) T 0.u/u 0 u/u 0 % Consol. (see Note 1) (See Note 2) (See Note 2) 5, 6, 7, 8, & , 11, 12, 13, & , 16, 17, 18, & Notes: 1. Soil nos. correspond the soil numbering used in the slope stability analysis 2. These value are obtained from Table 2 of "Field Applications of Soil Consolidation: Time-Dependent Loading and Varying Permeability", by Schiffman, R.L. (1958). z = depth u = excess pore pressure 2. Consolidation from Ash Residue Based on ash residue filling at 3H:1V to elevation 50 feet MSL Approximate year the ash filling started = 1985 Year when percent consolidation required = 2008 Assuming the filling to be linear t 0 = t = 23 T =T 0 = C v. t 0 /H 2 T 0 = T = 1.10 u z /u 0 = (z/h) - (0.5)(z/H) 2 Soil Nos. z z/h u z /u 0 u p /u 0 (T) T 0.u/u 0 u/u 0 % Consol. (See Note) 5, 6, 7, 8, & , 11, 12, 13, & , 16, 17, 18, & Note: These value are obtained from Table 2 of "Field Applications of Soil Consolidation: Time-Dependent Loading and Varying Permeability", by Schiffman, R.L. (1958).
20 Table 2 Undrained Shear Strength of Boston Blue Clay Under Partial Consolidation Cross Section Across Phase III Saugus RESCO Landfill Based on ash residue filling at 3H:1V to elevation 50 feet MSL Original ground elevation = 0.0 ft Total unit weight of clay = pcf Ground water elevation = 0.0 ft Unit weight of water = 62.4 pcf Unit weight of MSW = 65.0 pcf Unit weight of ash = pcf σ' vc Consolidation from MSW Consolidation from Ash σ' vc σ' vc + σ' vc Soil No. Soil Elev. Effect. OCR Original S u MSW Ht. MSW Wt. % Consol. Stress Incr. Ash Ht. Ash Wt. % Consol. Stress Incr. Total Stress New Effect. New OCR New S u Stress (see Note 1) (see Note 2) Increase Stress (see Note 3) (ft) (psf) (psf) (ft) (psf) (psf) (ft) (psf) (psf) (psf) (psf) (psf) 1 Ash 2 MSW 3 Peat Silt/Sand 5 Med. BBC Med. BBC Med. BBC Med. BBC Med. BBC Soft BBC Soft BBC Soft BBC Soft BBC Soft BBC Soft BBC Soft BBC Soft BBC Soft BBC Soft BBC Notes: 1. Over-consolidation ratio (OCR) based on MIT data from Route I-95 test fill 2. The undrained shear strength (S u ) values for BBC were obtained using the following SHANSEP relationship: 3. The undrained shear strength (Su) values were obtained using the following SHANSEP relationship: Su = ( 0.2)( σ vc)( OCR) S = ( 0.2)( σ + σ )( OCR) u vc vc 0.765
21 Table 3 Undrained Shear Strength of Boston Blue Clay Under 100% Consolidation Cross Section Across Phase III Saugus RESCO Landfill Based on ash residue filling at 3H:1V to elevation 50 feet MSL Original ground elevation = 0.0 ft Total unit weight of clay = pcf Ground water elevation = 0.0 ft Unit weight of water = 62.4 pcf Unit weight of MSW = 65.0 pcf Unit weight of ash = pcf σ' vc Consolidation from MSW Consolidation from Ash σ' vc σ' vc + σ' vc Soil No. Soil Elev. Effect. OCR Original S u MSW Ht. MSW Wt. % Consol. Stress Incr. Ash Ht. Ash Wt. % Consol. Stress Incr. Total Stress New Effect. New OCR New S u Stress (see Note 1) (see Note 2) Increase Stress (see Note 3) (ft) (psf) (psf) (ft) (psf) (psf) (ft) (psf) (psf) (psf) (psf) (psf) 1 Ash 2 MSW 3 Peat Silt/Sand 5 Med. BBC Med. BBC Med. BBC Med. BBC Med. BBC Soft BBC Soft BBC Soft BBC Soft BBC Soft BBC Soft BBC Soft BBC Soft BBC Soft BBC Soft BBC Notes: 1. Over-consolidation ratio (OCR) based on MIT data from Route I-95 test fill 2. The undrained shear strength (Su) values for BBC were obtained using the following SHANSEP relationship: 3. The undrained shear strength (Su) values were obtained using the following SHANSEP relationship: Su = ( 0.2)( σ vc)( OCR) S = ( 0.2)( σ + σ )( OCR) u vc vc
22 Analysis Table 4 Summary of Slope Stability Analyses Results Cross Section Across Phase III Saugus RESCO Landfill Consolidation of BBC S u Values from Static Factor of Safety Yield Acceleration Estimated Permanent Displacement Static None From Table Static Yield Acceleration Notes: Partial (see Table 1) BBC = Boston Blue Clay S u = Undrained shear strength (1) These values are acceptable From Table (1) % From Table g 4 inches (1)
23 Slope Stability Run Table 5 Summary of Slope Stability Analyses Results Cross Section Across Phase IV Saugus RESCO Landfill Consolidation of BBC Failure Mode Static Factor of Safety Yield Acceleration Estimated Permanent Displacement 1 None Circular 2.15 (1) 0.201g -- 2 None Block 1.87 (1) 0.154g -- 3 None Block through slurry wall 2.06 (1) 0.151g 0.1 inches (1) Notes: BBC = Boston Blue Clay (1) These values are acceptable
24 N:\projects\119504\2008\VF FEP Docs\Global Stability Attachment A Settlement Analysis
25 325' 376' 376' 51' Elevation 50 A 2% B ' % C Ash Solid Waste Peat Sand/Silt 0.5 Medium Boston Blue Clay 9-10 Soft Boston Blue Clay Figure 1. Idealized Settlement Cross-Section (Not to Scale) Page 1 of 5
26 Required: Determine whether the 2% slope on the final grading will be adequate considering settlement over the long-term Assumptions: - Figure 1 shows an idealized cross-section taken perpendicular to the valley line - The post-settlement slope between Points A and B would be the most critical - The differential settlement between points A and B will determine the post-settlement slope - Assuming the ash and sand to be relatively incompressible, the underlying layers that will undergo settlement are the solid waste, peat, and Boston Blue Clay (BBC) - All three compressible layers have two components of settlement: (i) a primary compression, which is both load and thickness dependent, and (ii) a secondary compression, which is time and thickness dependent (for waste, the secondary compression includes decomposition of waste with time and for BBC it is secondary consolidation) - To simplify the settlement calculations, it is assumed that the thicknesses of the different compressible strata are uniform; therefore, the secondary settlements at both A and B would be the same - Therefore, only the primary compression due to difference in the surcharge loading between A and B would lead to differential settlement - The difference in surcharge loading between A and B is that due to 6.5 feet of ash - Based on the discussion above, only the primary compression of solid waste, peat, and BBC at Point A due to the 6.5 feet difference in ash thickness needs to be computed to determine the slope change between A and B due to differential settlement Page 2 of 5
27 Design Parameters Critical Slope Length: - Distance between Points A and B = 325 ft - Minimum initial slope = 2 % Thicknesses of Various Layers: - Thickness of excess ash at Point A = 6.5 ft - Ash thickness at B = 26.5 ft - Thickness of solid waste = 17 ft - Thickness of peat = 0.5 ft - Thickness of sand/silt = 0.5 ft - Thickness of medium Boston Blue Clay = 9 ft - Thickness of soft Boston Blue Clay = 20 ft Groundwater Table: - Assumed depth to groundwater table = 0 ft Ash Parameters: - Unit weight = 105 pcf Solid Waste Parameters: - Unit weight = 65 pcf - Compression ratio = Number of sublayers used = 3 Peat Parameters: - Unit weight = 100 pcf - Compression ratio = Number of sublayers used = 1 Sand/Silt Parameters: - Unit weight = 120 pcf Medium Boston Blue Clay Parameters: - Unit weight = 110 pcf - Compression ratio = Recompression ratio = Number of sublayers used = 5 Soft Boston Blue Clay Parameters: - Unit weight = 110 pcf - Compression ratio = Recompression ratio = Number of sublayers used = 5 Page 3 of 5
28 Calculations Excess Loading at Point A relative to Point B = psf Excess settlement of solid waste under Point A: Sublayer Sublayer Mid-Depth Total Effective Incremental thickness Elevation Vert. Stress Vert Stress Settlement (ft) (ft) (psf) (psf) inches Cumulative = 5.0 Inches Excess settlement of peat under Point A: Sublayer Sublayer Mid-Depth Total Effective Incremental thickness Elevation Vert. Stress Vert Stress Settlement (ft) (ft) (psf) (psf) inches Cumulative = 0.2 Inches Excess settlement of Medium Boston Blue Clay under Point A: Sublayer Sublayer Mid-Depth Total Effective Past Max. Final Effective Incremental thickness Elevation Vert. Stress Vert. Stress Vert. Stress Vert. Stress Settlement (ft) (ft) (psf) (psf) (psf) (psf) inches Cumulative = 0.1 inches Excess settlement of Soft Boston Blue Clay under Point A: Sublayer Sublayer Mid-Depth Total Effective Incremental thickness Elevation Vert. Stress Vert. Stress Settlement (ft) (ft) (psf) (psf) inches Cumulative = 4.1 inches Differential Settlement between Points A and B = 9.4 inches Slope reduction between Points A and B due to the above differential settlement = 0.24 % Post-Settlement Slope = 1.76 % Page 4 of 5

29 Page 5 of 5
30
31
32
33 Attachment B Results of Static and Seismic Slope Stability Analyses Cross-Section Across Phase III N:\projects\119504\2008\VF FEP Docs\Global Stability
34 B-1 Location of Slope Stability Cross-Section and Test Boring N:\projects\119504\2008\VF FEP Docs\Global Stability

35
36
37
38
39
40
41
42
43 N:\projects\119504\2008\VF FEP Docs\Global Stability B-2 Results of Static Slope Stability Analysis
44
45 2/21/2008 Page 1 of 11 *** GSTABL7 *** ** GSTABL7 by Garry H. Gregory, P.E. ** ** Original Version 1.0, January 1996; Current Version 2.003, Jun (All Rights Reserved-Unauthorized Use Prohibited) ******************************************************************** SLOPE STABILITY ANALYSIS SYSTEM Modified Bishop, Simplified Janbu, or GLE Method of Slices. (Includes Spencer & Morgenstern-Price Type Analysis) Including Pier/Pile, Reinforcement, Soil Nail, Tieback, Nonlinear Undrained Shear Strength, Curved Phi Envelope, Anisotropic Soil, Fiber-Reinforced Soil, Boundary Loads, Wate Surfaces, Pseudo-Static & Newmark Earthquake, and Applied For ******************************************************************** Analysis Run Date: 2/21/2008 Time of Run: 02:07PM Run By: nk Input Data Filename: C:\GEOTECHNICAL\saugus\2008\Global-Stabil\ Output Filename: C:\GEOTECHNICAL\saugus\2008\Global-Stabil\ Unit System: English Plotted Output Filename: C:\GEOTECHNICAL\saugus\2008\Glob tabil\ PROBLEM DESCRIPTION: RESCO; Ash at 3H:1V to El. 50'; No Conso lidation; Run#S1-Bc-1 BOUNDARY COORDINATES 5 Top Boundaries 24 Total Boundaries Boundary X-Left Y-Left X-Right Y-Right Soil Type (ft) (ft) Below Bnd C:\GEOTECHNICAL\saugus\2008\Global-Stabil\s1-bc-1.OUT
46 2/21/2008 Page 2 of Default Y-Origin = 0.00(ft) Default X-Plus Value = 0.00(ft) 1 Default Y-Plus Value = 0.00(ft) ISOTROPIC SOIL PARAMETERS 20 Type(s) of Soil Soil Total Saturated Cohesion Friction Pore Pressure Piez. Type Unit Wt. Unit Wt. Intercept Angle Pressure Constant Surface No. (pcf) (pcf) (psf) (deg) Param. (psf) No PIEZOMETRIC SURFACE(S) SPECIFIED Unit Weight of Water = (pcf) Piezometric Surface No. 1 Specified by 2 Coordinate Points Pore Pressure Inclination Factor = 0.50 Point X-Water Y-Water A Critical Failure Surface Searching Method, Using A Random Technique For Generating Circular Surfaces, Has Been Specified. C:\GEOTECHNICAL\saugus\2008\Global-Stabil\s1-bc-1.OUT
47 2/21/2008 Page 3 of Trial Surfaces Have Been Generated. 60 Surface(s) Initiate(s) From Each Of 60 Points Equally Spaced Along The Ground Surface Between X = 0.00(ft) and X = (ft) Each Surface Terminates Between and X = (ft) X = (ft) Unless Further Limitations Were Imposed, The Minimum Elevation At Which A Surface Extends Is Y = 0.00(ft) 15.00(ft) Line Segments Define Each Trial Failure Surface. Following Are Displayed The Ten Most Critical Of The Trial Failure Surfaces Evaluated. They Are Ordered - Most Critical First. * * Safety Factors Are Calculated By The Modified Bishop Method * * Total Number of Trial Surfaces Evaluated = 3600 Statistical Data On All Valid FS Values: FS Max = FS Min = FS Ave = Standard Deviation = Coefficient of Variation = 34.2 Failure Surface Specified By 31 Coordinate Points C:\GEOTECHNICAL\saugus\2008\Global-Stabil\s1-bc-1.OUT
48 2/21/2008 Page 4 of Circle Center At X = ; Y = ; and Radius = *** *** Individual data on the 48 slices Water Water Tie Tie Earthquake Force Force Force Force Force Surcharge Slice Width Weight Top Bot Norm Tan Hor Ver Load No. (ft) (lbs) (lbs) (lbs) (lbs) (lbs) (lbs) (lbs) (lbs) C:\GEOTECHNICAL\saugus\2008\Global-Stabil\s1-bc-1.OUT
49 2/21/2008 Page 5 of Failure Surface Specified By 31 Coordinate Points Circle Center At X = ; Y = ; and Radius = *** *** 1 Failure Surface Specified By 32 Coordinate Points C:\GEOTECHNICAL\saugus\2008\Global-Stabil\s1-bc-1.OUT
50 2/21/2008 Page 6 of Circle Center At X = ; Y = ; and Radius = *** *** Failure Surface Specified By 29 Coordinate Points C:\GEOTECHNICAL\saugus\2008\Global-Stabil\s1-bc-1.OUT
51 2/21/2008 Page 7 of 11 Circle Center At X = ; Y = ; and Radius = *** *** 1 Failure Surface Specified By 30 Coordinate Points Circle Center At X = ; Y = ; and Radius = *** *** Failure Surface Specified By 29 Coordinate Points C:\GEOTECHNICAL\saugus\2008\Global-Stabil\s1-bc-1.OUT
52 2/21/2008 Page 8 of Circle Center At X = ; Y = ; and Radius = *** *** 1 Failure Surface Specified By 30 Coordinate Points C:\GEOTECHNICAL\saugus\2008\Global-Stabil\s1-bc-1.OUT
53 2/21/2008 Page 9 of Circle Center At X = ; Y = ; and Radius = *** *** Failure Surface Specified By 32 Coordinate Points Circle Center At X = ; Y = ; and Radius = *** *** 1 Failure Surface Specified By 31 Coordinate Points C:\GEOTECHNICAL\saugus\2008\Global-Stabil\s1-bc-1.OUT
54 2/21/2008 Page 10 of Circle Center At X = ; Y = ; and Radius = *** *** Failure Surface Specified By 29 Coordinate Points C:\GEOTECHNICAL\saugus\2008\Global-Stabil\s1-bc-1.OUT
55 2/21/2008 Page 11 of Circle Center At X = ; Y = ; and Radius = *** *** **** END OF GSTABL7 OUTPUT **** C:\GEOTECHNICAL\saugus\2008\Global-Stabil\s1-bc-1.OUT
56
57 2/21/2008 Page 1 of 10 *** GSTABL7 *** ** GSTABL7 by Garry H. Gregory, P.E. ** ** Original Version 1.0, January 1996; Current Version 2.003, Jun (All Rights Reserved-Unauthorized Use Prohibited) ******************************************************************** SLOPE STABILITY ANALYSIS SYSTEM Modified Bishop, Simplified Janbu, or GLE Method of Slices. (Includes Spencer & Morgenstern-Price Type Analysis) Including Pier/Pile, Reinforcement, Soil Nail, Tieback, Nonlinear Undrained Shear Strength, Curved Phi Envelope, Anisotropic Soil, Fiber-Reinforced Soil, Boundary Loads, Wate Surfaces, Pseudo-Static & Newmark Earthquake, and Applied For ******************************************************************** Analysis Run Date: 2/21/2008 Time of Run: 02:10PM Run By: nk Input Data Filename: C:\GEOTECHNICAL\saugus\2008\Global-Stabil\ Output Filename: C:\GEOTECHNICAL\saugus\2008\Global-Stabil\ Unit System: English Plotted Output Filename: C:\GEOTECHNICAL\saugus\2008\Glob tabil\ PROBLEM DESCRIPTION: RESCO; Ash at 3H:1V to El. 50'; With Con solid. through 2008; Run#S1-Bc-2 BOUNDARY COORDINATES 5 Top Boundaries 24 Total Boundaries Boundary X-Left Y-Left X-Right Y-Right Soil Type (ft) (ft) Below Bnd C:\GEOTECHNICAL\saugus\2008\Global-Stabil\s1-bc-2.OUT
58 2/21/2008 Page 2 of Default Y-Origin = 0.00(ft) Default X-Plus Value = 0.00(ft) 1 Default Y-Plus Value = 0.00(ft) ISOTROPIC SOIL PARAMETERS 20 Type(s) of Soil Soil Total Saturated Cohesion Friction Pore Pressure Piez. Type Unit Wt. Unit Wt. Intercept Angle Pressure Constant Surface No. (pcf) (pcf) (psf) (deg) Param. (psf) No PIEZOMETRIC SURFACE(S) SPECIFIED Unit Weight of Water = (pcf) Piezometric Surface No. 1 Specified by 2 Coordinate Points Pore Pressure Inclination Factor = 0.50 Point X-Water Y-Water A Critical Failure Surface Searching Method, Using A Random Technique For Generating Circular Surfaces, Has Been Specified. C:\GEOTECHNICAL\saugus\2008\Global-Stabil\s1-bc-2.OUT
59 2/21/2008 Page 3 of Trial Surfaces Have Been Generated. 60 Surface(s) Initiate(s) From Each Of 60 Points Equally Spaced Along The Ground Surface Between X = 0.00(ft) and X = (ft) Each Surface Terminates Between and X = (ft) X = (ft) Unless Further Limitations Were Imposed, The Minimum Elevation At Which A Surface Extends Is Y = 0.00(ft) 15.00(ft) Line Segments Define Each Trial Failure Surface. Following Are Displayed The Ten Most Critical Of The Trial Failure Surfaces Evaluated. They Are Ordered - Most Critical First. * * Safety Factors Are Calculated By The Modified Bishop Method * * Total Number of Trial Surfaces Evaluated = 3600 Statistical Data On All Valid FS Values: FS Max = FS Min = FS Ave = Standard Deviation = Coefficient of Variation = 30.5 Failure Surface Specified By 29 Coordinate Points C:\GEOTECHNICAL\saugus\2008\Global-Stabil\s1-bc-2.OUT
60 2/21/2008 Page 4 of Circle Center At X = ; Y = ; and Radius = *** *** Individual data on the 44 slices Water Water Tie Tie Earthquake Force Force Force Force Force Surcharge Slice Width Weight Top Bot Norm Tan Hor Ver Load No. (ft) (lbs) (lbs) (lbs) (lbs) (lbs) (lbs) (lbs) (lbs) Failure Surface Specified By 29 Coordinate Points C:\GEOTECHNICAL\saugus\2008\Global-Stabil\s1-bc-2.OUT
61 2/21/2008 Page 5 of Circle Center At X = ; Y = ; and Radius = *** *** 1 Failure Surface Specified By 28 Coordinate Points C:\GEOTECHNICAL\saugus\2008\Global-Stabil\s1-bc-2.OUT
62 2/21/2008 Page 6 of Circle Center At X = ; Y = ; and Radius = *** *** Failure Surface Specified By 28 Coordinate Points Circle Center At X = ; Y = ; and Radius = *** *** 1 Failure Surface Specified By 28 Coordinate Points C:\GEOTECHNICAL\saugus\2008\Global-Stabil\s1-bc-2.OUT
63 2/21/2008 Page 7 of Circle Center At X = ; Y = ; and Radius = *** *** Failure Surface Specified By 27 Coordinate Points C:\GEOTECHNICAL\saugus\2008\Global-Stabil\s1-bc-2.OUT
64 2/21/2008 Page 8 of Circle Center At X = ; Y = ; and Radius = *** *** 1 Failure Surface Specified By 28 Coordinate Points Circle Center At X = ; Y = ; and Radius = *** *** Failure Surface Specified By 27 Coordinate Points C:\GEOTECHNICAL\saugus\2008\Global-Stabil\s1-bc-2.OUT
65 2/21/2008 Page 9 of Circle Center At X = ; Y = ; and Radius = *** *** 1 Failure Surface Specified By 27 Coordinate Points C:\GEOTECHNICAL\saugus\2008\Global-Stabil\s1-bc-2.OUT
66 2/21/2008 Page 10 of Circle Center At X = ; Y = ; and Radius = *** *** Failure Surface Specified By 29 Coordinate Points Circle Center At X = ; Y = ; and Radius = *** *** **** END OF GSTABL7 OUTPUT **** C:\GEOTECHNICAL\saugus\2008\Global-Stabil\s1-bc-2.OUT
67 Table 1 Boston Blue Clay Consolidation Calculations Cross Section Across Phase III Saugus RESCO Landfill 1. Consolidation from Existing MSW Based on ash residue filling at 3H:1V to elevation 50 feet MSL Approximate year the MSW filling started = 1955 Approximate year MSW filling ended = 1985 Assuming the waste filling took place linearly t 0 = 30 years Year when percent of consolidation required 2008 t = 53 years Based on the 1999 analysis, Cv for the clay c v = 0.2 ft2/day Total thickness of clay 2H = 78 ft2/day Assuming two-way drainage H = 39 ft T 0 = C v. t 0 /H 2 T 0 = 1.44 T = C v. t/h 2 T = 2.54 T-T 0 = 1.10 Soil Nos. z z/h u p /u 0 (T) u p /u 0 (T-T 0 ) T 0.u/u 0 u/u 0 % Consol. (see Note 1) (See Note 2) (See Note 2) 5, 6, 7, 8, & , 11, 12, 13, & , 16, 17, 18, & Notes: 1. Soil nos. correspond the soil numbering used in the slope stability analysis 2. These value are obtained from Table 2 of "Field Applications of Soil Consolidation: Time-Dependent Loading and Varying Permeability", by Schiffman, R.L. (1958). z = depth u = excess pore pressure 2. Consolidation from Ash Residue Based on ash residue filling at 3H:1V to elevation 50 feet MSL Approximate year the ash filling started = 1985 Year when percent consolidation required = 2008 Assuming the filling to be linear t 0 = t = 23 T =T 0 = C v. t 0 /H 2 T 0 = T = 1.10 u z /u 0 = (z/h) - (0.5)(z/H) 2 Soil Nos. z z/h u z /u 0 u p /u 0 (T) T 0.u/u 0 u/u 0 % Consol. (See Note) 5, 6, 7, 8, & , 11, 12, 13, & , 16, 17, 18, & Note: These value are obtained from Table 2 of "Field Applications of Soil Consolidation: Time-Dependent Loading and Varying Permeability", by Schiffman, R.L. (1958).
68 Table 2 Undrained Shear Strength of Boston Blue Clay Under Partial Consolidation Cross Section Across Phase III Saugus RESCO Landfill Based on ash residue filling at 3H:1V to elevation 50 feet MSL Original ground elevation = 0.0 ft Total unit weight of clay = pcf Ground water elevation = 0.0 ft Unit weight of water = 62.4 pcf Unit weight of MSW = 65.0 pcf Unit weight of ash = pcf σ' vc Consolidation from MSW Consolidation from Ash σ' vc σ' vc + σ' vc Soil No. Soil Elev. Effect. OCR Original S u MSW Ht. MSW Wt. % Consol. Stress Incr. Ash Ht. Ash Wt. % Consol. Stress Incr. Total Stress New Effect. New OCR New S u Stress (see Note 1) (see Note 2) Increase Stress (see Note 3) (ft) (psf) (psf) (ft) (psf) (psf) (ft) (psf) (psf) (psf) (psf) (psf) 1 Ash 2 MSW 3 Peat Silt/Sand 5 Med. BBC Med. BBC Med. BBC Med. BBC Med. BBC Soft BBC Soft BBC Soft BBC Soft BBC Soft BBC Soft BBC Soft BBC Soft BBC Soft BBC Soft BBC Notes: 1. Over-consolidation ratio (OCR) based on MIT data from Route I-95 test fill 2. The undrained shear strength (S u ) values for BBC were obtained using the following SHANSEP relationship: 3. The undrained shear strength (Su) values were obtained using the following SHANSEP relationship: Su = ( 0.2)( σ vc )( OCR) S = ( 0.2)( σ + σ )( OCR) u vc vc 0.765

69
70
71
72 N:\projects\119504\2008\VF FEP Docs\Global Stability B-3 Probabilistic Seismic Hazard Based on USGS

73
74 3/3/2008 Page 1 of 7 *** Deaggregation of Seismic Hazard for PGA & 2 Periods of Spectral Accel. *** *** Data from U.S.G.S. National Seismic Hazards Mapping Project, 2002 version PSHA Deaggregation. %contributions. site: RESCO long: W., lat: USGS update files and programs. dm=0.2. Site descr:rock Return period: 2475 yrs. Exceedance PGA = g. #Pr[at least one eq with median motion>=pga in 50 yrs]= DIST(KM) MAG(MW) ALL_EPS EPSILON>2 1<EPS<2 0<EPS<1-1<EPS<0-2<EPS<-1 EPS< C:\GEOTECHNICAL\saugus\2008\Global-Stabil\Deaggregation.txt
75 3/3/2008 Page 2 of Summary statistics for above PSHA PGA deaggregation, R=distance, e=epsilon: Mean src-site R= 42.2 km; M= 5.80; eps0= Mean calculated for all so Modal src-site R= 15.2 km; M= 4.80; eps0= from peak (R,M) bin Gridded source distance metrics: Rseis Rrup and Rjb MODE R*= 14.8km; M*= 4.80; EPS.INTERVAL: 0 to 1 sigma % CONTRIB.= Principal sources (faults, subduction, random seismicity having >10% contribut Source Category: % contr. R(km) M epsilon0 (mean values) CEUS gridded seism Individual fault hazard details if contrib.>1%: ********************Central or Eastern U.S. Site ***************************** PSHA Deaggregation. %contributions. ROCK site: RESCO long: d W., lat: USGS update files and programs. Analysis on DaMoYr:04/03/2008 Return period: 2475 yrs s. PSA = g. #Pr[at least one eq with median motion>=psa in 50 yrs]= DIST(km) MAG(Mw) ALL_EPS EPSILON>2 1<EPS<2 0<EPS<1-1<EPS<0-2<EPS<-1 EPS< C:\GEOTECHNICAL\saugus\2008\Global-Stabil\Deaggregation.txt
76 3/3/2008 Page 3 of C:\GEOTECHNICAL\saugus\2008\Global-Stabil\Deaggregation.txt
77 3/3/2008 Page 4 of C:\GEOTECHNICAL\saugus\2008\Global-Stabil\Deaggregation.txt
78 3/3/2008 Page 5 of Summary statistics for above 1.0s PSA deaggregation, R=distance, e=epsilon: Mean src-site R= km; M= 6.62; eps0= Mean calculated for all so Modal src-site R= 34.9 km; M= 6.21; eps0= from peak (R,M) bin Gridded source distance metrics: Rseis Rrup and Rjb MODE R*= 370.6km; M*= 7.39; EPS.INTERVAL: 1 to 2 sigma % CONTRIB.= Principal sources (faults, subduction, random seismicity having >10% contribut Source Category: % contr. R(km) M epsilon0 (mean values) CEUS gridded seism Individual fault hazard details if contrib.>1%: ********************Central or Eastern U.S. Site ***************************** PSHA Deaggregation. %contributions. ROCK site: RESCO long: d W., lat: USGS update files and programs. Analysis on DaMoYr:04/03/2008 Return period: 2475 yrs s. PSA = g. #Pr[at least one eq with median motion>=psa in 50 yrs]= DIST(km) MAG(Mw) ALL_EPS EPSILON>2 1<EPS<2 0<EPS<1-1<EPS<0-2<EPS<-1 EPS< C:\GEOTECHNICAL\saugus\2008\Global-Stabil\Deaggregation.txt
79 3/3/2008 Page 6 of C:\GEOTECHNICAL\saugus\2008\Global-Stabil\Deaggregation.txt
80 3/3/2008 Page 7 of Summary statistics for above 0.2s PSA deaggregation, R=distance, e=epsilon: Mean src-site R= 58.0 km; M= 6.00; eps0= Mean calculated for all so Modal src-site R= 14.2 km; M= 4.80; eps0= 0.26 from peak (R,M) bin Gridded source distance metrics: Rseis Rrup and Rjb MODE R*= 17.0km; M*= 4.80; EPS.INTERVAL: 1 to 2 sigma % CONTRIB.= Principal sources (faults, subduction, random seismicity having >10% contribut Source Category: % contr. R(km) M epsilon0 (mean values) CEUS gridded seism Individual fault hazard details if contrib.>1%: ********************Central or Eastern U.S. Site ***************************** C:\GEOTECHNICAL\saugus\2008\Global-Stabil\Deaggregation.txt
81 B-4 Pseudo-Static Slope Stability Analysis to Determine Yield Acceleration N:\projects\119504\2008\VF FEP Docs\Global Stability
82
83 2/25/2008 Page 1 of 11 *** GSTABL7 *** ** GSTABL7 by Garry H. Gregory, P.E. ** ** Original Version 1.0, January 1996; Current Version 2.003, Jun (All Rights Reserved-Unauthorized Use Prohibited) ******************************************************************** SLOPE STABILITY ANALYSIS SYSTEM Modified Bishop, Simplified Janbu, or GLE Method of Slices. (Includes Spencer & Morgenstern-Price Type Analysis) Including Pier/Pile, Reinforcement, Soil Nail, Tieback, Nonlinear Undrained Shear Strength, Curved Phi Envelope, Anisotropic Soil, Fiber-Reinforced Soil, Boundary Loads, Wate Surfaces, Pseudo-Static & Newmark Earthquake, and Applied For ******************************************************************** Analysis Run Date: 2/25/2008 Time of Run: 09:31AM Run By: nk Input Data Filename: C:\GEOTECHNICAL\saugus\2008\Global-Stabil\ Output Filename: C:\GEOTECHNICAL\saugus\2008\Global-Stabil\ Unit System: English Plotted Output Filename: C:\GEOTECHNICAL\saugus\2008\Glob tabil\ PROBLEM DESCRIPTION: RESCO; Ash at 3H:1V to El. 50'; With 100 % Consolid; Y-Accel; Run#Y1-Bc-2 BOUNDARY COORDINATES 5 Top Boundaries 24 Total Boundaries Boundary X-Left Y-Left X-Right Y-Right Soil Type (ft) (ft) Below Bnd C:\GEOTECHNICAL\saugus\2008\Global-Stabil\y1-bc-2.OUT
84 2/25/2008 Page 2 of Default Y-Origin = 0.00(ft) Default X-Plus Value = 0.00(ft) 1 Default Y-Plus Value = 0.00(ft) ISOTROPIC SOIL PARAMETERS 20 Type(s) of Soil Soil Total Saturated Cohesion Friction Pore Pressure Piez. Type Unit Wt. Unit Wt. Intercept Angle Pressure Constant Surface No. (pcf) (pcf) (psf) (deg) Param. (psf) No PIEZOMETRIC SURFACE(S) SPECIFIED Unit Weight of Water = (pcf) Piezometric Surface No. 1 Specified by 2 Coordinate Points Pore Pressure Inclination Factor = 0.50 Point X-Water Y-Water Specified Peak Ground Acceleration Coefficient (A) = 0.186(g) Specified Horizontal Earthquake Coefficient (kh) = 0.093(g) Specified Vertical Earthquake Coefficient (kv) = 0.000(g) 1 Specified Seismic Pore-Pressure Factor = C:\GEOTECHNICAL\saugus\2008\Global-Stabil\y1-bc-2.OUT
85 2/25/2008 Page 3 of 11 A Critical Failure Surface Searching Method, Using A Random Technique For Generating Circular Surfaces, Has Been Specified Trial Surfaces Have Been Generated. 60 Surface(s) Initiate(s) From Each Of 60 Points Equally Spaced Along The Ground Surface Between X = 0.00(ft) and X = (ft) Each Surface Terminates Between and X = (ft) X = (ft) Unless Further Limitations Were Imposed, The Minimum Elevation At Which A Surface Extends Is Y = 0.00(ft) 15.00(ft) Line Segments Define Each Trial Failure Surface. Following Are Displayed The Ten Most Critical Of The Trial Failure Surfaces Evaluated. They Are Ordered - Most Critical First. * * Safety Factors Are Calculated By The Modified Bishop Method * * Total Number of Trial Surfaces Evaluated = 3600 Statistical Data On All Valid FS Values: FS Max = FS Min = FS Ave = Standard Deviation = Coefficient of Variation = 27.5 Failure Surface Specified By 29 Coordinate Points C:\GEOTECHNICAL\saugus\2008\Global-Stabil\y1-bc-2.OUT
86 2/25/2008 Page 4 of Circle Center At X = ; Y = ; and Radius = *** *** Individual data on the 44 slices Water Water Tie Tie Earthquake Force Force Force Force Force Surcharge Slice Width Weight Top Bot Norm Tan Hor Ver Load No. (ft) (lbs) (lbs) (lbs) (lbs) (lbs) (lbs) (lbs) (lbs) C:\GEOTECHNICAL\saugus\2008\Global-Stabil\y1-bc-2.OUT
87 2/25/2008 Page 5 of Failure Surface Specified By 29 Coordinate Points Circle Center At X = ; Y = ; and Radius = *** *** 1 Failure Surface Specified By 30 Coordinate Points C:\GEOTECHNICAL\saugus\2008\Global-Stabil\y1-bc-2.OUT
88 2/25/2008 Page 6 of Circle Center At X = ; Y = ; and Radius = *** *** Failure Surface Specified By 30 Coordinate Points Circle Center At X = ; Y = ; and Radius = C:\GEOTECHNICAL\saugus\2008\Global-Stabil\y1-bc-2.OUT
89 2/25/2008 Page 7 of 11 *** *** 1 Failure Surface Specified By 31 Coordinate Points Circle Center At X = ; Y = ; and Radius = *** *** Failure Surface Specified By 28 Coordinate Points C:\GEOTECHNICAL\saugus\2008\Global-Stabil\y1-bc-2.OUT
90 2/25/2008 Page 8 of Circle Center At X = ; Y = ; and Radius = *** *** 1 Failure Surface Specified By 31 Coordinate Points C:\GEOTECHNICAL\saugus\2008\Global-Stabil\y1-bc-2.OUT
91 2/25/2008 Page 9 of Circle Center At X = ; Y = ; and Radius = *** *** Failure Surface Specified By 31 Coordinate Points Circle Center At X = ; Y = ; and Radius = *** *** 1 Failure Surface Specified By 29 Coordinate Points C:\GEOTECHNICAL\saugus\2008\Global-Stabil\y1-bc-2.OUT
92 2/25/2008 Page 10 of Circle Center At X = ; Y = ; and Radius = *** *** Failure Surface Specified By 30 Coordinate Points C:\GEOTECHNICAL\saugus\2008\Global-Stabil\y1-bc-2.OUT
93 2/25/2008 Page 11 of Circle Center At X = ; Y = ; and Radius = *** *** **** END OF GSTABL7 OUTPUT **** C:\GEOTECHNICAL\saugus\2008\Global-Stabil\y1-bc-2.OUT
94
95 2/25/2008 Page 1 of 12 *** GSTABL7 *** ** GSTABL7 by Garry H. Gregory, P.E. ** ** Original Version 1.0, January 1996; Current Version 2.003, Jun (All Rights Reserved-Unauthorized Use Prohibited) ******************************************************************** SLOPE STABILITY ANALYSIS SYSTEM Modified Bishop, Simplified Janbu, or GLE Method of Slices. (Includes Spencer & Morgenstern-Price Type Analysis) Including Pier/Pile, Reinforcement, Soil Nail, Tieback, Nonlinear Undrained Shear Strength, Curved Phi Envelope, Anisotropic Soil, Fiber-Reinforced Soil, Boundary Loads, Wate Surfaces, Pseudo-Static & Newmark Earthquake, and Applied For ******************************************************************** Analysis Run Date: 2/25/2008 Time of Run: 09:31AM Run By: nk Input Data Filename: C:\GEOTECHNICAL\saugus\2008\Global-Stabil\ Output Filename: C:\GEOTECHNICAL\saugus\2008\Global-Stabil\ Unit System: English Plotted Output Filename: C:\GEOTECHNICAL\saugus\2008\Glob tabil\ PROBLEM DESCRIPTION: RESCO; Ash at 3H:1V to El. 50'; With 100 % Consolid; Y-Accel; Run#Y1-Bc-r2 BOUNDARY COORDINATES 5 Top Boundaries 24 Total Boundaries Boundary X-Left Y-Left X-Right Y-Right Soil Type (ft) (ft) Below Bnd C:\GEOTECHNICAL\saugus\2008\Global-Stabil\y1-bc-r2.OUT
96 2/25/2008 Page 2 of Default Y-Origin = 0.00(ft) Default X-Plus Value = 0.00(ft) 1 Default Y-Plus Value = 0.00(ft) ISOTROPIC SOIL PARAMETERS 20 Type(s) of Soil Soil Total Saturated Cohesion Friction Pore Pressure Piez. Type Unit Wt. Unit Wt. Intercept Angle Pressure Constant Surface No. (pcf) (pcf) (psf) (deg) Param. (psf) No PIEZOMETRIC SURFACE(S) SPECIFIED Unit Weight of Water = (pcf) Piezometric Surface No. 1 Specified by 2 Coordinate Points Pore Pressure Inclination Factor = 0.50 Point X-Water Y-Water Specified Peak Ground Acceleration Coefficient (A) = 0.162(g) Specified Horizontal Earthquake Coefficient (kh) = 0.081(g) Specified Vertical Earthquake Coefficient (kv) = 0.000(g) 1 Specified Seismic Pore-Pressure Factor = C:\GEOTECHNICAL\saugus\2008\Global-Stabil\y1-bc-r2.OUT
97 2/25/2008 Page 3 of 12 A Critical Failure Surface Searching Method, Using A Random Technique For Generating Circular Surfaces, Has Been Specified Trial Surfaces Have Been Generated. 60 Surface(s) Initiate(s) From Each Of 60 Points Equally Spaced Along The Ground Surface Between X = 0.00(ft) and X = (ft) Each Surface Terminates Between and X = (ft) X = (ft) Unless Further Limitations Were Imposed, The Minimum Elevation At Which A Surface Extends Is Y = 0.00(ft) 15.00(ft) Line Segments Define Each Trial Failure Surface. Following Are Displayed The Ten Most Critical Of The Trial Failure Surfaces Evaluated. They Are Ordered - Most Critical First. * * Safety Factors Are Calculated By The Modified Bishop Method * * Total Number of Trial Surfaces Evaluated = 3600 Statistical Data On All Valid FS Values: FS Max = FS Min = FS Ave = Standard Deviation = Coefficient of Variation = 35.3 Failure Surface Specified By 41 Coordinate Points C:\GEOTECHNICAL\saugus\2008\Global-Stabil\y1-bc-r2.OUT
98 2/25/2008 Page 4 of Circle Center At X = ; Y = ; and Radius = *** *** Individual data on the 58 slices Water Water Tie Tie Earthquake Force Force Force Force Force Surcharge Slice Width Weight Top Bot Norm Tan Hor Ver Load No. (ft) (lbs) (lbs) (lbs) (lbs) (lbs) (lbs) (lbs) (lbs) C:\GEOTECHNICAL\saugus\2008\Global-Stabil\y1-bc-r2.OUT
99 2/25/2008 Page 5 of Failure Surface Specified By 39 Coordinate Points C:\GEOTECHNICAL\saugus\2008\Global-Stabil\y1-bc-r2.OUT
100 2/25/2008 Page 6 of Circle Center At X = ; Y = ; and Radius = *** *** 1 Failure Surface Specified By 39 Coordinate Points Circle Center At X = ; Y = ; and Radius = C:\GEOTECHNICAL\saugus\2008\Global-Stabil\y1-bc-r2.OUT
101 2/25/2008 Page 7 of 12 *** *** Failure Surface Specified By 39 Coordinate Points Circle Center At X = ; Y = ; and Radius = *** *** 1 Failure Surface Specified By 40 Coordinate Points C:\GEOTECHNICAL\saugus\2008\Global-Stabil\y1-bc-r2.OUT
102 2/25/2008 Page 8 of Circle Center At X = ; Y = ; and Radius = *** *** Failure Surface Specified By 42 Coordinate Points C:\GEOTECHNICAL\saugus\2008\Global-Stabil\y1-bc-r2.OUT
103 2/25/2008 Page 9 of Circle Center At X = ; Y = ; and Radius = *** *** 1 Failure Surface Specified By 39 Coordinate Points C:\GEOTECHNICAL\saugus\2008\Global-Stabil\y1-bc-r2.OUT
104 2/25/2008 Page 10 of Circle Center At X = ; Y = ; and Radius = *** *** Failure Surface Specified By 41 Coordinate Points C:\GEOTECHNICAL\saugus\2008\Global-Stabil\y1-bc-r2.OUT
105 2/25/2008 Page 11 of Circle Center At X = ; Y = ; and Radius = *** *** 1 Failure Surface Specified By 40 Coordinate Points Circle Center At X = ; Y = ; and Radius = C:\GEOTECHNICAL\saugus\2008\Global-Stabil\y1-bc-r2.OUT
106 2/25/2008 Page 12 of 12 *** *** Failure Surface Specified By 38 Coordinate Points Circle Center At X = ; Y = ; and Radius = *** *** **** END OF GSTABL7 OUTPUT **** C:\GEOTECHNICAL\saugus\2008\Global-Stabil\y1-bc-r2.OUT
107 N:\projects\119504\2008\VF FEP Docs\Global Stability B-5 Permanent Displacement Calculations
108 Estimation of Seismically-Induced Permanent Displacement Seismic Slope Stability of Cross Section Across Phase III Saugus RESCO Landfill Based on USGS (2002) seismic hazard mapping, the peak ground acceleration (PGA) having a10% probability of exceedance in 250 years (this is equivalent to 2% probability in 50 years) = 0.16g Mean earthquake magnitude (M) = 6.0 Based on pseudo-static slope stability analysis, the yield acceleration (k y ) = 0.081g Conservatively, assume that the maximum acceleration within the critical slope failure surface (averaged spatially) is equal to the PGA; i.e., k max = 0.081g Therefore, k y /k max = 0.081g/0.16g = 0.50 From the Makdisi and Seed (1978) chart shown below, for an earthquake magnitude of 6 and k y /k max = 0.5, the likely maximum permanent displacement, (U max ) 10 cm 4 inches U max 10 cm 0.5
109 Attachment C Results of Static and Seismic Slope Stability Analyses Cross-Section Across Phase IV N:\projects\119504\2008\VF FEP Docs\Global Stability
110 N:\projects\119504\2008\VF FEP Docs\Global Stability C-1 Results of Static Slope Stability Analysis
111 # FS a 2.15 b 2.16 c 2.16 d 2.16 e 2.16 f 2.17 g 2.17 h 2.17 i 2.18 j 2.19 Soil Desc. New-Ash Old-Ash MSW SandSilt Med-BBC Till SluryWal RESCO; Valley Fill Stability; Section A-A'; Short-Term; Static; Circle c:\geotechnical\saugus\2008\revised 2006 stabil\a-stat-bc1.pl2 Run By: nk 3/12/ :04AM Soil Type No Total Unit Wt. (pcf) Saturated Unit Wt. (pcf) Cohesion Intercept (psf) Friction Angle (deg) Piez. Surface No. W1 W1 W1 W1 W1 W1 W d b a h j c f g i e GSTABL7 v.2 FSmin=2.15 Safety Factors Are Calculated By The Modified Bishop Method
112 C:\GEOTECHNICAL\saugus\2008\Revised 2006 Stabil\a-stat-bc1.OUT Page 1 *** GSTABL7 *** ** GSTABL7 by Garry H. Gregory, P.E. ** ** Original Version 1.0, January 1996; Current Version 2.003, June 2002 ** (All Rights Reserved-Unauthorized Use Prohibited) ********************************************************************************* SLOPE STABILITY ANALYSIS SYSTEM Modified Bishop, Simplified Janbu, or GLE Method of Slices. (Includes Spencer & Morgenstern-Price Type Analysis) Including Pier/Pile, Reinforcement, Soil Nail, Tieback, Nonlinear Undrained Shear Strength, Curved Phi Envelope, Anisotropic Soil, Fiber-Reinforced Soil, Boundary Loads, Water Surfaces, Pseudo-Static & Newmark Earthquake, and Applied Forces. ********************************************************************************* Analysis Run Date: 3/12/2008 Time of Run: 10:04AM Run By: nk Input Data Filename: C:\GEOTECHNICAL\saugus\2008\Revised 2006 Stabil\a-stat-bc1.i n Output Filename: C:\GEOTECHNICAL\saugus\2008\Revised 2006 Stabil\a-stat-bc1.O UT Unit System: English Plotted Output Filename: C:\GEOTECHNICAL\saugus\2008\Revi2006 Stabil\a-stat-bc1.PLT PROBLEM DESCRIPTION: RESCO; Valley Fill Stability; Section A- A'; Short-Term; Static; Circle BOUNDARY COORDINATES 8 Top Boundaries 22 Total Boundaries Boundary X-Left Y-Left X-Right Y-Right Soil Type (ft) (ft) Below Bnd User Specified Y-Origin = (ft) Default X-Plus Value = 0.00(ft) Default Y-Plus Value = 0.00(ft) ISOTROPIC SOIL PARAMETERS 7 Type(s) of Soil Soil Total Saturated Cohesion Friction Pore Pressure Piez. Type Unit Wt. Unit Wt. Intercept Angle Pressure Constant Surface No. (pcf) (pcf) (psf) (deg) Param. (psf) No A Critical Failure Surface Searching Method, Using A Random Technique For Generating Circular Surfaces, Has Been Specified Trial Surfaces Have Been Generated.
113 C:\GEOTECHNICAL\saugus\2008\Revised 2006 Stabil\a-stat-bc1.OUT Page 2 40 Surface(s) Initiate(s) From Each Of 40 Points Equally Spaced Along The Ground Surface Between X = 0.00(ft) and X = 60.00(ft) Each Surface Terminates Between X = (ft) and X = (ft) Unless Further Limitations Were Imposed, The Minimum Elevation At Which A Surface Extends Is Y = 0.00(ft) 20.00(ft) Line Segments Define Each Trial Failure Surface. Following Are Displayed The Ten Most Critical Of The Trial Failure Surfaces Evaluated. They Are Ordered - Most Critical First. * * Safety Factors Are Calculated By The Modified Bishop Method * * Total Number of Trial Surfaces Evaluated = 1600 Statistical Data On All Valid FS Values: FS Max = FS Min = FS Ave = Standard Deviation = Coefficient of Variation = % Failure Surface Specified By 14 Coordinate Points Circle Center At X = ; Y = ; and Radius = *** *** Individual data on the 25 slices Water Water Tie Tie Earthquake Force Force Force Force Force Surcharge Slice Width Weight Top Bot Norm Tan Hor Ver Load No. (ft) (lbs) (lbs) (lbs) (lbs) (lbs) (lbs) (lbs) (lbs) Failure Surface Specified By 14 Coordinate Points
114 C:\GEOTECHNICAL\saugus\2008\Revised 2006 Stabil\a-stat-bc1.OUT Page Circle Center At X = ; Y = ; and Radius = *** *** Failure Surface Specified By 14 Coordinate Points Circle Center At X = ; Y = ; and Radius = *** *** Failure Surface Specified By 14 Coordinate Points Circle Center At X = ; Y = ; and Radius = *** *** Failure Surface Specified By 15 Coordinate Points
115 C:\GEOTECHNICAL\saugus\2008\Revised 2006 Stabil\a-stat-bc1.OUT Page Circle Center At X = ; Y = ; and Radius = *** *** Failure Surface Specified By 14 Coordinate Points Circle Center At X = ; Y = ; and Radius = *** *** Failure Surface Specified By 15 Coordinate Points Circle Center At X = ; Y = ; and Radius = *** *** Failure Surface Specified By 14 Coordinate Points Circle Center At X = ; Y = ; and Radius = *** *** Failure Surface Specified By 15 Coordinate Points
116 C:\GEOTECHNICAL\saugus\2008\Revised 2006 Stabil\a-stat-bc1.OUT Page Circle Center At X = ; Y = ; and Radius = *** *** Failure Surface Specified By 13 Coordinate Points Circle Center At X = ; Y = ; and Radius = *** *** **** END OF GSTABL7 OUTPUT ****
117 # FS a 1.87 b 1.87 c 1.87 d 1.87 e 1.88 f 1.88 g 1.89 h 1.89 i 1.89 j 1.89 Soil Desc. New-Ash Old-Ash MSW SandSilt Med-BBC Till SluryWal Soil Type No RESCO; Valley Fill Stability; Section A-A'; Short-Term; Static; Block c:\geotechnical\saugus\2008\revised 2006 stabil\a-stat-sb1.pl2 Run By: nk 3/12/ :04AM Total Unit Wt. (pcf) Saturated Unit Wt. (pcf) Cohesion Intercept (psf) Friction Angle (deg) Piez. Surface No. W1 W1 W1 W1 W1 W1 W gh ij a cd b ef GSTABL7 v.2 FSmin=1.87 Safety Factors Are Calculated By The Simplified Janbu Method
118 C:\GEOTECHNICAL\saugus\2008\Revised 2006 Stabil\a-stat-sb1.OUT Page 1 *** GSTABL7 *** ** GSTABL7 by Garry H. Gregory, P.E. ** ** Original Version 1.0, January 1996; Current Version 2.003, June 2002 ** (All Rights Reserved-Unauthorized Use Prohibited) ********************************************************************************* SLOPE STABILITY ANALYSIS SYSTEM Modified Bishop, Simplified Janbu, or GLE Method of Slices. (Includes Spencer & Morgenstern-Price Type Analysis) Including Pier/Pile, Reinforcement, Soil Nail, Tieback, Nonlinear Undrained Shear Strength, Curved Phi Envelope, Anisotropic Soil, Fiber-Reinforced Soil, Boundary Loads, Water Surfaces, Pseudo-Static & Newmark Earthquake, and Applied Forces. ********************************************************************************* Analysis Run Date: 3/12/2008 Time of Run: 10:04AM Run By: nk Input Data Filename: C:\GEOTECHNICAL\saugus\2008\Revised 2006 Stabil\a-stat-sb1.i n Output Filename: C:\GEOTECHNICAL\saugus\2008\Revised 2006 Stabil\a-stat-sb1.O UT Unit System: English Plotted Output Filename: C:\GEOTECHNICAL\saugus\2008\Revi2006 Stabil\a-stat-sb1.PLT PROBLEM DESCRIPTION: RESCO; Valley Fill Stability; Section A- A'; Short-Term; Static; Block BOUNDARY COORDINATES 8 Top Boundaries 22 Total Boundaries Boundary X-Left Y-Left X-Right Y-Right Soil Type (ft) (ft) Below Bnd User Specified Y-Origin = (ft) Default X-Plus Value = 0.00(ft) Default Y-Plus Value = 0.00(ft) ISOTROPIC SOIL PARAMETERS 7 Type(s) of Soil Soil Total Saturated Cohesion Friction Pore Pressure Piez. Type Unit Wt. Unit Wt. Intercept Angle Pressure Constant Surface No. (pcf) (pcf) (psf) (deg) Param. (psf) No A Critical Failure Surface Searching Method, Using A Random Technique For Generating Sliding Block Surfaces, Has Been Specified.
119 C:\GEOTECHNICAL\saugus\2008\Revised 2006 Stabil\a-stat-sb1.OUT Page 2 The Active And Passive Portions Of The Sliding Surfaces Are Generated According To The Rankine Theory Trial Surfaces Have Been Generated. 2 Boxes Specified For Generation Of Central Block Base Length Of Line Segments For Active And Passive Portions Of Sliding Block Is 20.0 Box X-Left Y-Left X-Right Y-Right Height (ft) (ft) (ft) Following Are Displayed The Ten Most Critical Of The Trial Failure Surfaces Evaluated. They Are Ordered - Most Critical First. * * Safety Factors Are Calculated By The Simplified Janbu Method * * Total Number of Trial Surfaces Evaluated = 2000 Statistical Data On All Valid FS Values: FS Max = FS Min = FS Ave = Standard Deviation = Coefficient of Variation = 7.79 % Failure Surface Specified By 15 Coordinate Points *** *** Individual data on the 20 slices Water Water Tie Tie Earthquake Force Force Force Force Force Surcharge Slice Width Weight Top Bot Norm Tan Hor Ver Load No. (ft) (lbs) (lbs) (lbs) (lbs) (lbs) (lbs) (lbs) (lbs) Failure Surface Specified By 15 Coordinate Points
120 C:\GEOTECHNICAL\saugus\2008\Revised 2006 Stabil\a-stat-sb1.OUT Page *** *** Failure Surface Specified By 14 Coordinate Points *** *** Failure Surface Specified By 14 Coordinate Points *** *** Failure Surface Specified By 15 Coordinate Points
121 C:\GEOTECHNICAL\saugus\2008\Revised 2006 Stabil\a-stat-sb1.OUT Page 4 *** *** Failure Surface Specified By 15 Coordinate Points *** *** Failure Surface Specified By 15 Coordinate Points *** *** Failure Surface Specified By 15 Coordinate Points *** *** Failure Surface Specified By 14 Coordinate Points
122 C:\GEOTECHNICAL\saugus\2008\Revised 2006 Stabil\a-stat-sb1.OUT Page *** *** Failure Surface Specified By 14 Coordinate Points *** *** **** END OF GSTABL7 OUTPUT ****
123 # FS a 2.06 b 2.06 c 2.06 d 2.06 e 2.14 f 2.14 g 2.14 h 2.14 i 2.16 j 2.16 RESCO; Valley Fill Stability; Section A-A'; Short-Term; Static; Block; SluryWal c:\geotechnical\saugus\2008\revised 2006 stabil\a-stat-sb2.pl2 Run By: nk 3/12/ :04AM Soil Desc. New-Ash Old-Ash MSW SandSilt Med-BBC Till SluryWal Soil Type No Total Unit Wt. (pcf) Saturated Unit Wt. (pcf) Cohesion Intercept (psf) Friction Angle (deg) Piez. Surface No. W1 W1 W1 W1 W1 W1 W efgh a ij bcd GSTABL7 v.2 FSmin=2.06 Safety Factors Are Calculated By The Simplified Janbu Method
124 C:\GEOTECHNICAL\saugus\2008\Revised 2006 Stabil\a-stat-sb2.OUT Page 1 *** GSTABL7 *** ** GSTABL7 by Garry H. Gregory, P.E. ** ** Original Version 1.0, January 1996; Current Version 2.003, June 2002 ** (All Rights Reserved-Unauthorized Use Prohibited) ********************************************************************************* SLOPE STABILITY ANALYSIS SYSTEM Modified Bishop, Simplified Janbu, or GLE Method of Slices. (Includes Spencer & Morgenstern-Price Type Analysis) Including Pier/Pile, Reinforcement, Soil Nail, Tieback, Nonlinear Undrained Shear Strength, Curved Phi Envelope, Anisotropic Soil, Fiber-Reinforced Soil, Boundary Loads, Water Surfaces, Pseudo-Static & Newmark Earthquake, and Applied Forces. ********************************************************************************* Analysis Run Date: 3/12/2008 Time of Run: 10:04AM Run By: nk Input Data Filename: C:\GEOTECHNICAL\saugus\2008\Revised 2006 Stabil\a-stat-sb2.i n Output Filename: C:\GEOTECHNICAL\saugus\2008\Revised 2006 Stabil\a-stat-sb2.O UT Unit System: English Plotted Output Filename: C:\GEOTECHNICAL\saugus\2008\Revi2006 Stabil\a-stat-sb2.PLT PROBLEM DESCRIPTION: RESCO; Valley Fill Stability; Section A- A'; Short-Term; Static; Block; SluryWal BOUNDARY COORDINATES 8 Top Boundaries 22 Total Boundaries Boundary X-Left Y-Left X-Right Y-Right Soil Type (ft) (ft) Below Bnd User Specified Y-Origin = (ft) Default X-Plus Value = 0.00(ft) Default Y-Plus Value = 0.00(ft) ISOTROPIC SOIL PARAMETERS 7 Type(s) of Soil Soil Total Saturated Cohesion Friction Pore Pressure Piez. Type Unit Wt. Unit Wt. Intercept Angle Pressure Constant Surface No. (pcf) (pcf) (psf) (deg) Param. (psf) No A Critical Failure Surface Searching Method, Using A Random Technique For Generating Sliding Block Surfaces, Has Been Specified.
125 C:\GEOTECHNICAL\saugus\2008\Revised 2006 Stabil\a-stat-sb2.OUT Page 2 The Active And Passive Portions Of The Sliding Surfaces Are Generated According To The Rankine Theory Trial Surfaces Have Been Generated. 4 Boxes Specified For Generation Of Central Block Base Length Of Line Segments For Active And Passive Portions Of Sliding Block Is 15.0 Box X-Left Y-Left X-Right Y-Right Height (ft) (ft) (ft) Following Are Displayed The Ten Most Critical Of The Trial Failure Surfaces Evaluated. They Are Ordered - Most Critical First. * * Safety Factors Are Calculated By The Simplified Janbu Method * * Total Number of Trial Surfaces Evaluated = 2000 Statistical Data On All Valid FS Values: FS Max = FS Min = FS Ave = Standard Deviation = Coefficient of Variation = % Failure Surface Specified By 15 Coordinate Points *** *** Individual data on the 24 slices Water Water Tie Tie Earthquake Force Force Force Force Force Surcharge Slice Width Weight Top Bot Norm Tan Hor Ver Load No. (ft) (lbs) (lbs) (lbs) (lbs) (lbs) (lbs) (lbs) (lbs) Failure Surface Specified By 15 Coordinate Points
126 C:\GEOTECHNICAL\saugus\2008\Revised 2006 Stabil\a-stat-sb2.OUT Page *** *** Failure Surface Specified By 15 Coordinate Points *** *** Failure Surface Specified By 15 Coordinate Points *** *** Failure Surface Specified By 15 Coordinate Points
127 C:\GEOTECHNICAL\saugus\2008\Revised 2006 Stabil\a-stat-sb2.OUT Page *** *** Failure Surface Specified By 15 Coordinate Points *** *** Failure Surface Specified By 15 Coordinate Points *** *** Failure Surface Specified By 15 Coordinate Points *** *** Failure Surface Specified By 15 Coordinate Points
128 C:\GEOTECHNICAL\saugus\2008\Revised 2006 Stabil\a-stat-sb2.OUT Page *** *** Failure Surface Specified By 15 Coordinate Points *** *** **** END OF GSTABL7 OUTPUT ****
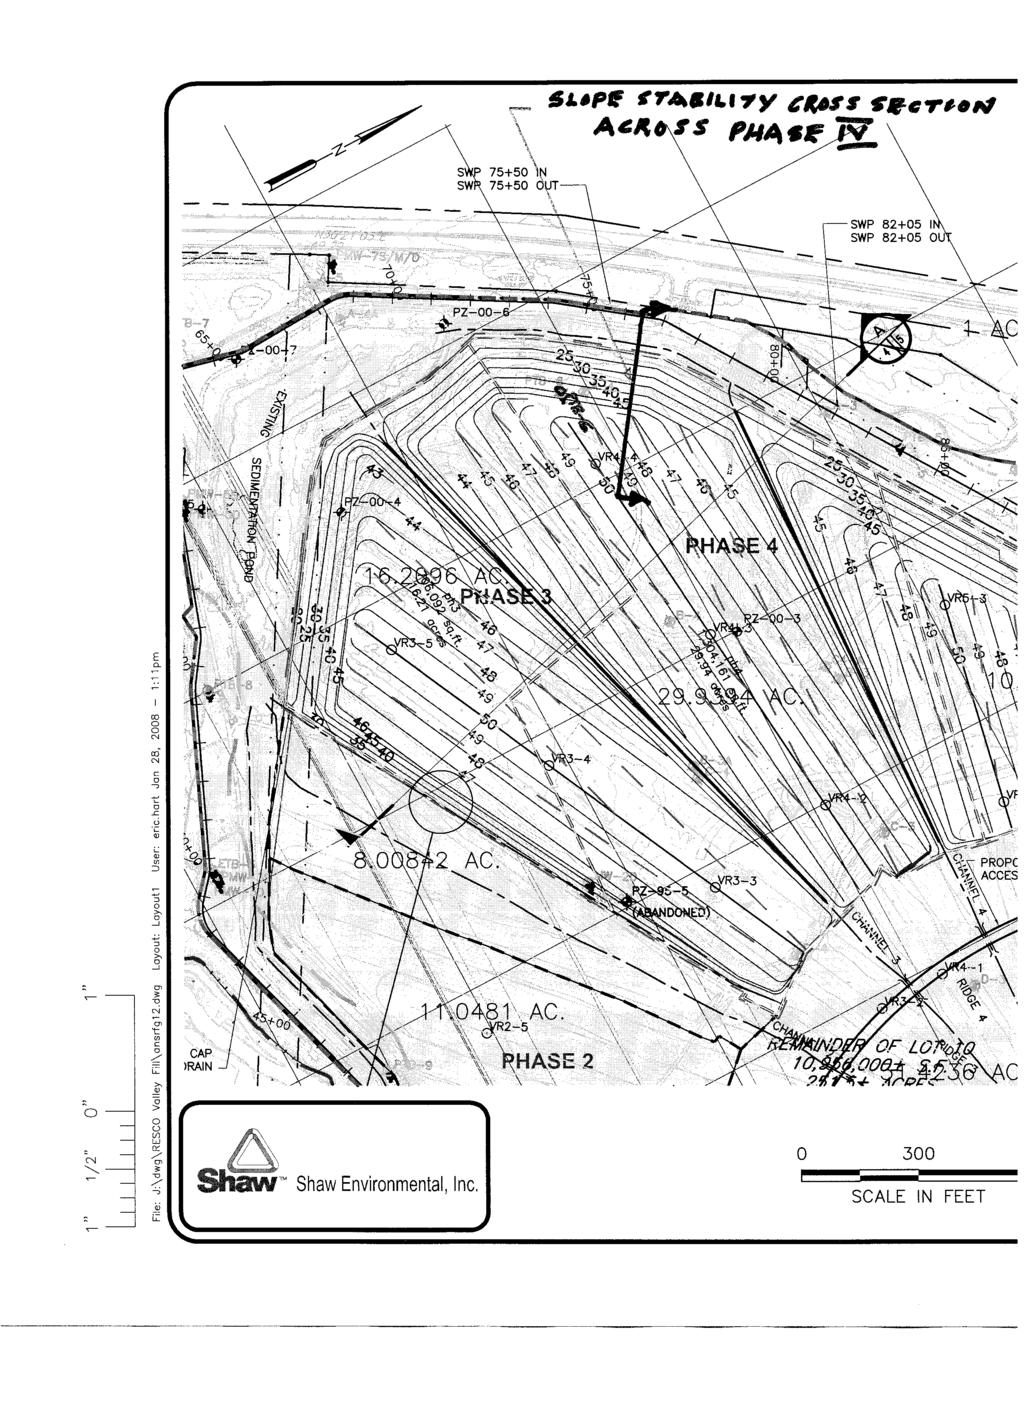
129
APPENDIX G SCA BASIN CALCULATIONS
 ONONDAGA LAKE SEDIMENT MANAGEMENT FINAL DESIGN APPENDIX G SCA BASIN CALCULATIONS p:\honeywell -syr\444853 - lake detail design\09 reports\9.22 sediment management final design\110930 submittal\110906 onon
Prof. B V S Viswanadham, Department of Civil Engineering, IIT Bombay
 43 Module 3: Lecture - 5 on Compressibility and Consolidation Contents Stresses in soil from surface loads; Terzaghi s 1-D consolidation theory; Application in different boundary conditions; Ramp loading;
CENGRS GEOTECHNICA PVT. LTD. Job No Sheet No. 1
 CENGRS GEOTECHNICA PVT. LTD. Job No. 214030 Sheet No. 1 INTERIM REPORT ON GEOTECHNICAL INVESTIGATION FOR PROPOSED 66 KV GRID PLOT AT G-7, DWARKA, NEW DELHI. 1.0 INTRODUCTION 1.1 Project Description M/s.
BIOREACTOR LANDFILLS: GEOTECHNICAL ASPECTS OF STABILITY EVALUATION
 BIOREACTOR LANDFILLS: GEOTECHNICAL ASPECTS OF STABILITY EVALUATION Presented by James Law SCS Engineers Master Class ISWA Congress 2009 Lisbon 10 October 2009 PRESENTATION OVERVIEW Landfill Slope Stability
Tension Cracks. Topics Covered. Tension crack boundaries Tension crack depth Query slice data Thrust line Sensitivity analysis.
 Tension Cracks 16-1 Tension Cracks In slope stability analyses with cohesive soils, tension forces may be observed in the upper part of the slope. In general, soils cannot support tension so the results
SUMMARY OF SUBSURFACE STRATIGRAPHY AND MATERIAL PROPERTIES
 Page 1 of 101 Written by: Ming Zhu Date: 08/20/2008 Reviewed by: R. Kulasingam/J. Beech Date: 08/20/2008 SUMMARY OF SUBSURFACE STRATIGRAPHY AND MATERIAL PROPERTIES 1. INTRODUCTION This Summary of Subsurface
Reinforced Soil Retaining Walls-Design and Construction
 Lecture 32 Reinforced Soil Retaining Walls-Design and Construction Prof. G L Sivakumar Babu Department of Civil Engineering Indian Institute of Science Bangalore 560012 Example calculation An 8 m high
October 16, GRDA CCR Landfill Compliance Report Grand River Dam Energy Center 8142 Hwy 412B PO Box 609 Chouteau, OK Dear Mr.
 October 16, 2018 Mr. Mike Bednar Superintendent of Environmental Compliance GRDA-Ecosystems and Education Center PO Box 70 420 Hwy 28 Langley, OK 74350-0070 RE: GRDA CCR Landfill Compliance Report Grand
E.2 CAP SETTLEMENT RA D AND OUTBOARD
 DRAFT ONONDAGA LAKE CAPPING, DREDGING AND HABITAT INTERMEDIATE DESIGN E.2 CAP SETTLEMENT RA D AND OUTBOARD Parsons P;\Honeywell-SYR\444576 2008 Capping\09 Reports\9.1 Capping and Dredge Area & Depth IDS\Appendices\Appendix
computed using Equation 3-18 by setting the 2nd term equal to 0 and K A equal to K o and using the pressure distribution as shown in Figure 3-23.
 computed using Equation 3-18 by setting the 2nd term equal to 0 and K A equal to K o and using the pressure distribution as shown in Figure 3-23. (2) For the resisting side, passive pressure theory indicates
Cubzac-les-Ponts Experimental Embankments on Soft Clay
 Cubzac-les-Ponts Experimental Embankments on Soft Clay GEO-SLOPE International Ltd. www.geo-slope.com 1, 7 - th Ave SW, Calgary, AB, Canada TP T Main: +1 3 9 Fax: +1 3 39 Introduction In the 197 s, a series
UNIT-I SOIL EXPLORATION
 SIDDHARTH GROUP OF INSTITUTIONS :: PUTTUR Siddharth Nagar, Narayanavanam Road 517583 QUESTION BANK (DESCRIPTIVE) Subject with Code : Geotechnical Engineering - II (16CE127) Year & Sem: III-B.Tech & II-Sem
m v = 1.04 x 10⁻⁴ m 2 /kn, C v = 1.29 x 10⁻² cm 2 /min
 2.10 Problems Example 2.1: Design of Shallow Foundation in Saturated Clay Design a square footing to support a column load of 667 kn. The base of the footing will be located 1 m below the ground level
Influence of Settlement on Bearing Capacity Analysis of Shallow Foundations on Sandy Clays in the Niger Delta, Nigeria
 Available online at www.scholarsresearchlibrary.com European Journal of Applied Engineering and Scientific Research, 201, 2 (4):20-27 (http://scholarsresearchlibrary.com/archive.html) ISSN: 22 0041 Influence
HISTORY OF CONSTRUCTION
 HISTORY OF CONSTRUCTION CFR 257.73(c)(1) West Boiler Slag Pond Clifty Creek Plant Madison, Indiana October, 2016 Prepared for: Indiana Kentucky Electric Corporation Prepared by: American Electric Power
Stability Analysis for a Landfill Experiencing Elevated Temperatures
 Stability Analysis for a Landfill Experiencing Elevated Temperatures Timothy D. Stark 1, F. ASCE, P.E., Kamran Akhtar 2, S.M. ASCE, and Manzoor Hussain 2, S.M. ASCE 1 Professor, Dept. of Civil and Environmental
SOIL IMPROVEMENT BY VACUUM PRELOADING FOR A POWER PLANT PROJECT IN VIETNAM
 18 th Southeast Asian Geotechnical & Inaugural AGSSEA Conference 29-31 May 213, Singapore Leung, Goh & Shen (eds) SOIL IMPROVEMENT BY VACUUM PRELOADING FOR A POWER PLANT PROJECT IN VIETNAM GOUW TJIE-LIONG
The tensile capacity of suction caissons in sand under rapid loading
 Frontiers in Offshore Geotechnics: ISFOG 25 Gourvenec & Cassidy (eds) 25 Taylor & Francis Group, London, ISBN 415 3963 X The tensile capacity of suction caissons in sand under rapid loading Guy T. Houlsby,
INSTITUTE OF AERONAUTICAL ENGINEERING (Autonomous) Dundigal, Hyderabad
 Dundigal, Hyderabad") INSTITUTE OF AERONAUTICAL ENGINEERING (Autonomous) Dundigal, Hyderabad - 500 043 CIVIL ENGINEERING Tutorial Question Bank Name : FOUNDATION ENGINEERING Code : A60126 Class : III B. Tech II Semester Branch
INSTITUTE OF AERONAUTICAL ENGINEERING (Autonomous) Dundigal, Hyderabad - 500 043 CIVIL ENGINEERING Tutorial Question Bank Name : FOUNDATION ENGINEERING Code : A60126 Class : III B. Tech II Semester Branch
Tutorial 2 Time-Dependent Consolidation. Staging Groundwater Time-dependent consolidation Point query Line query Graph Query
 Tutorial 2 Time-Dependent Consolidation Staging Groundwater Time-dependent consolidation Point query Line query Graph Query Model Set-up For this tutorial we will start with the model from Tutorial 1 Quick
CHAPTER 5: VACUUM TEST WITH VERTICAL DRAINS
 CHAPTER 5: VACUUM TEST WITH VERTICAL DRAINS 5.1 Introduction Using surcharging as the sole soil consolidation mean can take a long time to reach the desired soil settlement. Soil consolidation using prefabricated
Quantitative Risk of Linear Infrastructure on Permafrost Heather Brooks, PE. Arquluk Committee Meeting November 2015
 Slide 1 Quantitative Risk of Linear Infrastructure on Permafrost Heather Brooks, PE Arquluk Committee Meeting November 2015 Welcome to the meeting of the committee for Arquluk s Quantitative Risk of Linear
Submerged Slope with Excess Pore- Water Pressure
 Submerged Slope with Excess Pore- Water Pressure GEO-SLOPE International Ltd. www.geo-slope.com 1400, 633-6th Ave SW, Calgary, AB, Canada T2P 2Y Main: +1 403 269 02 Fax: +1 403 266 481 Introduction Analyzing
SITE S7: EMBANKMENT FAILURE WEST OF MILLARVILLE
 LANDSLIDE RISK ASSESSMENT SOUTHERN REGION SITE S7: EMBANKMENT FAILURE WEST OF MILLARVILLE LEGAL LOCATION: LSD 4-3-21-4 W5M and 1-4-21-4 W5M REFERENCE LOCATION ALONG HIGHWAY The slide area is located between
Strength and Deformation Behavior of Soft Bangkok Clay
 Geotechnical Testing Journal, Vol. 26, No. 4 Paper ID GTJ8933_264 Available online at: www.astm.org T. H. Seah 1 and K. C. Lai 2 Strength and Deformation Behavior of Soft Bangkok Clay ABSTRACT: The influence
INSTITUTE OF AERONAUTICAL ENGINEERING (Autonomous) Dundigal, Hyderabad CIVIL ENGINEERING TUTORIAL QUESTION BANK
 Dundigal, Hyderabad CIVIL ENGINEERING TUTORIAL QUESTION BANK") INSTITUTE OF AERONAUTICAL ENGINEERING (Autonomous) Dundigal, Hyderabad - 00 04 CIVIL ENGINEERING TUTORIAL QUESTION BANK Course Name Course Code Regulation Course Structure Course Coordinator Course Faculty
INSTITUTE OF AERONAUTICAL ENGINEERING (Autonomous) Dundigal, Hyderabad - 00 04 CIVIL ENGINEERING TUTORIAL QUESTION BANK Course Name Course Code Regulation Course Structure Course Coordinator Course Faculty
An Introduction to Deep Foundations
 An Introduction to Deep Foundations J. Paul Guyer, P.E., R.A. Paul Guyer is a registered mechanical engineer, civil engineer, fire protection engineer and architect with over 35 years experience in the
Study to Establish Relations for the Relative Strength of API 650 Cone Roof Roof-to-Shell and Shell-to- Bottom Joints
 Thunderhead Engineering Consultants I N C O R P O R A T E D 1006 Poyntz Ave. Manhattan, KS 66502-5459 785-770-8511 www. thunderheadeng.com Study to Establish Relations for the Relative Strength of API
For a cantilever pile wall shown in Figure 1, assess the performance of the system and answer the following questions.
 Question 1 For a cantilever pile wall shown in Figure 1, assess the performance of the system and answer the following questions. Figure 1 - Cantilever Pile Wall i. Estimate the net resulting horizontal
Evaluating the Design Safety of Highway Structural Supports
 Evaluating the Design Safety of Highway Structural Supports by Fouad H. Fouad and Elizabeth A. Calvert Department of Civil and Environmental Engineering The University of Alabama at Birmingham Birmingham,
Construction Dewatering
 Construction Dewatering Introduction The control of groundwater is one of the most common and complicated problems encountered on a construction site. Construction dewatering can become a costly issue
SUBPART C - STRUCTURE
 SUBPART C - STRUCTURE GENERAL CS 23.301 Loads (a) Strength requirements are specified in terms of limit loads (the maximum loads to be expected in service) and ultimate loads (limit loads multiplied by
Application of Expansive Soil Geotechnical Procedures
 Application of Expansive Soil Geotechnical Procedures FPA PRESENTATION John T. Bryant, Ph.D., P.G., P.E with Robert L. Lytton, Ph.D., PE. And Mr. Dean Read HOUSTON, TEXAS WEDNESDAY DECEMBER 10, 2008 2008
2018 Annual Inspection Report
 2018 Annual Inspection Report for Compliance with the Coal Combustion Residuals Rule (40 CFR Part 257) Comanche Station 2005 Lime Road Pueblo, Colorado 81006 January 18, 2019 Table of Contents Certification...
ENTUCKY RANSPORTATION C ENTER. College of Engineering
 Research Report KTC-05-34/SPR-297-05-1I T K ENTUCKY RANSPORTATION C ENTER College of Engineering USE OF ULTRA-LIGHTWEIGHT GEOFOAM TO REDUCE STRESSES IN HIGHWAY CULVERT EXTENSIONS Our Mission We provide
Notice of Intent to Close Inactive CCR Surface Impoundments
 Notice of Intent to Close Inactive CCR Surface Impoundments Virginia Electric and Power Company Possum Point Power Station Coal Combustion Residual Surface Impoundments A, B, C, D, and E Dumfries, Virginia
Analysis of dilatometer test in calibration chamber
 Analysis of dilatometer test in calibration chamber Lech Bałachowski Gdańsk University of Technology, Poland Keywords: calibration chamber, DMT, quartz sand, FEM ABSTRACT: Because DMT in calibration test
V-H-M Yield Surface describing Soil Structure Interaction of Sub-sea Structures and Wind Turbines on Caisson Foundations in Soft Clays
 NGM 2016 Reykjavik Proceedings of the 17 th Nordic Geotechnical Meeting Challenges in Nordic Geotechnic 25 th 28 th of May V-H-M Yield Surface describing Soil Structure Interaction of Sub-sea Structures
D.B. Wilson Station CCR Landfill
 D.B. Wilson Station CCR Landfill Disposal of Coal Combustion Residuals (CCR) from Electric Utilities Final Rule Closure and Post-closure Care Plan October 11, 2016 Prepared By: Project ID: 160030A Big
Stability of slopes of municipal solid waste landfills with co-disposal of biosolids
 Geo-Environment and Landscape Evolution II 215 Stability of slopes of municipal solid waste landfills with co-disposal of biosolids M. Chopra, D. Reinhart, M. Vajirkar & B. Koodhathinkal University of
CONE PENETRATION TESTS
 February 25, 2015 John Doe, P.E. Acme Engineering and Testing 1234 Test Avenue, Suite 204 Lake Wales, FL 33853 Re: Sample CPT Soundings Dear Mr. Doe, Direct Push Services, LLC (DPS) was retained by Acme
JAR-23 Normal, Utility, Aerobatic, and Commuter Category Aeroplanes \ Issued 11 March 1994 \ Section 1- Requirements \ Subpart C - Structure \ General
 JAR 23.301 Loads \ JAR 23.301 Loads (a) Strength requirements are specified in terms of limit loads (the maximum loads to be expected in service) and ultimate loads (limit loads multiplied by prescribed
2017 Annual Inspection Report
 2017 Annual Inspection Report for Compliance with the Coal Combustion Residuals Rule (40 CFR Part 257) Comanche Station 2005 Lime Road Pueblo, Colorado 81006 January 18, 2018 Table of Contents Certification...
Bearing Capacity and Settlement Response of PMS Tanks on Cohesionless Soil Lithology in Lekki, Lagos of Nigeria
 Available online at www.scholarsresearchlibrary.com European Journal of Applied Engineering and Scientific Research,, ():- (http://scholarsresearchlibrary.com/archive.html) ISSN: 8 Bearing Capacity and
AMEC010570_0001. Via . Mt. Polley Mine Tailings Facility Optimization Potential- Follow Up from Dam Safety Review 1.
 { TIME\@ "d MMMM yyyy" } AMEC Project Number VM00448 Via EMAIL Imperial Metals Corporation 200-580 Hornby Street Vancouver, B.C. V6C 3B6 Attention: Mr. Ron Martel Environmental Superintendent Reference:
Effects of directionality on wind load and response predictions
 Effects of directionality on wind load and response predictions Seifu A. Bekele 1), John D. Holmes 2) 1) Global Wind Technology Services, 205B, 434 St Kilda Road, Melbourne, Victoria 3004, Australia, seifu@gwts.com.au
3 1 PRESSURE. This is illustrated in Fig. 3 3.
 P = 3 psi 66 FLUID MECHANICS 150 pounds A feet = 50 in P = 6 psi P = s W 150 lbf n = = 50 in = 3 psi A feet FIGURE 3 1 The normal stress (or pressure ) on the feet of a chubby person is much greater than
Critical face pressure and backfill pressure in shield TBM tunneling on soft ground
 Critical face pressure and backfill pressure in shield TBM tunneling on soft ground Kiseok Kim 1), Juyoung Oh 2), Hyobum Lee 3) and Hangseok Choi 4) 1), 3), 4) Department of civil engineering, Korea University,
Pressuremeters in Geotechnical Design
 Pressuremeters in Geotechnical Design B.G. CLARKE Department of Civil Engineering University of Newcastle upon Tyne BLACK1E ACADEMIC & PROFESSIONAL An Imprint of Chapman & Hall London Glasgow Weinheim
Mechanical Stabilisation for Permanent Roads
 Mechanical Stabilisation for Permanent Roads Tim Oliver VP Global Applications Technology Tensar International toliver@tensar.co.uk Effect of geogrid on particle movement SmartRock Effect of geogrid on
Shallow foundations settlement
 References: 1. Rajapakse, Ruwan. Geotechnical Engineering Calculations and Rules of Thumb. 2. Schroeder, W.L., Dickenson, S.E, Warrington, Don, C. Soils in Construction. Fifth Edition. Upper Saddle River,
REPORT GEO-TECHNICAL INVESTIGATION FOR THE PROPOSED BLOCK-1 SUB-STATION SY NO-44, NEAR KYATAGANACHERLU VILLAGE
 REPORT ON GEO-TECHNICAL INVESTIGATION FOR THE PROPOSED BLOCK-1 SUB-STATION SY NO-44, NEAR KYATAGANACHERLU VILLAGE CLIENT: KARNATAKA SOLAR POWER DEVELOPMENT CORPORATION BANGALORE 0 GEO-TECHNICAL INVESTIGATION
Strength Reduction Stability
 1 Introduction Reduction Stability Stability by strength reduction is a procedure where the factor of safety is obtained by weakening the soil in steps in an elastic-plastic finite element analysis until
Application of pushover analysis in estimating seismic demands for large-span spatial structure
 28 September 2 October 2009, Universidad Politecnica de Valencia, Spain Alberto DOMINGO and Carlos LAZARO (eds.) Application of pushover analysis in estimating seismic demands for large-span spatial structure
EXPERIMENTAL INVESTIGATION ON OPTIMUM INSTALLATION DEPTH OF PVD UNDER VACUUM CONSOLIDATION ABSTRACT
 EXPERIMENTAL INVESTIGATION ON OPTIMUM INSTALLATION DEPTH OF PVD UNDER VACUUM CONSOLIDATION EXPERIMENTAL INVESTIGATION ON OPTIMUM INSTALLATION DEPTH OF PVD UNDER VACUUM CONSOLIDATION J.-C CHAI i), N. MIURA
Title Tsunami during 2011 East Japan Eart. The final publication is available より本文ファイルは に公開.
 Title Combined Failure Mechanism of a Bre Tsunami during 2011 East Japan Eart Author(s) Iai, Susumu Citation Geotechnical, Geological and Earthq 37: 177-186 Issue Date 2015-04-16 URL http://hdl.handle.net/2433/198459
Verdura 40/60 Retaining Wall Feasibility Design and Response to Plan Review Comments from City of Lake Forest
 Verdura 40/60 Retaining Wall Feasibility Design and Response to Plan Review Comments from City of Lake Forest Project: Portola Center Project (South Parcel), TTM 15353 Lake Forest, CA Prepared for: SunRanch
Chapter 12 Practice Test
 Chapter 12 Practice Test 1. Which of the following is not one of the conditions that must be satisfied in order to perform inference about the slope of a least-squares regression line? (a) For each value
REPORT GEO-TECHNICAL INVESTIGATION FOR THE PROPOSED BLOCK-7 SUB-STATION SY NO-225, NEAR RAYACHERLU VILLAGE
 REPORT ON GEO-TECHNICAL INVESTIGATION FOR THE PROPOSED BLOCK-7 SUB-STATION SY NO-225, NEAR RAYACHERLU VILLAGE CLIENT: KARNATAKA SOLAR POWER DEVELOPMENT CORPORATION BANGALORE 0 GEO-TECHNICAL INVESTIGATION
Plan B Dam Breach Assessment
 Plan B Dam Breach Assessment Introduction In support of the Local Sponsor permit applications to the states of Minnesota and North Dakota, a dam breach analysis for the Plan B alignment of the Fargo-Moorhead
Department of Civil & Geological Engineering GEOE Engineering Geology
 Department of Civil & Geological Engineering GEOE 218.3 Engineering Geology Assignment #3, Head, Pore Pressure & Effective Stress Due 08 Oct, 2010 NOTE: Numbered subscripts indicate depth, in metres, below
OFFICE OF STRUCTURES MANUAL FOR HYDROLOGIC AND HYDRAULIC DESIGN CHAPTER 11 APPENDIX B TIDEROUT 2 USERS MANUAL
 OFFICE OF STRUCTURES MANUAL FOR HYDROLOGIC AND HYDRAULIC DESIGN CHAPTER 11 APPENDIX B TIDEROUT 2 USERS MANUAL APRIL 2011 APRIL 2011 Page 1 Preface TIDEROUT 2, Build 1.22 dated June 29, 2006 is the current
Saturated-Unsaturated Consolidation
 Introduction Saturated-Unsaturated Consolidation This example looks at the volume change behavior of a saturated-unsaturated column under loading, wetting and drying conditions. Feature Highlights GeoStudio
Item 404 Driving Piling
 Item Driving Piling 1. DESCRIPTION Drive piling. 2. EQUIPMENT 2.1. Driving Equipment. Use power hammers for driving piling with specified bearing resistance. Use power hammers that comply with Table 1.
Hardware Triaxial and Consolidation Testing Systems Pressure Measurement and Control
 25 GDS Helpsheet Hardware Triaxial and Consolidation Testing Systems Pressure Measurement and Control World Leaders in Computer Controlled Testing Systems for Geotechnical Engineers and Geologists 1. Digital
Soft Computing Approaches to Constitutive Modeling in Geotechnical Engineering
 Soft Computing Approaches to Constitutive Modeling in Geotechnical Engineering Jamshid Ghaboussi and Youssef M. Hashash Department of Civil and Environmental Engineering University of Illinois at Urbana-Champaign
Pros and Cons of the Analysis of Slope Stability by Various Methods of Slices or Columns
 Pros and Cons of the Analysis of Slope Stability by Various Methods of Slices or Columns by Robert Pyke Ph.D., G.E. Partially Completed Draft April 22, 2017 General Background The history of slope stability
SUPPORTING NOTES FOR THE EVALUATION OF UNBOUND ROAD BASE AND SUB-BASE AGGREGATES
 SUPPORTING NOTES FOR THE EVALUATION OF UNBOUND ROAD BASE AND SUB-BASE AGGREGATES (These notes are guidelines only and must not be included in the Contract Documents). 1. SCOPE These Notes are guidelines
Non-Linear Seismic Analysis of Multi-Storey Building
 Non-Linear Seismic Analysis of Multi-Storey Building Uzair Khan 1 1 M.Tech (Structural & Construction Engineering) Department of Civil Engineering, National Institute of Technology, Jalandhar. Hina Gupta
COURSE NUMBER: ME 321 Fluid Mechanics I Fluid statics. Course teacher Dr. M. Mahbubur Razzaque Professor Department of Mechanical Engineering BUET
 COURSE NUMBER: ME 321 Fluid Mechanics I Fluid statics Course teacher Dr. M. Mahbubur Razzaque Professor Department of Mechanical Engineering BUET 1 Fluid statics Fluid statics is the study of fluids in
HURRICANE SANDY LIMITED REEVALUATION REPORT UNION BEACH, NEW JERSEY DRAFT ENGINEERING APPENDIX SUB APPENDIX D SBEACH MODELING
 HURRICANE SANDY LIMITED REEVALUATION REPORT UNION BEACH, NEW JERSEY DRAFT ENGINEERING APPENDIX SUB APPENDIX D SBEACH MODELING Rev. 18 Feb 2015 1 SBEACH Modeling 1.0 Introduction Following the methodology
CROSS-SHORE SEDIMENT PROCESSES
 The University of the West Indies Organization of American States PROFESSIONAL DEVELOPMENT PROGRAMME: COASTAL INFRASTRUCTURE DESIGN, CONSTRUCTION AND MAINTENANCE A COURSE IN COASTAL DEFENSE SYSTEMS I CHAPTER
[Barve, 4(7): July, 2015] ISSN: (I2OR), Publication Impact Factor: 3.785
![[Barve, 4(7): July, 2015] ISSN: (I2OR), Publication Impact Factor: 3.785](/thumbs/96/128298826.jpg "[Barve, 4(7): July, 2015] ISSN: (I2OR), Publication Impact Factor: 3.785") IJESRT INTERNATIONAL JOURNAL OF ENGINEERING SCIENCES & RESEARCH TECHNOLOGY PARAMETRIC STUDY TO UNDERSTAND THE SEISMIC BEHAVIOUR OF INTZE TANK SUPPORTED ON SHAFT Prasad S. Barve *, Ruchi P. Barve * Civil
IJESRT INTERNATIONAL JOURNAL OF ENGINEERING SCIENCES & RESEARCH TECHNOLOGY PARAMETRIC STUDY TO UNDERSTAND THE SEISMIC BEHAVIOUR OF INTZE TANK SUPPORTED ON SHAFT Prasad S. Barve *, Ruchi P. Barve * Civil
The Adequacy of Pushover Analysis to Evaluate Vulnerability of Masonry Infilled Steel Frames Subjected to Bi-Directional Earthquake Loading
 The Adequacy of Pushover Analysis to Evaluate Vulnerability of Masonry Infilled Steel Frames Subjected to Bi-Directional Earthquake Loading B.Beheshti Aval & M. Mohammadzadeh K.N.Toosi University of Technology,
STRUCTURAL STABILITY ASSESSMENT
 STRUCTURAL STABILITY ASSESSMENT CFR 257.73(d) Fly Ash Reservoir II Cardinal Plant Brilliant, Ohio October, 2016 Prepared for: Cardinal Operating Company Cardinal Plant Brilliant, Ohio Prepared by: Geotechnical
Section I: Multiple Choice Select the best answer for each problem.
 Inference for Linear Regression Review Section I: Multiple Choice Select the best answer for each problem. 1. Which of the following is NOT one of the conditions that must be satisfied in order to perform
Lifecycle Performance of Escape Systems
 Lifecycle Performance of Escape Systems A look at laboratory vs field conditioning of aramid fiber based escape systems. By James Hunter, Cedric Smith, Ole Kils and Tyler Mayer for ITRS 2018 1.1 Introduction
Alaska Deep-Draft Arctic Port System
 Alaska Deep-Draft Arctic Port System Seward Peninsula, AK, Alaska District, Pacific Ocean Division February 2014 PN: ####### Status: DRAFT Alaska Deep-Draft Arctic Ports System i Table of Contents 1.0
Mr. Michael Malone CPS Energy 145 Navarro Street, Mail Drop San Antonio, Texas Project No
 October 17, 2016 Mr. Michael Malone CPS Energy 145 Navarro Street, Mail Drop 100406 San Antonio, Texas 78296 Project No. 0352436 Subject: Compilation of Construction History Calaveras Power Station San
THE EFFECT OF EMBEDMENT DEPTH ON BEARING CAPACITY OF STRIP FOOTING IN COHESIVE FRICTIONAL MEDIUM
 Proceedings of the 4 th International Conference on Civil Engineering for Sustainable Development (ICCESD 2018), 9~11 February 2018, KUET, Khulna, Bangladesh (ISBN-978-984-34-3502-6) THE EFFECT OF EMBEDMENT
TABLE OF CONTENTS LEGAL NOTICE
 Closure Plan for Existing CCR Revision: 1 Surface Impoundments Page No. i TABLE OF CONTENTS 1. INTRODUCTION... 1 2. PROPOSED CCR IMPOUNDMENT CLOSURE PROCEDURE... 3 3. PROPOSED COVER SYSTEM... 4 4. ESTIMATED
SEALANT BEHAVIOR OF GASKETED-SEGMENTAL CONCRETE TUNNEL LINING
 4 th International Conference on Earthquake Geotechnical Engineering June 25-28, 2007 Paper No.1636 SEALANT BEHAVIOR OF GASKETED-SEGMENTAL CONCRETE TUNNEL LINING Faisal SHALABI 1, Edward CORDING 2, and
TABLE OF CONTENTS LEGAL NOTICE
 Surface Impoundments Page No. i TABLE OF CONTENTS 1. INTRODUCTION... 1 2. PROPOSED CCR IMPOUNDMENT CLOSURE PROCEDURE... 3 3. PROPOSED COVER SYSTEM... 4 4. ESTIMATED MAXIMUM INVENTORY OF CCR... 4 5. ESTIMATED
Verdura 40/60 Retaining Wall Feasibility Design and Response to Plan Review Comments from City of Lake Forest
 Verdura 40/60 Retaining Wall Feasibility Design and Response to Plan Review Comments from City of Lake Forest Project: Portola Center Project (North Parcel), TTM 17300 Lake Forest, CA Prepared for: USA
Pore-Air Entrapment during Infiltration
 Pore-Air Entrapment during Infiltration GEO-SLOPE International Ltd. www.geo-slope.com 1200, 700-6th Ave SW, Calgary, AB, Canada T2P 0T8 Main: +1 403 269 2002 Fax: +1 888 463 2239 Introduction Infiltration
Adaptive Pushover Analysis of Irregular RC Moment Resisting Frames
 Kalpa Publications in Civil Engineering Volume 1, 2017, Pages 132 136 ICRISET2017. International Conference on Research and Innovations in Science, Engineering &Technology. Selected papers in Civil Engineering
PUSHOVER ANALYSIS OF STEEL STRUCTURE Santosh shet 1, Dr.Akshatha shetty 2 1
 PUSHOVER ANALYSIS OF STEEL STRUCTURE Santosh shet 1, Dr.Akshatha shetty 2 1 P.G Student, NMAMIT Engineering college Nitte Karkala, Karnataka,India 2 Assistant Professor NMAMIT Engineering college Nitte
Coal Combustion Residuals Closure Plan
 Virginia Electric and Power Company Chesterfield Power Station Upper (East) Pond Chesterfield County, Virginia GAI Project Number: C150035.00 October 2016 Prepared by: GAI Consultants, Inc. Richmond Office
Applying Hooke s Law to Multiple Bungee Cords. Introduction
 Applying Hooke s Law to Multiple Bungee Cords Introduction Hooke s Law declares that the force exerted on a spring is proportional to the amount of stretch or compression on the spring, is always directed
E. Agu, M. Kasperski Ruhr-University Bochum Department of Civil and Environmental Engineering Sciences
 EACWE 5 Florence, Italy 19 th 23 rd July 29 Flying Sphere image Museo Ideale L. Da Vinci Chasing gust fronts - wind measurements at the airport Munich, Germany E. Agu, M. Kasperski Ruhr-University Bochum
International Journal of Technical Research and Applications e-issn: , Volume 4, Issue 3 (May-June, 2016), PP.
, PP.") DESIGN AND ANALYSIS OF FEED CHECK VALVE AS CONTROL VALVE USING CFD SOFTWARE R.Nikhil M.Tech Student Industrial & Production Engineering National Institute of Engineering Mysuru, Karnataka, India -570008
DESIGN AND ANALYSIS OF FEED CHECK VALVE AS CONTROL VALVE USING CFD SOFTWARE R.Nikhil M.Tech Student Industrial & Production Engineering National Institute of Engineering Mysuru, Karnataka, India -570008
Autodesk Moldflow Communicator Process settings
 Autodesk Moldflow Communicator 212 Process settings Revision 1, 3 March 211. Contents Chapter 1 Process settings....................................... 1 Profiles.................................................
Soil-Structure Interaction Analysis for Bridge Caisson Foundation
 Missouri University of Science and Technology Scholars' Mine International Conferences on Recent Advances in Geotechnical Earthquake Engineering and Soil Dynamics 2010 - Fifth International Conference
RELIABILITY ASSESSMENT, STATIC AND DYNAMIC RESPONSE OF TRANSMISSION LINE TOWER: A COMPARATIVE STUDY
 RELIABILITY ASSESSMENT, STATIC AND DYNAMIC RESPONSE OF TRANSMISSION LINE TOWER: A COMPARATIVE STUDY Yusuf Mansur Hashim M. Tech (Structural Engineering) Student, Sharda University, Greater Noida, (India)
An Analysis of the Travel Conditions on the U. S. 52 Bypass. Bypass in Lafayette, Indiana.
 An Analysis of the Travel Conditions on the U. S. 52 Bypass in Lafayette, Indiana T. B. T readway Research Assistant J. C. O ppenlander Research Engineer Joint Highway Research Project Purdue University
Swedge 6.0. Now with a Basal Failure Plane and Bench Design. Basal plane, improved water pressure distribution, and more
 Swedge 6.0 Now with a Basal Failure Plane and Bench Design Basal plane, improved water pressure distribution, and more Swedge is an easy-to-use analysis tool for evaluating the stability of surface wedges
using Strength Ratios
 Shear Strength of Liquefied Soil using Strength Ratios Prof. Scott M. Olson, PhD, PE 86 th Annual Meeting Transportation Research Board January 22, 2007 Liquefaction Problems Photos from eeri.org Undrained
Slope Stability Analysis Of Class I Landfills With Co Disposal Of Bios
 University of Central Florida Electronic Theses and Dissertations Masters Thesis (Open Access) Slope Stability Analysis Of Class I Landfills With Co Disposal Of Bios 2004 Mrutyunjay Vajirkar University
Analysis of Shear Lag in Steel Angle Connectors
 University of New Hampshire University of New Hampshire Scholars' Repository Honors Theses and Capstones Student Scholarship Spring 2013 Analysis of Shear Lag in Steel Angle Connectors Benjamin Sawyer
CHAPTER 3 PROJECT DESCRIPTION AND SITE CONDITION
 19 CHAPTER 3 PROJECT DESCRIPTION AND SITE CONDITION 3.1 OVERVIEW This chapter describes Route 44 relocation project. General project information is provided along with details related to the subsurface