Result February, 2014
|
|
|
- Heather Phillips
- 6 years ago
- Views:
Transcription

1 Improved market shares and solid margins in challenging conditions Result February, 2014 Mr. Kim Gran President and CEO Nokian Tyres plc 1

2 INDEX 1. General overview 2. Nokian Tyres financial performance 3. Profit centres (incl. Russian operations) 4. Nokian Tyres going forward 5. Appendixes Nokian Tyres Fastest on Ice 9 March, 2013: New Nokian Hakkapeliitta 8 sets New World Record km/h! 2

 and Net sales")
 and EBIT margin")
")
 and")
3 GENERAL OVERVIEW Key figures Net sales (m ) and Net sales growth (%) EBIT (m ) and EBIT margin (%) Net profit (m ) and net margin (%) Interest bearing net debt (m ) and gearing (%) 3


4 GENERAL OVERVIEW Group Operating Cash Flow and Free Cash Flow Cash flow from operations: m in 2013 CapEx 83,6 m lower than previous year Free cash flow m Free cash flow m excl. additional tax Group Cash Flow From Operations and Free Cash flow Monthly cumulative Group Cash flow from operations Manufacturing Cash flow from operations 4
5 GENERAL OVERVIEW OF 2013 Improved market shares and solid margins in challenging conditions Key figures, EUR million 10-12/ /12 Change% Change% Net sales , , Operating profit 93.2 (* (* Profit before tax Result for the period (** (** Earnings per share, EUR Equity ratio, % Cash flow from operations RONA,% (roll. 12 months) Gearing, % Summary Market share and market leadership improved in Russia and Nordic countries. In CE faster-than-market growth. Strong sales mix with new test-winning Hakkapeliitta range Good profitability Strong tailwind from raw material cost Increased share of Russian production Flat ASP in a tight pricing environment Industrial structure improving further: new lines 12 & 13 Russian capacity to > 15 million tyres by end 2013 Expanding distribution Vianor 1,206 stores in 27 countries, +169 stores in 2013 In Russia 3,300 stores within Nokian dealership programs Nokian Authorized Dealers (NAD) network with 432 stores building up in Europe and China *) Incl. bad debt provision of 8.4 m in Q4, (full year 14.3 m ) **) Incl. additional tax of m in Q4 Outlook 2014: Profitable growth Car tyre demand: growth in Nordics and CE, Russia flat Nokian Tyres sales targeted to grow in all main market areas Pricing environment 2014 tight for all tyre categories Further improved product offering with new Hakkapeliitta range supports winter tyre sales and ASP Raw material cost ( /kg) -5% full year 2014, tailwind of 22 m vs Profitability supported by improved cost structure and productivity on the back of increasing share of Russian production Year 2014 guidance: In 2014, the company is positioned to show growth in Net sales and Operating profit. 5
6 MARKET OVERVIEW OF 2013 Signs of recovery in global economy and tyre business in H2 Car tyres Heavy tyres Currencies Raw material prices Challenging markets, positive signals going forward Signs of recovery in global economy Economies in the Nordic countries and Russia relatively stable New car sales in Russia -5%, Europe -2%, Nordics -3% yoy Car tyre demand picked up in Europe in H2; 2013 still -1% (winter -5%) yoy. Demand in Nordics -2%, in Russia premium -9% with weak summer tyre season. Pricing environment in 2013 challenging Uncertainty continue in heavy tyres markets Demand soft in all product groups Forestry and radial industrial tyre demand started to pick up in Q4/2013 RUB weakened against EUR RUB weakened from EUR/RUB to during 2013 Raw material prices stabilizing on current level Nokian Tyres raw material cost ( /kg) down by 12.9% vs Raw material cost to decrease by 5% in 2014 vs. 2013, tailwind 22 m 6
7 NOKIAN TYRES PERFORMANCE 2013 Winter tyre sales and market shares up, profitability intact Sales and market position Profitability Production Winter tyre sales and market share up in the core markets + Sales growth in Nordic countries and in winter tyres + Car tyres market share improved in all markets + New Hakkapeliitta range a success in the markets + Test success continued, both in winter and summer tyres - Sales down due to soft demand in CE (H1) and Russia (H2) Tailwind from decreasing raw material cost, improved productivity + Raw material cost down 12.9% yoy + Increasing share of Russian production improved productivity + Average Selling Price ( /kg) practically on par with Winter tyres 79% (74%) of sales volume in 2013 supported mix and ASP - Negative effect from weakened RUB rate - Commissioning of the new factory in Russia increased depreciation - Bad debt provision of 14.3 m booked in Net profit hit by m additional taxes in Finland from years Capacity increases continued + Line 12 in Russia commenced production in Q1/2013, line 13 installed in Q2/ Utilization rate of production capacity down Distribution Vianor expanding as planned, new partner concepts booming + Vianor expanded to 1,206 stores in 27 countries; +169 stores in Nearly 3,300 tyre stores in Nokian dealership programs in Russia + Nokian Authorized Dealer (NAD) network comprises of 432 stores in Italy, Germany, Ukraine, Bulgaria and China 7

8 INDEX 1. General overview 2. Nokian Tyres financial performance Operating result per quarter Gross sales by market area Raw material cost development 3. Profit centres (incl. Russian operations) 4. Nokian Tyres going forward 5. Appendixes Ari Nieminen and Aki Panula, Nokia factory. 8
 2013 Net sales 1,521.0 m, (1,612.")
 Net sales 411.8 m, (446.")
9 FINANCIAL PERFORMANCE Group Operating profit per quarter Cumulative Operating profit per review period (m ) 2013 Net sales 1,521.0 m, (1,612.4 m ) -5.7% EBIT m, (415.0 m ) -7.1% 10-12/2013 Group Operating profit per quarter (m ) Net sales m, (446.4 m ) -7.7% EBIT 93.2 m, (111.8 m ) -16.6% 9


10 FINANCIAL PERFORMANCE Gross sales by market area 2013 Sales of Nokian Tyres Group: 1,665.7 m, -3.8% Sales of Manufacturing Units: 1,453.3 m, -4.3% GROUP Sales development in euros Nordic countries +1.5% Russia and CIS -4.9% Other Europe +5.8% (* North America +0.1% MANUFACTURING Sales development in euros Nordic countries +2.6% Russia and CIS -4.9% Other Europe +5.7% (* North America +0.3% *) Excluding contract manufacturing 10
11 EUROPEAN MARKET DATA ESTIMATES Car tyre replacement market volume & Nokian Tyres market shares 11
 Nokian Tyres raw material cost ( /kg) Raw material cost decreased by 15.4% in Q4/2013 vs.")

12 FINANCIAL PERFORMANCE Raw material cost development Raw material cost development index 2000-E2014 Value of raw material consumption (%) Nokian Tyres raw material cost ( /kg) Raw material cost decreased by 15.4% in Q4/2013 vs. Q4/2012 decreased by 16.1% in H2/2013 vs. H2/2012 decreased by 12.9% in 2013 vs Raw material cost is estimated to Stay stable in Q1/2014 vs. Q4/2013 decrease by 16% in Q1/2014 vs. Q1/2013 decrease by 5% in 2014 vs Estimated tailwind 22 m in 2014 vs
 Vianor and NAD Heavy Tyres Truck Tyres 4. Nokian Tyres going forward 5.")
13 INDEX 1. General overview 2. Nokian Tyres financial performance 3. Profit centres General overview Passenger Car Tyres (incl. Russian operations) Vianor and NAD Heavy Tyres Truck Tyres 4. Nokian Tyres going forward 5. Appendixes Stella Sharmatava and Anna Onufrieva, Vsevolozhsk, Russia 13
 Key products: studded and non-studded winter tyres, highspeed summer tyres Vianor Net sales: 312.5 m ; -0.9% EBIT: -1.8 m EBIT margin: -0.6% (-0.")
14 PROFIT CENTRES General overview 2013 Net sales 1,521.0 m ; -5.7% EBIT m ; -7.1% Share of sales Passenger Car Tyres Net sales: 1,137.0 m ; -6.8% EBIT: m ; -7.8% EBIT margin: 33.3% (33.7%) Key products: studded and non-studded winter tyres, highspeed summer tyres Vianor Net sales: m ; -0.9% EBIT: -1.8 m EBIT margin: -0.6% (-0.0%) 1,206 stores in 27 countries in Nokian Tyres core markets 183 equity-owned stores consolidated in result Heavy Tyres Net sales: 95.7 m ; -8.4% EBIT: 10.3 m ; -9.3% EBIT margin: 10.7% (10.8%) Key products: tyres for forestry, industrial and agricultural machinery Truck Tyres Net sales: 54.0 m ; +2.2% EBIT: 10.1 m ; +17.6% Key products: truck tyres and retreading materials 14

15 PROFIT CENTRES Car Tyres 2013: Successful new products, market shares up Performance in Market share growth in Russia, Nordics and CE + Magazine test winning streak continued with winter and summer tyres + New Nokian Hakkapeliitta range a success in the markets + ASP /kg almost flat -1.4% yoy despite tight pricing environment + Tailwind from decreasing raw material cost supported margins + Capacity increased with new lines 12 and 13 in Russia Sales decreased - Manufacturing contract with Bridgestone ended - RUB exchange rate development unfavourable - Fixed costs increased due to depreciations from the new factory Net sales: 2013: 1,137.0 m (1,220.1 m ); -6.8% 10-12/2013: m (304.2 m ); -10.7% EBIT: 2013: m (410.8 m ); -7.8% 10-12/2013: 75.3 m (94.1 m ); -20.1% EBIT margin: 2013: 33.3% (33.7%) 10-12/2013: 27.7% (30.9%) Key actions and targets for 2014 Increase sales with renewed product offering Improve market shares in core markets Expand distribution, special focus CE Improve sales mix & service level Defend brand and price position Improve productivity and utilization of capacities Secure collection of receivables Limit fixed cost growth Beat market growth in car and SUV tyre sales, improve price position with new products, expand distribution, improve productivity and capacity utilization Higher sales Higher ASP Lower cost Higher RONA New Nokian Hakkapeliitta 8 15

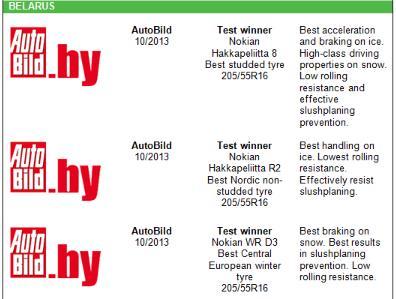
; Auto, Motor & Sport, Aftonbaldet BIL, Vi Bilägare, Motorföraren (Sweden); Auto, Motor og Sport, NAF/Motor (Norway); AutoReview, Za Rulem, (Russia);")
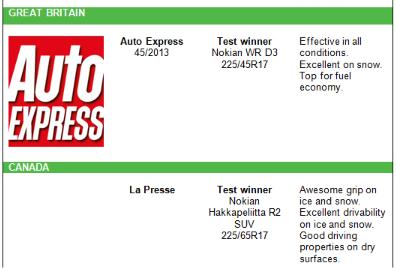
; AutoCentre (Ukraine), AutoBild (Belarus), Za Rulem (Russia), Auto, Motor og Sport (Norway), La Presse (Canada) New Nokian WR SUV 3 Ultimate snow")

16 MAGAZINE TESTS 2013 Test success continues both in summer and in winter WINTER TYRES, autumn 2013 OVER 20 TEST VICTORIES Nokian Hakkapeliitta 8 New multiple test winner - Studded winter tyre family for core markets: Ruler of the North Test victories in magazine tests, e.g.: Tekniikan Maailma, Tuulilasi (Finland); Auto, Motor & Sport, Aftonbaldet BIL, Vi Bilägare, Motorföraren (Sweden); Auto, Motor og Sport, NAF/Motor (Norway); AutoReview, Za Rulem, (Russia); AutoCentre (Ukraine); Autobild (Belarus) New Nokian Hakkapeliitta R2 Northern Comfort - Non-studded winter tyre family for core markets Test victories in magazine tests, e.g.: Tuulilasi, Auto Bild (Finland); Vi Bilägare, Teknikens Värld, Auto,Motor&Sport (Sweden); AutoCentre (Ukraine), AutoBild (Belarus), Za Rulem (Russia), Auto, Motor og Sport (Norway), La Presse (Canada) New Nokian WR SUV 3 Ultimate snow and slush performance - New high-performance SUV tyre for Central European winter Test victories e.g.: OFF Road, SUV Magazin (Germany) Nokian WR D3 Forget the Forecasts - Reliable winter tyre for Central Europe Reached highest recommendation good by ADAC and Stiftung Warentest; Highly recommended by TCS and ÖAMTC, AutoZeitung; Especially recommended by Auto Motor und Sport; Recommended by AutoBild, autotest, Auto Bild allrad (Germany); Test winner, AutoBild (Belarus), Motor News (Ukraine), Auto Express (UK) Nokian Hakkapeliitta 8: Superior test winner in Nordic countries and Russia Minimum 35% of car tyres net sales are new products Technological leadership High investment on winter tyre development & testing SUMMER TYRES, spring 2013 Nokian Hakka Blue Test victory: Tuulilasi (Finland) Nokian Hakka Green and Nokian Hakka SUV Test victories: Za Rulem (Russia), Auto Centre (Ukraine) New Nokian Hakkapeliitta R2 Nokian Line NEW Test victories or best reviews e.g.: Auto Bild, auto TEST, Auto, Motor & Sport, ADAC, Stiftung Warentest (Germany) 16
 in the business provides grip like never before on ice and snow.")


17 BRAND NEW PRODUCTS IN 2014 Nokian Hakkapeliitta 8 SUV Provides grip and durability like never before The Nokian Hakkapeliitta 8 SUV, the new studded tyre for SUVs, uses completely new innovations to tame the extremes of the Northern winter. The most modern stud technology (Nokian Eco Stud 8 Concept) in the business provides grip like never before on ice and snow. The durability of the sidewall is optimised by means of aramid fibres (Nokian Aramid Sidewall technology), widely used in the aerospace and defence industries. Nokian Hakkapeliitta C3 Winter grip and efficiency for professionals The new Nokian Hakkapeliitta C3 studded tyre makes life easier for heavy duty professionals. These durable studded tyres can master harsh winter conditions; in addition to the balanced winter grip that is synonymous with the Hakkapeliitta brand, it offers stable handling The new square steel stud ensures excellent winter grip The steel belt package and rubber compound, optimised for heavy use, provide structural durability and high-end performance for the rough Northern roads Nokian Hakkapeliitta CR3 Driving comfort for demanding professional use The new Nordic non-studded winter tyre, Nokian Hakkapeliitta CR3, is developed for versatile use on delivery vehicles and vans. It provides excellent winter grip and driving comfort. In addition to the extremely low rolling resistance, developments have also been made in handling on ice, snow, and wet roads. The new non-studded van tyre effectively utilises the Nokian Cryo Crystal Concept that was used to maximise the ice grip of the Nokian Hakkapeliitta R2 passenger car tyre. Nokian Hakkapeliitta 8 SUV Nokian Hakkapeliitta C3 Nokian Hakkapeliitta CR3 17


18 MAJOR REVAMP OF PRODUCT OFFERING 2013 Car tyres - examples of new products and innovations 1(2) Nokian Hakkapeliitta 8 Ruler of the North Nokian Hakkapeliitta 8 is a superior test winner in Nordics and Russia. Nokian Hakkapeliitta 8 winter grip like never before has won practically all winter tyre magazine tests The ground-breaking stud distribution and the Eco Stud 8 Concept create fantastic winter properties: supreme grip during braking and acceleration, better wear resistance, and peace of mind through driving comfort. The design of this next-generation studded Hakkapeliitta tyre is based on the Nokian Hakkapeliitta 7. This multiple test winner holds a world record in its field: over 30 test wins in car magazines between 2009 and Nokian Hakkapeliitta R2 Northern comfort The new non-studded winter tyre, will safely tackle even the trickiest winter conditions. The new innovations like Nokian Cryo Crystal Concept maximise the grip of this Nordic nonstudded tyre on ice. Nokian Hakkapeliitta R2 is the number one choice for those who value unique driving comfort and eco-friendly travelling. In addition to the extremely low rolling resistance, developments have also been made in handling on ice, snow, and wet roads, all for the benefit of drivers. Nokian Hakkapeliitta R2 SUV Northern comfort and stability for SUVs The non-studded Nokian Hakkapeliitta R2 SUV winter tyre, specially tailored for sport utility vehicles. The new innovations, like Nokian Cryo Crystal Concept, in the tread patterns and compounds of this stable, rugged new product ensure that the Nokian Hakkapeliitta R2 SUV s handling and grip properties are top-notch. Nokian WR SUV 3 Ultimate snow and slush performance Developed for Central Europe s varying winter conditions and the ever-increasing SUV segment Nokian WR G3 Forget the Forecast An extension of the Nokian Tyres All Weather Plus product line for the North American market New range puts winter grip on an awesome new level! Nokian Hakkapeliitta 8 Nokian Hakkapeliitta R2 Nokian Hakkapeliitta R2 SUV 18

 and Y (300 km/h) speed categories Nokian zline Ultra High Performance summer tyre for Central Europe New top class tyre family for varying Central European")

19 MAJOR REVAMP OF PRODUCT OFFERING 2013 Car tyres - examples of new products and innovations 2(2) Nokian Hakka Black Ultra high Performance summer tyre for core markets Cool performance for fast driving, stable and precise driving feel Tailor-made for the northern roads, the newest member of the Hakka summer tyre range offers optimal handling and safety in demanding driving situations The new innovations, Multi-layered structure, Nokian Intelligent UHP Silica, Hydro Grooves and Silent Groove Design. Top performance in both the W (270 km/h) and Y (300 km/h) speed categories Nokian zline Ultra High Performance summer tyre for Central Europe New top class tyre family for varying Central European summer conditions New Nokian zline - sporty, cool performance for fast driving Precise driving feel, uncompromisingly safe and comfortable travel Nokian Hakka Black Nokian Line Safety and top performance for wet roads Offers the best possible traction and precise handling especially for wet roads, for varying Central European driving conditions The new innovations maximize wet grip, the Cross-Block sipes and Surge Grooves The structural solutions and tread design were tailored to rise to the challenge of the different fast speeds in T, H, V and W speed categories Nokian zline Nokian WR Winter tyre for Central Europe Advanced new-generation tyre family for any winter weather Environmentally friendly premium products feature nanotechnology, canola oil and the solid winter expertise of Nokian Tyres Nokian WR D3 for the economic driver, Nokian WR A3 for sporty use Nokian WR 19
 56.6 m (43.7 m ), up 29.5%. Nokian Tyres: Higher market share, improved supply capacity, expanding distribution Nokian Tyres is clear market leader in premium tyres in Russia and CIS countries 20")
20 RUSSIA & CIS Market shares and winter tyre sales up Sales in Russia in 2013 down by 7.6% to m (563.0 m ) - GDP growth rate 1.3%, new car sales -5% - A+B segment tyre demand down 9%; summer --, winter +-0 Sales in CIS (excluding Russia) 56.6 m (43.7 m ), up 29.5%. Nokian Tyres: Higher market share, improved supply capacity, expanding distribution Nokian Tyres is clear market leader in premium tyres in Russia and CIS countries 20

21 RUSSIA & CIS Distributors, DSD-warehouses, Vianors and other partners: 621 Vianor stores (+88 in 2013) in Russia nearly 3,300 retail partner points of sale Distributors (35) DSD current cities (Moscow, SPb, Samara/Togliatti, Yekaterinburg, Chelyabinsk, N.Novgorod, Omsk, Rostov-on-Don, Perm, Ufa, Orenburg, Kazan, Voronezh, Tyumen, Volgograd, Novosibirsk) 621 Vianor stores in 363 cities; +18 stores in Q4/2013 Nokian dealership programs include nearly 3,300 tyre stores and car dealers in Russia 21
22 RUSSIA Nokian Tyres is the strongest player in Russia Nokian Tyres market position in Russia State-of-the-art and efficient factory in Russia - Close access to markets - Within customs zone (duty 18% in 2013 will decrease to 10% in 4 years) Clear market and price leader in core product categories Widely recognised and strong brand both company (Nokian Tyres) and products (Hakkapeliitta, Nordman) Strong distribution chain covering all of Russia based on long-term and close customer relationships The biggest controlled tyre distribution network 621 Vianor stores/ nearly 3,300 partner stores in Russia Nokian Tyres continues to strengthen its market leader position in Russia Nokian Tyres factories in Russia At the beginning of 2013 annual capacity in Russia was 14 million tyres with 2 factories, 11 lines operating and line 12 installed Line 12 commenced production in Q1/2013 Line 13 installed in Q2/2013 Annual capacity to >15 million tyres by end 2013 State-of-the art machinery, high automation level and European quality standards Vsevolozhsk factories export approximately 50% of its production to over 40 countries: Biggest consumer goods exporter in Russia Housing project, Hakkapeliitta Village 343 flats for employees commenced in summer 2013 Number of personnel in Russia on 31 December 2013: 1,319 (1,252) CAPEX by end 2013: 796 m 22

23 RUSSIA Russia s economy growing, but with a slower pace Russia s GDP growth CAGR 13 18: 8.6% Mean 13 18: 3.2% Consumer confidence in Russia quarters Source: Rosstat; Ministry for Economic Development; EIU; Nokian Tyres estimates Major trends and expectations After a severe crisis of , Russia s economy grew by ~4% a year in In 2013 the economy clearly slowed down: the estimated real GDP growth in 2013 was a modest 1.3%, reflecting weaker investment and consumer consumption The growth is expected to speed up to % in 2014 Overall growth trend is likely to continue unless major external shocks (e.g. collapse of oil prices) take place: in the base scenario, average GDP growth for is estimated at 3-4% a year Consumer confidence has stabilized and practically reached its normal level in 2013, although by the yearend it slightly declined; consumer spending and retail sales remain sluggish After the stabilization in early 2013 the ruble devalued in late 2013, especially against the euro (down to EUR / RUB), in early 2014 the devaluation continued, driven by the overall trend of weakening emerging markets currencies and the unrest in the neighboring Ukraine; further expectations vary a lot, with some experts predicting continued devaluation of the ruble and some (e.g. EIU) expecting gradual strengthening of the ruble back to the level of EUR / RUB 23


24 RUSSIA Decline in car sales is turning into modest growth Russian car sales forecast base scenario Monthly car sales Car market summary Sales of new cars and LCVs in Russia continued to grow in 2012, albeit with a clearly declining growth in H2; full-year growth was 11% vs Year 2013 started quite slowly, as expected: the zero growth in Q1 turned into a decline in Q2; totally 5% less cars were sold in 2013 vs. 2012, in Dec the decline turned into modest growth of 4% As the result, the Russian new car and LCV market reached 2.78 million units sold in 2013 The completed government program of subsidizing car loans has supported the car market in 2013, especially in the budget segment The first signs of market improvement are visible dynamics is more positive now than a few months ago and the structure of the market is improving, with foreign brands / more expensive cars gaining share (the Lada brand shows a bigger decline than foreign brands) However, the growth is expected to be cautious, in line with the overall economy and consumer spending: for 2014 the baseline is the same result as in 2013, with both slight decline and growth still possible This slowdown of the car market is seen as a temporary phase, not a sign of fundamental maturity of the market as global and Russia economies improve, the car market will continue to grow, as the unrealized potential has not disappeared Source: AEB; IHS Global Insight; Nokian Tyres estimates Jan

 Car (value)")
25 RUSSIA Growth of tyre market slowed down, but potential still exists Car and van tyre replacement market (volume) Car and van tyre replacement market (value)

26 PROFIT CENTRES Vianor 2013: Network of shops expands Performance in ,206 stores in 27 countries; +169 stores in Strategic tasks to expand distribution and set market prices for Nokian products succeeded + 45 car service operations acquired and integrated to existing Vianor stores by the end of Service revenues increased Sales and EBIT negative due to the black winter until early 2014 Key actions and targets for 2014 Improve tyre sales and market shares Increase sales of car services, tyre hotels and other services Increase e-commerce sales Continue to expand the network and the number of partners Target: 1,340 stores by the end of 2014 Equity-owned Vianor (183 stores) Net sales: 2013: m (315.3 m ); -0,9% 10-12/2013: m (121.3 m ); -3.3% EBIT: 2013: -1.8 m (0.0 m ); % 10-12/2013: 12.8 m (-11.8 m ); 8.7% EBIT margin: 2013: -0.6% (0.0%) 10-12/2013: 10.9% (9.7%) Cement and improve market leader position as a distributor in Nokian Tyres core markets Vianor Friedrichshafen, Germany 26
 Largest tyre chain in Russia and CIS: 621 stores (+88 in 2013)")
27 EXPANSION OF DISTRIBUTION CHANNEL 2013 Vianor: Foothold on core markets strengthening, +169 shops NAD: New soft franchise launch, 432 shops Vianor 1,206 stores in 27 countries 169 new stores in 2013; +45 in Q4/ equity-owned, 1,023 franchising/partners Largest tyre chain in Nordic and Baltic countries: 297 stores (+26 in 2013) Largest tyre chain in Russia and CIS: 621 stores (+88 in 2013) in 363 cities Expansion to Central Europe: 238 stores (+40 in 2013) Vianor stores by segment Car tyres: over 1,100 stores Heavy tyres: over 260 stores Truck tyres: over 320 stores Target 2014 over 1,340 Vianor stores Nokian Authorized Dealers (NAD) 2013: 432 stores in Italy, Germany, China, Bulgaria and Ukraine Estimate 2014: double the amount of stores Vianor Distribution spearhead for all product groups NAD Nokian Authorized Dealer 27


28 EXPANDING DISTRIBUTION Nokian Authorized Dealers (NAD) Requirements for NADs Minimum purchases from Nokian Tyres and a strong visibility in the store Professional tyre services Soft Nokian Tyres outdoor branding, indoors Nokian Tyres shop-in-shop Benefits for NADs NAD terms and conditions Product seminars, launch events Advertising materials, web visibility Target 2014 To double the amount of stores from current

29 PROFIT CENTRES Heavy Tyres 2013: Improved structure, recovering forestry tyre demand in Q4 Performance in Structural changes in manufacturing reduced manning and improved product quality, flexibility, and productivity + ASP was flat yoy despite challenging market situation + Lower raw material cost supported margins + Productivity improved + Forestry tyre order book started to grow in Q4 Sales down due to weaker demand and machine building in Europe Production adjusted to demand; profitability suffered from lower utilization rate Net sales: 2013: 95.7 m (104.4 m ); -8.4% 10-12/2013: 25.1 m (25.9 m ); -2.8% EBIT: 2013: 10.3 m (11.3 m ); -9.3% 10-12/2013: 2.7 m (1.4 m ); -91.2% EBIT margin: 2013: 10.7% (10.8%) 10-12/2013: 10.8% (5.5%) Key actions and targets for 2014 Increase sales, especially in forestry, radial and truck winter tyres Improve sales mix and share of replacement market sales Expand the distribution network, especially in Russia and CIS Accelerate development of new radial products Finalize factory modernization project Optimize production output Increase sales, optimize production output and improve productivity Nokian Mine L-5S 29
; +2.2% 10-12/2013: 14.8 m (14.6 m ); +1.6% EBIT: 2013: 10.1 m (8.6 m ); +17.")
30 PROFIT CENTRES Truck Tyres 2013: Market shares up in core markets Performance in Sales and market share improved in Nordics and Russia + Wider range for premium & standard truck tyres + Operating profit on a healthy level Net sales: 2013: 54.0 m (52.9 m ); +2.2% 10-12/2013: 14.8 m (14.6 m ); +1.6% EBIT: 2013: 10.1 m (8.6 m ); +17.6% Key actions and targets for 2014 (as part of Heavy Tyres profit centre) Increase sales and market shares in core markets Expand in Eastern Europe utilising the Vianor truck concept Utilize the combination of new & retreaded tyres as a sales concept Utilize the stronger winter product range (incl. Hakkapeliitta truck tyres) Optimize off-take contract manufacturing Focus on increasing sales, improving market shares and expanding distribution Nokian Hakkapeliitta Truck D 30

31 INDEX 1. General overview 2. Nokian Tyres financial performance 3. Profit centres (incl. Russian operations) 4. Nokian Tyres going forward Investments Production plants Outlook for Appendixes Dmitry Maslatsov and Evgeniy Dubovitskiy, Vsevolozhsk 31
32 NOKIAN TYRES GOING FORWARD Investment for growth and productivity Investments in m (209.2 m ) Nokian Tyres Capital expenditures (m ) Russia Capacity ramp-up and investments 12 lines in production since Q1/2013 Line 13 installed Q2/2013, in production H2/2013 Hakkapeliitta Village 2 nd stage completed 2013 Estimated investment for 2014 Approximately 116 m Russia: 42 m % of Net Sales % of Depreciations 32


 commenced production Own electricity generation 2013: Line 12 on stream in March 2013 Line 13 installation in")
33 PRODUCTION PLANTS Production capacity in 2013: 18 million tyres Potential to increase output by 50% in existing factories Nokia, Finland R&D, administration and marketing Development of key processes Prototype production batches Special car tyres Heavy tyres, retreading materials Export to western markets 2010: Car tyres to 6-day shift system Heavy tyres to 7-day full capacity utilisation 2011: Car tyres to 7-day shift system in August Investments for increasing productivity through automation Expansions in Heavy tyres factory : Car tyres 5-day shift system Temporary production cuts Vsevolozhsk, Russia Production of the whole car tyre range with state-of-the-art production technology and lower production costs Tax relieves Inside the duty borders of Russia and CIS Export to all markets Possibility to expand in current premises & land area 2010: Lines 7 and 8 were taken into use 2011: Lines 9 and 10 & new technology into use 2012: New factory next to the current one New line (11) commenced production Own electricity generation 2013: Line 12 on stream in March 2013 Line 13 installation in Q2/
34 NOKIAN TYRES GOING FORWARD Outlook 2014: Profitable growth Assumptions Core markets growing slowly GDP growth 2013 in Russia %, Nordics 2% New car sales growth in CE and Nordic countries New car sales flat in Russia Weakened RUB Price pressure limits ASP growth Raw material cost ( /kg) to decline Cost to decrease by 16% in Q1/2014 vs. Q1/2013 Cost to decrease by 5% in 2014 vs Passenger car tyre markets Demand in Nordic countries to grow 2-4% Demand in CE countries countries to grow 5-8% Demand in Russia & CIS to grow 0-3% Demand improving for winter tyres long term; legislation in Europe, Russia & CIS Outlook 2014: Profitable growth Car tyre demand: growth in Nordics and CE, Russia flat Nokian Tyres sales targeted to grow in all main market areas Pricing environment 2014 tight for all tyre categories Further improved product offering with new Hakkapeliitta range supports winter tyre sales and ASP Raw material cost ( /kg) -5% full year 2014, tailwind of 22 m vs Profitability supported by improved cost structure and productivity on the back of increasing share of Russian production Year 2014 guidance: In 2014, the company is positioned to show growth in Net sales and Operating profit. Heavy tyre market demand Demand to improve in Nokian core product groups Nokian Tyres financial position remains solid Equity ratio 67.6% at the end of 2013 Undrawn facilities available Convertible bond 150m due June
35 INSTRUCTIONS TO CONFERENCE CALL ATTENDEES Please press * and 1 to inform the operator that you have a question to the speaker. 35

36 INDEX 1. General overview of Nokian Tyres financial performance 3. Profit centres (incl. Russian operations) 4. Nokian Tyres going forward 5. Appendixes Other sales areas Board s proposals to AGM Dividend Board s proposals to AGM Members of the Board of Directors, remuneration and auditor Major shareholders Share price development Competitor comparison Magazine test results Winter tyre legislation in Europe Personnel Financing: Loans and Net Financial Expenses Tables of financial figures 36
 with more than 60% market share Nokian Tyres (manufacturing) Sales in Nordic Countries NOKIAN TYRES Market/price leader with about 37% market share in winter")
37 APPENDIX Nordic countries (FI,SE,NO): Market&price leader gross sales 401 m GENERAL Mature market with estimated annual growth 1-3% Winter tyre legislation use compulsory Three dominating brands (Nokian Tyres, Michelin and Continental) with more than 60% market share Nokian Tyres (manufacturing) Sales in Nordic Countries NOKIAN TYRES Market/price leader with about 37% market share in winter tyres and roughly 20% in summer tyres Only local producer & best distribution network Strong role of own Vianor tyre chain; 271 stores Local player product range and service specially designed for northern conditions The new Nokian Hakkapeliitta 8 studded tyre has dominated impartial winter tyre tests which has boosted sales. 37

38 APPENDIX Other Europe: Improving market position gross sales 374 m GENERAL Total of 32 European countries excluding FI, SE, NO, RU and CIS-countries Globally the biggest winter tyre market potential 12 times that of Nordic Countries Winter tyres is the fastest growing segment in CEE and Balkans Tyre market down by 1% in 2013 Nokian Tyres Manufacturing Sales in Other Europe, (excl. contract manufacturing) NOKIAN TYRES Nokian Tyres brand and price position improving Vianor expansion to Europe 238 stores Improved availability and distribution Logistics and service centre with 24 hour service to main markets Tailored product range 38
 Sales in North America NOKIAN TYRES Strong brand and product quality reputation in the winter tyre areas Exclusive distribution in selected")
39 APPENDIX North America: Stable 2013 gross sales 113 m GENERAL Canada & US snow belt area Market potential for winter tyres twice that of the Nordic Countries Winter tyre legislation in Canada supports the growth of demand Nokian Tyres (manufacturing) Sales in North America NOKIAN TYRES Strong brand and product quality reputation in the winter tyre areas Exclusive distribution in selected areas Strong historical presence Establishment of Vianor in New England 50 stores in North America 39
40 APPENDIX: BOARD S PROPOSALS TO AGM Dividend Board s proposal 1.45 /share Dividend: Parent company s distributable funds m The Board of Directors proposes to the Annual General Meeting that a dividend of EUR 1.45 per share be paid for the fiscal year 2013 Annual General Meeting on 8 April, 2014 Record date 11 April, 2014 Payment Date 25 April,
41 APPENDIX: BOARD S PROPOSALS TO AGM Members of the Board of Directors, remuneration and auditor The Nomination and Remuneration Committee s proposal for members of the board Seven members Five current Board members to continue: Kim Gran, Hille Korhonen, Hannu Penttilä, Risto Murto and Petteri Walldén New members: Raimo Lind and Inka Mero Kim Gran is the President and CEO of the company. The other Board members are independent of the company. All Board members are independent of any major shareholders of the company. Remuneration (unchanged): The monthly fee paid to the Chairman of the Board would be EUR 80,000 per year, and the monthly fee paid to Members of the Board EUR 40,000 per year 50% of the annual fee be paid in cash and 50% in company shares to the effect that in the period from 9 April to 30 April 2014, EUR 40,000 worth of Nokian Tyres Plc shares will be purchased at the stock exchange on behalf of the Chairman of the Board and EUR 20,000 worth of shares on behalf of each Board Member Each member of the Board will receive a meeting fee of EUR 600 per each possible attended meeting It is proposed not to pay a separate compensation to the President and CEO for Board work Board s proposal for the auditor: Authorised Public Accountant KPMG Oy Ab Jari Härmälä, Authorised Public Accountant, acting as the auditor with principal responsibility Fees according to current practice 41


42 APPENDIX Major shareholders as of 31 December, 2013 Number of Share of Change from Major Domestic Shareholders Shares Capital (%) previous month 1 Varma Mutual Pension Insurance Company , Ilmarinen Mutual Pension Insurance Company , Nordea , Nordea Nordenfonden , OP Investment Funds , The State Pension Fund , Mandatum Life Insurance Company Limited , Tapiola Mutual Pension Insurance Company , Svenska litteratursällskapet i Finland r.f , Schweizer Nationalbank , Major Domestic Shareholders total ,8 Foreign Shareholders 1) ,3 Bridgestone Corporation 2) 20,000, Division by Category as of 31 December, 2013 Total number of shares: 133,287,096 1) Includes also shares registered in the name of a nominee; 2) In the name of a nominee. Shareholder development by category Q4/ Q4/2013 Note: Options, outstanding (31 December, 2013) 2010A: 266,394 (77,689 in company's possession) 2010B: 1,339,960 (126,890 in company's possession) 2010C: 1,340,000 (94,130 in company's possession) 2013A: 1,150,000 (82,634 in company's possession) Nominee registered General government Household Finance and insurance 42

43 APPENDIX Comparing share price to main indexes 1/ Jan 2014 Nokian Tyres, +821% Competitors, +280% 1) RTS, +262% OMX Hel Cap, +77% Source: Thomson Reuters, as of 3 Feb The composite consists of an indexed average values of the main peers of Nokian Tyres. Nokian Tyres by Jan Last 10 years Last 5 years Last 3 years LTM L6M L3M Last month High 38,46 38,46 38,46 38,46 38,46 38,46 36,08 Average 21,31 25,89 31,82 34,55 35,75 35,43 33,97 Low 6,13 7,36 19,89 30,10 31,30 31,30 31,30 43
 has been clearly better than that of the main peers")

 Net margin E2013 Nokian (act.) * 12.1% Michelin 6.7% Bridgestone 7.4% Continental 6.")

44 APPENDIX Competitor comparison 1998-E2013 Nokian Tyres the most profitable tyre producer Nokian Tyres operational performance (growth and profitability) has been clearly better than that of the main peers during the past 15 years. The clearly better profitability protects the company profits during recessions and potential downturns. Net sales change CAGR 2010 E2013 Nokian (act.) 12.9% Michelin 4.5% Bridgestone 7.9% Continental 8.7% *) Net margin E2013 Nokian (act.) * 12.1% Michelin 6.7% Bridgestone 7.4% Continental 6.6% Source: Results (company websites) and 2013 consensus estimates for the peers as per Thomson Reuters 29 Jan COMPETITORS FIGURES 2013 ARE BASED ON CONSENSUS ESTIMATES, NOKIAN TYRES ON ACTUAL FIGURES. *) Nokian Net Result 2013 affected by disputable additional taxes of MEUR in Finland concerning years


45 APPENDIX -Test wins autumn (2) 45


46 APPENDIX -Test wins autumn (2) 46


47 APPENDIX -Test wins spring (2) 47


48 APPENDIX -Test wins spring (2) 48

49 APPENDIX Winter tyre legislation in Europe Source: Nokian Tyres 12/
")

50 APPENDIX Personnel 31 December, 2013 Personnel at the end of the review period Nokian Tyres Group: 4,170 (4,039) Equity-owned Vianor: 1,480 (1,362) Russia: 1,319 (1,252) Natalia Belichenko, Nadezhda Nikiforova and Alexandra Mizintseva, Vsevolozhsk 50


51 APPENDIX Financing: Loans on 31 December 2013, Net Financial Expenses and currency effect Net Financial Expenses Q4/2013: 35.6 m (Q4/2012: 7.6 m ) 51
")
 Manufacturing")


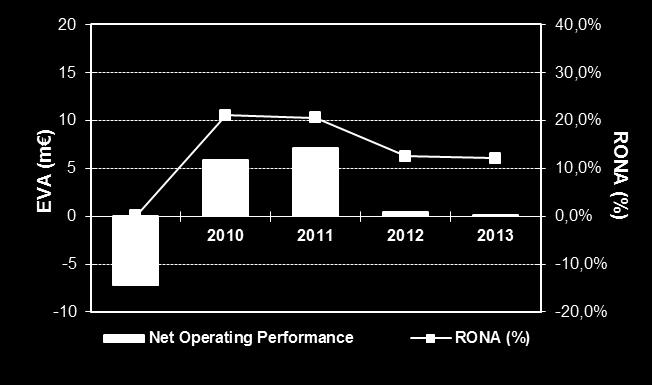
52 APPENDIX RONA (%) and Net operating performance (EVA) 1) Group EVA (m ) and RONA (%) Manufacturing EVA (m ) and RONA (%) Passenger Car Tyres EVA (m ) and RONA (%) Heavy Tyres EVA (m ) and RONA (%) 1) EVA is calculated based on 12% interest on capital employed. 52
53 APPENDIX Consolidated Income Statement Million euros 10-12/ / / /12 Change % Net sales , , Cost of sales Gross profit Other operating income Selling and marketing expenses Administration expenses Other operating expenses Operating profit Financial income Financial expenses ( Profit before tax Tax expense (2 ( Profit for the period Attributable to: Equity holders of the parent Non-controlling interest Earnings per share from the profit attributable to equity holders of the parent basic, euros diluted, euros ) Financial expenses in 10-12/13 and 1-12/13 contain EUR 20.2 million expensed punitive interests for tax reassessment decisions on years ) Tax expense in 10-12/13 and 1-12/13 contains EUR 80.1 million expensed additional taxes with punitive tax increases for tax reassessment decisions on years ) Otherwise tax expense in the consolidated income statement is based on the taxable result for the period. 53
54 APPENDIX Consolidated Other Comprehensive Income Million euros 10-12/ / / /12 Profit for the period Other comprehensive income, items that may be reclassified subsequently to profit and loss, net of tax: Gains/Losses from hedge of net investments in foreign operations Cash flow hedges Translation differences on foreign operations Total other comprehensive income for the period, net of tax Total comprehensive income for the period Total comprehensive income attributable to: Equity holders of the parent Non-controlling interest
55 APPENDIX Key Ratios KEY RATIOS Change % Equity ratio, % Gearing, % Equity per share, euro Interest-bearing net debt, mill. euros Capital expenditure, mill. euros Depreciation, mill. euros Personnel, average 4,194 4,083 Number of shares (million units) at the end of period in average in average, diluted
56 APPENDIX Consolidated Statement Of Financial Position Million euros 31/12/ /12/2012 Non-current assets Property, plant and equipment Goodwill Other intangible assets Investments in associates Available-for-sale financial assets Other receivables Deferred tax assets Total non-current assets Current assets Total assets 2, ,019.6 Inventories Changes in net working capital arising from operative business are partly covered Trade receivables by EUR 350 million domestic commercial paper programme. Other receivables Current tax assets Cash and cash equivalents Total current assets 1, ,208.9 Equity Share capital Share premium Translation reserve Fair value and hedging reserves Paid-up unrestricted equity reserve Retained earnings 1, ,213.2 Non-controlling interest Total equity 1, ,437.2 Non-current liabilities Deferred tax liabilities Provisions Interest bearing financial liabilities Other liabilities Total non-current liabilities Current liabilities Trade payables Other current payables Current tax liabilities Provisions Interest-bearing financial liabilities Total current liabilities
57 APPENDIX Consolidated Statement Of Cash Flows Million euros 1-12/ /12 Cash flows from operating activities: Cash generated from operations Financial items and taxes Net cash from operating activities Cash flows from investing activities: Net cash used in investing activities Cash flows from financing activities: Proceeds from issue of share capital Change in current financial receivables and debt Change in non-current financial receivables and debt Dividends paid Net cash from financing activities Net change in cash and cash equivalents Cash and cash equivalents at the beginning of the period Effect of exchange rate changes Cash and cash equivalents at the end of the period
58 APPENDIX Consolidated Statement Of Changes In Equity Equity attributable to equity holders of the parent Million euros A B C D E F G H Equity, Jan 1st , ,186.1 Profit for the period Other comprehensive income, net of tax: Cash flow hedges Net investment hedge Translation differences Total comprehensive income for the period Dividends paid Exercised warrants Share-based payments Total transactions with owners for the period Change in non-controlling interest 0.3 1,437.2 Equity, Dec 31th , ,437.2 A = Share capital B = Share premium C = Translation reserve D = Fair value and hedging reserves E = Paid-up unrestricted equity reserve F = Retained earnings G = Non-controlling interest H = Total equity Equity, Jan 1st , ,437.2 Profit for the period Other comprehensive income, net of tax: Cash flow hedges Net investment hedge Translation differences Total comprehensive income for the period Dividends paid Exercised warrants Share-based payments Total transactions with owners for the period Equity, Dec 31th , ,
59 APPENDIX Segment Information Million euros 10-12/ / / /12 Change % Net sales Passenger car tyres Heavy tyres Vianor Other operations Eliminations Total , , Operating result Passenger car tyres Heavy tyres Vianor ,450.8 Other operations Eliminations Total Operating result, % of net sales Passenger car tyres Heavy tyres Vianor Total Cash Flow II Passenger car tyres Heavy tyres Vianor Total
60 APPENDIX Changes in property, plant and equipment and contingent liabilities Million euros Opening balance Capital expenditure Decrease Depreciation for the period Exchange differences Closing balance CONTINGENT LIABILITIES Million euros FOR OWN DEBT Mortgages Pledged assets Guarantees The amount of debts with security ON BEHALF OF OTHER COMPANIES Guarantees OTHER OWN COMMITMENTS Guarantees Leasing and rent commitments Purchase commitments
61 APPENDIX Derivative Financial Instruments Million euros INTEREST RATE DERIVATIVES Interest rate swaps Notional amount Fair value FOREIGN CURRENCY DERIVATIVES Currency forwards Notional amount Fair value Currency options, purchased Notional amount Fair value Currency options, written Notional amount Fair value Interest rate and currency swaps Notional amount Fair value ELECTRICITY DERIVATIVES Electricity forwards Notional amount Fair value
62 APPENDIX Definitions Of Consolidated Key Financial Indicators Earnings per share, euro: Result for the period attributable to the equity holders of the parent / Average adjusted number of shares during the period Earnings per share (diluted), euro: Result for the period attributable to the equity holders of the parent / Average adjusted and diluted number of shares during the period - The share options affect the dilution as the average share market price for the period exceeds the defined subscription price. Equity ratio, %: Total equity x 100 / (Total assets - advances received) Gearing, %: Interest-bearing net debt x 100 / Total equity Equity per share, euro: Equity attributable to equity holders of the parent / Adjusted number of shares on the reporting date Operating margin: Operating result, % of net sales 62

63 Thank you!
A good sales mix, strong market position and raw material tailwind support margins
 A good sales mix, strong market position and raw material tailwind support margins Mr. Kim Gran President and CEO Nokian Tyres plc Nordea Finnish Large Cap Summit 2013 20 November, 2013 1 GENERAL OVERVIEW
EBIT improved in Q3 a good sales mix, strong market position and raw material tailwind support margins
 EBIT improved in Q3 a good sales mix, strong market position and raw material tailwind support margins Interim Report January-September 2013 31 October, 2013 Mr. Kim Gran President and CEO Nokian Tyres
Strong results and improving market position
 Strong results and improving market position SWEDBANK Helsinki Investor Trip 23 August 2012 Mr. Kim Gran President and CEO Nokian Tyres plc GENERAL OVERVIEW Competitor comparison 1998-E2012: Nokian Tyres
Handelsbanken Nordic Large Cap Seminar. September 16, 2015 President and CEO Ari Lehtoranta
 Handelsbanken Nordic Large Cap Seminar September 16, 2015 President and CEO Ari Lehtoranta Index 1. Nokian Tyres in brief 2. Nokian Tyres financial performance 3. Business units and Russian operations
Handelsbanken Russia Seminar
 Handelsbanken Russia Seminar 22 May, 2015 President and CEO Ari Lehtoranta Growth in the west Russia remains challenging Nokian Tyres 2014 Nokian Tyres is the northernmost tyre manufacturer in the world,
Russia going strong targeting growth in a slower market
 Russia going strong targeting growth in a slower market Interim Report January-March 2013 30 April, 2013 Mr. Kim Gran President and CEO Nokian Tyres plc INDEX 1. General overview 1-3/2013 2. Nokian Tyres
IMPROVING POSITION IN CORE MARKETS
 IMPROVING POSITION IN CORE MARKETS SEB Finnish Blue Chip 3 September 2013, Helsinki Mr. Kim Gran President and CEO Nokian Tyres plc GENERAL OVERVIEW Competitor comparison 1998-E2013 Nokian Tyres the most
Position improving in all markets devaluations penalize sales
 Position improving in all markets devaluations penalize sales Handelsbanken Russia Seminar 22 May 2014 Mr. Kim Gran President and CEO Nokian Tyres plc 1 GENERAL OVERVIEW Competitor comparison 1998-E2014
Strong results and cash flow a challenging market ahead in early 2013
 Strong results and cash flow a challenging market ahead in early 2013 Danske Bank Road trip to Russia 12 March, 2013 Mr. Kim Gran President and CEO Nokian Tyres plc GENERAL OVERVIEW Competitor comparison
Position improving in all markets devaluations penalize sales
 Position improving in all markets devaluations penalize sales Result January-March 2014 7 May, 2014 Mr. Kim Gran President and CEO Nokian Tyres plc 1 INDEX 1. General overview 2. Nokian Tyres financial
Economic situation in Russia and CIS impacts results - performance in western markets improved
 Economic situation in Russia and CIS impacts results - performance in western markets improved Interim Report January-September 2014 31 October, 2014 Mr. Ari Lehtoranta President and CEO 1 INDEX 1. General
Russia going strong targeting growth in a slower market. Mr. Kim Gran President and CEO Nokian Tyres plc 15 May, 2013
 Russia going strong targeting growth in a slower market Mr. Kim Gran President and CEO Nokian Tyres plc 15 May, 2013 GENERAL OVERVIEW Competitor comparison 1998-2012 Nokian Tyres the most profitable tyre
Strong growth in western markets - headwind in Russia Interim Report January - June August, 2014
 Strong growth in western markets - headwind in Russia Interim Report January - June 2014 8 August, 2014 Mr. Kim Gran President and CEO Nokian Tyres plc 1 INDEX 1. General overview 2. Nokian Tyres financial
Nokian Tyres the strongest tyre company in Russia. Carnegie Investment Bank 26 May, 2011, Vsevolozhsk
 Nokian Tyres the strongest tyre company in Russia Carnegie Investment Bank 26 May, 2011, Vsevolozhsk Mr. Andrei Pantioukhov General Manager Nokian Tyres Russia GENERAL OVERVIEW: Competitor comparison 1998-2010
Result January-September November, Mr. Kim Gran President and CEO Nokian Tyres plc
 Result January-September 2010 3 November, 2010 Mr. Kim Gran President and CEO Nokian Tyres plc INDEX 1. General overview of 1-9/2010 Summary Market overview Nokian Tyres performance 2. Nokian Tyres financial
ANNUAL GENERAL MEETING 8 April, The New Nokian Hakkapeliitta 7 SUV. Mr. Kim Gran President and CEO Nokian Tyres plc
 ANNUAL GENERAL MEETING 8 April, 2010 The New Nokian Hakkapeliitta 7 SUV Mr. Kim Gran President and CEO Nokian Tyres plc INDEX 1. General overview of 2009 Introduction Market overview Nokian Tyres performance
Nokian Tyres back to growth Conference call of ABG Sundal Collier Sales
 Nokian Tyres back to growth Conference call of ABG Sundal Collier Sales Mr. Kim Gran President and CEO Nokian Tyres plc November, 2010 INDEX 1. General overview 2. Nokian Tyres financial performance 3.
Nokian Tyres: The strongest tyre manufacturer in the Nordic countries and in Russia
 Nokian Tyres: The strongest tyre manufacturer in the Nordic countries and in Russia Nordic consumer discretionary seminar Swedbank New York, 29 September 2011 Mr. Kim Gran President and CEO Nokian Tyres
RESULT JANUARY-JUNE 2009 August 6, Mr. Kim Gran President and CEO Nokian Tyres plc
 RESULT JANUARY-JUNE 29 August 6, 29 Mr. Kim Gran President and CEO Nokian Tyres plc 1 INDEX 1. General overview of 1-6/29 Introduction Market overview Nokian Tyres performance 2. Nokian Tyres financial
Strong results profitable growth back on track
 Nokian Tyres plc Result 2010 9 February, 2011 Strong results profitable growth back on track Mr. Kim Gran President and CEO Nokian Tyres plc INDEX 1. General overview of 2010 Summary Market overview Nokian
Interim Report 1 3/2017
 Interim Report 1 3/2017 May 3, 2017 Interim President and CEO Andrei Pantioukhov Strong start of the year and good prospects for steady growth 1. General overview 2. Nokian Tyres financial performance
Safest tyres for Nordic conditions
 RESULT JANUARY- SEPTEMBER 2005 November 3rd Safest tyres for Nordic conditions 1 CONTENTS 1. Result January September 2005 Page - key figures 3 - market situation 4 - Nokian Tyres Q3 5 - Nokian Tyres performance
ANNUAL GENERAL MEETING
 ANNUAL GENERAL MEETING 12 April, 2012 Mr. Kim Gran President and CEO Nokian Tyres plc NOKIAN TYRES MANAGEMENT APRIL 1, 2012 Kim Gran President and CEO 1995 Pasi Anias Internal auditor 1999 Raija Kivimäki
ANNUAL GENERAL MEETING April 2, 2009
 ANNUAL GENERAL MEETING April 2, 2009 Mr. Kim Gran President and CEO Nokian Tyres plc 1 ANNUAL GENERAL MEETING 2009 Index 1. General overview 2008 2. Russia 3. Nokian Tyres going forward 4. Summary 5. Board
Strong growth in western markets - headwind in Russia Swedbank Norway 27 August, 2014
 Strong growth in western markets - headwind in Russia Swedbank Norway 27 August, 2014 Mr. Kim Gran President and CEO Nokian Tyres plc 1 STRATEGIC FOCUS Nokian vs. Tyre industry Global tyre business 2011:
Review by the President and CEO Nokian Tyres plc Annual General Meeting Ari Lehtoranta
 Review by the President and CEO Nokian Tyres plc Annual General Meeting 8.4.2015 Ari Lehtoranta Contents 1. Strategic focus areas and objectives how did we succeed in 2014 2. General overview 2014 3. Outlook
Half year financial report 1 6/2017
 Half year financial report 1 6/2017 August 8, 2017 President and CEO Hille Korhonen Strong first half of the year with solid full year expectations 1. General overview 2. Nokian Tyres financial performance
RESULT 2005, February 14th, The original winter tyre
 RESULT 2005, February 14th, 2006 The original winter tyre 1 CONTENTS 1. Result 2005 Page key figures 3 operating profit per quarter 4 market situation 5 Nokian Tyres 2005 in brief 6 Q4/2005 7 fixed costs
American Chamber of Commerce in Russia. Investor of the Year award. Candidate: NOKIAN TYRES RUSSIA. March 04, The New Nokian Hakkapeliitta 7 SUV
 American Chamber of Commerce in Russia Investor of the Year award Candidate: NOKIAN TYRES RUSSIA The New Nokian Hakkapeliitta 7 SUV March 04, 2010 FINANCIAL PERFORMANCE Total Investments in 2009 2009:
Interim report 1 9/2017
 Interim report 1 9/2017 November 1, 2017 President and CEO Hille Korhonen Strong performance with solid full year expectations 1 1. General overview 2. Nokian Tyres financial performance 3. Business units
Presentation half-year results 2012
 Presentation half-year results 2012 Okura Hotel, Amsterdam 26 July 2012 René J. Takens, CEO Hielke H. Sybesma, CFO Jeroen M. Snijders Blok, COO Agenda 1. Accell Group in H1 2012 2. Accell Group share 3.
Q PRESENTATION 18 OCTOBER 2018
 Q3 2018 PRESENTATION 18 OCTOBER 2018 Group Highlights Q3 2018 Very strong growth in revenue and operating profit outside of Denmark. In Denmark, acceptance of self-cleaning in September allows Atea to
Market position. Key figures. Year 2013 IFRS. Nokian Tyres in 2013
 2013 Annual Report Nokian Tyres in 2013 Market position excellent! Nokian Tyres increased its market shares in Russia, Nordic countries and Central Europe. The company has the strongest brand, price position
Annual results 2017 and strategy update. 09 March 2018
 Annual results 2017 and strategy update 09 March 2018 Agenda 1. Highlights & Group performance 2017 2. Strategy update 3. Outlook 2018 March 9, 2018 Accell Group N.V. presentation annual results 2017 1
Year 2012: The strong position in Russia improved further
 ANNUAL REPORT 2012 2 Year 2012: The strong position in Russia improved further Nokian Tyres PLC 2012 Key figures, IFRS Content EUR million 2012 2011 change% Net sales 1,612.4 1,456.8 10.7 Operating profit
Fact Sheet for Q3 and January-September 2012 October 24, 2012
 Fact Sheet for Q3 and January-September 2012 October 24, 2012 Contents Daimler Group Stock Market Information 3 Earnings and Financial Situation 4-13 Information for Divisions Mercedes-Benz Cars 14-17
Preliminary Unaudited Financial Results for 2016
 REGULATORY ANNOUNCEMENT March 9 th, 2017 Fortuna Entertainment Group N.V. Preliminary Unaudited Financial Results for 2016 Amsterdam - Fortuna Entertainment Group N.V. announces its preliminary unaudited
Annual results Accell Group 2016
 Annual results Accell Group 2016 Amsterdam, 10 March 2017 René J. Takens, CEO Hielke H. Sybesma, CFO Agenda 1. Key results 2016 2. Strategy 3. Outlook 10 March 2017 Accell Group N.V. presentation annual
The U.S. Economic Outlook
 The U.S. Economic Outlook Presented to: Maquiladora Industry Outlook Conference September 29 2006 Presented by: Patrick Newport Principal, U.S. Macroeconomic Service 781-301-9125 patrick.newport@globalinsight.com
Solid results first half year 2004 Accell Group
 Solid results first half year 2004 Accell Group René Takens (CEO), Hielke Sybesma (CFO) Amsterdam, 21 July 2004 1 Business goes well Autonomous Strong positioning of Accell Group s brands Effective marketing
Presentation first-half results 2010
 Presentation first-half results 2010 Okura Hotel, Amsterdam 23 July 2010 René J. Takens, CEO Hielke H. Sybesma, CFO Jeroen M. Snijders Blok, COO Agenda 1. Accell Group in H1 2010 2. Segments and countries
Half year results Accell Group 2017
 Half year results Accell Group 2017 Hielke Sybesma, Interim CEO & CFO Jeroen Snijders Blok, COO Jeroen Both, CSCO July 21, 2017 Agenda 1. Key results H1 2017 2. Strategy 3. Outlook July 21, 2017 Accell
Accell Group profit up by 15% in 2009
 Number of pages: 11 PRESS RELEASE Accell Group profit up by 15% in 2009 Heerenveen (the Netherlands), 26 February 2010 - Accell Group N.V. booked a further rise in turnover and profit in 2009. Turnover
Web.com Completes Acquisition of Yodle Deal strengthens Web.com s portfolio of products that help small businesses compete and succeed online
 Web.com Group, Inc. 12808 Gran Bay Parkway West Jacksonville, FL 32258 T: (904) 680-6600 F: (904) 880-0350 NASDAQ: WEB Web.com Completes Acquisition of Yodle Deal strengthens Web.com s portfolio of products
General Meeting of Shareholders
 General Meeting of Shareholders Heerenveen, 20 April 2006 1 Agenda Accell Group in 2005 Share price Financials Outlook 2 Further growth Turnover + 8%, organic turnover growth 5% Accell exceeded the top
Retreading materials
 Retreading materials 2 Noktop retreading materials Nokian Noktop A new life for your tyres From icy roads to earthmoving sites, from city buses to log trucks wherever the tyres wear, Noktop retreading
U.S. Overview. Gathering Steam? Tuesday, October 1, 2013
 U.S. Overview Gathering Steam? Tuesday, October 1, 2013 Uneven global economic recovery Annual real GDP growth projections (%) Projections 2013 2014 World 3.1 3.1 3.8 United States 2.2 1.7 2.7 Euro Area
Trade Growth - Fundamental Driver of Port Operations and Development Strategies
 Trade Growth - Fundamental Driver of Port Operations and Development Strategies Marine Terminal Management Training Program October 15, 2007 Long Beach, CA Paul Bingham Global Insight, Inc. 1 Agenda Economic
Accell Group. power in branding and distribution. Business profile. René Takens (CEO) Two segments: - Bicycles, Bicycle Parts & Accessories - Fitness
 Two segments: - Bicycles, Bicycle Parts & Accessories - Fitness") Accell Group power in branding and distribution Brussels/Antwerp, René Takens (CEO) Wouter de Vreeze (Manager M&A/IR) 1 Business profile Two segments: - Bicycles, Bicycle Parts & Accessories - Fitness
Accell Group power in branding and distribution Brussels/Antwerp, René Takens (CEO) Wouter de Vreeze (Manager M&A/IR) 1 Business profile Two segments: - Bicycles, Bicycle Parts & Accessories - Fitness
Half year results Accell Group N.V.
 Half year results Accell Group N.V. René Takens (CEO), Hielke Sybesma (CFO), Jeroen Snijders Blok (COO) Amsterdam, 1 Agenda Summary results Accell Group in 1st half year 2005 Share Accell Group Financial
Bob Costello Chief Economist & Vice President American Trucking Associations. Economic & Motor Carrier Industry Update.
 Bob Costello Chief Economist & Vice President American Trucking Associations Economic & Motor Carrier Industry Update February 26, 2013 The Worst Recession Since the Great Depression 0% Loss from Peak
Curves On The Road Ahead
 Curves On The Road Ahead Light Vehicle Market Outlook November 2018 Charles Chesbrough Senior Economist A g e n d a Economic Outlook and New Vehicle Sales Affordability Threat and the Used Vehicle Market
NIIT Technologies FZ-LLC, Dubai
 Balance Sheet as at I Notes As at As at As at As at PARTICULARS AED AED EQUITY AND LIABILITIES 1 Shareholders funds Share capital 3 5,000,000 90,084,500 5,000,000 84,865,500 Reserves and surplus 4 (209,271)
Europe June Craig Menear. Chairman, CEO & President. Diane Dayhoff. Vice President, Investor Relations
 Europe June 2016 Craig Menear Chairman, CEO & President Diane Dayhoff Vice President, Investor Relations Forward Looking Statements and Non-GAAP Financial Measurements Certain statements contained in today
North American Forging Shipment Forecast (Using FIA bookings information through December 2013)
") North American Forging Shipment Forecast 2014-2018 (Using FIA bookings information through December 2013) Percent Change Year Ago Best leading indicator combination for impression die bookings used to
North American Forging Shipment Forecast 2014-2018 (Using FIA bookings information through December 2013) Percent Change Year Ago Best leading indicator combination for impression die bookings used to
Terex Materials Processing & Mining
 Terex Materials Processing & Mining MineExpo International 2008 September 22, 2008 Eric Nielsen President, Terex MP&M Forward Looking Statements & Non-GAAP Measures The following presentation contains
Quarterly report 1/2005. Fire-resistant birch panelling from Finnforest and Moelven in the Danish-Jewish Museum in Copenhagen.
 Quarterly report 1/2005 Fire-resistant birch panelling from Finnforest and Moelven in the Danish-Jewish Museum in Copenhagen. Profit and Loss Account Operating revenues 1,411.2 1,407.0 1,143.4 5,773.2
Annual Results 2002 Accell Group N.V. Amsterdam, 20 February 2003
 Annual Results 2002 Accell Group N.V. Amsterdam, 20 February 2003 Agenda Summary results Important developments in 2002 Accell Group share Financials Sales & Marketing Outlook Summary results (x million)
Interim report Q November 2017
 Interim report Q3 2017 14 November 2017 1 Highlights Q3 2017 Positive developments in core business and Hartmann Technology Revenue grew due to technology sales and higher volumes Profitability impacted
Market Update. Randy Tinseth Vice President, Marketing Boeing Commercial Airplanes. Copyright 2016 Boeing. All rights reserved.
 Market Update The statements contained herein are based on good faith assumptions are to be used for general information purposes only. These statements do not constitute an offer, promise, warranty or
THE BLUE SKY REPORT A KERRIGAN QUARTERLY. Third Quarter 2018 December 2018
 THE BLUE SKY REPORT A KERRIGAN QUARTERLY Third Quarter 2018 December 2018 Contact Erin Kerrigan: (949) 439-6768 erin@kerriganadvisors.com Contact Ryan Kerrigan: (949) 728-8849 ryan@kerriganadvisors.com
Investor Presentation Q4 FY 2018
 Investor Presentation Q4 FY 2018 2 nd May, 2018 Content 1. India Business 4. Financials 2. Global Business 5. Recognitions 3. Infrastructure 2 nd May 2018 2 of 34 India Business 2 nd May 2018 3 of 34 India
Bob Costello Chief Economist & Vice President American Trucking Associations. Economic & Motor Carrier Industry Trends. September 10, 2013
 Bob Costello Chief Economist & Vice President American Trucking Associations Economic & Motor Carrier Industry Trends September 10, 2013 The Freight Economy Washington continues to be a headwind on economic
Market change we accelerate our transformation Amer Sports Roadshow June 2017 Heikki Takala, President and CEO
 Market change we accelerate our transformation Amer Sports Roadshow June 2017 Heikki Takala, President and CEO Glidepath 2010-15: We built Amer Sports from 1.5 to 2.5 B Sales ~2.5B Sales ~1.5B 2009 2015
Interim report Q Conference call, 30 August 2017 CEO Ulrik Kolding Hartvig CFO Marianne Rørslev Bock
 Interim report Q2 2017 Conference call, 30 August 2017 CEO Ulrik Kolding Hartvig CFO Marianne Rørslev Bock 1 Highlights Higher volumes outweighed by phasing in Hartmann Technology Group revenue declined
Fastmarkets RISI Global Boxboard Outlook
 Fastmarkets RISI Global Boxboard Outlook Forces shaping the boxboard industry 1 At the top of the business cycle? 2017 was a strong year, 2018 not so much Deceleration in the global economy Boxboard demand
Exhibit #MH-156. ELECTRIC OPERATIONS (MH10-2) PROJECTED OPERATING STATEMENT (In Millions of Dollars) For the year ended March 31 REVENUES
 PROJECTED OPERATING STATEMENT (In Millions of Dollars) For the year ended March 31 REVENUES") PROJECTED OPERATING STATEMENT 2011 2012 2013 2014 2015 2016 2017 2018 2019 2020 REVENUES General Consumers at approved rates 1,194 1,223 1,235 1,254 1,265 1,279 1,296 1,307 1,320 1,336 additional * - 42
PROJECTED OPERATING STATEMENT 2011 2012 2013 2014 2015 2016 2017 2018 2019 2020 REVENUES General Consumers at approved rates 1,194 1,223 1,235 1,254 1,265 1,279 1,296 1,307 1,320 1,336 additional * - 42
The U.S. Economic Outlook
 The U.S. Economic Outlook Nigel Gault Chief U.S. Economist, IHS Global Insight FTA Revenue Estimation & Tax Research Conference Charleston, West Virginia October 17, 2011 What Has Happened to the Recovery?
Nokian Tyres with you where the job is done
 Nokian Tyres with you where the job is done Wherever you operate, you can be certain that Nokian Tyres has the right tyre for the job at hand. We come out from the lab and get our hands dirty. We get to
The Global Economy: Sustaining Momentum
 The Global Economy: Sustaining Momentum David J. Stockton Senior Fellow Peterson Institute for International Economics Chief Economist Monetary Policy Analytics October 5, 2017 What s Driving the Global
Cargo outlook Brian Pearce Chief Economist. 13 December 2018
 Cargo outlook 2019 Brian Pearce Chief Economist 13 December 2018 1 Cargo revenue contribution stabilizing 2 % total revenues 82% 80% 78% 76% 74% 72% 70% 68% 66% 64% 62% 2008 2009 2010 2011 2012 2013 2014
Canadian Teleconference: Can the Canadian Economy Survive the Turmoil in the United States?
 Canadian Teleconference: Can the Canadian Economy Survive the Turmoil in the United States? Nigel Gault Chief U.S. Economist Dale Orr Canadian Macroeconomic Services Copyright 2008 Global Insight, Inc.
The U. S. Economic Outlook: Robert J. Gordon
 The U. S. Economic Outlook: Upside and Risks Robert J. Gordon Ottawa a Economics Association Ottawa, a, September 14, 2017 Immigration Medical Care My Policy Package: Be Like Canada d University Tuition
ECONOMIC ACTIVITY REPORT SEPTEMBER September 2018 Kristoffer Eide Hoen Anders Wettre
 ECONOMIC ACTIVITY REPORT SEPTEMBER 2018 27 September 2018 Kristoffer Eide Hoen Anders Wettre END OF AN ERA OF STRONG GROWTH Selected contracting markets CAGR* 2014 2017 Greater Gothenburg 23% Greater Malmö
AMERICAN GREEN INC INTERIM FINANCIAL STATEMENTS
 AMERICAN GREEN INC INTERIM FINANCIAL STATEMENTS (UNAUDITED) For the three months ended September 30, 2017 and 2016 AMERICAN GREEN INC. UNAUDITED CONSOLIDATED BALANCE SHEET AT SEPTEMBER 30, 2017 ASSETS
The U.S. Economy How Serious A Downturn? Nigel Gault Group Managing Director North American Macroeconomic Services
 The U.S. Economy How Serious A Downturn? Nigel Gault Group Managing Director North American Macroeconomic Services Growth Is Cooling; But a Soft Landing Is Likely (Real GDP, annualized rate of growth)
Accell Group achieves profit growth of 17% in 2008
 Number of pages: 11 PRESS RELEASE Accell Group achieves profit growth of 17% in 2008 Heerenveen, 27 February 2009 - Accell Group N.V. has realised a further growth in turnover and profits in 2008. Due
Accell Group first-half net profit up 13%
 Number of pages: 13 PRESS RELEASE Accell Group first-half net profit up 13% Heerenveen (the Netherlands), 25 July 2014 - Accell Group N.V. recorded net profit of 27.5 million in the first half of 2014,
Presentation First-half results 2007
 Presentation First-half results 2007 Okura Hotel, Amsterdam 20 July 2007 René J. Takens, CEO Hielke H. Sybesma, CFO Jeroen M. Snijders Blok, COO 1 Agenda Summary Development segments and countries in first
Outlook Global Automotive Industry
 Outlook Global Automotive Industry Jonathon Poskitt, Director, Global Sales Forecasts TAYSAD Aftermarket Conference Istanbul, 25 May 2018 LMC Automotive Global Presence Regional Expertise Local Support
LOREM IPSUM ANNUAL REVIEW 2017
 LOREM IPSUM ANNUAL REVIEW 2017 LOREM IPSUM PEACE OF MIND NOKIAN TYRES PLC 2 ANNUAL REVIEW 2017 LOREM IPSUM Our high-quality tyres offer reliability, performance, and peace of mind from winter blizzards
Overview of market trends through 2005 Forecasts for 2006 and 2007
 Overview of market trends through 2005 Forecasts for 2006 and 2007 Ed Pepke, Ph.D. Forest Products Marketing Specialist Food and Agricultural Organization & UN Economic Commission for Europe Geneva, Switzerland
Warsaw, 15 March 2012
 Warsaw, 15 March 2012 PZU 2.0 PZU Group s Strategy for 2012-2014 PZU Group s Vision for Growth PZU 2.0 Through our strong customer focus and superior operational efficiency the PZU Group will become the
AMERICAN GREEN INC INTERIM FINANCIAL STATEMENTS (UNAUDITED)
") AMERICAN GREEN INC INTERIM FINANCIAL STATEMENTS (UNAUDITED) For the six months ended December 31, 2017 and 2016 AMERICAN GREEN INC. UNAUDITED CONSOLIDATED BALANCE SHEET AT DECEMBER 31, 2017 ASSETS CURRENT
AMERICAN GREEN INC INTERIM FINANCIAL STATEMENTS (UNAUDITED) For the six months ended December 31, 2017 and 2016 AMERICAN GREEN INC. UNAUDITED CONSOLIDATED BALANCE SHEET AT DECEMBER 31, 2017 ASSETS CURRENT
Global Boxboard Market Review
 Global Boxboard Market Review Sailing In A World Of Volatility And Uncertainty European Conference March 2018 Alejandro Mata Senior Economist, European Forest Products Copyright 2018 RISI, Inc. Proprietary
Carol Tomé CFO and Executive Vice President, Corporate Services
 Carol Tomé CFO and Executive Vice President, Corporate Services Financial Overview December 6, 2017 1 Discussion Overview Fiscal 2017 Financial Guidance Our View of the Economy and State of the U.S. Housing
2018 Annual Economic Forecast Dragas Center for Economic Analysis and Policy
 2018 Annual Economic Forecast Dragas Center for Economic Analysis and Policy PRESENTING SPONSOR EVENT PARTNERS 2 The forecasts and commentary do not constitute an official viewpoint of Old Dominion University,
The Party Is Over U.S. Automotive Outlooks
 The Party Is Over U.S. Automotive Outlooks Yen Chen Senior Research Economist Center for Automotive Research Federal Reserve Bank of Chicago Economic Outlook Symposium December 1, 2017 U.S. Light Vehicle
De-Globalization: Does That Word Mean What You Think it Means?
 De-Globalization: Does That Word Mean What You Think it Means? Presentation to 35 Annual Monetary & Trade Conference Mykyta Vesselovsky, Ph.D. Office of the Chief Economist Global Affairs Canada April
PROVINCE OF SASKATCHEWAN INVESTOR PRESENTATION
 PROVINCE OF SASKATCHEWAN INVESTOR PRESENTATION May 2018 THE SASKATCHEWAN DIFFERENCE Economic Stability Diversified economy balances cyclicality of resources Growing population Majority government with
MARKET AND CAPACITY UPDATE. Matthew Marsh September 2016
 MARKET AND CAPACITY UPDATE Matthew Marsh September 2016 1980 1981 1982 1983 1984 1985 1986 1987 1988 1989 1990 1991 1992 1993 1994 1995 1996 1997 1998 1999 2000 2001 2002 2003 2004 2005 2006 2007 2008
Xcel Energy (Baa3/BBB-)
") January 28, 2004 Fixed Income Research Recommendation: Market Perform Credit Trend: Improving Jacob P. Mercer, CFA Senior Research Analyst 612-303-1609 jacob.p.mercer@pjc.com Mark D. Churchill Associate
January 28, 2004 Fixed Income Research Recommendation: Market Perform Credit Trend: Improving Jacob P. Mercer, CFA Senior Research Analyst 612-303-1609 jacob.p.mercer@pjc.com Mark D. Churchill Associate
Global economy maintaining solid growth momentum. Canada leading the pack
 Global economy maintaining solid growth momentum Canada leading the pack Dawn Desjardins (Deputy Chief Economist) (416) 974-6919 dawn.desjardins@rbc.com September 2017 Brighter global outlook gains traction
Paddy Power Betfair plc Q Trading Update
 Paddy Power Betfair plc 2018 Trading Update 2 November 2018 Paddy Power Betfair (the Group ) announces a trading update for the three months ended 30 September 2018. Unaudited Revenue Underlying EBITDA
Economic Overview. Melissa K. Peralta Senior Economist April 27, 2017
 Economic Overview Melissa K. Peralta Senior Economist April 27, 2017 TTX Overview TTX functions as the industry s railcar cooperative, operating under pooling authority granted by the Surface Transportation
AMERICAN GREEN INC INTERIM FINANCIAL STATEMENTS
 AMERICAN GREEN INC INTERIM FINANCIAL STATEMENTS (UNAUDITED) For the nine months ended March 31, 2018 and 2017 AMERICAN GREEN INC. UNAUDITED CONSOLIDATED BALANCE SHEET AT MARCH 31, 2018 ASSETS CURRENT ASSETS:
INTERIM FINANCIAL STATEMENTS
 AMERICAN GREEN INC INTERIM FINANCIAL STATEMENTS (UNAUDITED) For the three and nine months ended March 31, 2016 and 2015 AMERICAN GREEN INC. UNAUDITED CONSOLIDATED BALANCE SHEET AT MARCH 31, 2016 ASSETS
U.S. AUTO INDUSTRY UPDATE Federal Reserve Bank of Chicago Automotive Outlook Symposium. Emily Kolinski Morris Chief Economist May 2015
 U.S. AUTO INDUSTRY UPDATE Federal Reserve Bank of Chicago Automotive Outlook Symposium Emily Kolinski Morris Chief Economist May 2015 NORTH AMERICA INDUSTRY VOLUME SUMMARY 13.1 Total North America* (Mils.)
National and Virginia Economic Outlook Professor Robert M. McNab Dragas Center for Economic Analysis and Policy Strome College of Business
 National and Virginia Economic Outlook Professor Robert M. McNab Dragas Center for Economic Analysis and Policy Strome College of Business October 24, 2018 The forecasts and commentary do not constitute
UBS Annual Nordic Financial Services Conference Lars Aa. Løddesøl Group CFO - Storebrand
 UBS Annual Nordic Financial Services Conference 2013 Lars Aa. Løddesøl Group CFO - Storebrand 1 The Storebrand Group 100% of investments assessed by sustainability criteria 2.200 employees 40.000 corporate