A transitional stage in the current regime in the Suez Canal
|
|
|
- Samson Baker
- 5 years ago
- Views:
Transcription
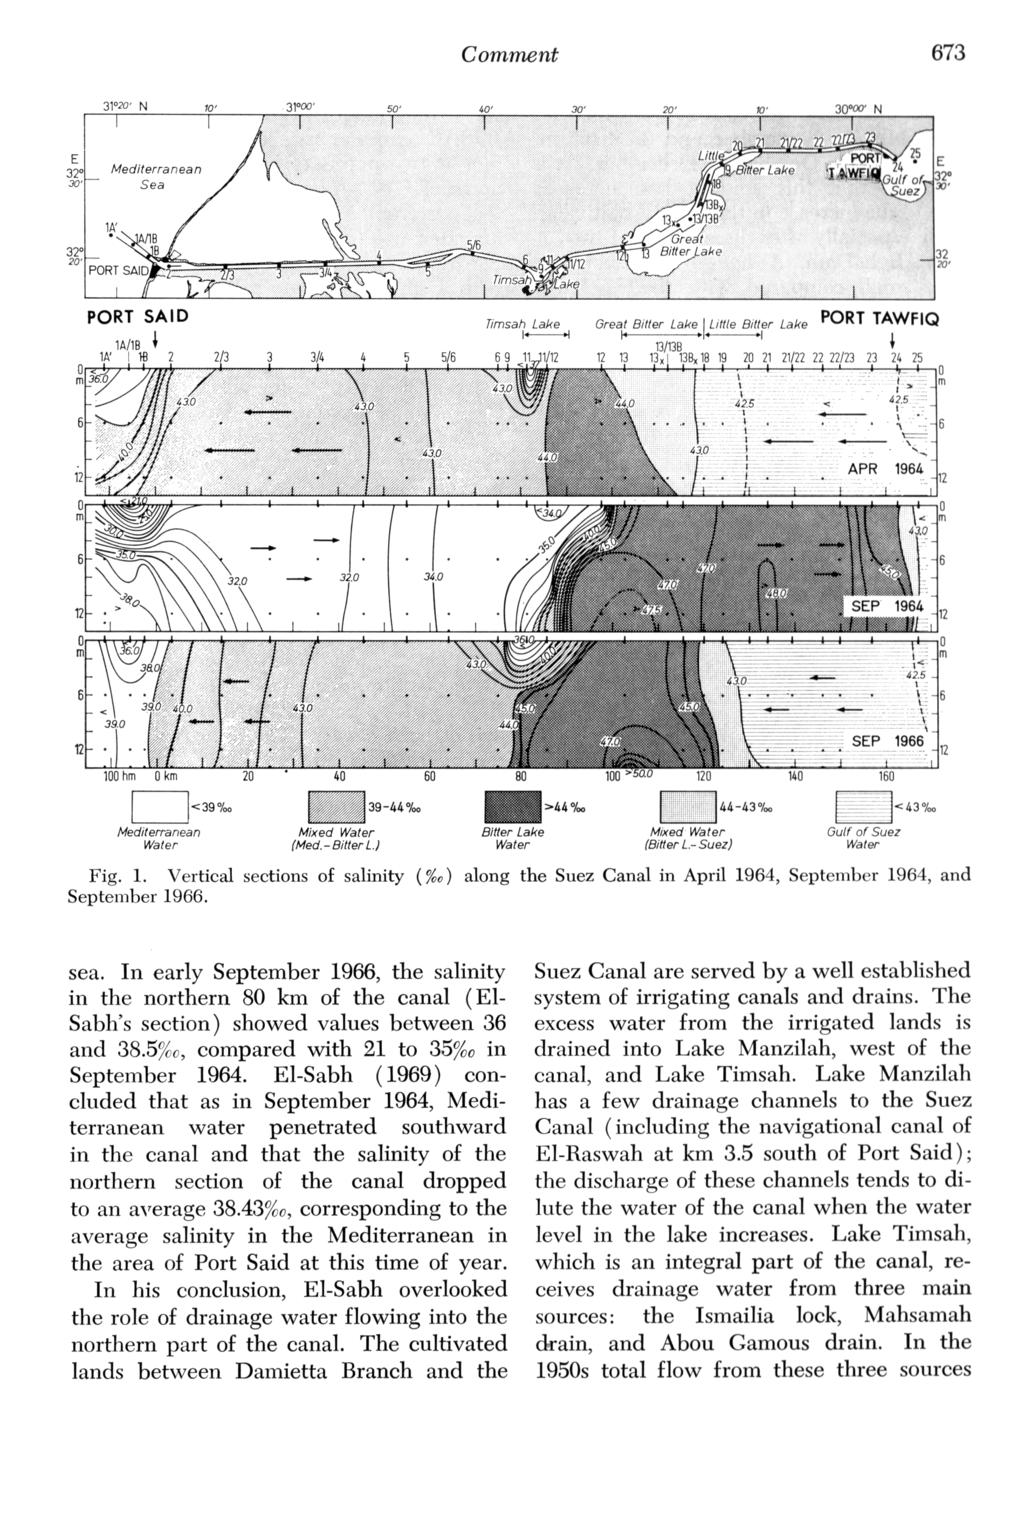
1 672 Comment A transitional stage in the current regime in the Suez Canal In their remarks Hassan and El-Sabh (1975) confine themselves to a seasonal comparison, utilizing only five monthly sections of one year, In this way, they exclude the experience gained from previous observations of the seasonal changes in the canal. Morcos (1967; Morcos and Messieh 1973) approach was to study the seasonal cycle of 1966, and particularly the sections of September 1966, in the light of seasonal observations made during the preceding years, in order to detect any change after the construction of the Aswan High Dam. This is well illustrated in Fig. 1 which shows the drastic difference between the September 1964 and September 1966 sections, from which southward and northward movements, respectively, are inferred. However, Hassan and El-Sabh argue that Morcos section was made on 28 and 29 September 1966 and that observations made earlier in the same month would show the normal conditions of southward movement. Their section, made in the first half of September 1966, is the basis of their argument; but the weakness of this section is the fact that the 160-km length of the canal was covered in 15 days (3-17 September 1966), compared with two days in Morcos section. Unfortunately no direct measurements of current were made in the canal during September Currents can only be inferred from salinity distribution in that month, taking into consideration calculations of the water and salt balance in Sep- tember 1966, seasonal variation in salinity distribution in the preceding years, and previous direct measurements of currents and water level in the canal between 1933 and 1937 and in A discussion of the main arguments follows. Between 1933 and 1937, the scientists of the Suez Canal Company conducted a most extensive quantitative study of the water regime of the canal by registering the mean water level and current using tidal gauges and two continuous recording cur- rent meters at two points, south and north of Great Bitter Lake. Baussan (1938) concluded that between the northward current in winter and the southward current in late summer, there is a transitional period during which the current is only reversed in the northern canal. (For simplicity, the portion of the Suez Canal north of the Bitter Lakes will be designated as the northern canal and that south of the Bitter Lakes as the southern canal.) Thus, water flows from the Mediterranean to the Bitter Lakes, while the current in the southern canal continues to be northward from the Red Sea to the Bitter Lakes. Examples given by Baussan were July-August 1935, June, July, August 1936, and June In these months the waters flowed from both ends of the canal toward the Bitter Lakes. This is to be expected, since compensation must be made for the high evaporation during that season from the Bitter Lakes (85.5% of the total area of the whole canal). Such a conclusion is confirmed by the recent estimation of evaporation from the Bitter Lakes by Miller and Munns (1974, p. 306) who wrote that the seemingly contradictory evidences of net inflows into the Canal from both the northern and southern ends of the Canal in the same period, together with extra volumes of Nile water entering at Lake Timsah, are reconciled with the excessive evaporation potential of the Bitter Lakes region. Thus, Hassan and El-Sabh s observation and main argument that Mediterranean waters penetrated in early September 1966 into the northern canal does not necessarily imply that the current in the whole canal (i.e. the net flow) was southward. During September 1964, 19,291 X 10 mr of water were discharged into the Mediterranean from the Damietta Branch of the Nile which opens 60 km west of Port Said. In September 1966, the mouth of the Damietta Branch was closed by an earth dam and there was no further direct flow of Nile water from this branch to the
2
3 674 Comment alone amounted to 16 x 10 m3 month-l from May to September and 22 X lo6 m3 month-l from October to December. It is believed that this amount has increased due to the increase in the area of cultivated land, especially after the erection of the Aswan High Dam. Although this amount is very small compared with the discharge from Damietta Branch (19,291 X 10 m3 month-l in September 1966) into the Mediterranean, it has a direct impact on the salinity of the canal. Assuming that the volume of the northern canal is X log m3 (80 km long and 1,800 m2 in cross section), and that the salinity before dilution is 42%,, the salinity resulting from the dilution by X log m3 month-l of drainage water of l%, salinity will be X log m3 X S1 = X 10g m3 X 42%, X log m3 X lp/,, Sl = 37.4%0. Thus, the amount of drainage water in only 1 month could decrease the salinity of the canal to a value less than that observed by El-Sabh ( 38.43s0). If we assume that the canal was filled with Mediterranean water of 39%0, the salinity would drop to 34.1%0. The above discussion indicates that the drop of salinity in the northern part of the canal cannot be taken solely as evidence of a southward current in the canal, although it does not of course exclude the possibility. In late September 1966, the northern canal was filled with water of a salinity ranging between 43s0 and 39s0, due to a northward flow of highly saline water from the Great Bitter Lake (GBL) diluted by drainage water. Assuming that the salinity of GBL water is 46%, and that of the drainage water 1%0, the mixed water in the northern canal would attain a salinity of 40.8z0, which is very close to the salinity observed. Figure 2 illustrates the position of the GBL water mass and the point of maximum salinity at 6-m depth along the canal in April and September, as noted from all the available observations from 1924 to From 1933 to 1937, currents in the canal were continuously measured by two IDRAC continuous-recording current meters at two points of the canal, south and north of GBL. These records and the five sections from April 1933 to April 1935 (illustrated in Fig. 2) show that a strong net northward current in Aprils is associated with a small (and less saline) GBL water mass and that the relatively weak net southward current in Septembers coincides with a large (and more saline) water mass. The GBL water mass, as well as the point of maximum salinity, is shifted to the north in April and to the south in September. Likewise, the velocity of current can be inferred from the position, volume, and salinity of the GBL water mass in the salinity sections made in the years before and after the sections, as shown in Fig. 2. The shift to the north on 29 September 1966 is clearly exceptional. In early September 1966, the water mass shows an intermediate position, occupying the Bitter Lakes Basin with no penetration into the southern or northern canals. Thus, the water mass during that entire September is basically different from that of the preceding Sep- tembers with respect to its position in the canal. However, it retains its other important characteristics, namely its large volume and high salinity which are due to the sluggish current over the salt bed, as previously indicated (Morcos 1967). This water mass thus extends a greater distance along the northern canal in September 1966 than it did in May or December For this reason, comparison of the two cases to draw a conclusion regarding the direction of the current, as attempted by Hassan and El-Sabh, would be misleading. The only safe conclusion to be drawn from such a comparison is that the current in September 1966 is weaker than in May or December On the other hand, this clarifies my approach, which depends on comparing conditions in a particular month (say September) over a number of years, as illustrated by Fig. 2. Since the water mass in these months retains the same characteristics
4 Comment 675 SUEZ 1 SEPTEMBER 1931 APRIL 1933 SEPTEMBER MAY 1934 SEPTEMBER 1 APRIL 1935 APRIL 1954 SEPTEMBER APRIL 1964 SEPTEMBER 1964 APRIL 1966 SEPTEMBER 1966 APRIL 1967 I I I I I I I I I I km Fig. 2. Displacement of the Great Bitter Lake water mass and the point of maximum salinity along the Suez Canal at 6-m depth in April and September during the five sets of monthly cruises 1924, , , 1964, and The distance along the Suez Canal measured in kilometers south of Port Said Lighthouse appears on the abscissa. The GBL water mass in each month is represented by a shadowed area enclosed between the position of the southern and northern 44% isohalines at 6-m depth. The more saline water mass of September is heavily shadowed. Two positions of the points of maximum salinity are joined by two dotted lines, one for the northerly shifted points of April and one for the southerly shifted points of September (after Morcos and Gerges 1974). (greater volume and higher salinity) any Morcos (1960a) studies of tidal curdisplacement in the position of the water rents in the promontory of Kabrit, between mass becomes meaningful in the interpre- the two basins of the Bitter Lakes, indicate tation of the direction of the current (not that the resultant currents are much weaker meaningless, as suggested by Hassan and than the resultant currents in the southern El-Sabh). canal. They show less seasonal variabiliy
5 Comment in magnitude and direction and may even give evidence of an opposite direction to the stronger resultant currents in the southern canal. (For simplicity, the resultant current is taken as the difference between ebb and flow currents divided by 2.) As mentioned before, the GBL water mass increases in volume and salinity in summer, due to high evaporation and slow currents over the salt bed (Morcos 1960b, 1967). Such an increase may become even greater as a result of the water s extended contact with the salt bed in transitional periods when water flows from both ends of the canal toward the Bitter Lakes. The trapped and swelling water mass gradually pushes its boundaries northward and southward. The LBL is an integral part of the basin of the Bitter Lakes and its connection with the GBL has a larger cross section than does the canal proper. In the absence of a strong northward current the LBL is filled by the GBL water mass, due to the natural process of expansion in volume and increase of salinity of this water mass. This is enhanced by diffusion and turbulence and should not be taken as evidence of a southward current in the canal as is done by Hassan and El-Sabh. A similar distribution with the LBL filled with the GBL water mass was observed in August and November 1931, July, August, October, and November 1933, June and July 1935, and June These are months of transitional characteristics or even weak northward currents. In this sense, figure 7 in Morcos and Messieh (1973) was constructed to illustrate the similarity in salinity distribution in the southern canal between El- Sabh s section in early September 1966 and Morcos section in June There is definitely no southward current in the canal in June 1955 and the similar distribution of salinity in early September 1966 should not be taken as evidence of a southward current. Noting that the LBL has a mean cross section five times greater than that of the Suez Canal proper, Hassan and El-Sabh concluded that the GBL water excursion in the 15-km LBL is equivalent to 5 x 15 = 75 Table 1. The monthly average of maximum velocities of currents (cm s-l) in 1949 at two points along the Suez Canal. (Average of two daily observations at maximum flood current (IV) and maximum ebb current (S) and resultant current, R = N - S/2.) Month Shallufa (km 146.1) Gineifa (km 134.0) N S R N S R Jan Jun Jtdl Sep km in the canal proper. Such a conclusion, not justified dynamically, is invalid. Penetration into the southern canal requires much greater energy than that required to fill LBL, the waters of which can simply be regarded as the shallow shelf water of GBL. Moreover, the observations made in September 1964 and the preceding Septembers showed the GBL water mass not only filling LBL but also penetrating the whole southern canal down to Suez Bay. Table 1 gives the monthly average of maximum velocities of currents at two points in the Suez Canal in 1949 (after Morcos 1960a). Values are given for only 4 months. January and September values are, respectively, the maximum northward and maximum southward resultant currents over 1 year. June values represent the minimum northward resultant current before it changed direction in July, when the minimum southward resultant current was observed. The results show that in June and July the resultant currents are very sluggish, and that between the two main seasons there is a transitional period where no appreciable currents occur in the canal. This period is interesting when calculating the water balance in the Bitter Lakes, since the uncertainty in the estimate of the contribution of currents to the water balance will be at a minimum. Table 2 shows the total volume of the water mass of GBL >44%0, 8~ in log m3, and the total salt content of this water mass, ZwS in log kg, as well as average salinities in June and July The estimation was made by summation of the real volume-and total salt
6 Comment 677 Table 2. Changes in the volume, total salt content, and average salinity in the GBL water mass from June to July Month 1955 mogm3 CzGIOgkg S%. June July Increase content-between each two successive isohalines within the water mass bounded by the southern and northern 44F0 isohalines. Table 2 demonstrates that the change from the northward regime to the southward regime is accompanied not only by an increase of salinity but also by an increase in the volume of the water mass, which produces a significant increase in the total salt content (2.333 * log kg month-l). This fact was overlooked by Hassan and El-Sabh in their attempt to calculate the salt budget in the canal, since, with the reversal of currents, part of the salt flowing into the Bitter Lakes from the north adds to the salinity increase due to evaporation, while the water carrying this salt from the north increases the volume of the more saline GBL water mass. Reliable information on the slope of the water surface along the canal could only be gained from observations of mean sea level (M.S.L.) at selected points along the canal especially in the region of the Bitter Lakes, in addition to observations at the two ends of the canal. In 1935, 1936, and 1937, three tide gauges were installed in addition to the two permanent tide gauges at Port Said and Port Tawfiq (Suez) : Deversoir (km 98), at the northern end of Great Bitter Lake; Kabrit (km 121), between Great and Little Bitter Lakes; Gineifa (km 134), at the southern end of Little Bitter Lake. Figure 3 shows the slope of the water surface along the canal in the 6 months between June and November The data for these three years show that in most cases the Bitter Lakes occupy an intermediate height between the Red Sea and the Mediterranean when the current is predominantly northward in win- I Km0 50 I 150 Fig. 3. The slope of the water surface along the Suez Canal in each month from June to November 1935 (after Morcos and Gerges 1974). Intermediate points are Deversoir (km 98 ), Kabrit ( km 121), and Gineifa (km 134). ter or predominantly southward in September. However, in some transitional months the Bitter Lakes are either higher or lower than the M.S.L. at both ends of the canal. According to Baussan (1938) the observations give the following patterns of circulation: 1. From winter to early summer the current flows from the Red Sea to the Mediterranean, as indicated by the slope in June This is followed by a reversal of current in the northern canal, with waters flowing from the Mediterranean to the Bitter Lakes while the current in the southern canal continues to be northward from the Red Sea to the Bitter Lakes (e.g. July- JUI A%! -sep act NW
7 678 Comment August 1935, J une, July, August 1936, June 1937). In these months the waters flow from both ends of the canal toward the Bitter Lakes. 3. This is followed by a predominant current established between the Mediterranean and Red Sea (e.g. September 1935, 1936, and 1937). 4. The current in the southern canal regains its original direction from the Red Sea to the Bitter Lakes, while the waters of the Mediterranean continue to flow from the Mediterranean to the Bitter Lakes (e.g. October 1935 and 1936). 5. Finally, the current is reversed between the Mediterranean and the Bitter Lakes and regains its initial northward direction along the whole canal (November 1935 and 1936). In the various parts of the Suez Canal, currents change direction over periods of hours and days due to tidal and nontidal factors, but the main criterion is the net outflow from the canal which has a seasonal character. Quantitatively, the current regime in the Suez Canal is defined by the net outflow from the canal. This net outflow can be taken as the resultant expression of the complex system of currents in the canal. Continuous recording of currents from 1933 to 1935 by IDRAC recording current meters at two points in the southern and northern canals demonstrated quantitatively a net northward outflow into the Mediterranean from the Red Sea during most of the year and a net southward outflow into the Red Sea from the Mediterranean during late summer. For example, in 1935, there was a net northward outflow of 5,250 x lo6 m3 into the Mediterranean in the first period and a net southward outflow of 150 X lo6 m3 into the Red Sea in the second period (C.U.C.M.S. 1937). Passing through the Great Bitter Lakes, this latter outflow causes a sharp increase in the salinity in Suez Bay during August and September every year. Morcos and Messieh (1973) showed that such an in- crease in salinity did not take place at any time during Therefore, it can be safely stated that the net southward outflow from the canal into the Red Sea, hitherto always observed in late summer, did not occur in late summer Finally, Hassan and El-Sabh agree that an unusual phenomenon occurred in the current regime in the Suez Canal during 1966, and that (p. 671) the degree of influence of the stoppage of the Nile flood can be established only by repeated observations over several years. In their view, this unusual phenomenon is only a decrease in the magnitude of the reversal, but according to the evidence given above it was a change in the seasonal pattern of the current regime. My conclusion is that the northward current regime during winter and early summer 1966 was followed by a transitional period with very weak currents flowing from both ends to the Bitter Lakes. By mid-september the current had regained its northward direction without being reversed to the south. S&m Division of Marine Sciences UNESCO, Paris France References A. Morcosl BAUSSAN, J Variations annuelles de niveau le long du Canal de Suez. Rev. Geogr. Phys. Geol. Dyn. 11: COMPAGNIE UNIVERSELLE DU CANAL MARITIME DE SUEZ Debit du Canal Maritime. Comm. Consult. Int. Trav., Reun : and appendix 17. EL-SABH, M. I Seasonal hydrographic variations in the Suez Canal after the completion of the Aswan High Dam. Kiel. Meeresforsch. 25 : HASSAN, E. M., AND M. I. EL-SABH Circulation and salinity distribution in the southern part of the Suez Canal. Limnol. Oceanogr. 20 : Former address: Department of Oceanography, Faculty of Science, University of Alexandria, Alexandria, Egypt.
8 Comment 679 MILLER, A. R., AND R. G. MUNNS The Bitter Lake salt barrier, p In L Ockanographie physique de la Mer Rouge, IAPSO-UNESCO-SCOR Symp., Paris, CNEXO Publ. Ser. Actes Colloq. 2. I~IORCOS, S. A. 1960a. The tidal currents in the southern part of the Suez Canal. Publ. Int. Assoc. Sci. Hydrol. Comm. Surface Waters 51: b. Die Verteilung des Salzhalts im Suez Canal. Kiel. Meeresforsch. 16: Effect of the Aswan High Dam on the current regime in the Suez Canal. Nature ( Lond. ) 214 : AND M. A. GERGES Circulation and mean sea level in the Suez Canal, p In L Oceanographie physique de la Mer Rouge, IAPSO-UNESCO-SCOR Symp., Paris, CNEXO Publ. Ser. Actes Colloq. 2. AND S. N. MESSIEH Circulation and salinity distribution in the southern part of the Suez Canal. Limnol. Oceanogr. 18:
What is an Estuary? Importance of Estuaries. Importance of Estuaries. Importance of Estuaries
 Oceanography 101, Richard Strickland Lecture 20 What is an Estuary? Portion of the ocean that is semi-enclosed by land and diluted by freshwater runoff All estuaries are embayments But embayments without
The Coriolis force, geostrophy, Rossby waves and the westward intensification
 Chapter 3 The Coriolis force, geostrophy, Rossby waves and the westward intensification The oceanic circulation is the result of a certain balance of forces. Geophysical Fluid Dynamics shows that a very
A STUDY OF THE PHYSICAL ENVIRONMENT AND WATER CIRCULATION IN FARWA LAGOON, LIBYA
 131 A STUDY OF THE PHYSICAL ENVIRONMENT AND WATER CIRCULATION IN FARWA LAGOON, LIBYA 1 2 M. GERGES and A. DURGHAM 1 UNESCO E:x:pex>t at MRC 2Marine Scientist at MB.C, TX'ipoU, Libya, S.P.L.A.J. ABSTRACT
Chapter 22, Section 1 - Ocean Currents. Section Objectives
 Chapter 22, Section 1 - Ocean Currents Section Objectives Intro Surface Currents Factors Affecting Ocean Currents Global Wind Belts (you should draw and label a diagram of the global wind belts) The Coriolis
Chapter 11 Tides. A tidal bore is formed when a tide arrives to an enclosed river mouth. This is a forced wave that breaks.
 Chapter 11 Tides A tidal bore is formed when a tide arrives to an enclosed river mouth. This is a forced wave that breaks. Tidal range can be very large Tide - rhythmic oscillation of the ocean surface
Water circulation in Dabob Bay, Washington: Focus on the exchange flows during the diurnal tide transitions
 Water circulation in Dabob Bay, Washington: Focus on the exchange flows during the diurnal tide transitions Jeong-in Kang School of Oceanography University of Washington (206) 349-7319 nortiumz@u.washington.edu
The events associated with the Great Tsunami of 26 December 2004 Sea Level Variation and Impact on Coastal Region of India
 The events associated with the Great Tsunami of 26 December 2004 Sea Level Variation and Impact on Coastal Region of India Satish R. Shetye National Institute of Oceanography, Goa Tsunamis are shallow-water
EARTH, PLANETARY, & SPACE SCIENCES 15 INTRODUCTION TO OCEANOGRAPHY. LABORATORY SESSION #6 Fall Ocean Circulation
 EARTH, PLANETARY, & SPACE SCIENCES 15 INTRODUCTION TO OCEANOGRAPHY LABORATORY SESSION #6 Fall 2017 Ocean Circulation The focus of the Lab this week is circulation of the ocean and atmosphere. Here, you
SOME WATER CHARACTERISTICS OF ESTUARIES IN INDONESIA
 SOME WATER CHARACTERISTICS OF ESTUARIES IN INDONESIA by HENK L. UKTOLSEYA 1 ABSTRACT This paper describes the results obtained during several hydro-oceanographical observations of some estuaries in Indonesia
OCN 201 Surface Circulation
 OCN 201 Surface Circulation Excess heat in equatorial regions requires redistribution toward the poles 1 In the Northern hemisphere, Coriolis force deflects movement to the right In the Southern hemisphere,
7.4 Temperature, Salinity and Currents in Jamaica Bay
 7.4 Temperature, Salinity and Currents in Jamaica Bay Arnold Gordon, Bruce Huber and Robert Houghton 7.4.1 INTRODUCTION Jamaica Bay stratification is weakly indicative of a shallow, tidally active environment,
Geostrophic and Tidal Currents in the South China Sea, Area III: West Philippines
 Southeast Asian Fisheries Development Center Geostrophic and Tidal Currents in the South China Sea, Area III: West Philippines Anond Snidvongs Department od Marine Science, Chulalongkorn University, Bangkok
Structure and discharge test cases
 Chapter 28 Structure and discharge test cases 28.1 Introduction Three test case have been implemented to test the performance and applicability of the structures and discharges modules. drythin Simulates
Directed Reading. Section: Ocean Currents. a(n). FACTORS THAT AFFECT SURFACE CURRENTS
. FACTORS THAT AFFECT SURFACE CURRENTS") Skills Worksheet Directed Reading Section: Ocean Currents 1. A horizontal movement of water in a well-defined pattern is called a(n). 2. What are two ways that oceanographers identify ocean currents? 3.
Skills Worksheet Directed Reading Section: Ocean Currents 1. A horizontal movement of water in a well-defined pattern is called a(n). 2. What are two ways that oceanographers identify ocean currents? 3.
Earth s oceans covers 71 % _ of the planet s surface. In reality, Earth s ocean waters are all. interconnected as part of a single large global ocean.
 Ocean Motion Met 101: Introduction to the World's Oceans Produced by The COMET Program Geography: Name Pd. Earth s oceans covers 71 % _ of the planet s surface. In reality, Earth s ocean waters are all
Case Studies. Georg Umgiesser and Natalja Čerkasova KU, Lithuania
 Case Studies Georg Umgiesser and Natalja Čerkasova KU, Lithuania Case 1: A beach in the Curonian Lagoon Beach Current situation in Curonian lagoon Beach in Kintai In the past, especially in Baltic inner
Summary of Lecture 10, 04 March 2008 Introduce the Hadley circulation and examine global weather patterns. Discuss jet stream dynamics jet streams
 Summary of Lecture 10, 04 March 2008 Introduce the Hadley circulation and examine global weather patterns. Discuss jet stream dynamics jet streams arise because the Coriolis force prevents Hadley-type
The Setting - Climatology of the Hawaiian Archipelago. Link to Video of Maui Waves
 The Setting - Climatology of the Hawaiian Archipelago Link to Video of Maui Waves What caused this week s weather? What caused this weekend s weather? Today s Objective: Provide overview and description
SIO 210 Problem Set 3 November 4, 2011 Due Nov. 14, 2011
 SIO 210 Problem Set 3 November 4, 2011 Due Nov. 14, 2011 1. At 20 N, both the ocean and the atmosphere carry approximately 2 PW of heat poleward, for a total of about 4 PW (see figure). If (at this latitude)
Case Studies Georg Umgiesser and Natalja Čerkasova KU, Lithuania
 Case Studies Georg Umgiesser and Natalja Čerkasova KU, Lithuania Case 1: A beach in the Curonian Lagoon 1 Beach Current situation in Curonian lagoon Beach in Kintai In the past, especially in Baltic inner
THE CIRCULATION IN THE NORTERN PART OF THE DENMARK STRAIT AND ITS VARIABILITY ABSTRACT
 ICES em 19991L:06 THE CIRCULATION IN THE NORTERN PART OF THE DENMARK STRAIT AND ITS VARIABILITY Steingrimur J6nsson Marine Research Institute and University of Akureyri, Glenirgata 36, 600 Akureyri, Iceland,
MODELING INDIAN OCEAN CIRCULATION: BAY OF BENGAL FRESH PLUME AND ARABIAN SEA MINI WARM POOL
 MODELING INDIAN OCEAN CIRCULATION: BAY OF BENGAL FRESH PLUME AND ARABIAN SEA MINI WARM POOL P. N. Vinayachandran* 1 1, *2 and J. Kurian* * 1 Centre for Atmospheric and Oceanic Sciences, Indian Institute
Alongshore wind stress (out of the page) Kawase/Ocean 420/Winter 2006 Upwelling 1. Coastal upwelling circulation
 Kawase/Ocean 420/Winter 2006 Upwelling 1. Coastal upwelling circulation") Kawase/Ocean 420/Winter 2006 Upwelling 1 Coastal upwelling circulation We found that in the northern hemisphere, the transport in the surface Ekman layer is to the right of the wind. At the bottom, there
Kawase/Ocean 420/Winter 2006 Upwelling 1 Coastal upwelling circulation We found that in the northern hemisphere, the transport in the surface Ekman layer is to the right of the wind. At the bottom, there
FINAL REPORT APPENDIX A. Physical Description of the Shubenacadie River
 FINAL REPORT APPENDIX A Physical Description of the Shubenacadie River Smart Solutions for Engineering, Science and Computing Physical Description of the Shubenacadie River Martec Technical Report # TR-07-12
PROPERTIES OF NEARSHORE CURRENTS
 Terry Hendricks PROPERTIES OF NEARSHORE CURRENTS During this past year, we have initiated a program to obtain a better understanding of the properties of the currents flowing over the nearshore shelf area
Impact of the tides, wind and shelf circulation on the Gironde river plume dynamics
 Impact of the tides, wind and shelf circulation on the Gironde river plume dynamics F. Toublanc 1, N. Ayoub 2, P. Marsaleix 3, P. De Mey 2 1 CNES/LEGOS 2 CNRS/LEGOS 3 CNRS/LA, Toulouse, France 5th GODAE
CHAPTER 134 INTRODUCTION
 CHAPTER 134 NEW JETTIES FOR TUNG-KANG FISHING HARBOR, TAIWAN Chi-Fu Su Manager Engineering Department Taiwan Fisheries Consultants, Inc. Taipei, Taiwan INTRODUCTION Tung-Kang Fishing Harbor, which is about
Chapter 10 Lecture Outline. The Restless Oceans
 Chapter 10 Lecture Outline The Restless Oceans Focus Question 10.1 How does the Coriolis effect influence ocean currents? The Ocean s Surface Circulation Ocean currents Masses of water that flow from one
Thermohaline Front at the Mouth of Ise Bay
 Journal of Oceanography, Vol. 53, pp. 403 to 409. 1997 Short Contribution Thermohaline Front at the Mouth of Ise Bay TETSUO YANAGI 1, XINYU GUO 1, TOSHIRO SAINO 2, TAKASHI ISHIMARU 3 and SINICHIRO NORIKI
Appendix 5: Currents in Minas Basin. (Oceans Ltd. 2009)
") Appendix 5: Currents in Minas Basin (Oceans Ltd. 29) Current in Minas Basin May 1, 28 March 29, 29 Submitted To: Minas Basin Pulp and Power P.O. Box 41 53 Prince Street Hansport, NS, BP 1P by 22, Purdy
Appendix 5: Currents in Minas Basin (Oceans Ltd. 29) Current in Minas Basin May 1, 28 March 29, 29 Submitted To: Minas Basin Pulp and Power P.O. Box 41 53 Prince Street Hansport, NS, BP 1P by 22, Purdy
Serial No. N4503 NAFO SCR Doc. 01/115. SCIENTIFIC COUNCIL MEETING SEPTEMBER 2001 (Deep-sea Fisheries Symposium Poster)
") NOT TO BE CITED WITHOUT PRIOR REFERENCE TO THE AUTHOR(S) Northwest Atlantic Fisheries Organization Serial No. N4503 NAFO SCR Doc. 01/115 SCIENTIFIC COUNCIL MEETING SEPTEMBER 2001 (Deep-sea Fisheries Symposium
NOT TO BE CITED WITHOUT PRIOR REFERENCE TO THE AUTHOR(S) Northwest Atlantic Fisheries Organization Serial No. N4503 NAFO SCR Doc. 01/115 SCIENTIFIC COUNCIL MEETING SEPTEMBER 2001 (Deep-sea Fisheries Symposium
SAND BOTTOM EROSION AND CHANGES OF AN ACTIVE LAYER THICKNESS IN THE SURF ZONE OF THE NORDERNEY ISLAND
 SAND BOTTOM EROSION AND CHANGES OF AN ACTIVE LAYER THICKNESS IN THE SURF ZONE OF THE NORDERNEY ISLAND Kos'yan R. 1, Kunz H. 2, Podymov l. 3 1 Prof.Dr.,The Southern Branch of the P.P.Shirshov Institute
Land use changes and their impacts on extreme events. By Millán M. Millán
 Land use changes and their impacts on extreme events By Millán M. Millán Conference: Land as a Resource, Brussels 19 June 2014 Atlantic Fronts 20% Decreasing Summer Storms 15% Decreasing Gone Mediterranean
EFFECT OF LARGE-SCALE RESERVOIR OPERATION ON FLOW REGIME IN THE CHAO PHRAYA RIVER BASIN, KINGDOM OF THAILAND
 EFFECT OF LARGE-SCALE RESERVOIR OPERATION ON FLOW REGIME IN THE CHAO PHRAYA RIVER BASIN, KINGDOM OF THAILAND TAICHI TEBAKARI Hydraulic Engineering Research Group, Public Works Research Institute 1, Minamihara,
LONG WAVES OVER THE GREAT BARRIER REEF. Eric Wolanski ABSTRACT
 LONG WAVES OVER THE GREAT BARRIER REEF by Eric Wolanski k ABSTRACT Low-frequency forcing of water currents over the continental shelf f Australia is quite strong and should be taken into account when the
SIO 210 Introduction to Physical Oceanography Mid-term examination November 4, 2013; 50 minutes
 SIO 210 Introduction to Physical Oceanography Mid-term examination November 4, 2013; 50 minutes Closed book; one sheet of your own notes is allowed. A calculator is allowed. (100 total points.) Possibly
Winds and Ocean Circulations
 Winds and Ocean Circulations AT 351 Lab 5 February 20, 2008 Sea Surface Temperatures 1 Temperature Structure of the Ocean Ocean Currents 2 What causes ocean circulation? The direction of most ocean currents
Seasonal Circulation in the Yellow and the East China Seas driven by the monsoon winds
 Seasonal Circulation in the Yellow and the East China Seas driven by the monsoon winds Ig-Chan Pang 1 and Jae-Hong Moon 2 1 : Cheju National University 2 : Department of Earth System Science and Technology,
Lesson: Ocean Circulation
 Lesson: Ocean Circulation By Keith Meldahl Corresponding to Chapter 9: Ocean Circulation As this figure shows, there is a connection between the prevailing easterly and westerly winds (discussed in Chapter
AIS data analysis for vessel behavior during strong currents and during encounters in the Botlek area in the Port of Rotterdam
 International Workshop on Next Generation Nautical Traffic Models 2013, Delft, The Netherlands AIS data analysis for vessel behavior during strong currents and during encounters in the Botlek area in the
Volume and Shoreline Changes along Pinellas County Beaches during Tropical Storm Debby
 Volume and Shoreline Changes along Pinellas County Beaches during Tropical Storm Debby Ping Wang and Tiffany M. Roberts Coastal Research Laboratory University of South Florida July 24, 2012 Introduction
Currents measurements in the coast of Montevideo, Uruguay
 Currents measurements in the coast of Montevideo, Uruguay M. Fossati, D. Bellón, E. Lorenzo & I. Piedra-Cueva Fluid Mechanics and Environmental Engineering Institute (IMFIA), School of Engineering, Research
Section 6. The Surface Circulation of the Ocean. What Do You See? Think About It. Investigate. Learning Outcomes
 Chapter 5 Winds, Oceans, Weather, and Climate Section 6 The Surface Circulation of the Ocean What Do You See? Learning Outcomes In this section, you will Understand the general paths of surface ocean currents.
SIO 210 Final examination Wednesday, December 11, PM Sumner auditorium Name:
 SIO 210 Final examination Wednesday, December 11, 2013 2-5 PM Sumner auditorium Name: Turn off all phones, ipods, etc. and put them away. This is a closed book exam. You may use one page of notes, both
Frontal Processes in the Columbia River Plume Area
 Portland State University PDXScholar Civil and Environmental Engineering Faculty Publications and Presentations Civil and Environmental Engineering 2-1-2006 Frontal Processes in the Columbia River Plume
Nortek Technical Note No.: TN-021. Chesapeake Bay AWAC Evaluation
 Nortek Technical Note No.: TN-021 Title: Chesapeake Bay AWAC Evaluation Last Edited: October 5, 2004 Authors: Eric Siegel-NortekUSA, Chris Malzone-NortekUSA, Torstein Pedersen- Number of Pages: 12 Chesapeake
Chapter 10. Adjacent seas of the Pacific Ocean
 Chapter 10 Adjacent seas of the Pacific Ocean Although the adjacent seas of the Pacific Ocean do not impact much on the hydrography of the oceanic basins, they cover a substantial part of its area and
Reply of Guyana Annex R2
 Summary of Findings: Analysis of Recent Shoreline Revisions to the This report assesses recent shoreline changes made to the 2005 edition of Dutch nautical chart NL 2218. This new edition is credited jointly
Tidally influenced environments. By Alex Tkaczyk, Henrique Menezes, and Isaac Foli
 Tidally influenced environments By Alex Tkaczyk, Henrique Menezes, and Isaac Foli Goals and aims Describe the role of tidal influence in depositional environments. - Deltas - Estuaries Provide an overview
The Continuing Evolution of the New Inlet
 The Continuing Evolution of the New Inlet Charles N. Flagg, Roger Flood and Robert Wilson School of Marine and Atmospheric Sciences, Stony Brook University It is now a year plus since super storm Sandy
10.6 The Dynamics of Drainage Flows Developed on a Low Angle Slope in a Large Valley Sharon Zhong 1 and C. David Whiteman 2
 10.6 The Dynamics of Drainage Flows Developed on a Low Angle Slope in a Large Valley Sharon Zhong 1 and C. David Whiteman 2 1Department of Geosciences, University of Houston, Houston, TX 2Pacific Northwest
3 The monsoon currents in an OGCM
 3 The monsoon currents in an OGCM The observations show that both Ekman drift and geostrophy contribute to the surface circulation in the north Indian Ocean. The former decays rapidly with depth, but the
OCN 201 Tides. Tsunamis, Tides and other long waves
 OCN 201 Tides Tsunamis, Tides and other long waves Storm surges Caused by winds and low atmospheric pressure associated with large storms Can raise sea surface by up to 25 ft, bottom contours magnify effect
THE RESPONSE OF THE GULF OF MAINE COASTAL CURRENT SYSTEM TO LATE-SPRING
 THE RESPONSE OF THE GULF OF MAINE COASTAL CURRENT SYSTEM TO LATE-SPRING NORTHEASTERLY WIND FORCING Neal R Pettigrew and Huijie Xue School of Marine Sciences University of Maine, Orono ME 04469 The Gulf
STUDY ON TSUNAMI PROPAGATION INTO RIVERS
 ABSTRACT STUDY ON TSUNAMI PROPAGATION INTO RIVERS Min Roh 1, Xuan Tinh Nguyen 2, Hitoshi Tanaka 3 When tsunami wave propagation from the narrow river mouth, water surface is raised and fluctuated by long
Sea and Land Breezes METR 4433, Mesoscale Meteorology Spring 2006 (some of the material in this section came from ZMAG)
") Sea and Land Breezes METR 4433, Mesoscale Meteorology Spring 2006 (some of the material in this section came from ZMAG) 1 Definitions: The sea breeze is a local, thermally direct circulation arising from
Sea and Land Breezes METR 4433, Mesoscale Meteorology Spring 2006 (some of the material in this section came from ZMAG) 1 Definitions: The sea breeze is a local, thermally direct circulation arising from
Suez Canal grounding with pilot onboard
 August 2016 Suez Canal grounding with pilot onboard The oil tanker was transiting the Suez Canal and had loaded crude oil in North Africa, and was on its way to India. On the bridge were the pilot, master,
ESS15 Lecture 12. Review, tropical oceans & El Nino, and the thermohaline ocean circulation. Please see new reading material on website.
 ESS15 Lecture 12 Review, tropical oceans & El Nino, and the thermohaline ocean circulation. Please see new reading material on website. Review. I-clicker exercise: In this graph of Earth s energy imbalances
The role of the inter-bar depressions in hydrodynamic and sediment transport processes of sandy macrotidal beaches
 The role of the inter-bar depressions in hydrodynamic and sediment transport processes of sandy macrotidal beaches Adrien CARTIER 1,2, Arnaud HÉQUETTE 1,2 and Philippe LARROUDE 3 1. Laboratoire d Océanologie
Managing and Adapting to Sea Level Rise in Egypt. Coastal Research Institute
 Managing and Adapting to Sea Level Rise in Egypt Coastal Research Institute Global Perspective Climate-induced increases in sea level are caused by thermal expansion of the oceans and melting of land ice
Chapter 9 Insolation control of monsoons 2004/4/15
 Chapter 9 Insolation control of monsoons 2004/4/15 Introduction Monsoon circulations exist on Earth today because the land responds to seasonal changes in solar radiation much more quickly than does the
Hydrographical Researches in the Western. Equatorial Pacific. Tadao Takahashi. Abstract
 141 Hydrographical Researches in the Western Equatorial Pacific by Tadao Takahashi Abstract Several hydrographical researches in the western Equatorial Pacific were made by Kagoshima-maru and Keiten-maru
OCN 201, Chemistry & Physics Section
 , A 1-April-2015 Name: Answer the True/False and Multiple Choice questions on the scantron sheet. Answer the remaining questions on this exam handout. Turn in both the scantron and exam at the end of class.
Duckies have been found in Hawaii, Alaska, S. America, Scotland, Washington state and Australia as of 2012.
 Duckies have been found in Hawaii, Alaska, S. America, Scotland, Washington state and Australia as of 2012. We learned that it takes 3 years to complete one circuit of the North Pacific Gyre flow in the
ATS150: Global Climate Change. Oceans and Climate. Icebergs. Scott Denning CSU 1
 The Oceans Wind-Driven Gyre Circulations Icebergs Scott Denning CSU 1 Surface Balance of Forces friction coriolis wind stress resultant current Wind stress accelerates surface water Friction couples surface
Chapter 9: Circulation of the Ocean
 Chapter 9: Circulation of the Ocean Tropical gardens on Britain s Scilly Isles. Only 48 kilometers (30 miles) off the coast of Cornwall at 50 N, these scenic islands lie in the path of the warm waters
Upstream environment for SBI - Modeled and observed biophysical conditions in the northern Bering Sea
 Upstream environment for SBI - Modeled and observed biophysical conditions in the northern Bering Sea Jaclyn Clement 1, Wieslaw Maslowski 1, Lee Cooper 2, Jacqueline Grebmeier 2, Waldemar Walczowski 3,
.y..o ~ - \ o ~ ~~~I bl:..ill & ~j.a,_,.,ui J-1 ~4 b~
 Qatar Univ. Sci. J. (1993), 13(2.): 353-357 SEASONAL VARIATIONS OF ACOUSTIC PROPERTIES IN ROPME SEA AREA By A. A. H. EL-GINDY* *Department of Marine Sciences, Faculty of Science, University of Qatar, Doha,
Landmark for the spawning of Japanese eel
 Landmark for the spawning of Japanese eel Shingo KIMURA and Katsumi TSUKAMOTO Ocean Research Institute, Univ. of Tokyo Salinity front in the North Equatorial Current El Niño/Southern Oscillation Index
Training program on Modelling: A Case study Hydro-dynamic Model of Zanzibar channel
 Training program on Modelling: A Case study Hydro-dynamic Model of Zanzibar channel Mayorga-Adame,C.G., Sanga,I.P.L., Majuto, C., Makame, M.A., Garu,M. INTRODUCTION Hydrodynamic Modeling In understanding
CALCASIEU SALINITY STRUCTURES. HYDRODYNAMIC MODELING (To Support Design of Salinity Barriers)
") CALCASIEU SALINITY STRUCTURES HYDRODYNAMIC MODELING (To Support Design of Salinity Barriers) Presentation Overview 1 2 3 4 5 Project Overview and CEA Circulation Modeling Vessel Hydrodynamics Modeling
CALCASIEU SALINITY STRUCTURES HYDRODYNAMIC MODELING (To Support Design of Salinity Barriers) Presentation Overview 1 2 3 4 5 Project Overview and CEA Circulation Modeling Vessel Hydrodynamics Modeling
SURFACE CURRENTS AND TIDES
 NAME SURFACE CURRENTS AND TIDES I. Origin of surface currents Surface currents arise due to the interaction of the prevailing wis a the ocean surface. Hence the surface wi pattern (Figure 1) plays a key
OCEANOGRAPHY STUDY GUIDE
 OCEANOGRAPHY STUDY GUIDE Chapter 2 Section 1 1. Most abundant salt in ocean. Sodium chloride; NaCl 2. Amount of Earth covered by Water 71% 3. Four oceans: What are they? Atlantic, Pacific, Arctic, Indian
DEAD-ENDCHANNELFLUSHINGINHARBORS
 DEAD-ENDCHANNELFLUSHNGNHARBORS PURPOSE: The purpose of this technical note is to present some design con- siderations which benefit dead-end channel flushing. Some of these factors can also be used to
Surf Survey Summary Report
 Port Otago Limited 15 Beach Street Port Chalmers Surf Survey Summary Report August 13-September 1 Leigh McKenzie Summary of Surf Locations of Interest Port Otago Ltd is undertaking monitoring of changes
Impact of Dredging the Lower Narrow River on Circulation and Flushing
 Impact of Dredging the Lower Narrow River on Circulation and Flushing Craig Swanson Ph.D. Swanson Environmental Alex Shaw Ocean Engineering, URI Prof. Malcolm L. Spaulding Ocean Engineering, URI 29 January
Ocean Motion Notes. Chapter 13 & 14
 Ocean Motion Notes Chapter 13 & 14 What is a Wave? Wave: movement of energy through a body of water How are Waves Caused? Caused mostly by wind Wind blowing on the water transmits energy to the water Size
Ocean Circulation. Si Hui Lee and Frances Wen. You can access ME at
 Ocean Circulation Si Hui Lee and Frances Wen You can access ME at http://tinyurl.com/oceancirculation Earth - the blue planet - 71% area covered by the oceans - 3/4 of ocean area between 3000-6000m deep
FIELD MEASUREMENTS OF SURFACE SUSPENDED SEDIMENT CONCENTRATION IN THE YANGTZE ESTUARY, CHINA
 International Conference on Estuaries and Coasts November 9-11, 2003, Hangzhou, China FIELD MEASUREMENTS OF SURFACE SUSPENDED SEDIMENT CONCENTRATION IN THE YANGTZE ESTUARY, CHINA Qing HE, Zhiying YU, Yuanye
Status of fisheries resources of bitter lakes, Suez Canal, Egypt
 Status of fisheries resources of bitter lakes, Suez Canal, Egypt Ashraf I. Ahmed and Asmaa H. El-Karamany Marine Science Department, Faculty of Science, Suez Canal University, 41522 Ismailia, Egypt ashrafibrahim2002@yahoo.com
Seasonal Variation of Stratification in the Gulf of Thailand
 Journal of Oceanography, Vol. 57, pp. 461 to 470, 2001 Seasonal Variation of Stratification in the Gulf of Thailand TETSUO YANAGI 1 *, SUHENDAR I SACHOEMAR 2, TOSHIYUKI TAKAO 3 and SHUNJI FUJIWARA 4 1
Monday, October 2, Watch for new assessment (Week 4/5 review) TA s have your tests, please see key (at course website)
 TA s have your tests, please see key (at course website)") Monday, October 2, 2017 Watch for new assessment (Week 4/5 review) TA s have your tests, please see key (at course website) Homework 3 Due date Wednesday, Oct 11 (8 pm) Be ready to watch another important
Monday, October 2, 2017 Watch for new assessment (Week 4/5 review) TA s have your tests, please see key (at course website) Homework 3 Due date Wednesday, Oct 11 (8 pm) Be ready to watch another important
HOURLY OCEANOGRAPHIC AND ACOUSTIC VARIATIONS IN THE STRAIT OF GIBRALTAR, AND MULTIBEAM ECHOSOUNDER TECHNOLOGY
 International Hydrographic Review, Monaco, LXXIII(2), September 1996 HOURLY OCEANOGRAPHIC AND ACOUSTIC VARIATIONS IN THE STRAIT OF GIBRALTAR, AND MULTIBEAM ECHOSOUNDER TECHNOLOGY by RUIZ-CANAVATE,1 A.
IX. Upper Ocean Circulation
 IX. Upper Ocean Circulation World Ocean Covers 71% of Earth s surface Contains 97% of surface water Arctic Ocean NH: 61% ocean, 39% land Pacific Ocean Atlantic Ocean Southern Ocean Indian Ocean SH: 81%
Table 4. Volumetric Change Rates Pre-Project and Post-Project for the Town of Duck
 V. VOLUMETRIC CHANGES General Volumetric changes measured over the entire monitoring area for various time periods are provided in Table 4. The volume changes are given in terms of cubic yards/foot of
Temperature, Salinity, Dissolved Oxygen and Water Masses of Vietnamese Waters
 Southeast Asian Fisheries Development Center Temperature, Salinity, Dissolved Oxygen and Water Masses of Vietnamese Waters Penjan Rojana-anawat, Siriporn Pradit, Natinee Sukramongkol and Somboon Siriraksophon
An Update of Coastal Erosion in Puerto Rico
 Jack Morelock and Maritza Barreto An Update of Coastal Erosion in Puerto Rico Department of Marine Sciences, University of Puerto Rico at Mayagüez and Geography Department, University of Puerto Rico at
The Air-Sea Interaction. Masanori Konda Kyoto University
 2 The Air-Sea Interaction Masanori Konda Kyoto University 2.1 Feedback between Ocean and Atmosphere Heat and momentum exchange between the ocean and atmosphere Atmospheric circulation Condensation heat
Hydrological Condition Report including the issues of High Flow Fluctuation in Chiang Saen
 Hydrological Condition Report including the issues of High Flow Fluctuation in Chiang Saen Technical Symposium for ESCIR and MRC on Social Impact Assessment in River Basin Management Sothea KHEM, HENG
CHAPTER 21 VARIABLE DISPERSION AND ITS EFFECTS ON THE MOVEMENTS OF TRACERS ON BEACHES
 CHAPTER 21 VARIABLE DISPERSION AND ITS EFFECTS ON THE MOVEMENTS OF TRACERS ON BEACHES W. A. Price, Senior Principal Scientific Officer Hydraulics Research Station, Wallmgford, Great Britain SUMMARY To
Shoreline changes and reef strengthening at Kavaratti island in Lakshadweep Archipelago - A case study
 Indian Journal of Geo-Marine Sciences Vol. 43(7), July 2014, pp. 1140-1144 Shoreline changes and reef strengthening at Kavaratti island in Lakshadweep Archipelago - A case study T.N.Prakash*, L.Sheela
Broadly speaking, there are four different types of structures, each with its own particular function:
 3 The selection of structures 3.1 Introduction In selecting a suitable structure to measure or regulate the flow rate in open channels, all demands that will be made upon the structure should be listed.
Current mooring observations in the area of the South Kuril Islands
 Current mooring observations in the area of the South Kuril Islands Georgy Shevchenko, Gennady Kantakov 2* and Valery Chastikov 2 Institute of Marine Geology and Geophysics FEB RAS, Yuzhno-Sakhalinsk,
OCN 201 Lab Fall 2009 OCN 201. Lab 9 - El Niño
 OCN 201 Lab Fall 2009 OCN 201 Lab 9 - El Niño El Niño is probably one of the most widely publicized oceanic phenomena. If there s one single reason for that it s probably the fact that El Niño s presence
ESCI 107/109 The Atmosphere Lesson 9 Wind
 Reading: Meteorology Today, Chapter 8 ABOUT WIND Wind is the motion of the air. ESCI 107/109 The Atmosphere Lesson 9 Wind The direction of the wind is given by which direction it is blowing from. For example,
Historical Analysis of Montañita, Ecuador for April 6-14 and March 16-24
 Historical Analysis of Montañita, Ecuador for April 6-14 and March 16-24 Prepared for the ISA by Mark Willis and the Surfline Forecast and Science Teams Figure 1. Perfect Right- hander at Montañita, Ecuador
August 1990 H. Kondo 435. A Numerical Experiment on the Interaction between Sea Breeze and
 August 1990 H. Kondo 435 A Numerical Experiment on the Interaction between Sea Breeze and Valley Wind to Generate the so-called "Extended Sea Breeze" By Hiroaki Kondo National Research Institute for Pollution
Temperature, salinity, density, and the oceanic pressure field
 Chapter 2 Temperature, salinity, density, and the oceanic pressure field The ratios of the many components which make up the salt in the ocean are remarkably constant, and salinity, the total salt content
Equilibrium Model of Tides
 Tides Outline Equilibrium Theory of Tides diurnal, semidiurnal and mixed semidiurnal tides spring and neap tides Dynamic Theory of Tides rotary tidal motion larger tidal ranges in coastal versus open-ocean
Tidal River Management (TRM)-An Innovative Scientific Approach for Sustainable Sediment Management
-An Innovative Scientific Approach for Sustainable Sediment Management") Paper ID: WRE-029 954 International Conference on Recent Innovation in Civil Engineering for Sustainable Development () Department of Civil Engineering DUET - Gazipur, Bangladesh Tidal River Management
Paper ID: WRE-029 954 International Conference on Recent Innovation in Civil Engineering for Sustainable Development () Department of Civil Engineering DUET - Gazipur, Bangladesh Tidal River Management