DREDGING THE HATTER BARN ROUTE
|
|
|
- Horatio Adams
- 5 years ago
- Views:
Transcription
1 International H ydrographie Review, M onaco, LX III (2), July 1986 DREDGING THE HATTER BARN ROUTE by Lt. Cdr. J.O. GRAVGAARD, Royal D anish Navy (*) 1. INTRODUCTION 1.1 One of the requirements a hydrographic surveyor may encounter in his work is to check dredging carried out by dredgers to determine whether or not the required depth has been obtained. 1.2 The article describes the hydrographic control survey in the newly dredged route in H atter Barn from the point of view of a hydrographic surveyor, giving the background for the route, the prelim inary survey, the contract and the control survey. The dredged route itself is of exceptional im portance for the scheme for its im plem entation denies certain ocean shipping use of a traditional transit area in the interests o f safer navigation. 1.3 The article by Mr. J.M. B a r b i e r and Mr. M. C h a u m e t - L a g r a n g e [1] is used as a guideline for a technical description of the survey system, the navigation system, and the echo sounding and side scan sonar systems o f the survey launch SKA 11 [2] which perform ed the survey. 2. BACKGROUND 2.1 The D EEP WATER ROUTE, Route T, passes through Danish waters, following the deepest possible path from the N orth Sea to the Baltic Sea. Yearly, some 20,000 ships use this route. The H atter Barn is situated midway (see figures 1 & 2) with its characteristic 80 turn. Furtherm ore, this area is characterized by the following : depths varying from 5 to 60 m currents either N E or SW up to 3-4 knots m inim um width o f the route 800 m (*) Svitzer Surveys, 4, H avnen, P.O. Box 178, DK-7620 LEM V IG.
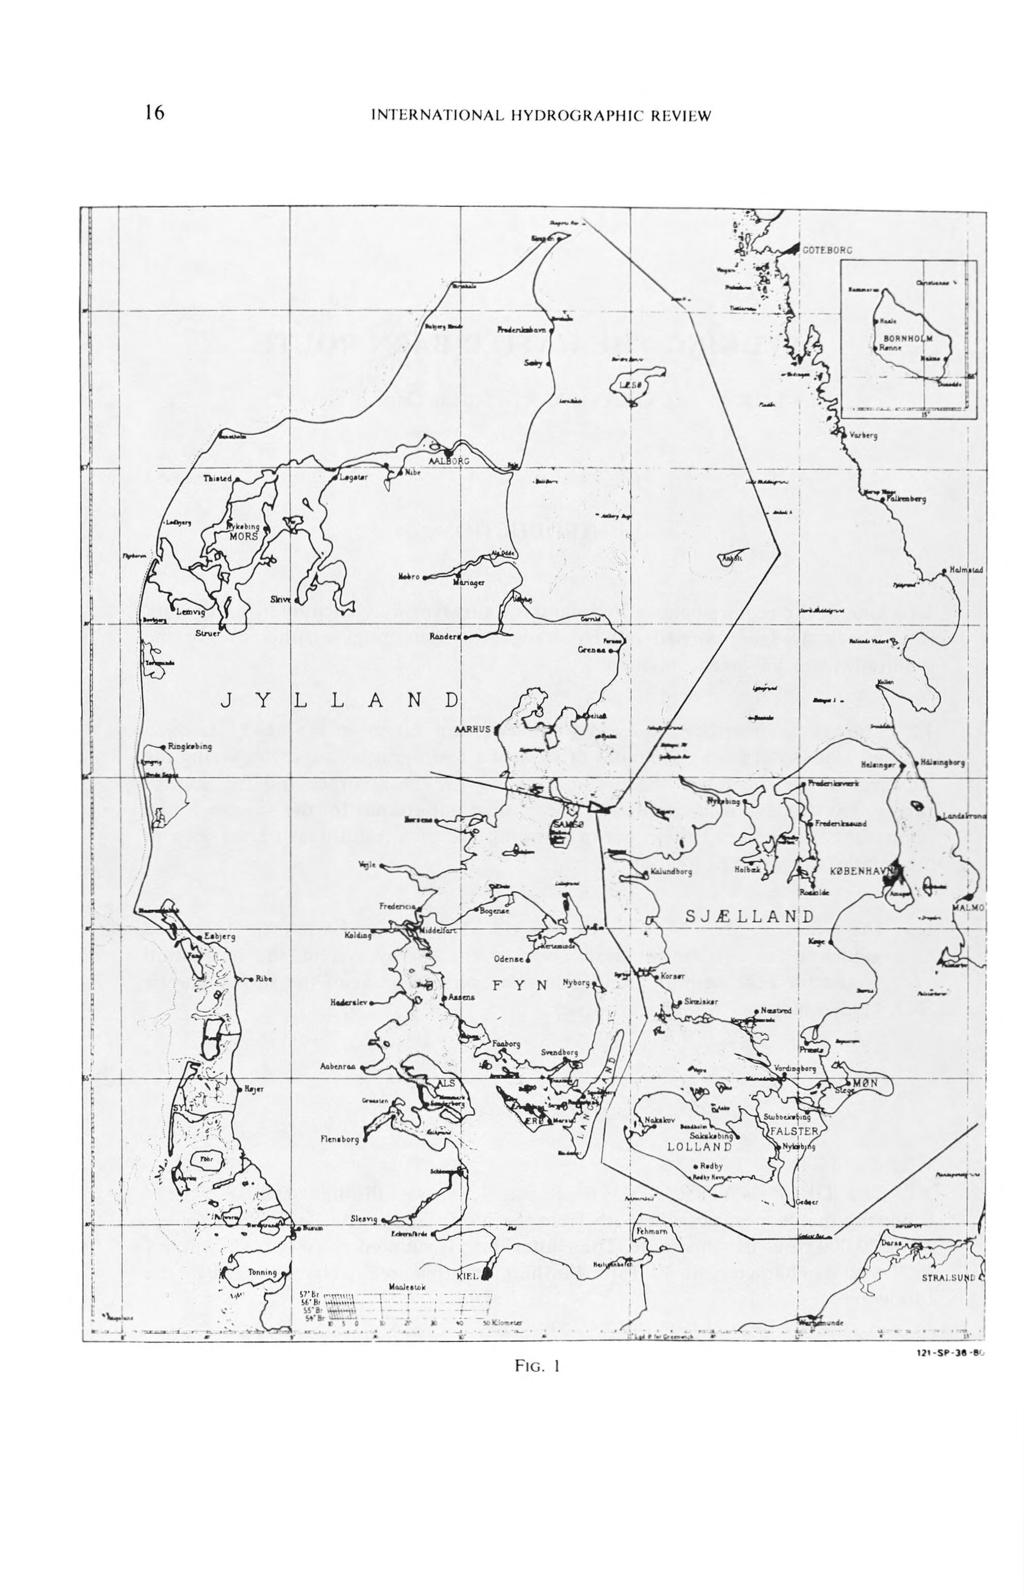
2 F ig. 1

3 SA M S0 B Æ L T Nuværende ruter/existing routes DREDGING THE HATTHRN BARN ROUTE F ig. 2 formed in the last glacial period seabed of blue clay and boulders up to 20 tons rising 3-4 m from the seabed average wind force more than 5 m /sec for 75 % of the year wind and current in opposite directions result in a very rough sea state. 2.2 Due to several groundings in the Hatter Barn area fourteen since 1974 and, especially, three in 1978 with the risk of major oil pollution in the northern part of the Great Belt, a group of advisers from the Ministry of Industrial Affairs,
4 D anish A dm inistration o f Navigation and H ydrography and D anish A dm inistration of Environments was formed to find a means of increasing safety o f shipping in this particular area and thus minimizing the risk of oil pollution. Several recom m endations were given, including one which led to more buoys being laid south o f H atter Barn Light, but it did not help. 2.3 There was no similarity in the groundings, except for navigational errors. Most groundings took place in daylight, with good visibility, and were by ships which could have taken the old alternative route G, as their draught was less than 10 m. 3. PRELIM INARY SURVEY 3.1 In 1980, the Hydrographic Office carried out a preliminary survey in the area. The objective was to determine the am ount of material required to be dredged, if such a solution were to be decided upon. The survey was m ade with Sercel s SYLEDIS MR3 in hyperbolic mode giving 2 lines of position, and the NAVITRO- N IC RT khz echo sounder system. The interline spacing o f the sounding lines was 50/25 m and L O Ps/soundings were sam pled every 8 m across 2 tracks m wide and approxim ately 16,000 m long, one near the present (dredged) route and the other 5 NM east of Hatter Barn. The coverage o f the seabed by this spot survey was about 10%. These data later formed the background for the draw ing of 15 and 17 m contours. 3.2 In addition, a geotechnic survey was made by the Danish Geotechnic Institute. The objective was to give a description of the nature of the seabed. This survey included side scan sonar, seismic profiles and bottom samples. Altogether, these surveys took 5 months (April to September) to complete, due to weather conditions in the area. 3.3 The data from these surveys comprised some of the background information given to the contractor in the later project. 4. TH E CONTRACT 4.1 Late in 1982 it was decided to dredge a route just south-east o f H atter Barn (see figure 3), to the depth of 15 m, allowing transit by ships with a maximum draught o f 13 m to relieve the congestion in the Deep Water Route. Theoretically, 66,500 m3 of sand, clay and boulders were to be removed from approximately 10 areas throughout the 16,300 m-long, 1,600 m-wide channel. Shipping would then be able to pass alm ost straight through H atter Barn with only 1 turn of 30.

5 DREDGING THE HATTERN BARN ROUTE S A M S 0 B / tlt Trafiksep areringssystom / T raffic separation sch e m e 1.apr.1984 Sd m Pr IB MARTHE " M-AK wa i ' fsù sm St KLEmflNE \ ehorrd / 12 f S iis l 2J f S d i H - / & * 8 o " \,'fc jr5-tu* ' > r. 7I S d.s c 1 2 Nom by \ v BuerJ S i t m i i i i 1 - -Jfyhotm» V c^lfndholm S d S t S u rld t e lô b Or S d '9.7 x 66 ' I ". S d sm S t. I 0^.SAX i s ' E - Q L i u y " n i 3 16 SL K d 1 5 Ea 1 l u n d b o re: 2 0 j4 ~ oj c. / a? «* < * / 7 / ** JW / zn.. xzzr^rm ~cl,j à S d, o r d j4.>*> - ŸtVSrup L ^rchralv ldt 11 Lænçde * O st for Greenwich F ig SP-30A From a hydrographic surveyor s point of view, the following considerations were important : in all areas with less than 17 m there should be a minimum depth of 15 m no hydrographic survey had been made, but the spot survey from 1980 could to some extent indicate soundings in the area if a complete survey were wanted by the contractor, he should perform this himself the dredger would be supplied with a SYLEDIS SR 3 for positioning the control sounding should be done with a 210 khz echo sounder.
, doing the post-dredging control survey, was equipped with the following (see figure 5) : SYLEDIS MR 3 giving 3 circular LOPs NAVITRONIC SOUNDIG 210 echo")
6 F ig. 4. T he survey launch SKA SURVEY EQ U IPM E N T AND FACTORS 5.1 The survey launch SKA 11 (see figure 4 ), doing the post-dredging control survey, was equipped with the following (see figure 5) : SYLEDIS MR 3 giving 3 circular LOPs NAVITRONIC SOUNDIG 210 echo sounder modified to use 30 khz as well HP 9825A calculator for processing of data TEKTRONIX 4924 magnetic tape recorder for collecting data HYDROGRAPHIC DATA HANDLER for interfacing HP 7130A recorder for digital depth data EPC recorder for analog depth data interfaced by GRAPHICAL RE CORDER INTERFACE TREND 800 printer for print-out of data HP 9872A plotter PATH GU ID A N CE UNIT for steering repeater data EMRI STEERING SYSTEM EG&G SMS 960 SIDE SCAN SONAR. 5.2 The survey system was basically divided into three parts (see figure 5) : an automatic part a back-up and control part, and a side scan sonar part.
7 F ig. 5. Survey system aboard th e survey launch SKA The autom atic part consisted of the M R 3, the E/S, H D H, calculator and the tape station. The objective of this was to collect the LOPs, depths and time to be stored on magnetic tape for further processing in the Hydrographic Office. In addition, inform ation was sent to the helmsman. 5.4 The back-up and control part was for the immediate real time checking and control of survey data. In addition to the above mentioned instruments, it consisted of graphical, digital and analog recorders, a plotter and a printer. 5.5 The SSS-system was interfaced to the calculator, so that the system could be controlled from the calculator station with the position, time, line and fix number, etc., written on the SSS-trace in order to measure and determ ine the position o f a depth anomaly. 5.6 As Mr. J. M. B a r b i e r and Mr. M. C h a u m e t - L a g r a n g e pointed out in their article, many equipm ent factors should be considered before conducting a survey such as the one under discussion here, nam ely : (a) O scillator position linked with the movements o f the vessel : depth o f oscillator, squat due to speed, roll, pitch and im portance of narrowness o f beam, heave; (b) Echo sounder calibration;
 Selection of soundings. 5.7 Depth o f oscillator : On both sides of the survey launch an oscillator draft mark was placed.")
8 (c) Echo sounder frequency (interpretation of echo trace); (d) Tidal correction; (e) Position errors : selection o f a positioning system, relative position o f antenna and oscillator; (f) Selection o f profiles; (g) Selection of soundings. 5.7 Depth o f oscillator : On both sides of the survey launch an oscillator draft mark was placed. The oscillator draft was preset on the echo sounders to give the actual depth measured. 5.8 Squat : As squat of the survey launch was not actually exactly known, speed was reduced and kept constant at 6 7 knots during the whole survey, thus minimizing the squat or at least keeping it constant. Repeated surveying in the same area showed differences within the specification of the echo sounder, ± 0.1 m, except where dredging had been done between surveys. 5.9 Roll, pitch, heave and narrowness o f beam : Being an inshore survey launch, the boat was subjected to heavy rolling and pitching due to weather in open areas like H atter Barn. This affected soundings obtained, especially as the beam width of the echo sounder was 15, which was required to give a good correlation between sounding and fix. This had the effect that the survey often had to be stopped when waves were about 0.5 m, or wind more than 5-6 m /sec, because then the sounding trace was oscillating ± 0.2 to ± 0.3 m, which was greater than the accuracy tolerance specified. As m entioned earlier, a narrow beam was preferred because of the correlation between sounding and fix, making it easier to relocate an obstacle, but on the other hand, interline spacing had to be reduced to give an acceptable coverage of the seabed, which resulted in much more time being spent on a job. With this echo sounder, a study shows that at 15 m depth a cone of 4 m is covered at the seabed. At the outer edge it measures 0.1 m less than the depth vertically beneath the oscillator, so a wider beam would cause errors larger than the required specifications Calibration o f echo sounder : Before sounding, daily tem perature and salinity were measured at every 2 m from the surface to the bottom in the area to be surveyed for calculation of m ean sound velocity, which was then preset on the echo sounders. In this area it was very significant, as there normally was a tem perature/ salinity layer in m depth due to less dense Baltic Sea water flowing north on the surface and the denser N orth Sea water flowing south at the seabed. Furtherm ore, a b ar check was carried out once a day to check the echo sounder Echo sounder frequency interpretation o f echo trace: The E /S on SKA 11 was a dual channel sounder with frequencies of 210 khz and 30 khz, both recorded on digital and analog recorders. Only the 210 khz soundings were recorded on m agnetic tape, so the 30 khz was used as control and back-up or, rather,

9 interpretation. Generally, the 210 khz will sound the top o f m aterial on the seabed, while the 30 khz will reflect the more solid material. This means that, in a case of seaweed on the bottom, it will be recorded as the bottom by 210 khz but om itted by 30 khz. On the other hand, soft m aterial such as m ud may not be recorded by 30 khz but is recorded by 210 khz. Some of these phenom ena were experienced in this area and the dual channel sounder proved very valuable, e.g. in one area the top of a shoal was covered with sea anem ones which were recorded by the 210 khz as less than 15.0 m, but not by the 30 khz. A diver clarified the situation. Regardless, soundings in dredged areas where the seabed com prised hard clay showed no significant differences between the two. Also, the mix of digital and analog recorders proved useful for interpretation of echoes, e.g., boulders were better seen on the analog recorder, whereas depths were better read on the digital, when ano th er run over the position had been done at slow er speed Tidal correction : From the survey of 1980 a bench m ark was established in Sejeroe H arbour and it was agreed that this would be used as a reference point throughout the survey and dredging. Two autom atic tide gauges were established there, one with and one without a radio link. The one with a radio link was used by the dredger to obtain real time water level, while SKA 11 had to pick up w ater level data after each survey to correct soundings. Some discussion ensued about the proximity of the tide gauge to the survey area, but as no alternatives or relevant data for differences were available, this had to be accepted. Surveying the same area twice at different tim es gave values within ± 0.1 m. TABLE 1 Calibration test in Ballen Harbour, February 28, 1984 Beacon 1 Beacon 2 Beacon 3 G eodetic d istan ce... M inimum d ista n c e... M aximum d istan ce... M ean d istance... Standard e rro r... Difference N orthing Easting C alibration p o sitio n... Calculated position... Standard e rro r... D ifferences... Error ellipse... Distance test-calculated position Presetting on M R 3 /

10 5.13 Position errors : The radio navigational system used was, as noted, the SYLEDIS B M R 3 giving three circular lines of position. To give a good fix the system had to be calibrated and checked. This was done once a m onth with a stationary test in a coordinated point at Ballen Harbour outer pier, a small harbour on the island o f Samsoe. A com puter program sampling 3 x distances from the M R 3 gave data needed for calculations of differences in geodetic distances, UTM coordinates, standard errors, m in./m ax. distances, error ellipse, etc. For calibration of the system, see Table 1. The inputs were UTM and geographical coordinates of the calibration point and beacons, and output was as shown in the table Checking was done 2-3 times during each test. After the first check, the navigational set was adjusted til! distances were within ± 0.3 m and standard error ± 0.5 m, and then another check was run, and sometimes yet another, until data were stable. Each test took 1-2 hours. As can be seen from the table, the range between min. and max. distances is only ± 1 m. This was not always so, as individual ranges could be as large as ± 5 to ± 7 m. Checking such ranges showed, however, that they were caused by a few random data, possibly reflections, not influencing the m ean when the d ata sam ple was large When working with the system, the maximum distance was about 20,000 m to 1 or 2 beacons and the m inimum 7,000 m. On average, the working distances were 10,000-15,000 m. Using Sercel s theoretical error for a position line in the system, 0.3 m ± 30 ppm, it means that the standard error on each position line should be ± 0.75 m and on the position ± 1.3 m. Experience proved that this value corresponded well as it was possible to return to a position, e.g. a boulder or a shoal, 9 out of 10 times, even in bad weather. N ear baselines, positioning errors were larger due to the effect of small fluctuations of the system. Here, errors could be from ± 2 m to ± 4 m. Large fluctuations of several hundreds o f metres were experienced, too, but it was only in a single data sample and very seldom. W hen SR 3 was installed, it showed the same repeatability Relative position o f antenna and oscillator : Due to vibrations from the main engine, the oscillators of SKA 11 were moved 2.75 m in front o f the receiver antenna. This distance had to be allow ed for and this was done at the H ydrographic Office Selection o f profiles : W ith use o f the SYLEDIS system the full benefit of the E M R I steering system was obtained, as sounding profiles could be ru n w i thin ± 1 m to ± 2 m of the preplanned survey lines. This also m ade it possible to use a small interline spacing and thereby survey an area with a very high percentage of bottom coverage. To declare a dredged route cleared to required depth needs good seabed coverage, dependent on a small spacing between sounding lines and good steering, but also on other factors. As steering has been m entioned, some consideration will be given to coverage and spacing. In Table 2 the longitudinal coverage is described.
11 TABLE 2 Longitudinal coverage Ship s s p e e d... 6 knots 3.1 m /sec E /S range 0-25 m pulses/sec 1 pulse every m 15 cone at 15 m m at seabed No. of pulses within 4 m...16 pulses Program updating tim e sec No. of updating pulses within the 4.0 m at seabed 5.16 An updating by the E /S every 0.25 m ensures that the seabed is well covered in the longitudinal direction, i.e. shoals and boulders are recorded at the digital and analog recorders, but not necessarily handled by the com puter, due to different data sam pling rate. As stated above, a 15 beamwidth gives a cone of 4 m at seabed. From Table 3, which gives seabed coverage percentage as a function of interline spacing of sounding lines, it is clear that a high percentage is only achieved by a small spacing. TABLE 3 Seabed coverage percentage as a function of spacing Spacing in m Percentage Due to small variations in positioning and steering this survey had to be carried out with 3 m spacing and doubtful areas were sounded a t least twice Selection o f soundings : The survey software was designed to collect data to be handled at the D anish A dm inistration o f Navigation an d H ydrography as the

12 hardw are on board did not facilitate on-line data processing. This was primarily caused by the limited calculator capacity, 23 Kbytes and, therefore, the relatively slow updating rate, 0.6 sec. Furthermore, soundings were not corrected aboard for tide as no autom atic tide gauge was connected to the system In the calculator, a selection of depth data took place within a certain time interval, here, 10 sec, so that minimum and maximum depths for the interval were collected together with the depth every time the timebase shifted. The selected depths with their LOPs and time were then stored on magnetic tape o f 200,000 bytes capacity. This was filled in 4 hours The position calculation was a least square adjustment with three circular LOPs based on flat earth com putation and was used merely for steering along track and plotting and, in some cases, as a quick reference for the dredger. As such data were not very accurate, however, care had to be taken In the program there was a built-in warning for soundings less than 15.0 m which resulted in a write-out giving uncorrected sounding and position. To control work done by dredgers, one has to be sure that it is done in accordance with the stated requirements. When a depth of 15.0 m is stated in the contract, a reduced sounding o f 14.9 m has to be dredged again. This is a very narrow limit and discussions will always arise since the variance from the requirem ent is within the accuracy specifications of the E /S, ±0.1 m. One must check internal and external factors, i.e. correct measured oscillator depth and sound velocity and their preset, and ensure that there is no sea state, swell or wake effect to make sure that the sounding is accurate. This can be a very difficult task Side scan sonar : The side scan sonar equipm ent on board SKA 11 was EG & G Seabed M apping System (SMS) 960, which gives a digital representation o f data. The object was to ensure that no obstacles were present after dredging and, especially, in non-dredged areas with less than 17 m where survey lines were not so close as those in dredged areas. The SSS-system was interfaced to the survey system so that position data and ship s true speed were transferred. Position of boulders could be calculated simply from the traces as the SSS-recorder drove with ship s true speed, thus eliminating along-track distortion, and the built-in height corrector eliminated vertical distortion. Positioning of a boulder was carried out as follows. A meter-counter was connected to the cable winch to measure the length o f cable from the winch to : Fish position (see figures 6 and 7) From ship s position, length of cable was read out from the m eter-counter and reduced by Pythagoras formula to give the distance in the horizontal plane. Adding distance from the winch to the antenna gave the distance of the fish from the antenna. Using sin/cos to ship s heading gave the fish position in the horizontal plane. B oulder position (see figure 7) From SSS-trace, distances from fish to boulder along-track and acrosstrack were measured and by sin/cos rules the position of the boulder could be calculated nearly on-line by a simple com puter program.
13 K = cable out (read on m eter-counter) H = height of fish above seabed (read on SSS-instrum ent) D = d epth (read on E /S trace) F = D H, fish d ep th beneath surface L = (K 2 F2), horizontal distance behind w inch B = distance an ten n a to w inch A = L + B, fish total distance behind an tenn a. F ig. 7. P ositioning of boulder. P ositioning of fish : Ni = N + A cos C, w here C is sh ip s heading Ei = E + A sin C P ositioning of boulder : N 2 = Ni + G cos (C ± 90 ), w here G is th e distance from tra c k E 2 = Ei + G sin (C ± 90 ) As the survey launch always stemmed the current, the fish was almost directly behind the ship, introducing only m inor errors in the positioning of boulders. 6. THE POST-DREDGING SURVEY 6.1. Before the survey started, the following was specified : in non-dredged areas, interline spacing 50 m in dredged areas, interline spacing 10 m in SSS-survey, interline spacing 100 m the hydrographic survey should be performed across the channel and the SSS-survey along the channel.

14 6.2 In April 1983 checks were m ade on some of the spot soundings of 1980 for the contractor to see the correlation between the positions o f LOPs and soun d ings. They were found to agree w ithin ± 10 m. 6.3 The hydrographic survey started by sounding all non-dredged areas with an interline spacing o f 50 m. Com parison with the former spot survey was good. Doubtful areas, those with depths less than 17 m but not less than 15 m, were surveyed with 10 m spacing. Here, no obstructions requiring dredging were found The first dredged area was sounded with 10 m spacing, giving 2 soundings with 0.1 to 0.2 m less than the required depth. The area was then resurveyed twice with spacing 5 m. This gave 18 soundings with 0.1 to 0.4 m less than the required depth. After further dredging the area was resurveyed twice with a 5 m interval, giving 12 soundings shallower than the design depth. Additional dredging, checked by sounding lines with 3 m spacing, cleared the area. After this experience, the rest of the dredged areas were sounded twice with 3 m interline spacing to ensure the areas were dredged to the required depth As the 17 m and 15 m contours were drawn from the spot survey data, one could expect differences, and indeed they occurred. In some areas, 5 to 10 new shoals were found outside the 15 m contour, but inside the 17 m contour after the first dredging had been done. This m eant that some areas had to be dredged and surveyed 3 or 4 times before they were cleared. Especially large isolated boulders caused difficulties to dredgers and these were blasted. Also, a dredger in a relatively open area like Hatter Bam with strong winds and currents, dredging to a depth of 15 m, had difficulty in dredging along straight lines. In the last phase, boulder fishers were hired to move small shoals and isolated boulders. This was done by SKA 11 dropping a buoy at the position and the fisher dredging with a diver to direct the bucket at the sea bottom Throughout the survey, positioning and sounding were excellent on SKA 11 as positioning was done within ± 1 m and sounding ±0.1 m, which m eant that, especially, isolated boulders, when found, could be relocated with the same least depth whenever required. The following example illustrates these perform ances. A boulder 2 x 3 m and 2 m high, weighing some 20 tons, was to be blasted. After the first explosion, SKA 11 came on top and recorded that 0.5 m of the top had gone and the boulder was split. This was confirmed by a diver and another blast had to be made. 6.7 Side scan sonar survey : As the result of experience with the hydrographic survey interline spacing, the SSS-survey line interval was reduced to 50 m and range to 50 m to give the best possible resolution. The recording showed num erous boulders throughout the whole channel, but only 32 o f those were of interest, as these were in areas with less than 17 m depth. To find least depth over these the following procedure was used : to relocate the boulders, the same track was run around the previous position while com paring the form er recorded bottom structure;
15 when relocated, the position was checked. This gave only minor changes of ± 3 m; the track was then shifted slightly to get the least depth over the boulder by echo sounders. If it did not work out the first time, lines were run on each side o f the position with 1 or 2 m spacing. Normally, least depth was found within 4 to 6 runs. This procedure showed that, in the worst case, there was a difference of about ± 7 m between the position from the SSS-record and the exact position of the least depth over the boulder. 6.8 The height of a boulder taken from the SSS-record was within ± 0.3 m. This was confirmed by diver s measurement with a pressure depth device. The variation was mainly due to the uncertainty of where the shadow starts and stops and, secondly, by the assum ption for the height-finding formula that the boulder is lying on level ground. If the seabed behind the boulder deepens, the shadow is longer and thus the height o f the boulder greater, and vice versa. 6.9 The SSS-survey and least depths found did not detect any further shoals to be dredged, even though some were quite close Closing remarks about the post-dredge survey : Altogether, the effective survey time was 250 hours, but the project lasted 15 months, primarily due to bad weather. Around 10 million soundings were m easured; 1.3 m illion were handled by the calculator, of which 70,000 were recorded on magnetic tape. This gave, on a fair sheet at 1:20,000 scale, 1,800 soundings, and on one at 1:5,000 scale, 7,800 soundings. 7. LESSO NS LEARNED Post-dredging surveys are very time-consuming and expensive, both for the dredger and for the survey unit, as areas may have to be re-dredged and re-sounded m any times. To ensure that an area is adequately dredged, a very small interline spacing and ensonified bottom area overlap are needed. This requires a well-calibrated, precise navigation system like SYLEDIS, and a good track-steering system. The SYLEDIS repeatability was good. Working within 10 to 15 km off stations it was better than ±1.3 m. The N avitronic Soundig system ensured that soundings were m easured within ± 0.1 m. The EM RI track steering system rendered it possible to steer the launch within ± 1 to ± 2 m o f sounding lines. A detailed survey should be conducted in advance so that shoals and boulders are detected. To reduce the period of this preparation phase, side scan sonar traces could be useful.
16 The required depth given to the contractor should be 0.3 to 0.5 m greater than the actual design depth. Though this will result in a larger volume to be dredged, there would be considerable savings in time and expenditure both in re-dredging and in conducting a post-dredging survey. Dredged areas should be surveyed with narrow line intervals at least twice to ensure that no obstacles remain undetected before the area is declared as clear. Positions of boulders from SSS-records were within ± 5 to ± 7 m, when later relocated with on-top position. Heights of boulders were correct to within ± 0.3 m. The computer system should have an up-dating rate that is com patible with that of the slowest of the echo sounder or navigation system to get data for all soundings/l O Ps for all depth anom alies of interest. The survey ship should be equipped with a datalink for tide data to correct soundings on-line. The com puter system should do real-time data processing, so that position and depth for a shoal to be re-dredged or a boulder to be removed could be given almost sim ultaneously. A dual channel echo sounder with digital/analog recorders is a useful tool for interpretation o f sounding data. REFERENCES [1] Dredging control by hydrographic soundings, by Jean-Michel B a r b ie r and Marc C h a u m e t - L a g r a n g e, /.//. Review, Vol. LX(2), July [2] 19.9-metre survey launch of the Danish Administration of Navigation and Hydrography, by Cdr. J.M. K il t, Royal Danish Navy, /.//. Review, Vol. LIX(l), January 1982.
BOTTOM MAPPING WITH EM1002 /EM300 /TOPAS Calibration of the Simrad EM300 and EM1002 Multibeam Echo Sounders in the Langryggene calibration area.
 BOTTOM MAPPING WITH EM1002 /EM300 /TOPAS Calibration of the Simrad EM300 and EM1002 Multibeam Echo Sounders in the Langryggene calibration area. by Igor Kazantsev Haflidi Haflidason Asgeir Steinsland Introduction
Engineering Surveying - II CE313. Hydrographic Survey Lecture 06 Muhammad Noman
 Engineering Surveying - II CE313 Hydrographic Survey Lecture 06 Muhammad Noman Hydrographic Surveying Hydrographic surveying is the branch of the survey which deal with any body of still or running water
S-44 edition 5 The IHO s New Standard For Hydrographic Surveys Chris Howlett Head of Seabed Data Centre United Kingdom Hydrographic Office
 S-44 edition 5 The IHO s New Standard For Hydrographic Surveys Chris Howlett Head of Seabed Data Centre United Kingdom Hydrographic Office Chairman of IHO Working Group that created S-44 edition 5 S-44
14/10/2013' Bathymetric Survey. egm502 seafloor mapping
 egm502 seafloor mapping lecture 10 single-beam echo-sounders Bathymetric Survey Bathymetry is the measurement of water depths - bathymetry is the underwater equivalent of terrestrial topography. A transect
Real Time Surveying GPS and HYDRO Software for Tide and Swell Compensation
 Real Time Surveying GPS and HYDRO Software for Tide and Swell Compensation by Mr Michael Walker, B.Surv. (Otago) HYDRO Division Trimble Navigation New Zealand Ltd. Abstract This paper focuses on the use
INTERNATIONAL HYDROGRAPHIC SURVEY STANDARDS
 INTERNATIONAL HYDROGRAPHIC SURVEY STANDARDS by Gerald B. MILLS 1 I. Background The International Hydrographic Organization (IHO) traces its origin to the establishment of the International Hydrographic
AN OFFSHORE TIDE GAUGE
 AN OFFSHORE TIDE GAUGE by Toshio Y a m a d a and Kinji I w a d a Hydrographic Department of Japan 1. INTRODUCTION Between October and December 1970 the Hydrographic Department of Japan carried out jointly
E4014 Construction Surveying. Hydrographic Surveys
 E4014 Construction Surveying Hydrographic Surveys Charts And Maps Hydrographic Chart an information medium and a tool for maritime traffic for the safety and ease of navigation contains information on
NEW SURVEY MOTOR LAUNCHES FOR THE ROYAL AUSTRALIAN NAVY
 International Hydrographic Review, Monaco, LXVI(l), January 1989 NEW SURVEY MOTOR LAUNCHES FOR THE ROYAL AUSTRALIAN NAVY by Commander John LEECH, RAN (*) INTRODUCTION By any standards the task facing the
Hydrographic Surveying Methods, Applications and Uses
 Definition: Hydrographic Surveying Methods, Applications and Uses It is the branch of surveying which deals with any body of still or running water such as a lake, harbor, stream or river. Hydrographic
OPERATIONS SEAFARER CERTIFICATION GUIDANCE NOTE SA MARITIME QUALIFICATIONS CODE. Deck: Chart Work
 Page 1 of 6 Compiled by Approved by Chief Examiner Syllabus Committee: 26 February 2013 OPERATIONS SEAFARER CERTIFICATION GUIDANCE NOTE SA MARITIME QUALIFICATIONS CODE Deck: Chart Work Page 2 of 6 COLUMN
9-METRE SURVEY MOTOR BOATS OF THE HYDROGRAPHIC SERVICE OF THE ROYAL NAVY
 International Hydrographie Review, Monaco, LVIII (1), January 1981 9-METRE SURVEY MOTOR BOATS OF THE HYDROGRAPHIC SERVICE OF THE ROYAL NAVY by Lt. Cdr. R. L. BASHFORTH, R. N. INTRODUCTION The six 35-feet
from ocean to cloud PARAMETRIC SUB-BOTTOM PROFILER, A NEW APPROACH FOR AN OLD PROBLEM
 PARAMETRIC SUB-BOTTOM PROFILER, A NEW APPROACH FOR AN OLD PROBLEM Geoff Holland, Alcatel-Lucent Submarine Networks Geoff.holland@alcatel-lucent.com Alcatel-Lucent Submarine Networks Ltd, Christchurch Way,
PORTS AUSTRALIA. PRINCIPLES FOR GATHERING AND PROCESSING HYDROGRAPHIC INFORMATION IN AUSTRALIAN PORTS (Version 1.5 November 2012)
") PORTS AUSTRALIA PRINCIPLES FOR GATHERING AND PROCESSING HYDROGRAPHIC INFORMATION IN AUSTRALIAN PORTS (Version 1.5 November 2012) PREFACE These Principles have been prepared by the Hydrographic Surveyors
PORTS AUSTRALIA PRINCIPLES FOR GATHERING AND PROCESSING HYDROGRAPHIC INFORMATION IN AUSTRALIAN PORTS (Version 1.5 November 2012) PREFACE These Principles have been prepared by the Hydrographic Surveyors
Wade Reynolds 1 Frank Young 1,2 Peter Gibbings 1,2. University of Southern Queensland Toowoomba 4350 AUSTRALIA
 A Comparison of Methods for Mapping Golf Greens Wade Reynolds 1 Frank Young 1,2 Peter Gibbings 1,2 1 Faculty of Engineering and Surveying 2 Australian Centre for Sustainable Catchments University of Southern
POLAPLOT : AN AUTOMATIC HYDROGRAPHIC DATA LOGGING AND PROCESSING SYSTEM
 POLAPLOT : AN AUTOMATIC HYDROGRAPHIC DATA LOGGING AND PROCESSING SYSTEM by The H ydrographic Service, Port of London Authority DEVELOPMENT For some years the Port of London s Hydrographic Service had been
THE RAPID DIGITISATION OF TIDE CHART RECORDS
 International Hydrographic Reuiew, Monaco, LV (2), July 1978. THE RAPID DIGITISATION OF TIDE CHART RECORDS by W.R. BLAIN & N.B. W E B B E R Department of Civil Engineering, University of Southampton, U.K.
ENVIRONMENT AGENCY GREAT OUSE AND 100 FT DRAIN QUARTERLY BATHYMETRIC SURVEY DECEMBER 2013 SITE SURVEY REPORT NO. H6787
 ENVIRONMENT AGENCY GREAT OUSE AND 100FT DRAIN QUARTERLY BATHYMETRIC SURVEY DECEMBER 2013 NO. H6787 LONGDIN & BROWNING (SURVEYS) LIMITED CHERRY TREE HOUSE CARMARTHEN ROAD SWANSEA SA1 1HE H6787 1 Measured
Recommended operating guidelines (ROG) for sidescan Sidescan sonar ROG in wrapper.doc English Number of pages: 9 Summary:
 for sidescan Sidescan sonar ROG in wrapper.doc English Number of pages: 9 Summary:") Title: Author(s): Document owner: Recommended operating guidelines (ROG) for sidescan sonar Dave Long (BGS) Dave Long (BGS) Reviewed by: Janine Guinan (MI) 07/09/07 Workgroup: MESH action: 2.1 Version:
Title: Author(s): Document owner: Recommended operating guidelines (ROG) for sidescan sonar Dave Long (BGS) Dave Long (BGS) Reviewed by: Janine Guinan (MI) 07/09/07 Workgroup: MESH action: 2.1 Version:
ScanFish Katria. Intelligent wide-sweep ROTV for magnetometer surveys
 ScanFish Katria Intelligent wide-sweep ROTV for magnetometer surveys User-friendly control and monitoring software solution The ScanFish Katria comes with the ScanFish III Flight software, which is an
Rule 7 - Risk of collision
 a) Every vessel shall use all available means appropriate to the prevailing circumstances and conditions to determine if risk of collision exists. If there is any doubt such risk shall be deemed to exist.
Plot the Path into the Harbor
 Plot the Path into the Harbor By Mary Anne Otten, Rudyard Area Schools and Joan Chadde, Michigan Technological University Subject/Grade: Grade 3 6, Math, Social Studies, Science Duration: 35 minutes Lesson
Tutorial for the. Total Vertical Uncertainty Analysis Tool in NaviModel3
 Tutorial for the Total Vertical Uncertainty Analysis Tool in NaviModel3 May, 2011 1. Introduction The Total Vertical Uncertainty Analysis Tool in NaviModel3 has been designed to facilitate a determination
Paper for consideration by ENC Working Group. Use of AU6 ENC cells as an option for Bathymetric ENCs (benc)
") Paper for consideration by ENC Working Group Use of AU6 ENC cells as an option for Bathymetric ENCs (benc) Submitted by: Alvaro Sanchez (AHS) Executive Summary: Compilation of high density bathymetric
Paper for consideration by ENC Working Group Use of AU6 ENC cells as an option for Bathymetric ENCs (benc) Submitted by: Alvaro Sanchez (AHS) Executive Summary: Compilation of high density bathymetric
Meeting the Challenges of the IHO and LINZ Special Order Object Detection Requirements
 Meeting the Challenges of the IHO and LINZ Special Order Object Detection Requirements Erik Hammerstad Kongsberg Maritime P. O. Box 111, N-3191 Horten, Norway erik.oscar.hammerstad@kongsberg.com Abstract
Hydrographic Surveying at The Port of London
 Hydrographic Surveying at The Port of London John Dillon-Leetch Port and Terminal Technology 2009 14 th October, Antwerp Overview Introduction Surveying the Thames Navigational Charting High Resolution
H ydrog ra p h ic S urve y Using SEABAT
 H ydrog ra p h ic S urve y Using SEABAT Hirokazu Mori, Tadashi Yamamoto and Isao Tedokon, Hydrographic Department, Japan Coast Guard The original was written in 1999, and our hydrographic surveys using
NEED FOR SUPPLEMENTAL BATHYMETRIC SURVEY DATA COLLECTION
 305 West Grand Avenue, Suite 300 Montvale, New Jersey 07645 Phone 201.930.9890 Fax 201.930.9805 www.anchorqea.com M EMORANDUM To: Caroline Kwan and Nica Klaber U.S. Environmental Protection Agency Region
Pilotage. Planning for pilotage
 Pilotage Planning for pilotage Being one step ahead of the game is key to effective pilotage. Only then will you know what to expect and what s lurking around the next bend. It s useful to construct a
Aids to navigation can include buoys, day beacons, range markers, and lighthouses.
 This boating safety course manual has been approved by Transport Canada strictly on the basis that it meets the minimum requirements of basic boating safety knowledge set out in Transport Canada s Boating
Sontek RiverSurveyor Test Plan Prepared by David S. Mueller, OSW February 20, 2004
 Sontek RiverSurveyor Test Plan Prepared by David S. Mueller, OSW February 20, 2004 INTRODUCTION Sontek/YSI has introduced new firmware and software for their RiverSurveyor product line. Firmware changes
13. TIDES Tidal waters
 Water levels vary in tidal and non-tidal waters: sailors should be aware that the depths shown on the charts do not always represent the actual amount of water under the boat. 13.1 Tidal waters In tidal
AUTOMATIC DREDGING PROFILE AND CONTOUR CONTROL
 AUTOMATIC DREDGING PROFILE AND CONTOUR CONTROL Jay Wise 1 ABSTRACT Phillips and Jordan, a leading excavating and disaster recovery contractor, was faced with the challenge to manage a civil contract involving
AN EVALUATION OF THE BO SUN MULTI-BEAM SONAR SYSTEM
 International Hydrographie Review, M onaco, L I I ( 2 ), J u ly 1975 AN EVALUATION OF THE BO SUN MULTI-BEAM SONAR SYSTEM by R. B u r k e and J. R o b s o n Hydrographie Development Group, Canadian Hydrographie
DQM Annual Hopper QA Checks
 DQM Annual Hopper QA Checks The following document is intended to be a guide for conducting annual Dredge Quality Management quality assurance checks on hopper dredges. The procedures should provide general
I SO : Changing the Standard for Luer Connectors
 I SO 80369-7: Changing the Standard for Connecrs White Paper By: Levi Loesch, Product and Mat erials Engineer, DDL, I nc 1 I SO 80369-7: Changing the Standard for Connecrs On Ocber 14, 2016, I SO form
Lat. & Long. Review. Angular distance N or S of equator Equator = 0º Must indicate N or S North pole = 90º N
 Navigation Part 2 1 Lesson Objectives Understand how a ships compass works and how it is used for navigation Measure distances on nautical charts Plot a course on a nautical chart Correct course headings
Level MEASUREMENT 1/2016
 Level MEASUREMENT 1/2016 AGENDA 2 A. Introduction B. Float method C. Displacer method D. Hydrostatic pressure method E. Capacitance method G. Ultrasonic method H. Radar method I. Laser method J. Level
Examples of Carter Corrected DBDB-V Applied to Acoustic Propagation Modeling
 Naval Research Laboratory Stennis Space Center, MS 39529-5004 NRL/MR/7182--08-9100 Examples of Carter Corrected DBDB-V Applied to Acoustic Propagation Modeling J. Paquin Fabre Acoustic Simulation, Measurements,
Anatomy of a Depth Survey
 1 Anatomy of a Depth Survey Part I General Considerations Tom O Donnell, AP Miles River Squadron 2 Why do depth surveys? NOAA, through its Office of Coast Survey, is mandated to keep our nautical charts
FULL SCALE MEASUREMENT OF DYNAMIC SHIP MOTIONS AND SQUAT
 FULL SCALE MEASUREMENT OF DYNAMIC SHIP MOTIONS AND SQUAT Mr. Gary Rolph Chief Hydrographic Surveyor Port of Brisbane Corporation Mr. Peter Rumball Surveyor Port of Brisbane Corporation Dr. Terry O'Brien
EFFECTS OF OCEAN THERMAL STUCTURE ON FISH FINDING WITH SONAR
 FiskDir. Skr. Ser. HavUnders., 15: 202-209. EFFECTS OF OCEAN THERMAL STUCTURE ON FISH FINDING WITH SONAR BY TAIVO LAEVASTU Fleet Numerical Weather Central, Monterey, California THE ACTIVE SONAR FORMULA
High Precision Hydrography in Canada, the ST. Lawrence River Channel, HD Bathymetry, Production, Distribution and Updating
 High Precision Hydrography in Canada, the ST. Lawrence River Channel, HD Bathymetry, Production, Distribution and Updating Marc Journault Canada CHS, Louis Maltais Canada CHS, and Richard Sanfaçon Canada
Marine Kit 4 Marine Kit 4 Sail Smooth, Sail Safe
 Marine Kit 4 Marine Kit 4 Sail Smooth, Sail Safe Includes Basic ship Terminologies and Investigation Check list Index 1. Ship Terminology 03 2. Motions of a Floating Body...09 3. Ship Stability.10 4. Free
Specifications for Synchronized Sensor Pipe Condition Assessment (AS PROVIDED BY REDZONE ROBOTICS)
") Specifications for Synchronized Sensor Pipe Condition Assessment (AS PROVIDED BY REDZONE ROBOTICS) A. Scope of Work The work covered by these specifications consists of furnishing all materials, labor,
Specifications for Synchronized Sensor Pipe Condition Assessment (AS PROVIDED BY REDZONE ROBOTICS) A. Scope of Work The work covered by these specifications consists of furnishing all materials, labor,
Interferometric Swath Bathymetry for Large Scale Shallow Water Hydrographic Surveys
 Interferometric Swath Bathymetry for Large Scale Shallow Water Hydrographic Surveys Lisa N. Brisson 1, Damon A. Wolfe 1, Matthew Staley P.S.M. 2 1 EdgeTech 4 Little Brook Rd West Wareham, MA 02576 2 USACE
Currents measurements in the coast of Montevideo, Uruguay
 Currents measurements in the coast of Montevideo, Uruguay M. Fossati, D. Bellón, E. Lorenzo & I. Piedra-Cueva Fluid Mechanics and Environmental Engineering Institute (IMFIA), School of Engineering, Research
Minimal influence of wind and tidal height on underwater noise in Haro Strait
 Minimal influence of wind and tidal height on underwater noise in Haro Strait Introduction Scott Veirs, Beam Reach Val Veirs, Colorado College December 2, 2007 Assessing the effect of wind and currents
A buoy, for example is an aid to navigation. Aids to navigation include many types of buoys as well as day beacons, range markers, and lighthouses.
 This online study guide has been approved by Transport Canada strictly on the basis that it meets the requirements of the Standard for Pleasure Craft Operator Testing over the Internet (TP 15080E) and
A Method Quantitatively Evaluating on Technical Progress of Students in Ship Handling Simulator Training ABSTRACT
 A Method Quantitatively Evaluating on Technical Progress of Students in Ship Handling Simulator Training Kinzo INOUE, Hideo USUI, Rong MA and Cemil YURTOREN Kobe University of Mercantile Marine 5-1-1 Fukae-minami
Drift Characteristics of Paroscientific pressure sensors
 Drift Characteristics of Paroscientific pressure sensors by Randolph Watts, Maureen Kennelly, Karen Tracey, and Kathleen Donohue (University of Rhode Island) PIES + current meter & CPIES arrays Paroscientific
An Assessment of Quality in Underwater Archaeological Surveys Using Tape Measurements
 An Assessment of Quality in Underwater Archaeological Surveys Using Tape Measurements Peter Holt 3H Consulting Ltd, 6 Honcray, Oreston, Plymouth, Devon, PL9 9XB The quality of a typical underwater archaeological
WMB-160F Multi-beam Fishing System
 WMB-160F Multi-beam Fishing System Take away the guess work and see what s REALLY below your boat! Seven Systems in One 2 WMB-160F WMB-160F Screen Shots The WMB-160F is a multi-beam sonar that has been
Echo Sounder Evaluation of XBT Drop Rate off the coast of Florida
 Echo Sounder Evaluation of XBT Drop Rate off the coast of Florida Lockheed Martin Sippican Grant Johnson Engineering Project Manager Ocean Products 9/22/2010 1 Introduction New fall rate evaluation approach
Figure 4, Photo mosaic taken on February 14 about an hour before sunset near low tide.
 The Impact on Great South Bay of the Breach at Old Inlet Charles N. Flagg and Roger Flood School of Marine and Atmospheric Sciences, Stony Brook University Since the last report was issued on January 31
ITTC Recommended Procedures and Guidelines
 Page 1 of 6 Table of Contents 1. PURPOSE...2 2. PARAMETERS...2 2.1 General Considerations...2 3 DESCRIPTION OF PROCEDURE...2 3.1 Model Design and Construction...2 3.2 Measurements...3 3.5 Execution of
A SYSTEM FOR PROCESSING HYDROGRAPHIC SURVEY DATA
 H Y PO S A SYSTEM FOR PROCESSING HYDROGRAPHIC SURVEY DATA by A. J. K e r r and T. V. E v a n g e l a t o s Canadian H ydrographic Service and D. M a r s h a l l, A G T Systems Ltd, Toronto ABSTRACT The
Seismic Survey Designs for Converted Waves
 Seismic Survey Designs for Converted Waves James A. Musser* GMG/AXIS Inc., Denver, CO 1720 Red Cloud Road, Longmont, CO, 80501, USA jmusser@gmg.com ABSTRACT Designing converted wave 3D surveys is considerably
ATION TITLE. Survey QC, Decision Making, and a Modest Proposal for Error Models. Marc Willerth, MagVAR
 1 a Modest Proposal for Error Models ATION TITLE Marc Willerth, MagVAR Speaker Information Marc Willerth VP of Survey Technologies April 11, 2018 MagVAR 2 Speaker Bio Marc Willerth Magnetic Variation Services,
Walk - Run Activity --An S and P Wave Travel Time Simulation ( S minus P Earthquake Location Method)
") Walk - Run Activity --An S and P Wave Travel Time Simulation ( S minus P Earthquake Location Method) L. W. Braile and S. J. Braile (June, 2000) braile@purdue.edu http://web.ics.purdue.edu/~braile Walk
Walk - Run Activity --An S and P Wave Travel Time Simulation ( S minus P Earthquake Location Method) L. W. Braile and S. J. Braile (June, 2000) braile@purdue.edu http://web.ics.purdue.edu/~braile Walk
Measured broadband reverberation characteristics in Deep Ocean. [E.Mail: ]
![Measured broadband reverberation characteristics in Deep Ocean. [E.Mail: ]](/thumbs/90/101823179.jpg "Measured broadband reverberation characteristics in Deep Ocean. [E.Mail: ]") Measured broadband reverberation characteristics in Deep Ocean Baiju M Nair, M Padmanabham and M P Ajaikumar Naval Physical and Oceanographic Laboratory, Kochi-682 021, India [E.Mail: ] Received ; revised
Measured broadband reverberation characteristics in Deep Ocean Baiju M Nair, M Padmanabham and M P Ajaikumar Naval Physical and Oceanographic Laboratory, Kochi-682 021, India [E.Mail: ] Received ; revised
Chartwork Learn the basics for position fixing using a number of techniques and a simple equation for speed, distance and time.
 Chartwork Learn the basics for position fixing using a number of techniques and a simple equation for speed, distance and time. Chartwork Chartwork Tools Accurate chart work is the basis for good navigation.
HELSINKI COMMISSION HELCOM SAFE NAV 4/2014 Group of Experts on Safety of Navigation Fourth Meeting Helsinki, Finland, 4 February 2014
 HELSINKI COMMISSION HELCOM SAFE NAV 4/2014 Group of Experts on Safety of Navigation Fourth Meeting Helsinki, Finland, 4 February 2014 Agenda Item 3 Accidents and ship traffic in the Baltic Sea Document
AHO s experience on HD bathymetric ENCs
 AHO s experience on HD bathymetric ENCs ENCWG3 Wollongong 16 18 April 2018 Alvaro Sanchez DD Charting Quality Assurance, Standards and Specifications Australian Hydrographic Office Background 2016 As part
PART 5 - OPTIONS CONTENTS 5.1 SYSTEM EXPANSION 5-3
 PART 5 - OPTIONS CONTENTS Para Page 5.1 SYSTEM EXPANSION 5-3 5.2 SENSORS 5-3 5.2.1 Trim Angle Sensor 5-3 5.2.2 Mast Rotation Sensor 5-3 5.2.3 Heel Angle Sensor 5-3 5.2.4 Barometric Pressure Sensor 5-3
Body Search and Recovery Using Sonar
 Body Search and Recovery Using Sonar Photos Mark W. Atherton Mark W. Atherton, Echoes and Images Image courtesy FBI Dive Team Images not for distribution. All photographs and drawings courtesy and Mark
Geospatial Positioning Accuracy Standards Part 5: Standards for Nautical Charting Hydrographic Surveys - Public Review Draft
 Appendix B FGDC Hydrographic Accuracy Standard Geospatial Positioning Accuracy Standards Part 5: Standards for Nautical Charting Hydrographic Surveys - Public Review Draft Subcommittee on Marine and Coastal
HYDROGRAPHIC AND SITE SURVEY REPORT
 HYDROGRAPHIC AND SITE SURVEY REPORT Proposed Pen Site at Dounie, Sound of Jura Prepared for: Kames Fish Farming Ltd Kilmelford Argyll PA34 4XA Tel: +44 (0)1631 720699 TransTech Limited www.transtechltd.com
BERNOULLI EFFECTS ON PRESSURE.ACTIVATED W ATER LEVEL GAUGES
 International Hydrographic R eview, Monaco, LV (2), July 1978. BERNOULLI EFFECTS ON PRESSURE.ACTIVATED W ATER LEVEL GAUGES by Langley R. MUIR Ocean and Aquatic Sciences, Central Region, Burlington, Ontario,
Multibeam and Laser: Combined High Resolution. Hydrographic Surveying for Civil Engineering Project Support
 Multibeam and Laser: Combined High Resolution Hydrographic Surveying for Civil Engineering Project Support John Dillon-Leetch,Port of London Authority Duncan Mallace, NetSurvey, UK Overview Introduction
Mapping the Sea Bottom Using RTK GPS and Lead-Line in Trabzon Harbor
 Mapping the Sea Bottom Using RTK GPS and Lead-Line in Trabzon Harbor Arzu ERENER and Ertan GÖKALP, Turkey Key Words: Real-Time Kinematic GPS, Lead Line, Roll Effect, Hydrographic surveys. SUMMARY The harbor
Plot the Path. Mary Anne Otten. lesson three
 Plot the Path Mary Anne Otten lesson three Subject/Grade: Grade 2, Math, Social Studies, Science Duration: one class period Materials needed: Per class: Day the Great Lakes Drained Away by Charles Ferguson
Spatial Methods for Road Course Measurement
 Page 1 of 10 CurtinSearch Curtin Site Index Contact Details Links LASCAN Spatial Sciences WA Centre for Geodesy COURSE MEASUREMENT This page is a summary of results of some of the research we have recently
V Complying with IHO S-52/S-63/S-64
 Model FEA-2107/2807 V.06.50 Complying with IHO S-52/S-63/S-64 The software has been upgraded to V.06.50 in accordance with the IHO standards. IHO S-52 Ed. 6.1.1 Specifications for Chart Contents and Display
Anchoring Is Important
 BCC Sailing Classes - Third Theory Anchoring Anchoring Is Important 1 The Anchor is your last resort. Anchoring Keep off a lee shore. Needs to be shaped (type of anchor) to bury in the type of bottom for
Evaluation of the Klein HydroChart 3500 Interferometric Bathymetry Sonar for NOAA Sea Floor Mapping
 Evaluation of the Klein HydroChart 3500 Interferometric Bathymetry Sonar for NOAA Sea Floor Mapping Yuhui Ai, Straud Armstrong and Dean Fleury L-3 Communications Klein Associates, Inc. 11 Klein Dr. Salem,
Transmission loss (TL) can be predicted, to a very rough degree, solely on the basis of a few factors. These factors are range, and frequency.
 can be predicted, to a very rough degree, solely on the basis of a few factors. These factors are range, and frequency.") Sonar Propagation By virtue of the fact that the speed that acoustic waves travel at depends on the properties of the medium (i.e. sea water), the propagation of sonar will be complicated. So complicated
Sonar Propagation By virtue of the fact that the speed that acoustic waves travel at depends on the properties of the medium (i.e. sea water), the propagation of sonar will be complicated. So complicated
Beamex. Calibration White Paper. Weighing scale calibration - How to calibrate weighing instruments
 Beamex Calibration White Paper info@beamex.com Weighing scale calibration - How to calibrate weighing instruments Weighing scale calibration - How to calibrate weighing instruments Weighing scales, weighing
ICES Guidelines for Multibeam Echosounder Data (Compiled September 2006)
") ICES Guidelines for Multibeam Echosounder Data (Compiled September 2006) If you are considering producing a hydrographic survey please read the following information first. Your survey could be used to
ICES Guidelines for Multibeam Echosounder Data (Compiled September 2006) If you are considering producing a hydrographic survey please read the following information first. Your survey could be used to
Click to edit Master title style Advanced Military Layers. and the Historic Environment
 Advanced Military Layers and the Historic Environment Paul Baggaley and Louise Tizzard Wessex Archaeology 1 Click to edit Objectives Master title style to establish the degree of mutual benefit in integrating
GNSS Technology for the Determination of Real-Time Tidal Information
 GNSS Technology for the Determination of Real-Time Tidal Information Benjamin Kidder C-Nav Positioning Solutions European region Outline of Topics Covered Introduction to Tides Past and Present Methods
COMPARISON OF CONTEMPORANEOUS WAVE MEASUREMENTS WITH A SAAB WAVERADAR REX AND A DATAWELL DIRECTIONAL WAVERIDER BUOY
 COMPARISON OF CONTEMPORANEOUS WAVE MEASUREMENTS WITH A SAAB WAVERADAR REX AND A DATAWELL DIRECTIONAL WAVERIDER BUOY Scott Noreika, Mark Beardsley, Lulu Lodder, Sarah Brown and David Duncalf rpsmetocean.com
INTERNATIONAL HYDROGRAPHIC REVIEW MAY 2015
 OPERATION TIRÚA: HYDROGRAPHIC VISION N.A. Guzmán Montesinos Naval Hydrographic Engineer Head of the Information Technology Department Head of the Chilean Tsunami Warning Center, Chile Abstract On 6 October
Homework 2a Bathymetric Charts [based on the Chauffe & Jefferies (2007)]
![Homework 2a Bathymetric Charts [based on the Chauffe & Jefferies (2007)]](/thumbs/73/69074241.jpg "Homework 2a Bathymetric Charts [based on the Chauffe & Jefferies (2007)]") 14 August 2008 MAR 110 HW-2a: ex1bathymetric Charts 1 2-1. BATHYMETRIC CHARTS Homework 2a Bathymetric Charts [based on the Chauffe & Jefferies (2007)] Nautical charts are maps of a region of the ocean
14 August 2008 MAR 110 HW-2a: ex1bathymetric Charts 1 2-1. BATHYMETRIC CHARTS Homework 2a Bathymetric Charts [based on the Chauffe & Jefferies (2007)] Nautical charts are maps of a region of the ocean
RAMSTM. 360 Riser and Anchor-Chain Integrity Monitoring for FPSOs
 RAMS 360 Riser and Anchor-Chain Integrity Monitoring for FPSOs Introduction to RAMS Tritech s RAMS is a 360 anchor-chain and riser integrity monitoring system for Floating Production Storage and Offloading
A PRACTICAL APPROACH TO QUALITY CONTROL AND QUALITY ANALYSIS OF DEPTH DATA
 A PRACTICAL APPROACH TO QUALITY CONTROL AND QUALITY ANALYSIS OF DEPTH DATA ABSTRACT Ulf Olsson, Mats Ericson, Stigbjörn Nilsson, Hans Öiås Hydrographic Office, Swedish Maritime Administration, Sweden Quality
IHO SP 44 Standards for Hydrographic Surveys and the demands of the new century.
 IHO SP 44 Standards for Hydrographic Surveys and the demands of the new century. Dave Monahan, CHS, and D E Wells, Ocean Mapping Group, UNB Keeping any standard up to date is a never-ending task. For example,
1. W hat questions w as the study trying to answ er?
 ECHO Program Slowdown Trial - Preliminary Findings Voluntary Vessel Slow dow n Trial in Haro Strait In 2016, the Enhancing Cetacean Habitat and Observation (ECHO) Program s Advisory Working Group conducted
Online Scorekeeper Operational Guide ACCESSING YOUR SCOREKEEPER INTERFACE
 The Virtual Scoreboard Network Online Scorekeeper Operational Guide ACCESSING YOUR SCOREKEEPER INTERFACE When you create your game scoreboard on The Virtual Scoreboard Network, you will be provided with
Optimizing Sound Speed Profiling to Meet TPU Requirements using a CAST Gauge
 Optimizing Sound Speed Profiling to Meet TPU Requirements using a CAST Gauge (Computer Aided Sound speed Technology) Derrick R. Peyton, Steven Smyth, Arnold Furlong ODIM Brooke Ocean Jonathan Beaudoin
Waves. harmonic wave wave equation one dimensional wave equation principle of wave fronts plane waves law of reflection
 Waves Vocabulary mechanical wave pulse continuous periodic wave amplitude wavelength period frequency wave velocity phase transverse wave longitudinal wave intensity displacement wave number phase velocity
 ON SHIPS OF 200 GRT/500 GT OR MORE Assessment Sheets Enclosure (1) to CG-543 Policy Letter 11-07 ASSESSMENT NO. OICNW-1-1A COMPETENCE: Plan and conduct a passage and determine position KNOWLEDGE, UNDERSTANDING
OPTIMAL LINE SPACING IN HYDROGRAPHIC SURVEY
 International Hydrographic Review, Monaco, LXX(l), March 1993 OPTIMAL LINE SPACING IN HYDROGRAPHIC SURVEY by E.C. BOUWMEESTER and A.W. HEEMINK 1 INTRODUCTION In this paper the authors present a simple,
1. What are the differences and similarities among transverse, longitudinal, and surface waves?
 Assignment Waves Reading: Giancoli, Chapters 11, 12, 22, 24 Holt, Chapters 12, 14 Objectives/HW The student will be able to: 1 Define, apply, and give examples of the following concepts: wave, pulse vs.
An assessment of quality in underwater archaeological surveys using tape measurements
 The International Journal of Nuuticul Archaeology (2003) 32.2: 246-25 1 doi: 10.1016/j.ijna.2003.04.002 W An assessment of quality in underwater archaeological surveys using tape measurements Peter Holt
CHAPTER 91 TRACKED VEHICLE FOR CONTINUOUS NEARSHORE PROFILES. Richard J. Seymour* Alan L. Higgins** David P. Bothman***
 CHAPTER 91 TRACKED VEHICLE FOR CONTINUOUS NEARSHORE PROFILES Richard J. Seymour* Alan L. Higgins** David P. Bothman*** INTRODUCTION The measurement of nearshore profiles has been the traditional method
Using Sonar for Navigation
 Using Sonar for Navigation By Steve Dashew We spend a lot of time cruising in remote areas, where charts tend to be out-of-date or nonexistent. For years we've been thinking about using sonar for navigation
occupies the right hard part of this building occupe l aile droite de ce bâtiment
 N orges S jo k a r t v e r k N o rges S jo k a r t v e r k occupies the right hard part of this building occupe l aile droite de ce bâtiment NORGES SJOKARTVERK (THE NORWEGIAN HYDROGRAPHIC OFFICE) b y R
Deploying the TCM-1 Tilt Current Meter in an Inverted (Hanging) Orientation By: Nick Lowell, Founder & President
 Orientation By: Nick Lowell, Founder & President") Lowell Instruments Application Note #TCMA Deploying the TCM-1 Tilt Current Meter in an Inverted (Hanging) Orientation By: Nick Lowell, Founder & President 1 Introduction The TCM-1 Tilt Current Meter (TCM)
Lowell Instruments Application Note #TCMA Deploying the TCM-1 Tilt Current Meter in an Inverted (Hanging) Orientation By: Nick Lowell, Founder & President 1 Introduction The TCM-1 Tilt Current Meter (TCM)
HYDROGRAPHIC AND TIDAL INFORMATION FOR DEEP DRAUGHT SHIPS IN A TIDAL ESTUARY
 HYDROGRAPHIC AND TIDAL INFORMATION FOR DEEP DRAUGHT SHIPS IN A TIDAL ESTUARY by Lt. Commander J. C. E. W h i t e, R.N., (Retd.) Port o f London A u thority This paper was presented at the XHIth International