Peter Griffith. July Technical Report No Division of Sponsored Research Massachusetts Institute of Technology
|
|
|
- Melvin Barber
- 6 years ago
- Views:
Transcription

1 kt,~ THE BUBBLY-SLUG TRANSITION IN A HIGH VELOCITY TWO PHASE FLOW j,'t Peter Griffith George A. Snyder 'V w July 1964 Technical Report No Division of Sponsored Research Massachusetts Institute of Technology Contract No. AT (30-1)-3301 Ii 2 ENGINEERING PROJECTS LABORATORY 3NGINEERING PROJECTS LABORATOR' igineering PROJECTS LABORATO' INEERING PROJECTS LABORAT' NEERING PROJECTS LABORK 'EERING PROJECTS LABOR 'ERING PROJECTS LABO' 'RING PROJECTS LABe ING PROJECTS LA 4G PROJECTS L 3 PROJECTS PROJECTC ROJEC- JEr TT
2 TECHNICAL REPORT NO THE BUBBLY-SLUG TRANSITION IN A HIGH VELOCITY TWO PHASE FLOW By Peter Griffith* George A. Snyder** Sponsored by the U. S. Atomic Energy Commission Contract No. AT (30-1)-3301 DSR 5003 July, 1964 Division of Sponsored Research Massachusetts Institute of Technology Cambridge 39, Massachusetts * Associate Professor of Mechanical Engineering, M.I.T. ** Former Research Assistant, M.I.T., present address: Westinghouse Atomic Power Laboratory, Bettis Field, Pittsburgh, Pennsylvania
3 ABSTRACT A possible mechanism for the transition between bubbly and slug flow is proposed and tested in a simulated slug flow system. No sudden collapse of slug flow with increasing velocity is found and it is concluded that: a. Slug flow is generally stable at voids greater than 35%. b. Bubbly flow at voids higher than this is a result of entrance conditions. c. Visual observations of bubbly flow in unheated systems at higher voids are most likely faulty. No simple asymptote limit or criterion that would predict the location of the bubbly-slug transition was found.
4 Introduction A number of observations have been made of the flow regime in the low void fraction region which are not consistent with one another. Reference (1) reports a transition to emulsion (or bubbly or froth) flow at a superficial mixture velocity of about 15 ft/sec in a one inch pipe. On the other hand void readings taken on similar air water systems (2) indicate that a slug flow pattern exists. Measurements made with a probe reported in reference (3) showed no evidence of bubbly flow. These measurements were made in a system at elevated pressure at very low heat fluxes, a variety of qualities and with velocities in excess of 10 ft/sec. Slug and annular flow were all that were observed. At comparable velocities and pressures but higher heat fluxes, reference (4) reports voids that indicate no slip and, therefore, a bubbly flow pattern. At still higher pressure and in a very small heated channel, reference (5) reports slip ratios that can only indicate a bubbly flow. With these apparently conflicting observations in mind, this investigation was undertaken. In particular, an attempt was made to see if there was any velocity at which slug flow bubbles broke up spontaneously into a froth as a result of gas entrainment in the wake of these bubbles. Such a critical velocity would provide a very useful upper bound for the region in which slug flow could exist. Two references bear directly on the problem at hand, references (6) and (7). Reference (6) is a detailed study of the bubbly-slug transition at low velocity which had as its primary conclusion that purity, initial bubble size, velocity, and pipe diameter were all important. The results were too complex
5 2 to be generally useful, though they did uncover a mechanism for the transition from bubbly to slug flow. Reference (7) is an experimental study of gas entrainment around a jet. The geometry and properties were different from the case of interest here but their measurements did show something of the nature of the gas entrainment phenomena. The Model Tested A simulated slug flow system which was stationary was tested in order to see what was happening more easily and work with a generally simpler system. A slug flow bubble was simulated in plastic and supported on a tube through which just enough air was provided to makeup for that air which was entrained. The primary measurements were the water flow rate, from which the jet velocity was calculated and the void fraction a little way down from the plastic bubble. A detailed drawing of the plastic bubble is shown in Figure (1). A photograph of the bubble is shown in Figure (6). In order to show how these measurements might be applied to a flowing system, two equations will be derived. One relates the jet velocity in these experiments to the "jet" velocity which would be observed in a flowing system. The second relates the entrained void to the average density of the mixture in a pipe in which there are also slug flow bubbles. These two results are incidental to the primary objective of the experiments, however, which was to see if there was a critical upper velocity at which wake entrainment made it impossible for slug flow to persist. Coordinate Transformation In studying the entrainment process at the tail of a slug flow bubble, it is appropriate to use a coordinate system which is attached to a slug flow bubble and to derive necessary velocity equations relative to that coordinate
6 MMMMMW" system. The purpose of developing these relations is to allow a transformation of the static measurement we have madeto a mixture moving in a pipe. The mixture velocity or throughput velocity in a pipe is given by In two phase flows the gas and liquid phases do not necessarily move through the pipe with the same velocity. In a vertical pipe the bubble velocity relative to the throughput velocity is given by Nicklin, Wilkes, and Davidson (8) for turbulent flow. 6 0 \ Qi.A /.D 6 Adding these relations the absolute velocity of the Taylor bubble is The absolute velocity of the bubble now becomes the velocity of our special coordinate system. Relative to this system the annular film now becomes an annular jet. The flow rate in the jet is The area of the annular film around the bubble is A -A,= At (\- Aki The velocity of the jet relative to the special coordinate system is tow ~ri.d~) I Emma
7 There exist experimentally observed limitations for the thickness of the annular film around a slug flow. These limits have been reported by Nicklin, Wilkes, and Davidson (8) as the percentage of pipe area which is filled by the film around the tail of a slug flow bubble. The range of the reported film areas and those tested in this investigation are shown below. Reported Limiting Areas of Annular Film 0.10 A. minimum p 0.21 A. maximum p Tested Areas of Annular Film 0.15 A. minimum p 0.25 A. maximum p Dimensionless parameters for the annular jet can be calculated using the above velocity. Average Mixture Density Assume a control volume as shown in Figure 2. The flow rate and velocity at the exit plane are A, The slug flow bubble will have a velocity relative to the liquid ahead of it as calculated in the previous section so that the absolute velocity of the bubble is Consider a system of one bubble plus one bubbly slug. The gas in such a system is
8 The time required for the system to pass a fixed reference point is The gas flow rate past the reference point is The average density of the system is ~+ It has been assumed in the visual model that the large and small bubbles have a velocity relative to one another. Indeed this is essential to the maintenance of a fully developed slug flow. Assuming that the local relative velocity between the small bubbles and the liquid in the slugs is negligible for high speed flows we can calculate a new density for the liquid in the slugs. By using the results of the present investigation one can calculate the density and gas distribution in a two phase slug flow.
9 Test Section The investigation of gas entrainment in the wake of a slug flow bubble is most conveniently performed using a stationary bubble. In such a case, one can see that the velocity of an annular jet relative to the bubble (see equation (5)) is also the absolute velocity of the jet. In this investigation a stationary slug flow bubble can be simulated by a plastic bubble suspended in a pipe. The vertical downflow of water in the pipe simulates vertical up flow of a two phase mixture. The advantages of the simulated bubble are the following. The area of interest stands still so that visual observations are easier, and second the complications of a large two phase loop are avoided. Property variations are much more easily experimented in such a system. In the case of the plastic bubble an external force constrains the bubble so all liquid flow rates within the operating range of the system can be tested to give a variety of jet velocities. Third, the entrainment process removes gas from the bubble. In order to have time for observations and measurements some technique must be available for replacing this gas. Such a technique must not introduce new variables and disturbances into the system. With a plastic bubble the gas can be replenished through the bubble support. The bubble can be made hollow with an open tail so as to provide nearly identical conditions to those existing at the tail of a free slug flow bubble. See Figure (1). The use of a plastic bubble to simulate slug flow is proposed, discussed and justified by velocity profile measurements in Moissis and Griffith (9). The annular jet is found to very quickly recover from the effects of the noslip interface condition as soon as it leaves the plastic surface.
10 In this investigation a hollow, plastic bubble approximating the shape of a G.I. Taylor bubble was suspended in a vertical plexiglass pipe by a stainless steel tube of 1/8" diameter. The bubble was centered in the pipe by small pins protruding from its side. Figure 3 shows a section view of the plastic bubble and a table of the bubble diameters, pipe diameters and geometric variations tested. The bubbles were made to test the parametertoyf and to try to test the possible effects of the centering pins. In the belief that the entrainment could not be affected by small differences in the shape of the bubble nose no special care was taken to insure uniformity. The bubbles were all cut to the same general shape and always smoothly rounded. In all cases the tail of the bubble was tapered as shown in Figure 3. The necessary air was forced into the hollow plastic bubble through the hollow tube. Below the bubble there were two ball valves, coupled and manually operated for isolation of a length of the pipe. The valves open or shut with just a 900 rotation of the shafts. By rapidly and simultaneously closing the valves one can obtain void fraction measurements. Two test sections were constructed around the above principles. They were of 3/4" and 1" inner diameter. In each case the valve bore was equal to the inner diameter of the pipe so as to eliminate any area change as a possible system-related variable. The remainder of the apparatus was built to accommodate either a recirculating system as for the silicone oil-nitrogen data or an open, single pass system for use with city water and shop air. Schematic drawings are shown in Figures 4 and 5.
11 The operating range for the water-air system was limited only by the line pressure of the city water system. The apparatus was protected from pressure surges during the sudden closing of the isolating valves by a simple pressure relief. A tee was placed in the water supply line with hoses connected to the "run" and a cork in the branch. When the pressure rose the cork blew out diverting the water flow from the apparatus to the sink. The cork was replaced in the tee as a preparatory step for the subsequent test run. Water flow rates were measured by an in line flow meter but for flow rates outside the limits of readily available meters a weigh bucket and stopwatch were used. Gas flow rates were measured when desired by a volume flow meter. For the silicone oil and nitrogen experiments an auxiliary apparatus constructed for some similar experiments was used. The auxiliary apparatus is described by Kumlin (10). The test apparatus was modified for the use of silicone oil by replacing the cork pressure release by a bypass tube and a third, coupled ball valve. Unfortunately, pressure drops in the auxiliary system limited the range of liquid flow rates to much lower jet velocities than were reached in the water-air system. Experimental Procedures The procedure for performing individual tests was as follows. A liquid flow rate was set by means of the control valves and some short interval of time was allowed to pass so that all air pockets in the system were swept out. Usually this required seconds but for very low flow rates it was necessary to turn up the water flow rate for a short time then reset it at the desired
12 value. After all air pockets were swept out the air supply was opened to allow air to fill the hollow plastic bubble. Entrainment started as soon as the air was allowed to enter the bubble. The air flow was then slowly increased until the gas-liquid interface moved slightly away from the tail of the plastic bubble. Opening the air shut-off valve any farther would drive the interface out of the tube and switch the entire flow regime from bubbly to annular. The first tests suffered a serious problem in this respect. The plastic bubbles were not initially tapered but had a flat face on the tail. In order to drive the interface outside the bubble it was necessary to set the air flow rate much higher than was required to maintain the desired equilibrium. When the interface left the bubble the flow regime blew out immediately into annular flow. It was possible to bring the bubbly flow back by turning the gas flow rate down so that the annular flow collapsed. When this was done the interface was quickly sucked into the plastic bubble. There was apparently a secondary flow around the flat tail of the bubble because tapering the bubble virtually eliminated this problem. The importance of keeping the interface at a distance of about 1 to 1 inches from the plastic bubble stems from the need to allow the jet to recover from the effects of the no-slip bubble boundary. One cannot allow the separation distance to grow very large, though, because the wall shear will slow the jet and cause it to grow. One thereby loses the advantage of the fixed dimension of a simulated bubble. This question will be discussed more in a discussion of special tests. When an equilibrium condition has been achieved by balancing the gas flow rate with the entrainment, the liquid flow rate is measured by meter or by timing the filling of a weigh bucket.. The gas flow rate is measured by a
13 volume flow meter and stopwatch. The void fraction is measured by quickly closing the valves and measuring the height of the resulting water column. The void fraction is defined as the distance between valves minus the liquid height divided by the distance between valves. For some of the test runs the procedure was modified slightly to investigate specific problems or to alleviate difficulties produced by the test conditions. The first instance of these deviations was a series of tests which were intended to determine the effects of varying the separation distance between the bubble and the interface. In one instance a series of tests was run with constant liquid flow rates. By adjusting the gas flow rate the separation distance between the tail of the plastic bubble and the gas-liquid interface was maintained at 9 cm., 7 cm., 5 cm., 3 cm. and 2 cm. As the liquid flow rates were increased the definition of the gas-liquid interface became less and less clear. The turbulent jet and violently churning wake caused concern that the interface was inside rather than outside the tail of the plastic bubble. The condition of an interface inside the bubble will be called an attached interface for convenience throughout the remainder of the discussion. It became necessary to know what effect an attached interface would have so two criteria were used to investigate the condition. In one case the interface was allowed to recede from the desired position into the plastic bubble. This represented a slightly lower gas flow than that required for the equilibrium condition and it is designated as an attached, low flow condition. In the second case the gas flow is increased until the attached interface is just poised on the lip of the bubble. It represents in the usual case a flow rate equal to or very slightly higher than that required for the equilibrium
14 condition. A series was run in which the two attached interface conditions and the usual 1-l inch spacing were repeated for various flow rates. A second modification of the basic procedure was required in testing with silicone oil and nitrogen. It was found that the bubbly flow was agglomerating into slug flow before reaching the downstream valve. The void fraction measurements were erratic because of the inclusion of large bubbles in some tests but not others. To counteract this condition it was necessary to set up the liquid and gas flow rates and measure them. Just before measuring the void fraction the gas flow was stopped so that all slugs were cleared from the test section. The gas was then turned on again and in the short interval between the establishment of the desired flow condition and the development of the first large bubbles the void fraction had to be measured. This modification to procedure improved the repeatability of the void fraction measurements. Several procedural difficulties deserve explanation. Mention has already been made of the lack of definition of the gas-liquid interface at high velocity. Some improvement could be achieved if the flow were observed with an outside window as a background. In such a case the interface became a shadow behind the highly turbulent jet. This type of observation was used for all very high velocities. An additional problem was the sensitivity of the test settings to water supply pressure. The city water supply fluctuates wildly between 40 and 55 pounds gage pressure during certain peak demand periods of the day. After several frustrating attempts to cope with the problem these periods were used for reducing data taken during quieter periods. A pressure regulator might have helped the situation but would have reduced the operating range of the apparatus.
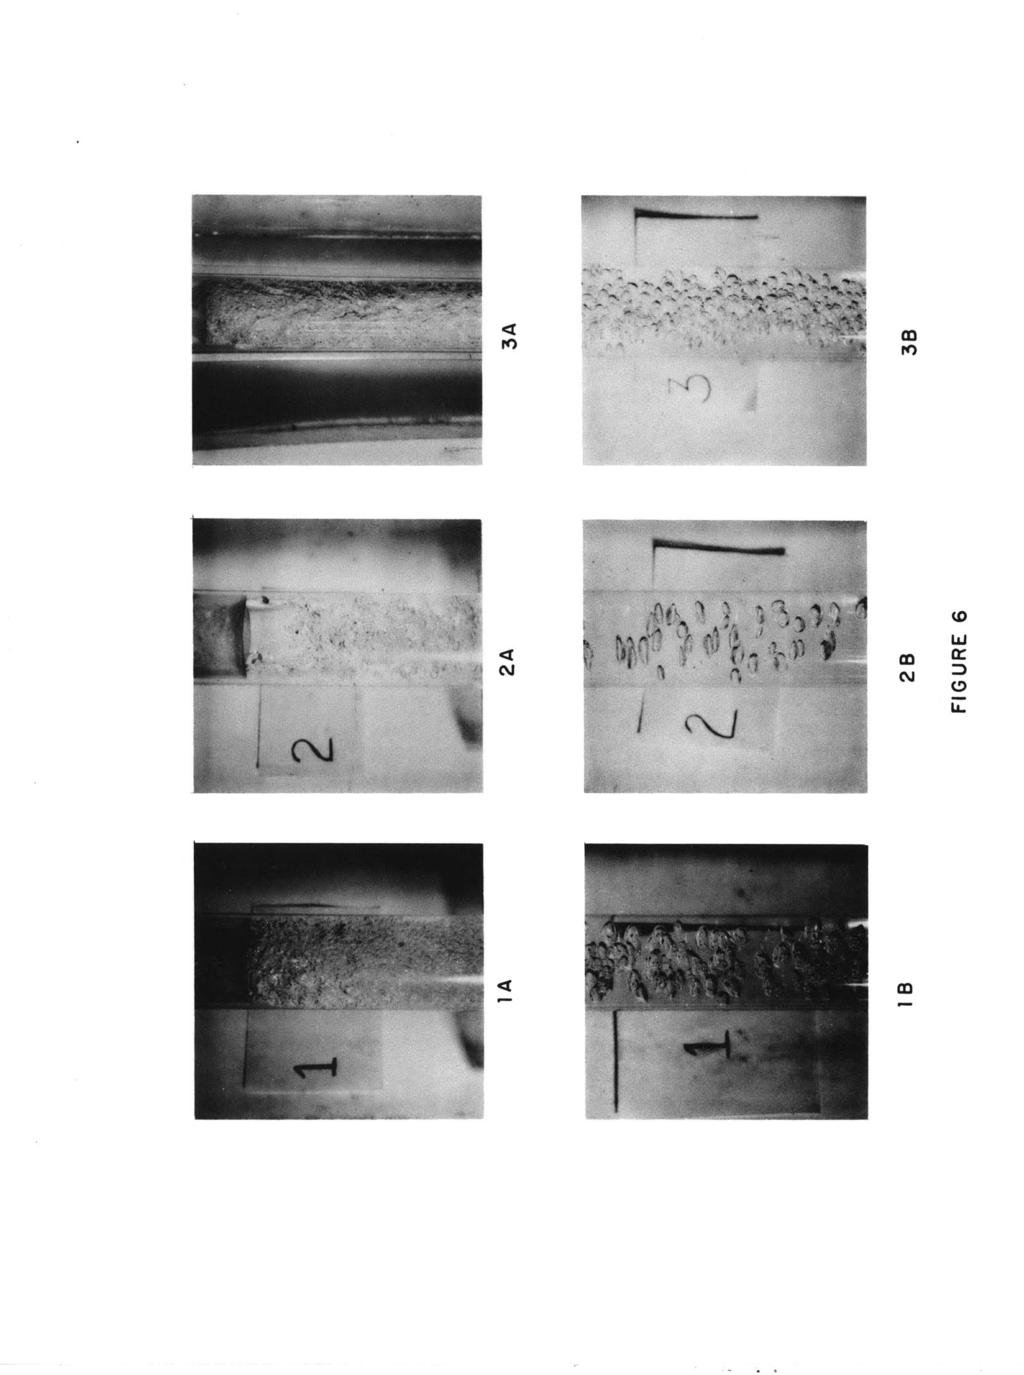
15 Experimental Observations Of special importance to the entrainment process is the nature of the two phase flow in the slug. For descriptive purposes the slug is divided into three segments; the wake, consisting of a short length immediately behind the bubble, the developing section and the developed section. The wake of a slug flow bubble is a highly turbulent section of the slug in which small bubbles, droplets of liquid and gas-liquid interfaces are quite ill-defined. Only for very low bubble velocities does the tail of a slug flow bubble satisfy the description of a nearly flat surface. Indeed, as soon as the velocity is increased enough to reach a Reynolds number above 5000 in the film the wake churns and pulses quite rapidly. At very high velocities the churning is very violent but the pulsing of the bubble-wake boundary (it can no longer reasonably be called an interface) is somewhat diminished. The length of the wake increases slowly with increasing velocity of the flow. At the highest velocities tested, a jet velocity of 41 feet per second which corresponded to a throughput velocity of 33 feet per second as calculated from Equation (5), the wake was about 8 pipe diameters in length. The growth of the wake length can be observed in Figure 6 at the end of the report. Photograph 2A shows a very short wake with agglomeration occurring immediately below the gas-liquid interface. On Photograph 1A the wake length is approximately 1 pipe diameter in length and in Photograph 3A the wake extends beyond the range of the photograph. The end of the wake is defined for purposes of this discussion as the point where a distinct bubbly flow can be observed. At high velocities the wake changes rather abruptly into the bubbly flow.
16 The developing section is immediately behind the wake. Very small bubbles are pulled out of the wake into this section where they quickly agglomerate into larger bubbles. Photographs which will be discussed later in this section indicate that these larger bubbles grow to a diameter of approximately one-fifth to one-third of the pipe diameter. Once again the developing section grows in length as the velocity of the mixture increases. This result is consistent with the observations of Radovcich and Moissis (6) who found a similar result for developing slug flows. The "developed section" of the slug is really a misnomer. It implies that no changes will occur in the flow pattern but in fact the agglomeration process is still occurring. The section is discussed separately because the agglomeration process is considerably slower than in the developing section. In the particular case of the silicone oil-nitrogen data the agglomeration process continued even to the formation of a slug flow. This agglomeration occurred spontaneously for the case of a 3/4" pipe with a jet thickness of 0.031". With a 3/4" pipe and a jet thickness of 0.041" the formation of a slug flow could be induced but would not occur spontaneously. When the jet thickness was increased to 0.051" no agglomeration to slug flow occurred. In the general case no noticeable agglomeration occurred in the developed section of the slug. A similar wake agglomeration process has been observed in flowing systems. It is important to determine how well the present model approximates the actual conditions existing in a two phase slug flow. To this end the observations made during this investigation are compared to the observations of other reporters. Numerous investigators have included photographs of slug flow in their reports. Among these are: Griffith and Wallis (11), low speed flows; Solomon (12), low to moderate speed flows; and Griffith (3) moderate
17 speed flows. The reader is invited to compare the wakes pictured in the above references with photographs of three flow conditions produced during the current investigation and shown in Figure 6. Photographs la and lb show a moderate speed wake and the resulting fully developed bubbly flow. One can see that even at a jet velocity of 13 feet per second there is an ill-defined interface followed by a wake of very small bubbles gradually increasing in size and decreasing in number as the distance from the tail of the bubble increases. Photograph lb shows the bubbly flow at the middle of the test section. The void fraction for this test was 14.4%. Photographs 2a and 2b show a low speed flow in which the gas-liquid interface is clearly defined and very similar to that shown in the Griffith and Wallis report. The velocity of the jet is 9.22 feet per second and void fraction is much less than 8%, too small to be measured in the present apparatus. Photographs 3a and 3b present a relatively high speed flow, the jet velocity being 25 feet per second. In an attempt to improve the resolution a lens was fitted to the apparatus. Unfortunately it is still possible to see only the turbulence of the jet. It is in cases like this that the backlighting must be used. The void fraction for this case is 19.9%. In switching to the 1" diameter test section a unexpected result was obtained. For large jet thickness, = 0.062", the core of the developed slug contained what looked like a very high void fraction. The bubbles were large and seemed closely packed. Surrounding this core of bubbles was an annular film of liquid which contained no bubbles. With a smaller jet thickness the core of bubbles grew larger and the void fraction increased. No noticeable increase in void fraction of the core could be seen. No such behavior was
18 noticed for the 3/4" tube although it conceivably could have existed. The effect was striking for the case of the 1" pipe and led the investigator to believe that something was disrupting the flow pattern. A second observation is related to the behavior of the gas-liquid interface when in the vicinity of the tail of the plastic bubble. Assume for descriptive purposes that the interface is far downstream. If the gas flow rate is slightly less than the entrainment rate the interface will move slowly toward the bubble. The rate of movement is rather slow and steady until the interface is several diameters from the bubble. At this point the interface accelerates toward the bubble. As the separation distance diminishes the velocity of the interface increases rapidly. A similar behavior is reported by Moissis and Griffith (9) for the agglomeration of Taylor bubbles in a developing slug flow. The reasons for the behavior are not similar because the interface movement is dependent upon the jet velocities and thicknesses and the bubble movement is dependent upon wake effects of a leading bubble. Results In the introduction to this report there is proposed a model for a slug flow to bubbly flow transition which requires a drastic increase in the gas entrainment at the tail of a slug flow bubble. In the case of the observations of one investigator, Kosterin (1), such a change should occur at a mixture velocity of about 13 feet per second in a 1" pipe. Using Equation (5) this corresponds to a jet velocity of 21 feet per second. In the present investigation the entrainment from a slug flow bubble has been studied with jet velocities ranging up to 40.8 feet per second. The raw
19 data for entrained void fraction are plotted against the jet velocity for all test conditions on Figures 7 through 10. It is noted that the void fraction for all water data increases rapidly with increasing velocity in the low velocity range and increases very slowly with increasing velocity in the high velocity range. Data for silicone oil was obtained only for low velocities so the rate of increase of void fraction with increasing velocity was large. The encircled data on Figure 7 was obtained under the conditions of agglomeration to slug flow as discussed in the Experimental Observations section. These data show the scatter which was introduced by the irregular presence of large bubbles in the wake. The dashed line which cuts through the data represents a laminar-turbulent transition in the annular jet. The value of the Reynolds number at the transition is set at This value is consistent with the observation that the jet changed from a glassy to a foggy film when a Reynolds number of 5000 was exceeded. Jet Reynolds numbers were calculated for all test runs at very low velocities. It was possible to observe that for Reynolds numbers less than 5000 the jet emerged from the tail of the plastic bubble with the glassy smoothness characteristic of a laminar flow. In noting that the Reynolds number in the annulus between the plastic bubble and the pipe wall is only half the Reynolds number of the emerging jet one can see the reason for this behavior. For all jet Reynolds numbers above 5000 the jet changed from laminar to turbulent with a transition length shorter than the separation distance from the tail of the bubble to the gas-liquid interface.
20 A secondary objective of this investigation has been to propose a mechanism to describe the gas entrainment in a slug flow. It had been hoped that the plastic bubble simulation of the actual flow condition would provide sufficient control of the geometry variables to allow a reasonably general reasonably simple correlation for the entrained void fraction. No simple dimensionless groups have been found to be generally adequate. Raw data is presented in Figures 7, 8, 9, and 10. The salient features that emerge from these figures are that void increases gradually with increasing jet velocity getting up to 35% at 41 ft/sec. Property and geometry effects are not large except that the very low surface tension for silicone oil displaces that curve well to the left. No evidence of a dramatic increase in void is to be seen at increasing velocity. An attempt was made to correlate these data but no single simple correlation was found to work in both laminar and turbulent flow. The groups found to work best for turbulent flow are shown on Figure (11) using the raw data of.figure (7). Geometric variables enter also so that a curve similar to Figure (11) would have to be developed for each geometry. The results are not general enough to make this worthwhile however, so just Figure (11) is presented. Conclusions 1. There is no indication of a sudden collapse of slug flow which results in a uniform bubbly or frothy mixture with increasing velocity. The fraction of small bubbles entrained just increases slowly. 2. Bubbly flow at voids higher than about 35% is a result of entrance conditions and does not represent a fully developed condition.
21 18 3. Visual observations of bubbly flow in unheated sections with voids greater than 35% are apparently faulty. 4. No simple criterion for the transition from bubbly to slug flow has been found.
22 Nomenclature V - Velocity Volume flow rate Cross section area Acceleration of gravity Volume Length? Density O'( X Void Fraction Distance from the tail of the plastic bubble Surface tension Viscosity Jet thickness A property parameter = e Weber number = Reynolds number = Subscripts. Average or overall ie S Bubble Slug Liquid Gas Absolute Pipe
23 BIBLIOGRAPHY 1. Kosterin, S. I., "Investigation of the Diameter and Position of Pipe Upon the Hydraulic Resistance and Structure of the Flow of a Gas-Liquid Mixture," Investia Akad Nauk, 12, Govier, G. W., B. A. Radford, and J. S. C. Dunn, "The Upwards Flow of Air Water Mixtures," The Can. Journal of Chem. Eng., 35, p. 58, August, Griffith, P., "The Slug-Annular Flow Regime Transition at Elevated Pressure," Argonne National Laboratory Report ANL-6796, November, Christiansen, Helge, "Power to Void Transfer Functions," Ph.D. Thesis, Nuclear Engineering Department, M.I.T., September, Egen, R. A., D. A. Dingee, and J. W. Chastain, "Vapor Formation and Behavior in Boiling Heat Transfer," ASME Paper 57-A Radovcich, N., R. Moissis, "The Transition from Two Phase Bubble Flow to Slug Flow," Technical Report No , D.S.R., M.I.T., Cambridge, Massachusetts. 7. Oyama, Y., Y. Takashima, and H. Idemura, "The Volume Rate of Air Dragged into Liquid by a Vertical Liquid Jet Flow to the Free Surface of the Liquid, Reports Sci. Res. Inst., 29, pp , Nicklin, R.,J. Wilkes, J., Davidson, J., "Two Phase Flow in Vertical Tubes," Trans. Inst. Chem. Eng., 40, Moissis, R., P. Griffith, "Entrance Effects in a Two Phase Slug Flow," ASME Paper No. 61-SA Kumlin, B., "The Effect of Electrical Fields on Two Phase Flow in Tubes," S.M. Thesis in Mechanical Engineering, M.I.T., Griffith, P. and G. B. Wallis, "Two Phase Slug Flow," August, 1960, ASME Paper No. 60-HT Solomon, J., "Construction of a Two Phase Flow Regime Transition Detector," S.M. Thesis in Mechanical Engineering, M.I.T., June, 1962.
24 Captions FIGURE 1. FIGURE 2. FIGURE 3. FIGURE 4. FIGURE 5. Sketch of simulated slug flow bubbles showing the wake and the entrainment occurring within it. Control volume for deriving continuity relations. Sketch of plastic bubble and table of geometric variables. Schematic drawing of single pass apparatus. Schematic diagram of recirculating apparatus. FIGURE 6. Photographs of entrainment process showing: 1 A Wake of a plastic bubble at = 13 feet per second with = inches. 1 B Developed flow behind the bubble with void fraction 14.4% 2 A Wake of a plastic bubble at = 9.22 feet per second with inches. 2 B Developed flow behind the bubble with void fraction 8%. 3 A Wake of a plastic bubble at = 25 feet. 3 B Developed flow behind a bubble with void fraction = 19.9% FIGURE 7. FIGURE 8. FIGURE 9. A FIGURE 10. 4b FIGURE 11. A Data for pipe diameter, = 0.75 inch, jet thickness = inch Water at Water at Silicone Data for inch. Water at Water at Silicone Silicone Silicone Water at temperature T = 41 0 F and air temperature T = 90 0 F and air oil and nitrogen at temperature T = 77 F pipe diameter, = 0.75 inch, jet thickness = temperature T = 41 0 F and air - bubble #2 temperature T = 90 0 F and air - bubble #2 oil and nitrogen at temperature T = 77 F - bubble oil and nitrogen at temperature T = 770F - bubble oil and nitrogen at temperature T = 77 0 F - bubble temperature T = 410F and air - bubble #5 Data for pipe diameter, = 0.75 inch, jet thickness = inch. Water at Water at temperature T = 410F and air temperature T = 900F and air Silicone oil and nitrogen at temperature T = 77 F Data for pipe diameter, T = 410F and air Jet thickness inch Jet thickness inch 1.00 inch, using water at temperature Correlated data from FIGURE 7. Water at temperature T = 410F and air Water at temperature T = 900F and air Silicone oil and nitrogen at temperature T = 77 F
25 Liquid Plastic Pipe Simu lated Slug Flow Bubble Air Jet -Wake with Bubbles FlGURE
26 I LID I -+-IQf I - f +Qg Qf+Q Q9 Q9 FIGURE 2
27 L KDb4 Bubble Bubble Pipe Centering Number Diameter (Db) Diameter (DP) Pins inch 0.75 inch inch 0.75 inch inch 0.75 inch inch 0.75 inch inch 0.75 inch inch 1.00 inch inch 1.00 inch 6 FIGURE 3
28 AIR HOT WATER PLASTIC BUBBLE COLD WATER Z COUPLED, QUICK 0 SACTING VALVES w O(MANUAL) WEIGHING BUCKET w FLOW METER AIR OUTLET PLATFORM SCALE SYSTEM NO.1 A. PIPE SIZE=0.75 IN. B. PIPE SIZE= 1.00 IN. WATER OUTLET FIGURE 4
29 GAS LIQUID FLOW METER -4- SILICONE OIL INLET COUPLED, QUICK ACTING VALVES (MANUAL) BYPASS PIPE GAS FLOW METER GA S -- SILICONE - OIL SYSTEM NO. 2 PIPE SIZE= 0.75 IN. FIGURE 5
30 CY w
31 O a LL - ' _ Q V (ft/sec) FIGURE 7
32 c o o IO V (f t / sec) FIGURE 8
33 LL U, V (ft/sec) FIGURE 9
34 c.32 O o.28 *24 O V- - (ft /sec) FIGURE 10
35 * NWE FIGURE I
INTERACTION BETWEEN WIND-DRIVEN AND BUOYANCY-DRIVEN NATURAL VENTILATION Bo Wang, Foster and Partners, London, UK
 INTERACTION BETWEEN WIND-DRIVEN AND BUOYANCY-DRIVEN NATURAL VENTILATION Bo Wang, Foster and Partners, London, UK ABSTRACT Ventilation stacks are becoming increasingly common in the design of naturally
Irrigation &Hydraulics Department lb / ft to kg/lit.
 CAIRO UNIVERSITY FLUID MECHANICS Faculty of Engineering nd Year CIVIL ENG. Irrigation &Hydraulics Department 010-011 1. FLUID PROPERTIES 1. Identify the dimensions and units for the following engineering
Flow and Mixing in the Liquid between Bubbles
 Excerpt from the Proceedings of the COMSOL Conference 2009 Boston Flow and Mixing in the Liquid between Bubbles Bruce A. Finlayson, Professor Emeritus of Chemical Engineering Department of Chemical Engineering,
Comparison of MARS-KS to SPACE for counter current flow limitation model
 Comparison of MARS-KS to SPACE for counter current limitation model Won Woong Lee, Min Gil Kim, Jeong I Lee Department of Nuclear and Quantum engineering, Korea Advanced Institute of Science and Technology
Section 2 Multiphase Flow, Flowing Well Performance
 Section 2 Multiphase Flow, Flowing Well Performance Multiphase Vertical Flow When producing an oil or gas well, the flow of the fluids up the tubing will be in most cases be 2 phase, liquid and gas. The
Development of High-speed Gas Dissolution Device
 Development of High-speed Gas Dissolution Device Yoichi Nakano*, Atsushi Suehiro**, Tetsuhiko Fujisato***, Jun Ma**** Kesayoshi Hadano****, Masayuki Fukagawa***** *Ube National College of Technology, Tokiwadai
Instruction Manual. Pipe Friction Training Panel
 Instruction Manual HL 102 Pipe Friction Training Panel 100 90 80 70 60 50 40 30 20 10 HL 102 Instruction Manual This manual must be kept by the unit. Before operating the unit: - Read this manual. - All
COMPUTATIONAL FLOW MODEL OF WESTFALL'S LEADING TAB FLOW CONDITIONER AGM-09-R-08 Rev. B. By Kimbal A. Hall, PE
 COMPUTATIONAL FLOW MODEL OF WESTFALL'S LEADING TAB FLOW CONDITIONER AGM-09-R-08 Rev. B By Kimbal A. Hall, PE Submitted to: WESTFALL MANUFACTURING COMPANY September 2009 ALDEN RESEARCH LABORATORY, INC.
Gerald D. Anderson. Education Technical Specialist
 Gerald D. Anderson Education Technical Specialist The factors which influence selection of equipment for a liquid level control loop interact significantly. Analyses of these factors and their interactions
THE INNER WORKINGS OF A SIPHON Jacques Chaurette p. eng. January 2003
 THE INNER WORKINGS OF A SIPHON Jacques Chaurette p. eng. www.lightmypump.com January 2003 Synopsis The objective of this article is to explain how a siphon works. The difference between low pressure, atmospheric
Single Phase Pressure Drop and Flow Distribution in Brazed Plate Heat Exchangers
 Purdue University Purdue e-pubs International Refrigeration and Air Conditioning Conference School of Mechanical Engineering 2016 Single Phase Pressure Drop and Flow Distribution in Brazed Plate Heat Exchangers
PIG MOTION AND DYNAMICS IN COMPLEX GAS NETWORKS. Dr Aidan O Donoghue, Pipeline Research Limited, Glasgow
 PIG MOTION AND DYNAMICS IN COMPLEX GAS NETWORKS Dr Aidan O Donoghue, Pipeline Research Limited, Glasgow A model to examine pigging and inspection of gas networks with multiple pipelines, connections and
Flow transients in multiphase pipelines
 Flow transients in multiphase pipelines David Wiszniewski School of Mechanical Engineering, University of Western Australia Prof. Ole Jørgen Nydal Multiphase Flow Laboratory, Norwegian University of Science
MEMORANDUM. Investigation of Variability of Bourdon Gauge Sets in the Chemical Engineering Transport Laboratory
 1 MEMORANDUM TO: FROM: Prof. Davis Hubbard Prof. Faith A. Morrison DATE: 22 April 2014 RE: Investigation of Variability of Bourdon Gauge Sets in the Chemical Engineering Transport Laboratory Introduction
SPECIFYING MOTIONLESS MIXERS
 SPECIFYING MOTIONLESS MIXERS The operating cost for the energy necessary to mix fluids with a motionless mixer is usually far lower than for any competitive mixing technique. An extruder which melts, mixes
Cover Page for Lab Report Group Portion. Pump Performance
 Cover Page for Lab Report Group Portion Pump Performance Prepared by Professor J. M. Cimbala, Penn State University Latest revision: 02 March 2012 Name 1: Name 2: Name 3: [Name 4: ] Date: Section number:
Paper 2.2. Operation of Ultrasonic Flow Meters at Conditions Different Than Their Calibration
 Paper 2.2 Operation of Ultrasonic Flow Meters at Conditions Different Than Their Calibration Mr William Freund, Daniel Measurement and Control Mr Klaus Zanker, Daniel Measurement and Control Mr Dale Goodson,
Experiment 8: Minor Losses
 Experiment 8: Minor Losses Purpose: To determine the loss factors for flow through a range of pipe fittings including bends, a contraction, an enlargement and a gate-valve. Introduction: Energy losses
Influence of rounding corners on unsteady flow and heat transfer around a square cylinder
 Influence of rounding corners on unsteady flow and heat transfer around a square cylinder S. K. Singh Deptt. of Mech. Engg., M. B. M. Engg. College / J. N. V. University, Jodhpur, Rajasthan, India Abstract
Study on the Influencing Factors of Gas Mixing Length in Nitrogen Displacement of Gas Pipeline Kun Huang 1,a Yan Xian 2,b Kunrong Shen 3,c
 Applied Mechanics and Materials Online: 2013-06-13 ISSN: 1662-7482, Vols. 321-324, pp 299-304 doi:10.4028/www.scientific.net/amm.321-324.299 2013 Trans Tech Publications, Switzerland Study on the Influencing
Predicting and Controlling Bubble Clogging in Bioreactor for Bone Tissue Engineering
 Predicting and Controlling Bubble Clogging in Bioreactor for Bone Tissue Engineering Marina Campolo, Dafne Molin, Alfredo Soldati Centro Interdipartimentale di Fluidodinamica e Idraulica and Department
. In an elevator accelerating upward (A) both the elevator accelerating upward (B) the first is equations are valid
 both the elevator accelerating upward (B) the first is equations are valid") IIT JEE Achiever 2014 Ist Year Physics-2: Worksheet-1 Date: 2014-06-26 Hydrostatics 1. A liquid can easily change its shape but a solid cannot because (A) the density of a liquid is smaller than that of
IIT JEE Achiever 2014 Ist Year Physics-2: Worksheet-1 Date: 2014-06-26 Hydrostatics 1. A liquid can easily change its shape but a solid cannot because (A) the density of a liquid is smaller than that of
MODELING AND SIMULATION OF VALVE COEFFICIENTS AND CAVITATION CHARACTERISTICS IN A BALL VALVE
 Proceedings of the 37 th International & 4 th National Conference on Fluid Mechanics and Fluid Power FMFP2010 December 16-18, 2010, IIT Madras, Chennai, India FMFP2010 341 MODELING AND SIMULATION OF VALVE
Wind Flow Validation Summary
 IBHS Research Center Validation of Wind Capabilities The Insurance Institute for Business & Home Safety (IBHS) Research Center full-scale test facility provides opportunities to simulate natural wind conditions
Micro Channel Recuperator for a Reverse Brayton Cycle Cryocooler
 Micro Channel Recuperator for a Reverse Brayton Cycle Cryocooler C. Becnel, J. Lagrone, and K. Kelly Mezzo Technologies Baton Rouge, LA USA 70806 ABSTRACT The Missile Defense Agency has supported a research
Two Phase Fluid Flow (ENGINEERING DESIGN GUIDELINE)
") Page : 1 of 61 Rev: 01 Guidelines for Processing Plant www.klmtechgroup.com Rev 01 KLM Technology #03-12 Block Aronia, Jalan Sri Perkasa 2 Taman Tampoi Utama 81200 Johor Bahru (ENGINEERING DESIGN GUIDELINE)
Page : 1 of 61 Rev: 01 Guidelines for Processing Plant www.klmtechgroup.com Rev 01 KLM Technology #03-12 Block Aronia, Jalan Sri Perkasa 2 Taman Tampoi Utama 81200 Johor Bahru (ENGINEERING DESIGN GUIDELINE)
FLOW CONSIDERATIONS IN INDUSTRIAL SILENCER DESIGN
 FLOW CONSIDERATIONS IN INDUSTRIAL SILENCER DESIGN George Feng, Kinetics Noise Control, Inc., 3570 Nashua Drive, Mississauga, Ontario Vadim Akishin, Kinetics Noise Control, Inc., 3570 Nashua Drive, Mississauga,
Mass Split of Two-Phase-Flow
 Mass Split of Two-Phase-Flow The split of two-phase-flow at horizontal side-t-junctions in unbalanced pipe systems for clean extinguishing agents Speaker: Gudrun Fay Minimax 2010 2013 Content 1. Applications
1. All fluids are: A. gases B. liquids C. gases or liquids D. non-metallic E. transparent ans: C
 Chapter 14: FLUIDS 1 All fluids are: A gases B liquids C gases or liquids D non-metallic E transparent 2 Gases may be distinguished from other forms of matter by their: A lack of color B small atomic weights
Multiphase Flow Prof. Gargi Das Department of Chemical Engineering Indian Institute of Technology, Kharagpur
 Multiphase Flow Prof. Gargi Das Department of Chemical Engineering Indian Institute of Technology, Kharagpur Module No. # 01 Lecture No. # 02 Estimation of Flow Patterns Well very good morning to all of
Gas Gathering System Modeling The Pipeline Pressure Loss Match
 PETROLEUM SOCIETY CANADIAN INSTITUTE OF MINING, METALLURGY & PETROLEUM PAPER 2005-230 Gas Gathering System Modeling The Pipeline Pressure Loss Match R.G. MCNEIL, P.ENG. Fekete Associates Inc. D.R. LILLICO,
CVEN 311 Fluid Dynamics Fall Semester 2011 Dr. Kelly Brumbelow, Texas A&M University. Final Exam
 CVEN 311 Fluid Dynamics Fall Semester 2011 Dr. Kelly Brumbelow, Texas A&M University Final Exam 8 pages, front & back, not including reference sheets; 21 questions An excerpt from the NCEES Fundamentals
Bioreactor System ERT 314. Sidang /2011
 Bioreactor System ERT 314 Sidang 1 2010/2011 Chapter 2:Types of Bioreactors Week 4 Flow Patterns in Agitated Tanks The flow pattern in an agitated tank depends on the impeller design, the properties of
Numerical Analysis of Two Phase Flow Patterns in Vertical and Horizontal Pipes
 Numerical Analysis of Two Phase Flow Patterns in Vertical and Horizontal Pipes MOHAMMED A. ABDULWAHID, HASANAIN J. KAREEM, MUJTABA A. ALMUDHAFFAR Thermal Mechanical Engineering, Southern Technical University,
Akasison Flow phenomena of a siphonic roof outlet
 Akasison Flow phenomena of a siphonic roof outlet Ir. Marc Buitenhuis MTD Hydraulic research engineer Akatherm BV, Panningen, The Netherlands 06-01-2011 Abstract So far the investigations on siphonic roof
THE BRIDGE COLLAPSED IN NOVEMBER 1940 AFTER 4 MONTHS OF ITS OPENING TO TRAFFIC!
 OUTLINE TACOMA NARROWS BRIDGE FLOW REGIME PAST A CYLINDER VORTEX SHEDDING MODES OF VORTEX SHEDDING PARALLEL & OBLIQUE FLOW PAST A SPHERE AND A CUBE SUMMARY TACOMA NARROWS BRIDGE, USA THE BRIDGE COLLAPSED
Investigation of Suction Process of Scroll Compressors
 Purdue University Purdue e-pubs International Compressor Engineering Conference School of Mechanical Engineering 2006 Investigation of Suction Process of Scroll Compressors Michael M. Cui Trane Jack Sauls
WIND-INDUCED LOADS OVER DOUBLE CANTILEVER BRIDGES UNDER CONSTRUCTION
 WIND-INDUCED LOADS OVER DOUBLE CANTILEVER BRIDGES UNDER CONSTRUCTION S. Pindado, J. Meseguer, J. M. Perales, A. Sanz-Andres and A. Martinez Key words: Wind loads, bridge construction, yawing moment. Abstract.
Applied Fluid Mechanics
 Applied Fluid Mechanics 1. The Nature of Fluid and the Study of Fluid Mechanics 2. Viscosity of Fluid 3. Pressure Measurement 4. Forces Due to Static Fluid 5. Buoyancy and Stability 6. Flow of Fluid and
Figure 1 Schematic of opposing air bearing concept
 Theoretical Analysis of Opposing Air Bearing Concept This concept utilizes air bearings to constrain five degrees of freedom of the optic as shown in the figure below. Three pairs of inherently compensated
UNIT 15 WATER HAMMER AND SURGE TANKS
 UNT 15 WATER HAMMER AND SURGE TANKS Structure 15.1 ntroduction Objectives 15.2 Water Hammer 15.2.1 Expression for Rise in Pressure 15.3 Rapid Acceleration of Flow 15.4 Surge Tanks 15.5 Summary 15.6 Keywords
AIR-WATER FLOW STRUCTURES AT AN ABRUPT DROP WITH SUPERCRITICAL FLOW
 AIR-WATER FLOW STRUCTURES AT AN ABRUPT DROP WITH SUPERCRITICAL FLOW H. CHANSON and L. TOOMBES Department of Civil Engineering, The University of Queensland, Brisbane QLD 4072, Australia 1. Introduction
Effect of 180 bends on gas/liquid flows in vertical upward and downward pipes
 Computational Methods in Multiphase Flow VII 435 Effect of 180 bends on gas/liquid flows in vertical upward and downward pipes A. Almabrok, L. Lao & H. Yeung Department of Offshore, Process and Energy
Effect of Argon Gas Distribution on Fluid Flow in the Mold Using Time-Averaged k-ε Models
 Effect of Argon Gas Distribution on Fluid Flow in the Mold Using Time-Averaged k-ε Models B. G. Thomas, T. Shi and L. Zhang Department of Materials Science &. Engineering University of Illinois at Urbana-Champaign
A Computational Assessment of Gas Jets in a Bubbly Co-Flow 1
 A Computational Assessment of Gas Jets in a Bubbly Co-Flow 1 Melissa Fronzeo*, 1 Michael Kinzel 1 The Pennsylvania State University, University Park, PA, USA Abstract In this effort, Computational Fluid
Tutorial. BOSfluids. Relief valve
 Tutorial Relief valve The Relief valve tutorial describes the theory and modeling process of a pressure relief valve or safety valve. It covers the algorithm BOSfluids uses to model the valve and a worked
STUDY OF SLUG CONTROL TECHNIQUES IN PIPELINE SYSTEMS
 STUDY OF SLUG CONTROL TECHNIQUES IN PIPELINE SYSTEMS JOSÉ L. A,VIDAL Petrobrás Research Center - CENPES/PDEP/TOOL Av.Horácio de Macedo 95- Cidade Universitária 191-915 -Rio de Janeiro-RJ E-mail:josearias@petrobras.com.br
Air Ingestion and Transport Testing in a Rotating Drum Raw Water Strainer
 Abstract Air Ingestion and Transport Testing in a Rotating Drum Raw Water Strainer Ludwig Haber, Alden Research Laboratory James Smith, McGuire Nuclear Station, Duke Energy McGuire Nuclear Station (MNS)
Questions. theonlinephysicstutor.com. facebook.com/theonlinephysicstutor. Name: Edexcel Drag Viscosity. Questions. Date: Time: Total marks available:
 Name: Edexcel Drag Viscosity Questions Date: Time: Total marks available: Total marks achieved: Questions Q1. A small helium balloon is released into the air. The balloon initially accelerates upwards.
Free Surface Flow Simulation with ACUSIM in the Water Industry
 Free Surface Flow Simulation with ACUSIM in the Water Industry Tuan Ta Research Scientist, Innovation, Thames Water Kempton Water Treatment Works, Innovation, Feltham Hill Road, Hanworth, TW13 6XH, UK.
Experiment. THE RELATIONSHIP BETWEEN VOLUME AND TEMPERATURE, i.e.,charles Law. By Dale A. Hammond, PhD, Brigham Young University Hawaii
 Experiment THE RELATIONSHIP BETWEEN VOLUME AND TEMPERATURE, i.e.,charles Law By Dale A. Hammond, PhD, Brigham Young University Hawaii The objectives of this experiment are to... LEARNING OBJECTIVES introduce
AIRFLOW GENERATION IN A TUNNEL USING A SACCARDO VENTILATION SYSTEM AGAINST THE BUOYANCY EFFECT PRODUCED BY A FIRE
 - 247 - AIRFLOW GENERATION IN A TUNNEL USING A SACCARDO VENTILATION SYSTEM AGAINST THE BUOYANCY EFFECT PRODUCED BY A FIRE J D Castro a, C W Pope a and R D Matthews b a Mott MacDonald Ltd, St Anne House,
Gas Lift Workshop Doha Qatar 4-88 February Gas Lift Optimisation of Long Horizontal Wells. by Juan Carlos Mantecon
 Gas Lift Workshop Doha Qatar 4-88 February 2007 Gas Lift Optimisation of Long Horizontal Wells by Juan Carlos Mantecon 1 Long Horizontal Wells The flow behavior of long horizontal wells is similar to pipelines
CHE 4115 Chemical Processes Laboratory 2 Experiment 1. Batch Distillation
 CHE 4115 Chemical Processes Laboratory 2 Experiment 1 Batch Distillation BACKGROUND Distillation is one of the most commonly used unit operations in chemical engineering. In general, a distillation operation
Sizing Pulsation Dampeners Is Critical to Effectiveness
 Sizing Pulsation Dampeners Is Critical to Effectiveness Pressure variation is an important consideration when determining the appropriate size pulsation dampener needed for an application. by David McComb,
Lab # 03: Visualization of Shock Waves by using Schlieren Technique
 AerE545 Lab # 03: Visualization of Shock Waves by using Schlieren Technique Objectives: 1. To get hands-on experiences about Schlieren technique for flow visualization. 2. To learn how to do the optics
Experimental studies on the effect of the number of stages on the performance of an electrical submersible pump in two-phase flow conditions
 Fluid Structure Interaction VII 227 Experimental studies on the effect of the number of stages on the performance of an electrical submersible pump in two-phase flow conditions E. Salehi, J. Gamboa & M.
BACK PRESSURE / SUSTAINING
 In many liquid piping systems, it is vital that line pressure is maintained within relatively narrow limits. This is the function of the 108 Pressure Relief / Back Pressure Series of the OCV control valves.
TWO PHASE FLOW METER UTILIZING A SLOTTED PLATE. Acadiana Flow Measurement Society
 TWO PHASE FLOW METER UTILIZING A SLOTTED PLATE Acadiana Flow Measurement Society Gerald L. Morrison Presented by: Mechanical Engineering Department Daniel J. Rudroff 323 Texas A&M University Flowline Meters
Flow in a shock tube
 Flow in a shock tube April 30, 05 Summary In the lab the shock Mach number as well as the Mach number downstream the moving shock are determined for different pressure ratios between the high and low pressure
Row / Distance from centerline, m. Fan side Distance behind spreader, m 0.5. Reference point. Center line
 1 Standardisation of test method for salt spreader: Air flow experiments Report 7: Effect of crosswind on salt distribution by Jan S. Strøm, Consultant Aarhus University, Engineering Centre Bygholm, Test
FUNDAMENTALS OF PRESSURE REGULATORS ROBERT BENNETT MANAGER OF TRAINING ELSTER AMERICAN METER
 FUNDAMENTALS OF PRESSURE REGULATORS ROBERT BENNETT MANAGER OF TRAINING ELSTER AMERICAN METER SUPPLY = DEMAND FUNCTION OF A REGULATOR A regulator may be defined as a "mechanism for controlling or governing
Simulation of Gas Holdup in a Bubble Column with a Draft Tube for Gas Dispersion into an Annulus
 Simulation of Gas Holdup in a Bubble Column with a Draft Tube for Gas Dispersion into an Annulus Fukuji Yamashita Dept. of Applied Bioscience, Kanagawa Institute of Technology, Atsugi 243-292, Japan, yamasita@bio.kanagawa-it.ac.jp
Analysis of Shear Lag in Steel Angle Connectors
 University of New Hampshire University of New Hampshire Scholars' Repository Honors Theses and Capstones Student Scholarship Spring 2013 Analysis of Shear Lag in Steel Angle Connectors Benjamin Sawyer
Cover Page for Lab Report Group Portion. Drag on Spheres
 Cover Page for Lab Report Group Portion Drag on Spheres Prepared by Professor J. M. Cimbala, Penn State University Latest revision: 29 September 2017 Name 1: Name 2: Name 3: [Name 4: ] Date: Section number:
Fluid Flow. Link. Flow» P 1 P 2 Figure 1. Flow Model
 Fluid Flow Equipment: Water reservoir, output tubes of various dimensions (length, diameter), beaker, electronic scale for each table. Computer and Logger Pro software. Lots of ice.temperature probe on
EFFECTS OF CHEMICAL ADDITIVES ON THE PRESSURE DROP IN THE PIPES
 International Journal of Bio-Technology andresearch (IJBTR) ISSN(P): 2249-6858; ISSN(E): 2249-796X Vol. 4, Issue 1, Feb 2014, 1-6 TJPRC Pvt. Ltd. EFFECTS OF CHEMICAL ADDITIVES ON THE PRESSURE DROP IN THE
MEMORIAL UNIVERSITY OF NEWFOUNDLAND Faculty of Engineering and Applied Science FLUID MECHANICS LABORATORY PIPE FRICTION
 MEMORIAL UNIVERSITY OF NEWFOUNDLAND Faculty of Engineering and Applied Science FLUID MECHANICS LABORATORY PIPE FRICTION Objective To estimate the fluid pressure drops and roughness specifications for copper
6. EXPERIMENTAL METHOD. A primary result of the current research effort is the design of an experimental
 6. EXPERIMENTAL METHOD 6.1 Introduction A primary result of the current research effort is the design of an experimental setup that can simulate the interaction of a windmill with a vortex wake and record
BACK PRESSURE / SUSTAINING
 SPECIFICATIONS DIMENSIONS In many liquid piping systems, it is vital that line pressure is maintained within relatively narrow limits. This is the function of the 108 Pressure Relief / Back Pressure Series
International Journal of Technical Research and Applications e-issn: , Volume 4, Issue 3 (May-June, 2016), PP.
, PP.") DESIGN AND ANALYSIS OF FEED CHECK VALVE AS CONTROL VALVE USING CFD SOFTWARE R.Nikhil M.Tech Student Industrial & Production Engineering National Institute of Engineering Mysuru, Karnataka, India -570008
DESIGN AND ANALYSIS OF FEED CHECK VALVE AS CONTROL VALVE USING CFD SOFTWARE R.Nikhil M.Tech Student Industrial & Production Engineering National Institute of Engineering Mysuru, Karnataka, India -570008
Ermenek Dam and HEPP: Spillway Test & 3D Numeric-Hydraulic Analysis of Jet Collision
 Ermenek Dam and HEPP: Spillway Test & 3D Numeric-Hydraulic Analysis of Jet Collision J.Linortner & R.Faber Pöyry Energy GmbH, Turkey-Austria E.Üzücek & T.Dinçergök General Directorate of State Hydraulic
3 1 PRESSURE. This is illustrated in Fig. 3 3.
 P = 3 psi 66 FLUID MECHANICS 150 pounds A feet = 50 in P = 6 psi P = s W 150 lbf n = = 50 in = 3 psi A feet FIGURE 3 1 The normal stress (or pressure ) on the feet of a chubby person is much greater than
Air entrainment in Dip coating under vacuum
 Air entrainment in Dip coating under vacuum M.I. Khan, R. Patel, H. Benkreira, IRC, School of Engineering, Design and Technology, University of Bradford, BD7 1DP, Abstract Air entrainment studies in dip
LOW PRESSURE EFFUSION OF GASES revised by Igor Bolotin 03/05/12
 LOW PRESSURE EFFUSION OF GASES revised by Igor Bolotin 03/05/ This experiment will introduce you to the kinetic properties of low-pressure gases. You will make observations on the rates with which selected
Micro Motion Pressure Drop Testing
 12/2018 Micro Motion Pressure Drop Testing www.emerson.com/micromotion Introduction Micro Motion has traditionally taken a very conservative approach to pressure drop, with single pressure measurements
CHAPTER 2 EXPERIMENTAL SETUP AND PROCEDURE
 22 CHAPTER 2 EXPERIMENTAL SETUP AND PROCEDURE 2.1 EXPERIMENTAL COLUMN All the experiments were carried out in an internal loop airlift fluidized bed and combined loop fluidized bed (an external down comer
Technical Note. Determining the surface tension of liquids by measurements on pendant drops
 Technical Note Pendant Drop Measurements Technical note: TN316e Industry section: all Author: FT, TW Date: 12/2010 Method: Drop Shape Analyzer DSA100 Keywords: Methods, surface tension, interfacial tension,
NUMERICAL AND EXPERIMENTAL INVESTIGATION OF THE FLOWFIELD IN A BLOWDOWN WIND TUNNEL
 ICAS 2002 CONGRESS NUERICAL AND EXPERIENTAL INVESTIGATION OF THE FLOWFIELD IN A BLOWDOWN WIND TUNNEL Ali Rebaine, ahmood Khalid, Cabot Broughton and Fred Ellis Institute for Aerospace Research, National
Visual Observation of Nucleate Boiling and Sliding Phenomena of Boiling Bubbles on a Horizontal Tube Heater
 Proceedings of the 2 nd World Congress on Mechanical, Chemical, and Material Engineering (MCM'16) Budapest, Hungary August 22 23, 216 Paper No. HTFF 146 DOI:.11159/htff16.146 Visual Observation of Nucleate
PHYS 101 Previous Exam Problems
 PHYS 101 Previous Exam Problems CHAPTER 14 Fluids Fluids at rest pressure vs. depth Pascal s principle Archimedes s principle Buoynat forces Fluids in motion: Continuity & Bernoulli equations 1. How deep
4.1 Why is the Equilibrium Diameter Important?
 Chapter 4 Equilibrium Calculations 4.1 Why is the Equilibrium Diameter Important? The model described in Chapter 2 provides information on the thermodynamic state of the system and the droplet size distribution.
Cover Page for Lab Report Group Portion. Head Losses in Pipes
 Cover Page for Lab Report Group Portion Head Losses in Pipes Prepared by Professor J. M. Cimbala, Penn State University Latest revision: 02 February 2012 Name 1: Name 2: Name 3: [Name 4: ] Date: Section
COMPRESSED AIR DISTRIBUTION SYSTEMS
 Series COMPRESSED AIR DISTRIBUTION SYSTEMS 18 DESIGNING AN EFFICIENT COMPRESSED AIR DISTRIBUTION The main source of inefficiencies and problems affecting compressed air distribution systems is often the
The Discussion of this exercise covers the following points: Pumps Basic operation of a liquid pump Types of liquid pumps The centrifugal pump.
 Exercise 2-3 Centrifugal Pumps EXERCISE OBJECTIVE In this exercise, you will become familiar with the operation of a centrifugal pump and read its performance chart. You will also observe the effect that
Design of a Solid Wall Transonic Wind Tunnel
 Design of a Solid Wall Transonic Wind Tunnel David Wall * Auburn University, Auburn, Alabama, 36849 A solid wall transonic wind tunnel was designed with optical access from three sides to allow for flow
TUTORIAL. NPSHA for those who hate that stuffy word. by Jacques Chaurette p. eng. copyright 2006
 TUTORIAL NPSHA for those who hate that stuffy word by Jacques Chaurette p. eng. www.lightmypump.com copyright 2006 page.2 NPSHA for those who hate that stuffy word This article follows the same approach
CFD Flow Analysis of a Refrigerant inside Adiabatic Capillary Tube
 CFD Flow Analysis of a Refrigerant inside Adiabatic Capillary Tube Y Raja Kumar ¹, Dr.P Usha sri ² PG Student¹, Associate professor² Department of Mechanical Engineering, University College of Engineering
Pigging as a Flow Assurance Solution Avoiding Slug Catcher Overflow
 Pigging as a Flow Assurance Solution Avoiding Slug Catcher Overflow Aidan O'Donoghue, Pipeline Research Limited, Glasgow, UK This paper sets out to provide an initial method of assessing the bypass requirements
Numerical Simulations of a Train of Air Bubbles Rising Through Stagnant Water
 Numerical Simulations of a Train of Air Bubbles Rising Through Stagnant Water Hong Xu, Chokri Guetari ANSYS INC. Abstract Transient numerical simulations of the rise of a train of gas bubbles in a liquid
OLGA. The Dynamic Three Phase Flow Simulator. Input. Output. Mass transfer Momentum transfer Energy transfer. 9 Conservation equations
 서유택 Flow Assurance The Dynamic Three Phase Flow Simulator 9 Conservation equations Mass (5) Momentum (3) Energy (1) Mass transfer Momentum transfer Energy transfer Input Boundary and initial conditions
Computational fluid dynamics analysis of a mixed flow pump impeller
 MultiCraft International Journal of Engineering, Science and Technology Vol. 2, No. 6, 2010, pp. 200-206 INTERNATIONAL JOURNAL OF ENGINEERING, SCIENCE AND TECHNOLOGY www.ijest-ng.com 2010 MultiCraft Limited.
NOTES ON WATER HAMMER. 55
 NOTES ON WATER HAMMER. 55 NOTES ON WATER HAMMER. By A. B. Robison. When the flow conditions of a liquid in a pipe line are varied by the opening or closing of a valve or the equivalent, a change in the
Simulation of Free Surface Flows with Surface Tension with ANSYS CFX
 Simulation of Free Surface Flows with Surface Tension with ANSYS CFX C. Kurt Svihla, Hong Xu ANSYS, Inc. Abstract Three different test cases involving free surface flows with surface tension were investigated
Laser-Induced Bubbles in Glycerol-Water Mixtures
 Laser-Induced Bubbles in Glycerol-Water Mixtures Allison R. McCarn, Erin M. Englert, and Gary A. Williams Department of Physics and Astronomy, University of California, Los Angeles, California 90095, USA
Modeling Turbulent Entrainment of Air at a Free Surface C.W. Hirt 5/24/12 Flow Science, Inc.
 Flow Science Report 01-12 Modeling Turbulent Entrainment of Air at a Free Surface C.W. Hirt 5/24/12 Flow Science, Inc. Overview In free-surface flows the turbulence in the liquid may be sufficient to disturb
API th Edition Ballot Item 7.8 Work Item 4 Gas Breakthrough
 API 521 7 th Edition Ballot Item 7.8 Work Item 4 Gas Breakthrough NOTE: This is a reballot of previously approved API 521 7 th Edition Ballot Item 6.3 which was modified based on comments. Comments should
THEORETICAL EVALUATION OF FLOW THROUGH CENTRIFUGAL COMPRESSOR STAGE
 THEORETICAL EVALUATION OF FLOW THROUGH CENTRIFUGAL COMPRESSOR STAGE S.Ramamurthy 1, R.Rajendran 1, R. S. Dileep Kumar 2 1 Scientist, Propulsion Division, National Aerospace Laboratories, Bangalore-560017,ramamurthy_srm@yahoo.com
Process Dynamics, Operations, and Control Lecture Notes - 20
 Lesson 0. Control valves 0.0 Context Controller output is a signal that varies between 0 and 100%. Putting this signal to use requires a final control element, a device that responds to the controller
SAFETY DEMONSTRATION TESTS ON HTR-10
 2nd International Topical Meeting on HIGH TEMPERATURE REACTOR TECHNOLOGY Beijing, CHINA,, September 22-24, 24 #Paper H6 SAFETY DEMONSTRATION TESTS ON HTR-1 Shouyin HU, Ruipian WANG, Zuying GAO Institute