OFFICE OF THE CITY ADMINISTRATOR
|
|
|
- Gyles Wilson
- 5 years ago
- Views:
Transcription

1 OFFICE OF THE CITY ADMINISTRATOR Gavin Newsom, Mayor Edwin M. Lee, City Administrator December 21, 2007 Mr. Eric Simmons, CFM National Flood Insurance Program Region IX, Mitigation Division U.S. Department of Homeland Security 1111 Broadway, Suite 1200 Oakland, California Subject: September 21, 2007 Preliminary Flood Insurance Rate Map Comments from the City and County of San Francisco Dear Mr. Simmons: The City and County of San Francisco (CCSF) is submitting comments on the preliminary Flood Insurance Rate Map (FIRM) for San Francisco, issued by the Federal Emergency Management Agency (FEMA) on September 21, Our requested changes to the preliminary FIRM are summarized in the enclosed table. Each of the changes is based on technical data. The data supporting each of the changes, prepared by the Port of San Francisco and the San Francisco Redevelopment Agency, is also enclosed. We are also submitting technical comments from the Mayor s Office of Base Reuse and the Treasure Island Development Authority and its consultants (Moffat & Nichol). Based on the issues raised by Moffat & Nichol, we are not in the position to agree or disagree with your findings at this time, but wanted to begin discussions with FEMA about questions that were raised and how the resolution of these issues may affect the current preliminary FIRM as well as the more detailed analysis that FEMA is currently preparing. It is our understanding that you will review the supporting data and revise the preliminary FIRM as appropriate. CCSF requests a review of the resulting changes to the FIRM prior to its finalization. Additionally, as we have discussed earlier, we request delaying publication of the final FIRM until the more detailed analysis of coastal high hazard areas of San Francisco Bay is complete, with the understanding that CCSF will join the National Flood Insurance Program in the meantime. We look forward to your response. If you have questions, please do not hesitate to contact me at (415) Sincerely, Linda S. Yeung Associate City Administrator 1 Dr. Carlton B. Goodlett Place, City Hall, Room 362, San Francisco, CA Telephone (415) ; Fax (415)
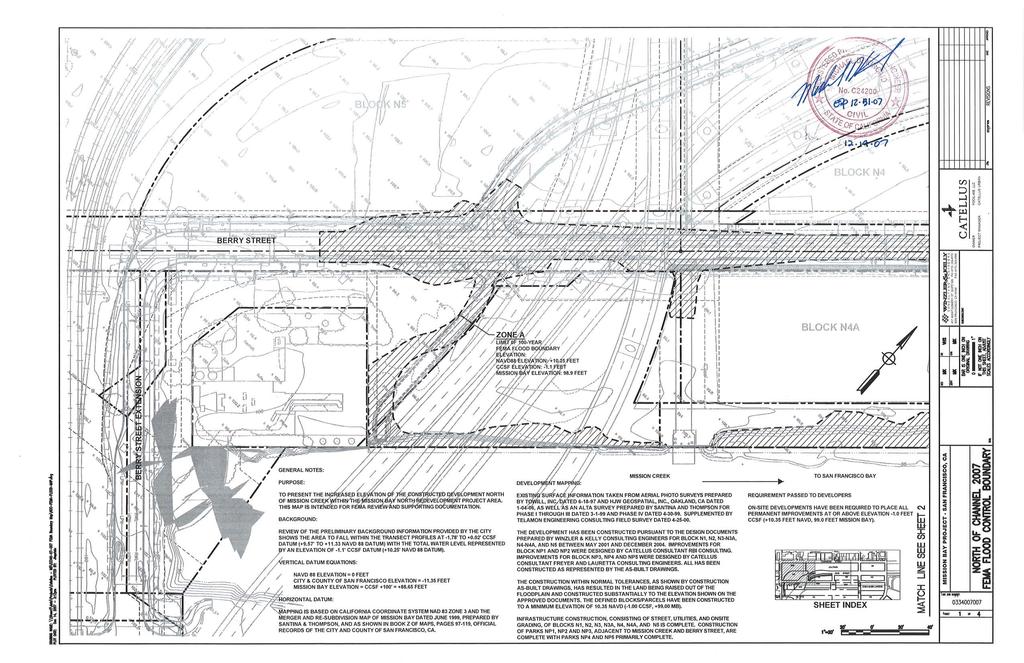
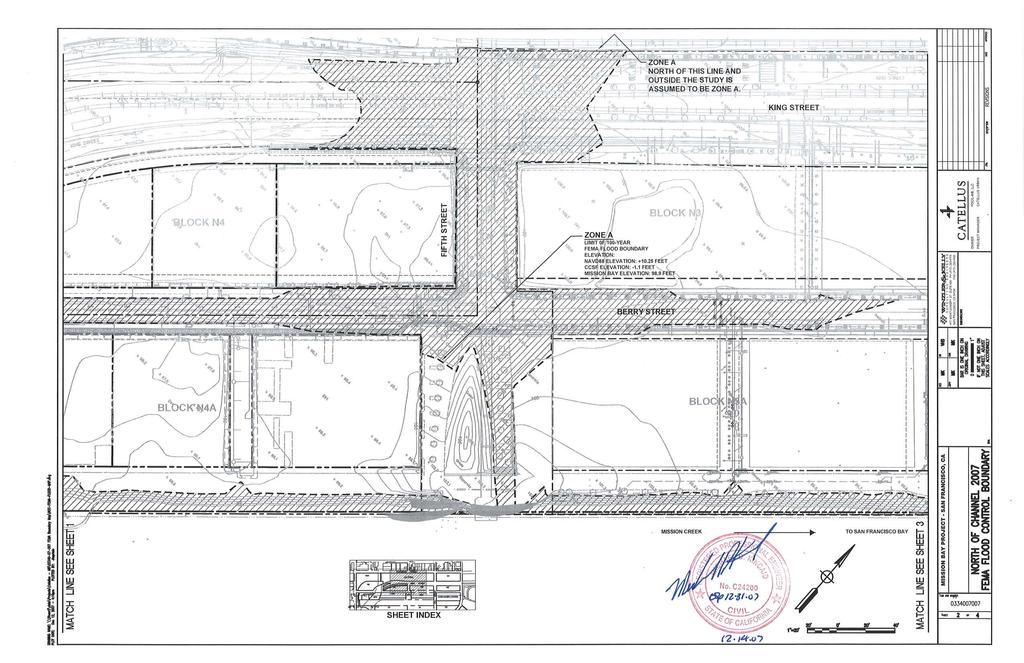
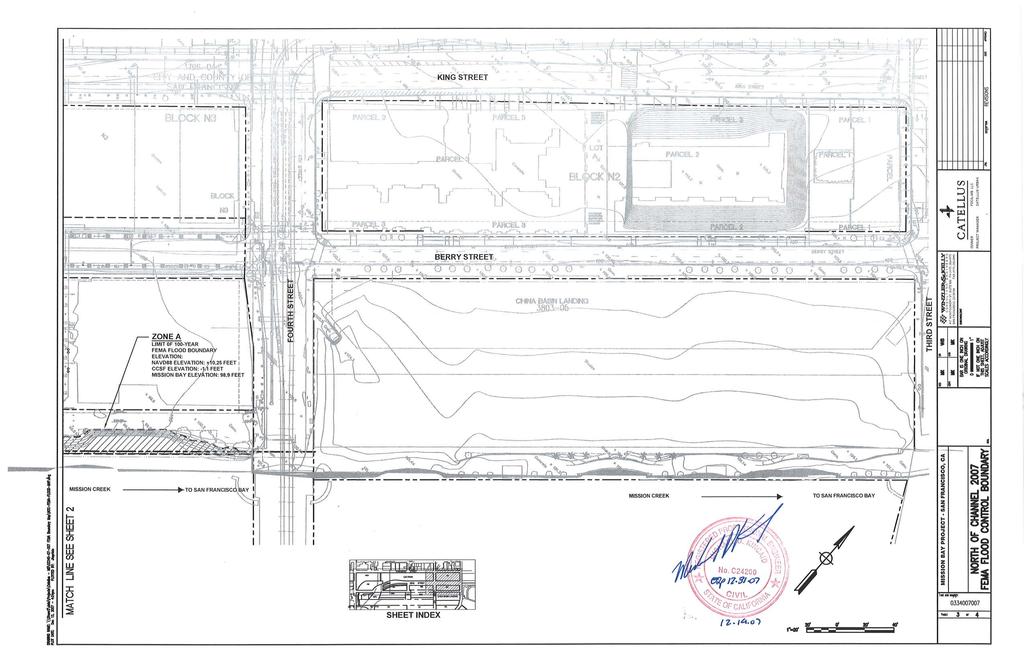
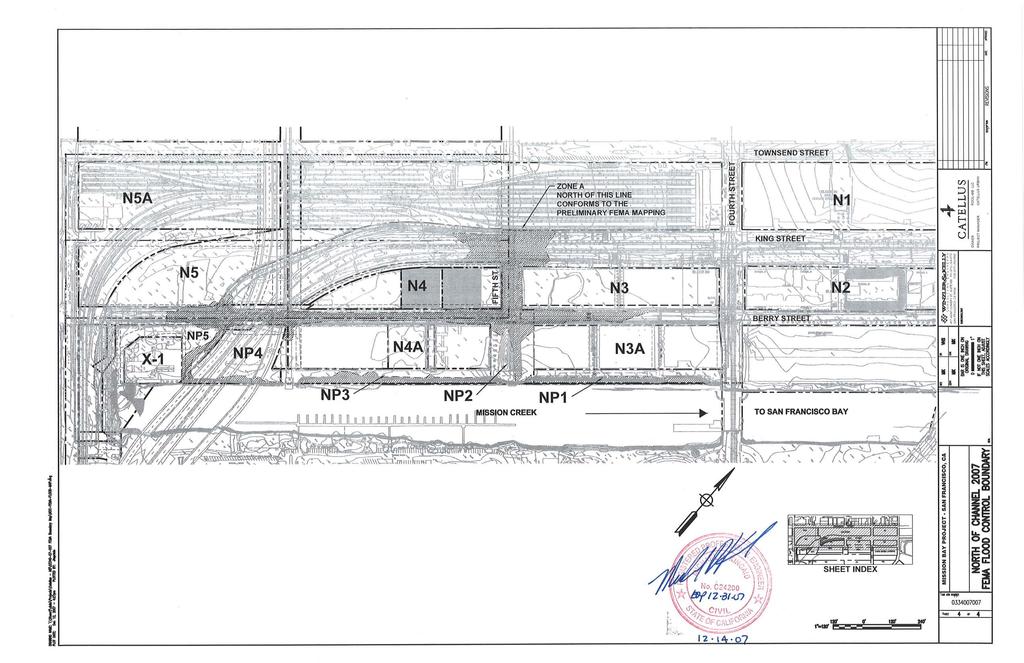
2 City and County of San Francisco Summary of Requested Changes to the September 21, 2007 Preliminary Flood Insurance Rate Map (FIRM) December 21, 2007 The table below summarizes requested changes to the preliminary FIRM for the City and County of San Francisco (CCSF). Item No. 1 Comment Map Number Supporting Data Remove the Special Flood Hazard Area (SFHA) designation from Pier 41 south to pier 50 (inclusive) and remove the Port piers, wharf structures and landside improvements protected by these structures; and designate these areas as Zone X C 0120A December 14, 2007 report and attachments prepared by the Port of San Francisco. See Appendix A. 2 Remove the SFHA designation from existing high ground to the north of Mission Creek in the Mission Bay North Redevelopment area and designate these areas as Zone X C 0120A Topographic data provided by the San Francisco Redevelopment Agency and Winzler & Kelly. See Appendix B.
3 Cc: Ed Lee, City Administrator The Honorable Sean Elsbernd Brad Benson, Port of San Francisco Ed Byrne, Port of San Francisco Catherine Reilly, San Francisco Redevelopment Agency John Roddy, City Attorney s Office Bruce Storrs, City and County Surveyor Jack Sylvan, Treasure Island Development Project
4 Appendix A Port of San Francisco Comments on FEMA Preliminary Flood Insurance Rate Map See 4 separate binders and disk
5 Port of San Francisco Comments on the FEMA Preliminary Flood Insurance Rate Map by Port of San Francisco Engineering Division 14 December 2007 Edward F. Byrne Chief Harbor Engineer -1-
6 Engineering Report Table of Contents A. Introduction 1. Background 2. Preliminary Flood Insurance Rate Maps B. Port Facilities and Maintenance Programs 1. Existing Structures a. Seawalls and Marginal Wharfs b. Breakwaters c. Piers 2. Seismic Strengthening 3. Port Inspection and Maintenance Program C. Conclusion D. Appendices: Appendix A Appendix B Appendix C Appendix D Appendix E Appendix F Appendix G FEMA FIRM for Port of San Francisco FEMA Table of TWL and Locations Port Operations and Maintenance Manual Port of San Francisco Waterfront Facilities Map of Port Waterfront Port of San Francisco Waterfront Facilities Seawalls Port of San Francisco Waterfront Facilities Breakwaters Port of San Francisco Waterfront Facilities Piers & Wharfs -2-
7 A. INTRODUCTION 1. Background This report documents and provides the technical basis for the Port of San Francisco s (Port) response and comments to FEMA s Preliminary Flood Insurance Rate Map (FIRM) published on September 21, The analysis and certifications included in this report show that: 1) the Port s piers and wharfs are structurally sufficient to withstand the effects of wave action and most of the pier decks are above the expected wave heights and therefore should be removed from the Special Flood Hazard Area (SFHA) and shown on the maps as Zone X; 2) the Port s seawall sections are structurally sufficient and have adequate height above the expected wave heights to provide protection against the 100-year flood event (1% annual chance flood) and therefore the landside improvements should be removed from the SFHA and shown on the maps as Zone X; and 3) the breakwaters are structurally sufficient to provide protection to many areas of the Port waterfront by reducing the wave height. Since the breakwaters provide significant flood protection, the Port requests that FEMA should re-analyze the projected 100-year flood elevations in the areas behind the breakwaters to account for their effect. FEMA s team of coastal engineers reviewed historic data, coastal topography and performed a preliminary hydrological and hydraulic analysis including a probabilistic analysis to establish the impact 100-year flood event for the San Francisco waterfront. FEMA has now completed the preliminary analysis and has established a preliminary FIRM. This map depicts the water elevations anticipated for a 100-year flood for the Port s waterfront. The preliminary FIRM for the Port s waterfront is shown in Appendix A. Study of the preliminary FIRM indicates that much of the Port waterfront including the finger piers, marginal wharfs, Herb Caen Promenade and much of the Embarcadero roadway is within a SFHA designated as Zone V. Zone V is defined by FEMA for this San Francisco Bay study as: Areas along coasts subject to inundation by the 1-percent-annual-chance flood event with additional hazards associated with storm-induced waves. Because detailed hydraulic analyses have not been performed, no Base Flood Elevations (BFEs) or flood depths are shown. Mandatory flood insurance purchase requirements and floodplain management standards apply. Since FEMA did not determine the BFEs for the Port s waterfront, the preliminary FIRM is based on Total Water Level (TWL) that was established by the analysis. The TWL elevations were transmitted to the Port in a spreadsheet format accompanied with a map showing the locations where the elevations were calculated. A copy of this FEMA transmittal is included in the Appendix B. The TWL elevation includes the effect of storm surge and wave and, thus, represents the maximum expected water elevation projected by FEMA s analysis. Initial analysis by the Port s Engineering Division indicates that most of the Port s finger piers, wharfs and roadways have a freeboard (or clearance) of one foot or more above the TWL elevations projected by FEMA for the 100 year storm event. FEMA informed the Port that the FEMA analysis did not account for the Port s waterfront seawall and breakwater structures which Provide considerable flood protection. -3-
8 The engineering analyses and certifications included in this report demonstrate that the Port s waterfront facilities offer considerable protection to flooding that must to be considered in the determination of Special Flood Hazard areas along the Port s waterfront. This report analyzes only the Port waterfront facilities from Pier 41 on the north to Pier 50 in the south. Port facilities to the north of Pier 41, including the Fisherman s Wharf Area, are not addressed in this report since FEMA indicated further TWL analysis is required in this area. The Port requests that FEMA revise the analysis to include the wave dissipating effect of the existing local breakwaters in the area. The breakwaters were not included in the Preliminary FIRM analysis, so the TWL s are erroneously indicating higher flood elevations than will actually occur. Port facilities to the south of Pier 50 are currently used for maritime operations. The existing waterfront structures provide adequate flood protection for this use. The Port is not submitting comment on FEMA s preliminary FIRM for any of the Port s facilities south of Pier 50. The structural analyses and certifications for Port waterfront facilities from Pier 41 to Pier 50, included in the Appendices, indicate that areas currently shown in FEMA s preliminary FIRM in SFHAs are actually safe from flooding due to the protection provided by the existing facilities. The Port s waterfront facilities were originally designed, constructed and anchored to prevent flotation, collapse and lateral movement resulting from hydrostatic and hydrodynamic loads including buoyancy. This report presents an independent analysis performed by Port Structural Engineers in accordance with the Corps of Engineer s guidelines included in the Criteria for Evaluating Coastal Flood-Protection Structures, USACE Technical Report CERC The analysis demonstrates that each of the Port s waterfront facilities is sufficient to resist the flooding loads and forces. A FEMA Coastal Structures Form, including supporting calculations, has been completed for each facility certified by Port engineers. The Port has a comprehensive Operations and Maintenance Manual for Waterfront Facilities that is used by Port inspection personnel to assure these critical structures continue to perform and operate satisfactorily and safely. A copy of this Manual in included in Appendix C. The Manual s Section III has been omitted to reduce the size of this report. 2. Preliminary Flood Insurance Rate Map (FIRM) for Port Waterfront Figure 1 shows the portion of the preliminary FIRM issued by FEMA for the waterfront in Port jurisdiction. All of the Port s finger piers have been mapped in a V-Zone. Table 1 is an abbreviated listing of the Port s facilities and indicates the FEMA determined TWL elevation, the Port facility elevation and the differential height between the TWL predicted by FEMA and the actual height of the pier. The Port s facility elevation is based on the results of a survey and represents the lowest point of the facility. In most cases the pier and wharf decks, and landside improvements are above the TWL and thus are not subject to flooding (elevation differences shown in the right hand column that are bolded). With one exception, the facility elevations that are below the TWL (bracketed by parentheses) are in the northern waterfront and are protected from wave action by the breakwaters as previously noted. -4-
9 Table 1: Comparison of Port Facility Elevations to FEMA Projections for Total Water Level (TWL) During a 100 Year Storm Event Facility or Pier No. (Listed from north to south) Elevation (ft.) FEMA s Preliminary TWL (ft.) Elevation Diff. (ft.) Hyde St. Pier (2.73) (2.70) 45 outer end of pier (0.35) wharf (1.70) (4.79) wharf (Step down for public access) wharf (Step down for public access) Ferry Plaza Ag Building/Sinbad Rincon Park
10 Table 1: Comparison of Port Facility Elevations to FEMA Projections for Total Water Level (TWL) During a 100 Year Storm Event Facility or Pier No. (Listed from north to south) Elevation (ft.) FEMA s Preliminary TWL (ft.) Elevation Diff. (ft.) 30/ AT&T Ball Park Low Point, Top of Curb South of P Low Point on P (N end) (0.53) 94 (S end) Table 1 Note: All elevations refer to NAVD
11 B. BACKGROUND ON PORT FACILITIES AND MAINTENANCE PROGRAMS 1. Existing Structures The Port of San Francisco s current improved waterfront began to take shape after the 1906 earthquake with the construction of the Port s concrete seawall along the water s edge. The Port s waterfront structures consist of seawalls, marginal wharves, piers and breakwaters. Appendix D presents a detailed plan of the Port s waterfront facilities. Following is a brief description of each of these waterfront structures. a. Seawalls The seawall was constructed in a number of different sections from 1908 to 1920 and is the primary flood control structure along the waterfront. The seawall construction varies considerably over the Port s waterfront; however, in the zone between Piers 41 to Pier 50 the seawall is generally a significant pile supported concrete structure that serves a dual purpose of retaining the land and protecting the landside improvements from the Bay waters. The seawall in many places was constructed with a marginal wharf, a piled deck structure extending from the top of the seawall away from the land and over the water. The marginal wharf in many cases is also used to structurally reinforce the seawall and, with its deck structure, provides additional flood protection by preventing wave over-topping. The seawall base is protected on the bay side by rip-rap to prevent scour during storm and tidal conditions. Appendix E presents the Port s analysis, certification and recent inspection reports for the Port s seawall sections from Pier 41 to Pier 50. The analyses demonstrates that the 30 differing seawall construction sections, from Pier 41 to Pier 50 that make up the Port s seawall structure, are sound, structurally capable and have sufficient elevation to protect the landside improvements from the effects of the 100 year flood. Thus, the areas located landside of the seawall should not be in SFHA and should be designated in Zone X. In cases where marginal wharfs are attached to the seawall, the analysis shows that these wharfs have sufficient structural capacity and height above the 100 year flood elevations to have the decks be designated in Zone X. The marginal wharf analysis and certification are included with the pier analysis in Appendix G. b. Breakwaters Breakwaters along the Port s waterfront are used to protect and shelter the Port s harbors and marinas. In performing this function, the breakwaters eliminate storm waves in the sheltered areas and thus protect the shoreline from wave action and run-up. There are seven breakwaters on the waterfront starting with the Aquatic Park Breakwater on the northern most end of the Port. Between Aquatic Park and Pier 45 is the Fisherman s Wharf Breakwater, is a significant concrete breakwater designed and installed by the Corps of Engineers. Immediately adjacent to the Fisherman s Wharf breakwater is Pier 45, an earthfill pier with embankments covered in riprap. Pier 45 also protects the Fisherman s Wharf area. Pier 39 has two breakwaters, one to the east and the other to the west. Both the Pier 39 breakwaters are constructed of concrete panels and pilings. The Ferry Building and Ferry Plaza areas are protected from wave action originating from the south Bay by the Pier 14 breakwater, the newest breakwater on the -7-
12 waterfront. This breakwater was installed in 2000, is composed of concrete panels and steel pilings and is used to protect the ferry landing areas along the Ferry Plaza. The South Beach Yacht Harbor is protected by concrete panel, concrete pile breakwaters that extend from Pier 40 southward to China Basin and then closes to the land at the AT&T Ballpark. Appendix F presents the Port s review, inspection reports and certification for these seven breakwaters. Since the Port could only locate the design drawings for the Pier 14 Breakwater, review of the other six breakwaters was based on review of inspection reports, current condition assessment and past performance. These breakwaters have performed very well during past storm events and on-going inspections indicate that six of the seven breakwaters, the Aquatic Park Breakwater being the exception, are sound, structurally capable and have sufficient elevation to protect the landside improvements from the effects of the 100 year flood. The Port therefore requests that FEMA should re-analyze the TWL s in the areas behind the breakwaters to account for their effects. The Aquatic Park Breakwater is the one exception. This breakwater has restricted access and needs repair due to piling deterioration, however, it continues, and will continue to provide protection to the adjacent waterfront for the near future. The Port understands that the US National Parks Department is pursuing funding to make these needed repairs. In the meantime, the Port will continue the regular inspections of this breakwater. c. Piers & Wharfs The Port of San Francisco has many finger piers integrally connected to and extending from the seawall, or seawall-marginal wharf structure, outward and away from the land, over the water. Most of these piers were constructed from 1908 through 1930, with some constructed as recently as The piers provide only minor flood control measures in that they limit the size of a wave that can pass below the structure by the presence of the beams and decking. The piers are generally constructed of concrete decks supported by concrete beams supported on piles. Some of the piers have wood decks supported on steel or concrete beams supported by piles. The piles are either reinforced concrete, concrete jacketed wood piles, or wood piles. Appendix G presents the Port s analysis, certification and recent inspection reports for the Port s piers from Pier 41 to Pier 50. The analysis demonstrates that the 28 Port piers, between Pier 41 to Pier 50, are sound, structurally capable and have sufficient elevation to withstand and be safely higher than the effects of the 100 year flood. Given that the piers and wharfs are constructed to withstand the impact of the waves during the 100-year flood and the decks are above the TWL, these piers should be removed from the SFHA and should be designated in Zone X. Two Port piers between Pier 41 to Pier 50 are not included in this response: Piers 36 and 22 ½. Pier 36 is condemned and no longer in use, and Pier 22 ½ is structurally compromised and has restricted loading. These two piers are not certified and are not considered to contribute to the Port s flood protection. The seawall sections adjacent to these piers are sound, certified and provide the necessary flood protection surrounding landside improvements. -8-
13 2. Seismic Strengthening Many of the Port s waterfront structures have been seismically strengthened to meet San Francisco Building Code requirements for earthquake loadings. Seismically upgrading these structures is very costly and significantly increases the structures ability to handle lateral loads, which also improves its ability to withstand any hydrodynamic loads. The following piers have been seismically upgraded to meet the code requirements at the time of the upgrade: Pier 45, Pier 39, Piers 27-29, and Piers 1.5 to 5, Pier 1, Ferry Plaza, Ferry Building, and Pier 48. The seismic upgrading of these piers included repairs and seismic strengthening of the adjacent seawall and marginal wharf. Although these structures were adequate to withstand the effects of the 100- year flood prior to being seismically strengthened, the added structural capacity and upgrading has greatly increased their overall durability and reduces future maintenance requirements. 3. Port Inspection and Assessment Program The Port has a structural inspection and assessment program for all Port facilities. The Port s waterfront facilities including all the piers, seawall and breakwaters have been inspected within the last 4 years by California licensed Civil or Structural Engineers with experience in waterfront structures. This program is used to identify and assess any damage or deterioration to the structural systems and initiate appropriate actions in the case of damage or unsafe conditions. An inspected facility is categorized according to its condition and allowable use as follows: Green Unrestricted use. May require some minor repair, or minimal barricading or signage. Yellow Restricted use. May require limiting access and barricading until repairs completed. Red Unsafe notice. Requires barricading to prevent public access and use. All of the Port s facilities that are required to protect the landside areas from flooding have been inspected and categorized as Green Unrestricted use. This means that there may be areas requiring minor repair or maintenance, but the structure is capable of serving its intended function and purpose and can withstand the storm loadings as was intended in its original design and its current use. The Port s Operation and Maintenance Manual for Waterfront Facilities is used to provide the protocol and frequency for the regular inspection and assessment of these structures. The O&M Manual includes forms required for reporting the results of an inspection and also establishes criteria for determining the priority and urgency of required repair depending on the type and location of damage. See Appendix C. C. CONCLUSION Based on the information presented by FEMA to the Port, flooding due to the 100-year event to the landside of the Port s Seawall is not a current problem. The TWL elevations determined by FEMA are below the deck heights for the majority of the Port s piers, wharfs and other waterfront facilities. The Port s existing waterfront structures, particularly the seawall and -9-
14 breakwaters, protect the landside structures and facilities from flooding. These structures have been inspected and analyzed and found to safely withstand the hydrodynamic loads imposed upon them by projected 100-year flood conditions. Port engineers, having verified the capability of these structures, have certified the Port s waterfront structures are capable of resisting the impact 1% annual chance waves, and verified that the 100-year flood heights are below the pier and wharf decks. Based on this analysis and certification, the Port hereby requests that FEMA revise the preliminary FIRMs for the San Francisco Bay from Pier 41 south to Pier 50 and remove the Port piers, wharf structures and landside improvements protected by these structures from the Special Flood Hazard Area Zone map designation and change the flood designation for these structures to Zone X. FEMA also is requested to perform an analysis of the Port s northern waterfront which considers the breakwaters that protect that area from flooding. The Fisherman s Wharf Harbors and the Hyde Street Harbor are completely surrounded by significant and competent breakwaters that greatly reduce the areas susceptibility to storm wave conditions. The Port anticipates that this FEMA refined analysis will lead to TWL elevations below the existing facility elevations and revise the FIRM to remove these facilities from any flood zone. -10-
15 Appendix B San Francisco Redevelopment Agency Comments on FEMA Preliminary Flood Insurance Rate Map See enclosed disk from Winzler & Kelly
16
17
18
19
20
21
22
23
24
25
26 Appendix C Mayor s Office of Base Reuse and Development and Treasure Island Development Authority Comments on FEMA Preliminary Flood Insurance Rate Map
27
 944-5411 Fax (925) 944-4732 MEMORANDUM To: Kheay Loke, Stephen Proud, Todd Adair From: Dilip Trivedi Date: December 6, 2007 Subj: Comments")
28 2001 N. Main Street Suite 360 Walnut Creek, California (925) Fax (925) MEMORANDUM To: Kheay Loke, Stephen Proud, Todd Adair From: Dilip Trivedi Date: December 6, 2007 Subj: Comments on Preliminary FEMA Map Treasure Island Development Project M&N File No: This memo provides comments on the Preliminary Flood Insurance Rate Map (FIRM) provided by the City of San Francisco electronically to us. FEMA had also presented the methodology for developing these maps in a meeting on October 16, 2007 at the Port of San Francisco. Some general comments are provided first, followed by an understanding of the methodology used in the analysis, followed by specific comments on the methodology (numbered in same order). General comments 1. The FIRM, when finalized in 2008, will influence development in all areas mapped within the flood zone. Typically, FEMA issues a Flood Insurance Study (FIS) along with the FIRM maps which provides a detailed description of criteria, data, and methodology which was used in developing the FIRM map. Also, the methodology for mapping flood prone areas along the Pacific Coast has changed substantially from previous FEMA guidance. It is critical for us to obtain either the FIS or other detailed studies which describe how the flood areas were mapped. FEMA should provide that to the City for review prior to finalization of the FIRM. 2. It can be expected that several Map Revisions will be requested of FEMA after finalization of the FIRM. FEMA should provide the key (or minimum) coastal criteria that will be used in their evaluation of requests for Letters of Map Revision (LOMR) so every applicant does not have to conduct a coastal study for their site. 3. The Total Water Level spreadsheet shows abnormal peaks with significantly different extreme water levels at adjacent transects. I suspect this is because the spreadsheet shows the results of analysis at discrete transects. It is unclear how this is affecting the FIRM maps and the floodplain limits shown on the maps. An explanation of this will be useful. 4. The flood plain limit for Treasure Island shown on the FIRM map is apparently day-lighting a contour elevation, which implies that a Base Flood Elevation (BFE) must have been estimated. However, the map states that a BFE was not computed. In the absence of a BFE, the entire analysis completed by FEMA will have to be redone for a LOMR request for areas presently mapped as Special Flood Hazard Areas (SFHA). We believe FEMA should provide the BFE considering the level of analysis already completed. If not, they should provide the water levels and wave heights used in developing the TWL, so we can determine the flood limit for the LOMR application.
29 Memorandum Comments on Preliminary Flood Map December 6, 2007 Page 2 of 3 5. This comment is related to the preceding comment about BFE. From the map it appears that Building 3 and the Torpedo Building, as well as the wastewater treatment plant, are outside the flood zone. Can FEMA confirm this? 6. The schedule for finalizing the FIRM maps is unclear. It appears that the data that went into developing the FIRM maps was insufficient. If, over the next year, the map is being finalized, then will FEMA update their bathymetry data with new transects along the shoreline if provided to them by you? Understanding of Methodology 1. Bathymetry for the Bay was obtained from NOAA navigation charts and other available land survey data provided by the City 2. The effect of existing shoreline protection structures on wave heights and run-up were not taken into account (smooth slopes were assumed) 3. It was assumed that perimeter levees, if present, would not be maintained because they are non-certified levees and a collapsed levee profile was used in the analysis 4. FEMA s contractors (Nolte & DHI) used the Direct Integration Method (DIM) to combine 33 years of data for various coastal criteria to estimate the 1% chance Total Water Level (TWL) and consequent flooding potential years of continuously recorded water levels were used in the analysis years of swell data for offshore was obtained from the GROW database and supplemented with CDIP buoy data for Fisherman s Wharf years of continuously recorded wind data from the SFO gage was used to estimate wind-waves 8. Wave setup was determined using FEMA s recommended guidelines as described in their Final Draft Guideance document 9. The water level and wave data were combined on a real-time basis to compute TWL for each time step, and then a 100-year TWL was determined statistically from the time series 10. TWL for swell and sea state conditions was determined separately and the higher of the two was used in the analysis. 11. Shoreline areas higher than the 1% water level, but within 30 feet of the shoreline where significant overtopping occurs, were mapped as Zone V. 12. Shoreline areas lower than the 1% water level were mapped as Zone A. The limit of coastal flooding shown on the flood maps was determined based on daylighting a water surface on the existing topography of Treasure Island. These areas have no Zone V designations. Base Flood Elevations were not determined in this study. 13. Areas landward of Zone A were mapped as Zone X (areas outside of a 500-year flood event) Specific Comments on Methodology & Results For Treasure Island 1. The bathymetry around Treasure Island has not been surveyed since the time of the original construction and conditions may be different than shown on the NOAA charts. If P:\ Treasure Island Planning\Flooding\Comments-FIRM_DTrivedi_ doc
30 Memorandum Comments on Preliminary Flood Map December 6, 2007 Page 3 of 3 water depths are shallower, it will result in smaller wave heights because they will break farther from the shoreline. 2. Existing shoreline protection structures (revetment around Treasure Island) will dissipate wave energy as they break on the structure and reduce wave run-up commensurately. 3. It was unclear from the presentation whether the revetment along the TI shoreline was treated as a levee and a degraded profile was used in the analysis 4. No comment 5. Question: Which gages within the Bay were used in the analysis? There is variation in water levels between the Presidio gage and at different locations within the Bay. 6. No comment 7. The topography around SFO, which affects wind direction and speed, is quite different from that around Treasure Island. Alameda Air Station data may be more appropriate for Treasure Island. 8. No comment 9. Question: Were two separate TWLs developed (one each for tide + swell, and tide + sea) or was the higher component of the swell or sea used in a single TWL analysis? 10. Same as comment No comment. However, if structure geometry is taken into account (roughness for rip-rap protection), the TWL would reduce and the Zone V designated areas would change considerably. 12. Is this daylighting elevation analogous to a Base Flood Elevation? If so, it should be stated in the FIRM map. 13. Question: Why should areas protected from the 0.2% flood event (500-year return period) receive any designation? P:\ Treasure Island Planning\Flooding\Comments-FIRM_DTrivedi_ doc
Evaluation of June 9, 2014 Federal Emergency Management Agency Flood Insurance Study for Town of Weymouth, Norfolk, Co, MA
 Evaluation of June 9, 2014 Federal Emergency Management Agency Flood Insurance Study for Town of Weymouth, Norfolk, Co, MA Prepared For: Woodard & Curran 95 Cedar Street, Suite 100 Providence, RI 02903
APPENDIX D-2. Sea Level Rise Technical Memo
 APPENDIX D-2 Sea Level Rise Technical Memo 2185 N. California Blvd., Suite 500 Walnut Creek, CA 94596 (925) 944-5411 Fax: (925) 944-4732 www.moffattnichol.com DRAFT MEMORANDUM To: From: Neil Nichols,
Bay County, MI Coastal Hazard Analysis Flood Risk Review Meeting. May 14, 2018
 Bay County, MI Coastal Hazard Analysis Flood Risk Review Meeting May 14, 2018 Agenda Introductions Coastal Flood Risk Study and Mapping Program Current Status Technical Overview of Study and Mapping Floodplain
St. Louis County, MN Coastal Hazard Analysis Flood Risk Review Meeting. May 2, 2018
 St. Louis County, MN Coastal Hazard Analysis Flood Risk Review Meeting May 2, 2018 Agenda Introductions Coastal Flood Risk Study and Mapping Program Current Status Technical Overview of Study and Mapping
Baraga County, MI Coastal Hazard Analysis Flood Risk Review Meeting. July 12, 2018
 Baraga County, MI Coastal Hazard Analysis Flood Risk Review Meeting July 12, 2018 Agenda Introductions Coastal Flood Risk Study and Mapping Program Current Status Technical Overview of Study and Mapping
Bayfield & Ashland Counties, WI Coastal Hazard Analysis Flood Risk Review Meeting. June 05, 2018
 Bayfield & Ashland Counties, WI Coastal Hazard Analysis Flood Risk Review Meeting June 05, 2018 Agenda Introductions Coastal Flood Risk Study and Mapping Program Current Status Technical Overview of Study
Door County, WI Coastal Hazard Analysis Flood Risk Review Meeting. August 21, 2017
 Door County, WI Coastal Hazard Analysis Flood Risk Review Meeting August 21, 2017 Agenda Introductions Coastal Flood Risk Study and Mapping Program Current Status Technical Overview of Study and Mapping
Photo by: Darryl Hatheway, 2011
 Photo by: Darryl Hatheway, 2011 September 11, 2015 Presentation Discussion Examine PFD V-Zone Mapping in Wave Runup Dominated West Coast Application of PFD V-Zone Mapping Criteria in Pacific G&S PFD V-Zone
Ventura County. Open Pacific Coast Study. California Coastal Analysis and Mapping Project
 Ventura County Open Pacific Coast Study California Coastal Analysis and Mapping Project December 2011 Project Name: Meeting: Date and Time: Location: California Coastal Analysis and Mapping Project (CCAMP)/Open
Open Pacific Coast Study. California Coastal Analysis and Mapping Project
 Open Pacific Coast Study California Coastal Analysis and Mapping Project September 2012 California Open Coast Counties California Coastal Analysis and Mapping Project This publication is an initiative
Sussex County, DE Preliminary Study Overview
 Sussex County, DE Preliminary Study Overview Coastal study scope: 102 miles of entire County shoreline Revised 102 panels for coastal study Riverine study scope: 14 streams, 67.1 miles, within the Nanticoke
Coastal Hazards Study
 Coastal Hazards Study 2212 Beach Boulevard, Pacifica Prepared for: EXECUTIVE SUMMARY City of Pacifica 170 Santa Maria Ave Pacifica, CA 94044 Prepared by: moffatt & nichol 2185 N. California Blvd. Walnut
SUPPLEMENTAL DOCUMENT SEA LEVEL RISE SCENARIO SELECTION AND DESIGN TIDE CALCULATION
 SUPPLEMENTAL DOCUMENT SEA LEVEL RISE SCENARIO SELECTION AND DESIGN TIDE CALCULATION FOR THE GUIDANCE FOR INCORPORATING SEA LEVEL RISE INTO CAPITAL PLANNING IN SAN FRANCISCO: ASSESSING VULNERABILITY AND
Pier 8 Wave Overtopping Analysis (65 Guise Street East) Our File:
 Our File:") Shoreplan Engineering Limited 55 Eglinton Avenue E., Suite 800 Toronto, ON Canada M4P 1G8 T) 416.487.4756 F) 416.487.5129 E) mail@shoreplan.com March 31, 2016 Mr. Ed English Senior Project Manager Waterfront
Shoreplan Engineering Limited 55 Eglinton Avenue E., Suite 800 Toronto, ON Canada M4P 1G8 T) 416.487.4756 F) 416.487.5129 E) mail@shoreplan.com March 31, 2016 Mr. Ed English Senior Project Manager Waterfront
HURRICANE SANDY LIMITED REEVALUATION REPORT UNION BEACH, NEW JERSEY DRAFT ENGINEERING APPENDIX SUB APPENDIX D SBEACH MODELING
 HURRICANE SANDY LIMITED REEVALUATION REPORT UNION BEACH, NEW JERSEY DRAFT ENGINEERING APPENDIX SUB APPENDIX D SBEACH MODELING Rev. 18 Feb 2015 1 SBEACH Modeling 1.0 Introduction Following the methodology
Monterey County December 3, 2014
 Flood Risk Review Meeting: Open Pacific Coast Study Monterey County December 3, 2014 Welcome and Introductions Flood Risk Review Meeting Monterey County California Coastal Analysis and Mapping Project
Bob Battalio, PE Chief Engineer, ESA September 8, 2016
 RELATING FUTURE COASTAL CONDITIONS TO EXISTING FEMA FLOOD HAZARD MAPS Technical Methods Manual Bob Battalio, PE Chief Engineer, ESA September 8, 2016 FMA 2016 Sacramento, California DWR-OST-SIO PILOTING
City of Port Aransas Shoreline Analysis and Improvements
 City of Port Aransas Shoreline Analysis and Improvements FINAL Technical Report August 24, 2016 Submitted To: City of Port Aransas Prepared for: City of Port Aransas This document is intended for planning
FEMA Region V. Great Lakes Coastal Flood Study. Pilot Study Webinar. Berrien County, Michigan. February 26, 2014
 FEMA Region V Great Lakes Coastal Flood Study Pilot Study Webinar Berrien County, Michigan February 26, 2014 2 Pilot Study Webinar Agenda Great Lakes Coastal Flood Study Background Demonstration Project
San Luis Obispo County December 2, 2014
 Flood Risk Review Meeting: Open Pacific Coast Study San Luis Obispo County December 2, 2014 Welcome and Introductions Flood Risk Review Meeting San Luis Obispo County California Coastal Analysis and Mapping
Physical Map Revisions in Connecticut due to Updated Coastal Flood Hazards F8: Maps in Transition
 Physical Map Revisions in Connecticut due to Updated Coastal Flood Hazards F8: Maps in Transition Brian Caufield, P.E., CFM Principal Engineer CDM Smith Kerry Bogdan, CFM Senior Engineer FEMA Region I
Project Incorporation of Sea Level Rise City of Newport Beach Approach for Balboa Islands, City of Newport Beach, California
 Project Incorporation of Sea Level Rise City of Newport Beach Approach for Balboa Islands, City of Newport Beach, California Ying Poon, Everest International Consultants, Inc. CMANC Annual Winter Meeting
The History of Coastal Flood Hazard Assessments in the Great Lakes
 The History of Coastal Flood Hazard Assessments in the Great Lakes Brian A. Caufield, P.E., CFM June 23, 2016 2 The Great Lakes Some Statistics Courtesy of Great Lakes Information Network One-fifth of
RE: Hurricane Matthew Beach Damage Assessment and Recommendations [CSE 2416]
![RE: Hurricane Matthew Beach Damage Assessment and Recommendations [CSE 2416]](/thumbs/83/87675702.jpg "RE: Hurricane Matthew Beach Damage Assessment and Recommendations [CSE 2416]") October 25, 2016 Iris Hill Town Administrator Town of Edisto Beach 2414 Murray St Edisto Beach SC 29438 RE: Hurricane Matthew Beach Damage Assessment and Recommendations [CSE 2416] Dear Iris, Hurricane
October 25, 2016 Iris Hill Town Administrator Town of Edisto Beach 2414 Murray St Edisto Beach SC 29438 RE: Hurricane Matthew Beach Damage Assessment and Recommendations [CSE 2416] Dear Iris, Hurricane
2016 NC Coastal Local Governments Annual Meeting
 2016 NC Coastal Local Governments Annual Meeting Coastal Flood Study Modeling and Mapping 101 April 21, 2016 Tom Langan, PE, CFM Engineering Supervisor NCEM Floodplain Mapping Program FEMA Coastal Flood
2017 Preliminary FEMA Flood Maps Old Orchard Beach Town Council Meeting. Old Orchard Beach, Town Hall July 18, 2017
 2017 Preliminary FEMA Flood Maps Old Orchard Beach Town Council Meeting Old Orchard Beach, Town Hall July 18, 2017 Overview Potential impacts of inaccurate Flood Insurance Rate Maps (FIRM) Why is appealing
Redondo Beach Boat Launch Ramp Facility
 Redondo Beach Boat Launch Ramp Facility Feasibility Report for the California Department of Boating and Waterways 2015 Grant Cycle For the City of Redondo Beach Submitted by March 13, 2014 Table of Contents
REVETMENTS. Purposes and Operational Constraints. Purposes Erosion control o o. Revetment Design 4/5/2016. CE A676 Coastal Engineering
 REVETMENTS Ijsseldam, the Netherlands Orson P. Smith, PE, Ph.D. Instructor Purposes and Operational Constraints Purposes Erosion control o o Embankment Toe protection for a seawall, retaining wall or other
SEA LEVEL RISE IMPACT ASSESSMENT AND MITIGATION ALTERNATIVES DEVELOPMENT FOR BALBOA ISLANDS, CITY OF NEWPORT BEACH, CALIFORNIA
 SEA LEVEL RISE IMPACT ASSESSMENT AND MITIGATION ALTERNATIVES DEVELOPMENT FOR BALBOA ISLANDS, CITY OF NEWPORT BEACH, CALIFORNIA Ying Poon 1, Brett Sanders 2, Randy Mason 3 and Robert Stein 4 The City of
CALCASIEU SALINITY STRUCTURES. HYDRODYNAMIC MODELING (To Support Design of Salinity Barriers)
") CALCASIEU SALINITY STRUCTURES HYDRODYNAMIC MODELING (To Support Design of Salinity Barriers) Presentation Overview 1 2 3 4 5 Project Overview and CEA Circulation Modeling Vessel Hydrodynamics Modeling
CALCASIEU SALINITY STRUCTURES HYDRODYNAMIC MODELING (To Support Design of Salinity Barriers) Presentation Overview 1 2 3 4 5 Project Overview and CEA Circulation Modeling Vessel Hydrodynamics Modeling
Plan B Dam Breach Assessment
 Plan B Dam Breach Assessment Introduction In support of the Local Sponsor permit applications to the states of Minnesota and North Dakota, a dam breach analysis for the Plan B alignment of the Fargo-Moorhead
Volume and Shoreline Changes along Pinellas County Beaches during Tropical Storm Debby
 Volume and Shoreline Changes along Pinellas County Beaches during Tropical Storm Debby Ping Wang and Tiffany M. Roberts Coastal Research Laboratory University of South Florida July 24, 2012 Introduction
FEMA West Coast Sea Level Rise Pilot Study
 FEMA West Coast Sea Level Rise Pilot Study Ed Curtis, P.E., CFM FEMA Region IX June 4, 2014 Presentation Objectives Present the goals of the FEMA West Coast Sea Level Rise Pilot Study Review the SLR Pilot
Comparison of Predicted and Measured Shoaling at Morro Bay Harbor Entrance, California
 Comparison of Predicted and Measured Shoaling at Morro Bay Harbor Entrance, California by Edward F. Thompson, Inocencio P. DiRamos, and Robert R. Bottin, Jr. PURPOSE: This Coastal and Hydraulics Engineering
Preliminary Wake Wash Impact Analysis Redwood City Ferry Terminal, Redwood City, CA
 Technical Memorandum Preliminary Wake Wash Impact Analysis Redwood City Ferry Terminal, Redwood City, CA 1. Introduction The following preliminary wake wash impact analysis was initiated by the Port of
APPENDIX C VEGETATED EMERGENCY SPILLWAY. VERSION 1.0 March 1, 2011
 APPENDIX C VEGETATED EMERGENCY SPILLWAY VERSION 1.0 March 1, 2011 [NOTE: Could use a better photo more clearly showing the emergency spillway in the context of the dam.] SECTION C-1: DESCRIPTION OF PRACTICE
DRAFT. October 17, 2014 File No Mr. Brendhan Zubricki Town Administrator Essex Town Hall 30 Martin Street Essex, MA.
 GZA GeoEnvironmental, Inc. Engineers and Scientists October 17, 2014 File No. 18.0171857.00 Mr. Brendhan Zubricki Town Administrator Essex Town Hall 30 Martin Street Essex, MA. 01929 DRAFT Re: Essex River
COASTAL HAZARDS. What are Coastal Hazards?
 COASTAL HAZARDS What are Coastal Hazards? Hazards in the New Jersey coastal zone include unavoidable risks to life and property generated by: coastal flooding, waves, high winds and waves, short-term and
Annex E Bridge Pier Protection Plan
 Annex E Bridge Pier Protection Plan Table E1 Bridge Types and Locations Table E2 Flow Conditions For River Sections Figure E1 Bridge Abutment Protection Figure E2 Bridge Pier Protection Figure E3 Central
Technical Brief - Wave Uprush Analysis 129 South Street, Gananoque
 Technical Brief - Wave Uprush Analysis 129 South Street, Gananoque RIGGS ENGINEERING LTD. 1240 Commissioners Road West Suite 205 London, Ontario N6K 1C7 June 12, 2013 Table of Contents Section Page Table
APPENDIX J HYDROLOGY AND WATER QUALITY
 APPENDIX J HYDROLOGY AND WATER QUALITY J-1 Technical Report on Airport Drainage, Northern Sector Airport and Ordinance Creek Watershed / Preliminary Creek Constructed Natural Channel Culvert J-2 Preliminary
NEED FOR SUPPLEMENTAL BATHYMETRIC SURVEY DATA COLLECTION
 305 West Grand Avenue, Suite 300 Montvale, New Jersey 07645 Phone 201.930.9890 Fax 201.930.9805 www.anchorqea.com M EMORANDUM To: Caroline Kwan and Nica Klaber U.S. Environmental Protection Agency Region
APPENDIX C. Fluvial and Tidal Hydraulics Report
 APPENDIX C Fluvial and Tidal Hydraulics Report BUENA VISTA LAGOON ENHANCEMENT PROJECT FLUVIAL AND TIDAL HYDRAULICS ANALYSES Prepared for: SANDAG 401 B Street, Suite 800 San Diego, California 92101 Contact:
Technical Report Culvert A Hydraulic Analysis
 DATE: November 3, 2011 Technical Report Culvert A Hydraulic Analysis TO: FROM: RE: Jim Reiser, P.E. Project Manager Parsons Brinckerhoff, Inc. Kurt Killian, P.E., CFM Parsons Brinckerhoff, Inc. Design
Future Condi,ons coastal hazard modeling and mapping
 Future Condi,ons coastal hazard modeling and mapping Presented by Bob Ba:alio, PE Environmental Science Associates, Inc. (ESA) On behalf of the physical processes team (USGS, TerraCosta- Scripps, ESA)
1-32 NOME HARBOR, ALASKA (CWIS NOS , 87755, 12270, & 10422) Condition of Improvement 30 September 2012
 Condition of Improvement 30 September 2012") NOME HARBOR 1-32 NOME HARBOR, ALASKA (CWIS NOS. 72742, 87755, 12270, & 10422) Condition of Improvement 30 September 2012 AUTHORIZATION: (1) Rivers and Harbors Act, 8 August 1917 (House Doc. 1932, 64th
NOME HARBOR 1-32 NOME HARBOR, ALASKA (CWIS NOS. 72742, 87755, 12270, & 10422) Condition of Improvement 30 September 2012 AUTHORIZATION: (1) Rivers and Harbors Act, 8 August 1917 (House Doc. 1932, 64th
Citrus, Hernando, and Pasco Coastal Hazard Analysis. Flood Risk Review Meeting Citrus, Hernando, and Pasco Counties, Florida December 14, 2017
 Citrus, Hernando, and Pasco Coastal Hazard Analysis Flood Risk Review Meeting Citrus, Hernando, and Pasco Counties, Florida December 14, 2017 Introductions Risk MAP Project Team FEMA Region IV RAMPP (study
Information for File # SEW
 Information for File #2014-02744-SEW Applicant: Minnesota Department of Transportation (MnDOT), District 3; c/o Mr. Robert Nibbe Corps Contact: Sarah Wingert, U.S. Army Corps of Engineers, 180 5 th Street
SURGE SUPPRESSION ACHIEVED BY DIFFERENT COASTAL SPINE (IKE DIKE) ALIGNMENTS. Bruce A. Ebersole, Thomas W. Richardson and Robert W.
 ALIGNMENTS. Bruce A. Ebersole, Thomas W. Richardson and Robert W.") SURGE SUPPRESSION ACHIEVED BY DIFFERENT COASTAL SPINE (IKE DIKE) ALIGNMENTS Abstract Bruce A. Ebersole, Thomas W. Richardson and Robert W. Whalin, Jackson State University, Jackson, Mississippi The primary
SURGE SUPPRESSION ACHIEVED BY DIFFERENT COASTAL SPINE (IKE DIKE) ALIGNMENTS Abstract Bruce A. Ebersole, Thomas W. Richardson and Robert W. Whalin, Jackson State University, Jackson, Mississippi The primary
Technical Brief - Wave Uprush Analysis Island Harbour Club, Gananoque, Ontario
 Technical Brief - Wave Uprush Analysis RIGGS ENGINEERING LTD. 1240 Commissioners Road West Suite 205 London, Ontario N6K 1C7 October 31, 2014 Table of Contents Section Page Table of Contents... i List
ADDENDA B Hydrologic and Hydraulic (H&H) Study Guidance 2019
 Study Guidance 2019") 09/25/2018 DRAFT FEMA Region I PA H&H Study ADDENDA B Hydrologic and Hydraulic (H&H) Study Guidance 2019 Region I Federal Emergency Management Agency (FEMA) Public Assistance Hydrologic and Hydraulic (H&H)
09/25/2018 DRAFT FEMA Region I PA H&H Study ADDENDA B Hydrologic and Hydraulic (H&H) Study Guidance 2019 Region I Federal Emergency Management Agency (FEMA) Public Assistance Hydrologic and Hydraulic (H&H)
HARBOR INFRASTRUCTURE INVENTORIES Marquette Harbor, Michigan
 HARBOR INFRASTRUCTURE INVENTORIES Marquette Harbor, Michigan Harbor Location: Marquette Harbor is located in Marquette Bay on the south shore of Lake Superior, 160 miles west of Sault Ste. Marie, MI and
U.S. Army Engineer Institute for Water Resources
 Sea Level Change Curve Calculator (2014.88) (DRAFT) U.S. Army Engineer Institute for Water Resources Table of Contents 1. INTRODUCTION... 2 1.1 BACKGROUND... 2 1.1.1 INFORMATION QUALITY ACT... 2 1.2 OVERVIEW...
STATUS REPORT FOR THE SUBMERGED REEF BALL TM ARTIFICIAL REEF SUBMERGED BREAKWATER BEACH STABILIZATION PROJECT FOR THE GRAND CAYMAN MARRIOTT HOTEL
 August 23 STATUS REPORT FOR THE SUBMERGED REEF BALL TM ARTIFICIAL REEF SUBMERGED BREAKWATER BEACH STABILIZATION PROJECT FOR THE GRAND CAYMAN MARRIOTT HOTEL performed by Lee E. Harris, Ph.D., P.E. Consulting
Coastal Engineering Technical Note
 Coastal Engineering Technical Note BAFFLED BREAKWATER FOR LIMITED FETCH SITES CETN III-45.(12/91) PURPOSE: To describe the Spud Point Marina breakwater, an innovative baffledtype breakwater designed to
City of Del Mar Local Coastal Plan (LCP) Amendment for Sea Level Rise and Coastal Flooding
 Amendment for Sea Level Rise and Coastal Flooding") City of Del Mar Local Coastal Plan (LCP) Amendment for Sea Level Rise and Coastal Flooding 6/22/17 Presentation to Sea Level Rise Stakeholder- Technical Advisory Committee (STAC) Nick Garrity, P.E. Lindsey
City of Del Mar Local Coastal Plan (LCP) Amendment for Sea Level Rise and Coastal Flooding 6/22/17 Presentation to Sea Level Rise Stakeholder- Technical Advisory Committee (STAC) Nick Garrity, P.E. Lindsey
MARTIN COUNTY BOARD OF COUNTY COMMISSIONERS
 MARTIN COUNTY BOARD OF COUNTY COMMISSIONERS 2401 S.E. MONTEREY ROAD STUART, FL 34996 DOUG SMITH Commissioner, District 1 ED FIELDING Commissioner, District 2 HAROLD E. JENKINS II Commissioner, District
Nome Harbor Page 2 of 12
 Nome Harbor Nome Harbor Page 2 of 12 Condition of Improvements 30 December 2015 Nome Harbor, Alaska (CWIS No. 010422, 012270, 072742, 087755) Authorization (1) Rivers and Harbors Act, 8 August 1917 (House
HARBOR INFRASTRUCTURE INVENTORIES Kenosha Harbor, Wisconsin
 HARBOR INFRASTRUCTURE INVENTORIES Kenosha Harbor, Wisconsin Harbor Location: Kenosha Harbor is on the west shore of Lake Michigan about 54 miles north of Chicago, Illinois. Authority: River & Harbor Acts
Ketchikan Harbors Thomas Basin and Bar Point Harbor
 Ketchikan Harbors Thomas Basin and Bar Point Harbor Condition of Improvements 30 December 2014 Thomas Basin & Bar Point Harbors Ketchikan, Alaska (CWIS No. 000631 & 087071) Authorization (1) Rivers and
New Orleans Municipal Yacht Harbor
 New Orleans Municipal Yacht Harbor Marina Schematic Design Update 601 Poydras St., Suite 1860 New Orleans, LA, 70130 504-648-3560 Post-Katrina Municipal Yacht Harbor: Introduction The MYH was an approximate
VOLUME 2 OF 5 VOLUSIA COUNTY, FLORIDA AND INCORPORATED AREAS COMMUNITY NAME NUMBER COMMUNITY NAME NUMBER
 VOLUME 2 OF 5 VOLUSIA COUNTY, FLORIDA AND INCORPORATED AREAS COMMUNITY NAME NUMBER COMMUNITY NAME NUMBER DAYTONA BEACH, CITY OF 125099 NEW SMYRNA BEACH, CITY OF 125132 DAYTONA BEACH SHORES, CITY OF 125100
RI Regulatory Setbacks & Buffers: Coastal Management Issues
 RI Regulatory Setbacks & Buffers: Coastal Management Issues New England Onsite Wastewater Training Program @ URI OWT 155 - November 29, 2012 James Boyd - Coastal Policy Analyst Photo: October 30, 2012
Implications of proposed Whanganui Port and lower Whanganui River dredging
 PO Box 637 Wanganui 4540 Attention: Rowan McGregor Dear Rowan 1 Summary We understand that it has been proposed to bring large vessels into the Port at Whanganui requiring the excavation of a channel up
TITLE: The Importance of Model Validation: Two Case Studies. AUTHOR:Julie Thomas. Scripps Institution of Oceanography, La Jolla, CA.
 TITLE: The Importance of Model Validation: Two Case Studies AUTHOR:Julie Thomas Scripps Institution of Oceanography, La Jolla, CA jothomas@ucsd.edu CO-AUTHOR: Corey Olfe Scripps Institution of Oceanography,
Structure Failure Modes
 US Army Corps Monitoring and Maintenance of Coastal Infrastructure Structure Failure Modes Steven A. Hughes, PhD, PE Coastal and Hydraulics Laboratory US Army Engineer Research and Development Center Waterways
Caltrans compendium of underwater sound data from pile driving 2014 update
 Caltrans compendium of underwater sound data from pile driving 2014 update Richard RODKIN 1 ; Keith POMMERENCK 2 1 Illingworth & Rodkin, Inc., United States 2 Illingworth & Rodkin, Inc., United States
S E SKELLY ENGINEERING
 May 5, 2004 Mr. Joel Baldwin Earth Investigation Consultants P.O. Box 795 Pacifica, CA 94044 SUBJECT: Reference: Coastal Hazard Study Proposed Legacy Quest Condominiums, 1567 Beach Boulevard, Pacifica.
SACO RIVER AND CAMP ELLIS BEACH SACO, MAINE SECTION 111 SHORE DAMAGE MITIGATION PROJECT APPENDIX F ECONOMIC ASSESSMENT
 SACO RIVER AND CAMP ELLIS BEACH SACO, MAINE SECTION 111 SHORE DAMAGE MITIGATION PROJECT APPENDIX F ECONOMIC ASSESSMENT Department of the Army New England District, Corps of Engineers 696 Virginia Road
BILLY BISHOP TORONTO CITY AIRPORT PRELIMINARY RUNWAY DESIGN COASTAL ENGINEERING STUDY
 Bâtiment Infrastructures municipales Transport Industriel Énergie Environnement BILLY BISHOP TORONTO CITY AIRPORT PRELIMINARY RUNWAY DESIGN COASTAL ENGINEERING STUDY N. Guillemette 1, C. Glodowski 1, P.
Comparisons of Physical and Numerical Model Wave Predictions with Prototype Data at Morro Bay Harbor Entrance, California
 Comparisons of Physical and Numerical Model Wave Predictions with Prototype Data at Morro Bay Harbor Entrance, California by Robert R. Bottin, Jr. and Edward F. Thompson PURPOSE: This Coastal and Hydraulics
Chapter 4 EM THE COASTAL ENGINEERING MANUAL (Part I) 1 August 2008 (Change 2) Table of Contents. Page. I-4-1. Background...
 1 August 2008 (Change 2) Table of Contents. Page. I-4-1. Background...") Chapter 4 EM 1110-2-1100 THE COASTAL ENGINEERING MANUAL (Part I) 1 August 2008 (Change 2) Table of Contents I-4-1. Background... Page I-4-1 a. Shore Protection Planning and Design, TR 4... I-4-1 b. Shore
Chapter 4 EM 1110-2-1100 THE COASTAL ENGINEERING MANUAL (Part I) 1 August 2008 (Change 2) Table of Contents I-4-1. Background... Page I-4-1 a. Shore Protection Planning and Design, TR 4... I-4-1 b. Shore
Eelgrass and Macroalgae Presence/Absence Preliminary Surveys BHP Proposed Grays Harbor Potash Export Facility A Task 400
 Memorandum 40600-HS-MEM-55036 Revision 0 Date: 26 July 2018 Subject: Eelgrass and Macroalgae Presence/Absence Preliminary Surveys BHP Proposed Grays Harbor Potash Export Facility A17.0202.00 Task 400 INTRODUCTION
STUDY ON TSUNAMI PROPAGATION INTO RIVERS
 ABSTRACT STUDY ON TSUNAMI PROPAGATION INTO RIVERS Min Roh 1, Xuan Tinh Nguyen 2, Hitoshi Tanaka 3 When tsunami wave propagation from the narrow river mouth, water surface is raised and fluctuated by long
FALL 2014 WORKSHOPS TAKEAWAYS
 SFMTA WORKSHOP FEEDBACK The SFMTA and partner agencies are continuing to utilize feedback from the Fall 2014 workshops to inform priorities and next steps for the Embarcadero Enhancement Project. Throughout
LOCAL COASTAL PROGRAM UPDATE
 LOCAL COASTAL PROGRAM UPDATE Agenda Meeting #1 General Information (1 1:45 pm) Introductions and Background Grants involved What is a Local Coastal Program? What is required? LCP Update tasks and schedule
Water Resources Report RKLD Annual Meeting July 30, 2016
 Water Resources Report RKLD Annual Meeting 2016 July 30, 2016 Topics Hydrology Report Indianford Dam trash rack cleanout performance Experimental Project update Review of PAS project Twin floods- 1 to
1-32 NOME HARBOR, ALASKA (CWIS NOS , 87755, & 10422) Condition of Improvement 30 September 2009
 Condition of Improvement 30 September 2009") NOME HARBOR 1-32 NOME HARBOR, ALASKA (CWIS NOS. 72742, 87755, & 10422) Condition of Improvement 30 September 2009 AUTHORIZATION: (1) Rivers and Harbors Act, 8 August 1917 (House Doc. 1932, 64th Congress,
NOME HARBOR 1-32 NOME HARBOR, ALASKA (CWIS NOS. 72742, 87755, & 10422) Condition of Improvement 30 September 2009 AUTHORIZATION: (1) Rivers and Harbors Act, 8 August 1917 (House Doc. 1932, 64th Congress,
Currents measurements in the coast of Montevideo, Uruguay
 Currents measurements in the coast of Montevideo, Uruguay M. Fossati, D. Bellón, E. Lorenzo & I. Piedra-Cueva Fluid Mechanics and Environmental Engineering Institute (IMFIA), School of Engineering, Research
SHORE PROTECTION AND HABITAT CREATION AT SHAMROCK ISLAND, TEXAS ABSTRACT
 SHORE PROTECTION AND HABITAT CREATION AT SHAMROCK ISLAND, TEXAS M. Cameron Perry, P.E., and Daniel J. Heilman, P.E. Coastal Engineer Shiner Moseley & Associates., Inc. 555 N. Carancahua Corpus Christi,
Figure 1 GE image of the Costa Sur & EcoEléctrica power plants, located inside Guayanilla and Tallaboa bay.
 1 7 - STORM SURGES IN PUERTO RICO_Power Plants-Costa Sur & EcoElectrica Costa Sur & EcoEléctrica Figure 1 shows a GE image of the Costa Sur (Guayanilla) and EcoElectrica site. Figure 2 shows the topographic
To: William Woods, Jenni Austin Job No: CentrePort Harbour Deepening Project - Comments on community queries
 Memo To: William Woods, Jenni Austin From: Richard Reinen-Hamill Date: Subject: cc: 1 Purpose This memo sets out our response to issues raised at and after Seatoun community consultation sessions held
North Shore of Long Island, Feasibility Study
 North Shore of Long Island, Asharoken New York Asharoken, Feasibility Study Asharoken, NY Public Meeting June 30, 2015 US Army Corps of Engineers US Army Corps of Engineers New York BUILDING STRONG BUILDING
Will Kempton, Chief Executive Officer. Update on Proposed Implementation of a Wayside Horn System Along the San Clemente Beach Trail
 May 27, 2010 To: From: Subject: Transit Committee Will Kempton, Chief Executive Officer System Along the San Clemente Beach Trail Overview The Orange County Transportation Authority and City of San Clemente
: Hydrodynamic input for 2D Vessel Simulations (HY- 0027)
") Technical Note To : Christian Taylor (PoHDA) From : Rohan Hudson Cc : Ben Gray Date : 1/04/2015 (Final Draft) Subject : Hydrodynamic input for 2D Vessel Simulations (HY- 0027) Introduction This Technical
Technical Note To : Christian Taylor (PoHDA) From : Rohan Hudson Cc : Ben Gray Date : 1/04/2015 (Final Draft) Subject : Hydrodynamic input for 2D Vessel Simulations (HY- 0027) Introduction This Technical
TRAFFIC IMPACT STUDY CRITERIA
 Chapter 6 - TRAFFIC IMPACT STUDY CRITERIA 6.1 GENERAL PROVISIONS 6.1.1. Purpose: The purpose of this document is to outline a standard format for preparing a traffic impact study in the City of Steamboat
GONE! Coastal Erosion Happens During Storms! Why Worry About Coastal Setbacks? Goals for Today
 RI Regulatory Setbacks & Buffers: Coastal Zone Management Issues New England Onsite Wastewater Training Program @ URI OWT 155 November 21, 2013 Goals for Today Understand the impacts of storms, coastal
A Coastal Storm Modeling System for determination of flood hazards along a high energy coast in response to SLR and 21 st century storms
 Li Erikson, Patrick Barnard, Andrea O Neill, Jodi Eshleman, Amy Foxgrover, Michael Fitzgibbon 2, Grant Ballard 2, Kelly Higgason 3 A Coastal Storm Modeling System for determination of flood hazards along
WASHINGTON COUNTY, MAINE (ALL JURISDICTIONS)
") VOLUME 1 OF 1 WASHINGTON COUNTY, MAINE (ALL JURISDICTIONS) COMMUNITY NAME CID COMMUNITY NAME CID TOWN OF ADDISON 230132 TOWNSHIP OF BROOKTON 230470 TOWN OF ALEXANDER 230303 CITY OF CALAIS 230134 TOWN OF
VOLUME 1 OF 1 WASHINGTON COUNTY, MAINE (ALL JURISDICTIONS) COMMUNITY NAME CID COMMUNITY NAME CID TOWN OF ADDISON 230132 TOWNSHIP OF BROOKTON 230470 TOWN OF ALEXANDER 230303 CITY OF CALAIS 230134 TOWN OF
Understanding the Tsunami Wave
 The First Tsunami attack on Sri Lanka Krakatoa Island 27 th August 1883 Understanding the Tsunami Wave Generation Propagation Nearshore Transformation Shoreline Entry Inland Dissipation 1 Generation and
Wave Transformation, Prediction, and Analysis at Kaumalapau Harbor, Lanai, Hawaii
 Wave Transformation, Prediction, and Analysis at Kaumalapau Harbor, Lanai, Hawaii Jessica H. Podoski, P.E. Coastal Engineer, USACE Honolulu District Christopher Goody, P.E. Sea Engineering, Inc. Thomas
Inlet Management Study for Pass-A-Grille and Bunces Pass, Pinellas County, Florida
 Inlet Management Study for Pass-A-Grille and Bunces Pass, Pinellas County, Florida Final Report Submitted By Ping Wang, Ph.D., Jun Cheng Ph.D., Zachary Westfall, and Mathieu Vallee Coastal Research Laboratory
UPPER BEACH REPLENISHMENT PROJECT RELATED
 ASSESSMENT OF SAND VOLUME LOSS at the TOWNSHIP of UPPER BEACH REPLENISHMENT PROJECT RELATED to the LANDFALL OF HURRICANE SANDY - PURSUANT TO NJ-DR 4086 This assessment is in response to Hurricane Sandy
Public Notice U.S. Army Corps In Reply to Application Number CENAB-OP-RMS (NATIONAL HARBOR (FORMERLY PORT Baltimore District AMERICA])
![Public Notice U.S. Army Corps In Reply to Application Number CENAB-OP-RMS (NATIONAL HARBOR (FORMERLY PORT Baltimore District AMERICA])](/thumbs/89/100795623.jpg "Public Notice U.S. Army Corps In Reply to Application Number CENAB-OP-RMS (NATIONAL HARBOR (FORMERLY PORT Baltimore District AMERICA])") Public Notice U.S. Army Corps In Reply to Application Number of Engineers CENAB-OP-RMS (NATIONAL HARBOR (FORMERLY PORT Baltimore District AMERICA]) 88-01361 PN 14-05 Comment Period: January 16, 2014 to
Public Notice U.S. Army Corps In Reply to Application Number of Engineers CENAB-OP-RMS (NATIONAL HARBOR (FORMERLY PORT Baltimore District AMERICA]) 88-01361 PN 14-05 Comment Period: January 16, 2014 to
SANTA ROSA COUNTY, FLORIDA AND INCORPORATED AREAS
 VOLUME 1 OF 1 SANTA ROSA COUNTY, FLORIDA AND INCORPORATED AREAS COMMUNITY NAME GULF BREEZE, CITY OF 120275 JAY, TOWN OF 120339 MILTON, CITY OF 120276 SANTA ROSA COUNTY, UNINCORPORATED AREAS COMMUNITY NUMBER
The development of the historical harbour of Paphos, Cyprus H.J. van Wijhe*, M. Meletiou^ Division, P.O. Box 152, 8300 AD Emmeloord, The Netherlands
 The development of the historical harbour of Paphos, Cyprus H.J. van Wijhe*, M. Meletiou^ Division, P.O. Box 152, 8300 AD Emmeloord, The Netherlands Abstract The harbour of Paphos originates from ancient
Creek Trash Assessment (CTA) Methodology (Demonstration: Mill Run Creek, Cheltenham, Pa.)
 Methodology (Demonstration: Mill Run Creek, Cheltenham, Pa.)") Creek Trash Assessment (CTA) Methodology (Demonstration: Mill Run Creek, Cheltenham, Pa.) Mill Run Creek emerges from a storm sewer in Philadelphia to an open creek in Cheltenham. The Creek downstream
Creek Trash Assessment (CTA) Methodology (Demonstration: Mill Run Creek, Cheltenham, Pa.) Mill Run Creek emerges from a storm sewer in Philadelphia to an open creek in Cheltenham. The Creek downstream
Wave Prediction in the Santa Barbara Channel
 Wave Prediction in the Santa Barbara Channel OCS Study MMS 2001-055 Final Technical Summary Final Study Report U.S. Department of the Interior Minerals Management Service Pacific OCS Region Wave Prediction
Boothbay Harbor Rotary Club May 12, 2016
 Mapping Potential Sea Level Rise and Storm Surge in Boothbay Harbor, ME Boothbay Harbor Rotary Club May 12, 2016 Peter A. Slovinsky, Marine Geologist Maine Geological Survey S.M. Dickson, MGS Quickly,
USING A LABYRINTH WEIR TO INCREASE HYDRAULIC CAPACITY. Dustin Mortensen, P.E. 1 Jake Eckersley, P.E. 1
 USING A LABYRINTH WEIR TO INCREASE HYDRAULIC CAPACITY Dustin Mortensen, P.E. 1 Jake Eckersley, P.E. 1 Plum Creek Floodwater Retarding Structure No. 6 is located in an area of Kyle, Texas, that is currently