Nebraska s Population and Economic Trends
|
|
|
- Camron Francis
- 6 years ago
- Views:
Transcription
1 Nebraska s Population and Economic Trends Jerry Deichert, David Drozd UNO Center for Public Affairs Research Twenty-first Annual Nebraska State Data Center Summer Conference August 17, 2010 CPACS Collaborating Commons--UNO Jerry Deichert, David Drozd, UNO
2 Nebraska Population and Economic Trends CPAR Reports Sources of Annual Data for Nebraska Estimates from the Census Bureau Bureau of Economic Analysis American Community Survey Changes Total population and components of change Age, race, and Hispanic/Latino Migration Focus Information from state and county IRS migration files Economic Trends Per capita income and employment
3 CPAR Reports 2008 Nebraska Population Report Nebraska Historical Population Report, Sept Nebraska Birth Report, July Nebraska Migration Report, October
4 Estimates from the Census Bureau The Population Estimates Program releases population and housing units estimates throughout the year. In general, the most current estimates released in a given year refer to the population on July 1 of the previous year. Data are provided for each year since the most recent Census. Most recent release supersedes data from prior releases.
5 Nebraska s Population and Economic Trends Main population trends Population is becoming more and more concentrated in state s most populous counties. Births have been increasing since 1994 and should continue a general uptrend until Net migration has been slightly negative since improving recently. Population is getting older and will continue to age. Population is becoming more racially and ethnically diverse (younger population). Economic trends--per capita income & employment Per capita income fluctuates between 90% and 95% of US average. Recently metro has been decreasing in relation to US while nonmetro increasing. Employment is growing more slowly than US and growing faster than population.
6 Population and Population Change Jerry Deichert, David Drozd, UNO
7 State Population 1990 to 2000 Between 1990 and 2000 the state grew at 8.4 percent 1990 s population growth largest since to 2009 State added 85,354 persons between April 1, 2000 and July 1, 2009 (about 5.5 percent decade rate) Growth rate ranked 33th in the US 2008 to 2009 Added 14,670 persons The growth is the largest in percentage and number since Growth rate ranked 24th in the US

 0.5-4 -4.")
8 Nebraska Population Change by Decade: 1910 to Percentage Change (10-year rate) Source: US Census Bureau, Decennial Censuses and Annual Estimates


9 Population 2,000,000 Nebraska Population and Population Change, Population Change 50,000 1,800,000 40,000 1,600,000 30,000 1,400,000 20,000 1,200,000 10,000 1,000, ,000-10, , , ,000-30, ,000-40, , Population Change Population Sources: Nebraska Health and Human Services System, Vital Statistics; and US Census Bureau, Annual Estimates
10
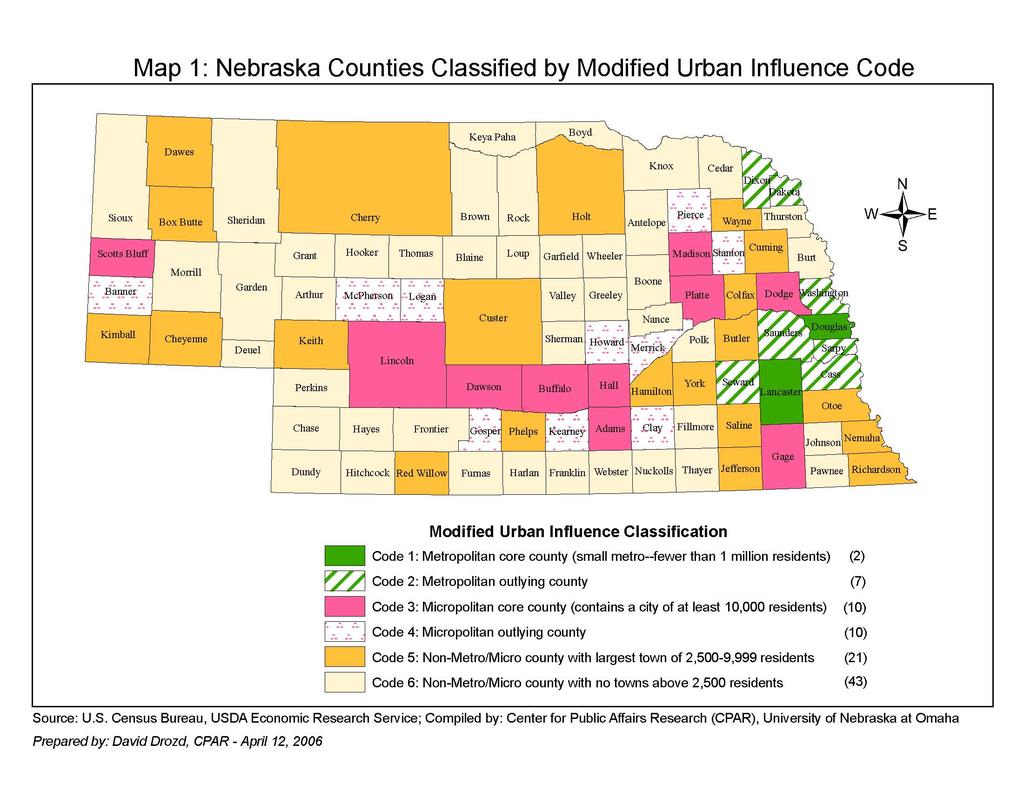
11 County Population 1990 to counties added population or were unchanged Nebraska s population is becoming more and more concentrated in its most populous counties Both metropolitan and nonmetropoltian counties added population Counties with no city above 2,500 continued to decline but at a slower rate 2000 to 2009 Only 16 counties added population 2000 to 2009 Sarpy, Johnson, Lancaster, Douglas, Buffalo, Hall, Adams, and Washington grew 5.0 percent or more Metropolitan counties added population, but nonmetropolitan counties lost population Metropolitan 11.8% Nonmetropolitan -3.4% Micropolitan 1.9% Largest city 2,500 to 9,999 persons -6.9% Largest city under 2,500 persons -11.8% Douglas, Lancaster, and Sarpy accounted for 52.6 percent of Nebraska s population in 2009
12
13 Population of Nebraska Counties By Metropolitan and Nonmetropolitan Status (2003 Definitions): ,100,000 1,050,000 1,000, , ,000 Persons 850, , , , , , Metro Nonmetro Source: US Bureau of Economic Analysis, Regional Economic Information System, and US Census Bureau, Annual Population Estimates
14 Population of Nebraska Counties By Micropolitan Status (2003 Definitions) and Size of Largest City 2,500-9,999 and Under 2,500: , , ,000 Persons 300, , , , , Micro 2,500-9,999 <2,500 Source: US Bureau of Economic Analysis, Regional Economic Information System, and US Census Bureau, Annual Population Estimates
15 Natural Change Natural Change = Births - Deaths Jerry Deichert, David Drozd, UNO
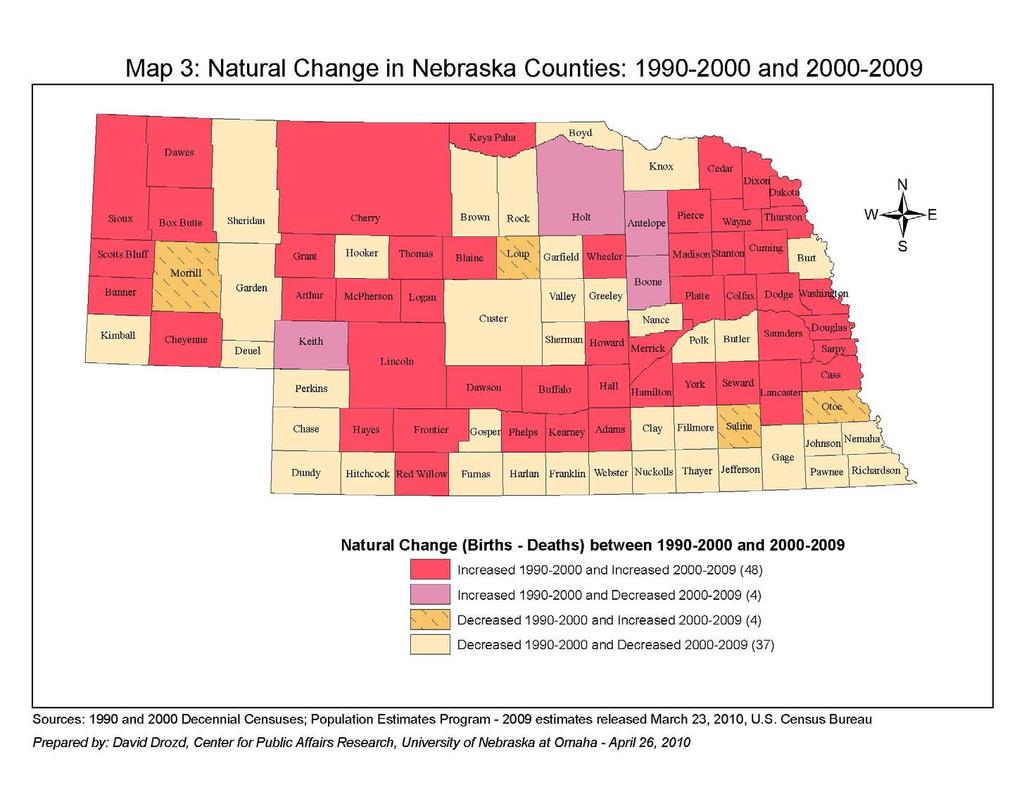
16 Natural Change 1990 to 2000 Births leveled off and then increased slightly Birth rates by age of mother increased slightly from 1990 Deaths increased slightly 41 counties had more deaths than births 2000 to 2009 Births in 2007, 2008, and 2009 were similar and were the highest since ,935 in 2007; 26,992 in 2008; and 26,931 in 2009 Recent peak was 27,335 in 1980 Number of deaths declined slightly in 2009 Natural increase higher than any time during the 1990s 52 counties had more births than deaths, and 41 had more deaths than births


17 Nebraska Natural Population Change (Births - Deaths) by Decade: 1930 to Percentage Change (10-year rate) Sources: Nebraska Health and Human Services System, Vital Statistics; and US Census Bureau, Decennial Censuses and Annual Estimates
18 Nebraska Births and Deaths, ,000 35,000 30,000 25,000 20,000 15,000 10,000 5, Persons Births Deaths Natural Change Source: Nebraska Health and Human Services System, Vital Statistics
19
20 Net Migration Jerry Deichert, David Drozd, UNO
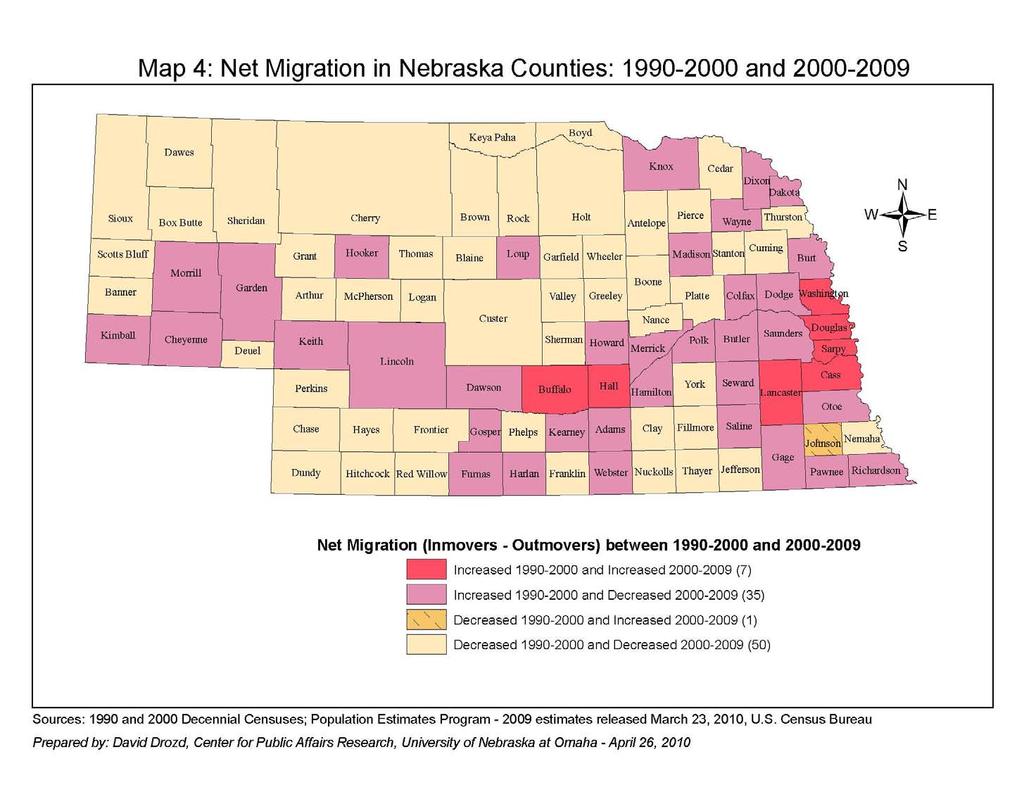
21 Net Migration 1990 to 2000 Added about 48,000 persons during the decade (3.1 percent) Decade with net inmigration for the first time in 6 decades International greater than domestic 42 counties had net inmigration or no net outmigration 2000 to 2009 Lost 9,156 persons since 2000 for a decade rate of -0.6 percent Net inmigration during State still experiencing international inmigration during each year About 3,300 per year State experiencing domestic outmigration for each year, but has improved by 2,300 in each of the past two years Only 8 counties had net inmigration ( ) Johnson, Sarpy, Lancaster, Washington, and Buffalo were above 2.0 percent
 -2.0-4.0-6.0-8.0-5.2-0.9-6.4-0.6-10.0-9.8-8.7-12.0-14.0-12.")

22 Nebraska Net Migration by Decade: 1930 to Migration Rate (Percent) (10-year rate) Sources: US Census Bureau, Decennial Censuses and Annual Estimates; and Nebraska Health and Human Services System, Vital Statistics


23 40,000 30,000 20,000 10, ,000-20,000-30,000-40,000-50,000-60,000 Nebraska Components of Population Change, Persons Net Migration Natural Change
24
25 Cities and Towns Jerry Deichert, David Drozd, UNO
26 Cities/Towns ( ) Nearly 80.0 percent of Nebraska s population lives in an incorporated city or town 79.4 percent in 2009, up from 77.0 percent in 2000 Population in Nebraska cities and towns grew 7.7 percent Population outside of cities and towns lost 4.3 percent Median size town is 313 persons Hadar (Pierce County) and Long Pine (Brown County) Mean (average) size town is 2,691 Ashland Omaha went from 44th largest city in US in 2000 to 40th largest in 2009
27 Cities/Towns ( ) Highest percentage growth Percentage City/Town County Change Gretna Sarpy Terrytown* Scotts Bluff 87.2 Waterloo Douglas 84.1 Hickman Lancaster 51.8 Papillion Sarpy 48.4 La Vista Sarpy 44.3 Bennet Lancaster 35.4 Waverly Lancaster 34.9 Raymond Lancaster 26.9 Denton Lancaster 24.9 *Entirely due to annexation
28 Population Change by Size of City/Town: 2000 to 2009 Size class Percent age Change Omaha 16.6 Lincoln ,000 to 50, ,000 to 9, ,500 to 4, ,000 to 2, (-4.4 without Gretna) 500 to to to less than
29 Age Structure Jerry Deichert, David Drozd, UNO
30 2009 Nebraska Population by Sex and Five-Year Age Group: Total Population to to to to to to to to to to to to to to to 14 5 to 9 Under Percent of Total Population Green lines depict the depression cohort; red checker shows the "baby boom"; Source: Population Estimates Program, U.S. Census Bureau, released pink represents the "baby boom echo"; pink crosshatch shows the "3rd wave"
31 Percentage Change for 5-year Age Groups in Nebraska: 2000 to years and over 80 to 84 years 75 to 79 years 70 to 74 years 65 to 69 years 60 to 64 years 55 to 59 years 50 to 54 years 45 to 49 years 40 to 44 years 35 to 39 years 30 to 34 years 25 to 29 years 20 to 24 years 15 to 19 years 10 to 14 years 5 to 9 years Under 5 years Total Population Percent Change
32 Percentage Change in Nebraska Population By 5-Year Age Group: Total & older Age group Under Percent Projections by Center for Public Affairs Research, UNO, Aug. 2008
33 Race and Hispanic/Latino Origin Jerry Deichert, David Drozd, UNO
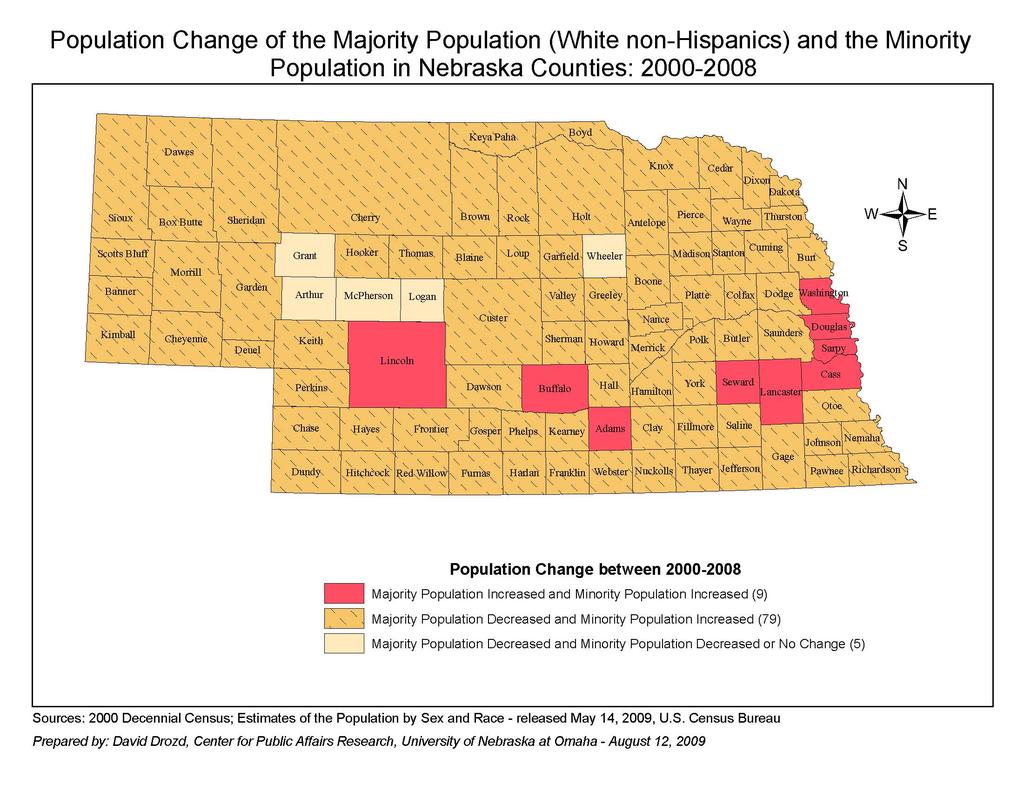
34 Race and Hispanic/Latino Origin Change Total 5.0 percent White alone 3.2 percent African-American or Black alone 19.1 percent American Indian and Alaska Native alone 27.9 percent Asian alone 35.4 percent Nat. Hawaiian Pac. Islander alone 69.1 percent Hispanic/Latino Origin 59.4 percent White non-hispanic 0.1 percent Minority 38.8 percent In 2009, Minority population was 16.5 percent of total Up from 12.7 in 2000 and 7.4 percent in 1990 Minority population is much younger Relatively more under 40 Relatively fewer 40+
35
36
37 Age Group 2009 Nebraska Population by Five-Year Age Group: Non-White or Hispanic/Latino (Minority Population) as a Percent of State Total to to to to to to to to to to to to to to to 14 5 to 9 Under 5 Total Percent of Total Population Compiled and Prepared by: David Drozd, Source: Population Estimates Program, U.S. Census Bureau, released Center for Public Affairs Research, UNO
38 Population Summary State population is expected to increase about 4.5 to 5 percent per decade until 2030 (0.5 percent per year). The trend of Nebraska s population becoming concentrated in its most populous counties is expected to continue. Micropolitan counties (those nonmetro counties with a town of 10,000 persons) are expected to continue their growth. Together Douglas, Sarpy, and Lancaster Counties account for somewhat more than half of the state s population, and this proportion gradually will increase (about 0.4 percentage points per year in the 2000s-see handout).
39 Population Summary Since 2000, the state has experienced a slight outmigration, and it is expected to be less than 1 percent for the decade. Births will peak in the mid 2010s as the baby boom echo pass through their peak child bearing years and as the number of young Latina women increase through immigration. The state s racial and ethnic diversity will increase. Most of the growth in the state s population will be in its minority populations as the white, non-latino will grow slowly if at all. The minority population will continue to be much younger.
40 Migration Focus A. Data from Census Estimates Since 2000 B. State IRS Tax Filing Data Since 1989 C. County IRS Tax Filing Data Since 1999 Jerry Deichert, David Drozd, UNO
41 Comparison of Domestic and International Migration for Nebraska: 2001 to ,000 International migration has been quite steady, bringing in about 3,100 persons per year. 3,000 Level of Migration (persons) 0-3,000-6,000 Domestic migration has improved in recent years, nearly becoming a net inmigration. -9, Year Source: Population Estimates Program, U.S. Census Bureau, released Domestic International
42 Comparison of Nebraska Inflows, Outflows, and Net Person Movement Based on IRS Tax Filings: ,000 10,000 45,000 8,000 Number of Exemptions (proxy for persons) 40,000 35,000 30,000 25,000 20,000 15,000 Nebraska's net movement of 10,000 persons domestically in ,000 was the best since 1996, 5,000 which was the last time Nebraska had a net gain of -8,000 persons from other states. 0-10, Year Source: IRS State-to- State Migration Files Total Inflow Total Outflow Total Net Flow 6,000 4,000 2, ,000-4,000 Net Person Movement Compiled and Prepared by: David Drozd, UNO
43 Number of Tax Return Exemptions for Movers between Nebraska and Michigan: 1989 to ,000 Exemptions (proxy for persons) 0-1, Year Source: IRS State-to-State Migration Files Total Inflow Total Outflow Total Net Flow Compiled and Prepared by: David Drozd, UNO
44 Number of Tax Return Exemptions for Movers between Nebraska and Florida: 1989 to ,000 Exemptions (proxy for persons) 1, , Year Source: IRS State-to-State Migration Files Total Inflow Total Outflow Total Net Flow Compiled and Prepared by: David Drozd, UNO
45 Number of Tax Return Exemptions for Movers between Nebraska and Missouri: 1989 to ,000 3,000 Exemptions (proxy for persons) 2,000 1, , Year Source: IRS State-to-State Migration Files Total Inflow Total Outflow Total Net Flow Compiled and Prepared by: David Drozd, UNO
46 Number of Tax Return Exemptions for Movers between Nebraska and South Dakota: 1989 to ,000 2,000 Exemptions (proxy for persons) 1, , Year Source: IRS State-to-State Migration Files Total Inflow Total Outflow Total Net Flow Compiled and Prepared by: David Drozd, UNO
47 Comparison of Migration within Nebraska and Out-of-State for Lancaster County based on Changes in IRS Tax Filing Locations: 1999 to ,500 1,289 1,090 1,274 1,174 Net Migration based on Number of Exemptions Changing Filing Locations 1, ,000-1,500-1,123-1, , , ,145-1,362-2,000-1, Tax Filing Years Source: IRS migration files, downloaded from Missouri State Data Center website Same St. Different St. -1,835 Compiled and Prepared by: David Drozd, Center for Public Affairs Research, UNO
48 Comparison of Migration within Nebraska and Out-of-State for Douglas County based on Changes in IRS Tax Filing Locations: 1999 to ,000 Net Migration based on Number of Exemptions Changing Filing Locations ,000-1,500-2, ,141-2, , ,166-2, Tax Filing Years Source: IRS migration files, downloaded from Missouri State Data Center website Same St. Different St. Compiled and Prepared by: David Drozd, Center for Public Affairs Research, UNO
49 Employment and Per Capita Personal Income Jerry Deichert, David Drozd, UNO
50 Employment Employment grew about the same rate as the US in the 1970s, more rapidly in the early 1990s, and more slowly since Since 1969, the rate of growth in Nebraska s employment is 3.7 times larger than its population.

51 Source: US Bureau of Economic Analysis, Regional Economic Information System
52 Jobs in Nebraska Counties By Metropolitan and Micropolitan Status (2003 Definitions) and Size of Largest City 2,500-9,999 and Under 2,500: , , ,000 Jobs 300, , , Metro Micro 2,500-9,999 <2,500 Source: US Bureau of Economic Analysis, Regional Economic Information System
53 Per Capita Income Per capita income declined in relation to the US between 1970 and 1980 and has fluctuated between 90 and 95 percent of the national average since then. Recently, metropolitan per capita income has been decreasing in relation to US while all nonmetro areas have been increasing.
54 Per Capita Personal Income of Nebraska Counties As a Percentage of the U.S. By Metropolitan and Nonmetropolitan Status (2003 Definitions): US = Nebraska Metro Nonmetro Source: US Bureau of Economic Analysis, Regional Economic Information System Percentage of U.S.
55 Per Capita Personal Income of Nebraska Counties As a Percentage of the U.S.By Metropolitan and Micropolitan Status (2003 Definitions) and Size of Largest City 2,500-9,999 and Under 2,500: US = 100 Percentage of U.S Metro Micro 2,500-9,999 <2,500 Source: US Bureau of Economic Analysis, Regional Economic Information System
56 Contact Us With Questions David Drozd (402) Jerry Deichert (402) Also view the CPAR website
Nebraska Births Report: A look at births, fertility rates, and natural change
 University of Nebraska Omaha DigitalCommons@UNO Publications since 2000 Center for Public Affairs Research 7-2008 Nebraska Births Report: A look at births, fertility rates, and natural change David J.
Community Forum Scottsbluff
 Community Forum Scottsbluff Jerry Deichert Center for Public Affairs Research University of Nebraska at Omaha December 3, 2013 State Population Summary In 2010, Nebraska had a population count of 1,826,341
WHERE ARE ARIZONA DEMOGRAPHICS TAKING US? HOW GROWING SLOWER, OLDER AND MORE DIVERSE AFFECTS REAL ESTATE
 WHERE ARE ARIZONA DEMOGRAPHICS TAKING US? HOW GROWING SLOWER, OLDER AND MORE DIVERSE AFFECTS REAL ESTATE March 2017 Tom Rex Office of the University Economist and Center for Competitiveness and Prosperity
MANITOBA'S ABORIGINAL COMMUNITY: A 2001 TO 2026 POPULATION & DEMOGRAPHIC PROFILE
 MANITOBA'S ABORIGINAL COMMUNITY: A 2001 TO 2026 POPULATION & DEMOGRAPHIC PROFILE MBS 2005-4 JULY 2005 TABLE OF CONTENTS I. Executive Summary 3 II. Introduction.. 9 PAGE III. IV. Projected Aboriginal Identity
2017 Nebraska Profile
 2017 Nebraska Profile State, 9 NEW Regions, 93 Counties, plus 31 Cities Three Volumes Demographic Change in the State Economic Influences at Work Housing Statistics and Trends Summary of Findings Discuss
Demographic Change in North Carolina
 Demographic Change in North Carolina 5 Trends to Watch North Carolina Aggregates Association June 29, 2017 Rebecca Tippett, PhD Director, Carolina Demography July 1 Population (Millions) North Carolina
Michigan Population Trends: The School Age Population
 Michigan Population Trends: The School Age Population Eric Guthrie Michigan s State Demographer January 16, 2018 State Demographer Michigan s liaison with the U.S. Census Bureau for most programs including
Utah s Demographic Transformation
 Utah s Demographic Transformation A View into the Future Pamela S. Perlich, Ph.D. University Of Utah December 3, 2009 Based on a paper with the same title, available on-line: www.bebr.utah.edu Utah: Trend
Wenlin Liu, Senior Economist. Stateof Wyoming. Economic Analysis Division State of Wyoming 1
 WYOMING DEMOGRAPHIC AND ECONOMIC TREND LCCC LIFE Program April 7, 2012 Cheyenne, Wyoming Wenlin Liu, Senior Economist Economic Analysis Division Stateof Wyoming Economic Analysis Division State of Wyoming
Demographic Characteristics and Trends of Bexar County and San Antonio, TX
 Demographic Characteristics and Trends of Bexar County and San Antonio, TX Leadership San Antonio Understand Infrastructure. Prepare for Growth. May 2, 2012 San Antonio, TX Select Growing States, 2000-2010
Developing Regional Solutions In Southeast Michigan
 Developing Regional Solutions In Southeast Michigan Presentation to Metropolitan Detroit Medical Library Group March 15, 2018 Membership Map 171 Total Members Including education members: Livingston Educational
HEALTH INSURANCE COVERAGE STATUS American Community Survey 1-Year Estimates
 S2701 HEALTH INSURANCE COVERAGE STATUS 2014 American Community Survey 1-Year Estimates Supporting documentation on code lists, subject definitions, data accuracy, and statistical testing can be found on
Program Review. Computer Business Applications. Prepared By GWC Office of Institutional Effectiveness
 2015-16 Program Review Prepared By GWC Office of Institutional Effectiveness 2015-16 Program Review NOTES AND DEFINITIONS... 3 SUMMARY DASHBOARD... 4 STUDENT DEMOGRAPHICS... 6 UNDUPLICATED HEADCOUNT AND
Housing, Economics and People in the U.S. and Wisconsin
 Housing, Economics and People in the U.S. and Wisconsin Morris A. Davis, Ph. D. Academic Director, James A. Graaskamp Center for Real Estate Associate Professor, Department of Real Estate and Urban Land
Figure 39. Yearly Trend in Death Rates for Drowning: NSW, Year
 10.0 DROWNING 10.1 Deaths due to Drowning: The drowning death rate showed a statistically significant decrease between 199 and 1999 (Figure 39). Between 199 and 1999, 46 people died from drowning, at a
Briefing Paper #1. An Overview of Regional Demand and Mode Share
 2011 Metro Vancouver Regional Trip Diary Survey Briefing Paper #1 An Overview of Regional Demand and Mode Share Introduction The 2011 Metro Vancouver Regional Trip Diary Survey is the latest survey conducted
Population & Demographics
 Population & Demographics Conditions and Trends When looking at trends in the total number of people living in Windham (population) and at the characteristics of the people who live here by factors such
NC s Shifting Population: Growth, Decline, and Rebound
 NC s Shifting Population: Growth, Decline, and Rebound House Select Committee on Strategic Transportation Planning and Long-Term Funding Solutions April 30, 2018 Rebecca Tippett, PhD Director, Carolina
Oakmont: Who are we?
 Oakmont: Who are we? A Snapshot of our community from the April 2010 US Census Contents Age and Gender... 1 Marital Status... 2 Home Ownership and Tenure... 3 Past Demographic Characteristics... 5 Income
Missing Opportunities: Racial and Ethnic Disparities in the Twin Cities Metro in 2016
 New MetroStats Missing Opportunities: Racial and Ethnic Disparities in the Twin Cities Metro in 2016 10/2/2017 Community Development Committee What s New American Community Survey data released (9/14)
Demographic and Economic Trends in the Tri-State Region
 Demographic and Economic Trends in the Tri-State Region James Gillard FEDERAL RESERVE BANK OF PHILADELPHIA Talk Outline Demographic Trends in the Region Economic Trends in the Region Regional Resources
The Wisconsin and Minnesota Economies: What can we learn from each other? Noah Williams
 The Economies: What can we learn from each other? Noah University of Wisconsin - Madison Future Wisconsin Summit 2016 Economies Location, size, demographics, and history make Wisconsin and Minnesota natural
User Characteristics and Use Trends Since the 1990s on Paved State Bicycle Trails
 User Characteristics and Use Trends Since the 1990s on Paved State Bicycle Trails State paved bicycle trails (segments studied are mapped) Paul Bunyan segment near Bemidji Heartland Paul Bunyan Gitchi-Gami
1999 On-Board Sacramento Regional Transit District Survey
 SACOG-00-009 1999 On-Board Sacramento Regional Transit District Survey June 2000 Sacramento Area Council of Governments 1999 On-Board Sacramento Regional Transit District Survey June 2000 Table of Contents
Nevada County Population Projections 2015 to 2034
 Nevada County Population Projections 2015 to 2034 Prepared By: Jeff Hardcastle, AICP Nevada State Demographer Nevada Department of Taxation Reno Office: 4600 Kietzke Lane, Building L Suite 235 Reno, NV
Spring Time for Housing
 Spring Time for Housing Arizona State University December 2 nd, 2015 Presented By: Elliott D. Pollack CEO, IN PHOENIX 1 2 The World has Changed Pre-2007 Post-2007 3 Employment Growth From Bottom of Recession
Three Strikes Analysis:
 Three Strikes Analysis: Demogr aphic Char acteristics of Strike Offenders Jessica Jin 16 Francesca Hidalgo-Wohlleben 17 with assistance from: Shaneli Jain 18 Shivani Pandya 18 Jennifer Walsh, PhD, Project
NC Demographic Trends Through 2035
 NC Demographic Trends Through 2035 House Select Committee on Strategic Transportation Planning and Long Term Funding Solutions February 22, 2016 Rebecca Tippett, University of North Carolina July 1 Population
Five Ways the 2016 Census Affects Marketers
 Five Ways the 2016 Census Affects Marketers February 15, 2018 Dr. Doug Norris Senior Vice President and Chief Demographer Rupen Seoni Senior Vice President and Practice Leader Today s presenters Dr. Doug
TRENDS IN PARTICIPATION RATES FOR WILDLIFE-ASSOCIATED RECREATION BY RACE/ETHNICITY AND GENDER:
 TRENDS IN PARTICIPATION RATES FOR WILDLIFE-ASSOCIATED RECREATION BY RACE/ETHNICITY AND GENDER: 1980-2001 Allan Marsinko Professor Department of Forestry and Natural Resources Clemson University Clemson,
50 by 30 Live, Learn, Earn
 50 by 30 Live, Learn, Earn SCALE Meeting Workforce Readiness October 13, 2017 Workforce Readiness Update Key Data Points Next Steps Employer Panel Workforce Readiness Vision Elevate each person s contribution
The Quality of Life of the People in Norway
 1 Example Report The Quality of Life of the People in Norway The Management Institute for Quality-of-Life Studies December 2018 2 Introduction This report provides a detailed picture of the quality of
Colorado Economic Update
 Colorado Economic Update Steamboat Economic Summit Place cover image here Brian Lewandowski Associate Director, Business Research Division October 21, 2016 Recession 8 Months Recession 18 Months Real GDP
Prepared for: North Dakota Housing Finance Agency, Bismarck, ND, and its partners across the state of North Dakota
 2016 North Dakota Statewide Housing Needs Assessment: Component 3 - Detailed Tables Accompanying data to the 2016 North Dakota Statewide Housing Needs Assessment: Population & Housing Forecast Issued:
THE FUTURE OF SALES TAX REVENUE
 THE FUTURE OF SALES TAX REVENUE Presented by Adam Fulton, Senior Economic Associate The Outlook for Sales Taxes State governments rely on state sales taxes for more than a fifth of their revenue Economic
Texas Housing Markets: Metropolitan vs. Border Communities. September 22, 2014
 Texas Housing Markets: Metropolitan vs. Border Communities Luis Bernardo Torres Ruiz, Ph.D. Research Economist El Paso Branch Dallas Federal Rio Grande Economic Association September 22, 2014 Contents
American River College Student Equity Disproportionate Impact Analyses Fall 2015
 Disproportionate Impact Analyses Fall 2015 This document introduces the set of data ARC s Research Office compiled in Fall 2015. The data reported here were sourced from the California Community College
Americans in Transit A Profile of Public Transit Passengers
 Americans in Transit A Profile of Public Transit Passengers published by American Public Transit Association December 1992 Louis J. Gambacclnl, Chairman Rod Diridon, Vice Chairman Fred M. Gilliam, Secretary-Treasurer
ANNUAL REPORT OF THE FARGO MOORHEAD METROPOLITAN AREA FARGO MOORHEAD METROPOLITAN COUNCIL OF GOVERNMENTS PREPARED BY:
 ANNUAL REPORT OF THE FARGO MOORHEAD METROPOLITAN AREA community & demographics roadway system freight & interstate travel bicycle & pedestrian network transit network PREPARED BY: FARGO MOORHEAD METROPOLITAN
METROPOLITAN PROFILE 2016 ANNUAL REPORT OF THE FARGO-MOORHEAD METROPOLITAN AREA
 METROPOLITAN PROFILE 2016 ANNUAL REPORT OF THE FARGO-MOORHEAD METROPOLITAN AREA community & demographics roadway system freight & interstate travel bicycle & pedestrian network transit network PREPARED
Bob Costello Chief Economist & Vice President American Trucking Associations. Economic & Motor Carrier Industry Trends. September 10, 2013
 Bob Costello Chief Economist & Vice President American Trucking Associations Economic & Motor Carrier Industry Trends September 10, 2013 The Freight Economy Washington continues to be a headwind on economic
Joint Strategic Needs Assessment (JSNA) Picture of Lewisham 2018
 Picture of Lewisham 2018") Joint Strategic Needs Assessment (JSNA) Picture of Lewisham 2018 Lewisham s Population Lewisham is the 13 th largest borough in London by population size and the 5 th largest in Southwark Inner London
Joint Strategic Needs Assessment (JSNA) Picture of Lewisham 2018 Lewisham s Population Lewisham is the 13 th largest borough in London by population size and the 5 th largest in Southwark Inner London
The Outlook for Real Estate and Residential Construction. Patrick M. Barkey, Director Bureau of Business and Economic Research University of Montana
 The Outlook for Real Estate and Residential Construction Patrick M. Barkey, Director Bureau of Business and Economic Research University of Montana Montana s Real Estate Performance: Getting Back to Boom
Traffic Safety Facts 2007 Data
 Traffic Safety Facts 2007 Data Bicyclists and Other Cyclists DOT HS 810 986 Bicyclists and other cyclists include riders of two-wheel nonmotorized vehicles, tricycles, and unicycles powered solely by pedals.
Changing Demographics in the U.S. and the Impact on Congress
 Changing Demographics in the U.S. and the Impact on Congress Richard Fry, PhD Prepared for presentation to the HACU 16 th Annual National Capitol Forum on Hispanic Higher Education, Washington, DC April
Update on the Assessment of Undergraduate Learning Outcomes Collegiate Learning Assessment B.4 B.5
 Update on the Assessment of Undergraduate Learning Outcomes Collegiate Learning Assessment B.4 B.5 CAL POLY, SAN LUIS OBISIPO WASC Interim Report, March 2015 Appendix B: Update on the Assessment of Undergraduate
ENROLLMENT PROJECTIONS JANUARY 8, 2018 BOARD OF EDUCATION PRESENTATION JEFF CIMMERER CHIEF INFORMATION OFFICER
 1 ENROLLMENT PROJECTIONS JANUARY 8, 2018 BOARD OF EDUCATION PRESENTATION JEFF CIMMERER CHIEF INFORMATION OFFICER Pittsford Central School District Enrollment Comparison Between 2016 and 2017 Grades Actual
Growth Trends in Hampton Roads
 Presentation to the Isle of Wight County Board of Supervisors Growth Trends in Hampton Roads Hampton Roads Planning District Commission Greg Grootendorst Chief Economist September 19, 2014 Looking to 2040
THE I-79 CORRIDOR. I-79 provides motorists with connections to the following major highways: I-80, PA 358, PA 965 and PA 208.
 The I-79 Corridor Pittsburgh to Erie Regional Thruway I-79 was constructed through Mercer County in the early 1960s. The portion north of PA 965 opened in 1961 and the segment south of PA 965 the following
Not For Sale. An American Profile: The United States and Its People
 An American Profile: The United States and Its People Not For Sale 1 759_EM_AmPro_ptg1.indd 1 Not For Sale 759_EM_AmPro_ptg1.indd 2 An American Profile: The United States and Its People 3 Table 1 Population,
Understanding Population Pyramids
 Understanding Population Pyramids Population Pyramids ttp://ecp3113-01.fa01.fsu.edu/lively_introduction/fig7.gif What will the pyramid look like in 2025? 2050? Age Dependency Ratio 80+ yrs. 75-79 yrs.
THE 2010 MSP REGION TRAVEL BEHAVIOR INVENTORY (TBI) REPORT HOME INTERVIEW SURVEY. A Summary of Resident Travel in the Twin Cities Region
 REPORT HOME INTERVIEW SURVEY. A Summary of Resident Travel in the Twin Cities Region") THE 2010 MSP REGION TRAVEL BEHAVIOR INVENTORY (TBI) REPORT HOME INTERVIEW SURVEY A Summary of Resident Travel in the Twin Cities Region October 2013 WHAT IS THE TBI? The Travel Behavior Inventory (TBI)
THE 2010 MSP REGION TRAVEL BEHAVIOR INVENTORY (TBI) REPORT HOME INTERVIEW SURVEY A Summary of Resident Travel in the Twin Cities Region October 2013 WHAT IS THE TBI? The Travel Behavior Inventory (TBI)
Net Migration to Montana Growth in the Gallatin. Net Migration to Eastern/Northern Montana. Resident Population July 1, 2006 (in 1000s)
") Growth in the Gallatin Douglas J. Young Professor of Economics Montana State University January 16, 28 2, 15, 1, 5, -5, -1, Net Migration to Montana 199-2 1-19 2-29 3-39 4-49 5-59 6-69 7-79 Census 199
Growth in the Gallatin Douglas J. Young Professor of Economics Montana State University January 16, 28 2, 15, 1, 5, -5, -1, Net Migration to Montana 199-2 1-19 2-29 3-39 4-49 5-59 6-69 7-79 Census 199
Travel and Rider Characteristics for Metrobus
 Travel and Rider Characteristics for Metrobus 040829040.15 Travel and Rider Characteristics for Metrobus: 2012-2015 Overview The Miami Dade County Metropolitan Planning Organization (MPO) conducted a series
Rural West Waterloo School Closure Review ARC Meeting #1 October 21, 2013
 Rural West Waterloo School Closure Review ARC Meeting #1 October 21, 2013 Presentation Outline Demographics & Enrolment Funding Rural West Waterloo Goals School Closure Review Process Demographics & Enrolment
Participation. Workers Compensation Insurance Seminar. May 22, Nick Beleiciks
 Oregon s Falling Labor Force Participation Workers Compensation Insurance Seminar May 22, 2013 Nick Beleiciks Let s start with a simple graph. Oregon Employment Loss by Recession 0% % Job Loss from Peak
Population trends in Hungary in the 2nd half of the 20th century and in the last 15 years
 Population trends in Hungary in the 2nd half of the 20th century and in the last 15 years Péter Őri (Hungarian Demographic Research Institute, Budapest) Driving forces behind demographic trends in Visegrad
2016 Capital Bikeshare Member Survey Report
 2016 Capital Bikeshare Member Survey Report Prepared by: LDA Consulting Washington, DC 20015 (202) 548-0205 February 24, 2017 EXECUTIVE SUMMARY Overview This report presents the results of the November
Larry Kessler, Ph.D. Boyd Center for Business & Economic Research University of Tennessee
 Larry Kessler, Ph.D. Boyd Center for Business & Economic Research University of Tennessee The U.S. economy has now enjoyed 7 years of economic growth since the Great Recession Real GDP grew by 1.2% in
NC Demographic Trends Through 2035
 NC Demographic Trends Through 2035 Joint Appropriation Committee on Transportation February 21, 2017 Rebecca Tippett, PhD Director, Carolina Demography July 1 Population (Millions) North Carolina s Total
An American Profile: The United States and Its People
 An American Profile: The United States and Its People 1 153641_EM_AmPro.indd 1 12/16/8 11:1:32 PM An American Profile: The United States and Its People 3 Table 1 Population, Percentage Change, and Racial
REPORT OF THE ENGINEERING & PLANNING DEPARTMENT PLANNING DIVISION
 REPORT OF THE ENGINEERING & PLANNING DEPARTMENT PLANNING DIVISION 2008 09 22 TO: Mayor John Rowswell and Members of City Council SUBJECT: Official Plan Review 2008 Part 1 - Population and Household Projections
Population Change during Trying Times: Illinois New Demographic Reality
 Change during Trying Times: Illinois New Demographic Reality Dr. Matthew Hall IGPA Faculty Member Assistant Professor of Sociology, University of Illinois at Chicago Highlights 1. Illinois grew by 411,399
Clackmannanshire Council. Housing Need and Demand Assessment. 1.0 Introduction
 Clackmannanshire Council Housing Need and Demand Assessment 1.0 Introduction Establishing a clear picture of housing need and demand in Clackmannanshire is essential to inform Council policy in relation
GROWING INEQUALITY AND ITS IMPACTS: Bulgaria and Romania
 GROWING INEQUALITY AND ITS IMPACTS: Bulgaria and Romania Vassil Tsanov Economic Research Institute of BAS Concluding Conference, Amsterdam, 4-5 Jun 2013 INCOME INEQUALITY DEVELOPMENT 1. Similarities: -
Deaths in Hawaii Due to Congestive Heart Failure
 in Hawaii Due to Congestive Heart Failure Death Counts, Age-Adjusted Mortality Rates, and Years of Potential Life Lost for Congestive Heart Failure for the State of Hawaii (Residents Only), by State, County
WORLD. Geographic Trend Report for GMAT Examinees
 2012 WORLD Geographic Trend Report for GMAT Examinees WORLD Geographic Trend Report for GMAT Examinees The World Geographic Trend Report for GMAT Examinees identifies mobility trends among candidates applying
JANUARY Danger Zones: A summary of pedestrian fatality trends in Louisiana
 JANUARY 2014 Danger Zones: A summary of pedestrian fatality trends in Louisiana TEN YEARS OF DANGER: Pedestrian Deaths in Louisiana Although vehicular deaths have decreased in Louisiana, pedestrian deaths
Deaths in Hawaii Due to Colon Cancer
 in Hawaii Due to Colon Cancer Death Counts, Age-Adjusted Mortality Rates, and Years of Potential Life Lost for Colon Cancer for the State of Hawaii (Residents Only), by State, County of Residence, Gender,
Internet Use Among Illinois Hunters: A Ten Year Comparison
 HumanDimensions R e s e a r c h P r o g r a m Internet Use Among Illinois Hunters: A Ten Year Comparison Illinois Natural History Survey Prairie Research Institute University of Illinois at Urbana-Champaign
Indiana Electricity Projections: The 2018 Forecast Update
 Indiana Electricity Projections: The 2018 Forecast Update State Utility Forecasting Group The Energy Center at Discovery Park Purdue University West Lafayette, Indiana October 2018 Summary This report
Dauphin Lake Fishery. Status of Walleye Stocks and Conservation Measures
 Dauphin Lake Fishery Status of Walleye Stocks and Conservation Measures Date: December, 21 Dauphin Lake Fishery Status of Walleye Stocks and Conservation Measures Background: Walleye stocks in Dauphin
Summary of Travel Trends Findings from the 2017 NHTS. Nancy McGuckin, Travel Behavior Analyst Anthony Fucci, Westat
 1 Summary of Travel Trends Findings from the 2017 NHTS Nancy McGuckin, Travel Behavior Analyst Anthony Fucci, Westat 2 A BIG thank you to: FHWA Team: Danny Jenkins, FHWA Stacey Bricka, Macrosys Tim Reusher,
PerformanceTrak News December 2013 and Year End Results January 30, 2014
 PerformanceTrak News December 2013 and Year End Results January 30, 2014 Executive Summary Rounds played concluded down 4.8% for 2013 while the number of days open finished down 6.9% as compared to 2012.
Small Business Dynamics and Job Creation. Small Business Numbers, Pretty Pictures and Not So Pretty Pictures
 Small Business Dynamics and Job Creation Or Small Business Numbers, Pretty Pictures and Not So Pretty Pictures Brian Headd Office of Advocacy U.S. Small Business Administration Employers 8,000,000 7,500,000
2015 Origin/Destination Study
 2015 Origin/Destination Study Research Report for Prepared by: March 2016 Table of Contents Summary of Findings... 7 Rider Profile... 7 Frequency of Use... 7 Transit Dependence... 7 Age... 7 Income...
Key Findings & Corridor Highlights
 The PA 358 Corridor Greenville to I-79 The PA 358 Corridor connects the Borough of Greenville in northwest Mercer County with I-79 to the east. For much of the way it follows the Shenango and Little Shenango
Wisconsin TB Program Update
 Wisconsin TB Program Update Pa Vang, RN, MSN Philip Wegner, RN, MPH Wisconsin TB Program WMLN Conference November 2015 1 Disclosure None 2 Objectives To describe US TB epidemiology To describe Wisconsin
The American Electorate of the 21st Century. Morley Winograd and Michael D. Hais NDN Fellows and Co-authors of Millennial Makeover
 The American Electorate of the 21st Century Morley Winograd and Michael D. Hais NDN Fellows and Co-authors of Millennial Makeover New American Demographics The New America: America Is a Dynamic and Changing
Hunter and Angler Expenditures, Characteristics, and Economic Effects, North Dakota,
 Agribusiness and Applied Economics Report No. 507-S January 2003 Hunter and Angler Expenditures, Characteristics, and Economic Effects, North Dakota, 2001-2002 Dean A. Bangsund and F. Larry Leistritz*
University Of Maryland
 2000 Census Census Data 200 Census Change 2000 to 200 SUBJECT Number Percent SUBJECT Number Percent Number Percent TOTAL POPULATION 437 TOTAL POPULATION 246-9 -43.7 White 283 64.8 White 65 67. -8-4.7 Black
2020 K Street NW, Suite 410 Washington, DC (202)
") 2020 K Street NW, Suite 410 Washington, DC 20006 (202) 463-7300 Interview dates: October 24 25, 2013 Interviews: 1,008 adults CONDUCTED BY IPSOS PUBLIC AFFAIRS These are findings of an Ipsos online poll
2020 K Street NW, Suite 410 Washington, DC 20006 (202) 463-7300 Interview dates: October 24 25, 2013 Interviews: 1,008 adults CONDUCTED BY IPSOS PUBLIC AFFAIRS These are findings of an Ipsos online poll
Target Shooting by Hunters and Their Use of Shooting Ranges: 1975, 1991, and 2011
 U.S. Fish & Wildlife Service Target Shooting by Hunters and Their Use of Shooting Ranges: 1975, 1991, and 2011 Addendum to the 2011 National Survey of Fishing, Hunting, and Wildlife-Associated Recreation
Georgia Annual Health Status Measures 2018
 Georgia Annual Health Status Measures 2018 with comparisons to the U.S. and Healthy People 2000, 2010 & 2020 objectives Prepared by the Office of Health Indicators for Planning (OHIP), Georgia Department
America s Diversity Explosion: What it means for Presidential Politics. WILLIAM H. FREY Brookings Institution and University of Michigan
 America s Diversity Explosion: What it means for Presidential Politics r WILLIAM H. FREY Brookings Institution and University of Michigan Millions 225 U.S. White and Minority Populations, 1970-2050 200
For the First Time, a Smaller Jackpot
 F I S C A L S T U D I E S WWW.ROCKINST.ORG SEPTEMBER 21, 2009 For the First Time, a Smaller Jackpot Trends in State Revenues from Gambling Lucy Dadayan and Robert B. Ward HIGHLIGHTS State-local gambling
The Impact of TennCare: A Survey of Recipients 2009
 The Impact of TennCare: A Survey of Recipients 2009 Christopher Carty Research Associate, Center for Business and Economic Research William F. Fox Director, Center for Business and Economic Research and
Figure 1.1. Percentage SCE of All Immigrants. Percentage. Period. Source: Carter et al. (1997).
.") Figure 1.1 Percentage SCE of All Immigrants 80 70 60 Percentage 50 40 30 20 10 0 1871 1875 1876 1880 1881 1885 1886 1890 1891 1895 1896 1900 1901 1905 1906 1910 1911 1915 1916 1920 1921 1925 1926 1930
Figure 1.1 Percentage SCE of All Immigrants 80 70 60 Percentage 50 40 30 20 10 0 1871 1875 1876 1880 1881 1885 1886 1890 1891 1895 1896 1900 1901 1905 1906 1910 1911 1915 1916 1920 1921 1925 1926 1930
State Health Assessment: Findings from the Ohio Medicaid Assessment Survey
 State Health Assessment: Findings from the Ohio Medicaid Assessment Survey County Commissioners Association of Ohio October 23, 2013 Presented by The Ohio Colleges of Medicine Government Resource Center
2012 Capital Bikeshare Member Survey Report
 2012 Capital Bikeshare Member Survey Report Prepared by: LDA Consulting Washington, DC 20015 (202) 548-0205 May 22, 2013 EXECUTIVE SUMMARY Overview This report presents the results of the November 2012
The Economic Status of Women in the U.S. What Has Changed in the Last Years
 The Economic Status of Women in the U.S. What Has Changed in the Last 20 40 Years March 28, 2018 Heidi Hartmann, Ph.D. President, IWPR Scholar in Residence, American University Editor, Journal of Women,
Alaska s Economic Climate
 Alaska s Economic Climate Alaska PTAC Statewide Procurement Conference April 2nd, 2015 Alaska Department of Labor and Workforce Development, Research Section, Neal Fried, Economist Alaska--Boom, Bust
Outmigration and the Changing Economy of the Great Plains
 Outmigration and the Changing Economy of the Great Plains Presented by: Michael Hayden, Secretary of the Kansas Department of Wildlife and Parks The Great Plains 98 th Meridian 1 2 Percentage Change in
2017 North Texas Regional Bicycle Opinion Survey
 2017 North Texas Regional Bicycle Opinion Survey Sustainable Development Program Kevin Kokes, AICP Public Meetings April, 2018 North Central Texas Council of Governments MPO for the Dallas-Fort Worth Region
Regional Real Estate Trends
 Regional Real Estate Trends Terry L. Clower, Ph.D. Director, Center for Regional Analysis Schar School of Policy and Government George Mason University April 6, 2018 140.0 120.0 100.0 80.0 60.0 40.0 20.0
Iowa Child Passenger Safety Survey 2016
 Iowa Child Passenger Safety Survey 2016 Conducted by the University of Iowa Injury Prevention Research Center Under contract to Iowa Governor s Traffic Safety Bureau Background Since 1985, Iowa has had
Northwest Economic Research Center College of Urban and Public Affairs Forecast Breakfast Economic Outlook
 Northwest Economic Research Center College of Urban and Public Affairs 2019 Forecast Breakfast Economic Outlook 1/10/2019 2 U.S. ECONOMY 1/10/2019 3 1980 1982 1984 1986 1988 1990 1992 1994 1996 1998 2000
From Recession to Recovery
 From Recession to Recovery Monday, April 26, 2010 8:00 AM - 9:15 AM Moderator Michael Klowden, President and CEO, Milken Institute Speakers Mohamed El-Erian, CEO and Co-Chief Investment Officer, Pacific
Housing Market Update Greater Moncton. Housing market intelligence you can count on
 Housing Market Update Greater Moncton Housing market intelligence you can count on Housing Market Drivers Multi-Residential/Rental Market New Home Market Single Family Homes Resale Market 2013/2014 Outlook
Water Development Office
 THE STATE OF WYOMING Water Development Office 6920 YELLOWTAIL ROAD TELEPHONE: (307) 777-7626 CHEYENNE, WY 82002 FAX: (307) 777-6819 TECHNICAL MEMORANDUM TO: Water Development Commission DATE: November