DATABASE HEALTH INDEX - DASHBOARD
|
|
|
- Cameron Carter
- 5 years ago
- Views:
Transcription
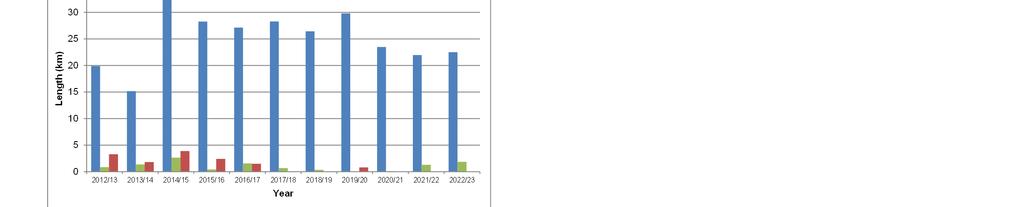
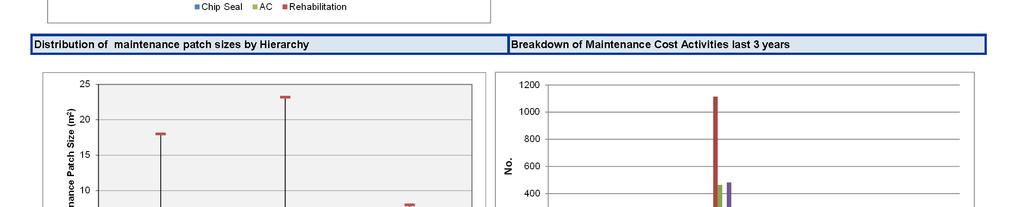
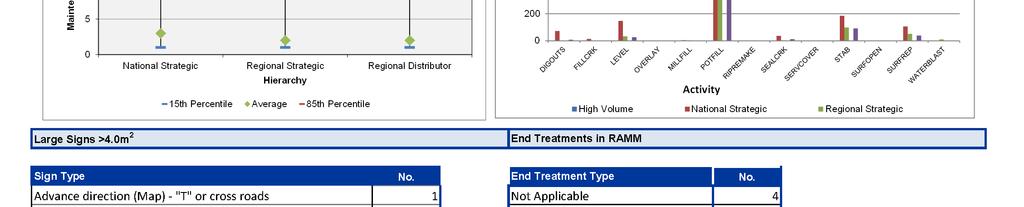
1 Page 1 of 7 DATABASE HEALTH INDEX - DASHBOARD Carriageway Asset Inventory Collected Data Non-Carriageway Asset Inventory Area: Date: MARLBOROUGH 26/07/2013 Category Measures Result Measure Capital Projects Surfacing Major capital projects completed v RAMM (in last 6-30 months) Minor capital or safety improvement projects v RAMM (in last 6-30 months) % of Network surfaced in RAMM over previous 4 15 months % Surfaces at least 50% older than expected age % of Network with no surfacing Illogical Records inc. % (SAC with chipseal, Low and high widths, Alignment of traffic volumes v pavement use) KEY: On or exceeding target One grade, or between 0 and 15 below captured value Greater than one grade, or 15 below captured value 9.2% 0.0% 0.0% 1.5% Performance Expected Category Value Proportion of Network with layer Information 100.0% Grade 3 Pavement Layer New layer length in previous 6 30 months 3.1% Illogical records (Pavement Layers v Incorrect Surfacing) 0.0% Road Marking Breakdown of road markings by type - - Proportion of very short (< 20m) TLs 1.0% Treatment Length Proportion of very long (> 2000m) TLs 2.1% Proportion of TLs with < 80% coverage of major surfacing 10.6% % updated in last 5 years 100.0% Grade 3 Date FWP last updated 9/07/ Forward Works Proportion of network identified for treatment in next ten years (from FWP) 122.2% Programme FWP v surfacings (% surfacings in last year conflicting with first 2 years of FWP excluding 2nd coats) 0.1% Evidence of active MIS strategy, reasons for treatments listed and detailed 100.0% Carriageway Rating Percentage rated in last year 99.2% High Speed Data Maintenance Activity Miscellaneous Traffic Count Structures % network meeting standards for roughness, rutting and texture (Roads surveyed in last year) % network meeting standards for FWD (Roads surveyed in last 5years) % network meeting standards for SCRIM (Roads surveyed in last year) Items per km for PA and SU cost groups in previous 4 15 months v Regional Average Spread of location in previous 4-15 months (proportion located at carriageway start) Distribution of maintenance patch sizes by Hierarchy Breakdown of Maintenance Cost Activities % of Maintenance Activity where fault type is "Unknown" No. of test pits with layer data recorded No. of LTPP sites recorded in RAMM Latest ADT Counts Latest ADT Estimates % loading estimate (i.e. not default) No. of Pavement Type "Bridge" v No. of Bridges > 50m in length in BDS No. Large Culverts v No. BDS Retaining Walls Gantries ( for locations) Barriers in RAMM (m) End Treatments in RAMM 99.9% 3.7% Grade % 100.0% 1.0% 1.0% 1 no. - 6 no. - 31/12/ /12/ % 10.0% Grade % 91 no m - Culverts per km v Regional Average (Rural) 100.0% Catchpits per km v Regional Average (Urban) 40.0% Grade 3 Drainage Manholes per km v Regional Average (Urban) 0.0% NA Subsoil Drains per km v Regional Average (Rural) 78.0% % of Drainage (Construction Date in previous 4 15 months) 0.1% Grade 4 Surfaced SWC per km v Regional Average (Urban) 73.8% Surface Water Channels Earth SWC per km v Regional Average (Rural) 60.8% Grade Sealed SWC renewal activity (Construction Date in previous 4 27 months) 0.3% Grade 4 Signs per km v Regional Average 94.6% Large Signs >4.0m 2 ( for quantity by type) 57 no. - Signs ITS VMS 4 no % of Signs with renewal date in last 4-15 months 2.6% Grade 3 No. Frangible bases in RAMM Streetlights per km v Regional Average 0.0% Grade 5 Frangible Base type no. Streetlights Shear Base type no % of Streetlight Poles with renewal date in last 4 15 months 0.0% Grade 4 Duplicates or near duplicates plus poles with no light or bracket 0.0% Footpaths & Cycleways Total length of Footpath and Cycleways (see attached tables for listings) - - Signal Controlled Intersections Signal Controlled Intersections ( for locations) - - Rest Areas Number of rest areas 6 no Weigh Stations Number of Weigh Stations ( for locations) Expected Value
2 Page 2 of 7 DATABASE HEALTH INDEX DASHBOARD - PROJECTS Area: MARLBOROUGH Date: 26/07/2013 Projects data completed v RAMM (in last 6-30 months) In RAMM (Y/N/P) Project Name SH RS Dir RP Comments Year Y SH1 Blenheim Threshold 01S 0018 Both 8827 Surfacing and Marking Missing 2013 N Tetly Brook Bridge Gaurdrail 01S 0057 Both P Renwick Threshold North Both 175 Carriageway, Pavement Layer, Surfacing and Markings Missing 2013 P Renwick Threshold South Both 2610 Carriageway, Pavement Layer, Surfacing and Markings Missing 2013 N SH6 Renwick ADS Sign Decreasing P Westwood Roundabout Both Only Pavement and Surfacing updated 2012 N Sneiders Creek Realignment Both N SH 62 Wratts To SH1 Widening Both Y Elavation Seal Widening 01S 0000 Decreasing Surfacing date incorrect - should be after pavement layer dates - layers incorrect dates AP40 should be after AP65. No need to split <50m layers should be combined with previous section with average width P Main St Improvements 01S 0028 Both Barriers Missing, Marking condition date Missing P Godfreys Rd RTB Decreasing 9460 Retaining Wall missing, marking painted date, condition date missing 2010 Y Brown River Curve Upgrade Both Railing constructed date missing 2010 N Dashwood Safety Improvements 01S 0043 Decreasing Y Para ATP Markings 01S 0000 B RHS Only 2009 Y Welds Pass ATP 01S 0028 B P Jacksons Road Intersection Upgrade Increasing Surfacing 12/2010? marking painted date, condition date missing 2009

3
4 Page 4 of 7 DATABASE HEALTH INDEX - REGIONAL AVERAGES Area: MARLBOROUGH Date: 26/07/2013 Regional Averages Hierarchy Asset Maintenance Costs (no. of pavement and surfacing faults perkm) Culverts (Rural) Catchpit (Urban) Manholes (urban) Subsoil Drain (Rural) (m per km) Surfaced SWC (Urban) (m per km) Earth SWC (Rural) (m per km) Signs Streetlights Region High Volume National Strategic Regional Strategic Regional Connector Regional Distributor Regional Average for route type MARLBOROUGH STH CANTERBURY NTH CANTERBURY COASTAL OTAGO Regional Average for route type MARLBOROUGH STH CANTERBURY NTH CANTERBURY COASTAL OTAGO Regional Average for route type MARLBOROUGH STH CANTERBURY NTH CANTERBURY COASTAL OTAGO Regional Average for route type MARLBOROUGH STH CANTERBURY NTH CANTERBURY COASTAL OTAGO Regional Average for route type MARLBOROUGH STH CANTERBURY NTH CANTERBURY COASTAL OTAGO Regional Average for route type MARLBOROUGH STH CANTERBURY NTH CANTERBURY COASTAL OTAGO Regional Average for route type MARLBOROUGH STH CANTERBURY NTH CANTERBURY COASTAL OTAGO Regional Average for route type MARLBOROUGH STH CANTERBURY NTH CANTERBURY COASTAL OTAGO Regional Average for route type MARLBOROUGH STH CANTERBURY NTH CANTERBURY COASTAL OTAGO Regional Average
5 Page 5 of 7 DATABASE HEALTH INDEX - PARAMETERS Pavement and Footpath Inventory Capital Projects Surfacing Pavement Layer Measures Description Data Source Grading Greater than Less than Major capital projects completed v RAMM (in last 6-30 months) Minor capital or safety improvement projects v RAMM (in last 6-30 months) % of Network surfaced in RAMM over previous 4 15 months % Surfaces 50% older than expected age % of Network with no surfacing Illogical records (SAC with chipseal, Low and high widths, Alignment of traffic volumes v pavement use) Proportion with layer information New Layer length in 6 30 months Illogical records (Pavement layers v Incorrect Surfacing) Proportion of major capital projects completed within in 6-30 months that have been catpured in RAMM Proportion of minor capital or safety improvement projects completed within in 6-30 months that have been catpured in RAMM Total length of Network with surface date between 4-15 months old / total length of network Total length of Network with surface date > 50% older than expected age / total length of network Total length of Network with no surface material / total length of network No. Records with inconsistencies / No carriageway sections Total length of Network with layer material / total length of network Total length of Network with layer date between 6-30 months old / total length of network Total No. illogical Records / total No treatment lengths NZTA Regional Office, RAMM RAMM surface_structure, carr_way, treatment_length RAMM surface_structure, carr_way RAMM carr_way, c_surface, traffic_loading, traffic_loading_dtl carr_way 8% 5% 8% Grade 3 2% 5% Grade 4 2% 3% 3% 7% Grade 3 7% 15% Grade 4 15% 5% 5% 15% 5% 5% 15% 5% 3% 5% Grade 3 1% 3% Grade 4 1% 5% NZTA Target Grade NZTA Regional Office, RAMM carr_way RAMM pave_structure, carr_way, treatment_length Grade 3 5% 15% RAMM carr_way, treatment_length Road Marking Breakdown of road markings by type Total road marking length by type RAMM carr_way, markings Treatment Length Forward Works Programme Collected Data Carriageway Rating High Speed Data 5% Proportion of very short < 20m TLs Total length of Network with length < 20m / 5% 15% RAMM carr_way, treatment_length total length of network 5% Total length of Network with length > 2000m / 5% 15% Proportion of very long > 2000m TLs RAMM carr_way, treatment_length total length of network 5% Proportion of TLs with < 80% Total length of Network with < 80% coverage RAMM carr_way, treatment_length 5% 15% coverage of major surfacing of major surfacings / total length of network % updated in last 5 years Total No treatment lengths updated in last 5 RAMM carr_way, treatment_length years / total No TL's Grade 3 Date FWP Last Updated Proportion of network identified for treatment in next ten years (date last updated) FWP v surfacings (% surfacings in last year conflicting with first 2 years of FWP exc 2nd coats) Evidence of active MIS strategy, reasons for treatments listed and detailed Percentage rated in last year % network meeting standards for roughness, rutting and texture (Roads surveyed in last year) % network meeting standards for FWD (Roads surveyed in last 5 years) % network meeting standards for SCRIM (Roads surveyed in last year) Date FWP last updated Length of network identified for treatment in the 10 year FWP / total network length Total length of Network with surfacings with dates in last year with a treatment scheduled in first 2 years of FWP (excl 2nd coats) / total length in first 2 years of FWP Total length of Network with MIS strategy present / Total Network Length Total network length rated in the last year / total network length Total length of network with roughness, rutting and texture surveyed in the last year / total network length Total length of network with FWD surveyed in the last 5 years / total network length Total length of network with SCRIM surveyed in the last year / total network length RAMM carr_way, treatment_length, rating RAMM carr_way, treatment_length, hsd_rough, hsd_rutting,hsd_texture RAMM carr_way, treatment_length,falling_weight RAMM carr_way, treatment_length,skid_resistance 2% 2% 5% Grade 3 5% 6% Grade 4 8%
6 Page 6 of 7 DATABASE HEALTH INDEX - PARAMETERS Measures Description Data Source Grading Greater than Less than Items per km for PA and SU fault codes in previous 4 15 months vs Regional Average Spread of location in previous 4-15 months (proportion located at carriageway start) Total number of pavement and surfacing activity in last 4-15 months/total Carriageway Length vs Regional Average Total number of pavement and surfacing activity in last 4-15 months at carriageway start / Total pavement and surfacing activity 5% 5% 15% NZTA Target Grade Maintenance Costs Distribution of maintenance patch sizes by Hierarchy Distribution of maintenance patch sizes by State Highway Classification Breakdown of Maintenance Cost Activities Breakdown of maintenance cost actvities by type for the last 3 years by State Highway Classification % of "Cost faults" Maintenance Cost Activities Percentage of maintenance cost activity recorded as unknown for the last 3 years. 5% 5% 15% Recording Test Pit Data Total number of test pit records RAMM carr_way, pave_test_pit_hdr Latest ADT Counts Latest date of counts RAMM traffic_loading Traffic Count Latest ADT Estimates Latest date of Estimates RAMM traffic_loading Non-Carriageway Asset Inventory % loading estimate (i.e. not default) No. Pavement Type "Bridge" v No. Bridges > 50m in length in BDS No. Large Culverts v No. BDS Total no. loading estimates in last year / total no carriageway sections Total No. Bridge pavement type in RAMM vs Total No. Bridges >50m in length in BDS that carry the State Highway Total No. Culverts with an area >= 3.4m 2 vs Total No. culverts in BDS RAMM carriageway, traffic_loading, carr_way, traffic_loading_dtl RAMM carr_way, BDS RAMM carr_way, drainage, BDS Structures Retaining Walls Total No. Retaining Walls RAMM carr_way, retaining_wall Gantries Total No. Gantries RAMM carr_way, minor_structure Barriers in RAMM(m) Total Length Barriers (excludes SR, HR, OTHER, GREAT) RAMM carr_way, railings Drainage Surface Water Channels Culverts per km v Regional Average (Rural) Catchpits per km v Regional Average (Urban) Manholes per km v Regional Average (Urban) Subsoil Drains per km v benchmark Regional Average (Rural) % of Drainage (Construction Date in previous 4 15 months) Surfaced SWC per km v Regional Average (Urban) Earth SWC per km v Regional Average (Rural) Renewal Activity (Construction Date in previous 4 27 months) Total No. of culverts per km Rural (Includes CUL, SDCUL, OFCUL) vs regional average per km Total No. of catchpits per kmurban (includes CP1,CP2,CP3,SUMP,GRID, SP) vs regional average per km Total No. of manholes per km Urban (includes MHOLE, DCHM) vs regional average per km Length of subsoil drains per km Rural vs regional average per km Total No. of drainage structures renewed or replaced in last 4-15 months / total no. of drainage structures Length of surfaced SWC per km Urban vs regional average per km Length of Earth SWC per kmrural vs regional average per km Length of surfaced SWC renewed or replaced in last 4-15 months / total length of surfaced SWC RAMM carr_way, drainage RAMM carr_way, drainage RAMM carr_way, drainage RAMM carr_way, drainage 4% RAMM carr_way, drainage 2% 4% Grade 3 1% 2% Grade 4 1% RAMM carr_way, sw_channel RAMM carr_way, sw_channel 4% RAMM carr_way, sw_channel 2% 4% Grade 3 1% 2% Grade 4 1%
7 Page 7 of 7 DATABASE HEALTH INDEX - PARAMETERS Measures Description Data Source Grading Greater than Less than Signs per km v Regional Average Total No. of signs per km vs regional average per km RAMM carr_way, signs NZTA Target Grade Large Signs >4.0m 2 Total No. of large signs with a sign face greater than 4.0m 2 RAMM carr_way, signs Signs ITS VMS Total No. of ITS Assets (3VMS, 3MVMS, 3VMSS) and its_state = "In Service" RAMM carr_way, ud_its Maintenance Activity ( replaced date in previous 4 15 months) Total No. of signs renewed or replaced in last 4-15 months / total number of signs 6% 4% 6% RAMM carr_way, signs Grade 3 2% 4% Grade 4 2% No. Frangible bases in RAMM Total No of signs with frangible bases RAMM carr_way, signs Streetlights per km v benchmark Total No. of street lights per km vs regional average per km RAMM carr_way, sl_pole Frangible Base type no. Total No. of street lights with frangible bases RAMM carr_way, sl_pole Streetlights Shear Base type no. Total No. of street lights with shear bases RAMM carr_way, sl_pole Maintenance Activity ( replaced date in previous 4 15 months) Duplicates or near duplicates plus poles with no light or bracket Total No. of street lights renewed or replaced in last 4-15 months / total number of street lights Total No. Poles with no brackets attached, total No. brackets with no light attached, total No. poles with duplicate road_id, location, offset_side, offset RAMM carr_way, sl_pole RAMM carr_way, sl_pole, sl_bracket, sl_light 6% 4% 6% Grade 3 2% 4% Grade 4 2% 5% 5% 15% Footpaths & Cycleways Total Length of Footpath Total length of footpath RAMM carr_way, footpath Total Length of Cycleways Total length of cycleways with marking type (M83, M72) and marking colour GR (green) and notes do not include bus way RAMM carr_way, markings Signal Controlled intersections No. Signal Controlled Intersections Number of signal Controlled Intersections (SIGINT) RAMM carr_way, features Rest Areas Number of rest areas Total No of rest areas RAMM carr_way, features Weigh Station No. Weigh stations Number of weighs Stations (WEIGH) RAMM carr_way, features
land transport road assets
 land transport road assets land transport road assets Otago Region Information as at June 2007 land transport road assets 2 Purpose of this publication Land Transport New Zealand annually publishes comparative
land transport road assets
 land transport road assets land transport road assets Westland District West Coast Region Information as at June 2006 land transport road assets 2 Purpose of this publication Land Transport New Zealand
A5.1 Permitted activities
 Section A5 Transportation A5.1 Permitted activities A5.1.1 Activities within roads Note: Refer to Section D for the definition of road (a) Any activity associated with the movement of traffic and the functioning
Appendix B Option 1 Design, Plans and Estimates
 19 Appendix B Option 1 Design, Plans and Estimates Opus International Consultants Ltd Design Details All options where designed using NZTA MOTSAM part 2, NCC Land development manual 2010 and Cycling
Department of Internal Affairs Mandatory Non-Financial Performance Measures 2013 Roads and Footpaths
 Road Asset Technical Accord - RATA The Centre of Excellence for Road Asset Planning in the Waikato Region Department of Internal Affairs Mandatory Non-Financial Performance Measures 2013 Roads and Footpaths
1.3.4 CHARACTERISTICS OF CLASSIFICATIONS
 Geometric Design Guide for Canadian Roads 1.3.4 CHARACTERISTICS OF CLASSIFICATIONS The principal characteristics of each of the six groups of road classifications are described by the following figure
ASSET ASSET IDENTIFICATION SIGNAGE
 PART PART E E: ASSET ASSET IDENTIFICATION SIGNAGE Manual No. SM051 E-1 7 ASSET IDENTIFICATION SIGN DESIGN AND PLACEMENT General The location referencing system does not include asset identification. However,
Parewanui Road (RP ) 1960 Prog. Mar-18 Prog. May-18
 1960 Prog. Mar-18 Prog. May-18") RDC ROADING REPORT: FEBRUARY 2018 1. MAINTENANCE, OPERATIONS AND RENEWALS This year s resealing programme of 61 km has been completed. Pre-reseal repairs for the 2018/19 year have been programmed. Installing
RDC ROADING REPORT: FEBRUARY 2018 1. MAINTENANCE, OPERATIONS AND RENEWALS This year s resealing programme of 61 km has been completed. Pre-reseal repairs for the 2018/19 year have been programmed. Installing
Secondary Road Program
 Secondary Road Program Joint Legislative Transportation Oversight Committee October 5, 2012 1 Secondary Roads Program The Big Picture The Secondary Road System Needs and Project Types Paved and Unpaved
Quality Assurance Statement. Prepared by: Glen Koorey. Reviewed by: Axel Wilke. Project Number: Version: 1
 Level 1, 284 Kilmore Street PO Box 22 458, Christchurch 8140, New Zealand T: 03 366 7605 E: info@viastrada.co.nz To: Safe Roads / NZ Transport Agency Attn: Liv Theunissen Date: 21 August 2018 Re: ATP installation
INDEX. Geometric Design Guide for Canadian Roads INDEX
 Acceleration lane, see Lanes, Acceleration Access, 8.1 Access Management and Functional Classification 8.2 Access Management by Design Classification 8.3 Access Configuration 8.4 Building Set-Back Guidelines
11 CHECKLISTS Master Checklists All Stages CHECKLIST 1 FEASIBILITY STAGE AUDIT
 11 CHECKLISTS 11.1 Master Checklists All Stages CHECKLIST 1 FEASIBILITY STAGE AUDIT 1.1 General topics 1. Scope of project; function; traffic mix 2. Type and degree of access to property and developments
Dr. Naveed Anwar Executive Director, AIT Consulting Affiliated Faculty, Structural Engineering Director, ACECOMS
 Dr. Naveed Anwar Executive Director, AIT Consulting Affiliated Faculty, Structural Engineering Director, ACECOMS Overview Highway Functions and Classifications Highway Design Components Design Control
TRANSPORT PUBLIC SAFETY SERVICES THAT SUPPORT COMMUNITIES. Provide access to, from and for emergency services
 Transport - 128 - Road Network KEY FACTS Council operates and maintains a network of some 2,53 km which includes: o 864 km of sealed roads o 1,666 km of unsealed roads o 7 bridges and large culverts o
WYDOT DESIGN GUIDES. Guide for. Non-NHS State Highways
 WYDOT DESIGN GUIDES Guide for Non-NHS State Highways 2014 GUIDE FOR Non-NATIONAL HIGHWAY SYSTEM (Non-NHS) STATE HIGHWAYS PRESERVATION REHABILITATION RECONSTRUCTION INTRODUCTION This Guide is directed to
Copy of my report. Why am I giving this talk. Overview. State highway network
 Road Surface characteristics and traffic accident rates on New Zealand s state highway network Robert Davies Statistics Research Associates http://www.statsresearch.co.nz Copy of my report There is a copy
CHECKLIST 6: EXISTING ROADS: ROAD SAFETY AUDIT
 CHECKLIST 6: EXISTING ROADS: ROAD SAFETY AUDIT 6.1 Road alignment and cross-section 6.1.1 Visibility; sight distance Is sight distance adequate for the speed of traffic using the route? Is adequate sight
CHECKLIST 4: PRE-OPENING STAGE AUDIT
 CHECKLIST 4: PRE-OPENING STAGE AUDIT 4.1 General topics 4.1.1 Changes since previous audit; translation of design into practice General check: have any matters that have changed since a previous audit
Introduction Methodology Study area and data collection Results and recommendation Conclusion References
 Introduction Methodology Study area and data collection Results and recommendation Conclusion References It is formal procedure for assessing accident potential and safety performance in the provision
CHECKLIST 2: PRELIMINARY DESIGN STAGE AUDIT
 CHECKLIST 2: PRELIMINARY DESIGN STAGE AUDIT 2.1 General topics 2.1.1 Changes since previous audit Do the conditions for which the scheme was originally designed still apply? (for example, no changes to
Driving Indiana s Economic Growth
 Driving Indiana s Economic Growth IRI/PCR/RUT Field Verification Kumar P. Dave Manager, Road & Pavement Asset Management & Programming, INDOT 03-06-2012 Organization Chart Pavement Division, INDOT David
Crash Patterns in Western Australia. Kidd B., Main Roads Western Australia Willett P., Traffic Research Services
 Crash Patterns in Western Australia Kidd B., Main Roads Western Australia Willett P., Traffic Research Services Abstract Examination of crash patterns is one way of identifying key factors on which focus
SECTION 12 ROAD MARKINGS AND DELINEATION
 SECTION 12 20 June 2009 Part 3: Motorways and Expressways CONTENTS Reference Page Page Number Date SECTION 12: MARKINGS AND DELINEATION 12.1 GENERAL... 12-1 June 2009 12.1.1 INTRODUCTION... 12-1 June 2009
City of Wayzata Comprehensive Plan 2030 Transportation Chapter: Appendix A
 A1. Functional Classification Table A-1 illustrates the Metropolitan Council s detailed criteria established for the functional classification of roadways within the Twin Cities Metropolitan Area. Table
Auckland Transport Code of Practice 2013
 P age 234 9 Roadside Restraint Devices 9.1 Scope This chapter includes the following: Road Safety Barrier Systems Fences Railings Bollards Sight Rails It excludes: Fences and restraints required within
Amendments to Essex Highway Maintenance Strategy Maintenance Policy and Standards April 2008
 Amendments to Essex Highway Maintenance Strategy Maintenance Policy and Standards April 2008 The following amendments to the wording of the maintenance strategy apply following the revised maintenance
Alberta Infrastructure HIGHWAY GEOMETRIC DESIGN GUIDE AUGUST 1999
 Alberta Infrastructure HIGHWAY GEOMETRIC DESIGN GUIDE AUGUST 1999,1'(; A ACCELERATION Data on acceleration from stop D-29 Effects of grade D-35 Intersections D-97, D-99 Lanes D-97, F-5, F-7, F-15, F-21,
UK Pavement Management System. Technical Note 45. Data Topic guidance notes for UKPMS Developers. Version Number 2.00 Issue
 UK Pavement Management System Technical Note 45 Data Topic 130-02 guidance notes for UKPMS Developers Version Number 2.00 Issue February 2019 Document Information Title (Sub Title) Technical Note 45 Data
2003 road trauma for. Wairoa District. Road casualties Estimated social cost of crashes* Major road safety issues WAIROA DISTRICT JULY 2004
 WAIROA DISTRICT JULY 24 T he Land Transport Safety Authority (LTSA) has prepared this road safety issues report. It is based on reported crash data and trends for the 1999 23 period. The intent of the
STATEMENT of POLICY and PROCEDURE
 SCHEDULE B to BY-LAW NO. 96-2013 STATEMENT of POLICY and PROCEDURE No. Responsibility: Roads Date: October 21, 2013 Policy: Road Design Standards Revised: Approved by: By-law No. 96-2013 Pages: 6 Purpose:
FLORIDA DEPARTMENT OF TRANSPORTATION
 FLORIDA DEPARTMENT OF TRANSPORTATION FLEXIBLE PAVEMENT CONDITION SURVEY HANDBOOK March 2012 STATE MATERIALS OFFICE Table of Contents Title Page List of Tables... i List of Figures... ii Executive Summary...
Pavement and Asset Management from a City s Perspective Mike Rief, PE, DBIA and Andrea Azary, EIT. February 12, 2015
 Pavement and Asset Management from a City s Perspective Mike Rief, PE, DBIA and Andrea Azary, EIT February 12, 2015 What is Pavement Management? At a Network Level: Pavement management refers to a systematic
Part 8: Roading. Contents. Part 8: Roading. Christchurch City Council Infrastructure Design Standard 8-1
 Part 8: Roading Contents 8.1 Referenced Documents... 8-4 8.2 Introduction... 8-7 8.2.1 Legal requirements... 8-7 8.3 Creating Good Urban Infrastructure... 8-7 8.4 Quality Assurance Requirements and Records...8-10
Use of Performance Metrics on The Pennsylvania Turnpike. Pamela Hatalowich, Penn Turnpike Commission Paul Wilke, Applied Research Associates, Inc.
 Use of Performance Metrics on The Pennsylvania Turnpike Pamela Hatalowich, Penn Turnpike Commission Paul Wilke, Applied Research Associates, Inc. Presentation Outline Background- Turnpike Construction
WYDOT DESIGN GUIDES. Guide for. NHS Arterial (Non-Interstate)
") WYDOT DESIGN GUIDES Guide for NHS Arterial (Non-Interstate) 2014 GUIDE FOR NATIONAL HIGHWAY SYSTEM (NHS) HIGHWAYS (NHS ARTERIALS, Non-Interstate) PRESERVATION REHABILITATION RECONSTRUCTION INTRODUCTION
WYDOT DESIGN GUIDES Guide for NHS Arterial (Non-Interstate) 2014 GUIDE FOR NATIONAL HIGHWAY SYSTEM (NHS) HIGHWAYS (NHS ARTERIALS, Non-Interstate) PRESERVATION REHABILITATION RECONSTRUCTION INTRODUCTION
road safety issues 2001 road toll for Gisborne district July 2002 Road user casualties Estimated social cost of crashes*
 GISBORNE DISTRICT road safety issues July 22 The Land Transport Safety Authority (LTSA) has prepared this Road Safety Issues Report. It is based on reported crash data and trends for the 1997 21 period.
Parks Highway: MP Lucus Road to Big Lake Road
 2 Purpose and Need 2.1 Corridor History The Parks Highway is a 324-mile long Rural Interstate Highway that extends from its intersection with the Glenn Highway north to Fairbanks, Alaska. The Parks Highway
APPENDIX I-A Kings County Regional Transportation Plan. Appendix A Page A-1 STATE ROUTES
 APPENDIX I-A STATE ROUTES Interstate 5 SR 33 SR 41 SR 43 SR 137 SR 198 SR 269 (See under City of Avenal) (See Figure 4-2 and 4-3 for Rural and Urban Functional Classifications) Appendix A Page A-1 INTERSTATE
Policy Statement. Objective. Context. References and Supporting Documentation
 Policy Statement Subject Placement of Distribution Poles Along Roads With Speed Limits Not Exceeding 70km/h Approved by Robert Rogerson Signature & Date Distribution Standards and Policy Manager Authorised
Safety and Design Alternatives for Two-Way Stop-Controlled Expressway Intersections
 Safety and Design Alternatives for Two-Way Stop-Controlled Expressway Intersections Thomas H. Maze Center for Transportation Research and Education Iowa State University 2901 South Loop Drive, Suite 3100
Welcome to the Open House
 Leslie Street Between 19 th Avenue and Stouffville Road Addendum to Class Environmental Assessment Study Welcome to the Open House Please sign in at the front desk. March 28, 2017 Richmond Green Sports
Road Safety Analysis A Case Study of National Highway 1-A in India. Authors
 Road Safety Analysis A Case Study of National Highway 1-A in India Authors M. S. Mir & F. A. Mir (Civil Engineering Department, NIT Srinagar India) Presentation by Mohammad Shafi Mir INTRODUCTION Road
21. CHRISTCHURCH CYCLE LANES: PROPOSED COLOURED SURFACING CHANGE
 21. CHRISTCHURCH CYCLE LANES: PROPOSED COLOURED SURFACING CHANGE General Manager responsible: General Manager City Environment, DDI 941-8608 Officer responsible: Transport and Greenspace Manager Author:
A465 Heads of the Valleys Dualling Sections 5 and 6 Dowlais Top to Hirwaun SUMMARY PROOF OF EVIDENCE. Highways Engineering Document WG 1.3.
 A465 Heads of the Valleys Dualling Sections 5 and 6 Dowlais Top to Hirwaun SUMMARY PROOF OF EVIDENCE Highways Engineering Document WG 1.3.2 by Jonathan Thirkettle MARCH 2018 1. Introduction 1.1 I am Jonathan
6. BREENS/GARDINERS/HAREWOOD INTERSECTION - SAFETY IMPROVEMENT PROJECT
 6. BREENS/GARDINERS/HAREWOOD INTERSECTION - SAFETY IMPROVEMENT PROJECT General Manager responsible: Officer responsible: Author: Jane Parfitt General Manager City Environment DDI 941 8656 Michael Aitken
SECTION 12 ROAD MARKINGS AND DELINEATION
 SECTION 12 ROAD MARKINGS AND DELINEATION (Blank Page) MANUAL OF TRAFFIC SIGNS AND MARKINGS - Part III: Motorways and Expressways 12-1 12.1 GENERAL 12.1.1 INTRODUCTION The markings and delineation details
County of Greenville South Carolina. Traffic Calming Program Neighborhood Traffic Education Program and Speed Hump Program
 County of Greenville South Carolina Traffic Calming Program Neighborhood Traffic Education Program and Speed Hump Program (rev) August 2008 I. PURPOSE The potential negative impacts from vehicular traffic
This Chapter sets forth the minimum design, technical criteria and specifications to be used in the preparation of all roadway plans.
 4.1 GENERAL This Chapter sets forth the minimum design, technical criteria and specifications to be used in the preparation of all roadway plans. These Roadway Standards are for new construction and modification
ENGINEERING DESIGN STANDARDS TO ENSURE ROAD SAFETY: EXPERIENCES FROM INDIA
 ENGINEERING DESIGN STANDARDS TO ENSURE ROAD SAFETY: EXPERIENCES FROM INDIA Atul Kumar 1 ABSTRACT The primary goal of designing roads with adequate standards is to achieve a safer transport facility for
PLAN 20 PUBLIC TRANSPORT NETWORK
 KEY Bus Route / 400m Coverage Existing Recommended Secondary Potential Secondary Indicative Stop Locations Principle Standard Sub-regional Transit Corridor Reservation PLAN 0 PUBLIC TRANSPORT NETWORK Date:
Road Condition Statistics: Notes and definitions
 Road Condition Statistics: Notes and definitions This note provides definitions used for road condition statistics. It also includes useful information on the source of the data 1. Source The statistics
DRAFT OPERATIONAL RESPONSIBILITY FOR PUBLIC ROADS IN WESTERN AUSTRALIA DRAFT VERSION 2
 DRAFT OPERATIONAL RESPONSIBILITY FOR PUBLIC ROADS IN WESTERN AUSTRALIA DRAFT VERSION 2 DECEMBER 2009 TABLE OF CONTENTS PART 1 INTRODUCTION...1 1. Purpose of Document...1 2. Consultation...1 3. Roads Which
Auckland Transport Monthly Indicators Report 2018/19
 Attachment 1 Auckland Transport Monthly Indicators Report 218/19 August 218 Table of Contents Page 2. 1. Summary of indicators 1.1 SOI performance measures 1.2 AT Metro patronage breakdown 2. Monthly indicators
DUNBOW ROAD FUNCTIONAL PLANNING
 DUNBOW ROAD FUNCTIONAL PLANNING Final Report August 3, 216 #31, 316 5th Avenue NE Calgary, AB T2A 6K4 Phone: 43.273.91 Fax: 43.273.344 wattconsultinggroup.com Dunbow Road Functional Planning Final Report
Optimising Gravel Road Maintenance Strategies. Presenter: Gerrie van Zyl
 Optimising Gravel Road Maintenance Strategies Presenter: Gerrie van Zyl Scope Introduction Road management systems Utilising information to improve maintenance strategies Blading optimisation process Conclusion
Geometric designs for Safe Highways. Dr. Manoj M. Asst. Professor Department of Civil Engineering IIT Delhi
 Geometric designs for Safe Highways Dr. Manoj M. Asst. Professor Department of Civil Engineering IIT Delhi WORKSHOP-CUM-TRAINING PROGRAMME ON ROAD SAFETY 17th 21st September 2018 Outline Introduction Cross
PAEKĀKĀRIKI HILL ROAD / BEACH ROAD / SH1 INTERSECTION PROGRESS REPORT
 Chairperson and Committee Members ENVIRONMENT AND COMMUNITY DEVELOPMENT COMMITTEE 6 DECEMBER 2011 Meeting Status: Public Purpose of Report: For Decision PAEKĀKĀRIKI HILL ROAD / BEACH ROAD / SH1 INTERSECTION
Markings and Road Furniture
 Index Markings and Road Furniture Pages 2 and 3 Other Statutory Controls Page 4 Safety Improvements, Monitoring and Reporting Requirements Page 5 SCRIM Data Releases Pages 6, 7 and 8 Lighting Pages 9 and
Road Safety Audit training course. Motorways - safety issues of the motorway design
 Road Safety Audit training course Motorways - safety issues of the motorway design Jesper Mertner, Road safety auditor, COWI A/S 1 ROAD SAFETY AUDITING COURSE Content 1. Safety 2. Cross sections 3. Horizontal
1. THE IMPACT OF HEAVY VEHICLE TRAFFIC ON ROAD PAVEMENTS
 1. THE IMPACT OF HEAVY VEHICLE TRAFFIC ON ROAD PAVEMENTS 1.1 Background The road network in NZ compromises approximately 95,100 km of roads. About 12.5 % or 11,900 km of these roads are State Highways
Improving Road Safety for North Eastern State Roads of India A Case Study
 Improving Road Safety for North Eastern State Roads of India A Case Study North Eastern States Portugal Debasis Chakrabarty, Transportation Engineer Key figures of North Eastern States Road Project Total
NEW JERSEY DEPARTMENT OF TRANSPORTATION RIDE QUALITY SPECIFICATION AND CASE STUDIES
 NEW JERSEY DEPARTMENT OF TRANSPORTATION RIDE QUALITY SPECIFICATION AND CASE STUDIES BY NARINDER S. KOHLI, P.E. PRINCIPAL ENGINEER PAVEMENT DESIGN, NJDOT (609) 530 8140 NARINDER.KOHLI@DOT.STATE.NJ.US RIDE
Guidance on Minor Improvements to National Roads (Including Erratum No. 1)
") Volume 6 Section 1 Part 1 NRA TA 85/11 Guidance on Minor Improvements to National Roads November 2011 (Including Erratum No. 1, February 2012) St. Martin s House, Waterloo Road, Dublin 4. Tel:+353 1 660
Volume 6 Section 1 Part 1 NRA TA 85/11 Guidance on Minor Improvements to National Roads November 2011 (Including Erratum No. 1, February 2012) St. Martin s House, Waterloo Road, Dublin 4. Tel:+353 1 660
Existing conditions of each bridge and repair plan are presented in Table
 2.2.2.5 Drainage Structure (1) Bridge Along the concerned section of this project road, there are 4 constructed bridges. The carriageway widths of existing bridges are designed to fit with existing road
New Zealand Transport Agency Maintenance guidelines for local roads (2012)
") New Zealand Transport Agency Maintenance guidelines for local roads (2012) Contents 1. Introduction... 12 1.1 Status and intent... 12 1.2 Optimising... 12 1.3 Territorial local authority compliance...
New Zealand Transport Agency Maintenance guidelines for local roads (2012) Contents 1. Introduction... 12 1.1 Status and intent... 12 1.2 Optimising... 12 1.3 Territorial local authority compliance...
Roadway Design Manual
 Roadway Design Manual Revised December 2013 2013 by Texas Department of Transportation (512) 302-2453 all rights reserved Manual Notice 2013-1 From: Manual: Mark A. Marek, P.E Roadway Design Manual Effective
(HIGHWAY GEOMETRIC DESIGN -1)
") LECTURE HOUR-19 TE-1(10CV56) UNIT-3 (HIGHWAY GEOMETRIC DESIGN -1) Width of carriage way: Width of the carriage way or the width of the pavement depends on the width of the traffic lane and number of lanes.
LECTURE HOUR-19 TE-1(10CV56) UNIT-3 (HIGHWAY GEOMETRIC DESIGN -1) Width of carriage way: Width of the carriage way or the width of the pavement depends on the width of the traffic lane and number of lanes.
RURAL HIGHWAY SHOULDERS THAT ACCOMMODATE BICYCLE AND PEDESTRIAN USE (TxDOT Project ) June 7, Presented by: Karen Dixon, Ph.D., P.E.
 June 7, Presented by: Karen Dixon, Ph.D., P.E.") RURAL HIGHWAY SHOULDERS THAT ACCOMMODATE BICYCLE AND PEDESTRIAN USE (TxDOT Project 0-6840) June 7, 2016 Presented by: Karen Dixon, Ph.D., P.E., TTI Team: Kay Fitzpatrick, Raul Avelar, & Subasish Das Project
RURAL HIGHWAY SHOULDERS THAT ACCOMMODATE BICYCLE AND PEDESTRIAN USE (TxDOT Project 0-6840) June 7, 2016 Presented by: Karen Dixon, Ph.D., P.E., TTI Team: Kay Fitzpatrick, Raul Avelar, & Subasish Das Project
Rural Highway Overtaking Lanes
 Rural Highway Overtaking Lanes Kah Wai Ng School of Civil and Resource Engineering, University of Western Australia Song Wang School of Mathematics and Statistics, University of Western Australia Doina
Report from Embassy Visit to Copenhagen May David Arditti
 Report from Embassy Visit to Copenhagen May 2013 David Arditti Standard CPH cycle track, one-way 1.5 2m wide, 5cm above carriageway, 5cm below footway Basic one-way cycle track protected by car parking
Guide to Road Design Part 3: Geometric Design Session I 18 October 2016
 Guide to Road Design Part 3: Geometric Design Session I 18 October 2016 Today s moderator Angela Racz Online Training Coordinator Knowledge Transfer - ARRB Group P: +61 3 9881 1694 E: training@arrb.com.au
C.A.R.S. Project Design Report.
 C.A.R.S. Project Design Report. PRODUCED BY: Browne, A. Kennedy, M. Dolan, N. Selman, C. STUDENT NO: DATE DUE: COURSE: LECTURER: C09365788-C09686908-D11125480-C08868352 20-April-2012 Dt004/3 Civil Engineering
Regional Cycle Programme Update
 Agenda Item 10 (ii) Regional Cycle Programme Update Glossary Auckland Council Auckland Transport Cycle Action Auckland New Zealand Transport Agency Regional Cycle Network (AC) (AT) (CAA) (NZTA) (RCN) Executive
LARIMER COUNTY: ENGINEERING DOUGLAS ROAD (CR 54)
") LARIMER COUNTY: ENGINEERING DOUGLAS ROAD (CR 54) INTRODUCTIONS * Pipeline 1041 Application Coordinator Todd Blomstrom Public Works Director Mark Peterson County Engineer Terry Gilbert Community Development
LARIMER COUNTY: ENGINEERING DOUGLAS ROAD (CR 54) INTRODUCTIONS * Pipeline 1041 Application Coordinator Todd Blomstrom Public Works Director Mark Peterson County Engineer Terry Gilbert Community Development
PROPOSED RESIDENTIAL SUBDIVISION
 PROPOSED RESIDENTIAL SUBDIVISION PART OF TARNEIT ROAD & 1121 DOHERTYS ROAD, TARNEIT Prepared For: TCG (RM) Developments Pty Ltd MARCH 2014 OUR REF: 16740R#1 PROPOSED RESIDENTIAL SUBDIVISION PART OF TARNEIT
Appendix B Existing ADOT Data Parameters
 Appendix B Existing ADOT Data Parameters Appendix 08/04/03 HPMS by Item Number All records 1 Year of Submittal 2 State Code 3 English or Metric Reporting Units 4 County Code 5 Section Identification (ID)
Guide to Road Design Part 4C: Interchanges
 Guide to Road Design Part 4C: Interchanges Sydney 2015 Second edition project manager: Mike Whitehead Second edition prepared by: Peter Aumann Second edition published December 2015 First edition published
Design Criteria. Design Criteria
 F Design Criteria Design Criteria Ministry of Transportation Ministère des Transports DESIGN CRITERIA Page: 1 of 13 WORK PROJECT NO. N/A GO Bloomington Station TYPE OF PROJECT LOCATION Bloomington Road
Complete Streets. Designing Streets for Everyone. Sarnia
 Complete Streets Designing Streets for Everyone Sarnia Complete Streets ~ Sarnia ~ 2018 Introduction Our City is made up of a network of streets that we use to go for a walk, cycle to work, drive to the
PENNDOT HPMS DATA COLLECTION GUIDE. Bureau of Planning and Research Transportation Planning Division April 2016 (Updated March 2018)
") PENNDOT HPMS DATA COLLECTION GUIDE Bureau of Planning and Research April 2016 (Updated March 2018) State Street Dauphin County NOTES INTRODUCTION The purpose of this document is to provide you with some
PENNDOT HPMS DATA COLLECTION GUIDE Bureau of Planning and Research April 2016 (Updated March 2018) State Street Dauphin County NOTES INTRODUCTION The purpose of this document is to provide you with some
Classification Criteria
 SCHEDULE D TO RECOMMENDED OFFICIAL PLAN AMENDMENT NO. 40 SCHEDULE C-4 Road Criteria Criteria Traffic Service Objective Land Service/Access Typical Daily Traffic Volume Flow characteristics Travel Speed
Alberta Highway 881. Corridor Management Plan. Session Forum 1 - Highways. Tri-Party Transportation Conference Moving Alberta Into the Future
 Tri-Party Transportation Conference Moving Alberta Into the Future Alberta Highway 881 Corridor Management Plan Lac La Biche to Anzac Session Forum 1 - Highways March 2017 INTRODUCTION + 241 km long, 2
CHAPTER 16 PEDESTRIAN FACILITIES DESIGN AND TECHNICAL CRITERIA TABLE OF CONTENTS
 CHAPTER 16 PEDESTRIAN FACILITIES DESIGN AND TECHNICAL CRITERIA TABLE OF CONTENTS Section Title Page 16.1 General... 16-1 16.1.1 AASHTO Reference... 16-1 16.1.2 ADA Requirements... 16-1 16.2 Sidewalks...
Preparing a Curb Ramp Project. December 15, 2010
 Preparing a Curb Ramp Project December 15, 2010 3 Tiers of Project Types Non-Signalized Curb Ramp Reconstruction - Typically utilizing standard plans and identifying ramp types at each quadrant Signalized
261 Twilight Road Cleanfill Application Review of Traffic Assessment
 Auckland Council 261 Twilight Road Cleanfill Application Review of Traffic Assessment Auckland Council 261 Twilight Road Cleanfill Application Review of Traffic Assessment Prepared By John Neill Senior
SCHEME DESIGN AND ENGINEERING
 THE NORTH SOMERSET COUNCIL (SOUTH BRISTOL LINK CLASSIFIED ROAD) SIDE ROADS ORDER 2013 THE NORTH SOMERSET COUNCIL (SOUTH BRISTOL LINK) COMPULSORY PURCHASE ORDER 2013 THE NORTH SOMERSET COUNCIL (SOUTH BRISTOL
APPENDIX L. Design Criteria
 APPENDIX L Design Criteria DRAFT PRELIMINARY DESIGN CRITERIA Page 1 of 18 APPROVALS MANAGER, ENGINEERING CITY OF HAMILTON MANAGER, ENGINEERING REGION OF HALTON DATE This Design Criteria for the New East-West
First Order Mapping of Primary and Secondary Road Network. Road Data - Rwanda. Metadata - Final version
 First Order Mapping of Primary and Secondary Road Network Road Data - Rwanda Metadata - Final version 1 GEODATABASE CONTENT The geodatabase for Rwanda data (RW_Data.mdb) contains 5 feature class : 1. RW_Roads
New Mexico Transportation Funding Challenges
 New Mexico Transportation Funding Challenges Rocky Mountain Pavement Preservation Partnership Meeting October 29-31, 2008 Ernest Archuleta, P.E. Field Operations Division Director 1 NMDOT DISTRICT OFFICES
10 SHERFORD Town Code
 Key Fixes (Ref: Masterplan Book, section 4a. Land Use Budget and Key Fixes ) The Town Plan designs and allocates buildings, streets and spaces as accurately as possible in the understandable absence of
Chapter II.3 TRANSPORTATION
 Chapter II.3 TRANSPORTATION 1. Introduction 1.1 PURPOSE The purpose of this chapter is to provide standards for roadway design elements where it is necessary for consistency and to ensure, as far as it
A Safe System-based approach to selection of clear zones, safety barriers and other roadside treatments
 Australasian Road Safety Research, Policing and Education Conference 2012 4-6 October 2012, Wellington, New Zealand A Safe System-based approach to selection of clear zones, safety barriers and other roadside
Intersection Safety 6/7/2015 INTERSECTIONS. Five basic elements should be considered in intersection design. Intersection Safety (continued)
") Intersection Safety S. M. SOHEL MAHMUD Assistant Professor Accident Research Institute (ARI), Bangladesh University of Engineering and Technology (BUET) Dhaka-1000, Bangladesh 1 Outline of the Presentation
Intersection Safety S. M. SOHEL MAHMUD Assistant Professor Accident Research Institute (ARI), Bangladesh University of Engineering and Technology (BUET) Dhaka-1000, Bangladesh 1 Outline of the Presentation
Auckland Transport Monthly Indicators Report 2018/19
 Attachment 1 Auckland Transport Monthly Indicators Report 218/19 October 218 Table of Contents Page 2. 1. Summary of indicators 1.1 SOI performance measures 1.2 AT Metro patronage breakdown 2. Monthly
Discover the Safe System Approach
 Discover the Safe System Approach Aim Take you on a journey of discovery Inform, engage, enthuse and share with you the Safe System approach to saving death and injury on our roads Change to less graphic
Paul Vraney Bureau of Project Development 02/11/2016
 Paul Vraney Bureau of Project Development 02/11/2016 ADA background & alterations definition Design considerations Provide sufficient layout data Curb ramp selection Maximum curb ramp and gutter slopes
CITY OF ROSEVILLE DESIGN STANDARDS
 CITY OF ROSEVILLE DESIGN STANDARDS Section 1 Purpose and Definitions 1-1 Purpose PD 1 1-2 Design Practice PD 1 1-3 Definitions PD 1 Section 2 General Requirements 2-1 Plans by an Appropriate Engineer GR
M-58 HIGHWAY ACCESS MANAGEMENT STUDY Mullen Road to Bel-Ray Boulevard. Prepared for CITY OF BELTON. May 2016
 M-58 HIGHWAY ACCESS MANAGEMENT STUDY Prepared for CITY OF BELTON By May 2016 Introduction Missouri State Highway 58 (M-58 Highway) is a major commercial corridor in the City of Belton. As development has
Road Classification Systems Christchurch and Toronto
 2001 Traffic Management Workshop Technical Paper Andrew G. Macbeth, BE, MEng, Reg Eng, MIPENZ Group Leader, Transportation, Montgomery Watson Harza (NZ) Ltd 7 Deans Avenue, PO Box 13-249, Christchurch
KERBWAY CONTENTS. Note: AutoCAD.dwg files, K1 to F1, may be downloaded from maxq.com.au.
 KERBWAY CONTENTS Contents Page 1 Introduction Page 2 Grates and Inlets Page 3 Design Charts: Mountable Kerb 1:30 Crossfall Chart 1 Barrier Kerb 1:30 Crossfall Chart 2 Mountable Kerb 1:40 Crossfall Chart