2018 Safety Assessment Report
|
|
|
- Annabella Mitchell
- 5 years ago
- Views:
Transcription

1 Measuring Performance 2018 Safety Assessment Report
2 (This page is intentionally left blank) Measuring Performance 2018 Safety Assessment Report DRAFT 2
3 Table of Contents Performance Based Planning Overview... 7 Florida Department of Transportation Response to Safety Performance Measures... 8 Sarasota/Manatee MPO Response to MAP-21 Performance Measures Setting Safety Targets Number of Fatalities Rate of Fatalities Number of Serious Injuries Rate of Serious Injuries Number of Non-motorized Fatalities and Serious Injuries Segment Level Trends and Conditions High Priority Segments Best Practices Systemic Vehicular User Strategies Traffic Signal Backplates Traffic Signal Head Placement Flashing Yellow Arrow Access Management Systemic Vulnerable User Strategies Street Lighting Sidewalk Connections Signage Systemic Senior Road User Strategies Desktop Assessments Measuring Performance 2018 Safety Assessment Report DRAFT 3
4 Table of Maps Map 1 FDOT Pedestrian and Bicycle Focused High Priority Counties Map 2 Fatal and Serious Injury Crash Frequency Distribution ( ) Map 3 Non-Motorized Fatal/Serious Injury Crash Frequency Distribution ( ) Map 4 Top 20 High Priority Crash Locations Table of Tables Table FDOT Safety Targets... 8 Table Sarasota/Manatee MPO Safety Targets Table 3 Annual Fatalities and 5-Year Averages ( ) Table 4 Annual Rate of Fatalities and 5-Year Averages ( ) Table 5 Annual Serious Injuries and 5-Year Averages ( ) Table 6 Annual Rate of Serious Injuries and 5-Year Averages ( ) Table 7 Non-Motorized Fatalities/Serious Injuries and 5-Year Averages ( ) Table 8 Top 20 High Priority Crash Locations Table of Figures Figure 1 Annual Crash Trends ( ) Figure 2 Annual Trend of Top Three Crash Types ( ) Figure 3 Number of Fatalities Figure 4 Rate of Fatalities Figure 5 Number of Serious Injuries Figure 6 Rate of Serious Injuries Figure 7 Number of Non-Motorized Fatalities and Serious Injuries Figure 8 - Traffic Signal with Standard and Retroreflective Backplates Figure 9 - Signal Head Lane Placement Figure 10 - Traditional vs Flashing Yellow Arrow Figure 11 - Flashing Yellow Arrow Operation Figure 12 - Intersection Lighting Layout Design Figure 13 - MUTCD R10-15 Turning Vehicles Yield to Pedestrians Sign Measuring Performance 2018 Safety Assessment Report DRAFT 4
5 Figure 14 - Bike Warning Figure 15 Ride with Traffic Measuring Performance 2018 Safety Assessment Report DRAFT 5
6 Safety Assessment Technical Supplement Twenty Desktop Assessment Review Locations 1. SR 684 (Cortez Rd)-Calm Harbor to 1st St W 2. SR 70 (53rd Ave)-14th St W to 15th St E 3. Swift Road from Parma Street to Grand Cayman 4. US 301 (Washington Blvd) from 10th Street to 30th Street 5. US 301 (Washington Blvd) between 30th Street and Desoto Road 6. Bahia Vista Street between Carter Avenue and Grand Boulevard 7. Wilkinson Road between Atwood Cay Circle to Cattleman Road 8. SR 684 (Cortez Rd)-82nd St to 32nd St 9. 26th Street between 56th Avenue and Cortez Road 10. 9th Street between Twin Oaks Boulevard and US SR 780 (Fruitville Rd)-School Ave to Bearded Oaks Dr th Street W between 40th Avenue W and 26th Avenue W 13. Ocean Boulevard Beach Road between Tenacity Lane and Hour Glass Way 14. Main Street between Bayfront Drive and US Albee Farm Road between Rehab Center Driveway and W Lucaya Ave 16. Gulf Drive between 58th Street and Holmes Boulevard 17. Pinebrook Rd from Venice Ave to Ridgewood Ave 18. N. Bay Blvd from Pine Ave to Poinsettia Rd 19. Biscayne Boulevard between Hyde Park Avenue and Pan American Boulevard th St E from SR-70 to 26th Ave E Four Road Safety Audit Field Reviews 1. SR 780 (Fruitville Rd)-School Ave to Bearded Oaks Dr. 2. US-301 (Washington Blvd) from 10th St to Desoto Road 3. SR-70 (53rd Ave) from US-41 (14th St) to 301 Blvd (15th St) 4. SR-684 (Cortez Road 44th Ave) from 82 nd Ave W to 1st St W Measuring Performance 2018 Safety Assessment Report DRAFT 6
7 Performance Based Planning Overview Performance Based Planning was formally introduced into the Metropolitan Planning Process through the Moving Ahead for Progress in the 21st Century Act (MAP-21). Since MAP-21 was signed into law on July 6, 2012, passage of the subsequent federal transportation legislation titled Fixing America s Surface Transportation (FAST) Act continues to emphasize the importance of performance-based metrics and the establishment of targets to guide future transportation investments. Through rule-making activities, the Federal Highway Administration (FHWA) has identified performance measures for the following four core programs included in MAP-21. National Highway Performance Program Highway Safety Improvement Program Congestion Mitigation and Air Quality Program National Highway Freight Program The FHWA Performance Management website ( maintains current information regarding transportation performance management. Updates on rulemaking related to performance measures, and the schedule by which Metropolitan Planning Organization s (MPO) and State Departments of Transportation (DOT) must establish future year targets, are included. Focusing specifically on the Highway Safety Improvement Program (HSIP), five performance measures were established for evaluating safe traveling conditions on the highway system. These measures became effective on April 14, 2016 and were developed to consider the safety of motorists, bicyclists, and pedestrians. The goal of the HSIP is to achieve a significant reduction in traffic fatalities and serious injuries on all public roads, supported by the following five performance measures established under MAP- 21. PM 1 Number of fatalities PM 2 Rate of fatalities (measured against roadway traffic volumes) PM 3 Number of serious injuries PM 4 Rate of serious injuries (measured against roadway traffic volumes) PM 5 Number of non-motorized (bicycle and pedestrian) fatalities and serious injuries Three measures (PM1, PM3, and PM 5) evaluate the total number of fatalities and serious injury crashes. The two remaining measures (PM 2 and PM4) evaluate the fatalities and serious injuries based on traffic volumes as a means of normalizing crash severity results against roadway conditions. Expressed as crashes per 100 million vehicle miles traveled (VMT), the fatality and serious injury rates provide a basis for comparing crash severity conditions across varying geographic areas. In addition to reporting on the established performance measures, the Florida Department of Transportation (FDOT) and the MPO are now responsible for establishing annually reported targets for each of these five measures. Since crash data from any given year may have extreme peaks or valleys, a Measuring Performance 2018 Safety Report DRAFT 7
8 rolling five-year average of the data is used as the basis for evaluating crash patterns and trends. Reporting of safety targets is based on the assessment of historic 5-year averages and projected 5-year periods. The first reporting period to be evaluated is the 5-year period from 2014 to 2018 and the MPO s first targets were set based on actual data from the 2012 to FHWA will evaluate the progress made by each MPO as part of the ongoing transportation planning process conducted during the federal certification review. Including identified safety elements and recommendations in all projects funded through the MPO, as well as adding new projects that target high crash locations will improve safety for drivers, bicyclists, and pedestrians in the two-county region. This, in turn, should begin reverse the current trend of rising fatalities and serious injuries in three to five years. This report is divided into three major sections, including this overview of performance-based planning. The remaining sections are listed below. Florida Department of Transportation Response to Safety Performance Measures Following enactment of MAP-21, FDOT began assessing currently available data sources and identifying potential performance measures. Coordination across the state resulted in the development of an annual performance report for tracking trends and establishing baseline conditions at a statewide level. With the knowledge that establishing targets would be a future requirement, FDOT proactively established targets for the reduction of fatalities and serious injuries at five percent annually. Ultimately, FDOT s long-term goal is to eliminate roadway fatalities completely. A summary level report, highlighting annual performance, was developed for the Florida Legislature annually from 2012 to This summary has allowed policy and decision makers the opportunity to discuss and evaluate not only the safety performance measures, but mobility, system preservation, economic impacts of transportation, and transportation and environmental interaction measures as well. Up-to-date information on the performance of Florida s multi modal transportation system is available on the FDOT website at Recognizing that many communities in Florida have been identified as the most dangerous for bicyclists and pedestrians in the Dangerous by Design Report by Smart Growth America, FDOT established a bicycle and pedestrian focused initiative in The purpose of this initiative has been to increase awareness and decrease fatalities of bicyclists and pedestrians in Florida. Florida s Pedestrian and Bicycle Strategic Safety Plan was designed to supplement the existing Strategic Highway Safety Plan. Developing a comprehensive strategy to combat crashes involving pedestrians and cyclists included identifying the top 25 high priority counties. Sarasota and Manatee counties, as depicted in Map 1, are the state s focus areas for addressing bicycle and pedestrian safety. This is one example where FDOT has taken a proactive step in evaluating transportation performance in an effort to identify strategic programs and areas for transportation investments. Measuring Performance 2018 Safety Report DRAFT 8
 2017 Annual Report.")
9 MAP 1 FDOT PEDESTRIAN AND BICYCLE FOCUSED HIGH PRIORITY COUNTIES Consistent with the schedule for implementing performance measure targets established in the federal rule-making, FDOT included Calendar Year 2018 targets for the five safety performance measures in the Highway Safety Improvement Program (HSIP) 2017 Annual Report. Supporting the State s goal and commitment to a vision of zero deaths, the FDOT safety targets were set at 0 for each of the performance measures. Additional narrative description was provided by FDOT for each measure to clarify the selection of the Vision Zero targets and expectation of future projects will ultimately improve safety conditions. FDOT also included a description of interim performance measures for each measure in order to satisfy the federal requirements. Table 1 lists the 2018 targets and interim performance measures listed in the 2017 Florida HSIP. TABLE FDOT SAFETY TARGETS Performance Measure Calendar Year 2018 Target Interim Performance Measure Number of Fatalities 0 3,052 Rate of Fatalities Number of Serious Injuries 0 20,861 Rate of Serious Injuries Non-motorized Fatalities and Serious Injuries Source: Florida Highway Safety Improvement Program 2017 Annual Report 0 3,447 Measuring Performance 2018 Safety Report DRAFT 9
10 Sarasota/Manatee MPO Response to MAP-21 Performance Measures The Sarasota/Manatee MPO analyzed safety data collected within the MPO planning area for the ten previous years related to safety performance measures in an effort to identify realistic, attainable safety performance targets based on historical data and projected trends. Following the FDOT s designation of targets for the five safety performance measures, the Sarasota/Manatee MPO adopted targets for the safety performance measures on January 22, The MPO, like FDOT, has taken a proactive approach in evaluating the trends in transportation safety data in an effort to identify a strategic multi modal transportation funding strategy to address the federally designated performance measures. As stated previously, establishing baseline conditions is the first step towards understanding the current data as the basis for formulating future year targets. Additionally, the MPO has taken steps to integrate performance measures into the project prioritization and selection process for funding through the Transportation Improvement Program in response to the performance measure requirements. Specifically, for the safety measures, the review of crash data has resulted in the identification of 20 corridors that were screened from a desktop assessment perspective to identify safety hot spot locations and potential countermeasure treatments. Six of these 20 locations were further reviewed through a mini road safety audit. Discussion of these assessments and conclusions are included following the review of the metropolitan safety targets for A first review of all crashes points to the nearly 18,000 crashes that occur annually on public roadways in Sarasota and Manatee counties as shown in Figure 1. While not all crashes result in a fatality or a serious injury, understanding overall crash trends can assist in determining patterns and appropriate strategies for reducing crashes in the future. Figure 2 illustrates how the trend of the top three crash types has changed on an annual basis. For these three factors, a plateauing occurred in 2010 through 2012 followed by a consistent and steady increase through This is an observed pattern that has been experienced in counties and states across the United States as travel conditions and patterns have increased along with the improving economy. Further details of this are discussed during the review of the performance measures. FIGURE 1 ANNUAL CRASH TRENDS ( ) Measuring Performance 2018 Safety Report DRAFT 10
11 FIGURE 2 ANNUAL TREND OF TOP THREE CRASH TYPES ( ) The remainder of this report documents the evaluation of historic data used for establishing safety performance measure targets along with an identification of locations and strategies that could be used to reverse the increasing trend of unsafe roadway conditions within the metropolitan area. The intended purpose of this data review is to accurately understand the current trends at the metropolitan level and to identify candidate priority corridors for implementing future safety improvements in support of the performance measure targets. Setting Safety Targets In recognition of FDOT establishing zero (0) as the statewide target for fatalities and the worldwide movement towards Vision Zero, the MPO established safety performance measure targets based on an evaluation of the historic and current crash trends. A review of three potential scenarios was conducted in order to demonstrate the potential long-term result through 2045 for the five safety performance measures. The three scenarios that were selected included a continuation of the recent trend, a 5% annual reduction, and an annual numerical reduction which could achieve zero fatalities and serious injuries by Through coordination with the MPO Citizens and Technical Advisory Committee and the MPO Board, a continuation of the recent trend was used to determine targets for the year averages. When considering targets for the year rolling average, it is important to remember that four of the five years have occurred which results in a trend showing a continued increase in fatalities and serious injuries in the near term. The MPO has made efforts to improve safe traveling conditions by partnering with FDOT to fund and implement road safety audits, establish new project prioritization criteria which elevate the importance of safety projects, and programming new safety projects in the Transportation Improvement Program. These efforts will aid in addressing the current safety conditions on the transportation system which will be realized over the next three to five years as more projects are funded and constructed. These efforts will need to continue and increase in order to overcome the safety related concerns. Measuring Performance 2018 Safety Report DRAFT 11
12 Evaluating how each performance measure has trended, allows the MPO to make a more informed decision in establishing future year targets and to identify areas for focused attention and resources in making the transportation system safer. Under the Federal rulemaking, the MPO has the ability to accept the statewide targets or establish a different target for the urbanized area. As discussed below, the Sarasota/Manatee MPO identified safety targets for each performance measure based on the historic trends and observations as listed in Table 2. TABLE SARASOTA/MANATEE MPO SAFETY TARGETS Performance Measure Calendar Year 2018 Target Year Average* Number of Fatalities Rate of Fatalities Number of Serious Injuries 1,879 1,540 Rate of Serious Injuries Non-motorized Fatalities and Serious Injuries *Based on observed crash trends from When comparing the fatality and serious injury rates for the Sarasota/Manatee MPO with the statewide rates shown in Table 1 there is a drastic difference with the MPO rate being almost double the rate of serious injuries. Information provided by FDOT to the MPOs for developing the performance measure targets shows that the rate of serious injuries for the Sarasota/Manatee area is one of ten MPOs with a rate higher than the statewide average for Discussed later, the recent increase in serious injuries and crashes has occurred simultaneously with an improved economy. Using data reported by the Department of Highway Safety and Motor Vehicles (DHSMV), data for each of the five performance measures was compiled for the two-county metropolitan planning area. Trends over the five-year rolling averages were observed and an estimate of future conditions was determined based on the recent historical trends. Number of Fatalities PM 1 Evaluating the historic fatalities from showed a leveling off of fatalities in 2014 following what had been a decline since Since 2014, fatalities within the metropolitan area have increased through A trend line included in Figure 3 indicates that the number of fatalities in the metropolitan area would be on par with 2016 fatalities which are the highest in more than a decade. Additionally, the 5-year averages have steadily increased since 2013, as shown in Figure 3, demonstrating the continued increase in the number of annual fatalities. Data provided by FDOT to the MPOs indicates that fatalities have increased statewide on an annual basis starting in 2013 placing the Sarasota/Manatee MPO in a similar situation as the other MPOs and counties in Florida. Florida is also not in a unique position. Across the country, the trend of increasing fatalities and serious injuries has been found to coincide with the reversal of the economic downturn in the 2009/2010 timeframe and the recent economic improvements. As the economy improved, gas prices have stabilized, and people have returned to driving as their means of transportation, resulting in greater opportunities for conflicts and crashes. Measuring Performance 2018 Safety Report DRAFT 12
13 Table 3 lists the annual number of fatalities and the resulting 5-year averages for the Sarasota/Manatee MPO. Based on this review of the trend, the target established for the year average number of fatalities is 121. FIGURE 3 NUMBER OF FATALITIES TABLE 3 ANNUAL FATALITIES AND 5-YEAR AVERAGES ( ) Fatalities * 2018** Annual Number Year Average *Estimated based on available data through 2017 and interpolated for 12 months. ** Based on observed crash trends from Measuring Performance 2018 Safety Report DRAFT 13
14 Rate of Fatalities PM 2 Fatality rates are calculated based on traffic volumes as a means of normalizing crash severity results against roadway conditions. Expressed as crashes per 100 million vehicle miles traveled (VMT), the fatality rate provides a basis for comparing crash severity conditions across varying geographic areas or roadway conditions. Shown in Figure 4, the rate of fatalities has fluctuated since 2010 with a generally increasing trend. With recent increases in the number of fatalities, the rate for the Sarasota/Manatee MPO now exceeds the statewide average with a trend line that indicates a continued increase. The rates shown between 2010 and 2016 are based on the number of fatalities from Figure 3 and historic VMT data listed in the FDOT Highway Mileage and Travel Report which can be found online at Future estimates of VMT were calculated using an average daily VMT/person estimate of 29.1, which was calculated using data from 2010 to This average was then applied to future population estimates for 2017 and 2018 based on the MPO s 2040 Long Range Transportation Plan population projections. Table 4 lists the fatality rates and resulting 5-year averages along with the VMT portion of the rate calculation expressed in terms of Million VMT. Based on this review of the trend, the target established for the year average fatality rate is FIGURE 4 RATE OF FATALITIES TABLE 4 ANNUAL RATE OF FATALITIES AND 5-YEAR AVERAGES ( ) Fatality Rate * 2018** Annual Rate Year Average Million VMT *Estimated based on available data through 2017 and interpolated for 12 months. ** Based on observed crash trends from Measuring Performance 2018 Safety Report DRAFT 14
15 Number of Serious Injuries PM 3 Evaluating the historic serious injuries from showed a leveling off of serious injuries in 2014 similar to the trends shown in the fatality data. Since 2014 however, the number of annual serious injuries has dramatically increased through The trend line included in Figure 5 points to an expected increase in serious injuries through As noted earlier, this increase has been experienced throughout Florida and the Sarasota/Manatee MPO is one of ten MPOs with a serious injury rate higher than the statewide average. The 5-year averages have steadily increased since 2013 as well, demonstrating the continued increase in the significant increase of serious injuries in recent years. Table 5 lists the annual number of serious injuries and the resulting 5-year averages. Based on this review of the trend, the target established for the year average number of serious injuries is 1,540. FIGURE 5 NUMBER OF SERIOUS INJURIES TABLE 5 ANNUAL SERIOUS INJURIES AND 5-YEAR AVERAGES ( ) Serious Injuries * 2018** Annual Number ,395 1,858 1,615 1,879 5-Year Average ,136 1,304 1,540 *Estimated based on available data through 2017 and interpolated for 12 months. ** Based on observed crash trends from Measuring Performance 2018 Safety Report DRAFT 15
16 Rate of Serious Injuries PM 4 Serious injury rates are calculated using the same methodology described previously for the fatality rate. Shown in Figure 6, the rate of serious injuries has increased steadily since The steep increase in the rate of serious injury crashes occurred during a time when travel or VMT was increasing as well. Table 6 lists the serious injury rates and the resulting 5-year averages along with the VMT portion of the rate calculation expressed in terms of Million VMT. Based on this review of the trend, the target established for the year average serious injury rate is FIGURE 6 RATE OF SERIOUS INJURIES TABLE 6 ANNUAL RATE OF SERIOUS INJURIES AND 5-YEAR AVERAGES ( ) Serious Injury * 2018** Rate Annual Rate Year Average Million VMT *Estimated based on available data through 2017 and interpolated for 12 months. ** Based on observed crash trends from Measuring Performance 2018 Safety Report DRAFT 16

17 Number of Non-motorized Fatalities and Serious Injuries PM 5 Fatalities and serious injury crashes involving non-motorized vehicles, bicyclists and pedestrians, represent a subset of the fatality and serious injury crashes. Since this performance measure represents a smaller data set, the percentage change on an annual basis can drastically differ from one reporting period to the next with small changes in the actual frequency of events, as seen in Figure 7. Like the fatality and serious injury performance measures, the nonmotorized crashes have increased in recent years with the expectation that these crashes could continue to increase. Table 7 lists the annual number of non-motorized fatalities and serious injuries along with the resulting 5- year averages. Based on this review of the trend, the target established for the year average number of non-motorized fatalities and serious injuries is 199. FIGURE 7 NUMBER OF NON-MOTORIZED FATALITIES AND SERIOUS INJURIES TABLE 7 NON-MOTORIZED FATALITIES/SERIOUS INJURIES AND 5-YEAR AVERAGES ( ) Serious Injuries and Fatalities * 2018** Annual Number Year Average *Estimated based on available data through 2017 and interpolated for 12 months. ** Based on observed crash trends from Measuring Performance 2018 Safety Report DRAFT 17

18 Segment Level Trends and Conditions The geographic information system (GIS) analysis was conducted using location information included in the Department of Highway Safety and Motor Vehicles (DHSMV) database for crashes in the two-county planning area for 2010 through This analysis included associating crashes with roadway segments and establishing data segments based on the occurrence of crash data for reporting and analysis. Map 2 illustrates the results of this analysis by showing the distribution and frequency of the fatal and serious injury crashes by location from 2010 to Higher frequency locations are indicated with red and orange colors, highlighting the locations where crashes over the seven-year period were a recurring concern. The single greatest area of concentration is in South Bradenton, in the area of Cortez Road and US 41. In addition to mapping all the fatal and serious injury crashes in this manner, a map of the non-motorized fatality and serious injury crashes was also compiled. Map 3 provides a slightly different pattern across the region when compared with Map 2. However, the more densely populated areas along US 41 and in particular the City of Sarasota and South Bradenton have the highest number of crashes shown for this period. MAP 2 FATAL AND SERIOUS INJURY CRASH FREQUENCY DISTRIBUTION ( ) Measuring Performance 2018 Safety Report DRAFT 18

19 MAP 3 NON-MOTORIZED FATAL/SERIOUS INJURY CRASH FREQUENCY DISTRIBUTION ( ) This association of crashes to roadway segments provided a method for identifying high crash segment locations as candidates for further review and consideration in developing strategies and safety projects to improve the future safety conditions of the HSIP performance measure data. High Priority Segments Best Practices Using the association of crashes to segments, a composite list of high crash corridors was compiled and reviewed by the MPO and FDOT. Using a per mile factor for normalizing the segment lengths, the list of state highways and off-system county and city roadways was combined. Based on the review of these segments by city and county staff, a list of the top 20 corridor locations was selected for conducting further analysis and review. These 20 corridors represented the locations which had the greatest number of fatalities and serious injuries and were identified as having a vehicular or non-motorized (bicycle/pedestrian) area of concern. Additionally, local agency staff requested specific locations be included based on recent crashes. Table 8 lists the 20 corridors that were identified as high priority crash corridor locations for conducting further review and assessments of the crash trends and conditions. Map 4 provides an illustration of the location of the 20 corridors. Measuring Performance 2018 Safety Report DRAFT 19
20 Location Number TABLE 8 TOP 20 HIGH PRIORITY CRASH LOCATIONS* Jurisdiction ON STREET FROM TO Manatee County Manatee County Sarasota County 4 City of Sarasota City of Sarasota / Sarasota County Sarasota County Sarasota County Manatee County Manatee County Manatee County 11 City of Sarasota Manatee County Sarasota County Cortez Road/ 44th Ave W Calm Harbor St 1st St W SR 70/ 53rd Ave US 41/ 14th St W 301 Blvd/ 15th St E Swift Road Parma Street Grand Cayman US 301/ Washington Blvd US 301 / Washington Blvd 10th St 30th St 30th St Before Desoto Road Bahia Vista St Carter Ave Grand Blvd Wilkinson Rd Atwood Cay Cir Cattleman Rd Cortez Road/ 44th Ave W 26th Street W 82nd St W 56th Avenue 30th St W 9th Street E Twin Oaks Boulevard US 301 SR 780/ Fruitville Road 26th Street W Ocean Blvd/ Beach Rd School Ave Cortez Road/ 44th Ave W Tenacity Ln 14 City of Sarasota Main St Bayfront Dr. 15 Venice Albee Farm Rd Bay Breeze Health and Rehab Center Driveway Cortez Road/ 44th Ave W Bearded Oaks Dr. 26th Avenue W Hour Glass Way US 301/ Washington Blvd W. Lucaya Ave 16 Manatee 15th St E (301 Blvd County E) SR 70 (53rd Ave) 26th Ave E 17 Holmes Beach Gulf Drive 58th Street Holmes Blvd 18 Venice Pinebrook Road Hatchett Creek Road Lucaya Ave 19 Anna Maria N. Bay Blvd Pine Ave Poinsettia Rd 20 North Port S. Biscayne Boulevard E Hyde Park Ave Pan American Blvd Road Safety Audit locations *The locations listed on this table are not in rank order. Measuring Performance 2018 Safety Report DRAFT 20

21 MAP 4 TOP 20 HIGH PRIORITY CRASH LOCATIONS Measuring Performance 2018 Safety Report DRAFT 21
22 For each of these 20 corridors, a desktop assessment review was conducted. This review evaluated the crash trends and roadway conditions, provided an overview of the crash causal factors, and identified issues and opportunities for mitigating and correcting the crashes. A complete summary of the findings from these assessments has been included in the technical supplement to this report. It is intended that these reviews provide targeted locations and strategies for future FDOT safety funding applications through the MPO s Project Prioritization and Transportation Improvement Program processes. While each of the Top 20 reviewed locations includes specific recommendations, itemized in the desktop review documents, a number of common observations were made for many of the locations. Those observations include the following patterns of fatal and incapacitating injury crashes: Left-turn crashes at permissive left-turn signalized intersections versus multi-lane opposing through volume. Angle crashes at signalized intersections with no backplates or with black backplates. Left-turn and angle crashes in signalized intersection influence area associated with driveways on undivided approaches to signalized intersections. Pedestrian and bicycle crashes at signalized intersections with faded standard (parallel bars) crosswalk markings Bicycle crashes mid-block riding in sidewalk contraflow Recommended systemic mitigation strategies for these observations include the following: Systemic Vehicular User Strategies Systemic vehicular focused crash mitigation strategies include: Traffic Signal Backplates Traffic Signal Head Placement Flashing yellow arrow protected/permissive traffic signals Access management Traffic Signal Backplates Backplates are added to traffic signal heads to improve the visibility of the illuminated face of the signal. The contrasting background of a backplate is especially beneficial on east-west facing signal heads during the morning and evening when the sun s glare can impair driver vision. Backplates can be made more visible by framing them with a retroreflective boarder, which can help drivers detect the presence of a signalize intersection at night or in low-light conditions (see Figure 8). According to the Federal Highway Administration s (FHWA) Crash Modification Factor (CMF) Clearinghouse, adding 3-inch yellow reflective sheeting to signal backplates yields an expected crash reduction of 15 percent of crashes at signalized intersections. Section of the FDOT Plans Preparation Manual (PPM) states: Louvered backplates shall be installed on all signal sections for all approaches. Retroreflective backplate borders are required for all backplates where the posted speed for the approach is 45 mph or greater. Retroreflective borders are encouraged on all backplates where the posted speed for the approach is less than 45 mph. Measuring Performance 2018 Safety Report DRAFT 22


.")
23 FIGURE 8 - TRAFFIC SIGNAL WITH STANDARD AND RETROREFLECTIVE BACKPLATES Source: safety.fhwa.dot.gov Traffic Signal Head Placement Traffic signal heads should be visible from all lanes on the approach. Increasing the number of signal heads at an intersection is associated with a decrease in red-light running and rear-end collisions. On the topic of signal head placement, the FDOT PPM (Section ) states: For two-lane approaches, a three-section head shall be placed over the center of each lane. If a single left-turn lane is provided and protected/permissive phasing is used, a five-section cluster can serve as one of the two indications required for the through lane. For three or more lane approaches, a three-section head shall be placed over the center of each lane. If a single left-turn lane is provided, a five-section cluster can serve as one of the indications required for the inside through lane (see Figure 9). FIGURE 9 - SIGNAL HEAD LANE PLACEMENT Flashing Yellow Arrow The ability for motorists to successfully make left turns is critical to the safety and efficiency of signalized intersections. In order to improve operation of traffic signals, the Federal Highway Administration (FHWA) has adopted the flashing yellow left-turn arrow as a national standard. A comprehensive National Cooperative Highway Research Program (NCHRP) study demonstrated that flashing yellow left-turn arrows are superior to traditional yield-on-green indications in terms of driver understanding and compliance, reducing severe crashes by 25 percent, while at the same time delivering greater operational efficiency (less delay). According to the Federal Highway Administration s (FHWA) Crash Modification Factor (CMF) Measuring Performance 2018 Safety Report DRAFT 23


24 Clearinghouse, installing left-turn flashing yellow arrow signals and supplemental traffic signs yields an expected crash reduction of 15 percent of left turn crashes and 10 percent of other crashes at signalized intersections. The flashing yellow arrow communicates to motorists that they must proceed with care and decide if there is a sufficient gap in oncoming traffic to safely make a left turn. FIGURE 10 - TRADITIONAL VS FLASHING YELLOW ARROW FIGURE 11 - FLASHING YELLOW ARROW OPERATION Access Management Access management refers to the design, application, and control of entry and exit points along a roadway. Every intersection, from a signalized intersection to an unpaved driveway, has the potential for conflicts between vehicles, pedestrians, and bicycles. The number and types of conflict points or locations where the travel paths of two users intersect influence the safety performance of the intersection or driveway. The following access management strategies can be used individually or in combination with one another: Driveway closure, consolidation, or relocation. Limited-movement designs for driveways (such as right-in/right-out only). Raised medians that preclude across-roadway movements. Turn lanes (i.e., left-only, right-only, or interior two-way left). Successful corridor access management involves balancing overall safety and corridor mobility for all users along with the access needs of adjacent land uses. According to the Federal Highway Measuring Performance 2018 Safety Report DRAFT 24
 crashes typically do not exhibit clear clustering; as such, a systemic approach is followed to mitigate the crashes.")
25 Administration s (FHWA) Crash Modification Factor (CMF) Clearinghouse, creating directional median openings to allow left-turns and U-turns yields an expected crash reduction of 51 percent of crashes. Systemic Vulnerable User Strategies Pedestrian and bicycle (vulnerable road user) crashes typically do not exhibit clear clustering; as such, a systemic approach is followed to mitigate the crashes. Typical systemic pedestrian and bicycle crash countermeasures include the following: Street Lighting Sidewalk Connections Signage Street Lighting Roadway lighting is a critical component of roadway safety and should be designed to provide adequate illumination for all roadway users. Many factors affect roadway lighting, such as location, orientation, intensity, color, ambient light, etc., and its effectiveness in increasing safety. New research on the placement of lighting in relationship to crosswalks is summarized in FHWA s Informational Report on Lighting Design for Midblock Crosswalks. According to the Federal Highway Administration s (FHWA) Crash Modification Factor (CMF) Clearinghouse, installing intersection lighting yields an expected crash reduction of 12 percent of nighttime crashes at intersections; installing new lighting yields a 49 percent reduction of nighttime crashes. Figure 12 provides an example of the preferred lighting locations. FIGURE 12 - INTERSECTION LIGHTING LAYOUT DESIGN Source: safety.fhwa.dot.gov Sidewalk Connections Sidewalks are the backbone of the non-motorized transportation network. They provide pedestrians and, often, less confident/experienced bicyclists with a dedicated facility that is separated from vehicular traffic. Sidewalks should be a part of every new or reconstructed roadway, and an effort should be made to retrofit existing roadways that currently do not have sidewalks, especially arterial and collector roadways with no paved shoulder. Sidewalks also play a role in encouraging non-motorized roadway users to cross at signalized intersections and other preferred crossing points by making access to these points more convenient. According to the Federal Highway Administration s (FHWA) Crash Modification Factor (CMF) Measuring Performance 2018 Safety Report DRAFT 25


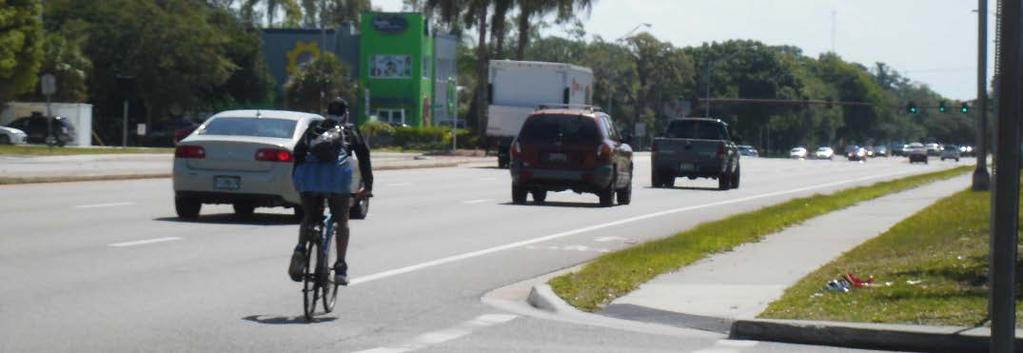
26 Clearinghouse, installing sidewalk to avoid walking a roadway yields an expected crash reduction of between 65 and 89 percent of vehicle/pedestrian crashes along roadways. Signage Signs can be used to warn drivers and other roadway users of threats and also can serve as visual reminders of drivers are required to act in specific circumstances. Signs such as the MUTCD R10-15 sign (see Figure 13) remind right-turning drivers of their responsibility to yield to pedestrians. However, the placement of signs should be done with care; the overuse of signs could result in drivers becoming desensitized and could lead to noncompliance. FIGURE 13 - MUTCD R10-15 TURNING VEHICLES YIELD TO PEDESTRIANS SIGN Bicycle warning signs (see Figure 14) can be placed along driveways indicating to drivers to watch for bicyclists, and they can be placed in view of bicyclists along the bike lane indicating to bicyclists to watch for turning cars. FIGURE 14 - BIKE WARNING Signs directing cyclists (see Figure 15) can be placed on the back of speed limit signs in view of contraflow bicyclists to encourage cyclists to travel along bike lanes and sidewalks with traffic. FIGURE 15 RIDE WITH TRAFFIC Measuring Performance 2018 Safety Report DRAFT 26
27 Systemic Senior Road User Strategies Special consideration is given to the needs of aging road users due to age-related diminished capabilities that may make it more difficult to negotiate intersections. Aging pedestrians and drivers face a variety of concerns, including decreased visual acuity, increased risk of falls, slowed walking and crossing speeds, and decreased ability to judge safe gaps and avoid turning vehicles. Pertinent proven and promising practices from FHWA s Handbook for Designing Roadways for the Aging Population include the following items: Delineation of Edge Lines and Curbs Left-turn Traffic Control for Signalized Intersections Street Name Signs Intersection Lighting Pedestrian Crossings Signal Head Visibility High Visibility Crosswalks Reduce Left-turn Conflict Intersections Flashing Yellow (or Red) Arrow Route Shield Markings at Major Freeway Junctions Utilize Highly Retroreflective Marking Material Desktop Assessments The desktop assessments provided a cross-tabulation of the crash type, causal factors, and driving conditions in tabular and graphic form along with a collision diagram for the corridor location. Of these 20 locations, 6 were selected for road safety audit (RSA) field reviews by multi-disciplinary teams in order to further evaluate the conditions of the roadway. These multi-disciplinary teams included local law enforcement, agency planning and engineering staff, FDOT representatives, and MPO staff. The six locations selected for the RSA field reviews were combined into 4 sites based on location and continuity. Two locations in Manatee County and two locations in Sarasota County were selected as listed below. 44th Ave W / Cortez Road from 82 nd Ave West to 1 st Ave West (#1 and #8 from Table 4) 53 rd Ave West (SR 70) from 14 th St West (US 41) to 15 th St East (#2 from Table 4) Washington Blvd (US 301) from 10 th St to Desoto Rd (#4 and #5 from Table 4) Fruitville Rd (SR 780) from Lime Ave to Beneva Rd (#11 from Table 4) Listed in the technical supplement to this report, a complete summary for each of these locations includes a detailed review of the field audit findings and recommendations. Measuring Performance 2018 Safety Report DRAFT 27


28 Sarasota/Manatee Metropolitan Planning Organization th Street East, Sarasota, FL Measuring Performance 2018 Safety Assessment Report Tindale Oliver 1000 North Ashley Drive, Suite 400, Tampa FL
National Performance Management Measures. April 20, 2016 Webinar
 Safety Performance Measures September 26, 2016 National Performance Management Measures April 20, 2016 Webinar Highway Safety Improvement Program Performance Measures 1 2 3 4 5 Number of fatalities Rate
PRELIMINARY DRAFT FIRST AMENDMENT TO VISION 2050: A REGIONAL LAND USE AND TRANSPORTATION PLAN FOR SOUTHEASTERN WISCONSIN
 PRELIMINARY DRAFT FIRST AMENDMENT TO VISION 2050: A REGIONAL LAND USE AND TRANSPORTATION PLAN FOR SOUTHEASTERN WISCONSIN ESTABLISHING TARGETS FOR FEDERAL PERFORMANCE MEASURES: HIGHWAY SAFETY SOUTHEASTERN
Pinellas County Metropolitan Planning Organization (MPO) 2014 Crash Data Report
 2014 Crash Data Report") Pinellas County Metropolitan Planning Organization (MPO) 2014 Crash Data Report MPO Board July 8, 2015 2 Crash Data Collection Motorcycle drove between stopped cars, ran a red light and collided with a
Pinellas County Metropolitan Planning Organization (MPO) 2014 Crash Data Report MPO Board July 8, 2015 2 Crash Data Collection Motorcycle drove between stopped cars, ran a red light and collided with a
Acknowledgements. Mr. David Nicol 3/23/2012. Daniel Camacho, P.E. Highway Engineer Federal Highway Administration Puerto Rico Division
 Daniel Camacho, P.E. Highway Engineer Federal Highway Administration Puerto Rico Division Acknowledgements Mr. David Nicol Director, FHWA Office of Safety FHWA Office of Safety http://safety.fhwa.dot.gov/provencountermeasures/
FLORIDA DEPARTMENT OF TRANSPORTATION DISTRICT 7 DISTRICT WIDE BICYCLE/PEDESTRIAN ACCESS TO TRANSIT SAFETY ASSESSMENT AND IMPROVEMENT PLAN
 FLORIDA DEPARTMENT OF TRANSPORTATION DISTRICT 7 DISTRICT WIDE BICYCLE/PEDESTRIAN ACCESS TO TRANSIT SAFETY ASSESSMENT AND IMPROVEMENT PLAN TRANSIT SAFETY ASSESSMENT SR 55/US 19 AT 80 TH AVE N DRAFT JUNE
Designing for Pedestrians: An Engineering Symposium. Rutgers University March 21, 2013
 Designing for Pedestrians: An Engineering Symposium Rutgers University March 21, 2013 The Problem 2 Pedestrian Fatalities Pedestrian Fatalities by Year in US (1994-2010) 6000 5000 4000 3000 2000 1000 0
Pinellas County Safety Initiatives
 Florida Department of TRANSPORTATION Pinellas County Safety Initiatives Whit Blanton, FAICP Pinellas County MPO A Distinctive County A unique geography Multi-jurisdictional Key demographics seniors and
Sarasota/Manatee MPO Project Priorities 2016 Adopted April 25, 2016
 All projects on the following priority lists should be implemented in the priority sequence listed, as consistent with the fiscal constraints identified in the MPO s adopted Long Range Transportation Plan
APPENDIX C. Systems Performance Report C-1
 APPENDIX C Systems Performance Report C-1 System Performance Report & Requirements According to the FAST Act, a long range transportation plan needs to include a system performance report and subsequent
Broad Street Bicycle Boulevard Design Guidelines
 Broad Street Bicycle Boulevard Design Guidelines Building from the strategies introduced in the 2013 Bicycle Transportation Plan and community input received thus far, City Transportation Staff have identified
APPENDIX A: Complete Streets Checklist DRAFT NOVEMBER 2016
 APPENDIX A: Complete Streets Checklist DRAFT NOVEMBER 2016 Complete Streets Checklist MetroPlan Orlando s Complete Streets Checklist is an internal planning tool for staff to further implementation of
Closing Plenary Session
 TRAFFIC SAFETY CONFERENCE Closing Plenary Session June 9, 2017 Las Colinas, TX Order of Report Out June 9, 2017 Las Colinas, TX Distracted Driving Prioritized Countermeasures Countermeasure 4a Systemically
LANE ELIMINATION PROJECTS
 PRESENTATION OUTLINE Lane Elimination Considerations Districts 4 & 7 Draft Lane Elimination Processes FDOT Lane Elimination Guidelines Example Projects D4 Case Study: SR A1A (Ft. Lauderdale) D7 Case Study:
Florida s Intersection Safety Implementation Plan (ISIP)
") Florida Department of TRANSPORTATION Florida s Intersection Safety Implementation Plan (ISIP) Alan El-Urfali, PE State Traffic Engineering and Operations Office March 28, 2017 Intersection Safety Implementation
Florida Department of TRANSPORTATION Florida s Intersection Safety Implementation Plan (ISIP) Alan El-Urfali, PE State Traffic Engineering and Operations Office March 28, 2017 Intersection Safety Implementation
AMATS Complete Streets Policy
 AMATS Complete Streets Policy Table of Contents: Section 1. Definition of Complete Streets Section 2. Principles of Complete Streets Section 3. Complete Streets Policy Section 4. Consistency Section 5.
Bicycle RSAs: How to Conduct Road Safety Audits and How to Use Them to Promote Bicyclist Safety. Dan Nabors, PE, VHB Bill DeSantis, PE, VHB
 PBIC Webinar Bicycle RSAs: How to Conduct Road Safety Audits and How to Use Them to Promote Bicyclist Safety [IMAGE] Dan Nabors, PE, VHB Bill DeSantis, PE, VHB Sept. 26, 2013, 2 pm Today s Presentation
Pedestrian Safety Action Plan Bicycle Safety Action Plan
 Pedestrian Safety Action Plan Bicycle Safety Action Plan January 24, 2017 VISION: Safe travel for all MISSION STATEMENT: Partner with the community to plan and fund transportation projects and programs
Abstract. Background. protected/permissive operation. Source: Google Streetview, Fairview/Orchard intersection
 ITE 2015 Western District Annual Meeting Ada County Highway District s Flashing Yellow Arrow Initiative Primary Author: Tim Curns, PE Ada County Highway District Traffic Engineer Author: Andrew Cibor,
Pedestrian Safety Guide for Transit Agencies
 Pedestrian Safety Guide for Transit Agencies FDOT/FTPA/CUTR Professional Development Workshop June 15, 2010 1 Purpose Presentation Overview Bus Stop Location and Design Process/Partnership 2 Purpose Every
MEMORANDUM. Charlotte Fleetwood, Transportation Planner
 MEMORANDUM Date: Updated August 22, 2017 To: Organization: Charlotte Fleetwood, Transportation Planner Boston Transportation Department From: Jason DeGray, P.E., PTOE, Regional Director of Engineering
M-58 HIGHWAY ACCESS MANAGEMENT STUDY Mullen Road to Bel-Ray Boulevard. Prepared for CITY OF BELTON. May 2016
 M-58 HIGHWAY ACCESS MANAGEMENT STUDY Prepared for CITY OF BELTON By May 2016 Introduction Missouri State Highway 58 (M-58 Highway) is a major commercial corridor in the City of Belton. As development has
Chapter 2: Standards for Access, Non-Motorized, and Transit
 Standards for Access, Non-Motorized, and Transit Chapter 2: Standards for Access, Non-Motorized, and Transit The Washtenaw County Access Management Plan was developed based on the analysis of existing
Safety Emphasis Areas & Safety Project Development Florida Department of Transportation District Seven Tampa Bay
 Safety Emphasis Areas & Safety Project Development Florida Department of Transportation District Seven Tampa Bay Stephen L. Benson, AICP, CNU-A FDOT District Seven Safety Office Presentation Overview Safety
PEDESTRIAN/BICYCLIST CRASH ANALYSIS 2015
 PEDESTRIAN/BICYCLIST CRASH ANALYSIS 2015 Central Arkansas Regional Transportation Study Table of Contents Executive Summary... 3 CARTS Pedestrian/Bicycle Crash Analysis... 3 Report Format... 3 Results...
Pavement Markings (1 of 3)
") Pavement Markings (1 of 3) DESCRIPTION AND DEFINITION Disadvantages Relatively high cost (over typical Crash reduction as yet unknown painted edge line) No tactile effect The STOP AHEAD pavement marking
Pavement Markings (1 of 3) DESCRIPTION AND DEFINITION Disadvantages Relatively high cost (over typical Crash reduction as yet unknown painted edge line) No tactile effect The STOP AHEAD pavement marking
Chapter 5 DATA COLLECTION FOR TRANSPORTATION SAFETY STUDIES
 Chapter 5 DATA COLLECTION FOR TRANSPORTATION SAFETY STUDIES 5.1 PURPOSE (1) The purpose of the Traffic Safety Studies chapter is to provide guidance on the data collection requirements for conducting a
Existing Conditions. Date: April 16 th, Dan Holderness; Coralville City Engineer Scott Larson; Coralville Assistant City Engineer
 Date: April 16 th, 2015 To: From: Re: Dan Holderness; Coralville City Engineer Scott Larson; Coralville Assistant City Engineer Darian Nagle-Gamm, Traffic Engineering Planner Highway 6 (2 nd Street) /
City of Wayzata Comprehensive Plan 2030 Transportation Chapter: Appendix A
 A1. Functional Classification Table A-1 illustrates the Metropolitan Council s detailed criteria established for the functional classification of roadways within the Twin Cities Metropolitan Area. Table
Welcome! San Jose Avenue Open House August 25, 2015
 Welcome! San Jose Avenue Open House August 25, 2015 Vision Zero The City and County of San Francisco adopted Vision Zero San Francisco Vision Zero High Injury Network as a policy in 2014, committing an
SR/CR A1A PEDESTRIAN SAFETY & MOBILITY STUDY RIVER TO SEA TRANSPORTATION PLANNING ORGANIZATION
 SR/CR A1A PEDESTRIAN SAFETY & MOBILITY STUDY RIVER TO SEA TRANSPORTATION PLANNING ORGANIZATION 2016 Florida Section ITE Annual Summer Meeting June 24, 2016 Today s Presenters Lois Bollenback Executive
CITY OF COCOA BEACH 2025 COMPREHENSIVE PLAN. Section VIII Mobility Element Goals, Objectives, and Policies
 CITY OF COCOA BEACH 2025 COMPREHENSIVE PLAN Section VIII Mobility Element Goals, Objectives, and Policies Adopted August 6, 2015 by Ordinance No. 1591 VIII MOBILITY ELEMENT Table of Contents Page Number
ADA Transition Plan. City of Gainesville FY19-FY28. Date: November 5, Prepared by: City Of Gainesville Department of Mobility
 ADA Transition Plan FY19-FY28 Date: November 5, 2018 Prepared by: City Of Gainesville Department of Mobility 1.0 INTRODUCTION 1.1 BACKGROUND The federal statute known as the Americans with Disabilities
Route 29 Corridor Assessment Update. Development of Possible Solutions
 Route 29 Corridor Assessment Update Development of Possible Solutions Public Workshop #3 October 27, 2016 Purpose of Developing Possible Solutions Recap of where we ve been and timeline for moving forward
REGIONAL BICYCLE AND PEDESTRIAN DESIGN GUIDELINES
 REGIONAL BICYCLE AND PEDESTRIAN DESIGN GUIDELINES November 16, 2011 Deb Humphreys North Central Texas Council of Governments Bicycle and Pedestrian Advisory Committee Snapshot of the Guide 1. Introduction
Access Management in the Vicinity of Intersections
 Access Management in the Vicinity of Intersections FHWA-SA-10-002 Technical Summary Photo: Ralph Bentley (used with permission) 0 Access Management is: The design, implementation and management of entry
Pedestrian & Bicycle Safety Innovations & Applications
 Pedestrian & Bicycle Safety Innovations & Applications County Engineers Association of Maryland Spring, 2017 Conference May 25, 2017 George Branyan Pedestrian Program Coordinator District Department of
Effects of Traffic Signal Retiming on Safety. Peter J. Yauch, P.E., PTOE Program Manager, TSM&O Albeck Gerken, Inc.
 Effects of Traffic Signal Retiming on Safety Peter J. Yauch, P.E., PTOE Program Manager, TSM&O Albeck Gerken, Inc. Introduction It has long been recognized that traffic signal timing can have an impact
Access Location, Spacing, Turn Lanes, and Medians
 Design Manual Chapter 5 - Roadway Design 5L - Access Management 5L-3 Access Location, Spacing, Turn Lanes, and Medians This section addresses access location, spacing, turn lane and median needs, including
ADOT Statewide Bicycle and Pedestrian Program Summary of Phase IV Activities APPENDIX B PEDESTRIAN DEMAND INDEX
 ADOT Statewide Bicycle and Pedestrian Program Summary of Activities APPENDIX B PEDESTRIAN DEMAND INDEX May 24, 2009 Pedestrian Demand Index for State Highway Facilities Revised: May 29, 2007 Introduction
City of Jacksonville Mobility Fee Update
 City of Jacksonville Mobility Fee Update 2017 Preliminary Analysis May 3, 2017 Carnival Cruise lines photo credit Presentation Overview Public Outreach Process Pedestrian and Bicycle Master Plan Study
Application of Demographic Analysis to Pedestrian Safety. Center for Urban Transportation Research University of South Florida
 Application of Demographic Analysis to Pedestrian Safety BDV25 TWO 977 30 Pei Sung Lin, Ph.D., P.E., PTOE, FITE Program Director Achilleas Kourtellis, Ph.D. Senior Research Associate CUTR, University of
FLORIDA STRATEGIC HIGHWAY SAFETY PLAN
 FLORIDA STRATEGIC HIGHWAY SAFETY PLAN 1 FLORIDA STRATEGIC HIGHWAY SAFETY PLAN Presenter: Joe Santos State Safety Engineer FDOT State Safety Office 2 Presentation 3/28/2017 3 FLORIDA STRATEGIC HIGHWAY SAFETY
VISION ZERO ACTION PLAN
 PALM BEACH Transportation Planning Agency VISION ZERO ACTION PLAN TPA Advisory Committee Meetings March 2019 PURPOSE Present the Data Analysis Key Findings and the Action Items from the Draft Action Plan
SR 693 (Pasadena Avenue) Corridor Study from Shore Drive South to 66 th Street
 Corridor Study from Shore Drive South to 66 th Street") Welcome and Introduction Sign-in and comment sheets Restrooms and exits Meeting agenda and timeline Meeting goals / expectations Provide input to guide study recommendations Actively participate throughout
Welcome and Introduction Sign-in and comment sheets Restrooms and exits Meeting agenda and timeline Meeting goals / expectations Provide input to guide study recommendations Actively participate throughout
Proven Safety Countermeasures. FHWA Office of Safety January 12, :00 p.m. to 2:00 p.m. Eastern Time
 Proven Safety Countermeasures FHWA Office of Safety January 12, 2012 1:00 p.m. to 2:00 p.m. Eastern Time Introduction and Background While States should still be considering the application of all of the
Proposed. City of Grand Junction Complete Streets Policy. Exhibit 10
 Proposed City of Grand Junction Complete Streets Policy Exhibit 10 1 City of Grand Junction Complete Streets Policy Vision: The Complete Streets Vision is to develop a safe, efficient, and reliable travel
Access Management Regulations and Standards
 Access Management Regulations and Standards Efficient highway operation Reasonable property access Concept of Access Management The way to manage access to land development while simultaneously preserving
UNCONTROLLED PEDESTRIAN CROSSING GUIDELINES
 City and County of Denver UNCONTROLLED PEDESTRIAN CROSSING GUIDELINES Prepared for: Prepared by: Adopted September 2016 This page is intentionally left blank. Contents for Denver Uncontrolled Pedestrian
Bay to Bay Boulevard Complete Streets Project
 Bay to Bay Boulevard Complete Streets Project Dale Mabry Highway to Bayshore Boulevard February 08, 2018 Photo Source: Tampa Bay Times Alessandra Da Pra Meeting Format Introduction Resurfacing Information
GOAL 2A: ESTABLISH AND MAINTAIN A SAFE, CONVENIENT, AND EFFICIENT MULTI-MODAL TRANSPORTATION SYSTEM TO MOVE PEOPLE AND GOODS THROUGHOUT THE CITY.
 2. TRANSPORTATION ELEMENT The purpose of this element is to assist in establishing an adequate transportation system within the City and to plan for future motorized and non-motorized traffic circulation
City of San Diego Vision Zero Draft Strategic Plan FY 2017
 City of San Diego Vision Zero Draft Strategic Plan FY 2017 Engineering Objective: To develop and implement a strategy that employs best planning, design and engineering practices. Background: Over the
Road Diets FDOT Process
 Florida Department of TRANSPORTATION Road Diets FDOT Process Humberto Castillero, PE, PTOE Roadway Design Office Purpose of Guide Develop a statewide lane elimination review process Balance state & local
FEDERAL HIGHWAY ADMINISTRATION APPLICATION
 FEDERAL HIGHWAY ADMINISTRATION APPLICATION REQUEST FOR PERMISSION TO EXPERIMENT WITH A BICYCLE BOX INTERSECTION TREATMENT Submitted by: City of Columbus Department of Public Service Date: June 26, 2009
Goal 3: Foster an environment of partnerships and collaboration to connect our communities and regions to one another.
 Non-Motorized Transportation Plan (NMTP) Draft Vision, Goal and,, Tri-County Regional Planning Commission (TCRPC) Purpose The purpose of the Tri-County Regional Planning Commission (TCRPC) Non-Motorized
Active Transportation Facility Glossary
 Active Transportation Facility Glossary This document defines different active transportation facilities and suggests appropriate corridor types. Click on a facility type to jump to its definition. Bike
Route 7 Corridor Study
 Route 7 Corridor Study Executive Summary Study Area The following report analyzes a segment of the Virginia State Route 7 corridor. The corridor study area, spanning over 5 miles in length, is a multi
What Engineering Can Do for You! Low Cost Countermeasures for Transportation Safety
 What Engineering Can Do for You! Low Cost Countermeasures for Transportation Safety Adam Larsen Safety Engineer Federal Highway Administration 360-619-7751 Adam.Larsen@DOT.GOV Adam Larsen TTP Safety Engineer
ACTIVE TRANSPORTATION
 ACTIVE TRANSPORTATION Mobility 2040 Supported Goals Improve the availability of transportation options for people and goods. Support travel efficiency measures and system enhancements targeted at congestion
City of Novi Non-Motorized Master Plan 2011 Executive Summary
 City of Novi Non-Motorized Master Plan 2011 Executive Summary Prepared by: February 28, 2011 Why Plan? Encouraging healthy, active lifestyles through pathway and sidewalk connectivity has been a focus
The 2009 Manual on Uniform Traffic Control Devices (MUTCD) (Brief) Highlights for Arizona Practitioners. Arizona Department of Transportation
 (Brief) Highlights for Arizona Practitioners. Arizona Department of Transportation") The 2009 Manual on Uniform Traffic Control Devices (MUTCD) (Brief) Highlights for Arizona Practitioners Arizona Department of Transportation New 2009 MUTCD 9 Parts (down from 10 in 2003) 816 pages (up
The 2009 Manual on Uniform Traffic Control Devices (MUTCD) (Brief) Highlights for Arizona Practitioners Arizona Department of Transportation New 2009 MUTCD 9 Parts (down from 10 in 2003) 816 pages (up
Designing for Pedestrian Safety in Washington, DC
 Designing for Pedestrian Safety in Washington, DC February 25, 2014 George Branyan Pedestrian Program Coordinator District Department of Transportation DC Journey to work mode split: 2012 Means of Transportation
APPENDIX F. Safety Planning. October 2018
 APPENDIX F Safety Planning October 2018 APPENDIX F: SAFETY PLANNING October 17, 2018 ABOUT VISUALIZE 2045 & THE TPB Visualize 2045 is the federally required long-range transportation plan for the National
Alternative Traffic Calming Methods
 Alternative Traffic Calming Methods In-street Pedestrian Crossing Sign Cost: approximately $300 per sign not including the installation cost Advantages of in-street pedestrian crossing signs 1. Typically
180 Grand Avenue, Suite x117 Dowling Associates, Inc.
 180 Grand Avenue, Suite 250 510.839.1742 x117 Oakland, CA 94612 510.839.0871 fax www.dowlinginc.com mbowman@dowlinginc.com Dowling Associates, Inc. Date: Memorandum To: CC: From: Ms. Leah Greenblat City
Agenda. Overview PRINCE GEORGE S PLAZA METRO AREA PEDESTRIAN PLAN
 PRINCE GEORGE S PLAZA METRO AREA PEDESTRIAN PLAN May 28, 2008 Agenda Welcome and introductions Project overview and issue identification Planning context and strengths Design challenges and initial recommendations
Creating Complete Streets to Accommodate All Users
 Creating Complete Streets to Accommodate All Users Peter Lagerwey, Toole Design Group plagerwey@tooledesign.com Brian Dougherty, Seattle DOT brian.dougherty@seattle.gov International Conference on Urban
METHODOLOGY. Signalized Intersection Average Control Delay (sec/veh)
") Chapter 5 Traffic Analysis 5.1 SUMMARY US /West 6 th Street assumes a unique role in the Lawrence Douglas County transportation system. This principal arterial street currently conveys commuter traffic
Chapter 5 Traffic Analysis 5.1 SUMMARY US /West 6 th Street assumes a unique role in the Lawrence Douglas County transportation system. This principal arterial street currently conveys commuter traffic
Bicycle Facilities Planning
 Bicycle Facilities Planning Overview Types of Cyclists Purpose for Riding Types of Facilities Bike Lanes Bicycle Boulevards Cycle Tracks Intersections Signals Signing and Marking Discussion Types of Bicyclists
MUTCD Part 6G: Type of Temporary Traffic Control Zone Activities
 MUTCD Part 6G: Type of Temporary Traffic Control Zone Activities 6G.01 Typical Applications Each temporary traffic control (TTC) zone is different. Many variables, such as location of work, highway type,
UPDATES, SUCCESSES, AND WHAT S AHEAD ON THE ROAD TO ZERO
 Vol. 1, Issue 1 I Spring 2018 www.planhillsborough.org/vision-zero S A F E S T R E E T S N O W H I L L S B O R O U G H UPDATES, SUCCESSES, AND WHAT S AHEAD ON THE ROAD TO ZERO TRACKING PROGRESS This is
Scope of Services BICYCLE/PEDESTRIAN PLAN FOR THE INDIAN RIVER COUNTY MPO
 I. INTRODUCTION Scope of Services BICYCLE/PEDESTRIAN PLAN FOR THE INDIAN RIVER COUNTY MPO The Indian River County Metropolitan Planning Organization (MPO) Bicycle and Pedestrian Plan was completed in 1997.
REDUCING COLLISIONS AT HIGH CRASH LOCATIONS
 REDUCING COLLISIONS AT HIGH CRASH LOCATIONS Presented by Nazir Lalani P.E. Traffex Engineers Inc. N_lalani@hotmail.com ACCIDENTS AND SAFETY Why is safety important? Safety components Who is responsible?
SAFETY PERFORMANCE MEASURES AND TARGET SETTING. Transportation Subcommittee September 15, 2017
 SAFETY PERFORMANCE MEASURES AND TARGET SETTING Transportation Subcommittee September 15, 2017 ACTION REQUESTED No action is requested. This item is for presentation and discussion. PREVIOUS ACTION Presented
Planning Guidance in the 2012 AASHTO Bike Guide
 Planning Guidance in the 2012 AASHTO Bike Guide Presentation by: RJ Eldridge Peter Lagerwey August 22, 2012 WEBINAR 2: PLANNING GUIDANCE IN THE 2012 AASHTO BIKE GUIDE Today s Webinar Significant Updates
Road Diets: Reconfiguring Streets for Multi-Modal Travel
 Road Diets: Reconfiguring Streets for Multi-Modal Travel Tom Grant, P.E., PTOE What is a Road Diet? Reconfiguration of travel lanes to benefit all roadway users (i.e., Complete Street) Reclaiming the space
Washington St. Corridor Study
 FIGURE 7.17 Bridge Alternatives - Cross Sections 86 Discarded Alternative: Short-Term Bridge Repair Short-term repairs and west bridge span replacement were considered during analysis. Short-term repairs
Dear Mr. Tweed: Sincerely, Min Zhou, P.E. Vice President
 December 17, 2012 Mr. Steve Tweed City of Long Beach, Department of Public Works Traffic & Transportation Bureau, 10 th Floor City Hall 333 West Ocean Boulevard Long Beach, CA 90802 Subject: Broadway and
Toolbox of Countermeasures and Their Potential Effectiveness to Make Intersections Safer
 8 Toolbox of Countermeasures and Their to Make Intersections Safer Introduction Studies included in the NCHRP 17-18 (3), Guidance for Implementation of the AASHTO Strategic Highway Safety Plan, as well
Evolving Roadway Design Policies for Walking and Bicycling
 Evolving Roadway Design Policies for Walking and Bicycling The 2016 Michigan Transportation Planning Conference Kalamazoo, MI July 13, 2016 Title 23 of the Code of Federal Regulations Title 23 was originally
CITY OF SAINT JOHN TRAFFIC CALMING POLICY
 CITY OF SAINT JOHN TRAFFIC CALMING POLICY VERSION: 1.0 April 10, 2012 Pedestrians, Cyclists and Motorists Sharing Street Spaces CONTENTS INTRODUCTION... 3 POLICY GOAL... 3 POLICY OBJECTIVES... 3 GUIDING
Bridgewater Complete Streets Prioritization Plan and Pedestrian Safety Assessment
 Bridgewater Complete Streets Prioritization Plan and Pedestrian Safety Assessment Presented by Luciano Rabito Manager of Complete Streets Presented to Bridgewater, MA Wednesday, April 26, 2017 6:30 P.M.
APPENDIX G: INTERSECTION NEEDS AT OKEECHOBEE BOULEVARD
 APPENDIX G: INTERSECTION NEEDS AT OKEECHOBEE BOULEVARD INTERSECTION NEEDS AT SR 7 and OKEECHOBEE BOULEVARD SR 7 Extension Project Development and Environment (PD&E) Study From Okeechobee Boulevard (SR
WELCOME Public Information Centre
 WELCOME Public Information Centre Fernforest Drive Brampton Soccer Centre Community Room #2 Tuesday January 19, 2016 6:30 p.m.to 9:00 p.m. Please sign in Neighbourhood Traffic Calming Guide Background
Road Safety Assessments. Lt. Bob McCurdy Williamson County Sheriff s s Office Marion, IL.
 Road Safety Assessments Lt. Bob McCurdy Williamson County Sheriff s s Office Marion, IL. Why Are We Here? 2005 US Traffic Fatalities = 43,443 1429 4329 1361 1616 1534 3504 1729 3543 Illinois Annual Fatallities
Kansas Department of Transportation Strategic Highway Safety Plan. Intersections
 Kansas Department of Transportation Strategic Highway Safety Plan Intersections Introduction The Federal Highway Administration (FHWA) defines an intersection as a planned point of conflict in the roadway
DEPARTMENT OF ENVIRONMENTAL SERVICES. North Harrison Street (Lee Highway to Little Falls Road) Comparative Analysis. Prepared for:
 Comparative Analysis. Prepared for:") DEPARTMENT OF ENVIRONMENTAL SERVICES North Harrison Street (Lee Highway to Little Falls Road) Comparative Analysis Prepared for: Arlington County Department of Environmental Services 2100 Clarendon Boulevard,
DEPARTMENT OF ENVIRONMENTAL SERVICES North Harrison Street (Lee Highway to Little Falls Road) Comparative Analysis Prepared for: Arlington County Department of Environmental Services 2100 Clarendon Boulevard,
Engineering Countermeasures for Transportation Safety. Adam Larsen Safety Engineer Federal Highway Administration
 Engineering Countermeasures for Transportation Safety Adam Larsen Safety Engineer Federal Highway Administration 360-619-7751 Adam.Larsen@DOT.GOV Countermeasure Selection Resources Manual for Selecting
Complete Street Analysis of a Road Diet: Orange Grove Boulevard, Pasadena, CA
 Complete Street Analysis of a Road Diet: Orange Grove Boulevard, Pasadena, CA Aaron Elias, Bill Cisco Abstract As part of evaluating the feasibility of a road diet on Orange Grove Boulevard in Pasadena,
FHWA Resources for Pedestrian and Bicycle Professionals
 FHWA Resources for Pedestrian and Bicycle Professionals Charlie Zegeer, UNC Highway Safety Research Center/PBIC Libby Thomas, UNC Highway Safety Research Center Dan Nabors, Vanasse Hangen Brustlin (VHB)
Project Goal and Description. Why Broadway? Broadway SFMTA.COM/BROADWAY. The goal of the Broadway Safety Improvement
 PROJECT OVERVIEW Project Goal and Description The goal of the Broadway Safety Improvement d St Van Ness Ave Project is to improve safety and comfort for all who Franklin St Hyde St Octavia St Gough St
CITY OF BLOOMINGTON COMPLETE STREETS POLICY
 CITY OF BLOOMINGTON COMPLETE STREETS POLICY POLICY OBJECTIVE: The City of Bloomington will enhance safety, mobility, accessibility and convenience for transportation network users of all ages and abilities,
CONTENTS EXECUTIVE SUMMARY 1
 CONTENTS CHAPTER PAGE EXECUTIVE SUMMARY 1 1 ISSUES AND PURPOSE OF THE ANALYSIS 2 1.1 Background 2 1.2 Analysis Area 2 1.3 Issues and Observations 3 1.4 Project and Public Meetings 3 2 LIST OF PREFERRED
Appendix A: Crosswalk Policy
 Appendix A: Crosswalk Policy Appendix A: Crosswalk Policy Introduction This citywide Crosswalk Policy is aimed at improving pedestrian safety and enhancing pedestrian mobility by providing a framework
Cycle Track Design Best Practices Cycle Track Sections
 Design Best Practices Sections It is along street segments where the separation and protection methods of cycle tracks offer more comfort than conventional bicycle lanes, and are more attractive to a wide
Borough of Danville, PA Traffic Calming Program Guidelines
 Borough of Danville, PA Traffic Calming Program Guidelines Adopted by Borough Council on 1 INTRODUCTION Speeding Traffic is a major concern in the Borough of Danville because of its detrimental impacts
US 41 (Tamiami Trail) Corridor Study. Roadway Safety Audit
 Corridor Study. Roadway Safety Audit") US 41 (Tamiami Trail) Corridor Study Roadway Safety Audit US 41 RSA June 14/15, 2017 Agenda Project Overview Schedule RSA Process Overview RSA Responsibilities Historical Crash Review 2 PROJECT OVERVIEW
US 41 (Tamiami Trail) Corridor Study Roadway Safety Audit US 41 RSA June 14/15, 2017 Agenda Project Overview Schedule RSA Process Overview RSA Responsibilities Historical Crash Review 2 PROJECT OVERVIEW
FDOT Bicycle/Pedestrian Focused Initiative & Complete Streets
 Florida Department of TRANSPORTATION FDOT Bicycle/Pedestrian Focused Initiative & Complete Streets Billy L. Hattaway, PE District One Secretary Secretary s Pedestrian Safety Initiative Dangerous by Design
Texas Intersection Safety Implementation Plan Workshop JUNE 2, 2016
 Texas Intersection Safety Implementation Plan Workshop JUNE 2, 2016 Why Intersection Safety? A small part of overall highway system, but Each year roughly 50% of all crashes estimated 3 million involve
US 41 COMPLETE STREETS CORRIDOR PLANNING STUDY from University Parkway to Whitfield Avenue
 41 US 41 COMPLETE STREETS CORRIDOR PLANNING STUDY from University Parkway to Whitfield Avenue EXECUTIVE SUMMARY DRAFT FEBRUARY 2019 Project Overview The US 41 Complete Streets Corridor Planning Study,
Public Information Centre
 WELCOME Public Information Centre Father Tobin Road Lougheed Middle School - Library Wednesday November 7, 2012 7:00 p.m.to 9:00 p.m. Please sign in Neighbourhood Traffic Calming Guide Background The City