Safety Plans. Tom Maze Transportation Seminar. April 30, Howard Preston Michael Barry Loren Hill. CH2M HILL, SRF Consulting Group, P.E.
|
|
|
- Rhoda Strickland
- 5 years ago
- Views:
Transcription
1 Mn/DOT County Road Safety Plans Tom Maze Transportation Seminar April 30, 2010 Howard Preston Michael Barry Loren Hill CH2M HILL, SRF Consulting Group, P.E. Services 1
2 Agenda Background, Goals & Objectives Project Overview Schedule, Participating Counties, Approach Safety Emphasis Areas Safety Strategies Identifying At-Risk Locations Examples of Projects Next Steps/Comments Questions 4/30/2010 2
3 4/30/2010 3
4 Background 657 All Others tical Emph hasis Area as Driver Safety Awareness Ran-Off the Road Head-On & Across Median Aggressive Drivers Young Drivers Signalized Intersections Unsignalized Intersections Alcohol Related Safety Goal A 5% Reduction in the Number of Traffic Fatalities imated Crit Unbelted Esti (Estimated) Goal 4/30/2010 4
5 4/30/2010 5


6 County Road Safety Plans Sponsored by Funding provided d by the Minnesota Department of Transportation Almost $3.5 million made available to prepare County Safety Plans for 87 counties over three years 4/30/2010 6
7 4/30/2010 7
8 Goal and Objectives Development of County Safety Plans Create county crash goal Establish safety emphasis areas High priority safety strategies At-risk locations Safety investment options Identify high priority safety projects, both proactive and reactive. Position counties to compete for safety funds Highway Safety Improvement Program High Risk Rural Roads Program Minnesota Central Safety Funds Foster safety culture among county stakeholders 4/30/2010 8
9 Schedule of Delivery Phase I - October 15, 2009 to mid July 2010 Phase II - July 2010 to April 2011 Phase III - April 2011 to January 2012 Phase IV - January 2012 to September /30/2010 9

10 Phase I Participating Counties ATP 3 Benton Robert Kozel Cass David Enblom Crow Wing Tim Bray Isanti Richard Heilman Kanabec Gregory Nikodym Mille Lacs Bruce Cochran Morrison Steve Backowski Sherburne Rhonda Lewis Stearns Mitch Anderson Todd Loren Fellbaum Wadena Joel Ulring Wright Wayne Fingalson ATP 6 Dodge Guy Kohlnhofer Fillmore John Grindeland Freeborn Sue Miller Goodhue Gregory Isakson Houston Brian Pogodzinski Mower Mike Hanson Rice Dennis Luebbe Wabasha Dietrich Flesch Winona David Kramer 4/30/
11 Project Approach Phase I Oct 2009 Feb 2010 Mar 2010 Mar 2010 Crash Analysis Kick-off Video Conference Select Safety Emphasis Areas Review Mtg w/ Counties Develop Comprehensive List of Safety Strategies Safety Workshop Project Programming May 2010 Project Development Identify Identify Implementation Short List Safety Evaluation of Critical Projects Refinement & Strategies Update SHSP Apr 2010 July 2010 Sft Safety Plan 4/30/
12 Minnesota s Safety Emphasis Areas Top 10 Emphasis Areas CEAs in the Minn. SHSP Top 10 Emphasis Areas (Based on Minnesota Data) Related Fatal Crashes or Fatalities Rank Related Fatalities Rank Related Fatalities Rank Related Fatalities Rank Increasing Seat Belt Usage and Improving Airbag Effectiveness Improving the Design and Operation of Highway Intersections 1,351 fatalities 53% 1 1,271 52% % % 3 1,013 fatal crashes 36% 3 1,004 33% % % 1 Reducing Impaired Driving 1,020 fatal crashes 36% 2 1,068 36% % % 2 Keeping Vehicles on the Roadway (combined with Minimizing the Consequences of Leaving the Road) 959 fatal crashes 34% % % % 4 Curbing Aggressive Driving 675 fatal crashes 24% % % % 5 Instituting Graduated Licensing for Young Drivers 705 fatal crashes 25% % % % 8 Reducing Head-On and Across-Median Crashes 505 fatal crashes 18% % % % 6 Sustaining Proficiency in Older Drivers 594 fatal crashes 21% % % % 7 Keeping Drivers Alert 681 fatal crashes 24% % % % 10 Making Truck Travel Safer 379 fatal crashes 14% % % % 9 Increasing Driver Safety Awareness Improving Information and Decision Support Systems Source: Minnesota Crash Records; not including fatalities due to the I-35W Bridge collapse : 2,797 fatal crashes; 3,126 fatalities; 2,572 vehicle occupant fatalities : 2,701 fatal crashes; 3,008 fatalities; 2,429 vehicle occupant fatalities : 2,358 fatal crashes; 2,573 fatalities; 1,983 vehicle occupant fatalities 4/30/
13 ATP 3 & ATP 6 ATP 3 Emphasis Area Statewide Percentage Interstate, US & TH CSAH & CR Twnshp & Other Total Fatal and Serious Injury Crashes 10, Young drivers (under 21) 26% 25% (136) 29% (188) 34% (108) Unlicensed drivers 7% 8% (43) 9% (60) 6% (20) Older drivers (over 64) 13% 19% (103) 13% (85) 11% (35) Drivers Aggressive driving and speeding-related 22% 22% (123) 25% (164) 27% (84) Drug and alcohol-related 25% 21% (114) 35% (231) 30% (96) Inattentive, distracted, asleep drivers 21% 28% (155) 19% (126) 20% (62) Safety aw areness Unbelted vehicle occupants 27% 31% (174) 33% (217) 26% (81) Special Users Pedestrians crashes 8% 6% (33) 4% (24) 9% (29) Bicycle crashes 4% 1% (6) 2% (13) 7% (21) Motorcycles crashes 14% 12% (64) 17% (111) 16% (49) Vehicles Heavy vehicle crashes 9% 13% (71) 6% (37) 5% (16) Safety enhancements Train-vehicle collisions 0% 0% (0) 0% (1) 2% (5) Road departure crashes 27% 25% (137) 41% (269) 29% (91) Highw ays Consequences of leaving road Intersection crashes 43% 42% (230) 39% (259) 43% (137) Head-On and Sidesw ipe (opposite) 15% 18% (101) 15% (101) 13% (41) Work zone crashes 1% 2% (11) 1% (5) 1% (4) EMS Enhancing Emergency Capabilities Management Information and decision support systems More effective processes ATP 6 Interstate, US & TH 475 CSAH & CR 433 Twnshp & Other % (116) 28% (121) 34% (92) 5% (25) 6% (25) 7% (18) 20% (96) 13% (56) 13% (34) 23% (108) 25% (107) 20% (54) 15% (73) 29% (125) 21% (57) 27% (130) 15% (63) 14% (38) % (133) 31% (135) 25% (69) 4% (17) 3% (12) 10% (27) 1% (6) 1% (6) 7% (18) 16% (74) 18% (76) 8% (22) 14% (68) 5% (23) 7% (20) % (1) 0% (2) 1% (3) 31% (149) 48% (207) 23% (63) % (177) 26% (112) 50% (136) 17% (83) 19% (83) 12% (32) 2% (8) 1% (4) 0% (0) DPS Crash Data Records, 2004 to 2008 Note: Numbers are not additive, as one crash may involve a young driver at an intersection. 4/30/
14 Sample of Critical Emphasis Areas Drivers Statew ide Percentage Todd County Stearns County Cass County Winona County CSAH & CR CSAH & CR CSAH & CR Em phas is Ar e a CSAH & CR Total Fatal and Serious Injury Crashes 10, Young drivers (under 21) 26% 23% (7) 26% (36) 18% (8) 32% (12) Unlicensed drivers 7% 13% (4) 7% (9) 23% (10) 8% (3) Older drivers (over 64) 13% 13% (4) 17% (23) 9% (4) 11% (4) Aggressive driving and speedingrelated 22% 20% (6) 28% (38) 32% (14) 29% (11) Drug and alcohol-related 25% 47% (14) 31% (42) 43% (19) 34% (13) Inattentive, distracted, asleep drivers 21% 27% (8) 25% (34) 27% (12) 11% (4) Safety aw areness Unbelted vehicle occupants 27% 30% (9) 28% (38) 36% (16) 29% (11) Special Users Pedestrians crashes 8% 0% (0) 5% (7) 9% (4) 0% (0) Bicycle crashes 4% 3% (1) 1% (1) 2% (1) 8% (3) Motorcycles crashes 14% 17% (5) 11% (15) 9% (4) 21% (8) Vehicles ces Heavy vehicle crashes 9% 3% (1) 5% (7) 7% (3) 3% (1) Safety enhancements Train-vehicle collisions 0% 0% (0) 0% (0) 2% (1) 0% (0) Road departure crashes 27% 40% (12) 40% (55) 45% (20) 39% (15) Consequences of leaving road Highw ays Intersection crashes 43% 30% (9) 36% (49) 23% (10) 26% (10) Head-On and Sidesw ipe (opposite) crashes 15% 3% (1) 12% (16) 14% (6) 13% (5) Work zone crashes 1% 0% (0) 0% (0) 2% (1) 3% (1) EMS Enhancing Emergency Capabilities Information and decision support Management systems More effective processes DPS Crash Data Records, 2004 to 2008 Top 5 Emphasis Areas by Jurisdiction 4/30/2010 Note: Numbers are not additive, as one crash may involve a young driver at an intersection. 14

15 Greater Minnesota Crash Data Overview Source: MnCMAT Crash Data, Severe is fatal and serious injury crashes (K+A). Example All % Severe % 5 Year Crashes 165,739 5,770 -ATP s 1, 2, 3, 4, 6, 7, and 8 NO Metro State System CSAH/CR 76,992 46% 39,073 24% 2,362 41% 2, % City, Twnshp, Other 49,674 30% 1, % Urban 14,599 37% % Rural 24,474 63% 1,860 83% Not Inters-Related 5,271 36% % Unknown/Other 1,880 13% 23 6% Run Off Road 1,283 (24%), 74 (37%) Head On 361 (7%), 27 (14%) Rear End 1,315 (25%), 21 (11%) Right Angle 529 (10%), 18 (9%) Inters-Related 7,448 51% % Animal 4,407 18% 74 4% Inters-Related 5,938 30% % Other/Unknown Signalized All Way Stop 2,755 47% 249 4% 199 3% % 5 1% 19 4% Not Animal 20,067 82% 1,786 96% Unknown/Other 1,502 7% 66 4% Thru-Stop 2,735 46% % Head On, SS Opp 821 7% % Not Inters-Related 12,627 63% 1,185 66% Run Off Road 8,367 66% % Signalized 2,189 29% 36 22% All Way Stop 438 6% 6 4% Right Angle 651 (30%), 20 (56%) Rear End 753 (34%), 5 (14%) Left Turn 361 (17%), 4 (11%) Head On 70 (3%), 2 (6%) Thru-Stop 2,810 38% 70 44% Other/Unknown 2,011 27% 48 30% Right Angle 1,359 (48%), 41 (59%) Head On 70 (3%), 7 (10%) Left Turn 283 (10%), 4 (6%) Rear End 368 (13%), 4 (6%) Run Off Road 1,047 (38%), 93 (38%) Right Angle 297 (11%), 50 (20%) Head On 119 (4%), 26 (11%) Left Turn 186 (7%), 20 (8%) On Curve % 47 36% Right Angle 968 (35%), 145 (55%) Run Off Road 360 (13%), 23 (9%) Left Turn 183 (7%), 11 (4%) Rear End 287 (11%), 8 (3%) On Curve 3,550 42% % 4/30/
16 ATP 3 County Crash Data Overview Source: MnCMAT Crash Data, Severe is fatal and serious injury crashes (K+A). Example All % Severe % 5 Year Crashes ATP 3 43,243 1,659 State System CSAH/CR 20,541 48% 12,623 29% % % City, Twnshp, Other 10,079 23% % Urban 4,994 40% % Rural 7,629 60% % Not Inters-Related 1,810 36% 75 48% Unknown/Other % 6 4% Run Off Road 519 (29%), 30 (40%) Rear End 392 (22%), 9 (12%) Head On 136 (8%), 8 (11%) Right Angle 159 (9%), 6 (8%) Inters-Related 2,616 53% 75 48% Animal 1,581 21% 20 3% Inters-Related 2,013 33% % Other/Unknown Signalized All Way Stop % 90 4% 75 4% 67 39% 3 2% 5 3% Not Animal 6,048 79% % Unknown/Other 453 8% 21 4% Thru-Stop 1,002 50% 98 56% Head On, SS Opp 248 7% 42 12% Not Inters-Related 3,582 59% % Run off Road 2, % % Signalized % 15 20% All Way Stop 126 5% 1 1% Right Angle 199 (24%), 6 (40%) Rear End 289 (35%), 1 (7%) Left Turn 153 (18%), 4 (27%) Head On 29 (3%), 1 (7%) Thru-Stop % 33 44% Other/Unknown % 26 35% Right Angle 417 (49%), 21 (64%) Rear End 128 (15%), 2 (6%) Left Turn 96 (11%), 2 (6%) Head On 22 (3%), 4 (12%) Run Off Road 300 (35%), 30 (45%) Right Angle 56 (7%), 5 (7%) Rear End 154 (18%), 1(2%) Left Turn 75 (9%), 7 (10%) Right Angle 393 (39%), 59 (60%) Run Off Road 121 (12%), 9(9%) Left Turn 91 (9%), 4 (4%) Rear End 97 (10%), 2 (2%) On Curve 89 36% 19 45% On Curve % % 4/30/
17 ATP 6 County Crash Data Overview Source: MnCMAT Crash Data, Severe is fatal and serious injury crashes (K+A). Example All % Severe % 5 Year Crashes ATP 6 35,890 1,258 State System CSAH/CR 16,571 46% 7,509 21% % % City, Twnshp, Other 11,810 33% % Not Inters-Related % 52 53% Urban 3,109 41% 98 20% Unknown/Other % 9 9% Run Off Road 235 (24%), 24 (46%) Rear End 307 (31%), 5 (10%) Head On 57 (6%), 9 (17%) Right Angle 98 (10%), 4 (8%) Inters-Related 1,615 52% 37 38% Inters-Related 1,035 28% 97 25% Rural 4,400 59% % Animal Not Animal % 3,760 85% 12 3% % Other/Unknown Signalized All Way Stop % 97 9% 10 1% 47 49% 2 1% 1 1% Unknown/Other 302 8% 20 5% Thru-Stop % 47 49% Head On, SS Opp 151 6% 28 11% Not Inters-Related 2,423 64% % Run off Road 1,635 67% % Signalized % 11 30% All Way Stop 63 4% 5 13% Right Angle 221 (35%), 8 (73%) Rear End 241 (38%), 2 (18%) Left Turn 86 (14%), 0 (0%) Right Turn 3 (<1%), 1 (9%) Thru-Stop % 15 41% Other/Unknown % 6 16% Right Angle 285 (50%), 11 (73%) Rear End 74 (13%), 2 (13%) Left Turn 61 (11%), 0 (0%) Run Off Road 183 (38%), 16 (34%) Right Angle 48 (10%), 7 (15%) Rear End 66 (14%), 2 (4%) Left Turn 37 (8%), 8 (17%) Right Angle 178 (40%), 28 (60%) Run Off Road 55 (12%), 5 (11%) Head On 17 (4%), 4 (9%) On Curve 59 39% 13 46% On Curve % % 4/30/
18 ATP 3 County Severe Crash Numbers Legend 23/yr (117 total) - Severe crashes on any jurisdiction 9/yr (45 total) - Severe crashes on CSAH/CR MnCMAT Crash Data, /30/2010 Severe=K+A 18
19 ATP 3 County Crash Data Overview ATP 3 Total Crashes: 43,126 Severe Crashes: 1,524 Mileage: 20,253.9 Rate: 1.07 Severe Rate: 3.79 Density: 0.43 Severe Density: 1.50 LEGEND Severe Crashes = Fatal + A Severity Rate=Total crashes per Million Vehicle Miles (MVM) Severe Rate = Severe crashes per 100 MVM Density = Total crashes per miles per year Severe Density = Severe crashes per 100 miles per year State County City Other Total Crashes: 20,243 Severe Crashes: 554 Mileage: 1,580.9 Rate: 0.83 Severe Rate: 2.28 Density: 2.56 Severe Density: 7.01 Total Crashes: 12,421 Severe Crashes: 659 Mileage: 6,633.3 Rate: 1.11 Severe Rate: 5.86 Density: 0.37 Severe Density: 1.99 Total Crashes: 8,575 Severe Crashes: 180 Mileage: 2,746.0 Rate: 2.34 Severe Rate: 4.92 Density: 0.62 Severe Density: 1.31 Total Crashes: 1,887 Severe Crashes: 131 Mileage: 9,293.6 Rate: 1.99 Severe Rate: Density: 0.04 Severe Density: 0.28 ATP 6 Total Crashes: 35,644 Severe Crashes: 1,182 Mileage: 13,508.9 Rate: 1.39 Severe Rate: 4.62 Density: 0.53 Severe Density: 1.75 Source: Mn/DOT TIS, Rate MVM, Density Crashes per Mile per Year Severe is fatal and serious injury crashes (K+A). State County Total Crashes: 16,365 Total Crashes: 7,371 Total Crashes: 10,753 Total Crashes: 1,155 Severe Crashes: 478 Severe Crashes: 438 Severe Crashes: 190 Severe Crashes: 76 Mileage: 1,352.8 Mileage: 4,192.8 Mileage: 1,829.6 Mileage: 6,133.7 Rate: 1.02 Rate: 1.36 Rate: 3.13 Rate: 1.56 Severe Rate: 2.98 Severe Rate: 8.09 Severe Rate: 5.53 Severe Rate: Density: 2.42 Density: 2.09 Density: 1.18 Density: 0.04 Severe Density: 7.07 Severe Density: 0.35 Severe Density: 2.08 Severe Density: /30/ City Other


20 Comprehensive Safety Improvement Process For the past 30 years, most safety programs have been focused on identifying locations with a high frequency or rate of crashes Black Spots and then reactively implementing safety improvement strategies. The result of making Black Spots the highest priority in the safety program was to focus safety investments primarily on urban and suburban signalized intersections the locations with the highest number of crashes. However, these Black Spot intersections were found to account for fewer than 10% of fatal crashes. Minnesota counties average approximately 10 severe (fatal+serious injury) crashes per year on their (500 mile) system there are virtually NO Black Spots on the county system. Minnesota decided to include counties in the Highway Safety Improvement Program because almost one-half of our fatal crashes occur on the county system of highways but these 190 crashes are spread across a 45,000 mile system (0.004 fatal crashes per mile). The solution requires a systematic approach. A new, more systematic based analysis of Minnesota s crash data combined with the adoption of a goal to reduce fatal crashes has led to a more comprehensive approach to safety programming a focus on Black Spots in urban areas where there are intersections with high frequencies of crashes and a systems-based approach for rural areas where the total number of severe crashes is high but the actual number of crashes at any given location is very low. 4/30/


21 Safety Strategies Overview NCHRP Report 500 A series of guides to assist state and local agencies in reducing injuries and fatalities in targeted emphasis areas The guides correspond to the emphasis areas outlined in the AASHTO Strategic Highway Safety Plan. Each guide includes a brief introduction, a general description of the problem, the strategies/ countermeasures to address the problem, and a model implementation process. 4/30/
22 Screening - Initial Strategies AASHTO s SHSP, NCHRP Report 500 Implementation ti Guidelines, NCHRP Report 622 and input from Safety Partners. Winona County s Critical Strategies The strategies will be screened using: - Crash data, - Effectiveness, - Cost, and -Input from Safety Workshop. Enforcement Strategies The Critical Strategies should have the greatest potential to significantly reduce the number of traffic fatalities in Winona County. 4/30/
23 Example Typical Run-Off Road Strategies 4/30/

24 Example Typical Intersection Strategies Included Strategies: Change Intersection Type Street Lighting Dynamic Warning Signs Enhanced Signing and Delineation Improve Sight 4/30/2010 Distance 24


25 Safety Workshop Date/Time: March 10 th, 8:30AM to 3PM Location: Rushford Village Hall Agenda 8:30 Coffee and Registration 9AM - Introductions Background Information/Desired Outcomes Breakout Sessions Prioritize Strategies 12PM 1PM - Lunch Report Back/Final Presentation 2:45 3PM - Wrap-up p 4/30/
26 Strategy Voting Results Priority List of Signalized Intersection Safety Strategies Objectives Strategies Voting Rank 17.2 E -- Improve driver compliance with traffic control devices 172A Employ signal coordination along a corridor or route 17.2 E2 -- Supplement conventional enforcement of red-light running with confirmation lights Priority List of Unsignalized Intersection Safety Strategies Voting Objectives Strategies Results Rank 17.1 B -- Reduce the frequency and severity of intersection conflicts through geometric design improvements 17.1 E -- Improve driver awareness of intersections as viewed from the intersection approach 17.1 F -- Choose appropriate intersection traffic control to minimize crash frequency and severity 17.1 G -- Improve driver compliance with traffic control devices and traffic laws at intersections 17.1 H -- Reduce operating speeds on specific intersection approaches 17.1 B12 -- Restrict or eliminate turning maneuvers by providing channelization or closing median openings 17.1 B16 -- Realign intersection approaches to reduce or eliminate intersection skew 17.1 E2 -- Improve visibility of intersections by providing lighting 171E Provide a stop bar (or provide a wider stop bar) on minor-road approaches 17.1 E5 -- Install larger regulatory and warning signs at intersections and improve visibility of intersections by providing enhanced signing and delineation 17.1 E9 -- Provide pavement markings with supplementary messages, such as STOP AHEAD 17.1 F3 -- Provide roundabouts at appropriate locations 17.1 G1 -- Provide targeted enforcement to reduce stop sign violations 17.1 G2 -- Provide targeted public information and education on safety problems at specific intersections 17.1 H1 -- Provide dynamic speed feedback signs 17.1 H2 -- Provide traffic calming on intersection approaches through a combination of geometrics and traffic control devices Priority List of Road Departure Safety Strategies Objectives 15.1 A -- Keep vehicles from encroaching on the roadside Priority List of Seat Belt Usage Safety Strategies Voting Strategies Results Rank 15.1 A1 -- Install shoulder rumble strips 15.1 A2 -- Install edgelines "profile marking", edgeline rumble strips or modified shoulder 19 1 rumble strips on section with narrow or no paved shoulders 15.1 A3 -- Install centerline rumble strips A4 -- Provide enhanced shoulder or delineation and marking for sharp curves A6 -- Provide enhanced pavement markings A8 -- Apply shoulder treatments *Eliminate shoulder drop-offs *Shoulder 7 8 wedge *Widen and/or pave shoulders Objectives Strategies 8.1 A4- Support Legislation to change seat 81A 8.1 A- Maximize i use of occupant restraints t by belt usage from a secondary to a primary all vehicle occupants offense. 8.1 B- Insure that restraints, especially child Support legislation to improve child passenger and infant restraints, are properly used safety laws Voting Results Rank Priority List of Impaired/Aggressive/Young Drivers and Bicyclist Safety Objectives Ensuring Safer Bicycle Travel Strategies Receiving Highest Votes Prosecute, Impose Sanctions on, and Treat DWI Offenders Install shoulder rumble strips Red-Light Enforcement Improved signs, markings and street lights 0 Public Outreach and Awareness Campaigns Strategies Voting Results Rank Increase bicycle helmet usage 4 11 Support diversion programs to impaired driving offenses Support legislation to require ignition interlocks as a condition for license reinstatement Conduct educational and public information campaigns against aggressive driving Develop parent-teen driver's education presentations and handbook aimed at educating individuals on the risk of teen driving Continue seat belt challenges among high schools to encourage teens to buckle up /30/


 to identify risk and prioritize the 5 (or 6) Ranking")
27 A Systematic Approach The average county in Minnesota includes: 500 miles of county highway 500 horizontal curves 180 controlled intersections The key questions: Is every element of the county system equally at risk? Where to Start? A new approach to safety planning Old Approach Crashes = Risk & No Crashes = No Risk New Approach No Crashes No Risk Use surrogates of crashes (roadway and traffic characteristics) to identify risk and prioritize the 5 (or 6) Ranking System 4/30/
28 ATP - Segments 12 counties uploaded to the comprehensive list 4,900 total miles Road Departure Crashes 2,643 total, 233 severe ATP County Total 3 Cass 433 Isanti Todd Sherburne Kanabec Mille Lacs Crow Wing Stearns Wadena Total Dodge 227 Winona Mower Total 879 Grand Total /30/
29 ATP - Segments Percen ntage Per rcentage 50% 45% 35% 30% 25% 20% 15% 10% 40% 35% 30% 25% 20% 15% 10% 5% 0% 5% 0% 27% 21% 11% 10% 7% 36% 25% 31% 47% ATP 6- Road Departure Analysis 20% 22% 20% 17% 17% 18% 11% 7% 11% 9% 10% 6% 7% 5% 3% 0% 3% 3% 4% 1% 2% 3% 4% 3% 3% 0% 1% 0% 0% 1% 1% 0% 0% 1% 0% 0% 0< < < < < < < < < < % 8% 5% ADT Length (879 miles) VMT ( M total ) Runoff Road Crashes (458 total) Severe Runoff Road Crashes (30 total) 25% 17% 17% 14% 14% 13% 11% 11% ATP 3- Road Departure Analysis 12% 11% 9% 10% 11% 8% 8% 9% 7% 7% 6% 5% 7% 5% 5% 3% 5% 5% 5% 6% 4% 3% 3% 2% 3% 1% 2% 1% 0< < < < < < < < < < ADT Length (4006 miles) VMT ( M total ) Runoff Road Crashes (2185 total) Severe Runoff Road Crashes (203 total) 4/30/ % 6% 17% 12%


30 Edge Risk Assessment 1 Good Edge, Good Clear Zone 2 No Edge, Good Clear Zone 3 No Edge, No Clear Zone 4/30/
31 Winona County Segment Prioritization Winona County Rural Segment Prioritization Rank Corridor Route # Start End Length ADT RD Curve Critical Edge Tiebreakers RD Rate Totals Range Density Radius Density Risk Edge Risk RD Density CSAH 12 CSAH 1 CR CSAH 3 CSAH 12 US CSAH 23 CSAH 25 US CSAH 25 CR 110 US CSAH 8 CSAH 11 CSAH CSAH 20 CSAH 25 US CSAH 17 Waldo Rd CSAH CR 101 Start CSAH CSAH 11 Houston Co Line South CR CSAH 5 Houston Co Line South CSAH CSAH 30 Wabasha Co Line West CSAH CSAH 19 begin pavement MN CSAH 1 CSAH 12 Houston Co Line South CSAH 43 Fillmore Co Line South CSAH CSAH 26 Wabasha Co Line West MN CSAH 7 CSAH 12 Pickwick i k CSAH 17 CSAH 12 Winona CL South CR 105 Start Paved Winona CL South CSAH 25 Fillmore Co Line South CSAH CSAH 15 CSAH 17 in Witoka US 61 at Homer CSAH 21 MN 43 Winona CL South CSAH 12 MN 43 CSAH 17 (Witoka) CSAH 29 Fillmore Co Line South CSAH CSAH 7 Pickwick US CSAH 9 Cedar Church Rd US CSAH 16 Houston Co Line South CSAH CR 114 CSAH 26 CSAH Is Winona County s entire system at-risk? No about 1/3 of their system 4/30/


32 Cass County Segments CSAH 7 segment Project Form 4/30/
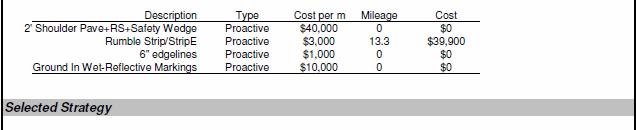
33 Cass County Segments Segments Length Paving Length Cost Year miles $138,000 Year miles 3.4 miles $172,020 Year miles 16miles 1.6 $106, Total miles $416,620 Project Summary Total 13 Projects $416,620 Rumble Strip/StripE 11 segments Split -- Rumble Strip/StripE and 2 Shoulder Pave/RS/Safety Wedge 2 segments 4/30/
34 ATP Curves 11 counties uploaded to the comprehensive list 3,207 total curves 2609 (81%) curves with no crashes Crashes 881 total, 94 severe crashes 2 curves with multiple fatal crashes (5 years) 0.05 crashes/curve/year ATP County Total 3 Cass 583 Isanti 287 Sherburne 227 Todd 357 Mille Lacs 233 Kanabec 115 Stearns 603 Wadena Total Dodge 90 Winona 503 Mower Total severe crashes/curve/year Grand Total /30/
35 4/30/
36 Curve-Related Roadway Departure Approximately 50% to 60% of roadway departure crashes are curve related Are all curves equally at-risk? No Ranked based on Checkmark system 5 System: ADT Range Radius Range Severe Crash on curve Intersection on curve Visual Trap on curve 4/30/
37 Percen ntage tage Percent ATP - Curves 50% 45% 40% 35% 30% 25% 20% 15% 10% 5% 0% 60% 50% 40% 30% 20% 10% 0% 47% 45% 40% 22% 20% 20% 21% 19% 16% ATP 6 - Curve Radius 7% 11% 8% 0< < < < < < % 16% 16% Radius (ft) # Curves (699 total) Crashes (202 total Severe Crashes (19 total) 45% 48% 40% ATP 3 - Curve Radius 29% 24% 25% 9% 8% 4% 6% 5% 6% 0% 3% 3% 5% 0% 0% 0% 4% 1% 3% 2% 1% 1% 0% 0% 0< < < < < < Radius (ft) # Curves (2507 total) Crashes (679 total Severe Crashes (75 total) 4/30/
38 Curve-Related Roadway Departure Corridor Crashes Severe RoR Length Intersection Corridor Segment Description Curve Weighted ADT K A B C PDO K A Radius Curve on Curve Chevrons Visual Trap Rank 7 CSAH 3 Mower Co - CSAH ,250 Yes xxx 9 CSAH 4 CSAH 5 - CSAH , ,150 1,875 Yes xxx 11 CSAH 8 CSAH 6 - CSAH ,150 None 0 0 1,150 1,050 Yes Yes xxxx 18 CSAH 11 CSAH 36 - CSAH 2 2 1,500 None Yes Yes xxxx 20 CSAH 2 36th Ave NE - TH ,200 None 0 0 1,050 1,500 Yes Yes xxx 21 CR th St NW - CSAH , ,100 Yes xxx 22 CSAH 3 CSAH 14 - CSAH , xxx 24 CSAH 12 US 52 - US , , Yes xxx 26 CSAH 5 Byron City Limits - Dodge 5 2, ,100 1,025 Yes xxx Co (CSAH 17) 6 2, , Yes xxx 41 CSAH 34 US 14 - CSAH 3 3 2,100 None 0 0 1, Yes Yes xxx 42 CSAH 3 CSAH 6 - CSAH 4 5 1, ,350 Yes Yes xxxxx 6 1,150 None ,250 Yes Yes xxxx 44 CSAH 6 CSAH 3 - US , ,225 Yes Yes xxxx 2 1,250 None ,250 Yes Yes xxxx 52 CSAH 10 Chatfield City Limits - I None ,250 Yes Yes xxx 63 CSAH 25 CSAH 3 - CSAH , , Yes xxx 3 1, ,150 1,075 Yes Yes xxxx 64 CSAH 23 CSAH 19 - TH None ,250 Yes Yes xxx None ,200 Yes Yes xxx 65 CR 143 CSAH 11 - CSAH , Yes xxx 71 CSAH 16 CSAH 1 - US None ,275 Yes Yes xxx 75 CSAH 18 CSAH 12 - Wabasha Co 4 1, , Yes Yes xxx Summary of the high priority curves prioritization includes: 23 curves received 3, 4 or 5 stars (240 total) 1 received 5 s 6 received 4 s 16 received 3 s 10% of all curves 18 different corridor segments across the county 4/30/
39 Cass County Curves Project Summary Total 168 Projects $554,400 Year 1 70 high priority curves $231,000 Year 2 49 proximity curves $161,700 Year 3 49 proximity curves $161,700 Chevrons 168 priority curves/568 curves 4/30/
40 ATP - Intersections 14 counties uploaded to the comprehensive list 2,595 total intersections Multiple Severe Crashes: 40 Multiple Fatal Crashes (2 in 5 years): 6 7,360 total crashes 310 severe crashes 0.56 crashes/intersection/year ATP County Total 3 Cass 225 Crow Wing 190 Isanti 179 Kanabec 206 Mille Lacs 186 Stearns 388 Todd 210 Wadena Total Dodge 135 Freeborn 254 Goodhue 145 Houston 67 Mower 160 Winona severe/intersection/year 6 Total 873 Grand Total /30/
41 7 Rating System County Highway Geometry Volume Proximity Commercial Intersections Skew On/Near Curve ADT Ratio previous STOP sign RR Xing Crashes Development Intersection 1 Intersection 2 Intersection 3 Intersection 4 Intersection 5 Intersection 6 Intersection 7 Intersection 8 4/30/
42 Application of Proactive Methodology Winona County Rural Intersection Prioritization Rank Int # Sys # Intersection Description Skew On/Near Curve Development RR Xing Previous Total Ratio STOP (>5mi) Crashes (Min/Maj) Priority Crash Cost CSAH 12 MNTH-76 RT $ 91, CSAH 29 CR-109 RT, CSAH-29 TURNS LT $ 182, CSAH 21 MNTH-43 X-ING, T-130 BHD $ 175, CSAH 5 CSAH-8 LT $ 136, CSAH 11 CSAH-12 X-ING $ 12, CSAH 12 CR-104 RT $ CSAH 39 CR-119 AHD, CSAH-39 TURNS LT $ 836, CSAH 6 CSAH-33 X-ING ENTER FREMON $ 503, CSAH 21 CSAH-44 RT $ 399, CSAH 12 MNTH-43 X-ING $ 342, CSAH 39 MNTH-74 X-ING (NORTH) $ 318, CSAH 20 CSAH-27 LT & BHD T-560 RT $ 239, CSAH 6 MNTH-74 X-ING $ 196, CSAH 30 CSAH-31 X-ING $ 148, CNTY 120 USTH-14 X-ING, T-322 AHD east $ 103, CSAH 6 CSAH-35 LT CR-113 RT $ 91, CSAH 25 CR-102 RT $ 12, CSAH 25 CR-106 AHD, CSAH-25 CURVES $ 12, CSAH 1 CSAH-12 X-ING $ CSAH 6 T-549 LT CSAH-29 RT & AHD $ CSAH 7 CSAH-12 X-ING $ CSAH 30 MNTH-74 X-ING $ CSAH 6 CSAH-43 RT $ 685, CSAH 12 CSAH-17 RT $ 606, CSAH 39 MNTH-74 X-ING, T-100 BHD (SOU $ 560, CSAH 12 CSAH-25 LT & BHD $ 539,000 4/30/
43 Winona County Intersections No. Rural Thru-Stop Intersections: 71 Prioritization: # % 0 0% CH/TH 7 CH/CH 13 CH/Other 2 0 0% 1 1% 5 7% 16 23% 27 38% 18 25% - 4 6% % Considered C dfor projects 4/30/
44 Winona County Intersections Project Summary Total $556,100 Year 1-8 intersections - $137,100 Year 2-7 intersections - $288,500 Year 3-7 intersections - $130,500 Signs and Markings 22 intersections Street Lights 19 intersections Directional Median 1 intersection 4/30/
45 Next Steps Phase I May - Identify Safety Projects in each county July Deliver Safety Plans Phase II July 2010 thru April 2011 Phase III April 2011 thru January 2012 Phase IV January 2012 thru September /30/
46 Questions? 4/30/
Lessons Learned from the Minnesota County Road Safety Plans. Richard Storm CH2M HILL
 Lessons Learned from the Minnesota County Road Safety Plans Richard Storm CH2M HILL May 21, 2014 Overview of the MN CRSP: Why Prepare Safety Plans for Local Systems? MAP-21: Requires states to address
Update MnDOT s County Roadway Safety Plans 2012 Traffic Records Forum Biloxi, MS October 29, 2012 Brad Estochen
 Update MnDOT s County Roadway Safety Plans 2012 Traffic Records Forum Biloxi, MS October 29, 2012 Brad Estochen MnDOT, CH2M HILL, SRF Consulting Group, P.E. Services 1 County Road Safety Plans Funding
Olmsted County Highway Safety Plan
 TB072009008MKE Olmsted County Highway Safety Plan September 2009 Submitted to: Table of Contents 1. Introduction...1-1 2. Comprehensive Crash Analysis...2-1 3. Safety Emphasis Areas...3-1 4. Safety Strategies...4-1
Systemic Safety Project Selection Tool
 Systemic Safety Project Selection Tool Presented by: Karen Scurry Federal Highway Administration Office of Safety Howard Preston CH2M HILL May 28, 2013 Today s presentation Introduction and housekeeping
Final Report for the Minnesota County Roadway Safety Plans. Prepared for
 Final Report for the Minnesota County Roadway Safety Plans Prepared for January 2014 Contents Acronyms... ii Introduction / Overview... 1-1 Crash Data Analysis and Safety Emphasis Areas... 2-1 Safety Strategies...
Where Did the Road Go? The Straight and Narrow about Curves
 Where Did the Road Go? The Straight and Narrow about Curves Renae Kuehl, SRF Consulting Group October 23, 2018 What is a County Roadway Safety Plan or CRSP?" CRSP Identifies priority location-specific
Dear Fellow Nebraskans:
 Dear Fellow Nebraskans: In accordance with the provisions in the Safe, Accountable, Flexible, and Efficient Transportation Equity Act A Legacy for Users (SAFETEA LU), each state is required to develop
Summary of Local HSIP Solicitation State Fiscal Years (SFY) 2016, 2017, 2018 & 2019
 2016, 2017, 2018 & 2019") Summary of Local HSIP Solicitation State Fiscal s 2016, 2017, 2018 & 2019 Project Selection: A selection team with representation from the State Aid Division (SALT), the Office of Traffic, Safety, and
Summary of Local HSIP Solicitation State Fiscal s 2016, 2017, 2018 & 2019 Project Selection: A selection team with representation from the State Aid Division (SALT), the Office of Traffic, Safety, and
Education Emergency Medical Services Enforcement Engineering. north dakota strategic highway safety plan. Submitted by
 Education Emergency Medical Services Enforcement Engineering north dakota strategic highway safety plan Submitted by SEPTEMBER 2013 North Dakota Strategic Highway Safety Plan Prepared for North Dakota
Minnesota Comprehensive Highway Safety Plan
 The Minnesota Comprehensive Highway Safety Plan (CHSP) was created in a coordinated effort between the Minnesota Departments of Transportation and Public Safety to reduce the number of traffic fatalities
Reducing Crashes at Rural Thru-STOP Controlled Intersections
 Reducing Crashes at Rural Thru-STOP Controlled Intersections Howard Preston and Richard Storm CH2M Hill 1380 Corporate Center Curve, Suite 200 Eagan, MN 55121 hpreston@ch2m.com, richard.storm@ch2m.com
Toward Zero Deaths. Regional SHSP Road Show Meeting. Virginia Strategic Highway Safety Plan. presented by
 Toward Zero Deaths Regional SHSP Road Show Meeting presented by Virginia Strategic Highway Safety Plan December 1, 2016 1 Welcome & Introductions Purpose of the Meeting Objectives & Key Outcomes Agenda»
Local Road Safety Plans
 An Introduction to Local Road Safety Plans June 21, 2018 Today s Presenter Jerry Roche, P.E. Safety Analysis Program Manager FHWA Office of Safety Ames, IA 2 NACE Do-It-Yourself LRSP Pilot Six states,
Road Safety Assessments. Lt. Bob McCurdy Williamson County Sheriff s s Office Marion, IL.
 Road Safety Assessments Lt. Bob McCurdy Williamson County Sheriff s s Office Marion, IL. Why Are We Here? 2005 US Traffic Fatalities = 43,443 1429 4329 1361 1616 1534 3504 1729 3543 Illinois Annual Fatallities
DRIVING ZERO FATALITIES TO A REALITY ILLINOIS LOCAL SAFETY INITIATIVE
 DRIVING ZERO FATALITIES TO A REALITY ILLINOIS LOCAL SAFETY INITIATIVE Priscilla Tobias, PE State Safety Engineer Illinois Dept of Transportation Illinois Stats 102 Counties 145,000 Roadway Miles 900+ Fatalities
TEXAS TRAFFIC SAFETY TASK FORCE. Jeff Moseley Texas Transportation Commission
 TEXAS TRAFFIC SAFETY TASK FORCE Jeff Moseley Texas Transportation Commission June 7, 2016 Fatalities and fatal crashes 2010 2015 4,000 3,500 3,417 3,407 3,536 3,533 3,000 3,061 3,067 2,782 2,803 3,037
Engineering Your Community Safe
 Engineering Your Community Safe Andi Bill Transportation Information Center thanks its partners for their support and assistance National Traffic Safety Goal Reasonable goal? Who s Involved? What can you
Acknowledgements. Mr. David Nicol 3/23/2012. Daniel Camacho, P.E. Highway Engineer Federal Highway Administration Puerto Rico Division
 Daniel Camacho, P.E. Highway Engineer Federal Highway Administration Puerto Rico Division Acknowledgements Mr. David Nicol Director, FHWA Office of Safety FHWA Office of Safety http://safety.fhwa.dot.gov/provencountermeasures/
INTERSECTION CRASH COUNTERMEASURES
 INTERSECTION CRASH COUNTERMEASURES ALL SEVERE INTERSECTION (include gap CRASHES High Friction Surface Treatment - Intersection Markings - advanced acceptance and intersection approaches to intersections
Speed Management Action Plan
 Speed Management Action Plan National Selection Criteria Criteria Description Fatalities The number of fatalities resulting from speeding-related crashes. Percentage Compares total fatalities in each State
9:45-10:30 Understanding the Problem Overview of 15 Critical Strategies (from the CHSP, SHSP) Specific Strategies for Engineers
 Specific Strategies for Engineers") Course Agenda 8:30-9:00 Sign-in 9:00-9:45 Introducing the Issues Course Objective Present the need for safety Initiatives 9:45-10:30 Understanding the Problem Overview of 15 Critical Strategies (from the
Course Agenda 8:30-9:00 Sign-in 9:00-9:45 Introducing the Issues Course Objective Present the need for safety Initiatives 9:45-10:30 Understanding the Problem Overview of 15 Critical Strategies (from the
A Strategic Highway Safety Plan. a coordinated and informed approach to reducing highway fatalities and serious injuries on all public roads.
 Introduction A Strategic Highway Safety Plan is a coordinated and informed approach to reducing highway fatalities and serious injuries on all public roads. A Strategic Highway Safety Plan is Based on
Systemic Safety. Doug Bish Traffic Services Engineer Oregon Department of Transportation March 2016
 Systemic Safety Doug Bish Traffic Services Engineer Oregon Department of Transportation March 2016 Oregon averages 1700 fatal and serious injury crashes each year. Some of the more common crash types include:
Reducing Fatalities and Serious Injuries on County Roads
 Reducing Fatalities and Serious Injuries on County Roads Brian C. Roberts, P.E. Executive Director National Association of County Engineers Washington, DC Housekeeping Please silence all mobile devices.
Toward Zero Deaths: Proactive Steps for Your Community
 Est. Dec. 2014 Toward Zero Deaths: Proactive Steps for Your Community Presented by: Brian Roberts, P.E., National Association of County Engineers Marie Walsh, Ph.D., Louisiana Local Technical Assistance
Pavement Markings (1 of 3)
") Pavement Markings (1 of 3) DESCRIPTION AND DEFINITION Disadvantages Relatively high cost (over typical Crash reduction as yet unknown painted edge line) No tactile effect The STOP AHEAD pavement marking
Pavement Markings (1 of 3) DESCRIPTION AND DEFINITION Disadvantages Relatively high cost (over typical Crash reduction as yet unknown painted edge line) No tactile effect The STOP AHEAD pavement marking
Toolbox of Countermeasures and Their Potential Effectiveness to Make Intersections Safer
 8 Toolbox of Countermeasures and Their to Make Intersections Safer Introduction Studies included in the NCHRP 17-18 (3), Guidance for Implementation of the AASHTO Strategic Highway Safety Plan, as well
Minnesota Strategic Highway Safety Plan
 Minnesota Strategic Highway Safety Plan Executive Summary Minnesota s comprehensive and strategic safety planning process began in 2004, involved a cross-section of state, local and private safety partners
Minnesota Crash Mapping Analysis Tool (MnCMAT) & Crash Data
 & Crash Data") Minnesota Crash Mapping Analysis Tool (MnCMAT) & Crash Data Brad Estochen State Traffic Safety Engineer Minnesota Department of Transportation 2012 Traffic Records Forum Biloxi, MS October 2012 Brief History
Minnesota Crash Mapping Analysis Tool (MnCMAT) & Crash Data Brad Estochen State Traffic Safety Engineer Minnesota Department of Transportation 2012 Traffic Records Forum Biloxi, MS October 2012 Brief History
Fatal Head-On Crashes on. Rural Two-Lane Two-Way Highways in Minnesota
 Fatal Head-On on Rural Two-Lane Two-Way Highways in Minnesota A Report Submitted to the Minnesota Department of Transportation By Derek Leuer, PE Office of Traffic, Safety, and Technology Minnesota Department
Closing Plenary Session
 TRAFFIC SAFETY CONFERENCE Closing Plenary Session June 9, 2017 Las Colinas, TX Order of Report Out June 9, 2017 Las Colinas, TX Distracted Driving Prioritized Countermeasures Countermeasure 4a Systemically
THE FUTURE OF THE TxDOT ROADWAY DESIGN MANUAL
 THE FUTURE OF THE TXDOT ROADWAY DESIGN MANUAL Kenneth Mora, P.E. (Design Division) 10/10/2017 Table of contents 1 2 Reduction in FHWA design controlling criteria Innovative Intersection Guidance 3-7 8-42
Institute of Transportation Engineers Safety Action Plan
 I Institute of Transportation Engineers Safety Action Plan 1. Introduction 2. Intersection Crashes 3. Keep Vehicles on the Road 4. Minimize Consequences When Vehicles Leave the Road 5. School Crossing
Texas Intersection Safety Implementation Plan Workshop JUNE 2, 2016
 Texas Intersection Safety Implementation Plan Workshop JUNE 2, 2016 Why Intersection Safety? A small part of overall highway system, but Each year roughly 50% of all crashes estimated 3 million involve
Occ c u c pa p n a t pro r t O ec e t c i t O i n
 Occupant Protection Occupant Protection Introduction Buckling up or being buckled in is the most effective protection during a car crash. The simple truth is that the great majority of people ejected from
What Engineering Can Do for You! Low Cost Countermeasures for Transportation Safety
 What Engineering Can Do for You! Low Cost Countermeasures for Transportation Safety Adam Larsen Safety Engineer Federal Highway Administration 360-619-7751 Adam.Larsen@DOT.GOV Adam Larsen TTP Safety Engineer
REDUCING COLLISIONS AT HIGH CRASH LOCATIONS
 REDUCING COLLISIONS AT HIGH CRASH LOCATIONS Presented by Nazir Lalani P.E. Traffex Engineers Inc. N_lalani@hotmail.com ACCIDENTS AND SAFETY Why is safety important? Safety components Who is responsible?
HSIP Project Selection Criteria
 HSIP Project Selection Criteria The purpose of the Highway Safety Improvement Program (HSIP) is to reduce the number of fatal and injury crashes by targeting high crash locations and causes. Projects,
Engineering Countermeasures for Transportation Safety. Adam Larsen Safety Engineer Federal Highway Administration
 Engineering Countermeasures for Transportation Safety Adam Larsen Safety Engineer Federal Highway Administration 360-619-7751 Adam.Larsen@DOT.GOV Countermeasure Selection Resources Manual for Selecting
Chapter 5 DATA COLLECTION FOR TRANSPORTATION SAFETY STUDIES
 Chapter 5 DATA COLLECTION FOR TRANSPORTATION SAFETY STUDIES 5.1 PURPOSE (1) The purpose of the Traffic Safety Studies chapter is to provide guidance on the data collection requirements for conducting a
SAFETY PERFORMANCE MEASURES AND TARGET SETTING. Transportation Subcommittee September 15, 2017
 SAFETY PERFORMANCE MEASURES AND TARGET SETTING Transportation Subcommittee September 15, 2017 ACTION REQUESTED No action is requested. This item is for presentation and discussion. PREVIOUS ACTION Presented
TRAFFIC STUDY. Birch Bluff Road / Pleasant Avenue 01/15/2018. City of Tonka Bay 4901 Manitou Road Tonka Bay, MN WSB PROJECT NO.
 TRAFFIC STUDY Birch Bluff Road / Pleasant Avenue 01/15/2018 City of Tonka Bay 4901 Manitou Road Tonka Bay, MN 55331 WSB PROJECT NO. 10805-000 Birch Bluff Road/ Pleasant Avenue Traffic Study For: City of
November 2, Government takes on the challenge of improving traffic safety
 November 2, 2006 Government takes on the challenge of improving traffic safety Edmonton... The Alberta government has taken on the challenge of improving traffic safety by moving ahead with a comprehensive,
Safety at Unsignalized Intersections. Unsignalized Intersections
 Safety at FHWA Safety Focus Areas 2 National Statistics 3 National Statistics There were 41,059 highway fatalities in 2007. Where did they occur? Non-Intersections 79% About half of all crashes and half
Rebecca Szymkowski, P.E., PTOE Wisconsin Department of Transportation. ITE Midwestern District Annual Meeting June 30, 2015
 Rebecca Szymkowski, P.E., PTOE Wisconsin Department of Transportation ITE Midwestern District Annual Meeting June 30, 2015 Strategic Highway Safety Plan (SHSP) Roundabout Safety Analysis J-turn Experiences
Michael D. Turpeau Jr. State Safety Program Supervisor Georgia Department of Transportation
 Michael D. Turpeau Jr. State Safety Program Supervisor Georgia Department of Transportation Safety Programs Highway Safety Improvement Program (HSIP) Off-System Safety Program (OSSP) High Risk Rural Roads
Road Safety Audit Review
 U.S. Highway 14: Mankato to New Ulm Road Safety Audit Review Technical Report April 17, 2012 Prepared By 1.0 INTRODUCTION... 2 1.1 ROAD SAFETY AUDIT REVIEW (RSAR) TEAM... 2 1.2 ROAD SAFETY AUDIT REVIEW
Mission: The mission of FARS is to make vehicle crash information accessible and useful so that traffic safety can be improved
 Mission: The mission of FARS is to make vehicle crash information accessible and useful so that traffic safety can be improved NHTSA created FARS in 1975 National Center for Statistics and Analysis (NCSA)
Access Management in the Vicinity of Intersections
 Access Management in the Vicinity of Intersections FHWA-SA-10-002 Technical Summary Photo: Ralph Bentley (used with permission) 0 Access Management is: The design, implementation and management of entry
2003 road trauma for. Wairoa District. Road casualties Estimated social cost of crashes* Major road safety issues WAIROA DISTRICT JULY 2004
 WAIROA DISTRICT JULY 24 T he Land Transport Safety Authority (LTSA) has prepared this road safety issues report. It is based on reported crash data and trends for the 1999 23 period. The intent of the
Canadian Association of Chiefs of Police Association canadienne des chefs de police
 WHAT S IN THE KIT? Media Advisory Template To be used to invite the media to an event during Operation Impact. We suggest you reproduce this on your own police agency letterhead. News Release Template
APPENDIX G Lane Departure Action Plan
 APPENDIX G Introduction Lane Departure is one of nine emphasis areas of the North Carolina Strategic Highway Safety Plan. This emphasis area targets the following crashes: Ran Off Road Left Ran Off Road
Integrating Safety into the Transportation Decision Making Process
 Wednesday, February 17th, 2016 Integrating Safety into the Transportation Decision Making Process Priscilla Tobias, PE State Safety Engineer Illinois Department of Transportation Increased Focus of Safety
We believe the following comments and suggestions can help the department meet those goals.
 The Honorable Secretary Anthony Foxx The Secretary of Transportation United States Department of Transportation 1200 New Jersey Avenue, SE Washington, DC 20590 August 30, 2013 Dear Secretary Foxx, Thank
PALM BEACH COUNTY LOCAL ROAD SAFETY PLAN
 PALM BEACH COUNTY LOCAL ROAD SAFETY PLAN JANUARY 2019 Street View Images Google 2018 Notice This document is disseminated under the sponsorship of the U.S. Department of Transportation in the interest
Designing for Pedestrians: An Engineering Symposium. Rutgers University March 21, 2013
 Designing for Pedestrians: An Engineering Symposium Rutgers University March 21, 2013 The Problem 2 Pedestrian Fatalities Pedestrian Fatalities by Year in US (1994-2010) 6000 5000 4000 3000 2000 1000 0
South Carolina s Strategic Highway Safety Plan
 Target Zero South Carolina s Strategic Highway Safety Plan 215-218 March 4, 215 Dear Highway Safety Partner: The South Carolina Department of Public Safety (SCDPS) and the South Carolina Department of
Document Safer Roads Ottawa Program Workplan
 Document 2 2012 Safer Roads Ottawa Workplan The 2012 Safer Roads Ottawa (SROP) implementation plan includes: The production of a video to help launch the new SROP; The delivery of an annual year-long campaign-based
CERS Research and Outreach Activities. Keith Knapp, PE Center for Excellence in Rural Safety Annual Transportation Research Conference April 28, 2010
 CERS Research and Outreach Activities Keith Knapp, PE Center for Excellence in Rural Safety Annual Transportation Research Conference April 28, 2010 PRESENTATION CONTENT! Review Some Rural Crash Statistics!
Road Safety Audit Course Participant Guidebook. August 22 & 23, Cleveland Avenue Columbus, Ohio
 Road Safety Audit Course Participant Guidebook August 22 & 23, 2017 Cleveland Avenue Columbus, Ohio 1 2 Table of Contents Executive Summary... 5 Cleveland Avenue City of Columbus... 6 Road Location Details...
Recent U.S. Research on Safety Evaluation of Low-Cost Road Engineering Safety Countermeasures Lessons for Canada
 Recent U.S. Research on Safety Evaluation of Low-Cost Road Engineering Safety Countermeasures Lessons for Canada Bhagwant Persaud Department of Civil Engineering, Ryerson University 350 Victoria Street,
Street Smart - Regional Pedestrian Safety Campaign. Hopkins Grand Rounds July 16, 2014
 Street Smart - Regional Pedestrian Safety Campaign Hopkins Grand Rounds July 16, 2014 Baltimore Metropolitan Council (BMC) Who We Are The organization of the Baltimore region s elected executives, representing
FLORIDA TRANSPORTATION COMMISSION HIGHWAY SAFETY REPORT CALENDAR YEAR 2008
 FLORIDA TRANSPORTATION COMMISSION HIGHWAY SAFETY REPORT CALENDAR YEAR 2008 January 15, 2010 HIGHWAY SAFETY REPORT FOR CALENDAR YEAR 2008 January 15, 2010 2 TABLE OF CONTENTS INTRODUCTION 5 STRATEGIC HIGHWAY
CTDOT Pedestrian and Bicycle Safety Initiatives
 CTDOT Pedestrian and Bicycle Safety Initiatives 2017 Northeast Transportation Safety Conference Mark F. Carlino, P.E. Traffic Engineering Division Chief Bureau of Engineering and Construction Connecticut
SURFACE TRANSPORTATION SAFETY & INVESTMENT UPDATE ON PROGRESS SINCE 2000
 SURFACE TRANSPORTATION SAFETY & INVESTMENT UPDATE ON PROGRESS SINCE 2000 Requested by: American Association of State Highway and Transportation Officials (AASHTO) Prepared by: Timothy Neuman, P.E. CH2M
CDRT. Child Death Review Team Dallas County. Brief Report Traffic-related Child Deaths OVERVIEW
 Dallas County CDRT Child Death Review Team 2013 Brief Report Traffic-related Child Deaths 2006-2011 OVERVIEW In Dallas County, traffic-related injury death rates among children are typically less than
Safety Impacts: Presentation Overview
 Safety Impacts: Presentation Overview The #1 Theme How Access Management Improves Safety Conflict Points The Science of Access Management By Treatment Studies Themes for Texas Access Management Improve
Table of Contents Kansas Highway Safety Improvement Program
 KANSAS Page 1 of 54 Table of Contents Table of Contents... 2 Disclaimer... 3 Executive Summary... 4 Introduction... 5 Program Structure... 5 Program Administration... 5 Program Methodology... 8 Project
What is the problem? Transportation Safety Planning Purdue Road School. 42,636 Fatalities. Nearly 3M Injuries. Over 4M PDO crashes
 Transportation Safety Planning Purdue Road School March 29, 2006 What is the problem? 42,636 Fatalities Nearly 3M Injuries Over 4M PDO crashes $230B Cost to the Nation Trends in Motor Vehicle Fatality
K-10 in Douglas and Johnson Counties
 KANSAS DEPARTMENT OF TRANSPORTATION K-10 in Douglas and Johnson Counties 2014 Corridor Review - Final Report Kansas Department of Transportation 12/8/2014 In response to concerns about median crossover
Traffic Signs (1 of 3)
") Traffic Signs (1 of 3) DESCRIPTION AND DEFINITION 5. Initiate Projects Implement sign upgrade projects and consider sign removal. In the analytical process to determine an agency s annual sign maintenance
Traffic Signs (1 of 3) DESCRIPTION AND DEFINITION 5. Initiate Projects Implement sign upgrade projects and consider sign removal. In the analytical process to determine an agency s annual sign maintenance
Benefits of Center Line Rumble Strips on Rural 2-Lane Highways in Louisiana
 Benefits of Center Line Rumble Strips on Rural 2-Lane Highways in Louisiana Xiaoduan Sun, Ph.D., P.E. University of Louisiana at Lafayette 2018 Louisiana Transportation Conference Baton Rouge, February
INFORMATION TOOL KIT
 CANADA ROAD SAFETY WEEK 2017 INFORMATION TOOL KIT Thank you for being involved in Canada Road Safety Week. With your participation, we can spread the word about this special week and why it is an important
Access Location, Spacing, Turn Lanes, and Medians
 Design Manual Chapter 5 - Roadway Design 5L - Access Management 5L-3 Access Location, Spacing, Turn Lanes, and Medians This section addresses access location, spacing, turn lane and median needs, including
Hot Spot Identification and Analysis Methodology
 Brigham Young University BYU ScholarsArchive All Theses and Dissertations 2013-11-20 Hot Spot Identification and Analysis Methodology Jacob S. Farnsworth Brigham Young University - Provo Follow this and
Sponsored by the Office of Traffic and Safety of the Iowa Department of Transportation NOVEMBER 2001 CTRE
 PAVED SHOULDERS ON PRIMARY HIGHWAYS IN IOWA: AN ANALYSIS OF SHOULDER SURFACING CRITERIA, COSTS, AND BENEFITS EXECUTIVE SUMMARY Sponsored by the Office of Traffic and Safety of the Iowa Department of Transportation
Review of Minnesota s Rural Intersection Crashes: Methodology for Identifying Intersections for Intersection Decision Support (IDS)
") 2004-31 Final Report Review of Minnesota s Rural Intersection Crashes: Methodology for Identifying Intersections for Intersection Decision Support (IDS) Report #1 in the Series: Developing Intersection
2004-31 Final Report Review of Minnesota s Rural Intersection Crashes: Methodology for Identifying Intersections for Intersection Decision Support (IDS) Report #1 in the Series: Developing Intersection
FLORIDA STRATEGIC HIGHWAY SAFETY PLAN
 FLORIDA STRATEGIC HIGHWAY SAFETY PLAN 1 FLORIDA STRATEGIC HIGHWAY SAFETY PLAN Presenter: Joe Santos State Safety Engineer FDOT State Safety Office 2 Presentation 3/28/2017 3 FLORIDA STRATEGIC HIGHWAY SAFETY
Department of Transportation
 Department of Transportation I. Internal Scan The number of older drivers in the United States will double over the next 30 years. By 2030 one in five Americans will be age 65 or older. On a licensed-driver
EVERY MOVE YOU MAKE. everymove.ohio.gov OHIO STRATEGIC HIGHWAY SAFETY PLAN
 EVERY MOVE YOU MAKE everymove.ohio.gov OHIO STRATEGIC HIGHWAY SAFETY PLAN A Comprehensive Plan to Reduce Fatalities and Serious Injuries 2014-2019 TABLE OF CONTENTS 1 Partner Pledge 2 Thank You to Our
APPENDIX C. Systems Performance Report C-1
 APPENDIX C Systems Performance Report C-1 System Performance Report & Requirements According to the FAST Act, a long range transportation plan needs to include a system performance report and subsequent
KANSAS STRATEGIC HIGHWAY SAFETY PLAN
 KANSAS STRATEGIC HIGHWAY SAFETY PLAN 214 Annual Dashboard Report Preliminary Statewide Fatality Analysis The accident data herein, as of February 19, 215, reflect the reporting officer s observations and
Technology Challenges Within Transportation Safety Among Several Indian Reservations
 Technology Challenges Within Transportation Safety Among Several Indian Reservations Trenna L. Terrill, M.S., E.I.T. Center Engineer Khaled Ksaibati, Ph.D., P.E. Center Director OVERVIEW Introduction Background
Rational road safety management Practice and Theory. Bhagwant Persaud Ryerson University Toronto, Canada
 Rational road safety management Practice and Theory Bhagwant Persaud Ryerson University Toronto, Canada Overview Road infrastructure safety management process Evolution of road infrastructure safety management
RURAL HIGHWAY SHOULDERS THAT ACCOMMODATE BICYCLE AND PEDESTRIAN USE (TxDOT Project ) June 7, Presented by: Karen Dixon, Ph.D., P.E.
 June 7, Presented by: Karen Dixon, Ph.D., P.E.") RURAL HIGHWAY SHOULDERS THAT ACCOMMODATE BICYCLE AND PEDESTRIAN USE (TxDOT Project 0-6840) June 7, 2016 Presented by: Karen Dixon, Ph.D., P.E., TTI Team: Kay Fitzpatrick, Raul Avelar, & Subasish Das Project
RURAL HIGHWAY SHOULDERS THAT ACCOMMODATE BICYCLE AND PEDESTRIAN USE (TxDOT Project 0-6840) June 7, 2016 Presented by: Karen Dixon, Ph.D., P.E., TTI Team: Kay Fitzpatrick, Raul Avelar, & Subasish Das Project
Florida s Intersection Safety Implementation Plan (ISIP)
") Florida Department of TRANSPORTATION Florida s Intersection Safety Implementation Plan (ISIP) Alan El-Urfali, PE State Traffic Engineering and Operations Office March 28, 2017 Intersection Safety Implementation
Florida Department of TRANSPORTATION Florida s Intersection Safety Implementation Plan (ISIP) Alan El-Urfali, PE State Traffic Engineering and Operations Office March 28, 2017 Intersection Safety Implementation
Local Rural Road Safety
 Local Rural Road Safety County State Aid Highway (CSAH) 5 Freeborn County, Minnesota National Surface Transportation Policy & Revenue Study Commission Testimony submitted by: Susan G. Miller, P.E. County
Highway 12 Safety Coalition
 Highway 12 Safety Coalition City of Wayzata, City of Long Lake, City of Orono, City of Medina, City of Maple Plain, City of Independence, City of Delano, City of Montrose, City of Waverly, City of Howard
Star Ratings for the Strategic Road Network. Richard Leonard - Highways England
 Star Ratings for the Strategic Road Network Richard Leonard - Highways England Strategic Direction for Road User Safety 2 Delivery Plan Star Rating - Commitments We will ensure that by the end of 2020
Bicycle - Motor Vehicle Collisions on Controlled Access Highways in Arizona
 Bicycle - Motor Vehicle Collisions on Controlled Access Highways in Arizona Analysis from January 1, 1991 to June 30, 2002 Richard C. Moeur, PE Traffic Design Manager, Northern Region Michelle N. Bina
Comprehensive Measures to Reduce Traffic Accident Fatalities
 Comprehensive Measures to Reduce Traffic Accident Fatalities Outcomes: 4,621 people died as a result of traffic accidents in 2015. It represents 4% decrease compared to 2014. Year 2012 2013 2014 2015 Traffic
Defining Purpose and Need
 Advanced Design Flexibility Pilot Workshop Session 4 Jack Broz, PE, HR Green May 5-6, 2010 Defining Purpose and Need In your agency s project development process, when do design engineers typically get
2013 Traffic Safety Report
 Traffic Safety Report Introduction Every year on the more than 1, miles of unincorporated Larimer County roadways, about 375 vehicular traffic crashes occur. Those crashes include about 75 severe crashes
17 th Annual Northwest Tribal Transportation Symposium April 21, 2010 Northwest Region Division of Transportation Bureau of Indian Affairs
 17 th Annual Northwest Tribal Transportation Symposium April 21, 2010 Northwest Region Division of Transportation Bureau of Indian Affairs Strategic t Highway Safety Plan for Indian Lands (SHSP) Washington
Recently Developed Intersection CMFs. Nancy Lefler, VHB ATSIP Traffic Records Forum, 2014
 Recently Developed Intersection CMFs Nancy Lefler, VHB ATSIP Traffic Records Forum, 2014 Overview General Methodology Treatments Installation of traffic signals - with and without left-turn lanes (NCDOT)
Implementing Strategies from Missouri s Blueprint for Safer Roadways Using System-wide Safety Solutions to Save Lives
 Implementing Strategies from Missouri s Blueprint for Safer Roadways Using System-wide Safety Solutions to Save Lives John Schaefer Sr. Traffic Studies Specialist Missouri Department of Transportation
TRB/AASHTO Geometric Design Research Efforts Supplemental Information
 TRB/AASHTO Geometric Design Research Efforts Supplemental Information Status Report on Ongoing Projects Wed, June 14, 3:45 pm - 4:45 pm Overview The TRB Committee on Geometric Design (AFB10) is seeking
SR 53 Corridor Study. Final Report Presentation. Friday, October 3, :00 AM to noon
 SR 53 Corridor Study Final Report Presentation Friday, October 3, 2014 10:00 AM to noon SR 53 Corridor Study Final Report Presentation Study Purpose: Investigate safety improvements along the SR 53 corridor
Safety and Design Alternatives for Two-Way Stop-Controlled Expressway Intersections
 Safety and Design Alternatives for Two-Way Stop-Controlled Expressway Intersections Thomas H. Maze Center for Transportation Research and Education Iowa State University 2901 South Loop Drive, Suite 3100
MN 5 Corridor Performance. Current Corridor Characteristics Highway: MN AADT: 2,400 73,000
 Corridor Context The corridor runs from Norwood Young America to the connection with US 212 in Eden Prairie. The corridor serves the communities of Chanhassen, Eden Prairie, Norwood Young America, Victoria,