MULTIMODAL TRANSPORTATION ANALYSIS FIRST DRAFT NEW ES AT REED SITE WASHINGTON, DC. May 8, 2018 (DRAFT)
|
|
|
- Aleesha Sanders
- 5 years ago
- Views:
Transcription

1 MULTIMODAL TRANSPORTATION ANALYSIS NEW ES AT REED SITE WASHINGTON, DC May 8, 2018 ()
2 Prepared by: 1140 Connecticut Avenue NW Suite 600 Washington, DC Tel: Fax: Centreville Road Suite 330 Chantilly, VA Tel: Fax: Washington Street Suite 136 Haymarket, VA Tel: Fax: This document, together with the concepts and designs presented herein, as an instrument of services, is intended for the specific purpose and client for which it was prepared. Reuse of and improper reliance on this document without written authorization by Gorove/Slade Associates, Inc., shall be without liability to Gorove/Slade Associates, Inc.
3 Contents Executive Summary... i Introduction... 1 Purpose of Study... 1 Study Tasks... 1 Contents of Study... 1 Study Area Overview... 4 Major Transportation Features... 4 Future Projects... 8 Project Design Project Overview Site Access and Parking Loading Bicycle Facilities Travel Demand Assumptions Mode Split Parking Demand Queuing Demand Trip Generation Traffic Operations Study Area, Scope, & Methodology Vehicular Analysis Results Parking Existing Parking Demand Spot Counts Parking Impacts Pedestrian Facilities Sidewalk Review Crossing Review Planned Pedestrian Infrastructure Pedestrian Recommendations Bicycle Facilities Existing Bicycle Facilities Review Planned Bicycle Facilities Bicycle Facilities at the New ES Bicycle Recommendations Transportation Management Plan Transportation Demand Management Safe Routes to School Parking Management Plan Arrival and Dismissal Plans Performance and Monitoring Summary and Conclusions... 75
4 Figures Figure 1: Site Location... 3 Figure 2: Walkscore and Bikescore... 5 Figure 3: Major Regional Transportation Facilities... 6 Figure 4: Major Local Transportation Facilities... 7 Figure 5: Map of Local Initiatives Figure 6: Map of Nearby Developments Figure 7: Overview of Existing and Proposed Access Figure 8: Library and New ES Staff Access Figure 9: Student, Visitor and Loading Access Figure 10: Vehicular Trip Generation Summary Figure 11: Study Area Intersections Figure 12: Existing Peak Hour Volumes Figure 13: Background Peak Hour Volumes Figure 14: Staff Distribution Figure 15: Local Traffic Distribution Figure 16: Student Drop Off/Pick Up Distribution Figure 17: Existing Trips Removed Figure 18: Reapplied Library Trips Figure 19: New ES Staff Trips Figure 20: New ES Student Trips Figure 21: New ES Visitor Trips Figure 22: Total New ES Generated Trips Figure 23: Total Future Peak Hour Trips Figure 24: Existing Lane Configurations Figure 25: Background Lane Configurations Figure 26: Total Future Lane Configurations Figure 27: Parking Count Study Area Figure 28: Peak Parking Occupancy Figure 29: Parking Categories within Study Area Figure 30: Parking Occupancy, Overall and Site Figure 31: Parking Occupancy, Retail and Residential Figure 32: Spot Count Area Figure 33: Spot Count Comparison, Overall and Site Figure 34: Spot Count Comparison, Retail and Residential Figure 35: Pedestrian Study Area Figure 36: Exiting Pedestrian Facilities (quarter mile) Figure 37: Existing Pedestrian Facilities (routes to west) Figure 38: Existing Pedestrian Facilities (routes to east) Figure 39: Future Pedestrian Facilities (quarter mile) Figure 40: Future Pedestrian Facilities (routes to west) Figure 41: Existing Bicycle Facilities Figure 42: Future Bicycle Facilities Tables Table 1: Student Morning Mode Split Survey Results Table 2: Student Afternoon Mode Split Survey Results Table 3: Summary of Staff Mode Split Survey Results Table 4: New ES Mode Splits (baseline) Table 5: New ES Mode Splits (with Enhanced TDM) Table 6: New ES Mode Splits (with Inclement Weather) Table 7: Parking Demand Summary Table 8: Trip Generation Summary (baseline) Table 9: AADT Volume Trends Table 10: Capacity Analysis Results Table 11: Queuing Analysis Results Table 12: Sensitivity Analysis Results Table 13: Summary of Parking Demand Table 14: Summary of Spot Count Parking Demand Table 15: Arlington County Sidewalk Requirements Table 16: Crossing Distance Analysis (Wash Blvd)... 63
5 EXECUTIVE SUMMARY The following report is a Multimodal Transportation Analysis (MMTA) for the New Elementary School (ES) at the Reed site. The New ES at Reed project consists of creating a new neighborhood elementary school, with a capacity of 732 students, to be opened in for the start of the school year. The Reed site was selected for a new neighborhood school in the APS Strategic Plan. The project is currently in the schematic design phase. This MMTA is based on the conceptual plans for the New ES. School and Integration Station. The Westover library will remain, and the athletic fields will be reconfigured but remain on the site. Transportation Demand Based on extensive surveys of APS students and staff, observations of the Reed site and other APS facilities, and traffic and parking data collected near the Reed site, this report assembled detailed projections of travel demand assumptions for the New ES. The following mode splits are anticipated for the New ES: The purpose of this report is to review existing and future transportation facilities in the area surrounding the project site, project transportation demand needs of the project, determine if the new transportation demand generated by the project would have detrimental impacts on the surrounding transportation network, and present recommendations to minimize the detrimental impact from the proposed project. This report concludes that the New ES at the Reed site will not have a detrimental impact to the surrounding transportation and roadway network given the recommendations from this report are implemented, including the Transportation Management Plan. Study Area and Project Description The site is surrounded by an extensive regional and local transportation system that will connect students, staff, and visitors of the project to the rest of Arlington County and surrounding areas. Several local initiatives will positively impact the study area, including the Washington Boulevard Bike, Pedestrian, and Roadway Enhancements, and a number of Neighborhood Conservation projects. The current Reed site is home to: The Westover Library, a local branch of the Arlington Public Library The Children s School, a non profit daycare and preschool focused on serving APS staff Integration Station, APS preschool for special education students A recreational area with several athletic fields The conceptual plan to add an elementary school for the site demolishes the building currently housing The Children s Students: o 38% Automobile o 36% School Bus o 26% Walk/Bike Staff: o 89% Automobile o 9% School Bus o 2% Transit The conceptual design was based on projected transportation demands, which are detailed in the report. The site was designed to accommodate: Parking demand of 45 spaces for the library, and 119 spaces for the New ES Queuing room for 30 cars at the student drop off and pick up area Space for 7 school buses to load and unload students The conceptual design for the project includes 125 parking spaces in expanded Northwest and 18 th Street lots, and approximately 10 spaces that can be used for visitor parking in the pick up/drop off area. After schematic design, this number may change slightly. Based on the expected supply, some of the parking demand is accommodated on street as a compromise between having parking accommodated on site and providing greenspace and recreation fields on site. Traffic Operations This MMTA contains a detailed analysis of capacity at nearby intersections. The assumptions and methodologies of the capacity analyses were scoped with Arlington County DES staff. The analyses include a comparison of traffic capacity for existing conditions, and projected future conditions including i
6 scenarios with and without the project. These analyses reached the following conclusions: The existing study area intersections all operate at acceptable levels of service and delay, with one exception. The southbound approach of 18 th Street N to Washington Boulevard shows has long delays as side street traffic waits for gaps in Washington Boulevard traffic. This condition is common for side streets with low traffic volume intersecting an arterial like Washington Boulevard. The future scenarios show similar results, with all study area intersections operating at acceptable levels with one exception. Traffic generated by the New ES has a negligible impact on the PM commuter peak hour. This report does not recommend any traffic mitigation measures for the proposed New ES A sensitivity anlaysis that explored different mode split scenarios for the New ES confirmed the findings of the baseline mode split scenario. Parking Impacts This MMTA reviewed the projected parking demand and opportunities for parking supply to determine potential impacts the project could have on the surrounding neighborhood. Detailed counts of parking occupancy on surrounding streets and nearby off street parking lots were performed to gain an understanding of parking opportunities and concerns. After reviewing the data collected, this report found the following: The New ES and associated parking lots should maximize the ability to share parking between the New ES and the library in a manner that helps prevent library visitor parking from using other parking supplies. Residential parking on surrounding streets in the neighborhood is readily available during the school day. The streets directly adjacent to the school could serve as a potential resource of parking supply for New ES staff and visitors. The retail areas adjacent to the Reed site generate parking demand that coincides with school peak parking demand. Thus, there is a potential for the New ES parking demand to impact retail parking supply. Additionally, there is an opportunity for retail parking demand to use school parking supply outside of school hours. Based on the overlap of parking demands with New ES, and in order to most efficiently use the parkin provided on the Reed site while saving space for recreation fields, this report presents the following parking recommendations: Take advantage of the parking availability on surrounding neighborhood streets by using it as part of the parking supply for New ES staff. Discourage New ES (and library) staff from parking in front of retail areas or the library, so that those spaces can be used by retail patrons and library visitors. Work with County staff on curbside management changes to on street parking areas to deter staff parking in certain locations. Utilize the New ES s area set aside for arrival drop off and dismissal pick up queuing for visitor parking at other times. This additional visitor parking could be used by the library, notably to boost the supply during events such as story time that do not coincide with school arrival or dismissal. Sign the expanded Northwest and 18 th Street parking lots in a manner that encourages sharing outside of school operating hours. Use signs such as APS and Library Staff parking only, Mon Fri 6:00 AM to 4:30 PM, Public parking all other times. Pedestrian Facilities The report contains a review of pedestrian walking routes to and from the Reed site to help develop a set of recommendations improvements to raise the potential walking mode spit of students and staff at the New ES. The steps performed in this review included: A detailed review of infrastructure within a 0.25 radius of the site A detailed review of additional walking routes beyond 0.25 miles, based on potential walk zone boundaries for the New ES A review of crossing quality along walking routes across arterial roadways An examination of impacts that planned County projects would have on walking route quality ii
7 The following conclusions are reached regarding pedestrian facilities: Walking routes adjacent to the school generally meet County standards, with some exceptions Some targeted sidewalk improvements could help improve walking route quality, within the study area sidewalks can primarily be improved by adding sidewalks along expected walking routes that only have a sidewalk on one side of the street The presence of multiple signalized intersections along Washington Boulevard in the vicinity of the site provide safe crossing locations for pedestrians across an arterial. Already planned infrastructure enhancements by the County on Washington Boulevard and Patrick Henry Drive will significantly improve pedestrian access to the site, especially at the intersection of Patrick Henry Drive and 16th Street N To aid crossings at arterials, this report recommends all crosswalks over Patrick Henry Drive at its intersections with 18 th Street N and 16 th Street N be re stripped as high visibility style (continental) crosswalk markings with road side School Crossing signage. This report recommends that the placement of crossing guards be considered at the following intersections when the school opens: o Washington Boulevard and 18 th Street N o Patrick Henry Drive and 18 th Street N o Patrick Henry Drive and 16 th Street N o N Lexington Street and 18 th Street N Bicycle Facilities Based on a review of bicycle facilities, this report concludes the following: The site has good connectivity to existing on and offstreet bicycle facilities. The site is surrounded by local neighborhood streets, bicycle lanes on Washington Boulevard and Patrick Henry Drive, and the W&OD and Custis Trails. While there are no bicycle lanes on Washington Boulevard adjacent to the site and stretching westward, planned improvements will add bicycle lanes and narrow vehicular lanes in both direction, improving bicycle comfort levels. There is one (1) Capital Bikeshare station adjacent to the site, with an additional station planned to be installed at the intersection of Washington Boulevard and Patrick Henry Drive in FY2018. The plans for on site bicycle parking for the New ES are currently being developed as part of the schematic design. The school plans to meet or exceed County requirements for short and long term bicycle parking on site, including providing showers and lockers for staff that commute via bicycle. This report recommends short term bicycle parking be located on both the southern and northern entrances to the New ES, as cyclists will likely approach the school from several directions. Transportation Management Plan A Transportation Management Plan (TMP) has many components that are tailored to accommodate a given facility with the goal being the reduction of automobile trips by encouraging alternative forms of transportation and ensuring safe and efficient operations of transportation facilities. This report outlines some of the potential TMP components for the New ES, including: A Transportation Demand Management (TDM) plan; A Safe Routes to School plan; A Parking Management Plan; Arrival and Dismissal Plans; and A Performance and Monitoring Plan. iii
8 INTRODUCTION APS Go! data for comparable APS facilities was reviewed to help establish mode split assumptions. This report is a Multimodal Transportation Analysis (MMTA) for the New Elementary School (ES) at the Reed site. The New ES at Reed project consists of creating a new neighborhood elementary school, with a capacity of 732 students, to be opened in for the start of the school year. The Reed site was selected for a new neighborhood school in the APS Strategic Plan. The project is currently in the schematic design phase. This MMTA is based on the conceptual plans for the New ES. Figure 1 shows the location of the Reed site. PURPOSE OF STUDY The purpose of this report is to: 1. Review existing and future transportation facilities in the area surrounding the project site. 2. Project the transportation demand needs of the proposed project. 3. Determine if the new transportation demand generated by the project would have detrimental impacts on the surrounding transportation network 4. Present recommendations to minimize the detrimental impact from the proposed project, including providing recommendations for the design team to incorporate into the schematic design STUDY TASKS The following tasks were completed as part of this study: A scoping meeting was held with Arlington County Department of Environmental Services (DES) staff on January 3, This meeting reviewed assumptions and methodologies for this MMTA. A scoping form based on the meeting with County staff was submitted to the County and subsequently approved. Field reconnaissance was performed at the Reed site to review lane configurations and traffic controls, as well as at other APS elementary schools to review pick up/drop off procedures and queues. Traffic counts were conducted at 11 locations on Thursday, February 1, Parking counts (inventory and occupancy) were conducted in the area surrounding the Reed site on Tuesday December 12, 2017, and Thursday, April 12, Capacity analyses for the existing conditions were performed. A revised scoping form submitted to the County and subsequently approved. The revised scoping form updated some of the assumptions to be used in this MMTA based on the processed APS Go! data and the existing conditions capacity analysis results. Future capacity analyses were performed based on the revised scope. Multimodal analyses were performed reviewing pedestrian and bicycle travel to and from the project. The analysis findings and recommendations were documented in this report. CONTENTS OF STUDY This report contains nine sections as follows: Study Area Overview This section reviews the area near and adjacent to the proposed project and includes an overview of the site location, and local initiatives within the study area. Project Design This section reviews the transportation components of the project, including the site plan and access. Included is a review of parking, truck access, and loading/unloading facilities. Travel Demand Assumptions This section outlines the travel demand of the proposed project. It contains projections on the mode splits of site users and summarizes the proposed trip generation of the project. Traffic Operations This section provides a summary of the existing roadway facilities and an analysis of the existing and future roadway capacity in the study area. This section highlights the vehicular impacts of the project, including presenting mitigation measures for minimizing impacts as needed. 1
9 Parking This section reviews the available parking surrounding the Reed site and presents parking recommendations. Pedestrian Facilities This section summarizes existing and future pedestrian access to the site, reviews walking routes to and from the project site, outlines impacts, and presents recommendations as needed. Bicycle Facilities This section summarizes existing and future bicycle access to the site, reviews the quality of cycling routes to and from the project site, outlines impacts, and presents recommendations as needed. Transportation Management Plan This section outlines the various components of the project s Transportation Management Plan (TMP), including Transportation Demand Management (TDM) and Safe Routes to School (SRTS) plans. Summary and Conclusions This section presents a summary of the recommended mitigation measures by mode and presents overall report findings and conclusions. 2

10 Figure 1: Site Location 3
11 STUDY AREA OVERVIEW This section reviews the study area and includes an overview of the site location, including a summary of the major transportation characteristics of the area and of future regional projects. The following conclusions are reached within this chapter: The site is surrounded by an extensive regional and local transportation system that will connect students, staff, and visitors of the project to the rest of Arlington County and surrounding areas. The site is served by public transportation with access to two Metrorail lines, and several local and regional bus routes. There is existing bicycle infrastructure including the W&OD and Custis Trails, and several bicycle lanes and signed routes in the vicinity of the site. Pedestrian conditions are generally good, particularly along anticipated major walking routes Several local initiatives will positively impact the study area, including the Washington Boulevard Bike, Pedestrian, and Roadway Enhancements, and a number of Neighborhood Conservation projects MAJOR TRANSPORTATION FEATURES Overview of Regional Access Overview of major facilities, not a detailed description. Include highways, arterials, transit, major bicycle facilities. Cite mode specific chapters if they exist later in the report. The New ES at Reed site has ample access to regional vehicular, transit, and bicycle based transportation options, as shown in Figure 3, that connect the site to destination within Virginia, the District, and Maryland. The site is located 0.8 miles from the East Falls Church Metrorail station, which is serviced by the Orange and Silver lines, and provide connection to areas in Virginia, the District, and Maryland that are near Metrorail. The site is also serviced by one major regional bus route which connects to multiple Metrorail stations in Arlington County and Falls Church. The site is located a short distance from the W&OD and Custis Trails, which are both located less than 0.5 miles from the site. These two trails make up part of the Arlington Loop, which provides local and regional off street connectivity for bicycles to and from the site. A detailed review of existing and bicycle access and infrastructure is provided in a later section of this report. Overall, the site has access to several regional roadways, transit, and bicycle options, making it convenient to travel between the site and destinations in the Virginia, the District, and Maryland. Overview of Local Access Overview of major facilities, not a detailed description. Include collectors, local transit, bicycle facilities. Cite mode specific chapters if they exist later in the report. There are several local transportation options near the site that serve vehicular, transit, walking, and cycling trips, as shown on Figure 3. The site is served by a local vehicular network of low volume neighborhood streets that provide connections from regional roads to the site. Arlington Transit (ART) is a local bus system provided by Arlington County. ART supplements Metrobus with cross County routes as well as neighborhood connections to Metrorail. As shown in Figure 4 there are multiple bus routes that service the site. In the vicinity of the site, the majority of bus routes travel along Washington Boulevard. The site is accessible from interstate I 66, US Highways such as US 29 (Lee Highway) and US 50 (Arlington Boulevard), as well as State Routes such as SR 237 (Washington Boulevard), SR 694 (Great Falls Street), and SR 120 (N Glebe Road). All of these roadways bring vehicular traffic within a half mile of the site, at which point arterials and local roads can be used to access the site directly. The main arterials in the vicinity of the site are Washington Boulevard and Patrick Henry Drive. There are existing bicycle facilities that connect the site to neighborhoods within Arlington County, most notably bicycle lanes on Patrick Henry Drive, Washington Boulevard, and N Ohio Street. Other facilities include bicycle friendly roads that include signed routes on N Lexington Street, N McKinley Road, 16 th Street N, and 22 nd Street N. 4

12 As shown in Figure 2, the site is situated in a neighborhood that encompasses good walkscores and bikescores. The site is in an area that provides a better walking environment than areas to the west and south which either lack sidewalk coverage or have physical barriers limiting connectivity such as I 66. A detailed review of existing and proposed pedestrian access and infrastructure is provided in a later section of this report. Car sharing Two car sharing companies provide service in Arlington County: Zipcar and Car2Go. Both are private companies that provide registered users access to a variety of automobiles. Of these, Zipcar has designated spaces for their vehicles. There are no car share locations within a quarter mile of the site. Car sharing is also provided by Car2Go, which provides pointto point car sharing. Car2Go currently has a fleet of vehicles located throughout the District and Arlington. Car2Go vehicles may park in any non restricted metered curbside parking space or Residential Permit Parking (RPP) location in any zone throughout the defined Home Area. Members do not have to pay the meters or pay stations. Car2Go does not have permanent designated spaces for their vehicles; however, availability is tracked through their website and mobile phone application, which provides an additional option for car sharing patrons. Walkscore Walkscore.com is a website that provides scores and rankings for the walking, biking, and transit conditions within neighborhoods of Arlington County. Based on this website the planned development is located in the Highland Park Overlee Knolls neighborhood. The site location has a walk score of 76 (or Very Walkable ), a transit score of 51 (or Good Transit ), and a bike score of 75 (or Very Bikeable ). shows the neighborhood borders in relation to the site location and displays a heat map for walkability and bikeability. The site is situated in an area with good walk scores because of the abundance of neighborhood serving retail locations that are in close proximity, where most errands can be completed by walking. The transit score was based on the proximity to multiple bus lines, and distance to the nearest Metrorail stop which is located 0.8 miles from the site. The site is situated in an area with good bike scores due to its proximity to low volume residential roadways, number of bike lanes and trails, and flat topography. Overall, the Highland Park Overlee Knolls neighborhood has high walk, transit, and bike scores. Additionally, planned roadway improvements will help increase the walk, bike, and transit scores in the Highland Park Overlee Knolls neighborhood. Figure 2: Walkscore and Bikescore 5

13 Figure 3: Major Regional Transportation Facilities 6

14 Figure 4: Major Local Transportation Facilities 7
15 FUTURE PROJECTS There are a few local initiatives and approved developments in the vicinity of the site. These planned and proposed projects are summarized below. Local Initiatives Washington Boulevard Bike, Pedestrian, and Roadway Enhancements The stretch of Washington Boulevard between Westover and East Falls Church is a VDOT owned and operated roadway. During the winter of 2016/2017, County staff developed a new striping and marking plan, with input from area property owners and community stakeholder groups, and VDOT will execute the work. Currently the road consists of two wide travel lanes and on street parking through much of the corridor. The most significant feature of the proposed layout is the introduction of bicycle lanes in both directions; some stretches getting an additional 2 or 3 foot buffer against moving traffic. The 2011 East Falls Church Area Plan calls for bike lanes along the entire stretch of Washington Boulevard through the master plan area. The 2008 Bicycle Element of the Master Transportation Plan (MTP) also calls for bike lanes in the same area. The final plan as submitted to VDOT provides a number of benefits, including: Helping stitch together the expanding Capital Bikeshare system (a new station was installed at the East Falls Church metro station in 2016 and two new stations will be installed in Westover in 2017 and 2018); Connecting existing bicycle lanes on Washington Boulevard between the Westover neighborhood and Lacy Woods Park neighborhood; Creating a nearly two mile stretch of bicycle lanes from N Sycamore Street to George Mason Drive; The narrowing of unnecessarily wide travel lanes to help calm traffic; Installing a dedicated left turn lane for westbound Washington Boulevard at N Ohio Street to help reduce backups; Improving pedestrian comfort on sidewalks due to buffering provided by the new bicycle lanes; and Pedestrian safety improvements at key intersections with highly visible markings for crosswalks. This project is currently undergoing construction. East Falls Church Plan The East Fall Church Plan was adopted in 2011 by the County Board and designated the area in the vicinity of the East Falls Church Metrorail station as the East Falls Church Neighborhood Center District. The East Falls Church Plan built on recommendations made by the citizen task force including: Preserving single family areas and historic and natural resources; Providing opportunities for new open spaces and neighborhood serving retail, including a grocery store; Limiting building heights to four to six stories along building frontages, with specific height guidance for the park and ride site up to nine stories; Outlining goals and strategies for attaining affordable housing units; Considering financing options for a new West Entrance to the Metrorail station; Reducing auto congestion and limit spillover parking impacts; Improving bicycle and pedestrian safety and connectivity; Enhancing bus service; and Studying improvements to I 66. Major challenges in developing a plan for the area were connecting both sides of I 66 through better bicycle and pedestrian facilities, addressing current and future traffic issues, and providing opportunities for mixed use development that complements the character of the neighborhood. Key elements of the plan include: A Neighborhood Center vision for that includes preserving the surrounding single family neighborhoods, preserving and creating new open spaces, providing opportunities for additional neighborhood oriented retail and enhancing pedestrian and bicycle connections to the Metrorail station; A new mixed use development node at the existing 422 space park and ride site to include: ground floor retail, a pool of 100 to 200 shared public parking spaces priced to favor short term parkers, a public open space and continuation of existing bus operations; 8
16 New public open spaces adjacent to the W&OD Trail near Lee Highway; A new west entrance to the East Falls Church Metrorail station to make the station more accessible from proposed development along Lee Highway and Washington Street in the City of Falls Church; and Street improvements including new lane configurations, addition of on street bicycle lanes, on street parking (where possible), and intersection enhancements to increase pedestrian safety and reduce speeding and merging conflicts. Neighborhood Conservation (NC) Projects The Neighborhood Conservation (NC) Program helps improve and enhance Arlington neighborhoods. When the program was created in 1964, the goal was to empower residents by having them come together to discuss and share ideas for improving their neighborhoods. Today, the program provides funding for a variety of improvements including: installation of sidewalks, curbs and gutters, streetlights, signs, park improvements, neighborhood art and beautification. This program empowers citizens to identify and plan projects in their own neighborhoods N Ohio Street / John Marshall Trail Improvements This is a pedestrian safety and street improvement project on N Quintana Street from Washington Boulevard to 19 th Street N. The project scope includes: (1) a new 5 foot wide concrete sidewalk being constructed along the east side of the street. It will narrow to 4 foot in width at one location to protect a mature tree; (2) a utility/buffer (grass) strip, located adjacent to the sidewalk; (3) LED Carlyle style streetlights replacing existing DVP owned Cobra streetlights; (4) storm water drainage improvements within the project limits; (5) the street width narrowing to 28 feet at the northerly end of the project limits, closer to Washington Boulevard, and on street parking will being retained along both sides; and (6) the street width being narrowed to 22 feet at the mid to southerly parts of the project limits, and on street parking being retained along the east side only. The narrowed roadway will maintain two travel lanes, one in each direction, but will be considered a yield street. N Ohio Street / John Marshall Trail Improvements The segment of N Ohio Street from 22 nd Street N to Washington Boulevard will be improved to include sidewalks, crosswalks, and curb ramps that meet Arlington County and ADA standards. In addition, LED streetlight improvements may also be implemented in the future. 22 nd Street N Improvements The street improvement project on 22 nd Street N from N Kentucky Street to N Lexington Street proposes to construct a curb and gutter where there currently is none on the north side of the street. The project scope also includes a proposed curb extension with bio retention basin on 22 nd Street N, adjacent to the property located at 5709 N 22 nd Street. Patrick Henry Drive Street Improvement Project This is a neighborhood pedestrian safety and beautification project to install curb extensions at Washington Boulevard at Patrick Henry Drive; curb extensions at 15 th Street N, with double handicap accessible ramps on the west side of Patrick Henry Drive to accommodate mid block crossing; curb extensions at 16 th Street N and N Lexington Street; bump out entrance into parking area of Westover Apartments on the west side of Patrick Henry Drive; the installation of 5 foot bicycle lanes on the west side of Patrick Henry Drive from Washington Boulevard to 16th Street N; 5 foot sidewalk along several locations; yellow painted dividing stripe on Patrick Henry Drive, and re orienting parking on the west side at the Westover Apartments to be 60 degree back in parking. Travel lanes will be 10 feet on both sides of Patrick Henry Drive. N Illinois Street Improvements Pedestrian safety and street improvement project on North Illinois Street from 22 nd Street N to Lee Highway. The project scope includes: (1) design and installation of a new 5 foot continuous sidewalk, with a 2.5 foot utility/buffer strip, curb, and gutter on the west side of the street; (2) continuous curb and gutter on the east side of the street; (3) ADA compliant pedestrian ramps throughout the project area; and (4) curb extensions at the intersections of N Illinois Street with N 22 nd Road, N 23 rd Street, and N 24 th Street. 24 th Street Improvements This is a neighborhood pedestrian safety and beautification project on 24 th Street N, from N Illinois Street to N Kensington Street. The project scope includes: (1) installing a continuous 5 foot sidewalk, curb and gutter, and associated storm water infrastructure, on the south side of 24 th Street N; (2) on street parking being retained on both sides of 24 th Street N; (3) ADA compliant pedestrian ramps being installed at the intersections with N Illinois Street and N Kensington Street; and (4) New 9
17 Carlyle style streetlights installed in the new 2.5 foot utility/buffer strip adjacent to the sidewalk. Based on industry standards, some of the infrastructure improvements identified above were included in this report s future traffic models. The Traffic Operations chapter of this report details which projects met standards for inclusion, and how future changes were assumed and incorporated into the analysis. Potential Developments There is one (1) potential development project in the vicinity of the site, which was considered for inclusion as part of this study. Figure 6 identifies the location of this development. Virginia Hospital Center Expansion In 2015, Virginia Hospital Center (VHC) proposed the expansion of the hospital on an adjacent parcel of land at 1800 N Edison Street. Generally known as the Edison Site, the 5.6 acre site was owned by the County at the time. VHC intends to incorporate the Edison Site into their existing, adjacent campus for a total site area of 21.6 acres. VHC's rezoning, site plan amendment, and use permit amendment applications propose to: Rezone Edison Site from "S 3A" to "S D"; Replace existing buildings on Edison Site with a new 7 story medical office building and an 8 story parking garage; and Convert 120,000 square feet of medical office use on the current VHC campus to hospital use. The Site Plan Review Committee, including members of the Planning Commission and representatives of other advisory commission and nearby civic associations, will meet to review the proposed development plans in

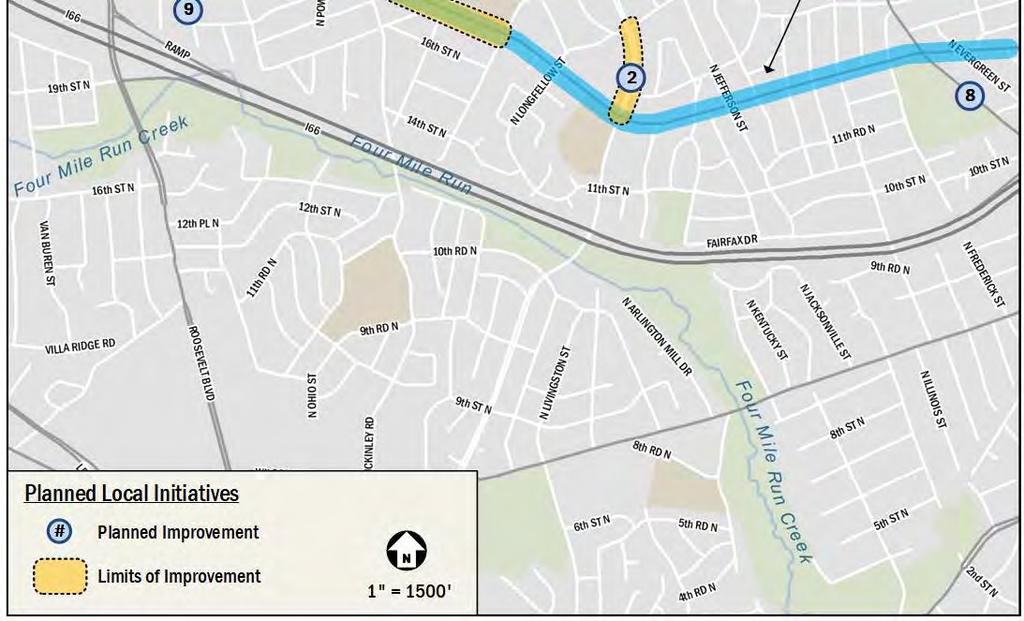
18 Figure 5: Map of Local Initiatives 11


19 Figure 6: Map of Nearby Developments 12
20 PROJECT DESIGN library staff parking, and a general parking lot on 18 th Street, which is used primarily by visitors to the Reed site. This section reviews the transportation components of New Elementary School (ES) at the Reed site project. This includes an overview of how the site will be accessed by it various users, and how each mode is accommodated. The New ES at Reed project consists of creating a new neighborhood elementary school, with a capacity of 732 students, to be opened in for the start of the school year. The Reed site was selected for a new neighborhood school in the APS Strategic Plan. This report is based on a conceptual design approved by the School Board and developed by APS, the design team, and the BLPC (Building Level Planning Committee) and PRFC (Public Facilities Review Committee). The project is currently in schematic design, and thus specific details are likely to change. It is not anticipated that major transportation site elements will change, such as parking lot locations or driveways. Changes will likely be limited to slight differences in the total number of parking spaces in the expanded parking lots. PROJECT OVERVIEW The current Reed site is home to: The Westover Library, a local branch of the Arlington Public Library The Children s School, a non profit daycare and preschool focused on serving APS staff (with approximately 120 students) Integration Station, APS preschool for special education students (with approximately students) A recreational area with several athletic fields The conceptual plan to add an elementary school for the site demolishes the building currently housing The Children s School and Integration Station. The Westover library will remain, and the athletic fields will be reconfigured but remain on the site. An overview of changes to the Reed site is presented in Figure 7. SITE ACCESS AND PARKING Current vehicular access to the site is located on the Northwest parking lot behind the library, which accommodates APS and Future vehicular access will remain similar to existing. The Northwest parking lot will be expanded but will remain a staff parking lot. This is because the location of the Northwest lot, off 18 th and Madison Streets, is accessed via residential streets and 18 th Street s intersection with Washington Boulevard is unsignalized. Since access to the parking lot is less intuitive and doesn t offer drivers a lot of routing choices, it is best used by staff instead of visitors (and especially parents picking up and dropping off students). The 18 th Street lot will also be expanded, and will accommodate visitor parking, staff parking not accommodated in the Northwest lot, and a student drop off/pick up loop and queuing area. In addition to being expanded, the 18 th Street lot will remove one of its curb cuts and switch to a one way loop circulation out of the same curb cut. This allows for more space for queuing and decreases a pedestrian/vehicular conflict point near the front door of the school. The conceptual design was based on projected transportation demands, which are detailed in the next chapter of this report. In summary, the site was designed to accommodate: Parking demand of 45 spaces for the library, and 119 spaces for the New ES Queuing room for 30 cars at the student drop off and pick up area Space for 7 school buses to load and unload students Figure 8 and Figure 9 present a summary of future site access. Library Access Library staff and volunteers will park in the expanded Northwest lot. This report recommends that 15 spaces within that lot have signage reserving spaces for the library, since the library opens later than the new ES. Library patrons will have access to visitor parking in the expanded 18 th Street lot. This report recommends that the visitor parking within eh 18 th Street lot is signed to prevent is being used by staff. It is also anticipated that many library patrons will park on the street adjacent to the library, as they do today. 13
21 New ES Access Staff for the new ES will park in the expanded northwest lot, the expanded 18 th Street lot, and on street adjacent to the Reed site. Although most staff parking will be accommodated on the Reed site, some parking is expected to occur on street. This represents a compromise between minimizing impacts to the surrounding neighborhood with providing green space and recreation facilities on site. A detailed review of parking, and potential impacts is included in a chapter later in this report. School buses will be accommodated on street on McKinley/18 th Streets in front of the building near the front door. There is room for seven buses. Drivers dropping off students the morning and picking them up in the afternoon will do so in the expanded 18 th St lot. A dedicated loop and queuing space for this activity will be incorporated in the lot. The queuing space can accommodate around 30 vehicles, which is sufficient to handle the anticipated demand. LOADING The New ES s loading facilities are anticipated to remain where they are today, on the northwest side of the building adjacent to the Northwest lot. Design of the loading dock is currently being performed as part of the schematic design phase. BICYCLE FACILITIES The amount of location of bicycle racks on the Reed site will be determined as part of schematic design. The bicycle facilities chapter later in this report presents recommendations on the types and location for on site bicycle parking. 14


22 Figure 7: Overview of Existing and Proposed Access 15

23 Figure 8: Library and New ES Staff Access 16

24 Figure 9: Student, Visitor and Loading Access 17
25 TRAVEL DEMAND ASSUMPTIONS Table 1: Student Morning Mode Split Survey Results Morning Mode Split This section outlines the transportation demand of the proposed new ES at the Reed site. This includes a review of APS Go! survey information, expected mode splits for staff and students, vehicular trip generation, parking demand and estimates of queuing space needed for school buses and parent drop off/pick up. MODE SPLIT The main source of mode split information for this report was APS Go! survey data collected in These surveys included all APS schools, and consisted of multiple surveys including student tallies, parent surveys, and staff surveys. Not only do these surveys include mode split questions, but they also asked many other relevant questions where the responses where used to help assemble assumption for this report (e.g. arrival and departure times for staff). APS Go! data for the student tallies and parent surveys were reviewed to help establish assumed modes splits for the New ES at the Reed site. Table 1 summarizes the morning mode split data from these surveys, and Table 2 contains the afternoon mode split survey results. The surveys were summarized in three categories, (1) all APS elementary schools, (2) all APD neighborhood schools (since the New ES will be a neighborhood school), and (3) just the results for the closest neighborhood elementary school to the Reed site, McKinley ES. After comparing the summarize of survey information, this report decided to base assumptions on the student tallies over the parent surveys, as it appeared they were a more accurate reflection of mode splits. Based on the parent responses, they were overestimating the amount of times they would walk their children to school compared to how much they actually drive their children to school. A similar summary of mode splits was performed for staff using the APS Go! data, the only difference being that the two closest APS facilities to the Reed site were averaged as comparable locations, McKinley ES and Swanson MS. This information is summarized in Table 3. Population & Source Auto All APS Elementary Schools Carpool School Bus Walk Bike Transit Parent Survey 25% <1% 43% 30% 1% <1% Student Tally 37% 2% 39% 21% 1% <1% APS Neighborhood ES Parent Survey 25% <1% 39% 34% 1% <1% Student Tally 36% 2% 36% 24% 2% <1% McKinley ES Parent Survey 16% 1% 49% 34% <1% <1% Student Tally 37% 1% 41% 21% <1% <1% Table 2: Student Afternoon Mode Split Survey Results Population & Source Auto All APS Elementary Schools Carpool Afternoon Mode Split School Bus Walk Bike Transit Parent Survey 36% <1% 35% 26% 2% <1% Student Tally 36% 3% 38% 22% 1% <1% APS Neighborhood ES Parent Survey 35% <1% 32% 30% 2% <1% Student Tally 35% 3% 36% 24% 2% <1% McKinley ES Parent Survey 36% 1% 35% 29% <1% <1% Student Tally 37% 1% 40% 22% <1% <1% Table 3: Summary of Staff Mode Split Survey Results Population Mode Auto Carpool Walk Bike Transit All APS Staff 85% 3% 4% 3% 5% APS Neighborhood ES Staff 84% 3% 5% 2% 6% McKinley ES and Swanson MS Staff 86% 3% 7% 2% 2% 18
26 Based on the survey results above (including APS Go! survey information from school visitors), this report assembled baseline assumptions regarding anticipated mode splits for students, staff, and visitors are the New ES. These assumptions are summarized in Table 4. Table 4: New ES Mode Splits (baseline) Population Auto Carpool School Bus Mode Walk Bike Transit Students 38% 0% 36% 24% 2% 0% Staff 86% 3% 7% 2% 2% Visitors 81% 2% 12% 2% 3% This report also used two other sets of mode split assumptions its analysis, one that assumes enhanced Transportation Demand Management (TDM) measures that increase use of non auto modes, and an inclement weather scenario that assumes many people that walk to school would drive or be driven instead. These mode splits, summarized in Table 5 and Table 6, were used in sensitivity analyses, to ensure that this report is making proper conclusions even when considering these alternate mode split scenarios. Mainly, the enhanced TDM scenario was used to base parking demand assumptions, and the inclement weather scenario used to help identify potential traffic impacts not foreseen under the baseline mode split. Table 5: New ES Mode Splits (with Enhanced TDM) Mode Population School Auto Carpool Walk Bike Transit Bus Students 33% 0% 36% 27% 4% 0% Staff 81% 5% 7% 2% 5% Visitors* 81% 2% 12% 2% 3% *Enhanced TDM measures are not expected to affect visitor mode splits Table 6: New ES Mode Splits (with Inclement Weather) Mode Population School Auto Carpool Walk Bike Transit Bus Students 43% 0% 36% 19% 2% 0% Staff 81% 3% 2% 2% 2% Visitors* 86% 2% 7% 2% 3% PARKING DEMAND The future Reed site will generate parking demand from three sources: the library, the New ES, and the recreation fields. The library and New ES will have their parking demand peak during the same time, during an afternoon on a school day. Although the fields will generate parking demand, it will not overlap with parking demand generated by the New ES. Thus, this report focused on projecting the parking demand peak on a weekday afternoon when the New ES parking demand is highest and overlaps with library parking demand. Table 7 summarizes the parking demand estimates for the future Reed site when parking demand peaks during a weekday afternoon. Table 7: Parking Demand Summary Population Library Baseline Parking Demand With Enhanced TDM Staff/Volunteers 15 spaces 15 spaces Visitors 30 spaces 30 spaces New ES Staff 120 spaces 111 spaces Visitors 8 spaces 8 spaces Total 173 spaces 164 spaces The parking demand for the library was based on counts of existing parking on site and on adjacent streets, and information provided by library staff. The parking demand for the New ES is based on the expected staff population, mode split estimates, arrival and departure times from APS Go! data, and visitor surveys contained in the APS Go! data. This report uses the parking demand with enhanced TDM as the design condition for the Reed site. QUEUING DEMAND This report assumes that the New ES will need to accommodate seven (7) school buses on site. This is based on the amount of school buses needed to serve comparable APS neighborhood elementary schools; it represents the higher end of buses needed at elementary schools. The amount of queuing space needed parent drop off/pick up area was based on observations at other APS elementary schools and is estimated to range from 23 to 28 cars in the morning and 28 to 61 cars in the afternoon. These ranges vary due to the geometry and operations at the comparable locations observed. Because this project provides and opportunity to establish proper geometry and operational practices for the pick up/drop off area, this report recommends a design target of a 30 car queue length for the New ES. 19
27 TRIP GENERATION The vehicular trip generation for this project takes into account the changes to the existing uses, and the addition of New ES traffic. First, the existing trips from the library, Children s School and Integration Station are removed from the network. The trips removed are just those entering the existing the site at parking lots (i.e. they do not include traffic not parking onsite). Second, the library trips that were removed are added back to the network. The library trips were removed and added back because they will park in different locations after the New ES project is constructed. Finally, traffic generated by the New ES is added to the network. The trip generation for the New ES is based on the population numbers of students and staff, the mode split assumptions summarized above, and transportation profiles based on APS Go! data (including arrival and departure times). The assumed bell times for the New ES were 9:00 AM to 3:41 PM, which match nearby elementary schools, but if offset from the closest public school, Swanson MS, which has bell times of 7:50 AM to 2:24 PM. Using this information, a daily vehicular trip generation as determined for each user group. These are shown on Figure 10. Once these daily profiles were assembled, the morning peak hour, school dismissal peak hour, and evening commuter peak hour trip generations were assembled. Table 8 contains a summary of the project s trip generation (for the baseline mode split scenario). Table 8: Trip Generation Summary (baseline) Vehicular Trip Generation User Group AM Peak Hour PM School Peak Hour PM Commuter Peak Hour IB OB Total IB OB Total IB OB Total Step 1: Subtract existing trips (in and out of driveways into the site) from the network Library 0 v/hr 0 v/hr 0 v/hr 11 v/hr 14 v/hr 25 v/hr 6 v/hr 11 v/hr 17 v/hr Day Care 50 v/hr 33 v/hr 83 v/hr 17 v/hr 19 v/hr 36 v/hr 37 v/hr 54 v/hr 91 v/hr Total 50 v/hr 33 v/hr 83 v/hr 28 v/hr 33 v/hr 61 v/hr 43 v/hr 65 v/hr 108 v/hr Step 2: Add Library trips back to the network (library trips are removed and reapplied because they will be parking in different locations) Library 0 v/hr 0 v/hr 0 v/hr 11 v/hr 14 v/hr 25 v/hr 6 v/hr 11 v/hr 17 v/hr Step 3: Add trips associated with New ES Student Pick up/drop off 200 v/hr 200 v/hr 400 v/hr 145 v/hr 145 v/hr 290 v/hr 50 v/hr 44 v/hr 94 v/hr Staff 58 v/hr 1 v/hr 59 v/hr 0 v/hr 49 v/hr 49 v/hr 0 v/hr 21 v/hr 21 v/hr Visitors 3 v/hr 0 v/hr 3 v/hr 3 v/hr 4 v/hr 7 v/hr 0 v/hr 1 v/hr 1 v/hr Total 261 v/hr 201 v/hr 462 v/hr 148 v/hr 198 v/hr 346 v/hr 50 v/hr 66 v/hr 116 v/hr Total net new Trips Library and New ES 211 v/hr 168 v/hr 379 v/hr 131 v/hr 179 v/hr 310 v/hr 13 v/hr 12 v/hr 25 v/hr 20
28 Figure 10: Vehicular Trip Generation Summary 21
29 TRAFFIC OPERATIONS This section provides a summary of an analysis of the existing and future roadway capacity in the study area. Included is an analysis of potential vehicular impacts of the project and a discussion of potential improvements. The purpose of the capacity analysis is to: Determine the existing capacity of the study area roadways; Determine the overall impact of the proposed project on the study area roadways; and Discuss potential improvements and mitigation measures to accommodate the additional vehicular trips The following conclusions are reached within this chapter: The existing study area intersections all operate at acceptable levels of service and delay, with one exception. The southbound approach of 18 th Street N to Washington Boulevard shows has long delays as side street traffic waits for gaps in Washington Boulevard traffic. This condition is common for side streets with low traffic volume intersecting an arterial like Washington Boulevard. The future scenarios show similar results, with all study area intersections operating at acceptable levels with one exception. Traffic generated by the New ES has a negligible impact on the PM commuter peak hour. This report does not recommend any traffic mitigation measures for the proposed New ES A sensitivity anlaysis that explored different mode split scenarios for the New ES confirmed the findings of the baseline mode split scenario. STUDY AREA, SCOPE, & METHODOLOGY This section outlines the assumptions used to develop the existing and future capacity analyses, including volumes, roadway geometries and traffic operations. The scope of the analysis contained within this report was extensively discussed with and agreed to with Arlington County DES staff. The general methodology of the analysis follows national and County guidelines on the preparation of transportation impact evaluations of site development. Capacity Analysis Scenarios The vehicular analyses were performed to determine if the proposed development will lead to adverse impacts on traffic operations. (A review of impacts to each of other modes is provided later in this report.) This is accomplished by comparing future scenarios: (1) without the proposed project (referred to as the Background condition), and (2) with volumes generated by the project (referred to as the Total Future condition). As per this report s scoping agreement, the roadway capacity analysis examined the following scenarios: Existing Conditions Future Conditions without project traffic Future Conditions with project traffic Each scenario contains three distinct hours of analysis, scenarios: 1. The AM commuter/school peak hour (in order to be conservative these hours were assumed to be the same) 2. The PM school peak hour 3. The PM commuter peak hour Study Area The study area is a list of intersections where detailed capacity analyses were performed for the scenarios listed above. They represent the intersections most likely to have potential impacts or require changes to traffic operations to accommodate the proposed project. Although it is possible that impacts will occur outside of the study area, those impacts are not significant enough to be considered a detrimental impact nor worthy of mitigation measures. The study area intersections are based on the projected future trip generation and the location of site access points. As agreed to in this report s scoping agreement, the following intersections were included: 1. Washington Blvd/18th Street/N Nicholas St 2. Washington Blvd/McKinley Road 3. 18th Street N/Parking Lot Exit 4. 18th Street N/N Longfellow Street 5. 18th Street N/Parking Lot Entrance 6. 18th Street N/ N Lexington Street 22
30 7. 18th Street N/Patrick Henry Drive 8. N Lexington Street/18th Road N 9. N Lexington Street/19th Street N th Street N/ N Madison Street 11. N Madison Street/18th Street N/Parking Lot Figure 11 shows a map of the study area intersections. Traffic Volume Assumptions The following section reviews the traffic volume assumptions and methodologies used in the roadway capacity analyses. Existing Traffic Volumes The existing traffic volumes are comprised of turning movement count data, which was collected on Thursday, February 1, The results of the traffic counts are included in the Technical Appendix. For the AM commuter/school and PM commuter peak hours, the system peak of the study area intersections was used. This was 7:30 AM to 8:30 AM for the AM peak, and 4:45 PM to 5:45 PM in the PM peak. For the PM school peak hour, the counts from 3:00 PM to 4:00 PM were used based on the anticipated trip generation from the New ES and the assumed afternoon bell time. The existing peak hour traffic volumes are shown on Figure Background Volumes (without the Project) The traffic projections for the 2011 Background conditions consist of the existing volumes with two additions: Traffic generated by developments expected to be completed prior to the project (known as background developments); and Inherent growth on the roadway (representing regional traffic growth). Based on these criteria, and as discussed previously, no developments were included in the 2021 Background scenario. As described in the Study Area Overview chapter, the Virginia Hospital Center Expansion project does not meet these criteria. Traffic generated from that project is considered covered in the general background growth. While the background developments represent local traffic changes, regional traffic growth is typically accounted for using growth rates. The growth rates used in this analysis are derived using trends in historical counts. Table 9 shows a summary of the growth in traffic volumes on roadways adjacent to the study area. Based on this analysis an annual growth rate of 0.2% was assumed. Table 9: AADT Volume Trends Roadway AADT th St N from N Longfellow St to Patrick Henry Dr Annual % Change ( ) % McKinley Rd from Washington Blvd to N Longfellow St 2,600 3,500 3,500 3,400 2, % Patrick Henry Dr from Washington Blvd to George Mason Dr 6,500 6,100 6,100 6,000 6, % Washington Blvd from Lee Highway to Patrick Henry Dr 15,000 13,000 13,000 12,000 14, % N Lexington St from 16 th St N to 22 nd St N 2,400 2,300 2,300 2,300 2, % 16 th St N from Patrick Henry Dr to N Lexington St 2,300 2,300 2,300 2,200 2, % Average 0.2% *Adjacent to proposed study area Source: VDOT Traffic Data 2012 to 2016 ( trafficcounts.asp) Following national and local methodologies, a background development must meet the following criteria to be incorporated into the analysis: Be located in the study area, defined as having an origin or destination point within the cluster of study area intersections; Have entitlements; and Have a construction completion date prior or close to the proposed development. The traffic volumes generated the inherent growth along the network were added to the existing traffic volumes in order to establish the 2021 Background traffic volumes. The Background peak hour traffic volumes are shown on Figure


31 Figure 11: Study Area Intersections 24
32 Figure 12: Existing Peak Hour Volumes 25

33 Figure 13: Background Peak Hour Volumes 26
34 2021 Total Future Volumes (with Project) The 2021 Total Future Volumes consist of the 2021 Background volumes with the addition of the traffic volumes generated by the project. Thus, the 2021 Total Future traffic volumes include traffic generated by: the existing volumes, the inherent growth on the study area roadways, and the proposed project. The proposed project s trip generation was presented in the Travel Demand Assumptions chapter of this MMTA. The trip generation was distributed and assigned in three steps. First, the existing trips from the library, Children s School and Integration Station are removed from the network. The trips removed are just those entering the existing the site at parking lots (i.e. they do not include traffic not parking on site). Second, the library trips that were removed are added back to the network. The library trips were removed and added back because they will park in different locations after the New ES project is constructed. Finally, traffic generated by the New ES is added to the network. Distribution and routing assumptions are based on the location of APS Planning Units, traffic counts and existing volume patterns, and the Existing Conditions vehicular capacity analysis. Separate distributions for staff and parents were developed: Figure 14 shows the inbound and outbound trip distribution for staff; Figure 15 shows the trip distribution for local traffic, representing all trips that have origins and destinations in the local neighborhood; and Figure 16 shows the trip distribution for students which accounts for how some parents continue to work or return from work. The traffic volumes for the 2021 Total Future conditions were calculated by adding the development generated traffic volumes to the 2021 Background traffic volumes as per the steps listed above. Figure 17 shows the existing trips removed from the network. Figure 18 shows the library trips reapplied to the network. Figure 19 shows the New ES staff trips. Figure 20 shows the New ES student trips. Figure 21 shows the New ES visitor trips. Figure 22 shows the total trips generated by the New ES. Figure 23 shows the Total Future peak hour trips. Geometry and Operations Assumptions The following section reviews the roadway geometry and operations assumptions made and the methodologies used in the roadway capacity analyses. Existing Geometry and Operations Study area intersection geometry, lane configuration and additional infrastructure details were recorded at the time of the traffic counts and confirmed via field reconnaissance by Gorove/Slade. For some intersections where wide travels lanes existing, observations were made on how traffic flowed through the intersection and the lane configurations adjusted. For example, on the westbound approach of Washington Boulevard to N McKinley Rd, there is technically only a single lane, but enough pavement width to fit two cars. Based on field observations this was coded in the traffic model as two lanes to better reflect actual conditions. Traffic signal timings were provided by County staff and double checked in the field. Figure 24 shows the Existing lane configurations Background Geometry and Operations Assumptions Following industry standard methodologies, a background geometry improvement must be funded and have a construction completion date prior or close to the proposed development. Based on these criteria, a slight change was made to the intersection of Washington Boulevard and 18 th Street N. The plans provided by the County for the Washington Boulevard Bike, Pedestrian, and Roadway Enhancement show that vehicles on Washington Boulevard turning right onto 18 th Street N (in both directions) will have a small right turn lane available. This change was made for the 2021 scenarios. No changes to signal timings were made. Figure 25 shows the Background lane configurations Total Future Geometry and Operations Assumptions The 2021 Total Future geometry and operations assumptions include changes to accommodate the proposed modifications and expansion of the 18 th Street parking lot. This includes removal of the 18 th Street lot exit curb cut and moving the exiting traffic from the parking lot to the location of the entering curb cut, turning into a two way driveway. No signal timing changes were made. Figure 26 shows the Total Future lane configurations. 27

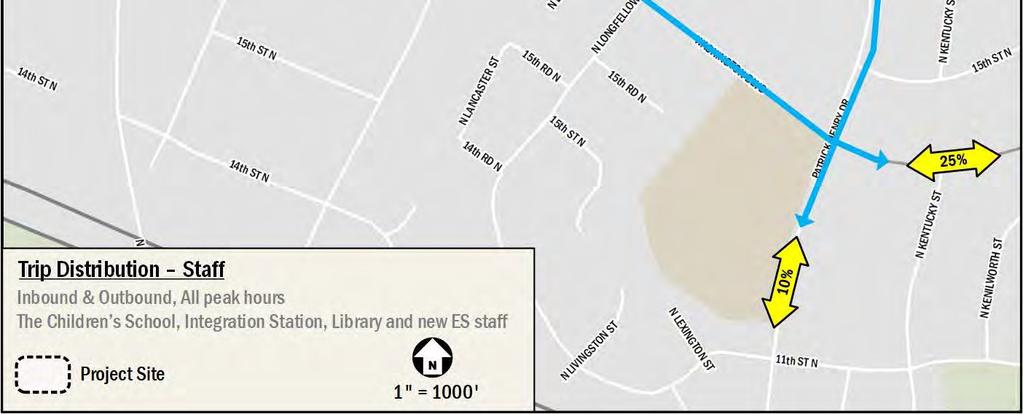
35 Figure 14: Staff Distribution 28


36 Figure 15: Local Traffic Distribution 29


37 Figure 16: Student Drop Off/Pick Up Distribution 30
38 Figure 17: Existing Trips Removed 31
39 Figure 18: Reapplied Library Trips 32
40 Figure 19: New ES Staff Trips 33
41 Figure 20: New ES Student Trips 34
42 Figure 21: New ES Visitor Trips 35
43 Figure 22: Total New ES Generated Trips 36

44 Figure 23: Total Future Peak Hour Trips 37
45 Figure 24: Existing Lane Configurations 38
46 Figure 25: Background Lane Configurations 39
47 Figure 26: Total Future Lane Configurations 40
48 VEHICULAR ANALYSIS RESULTS Intersection Capacity Analysis Intersection capacity analyses were performed for the three scenarios outlined previously at the intersections contained within the study area during the morning and afternoon peak hours. Synchro version 9.1 was used to analyze the study intersections based on the Highway Capacity Manual (HCM) 2000 methodology. The results of the capacity analyses are expressed in level of service (LOS) and delay (seconds per vehicle) for each approach. A LOS grade is a letter grade based on the average delay (in seconds) experienced by motorists traveling through an intersection. LOS results range from A being the best to F being the worst. LOS D is typically used as the acceptable LOS threshold in the District; although LOS E or F is sometimes accepted in urbanized areas if vehicular improvements would be a detriment to safety or non auto modes of transportation. The LOS capacity analyses were based on: (1) the peak hour traffic volumes; (2) the lane use and traffic controls; and (3) the Highway Capacity Manual (HCM) methodologies (using Synchro software). The average delay of each approach and LOS is shown for the signalized intersections in addition to the overall average delay and intersection LOS grade. The HCM does not give guidelines for calculating the average delay for a two way stop controlled intersection, as the approaches without stop signs would technically have no delay. Table 10 shows the results of the capacity analyses. Detailed LOS descriptions and the analysis worksheets are contained in the Technical Appendix The results show that all study area intersections operate at acceptable conditions with one exception, the southbound approach of 18 th Street N to Washington Boulevard. At several locations within the study area, there are slight improvements between existing and future conditions. This is because of two reasons. First, the methodology used in the analysis assumes a minimum peak hour factor of 0.92 in the future analysis years. At some locations, this caused slight improvements in delay and LOS. Second, the removal of existing trips and application of library and New ES trips to the site resulted in some volume changes that lead to improved results in the Total Future condition. This is most apparent on the southbound approach of 18 Street N to Washington Boulevard between Total Future and Background conditions. The Total Future conditions has slightly different volumes at the approach (notably fewer through volumes and more right turns). This leads to a decrease in delay. Queuing Analysis In addition to the capacity analyses presented above, a queuing analysis was performed at the study intersections. The queuing analysis was performed using Synchro software. The 50 th percentile and 95 th percentile queue lengths are shown for each lane group at the study area signalized intersections. The 50 th percentile queue is the maximum back of queue on a median cycle. The 95 th percentile queue is the maximum back of queue that is exceeded 5% of the time. For unsignalized intersections, only the 95 th percentile queue is reported for each lane group (including free flowing left turns and stopcontrolled movements) based on the HCM 2000 calculations. HCM 2000 does not calculate queuing for all way stops. Table 11 shows the results of the queuing analysis. The queuing analyses show that all study intersections have acceptable queuing results, with all queues shorter than available storage lengths. Mitigations Based on County standards, the proposed project is determined to have an impact if any intersection or approach experiences a degradation to LOS E or F in the future scenario where one does not exist in the background scenario. There is one location in the study area that meets this criterion, the southbound approach of 18 Street N to Washington Boulevard degrades from a LOS E to a LOS F in the AM peak hour scenario. After exploring potential mitigation measures for this location, this report is not recommending any, for several reasons. First, this condition is typical for side street traffic approaching an arterial at an unsignalized location. Second, the amount of volumes at the approach is very low and would not warrant a traffic signal. Third, potential improvements that would widen the intersection to provide more lanes could alleviate the poor LOS, but those improvements would have detrimental impacts to other modes. And finally, traffic delayed at this intersection can use the traffic grid to find other routes that don t experience this delay, by driving to an intersection with Washington Boulevard that has a traffic signal. 41
49 Table 10: Capacity Analysis Results AM Peak Hour PM School Dismissal Peak PM Commuter Peak Hour Intersection/ Movement Existing Background Total Future Existing Background Total Future Existing Background Total Future Delay LOS Delay LOS Delay LOS Delay LOS Delay LOS Delay LOS Delay LOS Delay LOS Delay LOS Washington Blvd & 18th St/Nicholas St Overall 1.2 A 1.1 A 1.4 A 1.2 A 1.1 A 1.6 A 2.0 A 1.8 A 1.6 A Eastbound 0.4 A 0.4 A 0.9 A 0.3 A 0.3 A 0.1 A 0.2 A 0.2 A 0.1 A Westbound 0.4 A 0.4 A 0.4 A 0.9 A 0.8 A 0.8 A 0.8 A 0.8 A 0.8 A Northeastbound 30.6 D 27.0 D 30.5 D 16.6 C 16.7 C 17.4 C 21.3 C 21.5 C 21.7 C Northbound 21.8 C 20.3 C 22.7 C 14.8 B 14.0 B 14.4 B 22.7 C 21.3 C 21.7 C Southbound 39.0 E 35.3 E 50.2 F 21.0 C 18.3 C 17.8 C 91.9 F 88.7 F 44.9 E Washington Blvd & McKinley Rd Overall 17.5 B 17.4 B 18.0 B 15.5 B 15.2 B 15.8 B 19.8 B 19.3 B 19.6 B Eastbound Left 9.9 A 9.7 A 10.9 B 11.1 B 10.7 B 11.6 B 15.8 B 14.5 B 15.9 B Eastbound TR 18.9 B 19.2 B 19.2 B 11.7 B 11.4 B 11.5 B 16.3 B 16.4 B 16.5 B Westbound Left 9.5 A 9.5 A 9.5 A 8.9 A 8.9 A 8.9 A 9.3 A 9.4 A 9.4 A Westbound TR 15.6 B 14.9 B 15.7 B 16.7 B 16.3 B 16.9 B 22.7 C 21.6 C 21.7 C Northbound Left 20.8 C 20.7 C 20.8 C 20.6 C 20.6 C 20.6 C 20.8 C 20.8 C 20.8 C Northbound TR 20.9 C 20.8 C 20.9 C 21.0 C 20.9 C 21.0 C 21.0 C 21.0 C 21.0 C Southbound LT 21.8 C 21.7 C 23.8 C 21.9 C 21.7 C 22.7 C 22.6 C 22.5 C 24.2 C Southbound Right 20.7 C 20.7 C 21.0 C 20.9 C 20.9 C 21.0 C 21.0 C 21.0 C 21.0 C 18th St & Existing Exit Overall 1.5 A 1.4 A 0.7 A 0.7 A 2.0 A 1.9 A Eastbound 9.2 A 9.1 A 9.3 A 9.3 A 9.8 A 9.7 A Northbound 0.0 A 0.0 A 0.0 A 0.0 A 0.0 A 0.0 A Southbound 0.0 A 0.0 A 0.0 A 0.0 A 0.0 A 0.0 A 18th St & Longfellow St Overall 1.6 A 1.5 A 1.2 A 1.3 A 1.2 A 1.1 A 1.5 A 1.5 A 1.5 A Westbound 9.3 A 9.3 A 9.8 A 9.4 A 9.4 A 9.7 A 9.6 A 9.6 A 9.5 A Northbound 0.0 A 0.0 A 0.0 A 0.0 A 0.0 A 0.0 A 0.0 A 0.0 A 0.0 A Southbound 1.1 A 0.9 A 0.6 A 0.2 A 0.2 A 0.4 A 0.8 A 0.7 A 0.7 A 18th St & Existing Entrance (Future Exit) Overall 6.3 A 5.0 A 2.9 A Eastbound 13.2 B 12.8 B 10.3 B Northbound 4.1 A 2.8 A 2.0 A Southbound 0.0 A 0.0 A 0.0 A 18th St & Lexington St Overall 4.4 A 4.2 A 7.0 A 5.4 A 5.5 A 7.8 A 5.8 A 5.6 A 5.9 A Eastbound 0.2 A 0.1 A 0.1 A 0.1 A 0.1 A 0.1 A 0.1 A 0.1 A 0.2 A Westbound 2.4 A 2.4 A 2.8 A 2.3 A 2.2 A 2.7 A 2.3 A 2.3 A 2.3 A Northbound 11.5 B 11.2 B 14.5 B 10.7 B 10.6 B 13.3 B 11.4 B 11.2 B 11.6 B Southbound 11.0 B 10.8 B 13.0 B 10.5 B 10.4 B 11.6 B 10.9 B 10.8 B 11.0 B 18th St & Patrick Henry Dr Overall 1.6 A 1.6 A 3.6 A 2.5 A 2.4 A 4.5 A 1.8 A 1.7 A 2.1 A Eastbound 0.1 A 0.1 A 0.1 A 0.1 A 0.1 A 0.0 A 0.0 A 0.0 A 0.1 A Westbound 0.0 A 0.1 A 0.1 A 0.6 A 0.7 A 0.7 A 0.2 A 0.2 A 0.5 A Northbound 11.1 B 10.9 B 12.0 B 10.9 B 10.8 B 12.0 B 11.5 B 11.4 B 11.6 B Southbound 11.1 B 10.9 B 11.7 B 10.9 B 10.9 B 11.4 B 11.5 B 11.4 B 11.6 B 18th Rd & Lexington St Overall 0.5 A 0.5 A 0.4 A 0.4 A 0.3 A 0.2 A 0.4 A 0.3 A 0.3 A Eastbound 0.2 A 0.2 A 0.2 A 0.1 A 0.1 A 0.1 A 0.1 A 0.1 A 0.1 A Westbound 0.0 A 0.0 A 0.0 A 0.0 A 0.0 A 0.0 A 0.0 A 0.0 A 0.0 A Southbound 9.7 A 9.7 A 10.4 B 9.2 A 9.1 A 9.6 A 9.4 A 9.4 A 9.5 A 19th St & Lexington St Overall 2.3 A 2.3 A 2.7 A 1.9 A 1.8 A 2.4 A 2.1 A 2.0 A 2.1 A Eastbound 0.1 A 0.1 A 0.0 A 0.1 A 0.1 A 0.1 A 0.2 A 0.2 A 0.2 A Westbound 0.4 A 0.3 A 1.0 A 0.3 A 0.3 A 1.1 A 1.0 A 1.0 A 1.2 A Northbound 9.7 A 9.6 A 9.9 A 9.7 A 9.7 A 10.1 B 10.2 B 10.2 B 10.2 B Southbound 10.0 A 9.9 A 11.1 B 10.1 B 10.1 A 11.1 B 10.0 B 10.0 B 10.0 B 19th St & Madison St Overall 7.1 A 7.0 A 7.2 A 7.0 A 7.0 A 7.0 A 7.0 A 7.0 A 7.0 A Eastbound 7.2 A 7.2 A 7.4 A 6.9 A 6.9 A 7.2 A 7.1 A 7.1 A 7.2 A Westbound 6.8 A 6.8 A 6.9 A 6.7 A 6.7 A 6.8 A 6.7 A 6.7 A 6.7 A Northbound 7.1 A 7.1 A 7.2 A 7.1 A 7.1 A 7.1 A 7.2 A 7.1 A 7.2 A Southbound 7.0 A 7.0 A 7.1 A 7.1 A 7.1 A 7.0 A 7.2 A 7.1 A 7.1 A 18th St & Madison St/Parking Lot Overall 4.5 A 4.3 A 2.5 A 6.0 A 7.1 A 8.6 A 7.7 A 7.6 A 8.0 A Eastbound 8.9 A 8.9 A 8.8 A 8.5 A 8.6 A 8.9 A 8.7 A 8.7 A 8.7 A Westbound 9.0 A 9.0 A 8.9 A 9.2 A 8.9 A 9.0 A 9.1 A 9.1 A 9.0 A Northbound 2.3 A 2.3 A 1.5 A 4.7 A 5.0 A 6.5 A 6.4 A 6.4 A 6.8 A Southbound 0.0 A 0.0 A 0.0 A 0.0 A 0.0 A 0.0 A 0.0 A 0.0 A 0.0 A 42
50 Table 11: Queuing Analysis Results Intersection & Lane Group AM Peak Hour PM School Dismissal Peak PM Commuter Peak Hour Storage Length (ft) Existing Background Total Future Existing Background Total Future Existing Background Total Future 50th % 95th % 50th % 95th % 50th % 95th % 50th % 95th % 50th % 95th % 50th % 95th % 50th % 95th % 50th % 95th % 50th % 95th % Washington Blvd & 18th St/Nicholas St Eastbound Left Eastbound Thru Wetbound Thru Westbound Right Northeasbound LTR Northbound LTR Southbound LTR Washington Blvd & McKinley Rd Eastbound Left Eastbound TR Westbound Left Westbound TR Northbound Left Northbound TR Southbound LT Southbound Right th & Site Exit Eastbound LR Northbound Thru Southbound Thru th St & Longfellow St Westbound LR Northbound TR Southbound LT th & Site Entrance Eastbound LR Northbound LT Soutbound TR th St & Lexington St Eastbound LTR Westbound LTR Northbound LTR Southbound LTR th St & Patrick Henry Dr Eastbound LTR Westbound LTR Northbound LTR Southbuond LTR th Rd & Lexington St Eastbound LT Westbound TR Southbuond LR th St & Lexington St Eastbound LTR Westbound LTR Northbound LTR Southbuond LTR th St & Madison St Eastbound LTR 655 Westbound LTR 245 Northbound LTR 500 Southbound LTR th St & Madison St HCM 2000 Does Not Analyze All Way Stop Controlled Intersections Eastbound LTR Westbound LTR Northbound LTR
51 Additional Mode Split Scenarios As stated in the Travel Demand Assumptions chapter, two additional mode split scenarios were developed for the New ES, an enhanced TDM scenario and an inclement weather scenario. The following presents a summary of a sensitivity analysis of the capacity analysis results that performs the same analysis but with these mode splits underlying the trip generation calculations. These results show that the various mode split scenarios for the New ES all result in very similar results. The Enhanced TDM scenario does results in the southbound approach of 18 th Street N to Washington Boulevard having a LOS E in Total Future conditions, the same as existing conditions, and thus not requiring the exploration of mitigations. But this is mainly because the approach is right on the threshold between LOS E and F. This report does not see any reason to alter the findings and conclusions reached in the baseline capacity analysis results based on the sensitivity analyses. 44
52 Table 12: Sensitivity Analysis Results Intersection/ Movement AM Peak Hour PM School Dismissal Peak Total Future Enhanced TDM Inclement Weather Total Future Enhanced TDM Inclement Weather Delay LOS Delay LOS Delay LOS Delay LOS Delay LOS Delay LOS Washington Blvd & 18th St/Nicholas St Overall 1.4 A 1.3 A 1.4 A 1.6 A 1.5 A 1.6 A Eastbound 0.9 A 0.8 A 0.9 A 0.1 A 0.1 A 0.1 A Westbound 0.4 A 0.4 A 0.4 A 0.8 A 0.8 A 0.8 A Northeastbound 30.5 D 22.3 C 22.9 C 17.4 C 14.3 B 14.5 B Northbound 22.7 C 29.9 D 30.8 D 14.4 B 17.3 C 17.5 C Southbound 50.2 F 48.5 E 50.8 F 17.8 C 17.5 C 17.6 C Washington Blvd & McKinley Rd Overall 18.0 B 17.9 B 18.1 B 15.8 B 15.7 B 15.9 B Eastbound Left 10.9 B 10.7 B 11.2 B 11.6 B 11.4 B 11.7 B Eastbound TR 19.2 B 19.2 B 19.2 B 11.5 B 11.5 B 11.5 B Westbound Left 9.5 A 9.5 A 9.5 A 8.9 A 8.9 A 8.9 A Westbound TR 15.7 B 15.5 B 15.8 B 16.9 B 16.8 B 17.0 B Northbound Left 20.8 C 20.8 C 20.8 C 20.6 C 20.6 C 20.6 C Northbound TR 20.9 C 20.9 C 20.9 C 21.0 C 21.0 C 21.0 C Southbound LT 23.8 C 23.5 C 24.2 C 22.7 C 22.6 C 22.9 C Southbound Right 21.0 C 21.0 C 21.1 C 21.0 C 21.0 C 21.0 C 18th St & Existing Exit Overall Eastbound Northbound Southbound 18th St & Longfellow St Overall 1.2 A 1.2 A 1.1 A 1.1 A 1.1 A 1.1 A Westbound 9.8 A 9.7 A 9.9 A 9.7 A 9.6 A 9.7 A Northbound 0.0 A 0.0 A 0.0 A 0.0 A 0.0 A 0.0 A Southbound 0.6 A 0.6 A 0.6 A 0.4 A 0.3 A 0.3 A 18th St & Existing Entrance (Future Exit) Overall 6.3 A 5.7 A 7.0 A 5.0 A 4.6 A 5.5 A Eastbound 13.2 B 12.1 B 14.3 B 12.8 B 12.1 B 13.6 B Northbound 4.1 A 3.8 A 4.5 A 2.8 A 2.5 A 3.0 A Southbound 0.0 A 0.0 A 0.0 A 0.0 A 0.0 A 0.0 A 18th St & Lexington St Overall 7.0 A 6.5 A 7.4 A 7.8 A 7.5 A 8.2 A Eastbound 0.1 A 0.1 A 0.1 A 0.1 A 0.1 A 0.1 A Westbound 2.8 A 2.8 A 2.9 A 2.7 A 2.6 A 2.8 A Northbound 14.5 B 13.9 B 15.3 C 13.3 B 12.8 B 13.8 B Southbound 13.0 B 12.7 B 13.4 B 11.6 B 11.3 B 11.7 B 18th St & Patrick Henry Dr Overall 3.6 A 3.4 A 4.1 A 4.5 A 4.3 A 4.7 A Eastbound 0.1 A 0.1 A 0.1 A 0.0 A 0.0 A 0.0 A Westbound 0.1 A 0.1 A 0.1 A 0.7 A 0.7 A 0.7 A Northbound 12.0 B 11.9 B 12.4 B 12.0 B 11.9 B 12.3 B Southbound 11.7 B 11.6 B 11.9 B 11.4 B 11.3 B 11.5 B 18th Rd & Lexington St Overall 0.4 A 0.4 A 0.4 A 0.2 A 0.2 A 0.2 A Eastbound 0.2 A 0.2 A 0.1 A 0.1 A 0.1 A 0.0 A Westbound 0.0 A 0.0 A 0.0 A 0.0 A 0.0 A 0.0 A Southbound 10.4 B 10.3 B 10.4 B 9.6 A 9.6 A 9.7 A 19th St & Lexington St Overall 2.7 A 2.7 A 2.8 A 2.4 A 2.3 A 2.4 A Eastbound 0.0 A 0.0 A 0.0 A 0.1 A 0.1 A 0.1 A Westbound 1.0 A 1.0 A 1.0 A 1.1 A 1.0 A 1.2 A Northbound 9.9 A 9.8 A 9.9 A 10.1 B 10.0 B 10.1 B Southbound 11.1 B 11.0 B 11.3 B 11.1 B 11.0 B 11.3 B 19th St & Madison St Overall 7.2 A 7.2 A 7.2 A 7.0 A 7.0 A 7.1 A Eastbound 7.4 A 7.3 A 7.4 A 7.2 A 7.1 A 7.2 A Westbound 6.9 A 6.9 A 6.9 A 6.8 A 6.8 A 6.8 A Northbound 7.2 A 7.2 A 7.2 A 7.1 A 7.1 A 7.1 A Southbound 7.1 A 7.1 A 7.1 A 7.0 A 7.0 A 7.0 A 18th St & Madison St/Parking Lot Overall 2.5 A 2.7 A 2.5 A 8.6 A 8.5 A 8.6 A Eastbound 8.8 A 8.8 A 8.8 A 8.9 A 8.9 A 8.9 A Westbound 8.9 A 8.9 A 8.9 A 9.0 A 9.0 A 9.0 A Northbound 1.5 A 1.6 A 1.5 A 6.5 A 6.5 A 6.5 A Southbound 0.0 A 0.0 A 0.0 A 0.0 A 0.0 A 0.0 A 45
53 PARKING spaces on the block face. Several off street parking lots were also included in the study area. This section reviews the available parking surrounding the Reed site and presents parking recommendations, including: A summary of parking data collected in the area surrounding the Reed site on a typical weekday A review of existing peak parking demand for the existing uses on the Reed site, the nearby retail uses, and the surrounding residential streets A list of opportunities and concerns for accommodating anticipated demand from the new ES The following conclusions are reached within this chapter: During a typical weekday, the existing parking demand adjacent to the Reed site is easily accommodated by the parking supply The adjacent retail area s parking supply peaks during the middle of the day with just over 70% occupied There is a potential that some New ES parking could occupy on street spaces that would be better served for retail parking demand There is a significant amount of on street parking on residential streets that could serve as parking supply for the New ES Curbside management strategies should be used to ensure that parking generated by the New ES that parks on street does so in these residential areas and not in on street parking adjacent to the library or retail uses EXISTING PARKING DEMAND As part of this transportation report, detailed counts of parking supply and demand were conducted surrounding the Reed site. The purpose of these counts was to determine the amount of parking supply and demand on streets within walking distance of the site and to identify trends or patterns associated with parking demand. The area surveyed during this study, shown in Figure 27, represents an approximate 0.25 mile walk from the Reed site. Each block face in the study area was surveyed to determine whether parking is allowed and the approximate number of The time and date of the parking data collection were selected based on the purpose of the counts. Since the information will be used to help determine parking supply needs for the new Elementary School, the date of the count was selected to represent a typical weekday, as school parking demand is highest during a school day when staff is parked on site. As such, parking data was collected in the study area on Tuesday December 12, 2017 from 6:00 AM to 10:00 PM. The parking demand sweeps were conducted every 30 minutes. The parking data found a total of 1,395 parking spaces in the study area, the majority of which are unrestricted. The restricted parking is all adjacent to retail or library/school uses, such as patron parking in the commercial area on or adjacent to Washington Blvd, and 12 one hour parking spaces on the northwest corner of McKinley Rd and Washington Blvd and the northeast corner of McKinley Rd and Washington Blvd. Most of the off street parking lots were signed for specific uses, including the Northwest lot on the Reed Site, which is signed for Library/APS staff only from 6:00 AM to 4:30 PM Monday through Friday. None of the residential blocks in the study area had restricted (permit) parking. The parking data found that the peak parking occupancy for the entire area occurred at 11:00 AM with an overall parking utilization of 38 percent (525 occupied of 1,395 available). The largest contributor to the peak is the commercial parking along Washington Blvd. Most other streets observed have an occupancy lower than 70% as seen on the map in Figure 28. Tables and figures with parking demand for each period of data collection are contained in this report s Technical Appendix. 46


54 Figure 27: Parking Count Study Area 47

55 Figure 28: Peak Parking Occupancy 48
56 For purposes of reviewing the parking demand in more detail, the parking supply within the study area was broken down into three categories: Site Parking, which consists of the existing Northwest and 18 th Street lots on the Reed site Retail Parking, which includes all retail/commercial off street lots, and on street parking on blocks that have retail and/or library uses on that block Residential Parking, which includes all on street spaces on primarily residential blocks Figure X shows these parking categories. Table 13 provides a review of each category s peak parking demands. Figure 30 shows the overall and site parking demand over the course of the counts, while Figure 31 shows the retail and residential parking demand. Table 13: Summary of Parking Demand Parking Type Number of Spaces Peak Demand Site 72 81% at 2:30 PM Retail % at 12:30 PM Residential 1,056 38% at 6:30 AM/9:30PM Total 1,395 38% at 11:30 AM Site parking peaks at 2:30pm, with 81% of the 72 off street spaces on the Reed site occupied. The lots on the Reed site peak during the middle of the day, which is logical considering the uses on site (day care/pre school and public library). The retail parking also peaked in the middle of the day, around lunch time. The retail parking is over 50% occupied throughout most of the day but drops in the evening around 6:30 pm. Residential parking in the neighborhoods surrounding the Reed site is readily available, peaking at under 40% early in the morning and late at night. During the middle of the day, residential parking is mostly under 30% occupied. SPOT COUNTS Additional parking counts were conducted at a later date to help double check the results of the original parking count. This was done because the original count was performed on a Tuesday in December, with cold weather (partly sunny with a high of 48 degrees). Concerns were expressed that this may not capture typical demand because the library has popular activities on Thursdays (e.g. story time), and the cold weather could impact parking demand. The secondary parking counts are referred as a spot count because they were smaller in scope and duration. The did not cover as wide of an area, limiting the number of residential blocks counted, and they only were performed between 10:00 AM and 6:00 PM, since that time had already been demonstrated to be the peak of the uses within the study area. The spot counts were performed on Thursday, April 12, 2018, when the weather was partly sunny with a high of 79 degrees. Figure 32 shows the area of the spot count and Table 14 provides a summary of the count and peak demand times. Figure 33 shows a comparison of the parking demand within the spot count area to the existing counts and a comparison of the off street lots on site, while Figure 34 shows comparisons between the retail and residential parking (within the spot count area). Table 14: Summary of Spot Count Parking Demand Parking Type Number of Spaces Peak Demand Site 72 86% at 10:30 AM Retail % at 12:30 PM 77% at 6:00 PM Residential % at 6:00 PM Total % at 12:30 PM 52% at 6:00 PM The spot counts show many similarities to the original counts, and a few differences. The main finding is that during the peak parking demand time for the New ES, 11:00 AM to 2:00 PM, the overall, site, and retail parking demands are very similar between the two counts. Thus, the main findings from the original counts regarding potential impact from the New ES are the same. There are two differences between the original and spot counts. First, parking demand on site is a little higher before Noon, peaking at 10:30 AM. This is likely due to the event at the library (story time). This means that additional visitor parking for the library would be beneficial at that time. Second, the amount of parking demand in the afternoon and early evening is slightly higher, notably for the retail parking. This means that the warmer weather may have an impact on parking in the area, although this does not coincide with the peak parking times for the New ES. 49
57 Figure 29: Parking Categories within Study Area 50


58 Figure 30: Parking Occupancy, Overall and Site 51

59 Figure 31: Parking Occupancy, Retail and Residential 52

60 Figure 32: Spot Count Area 53

61 Figure 33: Spot Count Comparison, Overall and Site 54

62 Figure 34: Spot Count Comparison, Retail and Residential 55
63 PARKING IMPACTS Based on the parking data and counts, the potential impacts of building a New ES on the Reed site were reviewed and recommendations developed. This was done by comparing the anticipated peak demand of the New ES to the demands observed from the parking data for the existing uses on site and surrounding residential and retail. Then a list of recommendations was developed to minimize the impact of the New ES. Parking demand of the New ES will peak in the middle of a school day, around 10 AM to 3:00 PM. This compares to other parking demand sources in the following manner: The library demand appears to be constant during operating hours from staff and patron parking, which overlaps the peak parking times for the New ES. The library s parking needs appear to peak during events at the library such as story time. Thus, the New ES and associated parking lots should maximize the ability to share parking between the New ES and the library in a manner that helps prevent library visitor parking from using other parking supplies. The recreation fields on site do not appear to have parking demand that overlaps with a typical school day. Although the fields do generate some parking demand, this occurs outside of school operating hours and can use the parking lots on the Reed site. Residential parking on surrounding streets in the neighborhood is readily available during the school day. The streets directly adjacent to the school could serve as a potential resource of parking supply for New ES staff and visitors. The retail areas adjacent to the Reed site generate parking demand that coincides with school peak parking demand. The parking data shows the retail parking peaking during lunch time. Thus, there is a potential for the New ES parking demand to impact retail parking supply. Additionally, there is an opportunity for retail parking demand to use school parking supply outside of school hours. Based on the overlaps of parking demands with New ES, and in order to most efficiently use the parkin provided on the Reed site while saving space for recreation fields, this report presents the following parking recommendations: Take advantage of the parking availability on surrounding neighborhood streets by using it as part of the parking supply for New ES staff. Discourage New ES (and library) staff from parking in front of retail areas or the library, so that those spaces can be used by retail patrons and library visitors. Work with County staff on curbside management changes to on street parking areas to deter staff parking in certain locations. For example, the parking in front of the library on Washington Boulevard is currently unrestricted. Switching it to time restricted (i.e. 2 hour) parking, would allow it to be used by visitors and patrons but not by employees. Utilize the New ES s area set aside for arrival drop off and dismissal pick up queuing for visitor parking at other times. This additional visitor parking could be used by the library, notably to boost the supply during events such as story time that do not coincide with school arrival or dismissal. Sign the expanded Northwest and 18 th Street parking lots in a manner that encourages sharing outside of school operating hours. Use signs such as APS and Library Staff parking only, Mon Fri 6:00 AM to 4:30 PM, Public parking all other times. 56
64 PEDESTRIAN FACILITIES This section presents a review of pedestrian walking routes to and from the Reed site. The purpose of this review is to develop a set of recommendations for infrastructure and operational improvements to raise the potential walking mode spit of students and staff at the New ES. The steps performed in this review included: A detailed review of infrastructure within a 0.25 radius of the site A detailed review of additional walking routes beyond 0.25 miles, based on potential walk zone boundaries for the New ES A review of crossing quality along walking routes across arterial roadways An examination of impacts that planned County projects would have on walking route quality The following conclusions are reached within this chapter: Walking routes adjacent to the school generally meet County standards, with some exceptions to the south of the site in residential neighborhoods, and along sections of Washington Boulevard, Patrick Henry Drive, and 16 th Street N Some targeted sidewalk improvements could help improve walking route quality, within the study area sidewalks can primarily be improved by adding sidewalks along expected walking routes that only have a sidewalk on one side of the street The presence of multiple signalized intersections along Washington Boulevard in the vicinity of the site provide safe crossing locations for pedestrians across an arterial. Each traffic signal provides adequate walk time for pedestrians crossing Washington Boulevard. Crosswalks on Patrick Henry Drive in the vicinity of the site do not meet County standards for crosswalk treatments, especially when considered as primary crossing points across an arterial Already planned infrastructure enhancements by the County on Washington Boulevard and Patrick Henry Drive will significantly improve pedestrian access to the site, especially at the intersection of Patrick Henry Drive and 16th Street N This report recommends that the placement of crossing guards be considered at the following intersections when the school opens: o Washington Boulevard and 18 th Street N o Patrick Henry Drive and 18 th Street N o Patrick Henry Drive and 16 th Street N o N Lexington Street and 18 th Street N SIDEWALK REVIEW The sidewalk review is an examination of sidewalks along expected walking routes to and from the New ES, comparing their sidewalk widths, buffer widths, and curb ramps to County standards. The sidewalk review for this report was performed for: (1) all facilities within a quarter mile of the site, and (2) facilities along five (5) primary walking routes in the preliminary walkzone that APS developed for the New ES at Reed. Figure 35 shows the pedestrian study area that was evaluated as part of this MMTA. The sidewalks, crosswalks, and curb ramps within the study area were evaluated based on the guidelines set forth by Arlington County. Table 15 summarizes the county width requirements for sidewalks and buffers by street type. Table 15: Arlington County Sidewalk Requirements Minimum Widths Street Type Sidewalk Buffer Neighborhood (Low Density) 4 2 Primarily Single Family Residential Neighborhoods Arterial 5 4 Urban Center Local (Medium to High Density) 6 4 Primarily Retail Oriented Mixed Use Arterial 10 6 Comparisons of the pedestrian facilities within the study area to Arlington County standards are shown on Figure 36, Figure 37, and Figure 38. Within one quarter mile of the site, almost all of the roadways are considered neighborhood (low density). Washington Boulevard and Patrick Henry Drive are both arterials, with Patrick Henry Drive and some of Washington Boulevard being classified as Primary Single Family Residential Neighborhood Arterials. Washington Boulevard between N Nottingham Street and N Longfellow Street is classified as a Primary Retail Oriented Mixed Use Arterial. Most of the sidewalks surrounding the site meet County standards for sidewalk width 57
65 and buffer; however, there are exceptions. Firstly, there are areas to the in the residential neighborhood to the south of the site that lack sidewalks on both sides of the road. Secondly, while there are sidewalks and buffers present on both Washington Boulevard and Patrick Henry Drive, the sidewalk and buffer widths do not meet the minimum specified widths per County standards. ADA standards require that all curb ramps be provided wherever an accessible route crosses a curb and must have a detectable warning. Additionally, curb ramps shared between two crosswalks is not desired. Under existing conditions there are curb ramps present at most intersections; however, many intersections have curb ramps that are shared by multiple crosswalks, which is undesired. Outside of the quarter mile walk area, the five extended walking routes show a similar level of quality. All have at adequate facilities, although not all of them meet standard. The exception is the extended walking route along 16 th Street east of the site, which has acceptable sidewalks on its northern side, but no sidewalks on its southern half. It may be worthwhile for the County to explore adding sidewalks to the southern side of 16 th Street N, although the width of the roadway would likely mean that adding sidewalks would come at the loss of on street parking on that side of the street. 58

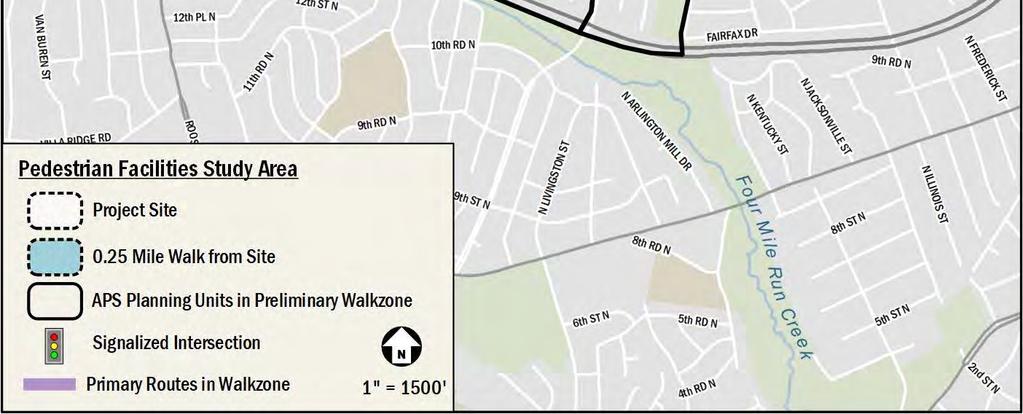
66 Figure 35: Pedestrian Study Area 59


67 Figure 36: Exiting Pedestrian Facilities (quarter mile) 60


68 Figure 37: Existing Pedestrian Facilities (routes to west) 61


69 Figure 38: Existing Pedestrian Facilities (routes to east) 62
70 CROSSING REVIEW This section reviews the quality of crosswalks along walking routes that cross nearby arterials to the Reed site. The purpose of this review is to determine is students would be conformable crossing arterials and what measures could be done to increase walking route quality. The 3 second assumption was used instead to be more conservative, and account of the age of the students walking to and from the school. Please note that the Virginia Department of Transportation (VDOT) and the Manual on Uniform Traffic Control Devices (MUTCD) assume an average pedestrian walking speed of 3.5 feet per second. Washington Boulevard Washington Boulevard has several locations were pedestrians can cross at signalized locations with a walk/don t walk pedestrian signal. The crossing review at these locations is based on ensuring pedestrians have sufficient time to cross when they get a walk sign, by comparing the amount of walk time presented during the signal phases compared to the length of the crosswalk. The main sources of data for this review were (1) crosswalk measurements taken using Arlington County s AC Maps, and (2) signal timing sheets provided by Arlington County (which show pedestrian walk and don t walk times). The required pedestrian crossing time was calculated by dividing the distance by an average walking speed of three (3) feet per second. Please note that the Virginia Department of Transportation (VDOT) and the Manual on Uniform Traffic Control Devices (MUTCD) assume an average pedestrian walking speed of 3.5 feet per second. Table 16: Crossing Distance Analysis (Wash Blvd) Intersection Leg Crossing Distance Required Crossing Minimum Provided Crossing Time (ft) Time (sec)* AM (sec) PM (sec) Washington Boulevard and N Ohio Street North Leg South Leg East Leg West Leg Washington Boulevard and N McKinley Road North Leg South Leg East Leg West Leg Washington Boulevard and N Longfellow Street North Leg South Leg East Leg West Leg Washington Boulevard and Patrick Henry Drive North Leg South Leg East Leg West Leg *assuming a pedestrian walking speed of 3 ft/sec. Table 16 shows the results of the pedestrian crossing distance analysis. Based on the results of the analysis, the closest signalized intersections to the site allow sufficient time for pedestrians to cross, even when accounting for the walking speed of children. Although Washington Boulevard carries a relatively high level of vehicular volumes, this report does not recommend infrastructure upgrades to its crosswalks. Instead, a crossing guard may be the more appropriate solution to help ensure students obey the walk/don t walk signals at the intersection. Patrick Henry Drive In contract to Washington Boulevard, the walking routes that cross Patrick Henry Drive all cross at unsignalized intersections. This report reviewed the crosswalk quality using Arlington County s Evaluation Criteria at Unsignalized Crossings, which assigns crosswalk types based on an intersection s speed limit, geometry and vehicular volumes. Based on the review of these standards, this report recommends all crosswalks over Patrick Henry Drive at its intersections with 18 th Street N and 16 th Street N be re stripped as high visibility style (continental) crosswalk markings with road side School Crossing signage. Even with improved crosswalk markings, these may not be comfortable crossing locations for elementary age students, due to high speeds of cars, and grades and roadway curves that limit sight distance. Based on observations in the field, this report recommends that the New ES explore the use of crossing guards at Patrick Henry Drive s intersections with 16 th Street N and 18 th Street N to help promote walking to and from the school. 63
71 PLANNED PEDESTRIAN INFRASTRUCTURE This section reviews planned infrastructure improvements near the Reed site that could potentially alleviate some of the concerns noted above. This review found significant planned enhancements to pedestrian facilities on Washington Boulevard and Patrick Henry Drive will address gaps in the system that are present under existing conditions. Figure 39 and Figure 40 show future pedestrian infrastructure conditions taking account the improvements listed below. Washington Boulevard Bike, Pedestrian, Roadway Enhancements The stretch of Washington Boulevard between Westover and East Falls Church is a VDOT owned and operated roadway. During the winter of 2016/2017, County staff developed a new striping and marking plan, with input from area property owners and community stakeholder groups, and VDOT will execute the work. Currently the road consists of two wide travel lanes and on street parking through much of the corridor. The most significant feature of the proposed layout is the introduction of bicycle lanes in both directions; some stretches getting an additional 2 or 3 foot buffer against moving traffic. The final plan as submitted to VDOT provides a number of pedestrian benefits, including: (1) the narrowing of unnecessarily wide travel lanes to help calm traffic; (2) improving pedestrian comfort on sidewalks due to buffering provided by the new bicycle lanes; and (3) pedestrian safety improvements at key intersections with highly visible markings for crosswalks. Although pedestrian comfort along Washington Boulevard will be improved, the planned sidewalk width still does not meet the minimum sidewalk widths in Arlington County for Primarily Retail Oriented Mixed Use Arterials. Neighborhood Conservation (NC) Projects The following projects include pedestrian related improvements as part of Arlington County s Neighborhood Conservation (NC) Program. Infrastructure improvements made through the County s NC Program generally include the installation of sidewalks, curbs and gutters, streetlights, park improvements and renovations, neighborhood art, beautification, traffic management, and pedestrian safety improvements. N Ohio Street / John Marshall Trail Improvements This is a pedestrian safety and street improvement project on North Quintana Street from Washington Boulevard to 19 th Street North. The project scope includes: (1) a new 5 foot wide concrete sidewalk being constructed along the east side of the street. It will narrow to 4 foot in width at one location to protect a mature tree; (2) a utility/buffer (grass) strip, located adjacent to the sidewalk; (3) LED Carlyle style streetlights replacing existing DVP owned Cobra streetlights; (4) storm water drainage improvements within the project limits; (5) the street width narrowing to 28 feet at the northerly end of the project limits, closer to Washington Boulevard, and on street parking will being retained along both sides; and (6) the street width being narrowed to 22 feet at the mid to southerly parts of the project limits, and on street parking being retained along the east side only. The narrowed roadway will maintain two travel lanes, one in each direction, but will be considered a yield street. N Ohio Street / John Marshall Trail Improvements The segment of N Ohio Street from 22 nd Street N to Washington Boulevard will be improved to include sidewalks, crosswalks, and curb ramps that meet Arlington County and ADA standards. In addition, LED streetlight improvements may also be implemented in the future. 22 nd Street N Improvements The street improvement project on 22 nd Street N from N Kentucky and N Lexington Streets proposes to construct a curb and gutter where there currently is none on the north side of the street. The project scope also includes a proposed bioretention basin on 22 nd Street N, adjacent to the property located at 5709 N 22 nd Street. Patrick Henry Drive Street Improvement Project This is a neighborhood pedestrian safety and beautification project to install curb extensions at Washington Blvd at Patrick Henry Drive; curb extensions at 15 th Street N, with double handicap accessible ramps on the west side of Patrick Henry Drive to accommodate mid block crossing; curb extensions at 16 th Street N and N Lexington Street; bump out entrance into parking area of Westover Apartments on west side of Patrick Henry Drive; install 5 foot bicycle lanes on the west side of Patrick Henry Drive from Washington Blvd to 16th Street N; 64
72 install 5 foot sidewalk along several locations; install yellow painted dividing stripe on Patrick Henry Drive, and orient parking on the west side at the Westover Apartments to be 60 degree back in parking. Travel lanes will be 10 feet on both sides of Patrick Henry Drive. Improving pedestrian connections in the vicinity of the East Falls Church Metrorail Station is seen as a vital strategy in increasing the likelihood of transit being used by commuters. Although pedestrian comfort along this segment of Patrick Henry Drive will be improved, sidewalk widths still do not meet the minimum sidewalk widths in Arlington County for Primarily Single Family Residential Neighborhoods Arterial. N Illinois Street Improvements Pedestrian safety and street improvement project on North Illinois Street from 22 nd Street North to Lee Highway. The project scope includes: (1) design and installation of a new 5 foot continuous sidewalk, with a 2.5 foot utility strip adjacent, curb and gutter, on the west side of the street; (2) continuous curb and gutter on the east side of the street; (3) ADA compliant pedestrian ramps throughout the project area; and (4) curb extensions at the intersections of N Illinois Street with N 22 nd Road, N 23 rd Street, and N 24 th Street. 24 th Street Improvements This is a neighborhood pedestrian safety and beautification project on 24 th Street N, from N Illinois Street to N Kensington Street. The project scope includes: (1) installing a continuous 5 foot sidewalk, curb and gutter, and associated storm water infrastructure, on the south side of 24 th Street N; (2) on street parking being retained on both sides of 24 th Street N; (3) ADA compliant pedestrian ramps being installed at the intersections with N Illinois and N Kensington Streets; and (4) New Carlyle style streetlights installed in the new 2.5 foot utility/buffer strip adjacent to the sidewalk. East Falls Church Plan The East Fall Church Plan includes street improvements such as new lane configurations, addition of on street bicycle lanes, onstreet parking (where possible), and intersection enhancements to increase pedestrian safety and reduce speeding and merging conflicts. Some of the design features recommended for Washington Boulevard between the Reed site and the East Falls Church Metrorail station include: (1) removing exclusive right tum lanes and reducing vehicular travel lane widths to create space for on street parking and a striped bicycle lane in each direction; and (2) providing tree/furniture zones and an 8 foot sidewalk. 65
73 Figure 39: Future Pedestrian Facilities (quarter mile) 66
")
74 Figure 40: Future Pedestrian Facilities (routes to west) 67
75 PEDESTRIAN RECOMMENDATIONS Based on the review of pedestrian facilities, this report concludes the following: Walking routes adjacent to the school generally meet County standards, with some exceptions to the south of the site in residential neighborhoods, and along sections of Washington Boulevard, Patrick Henry Drive, and 16 th Street N Some targeted sidewalk improvements could help improve walking route quality, within the study area sidewalks can primarily be improved by adding sidewalks along expected walking routes that only have a sidewalk on one side of the street Specific improvements that the County could explore that would significantly improve the quality of the pedestrian walking area are adding sidewalks to (adding sidewalks to these areas would likely involve removal of on street parking and as such would require further study by the County): o The southern side of 18 th Street N between Patrick Henry Drive and Longfellow Street o The southern side of 16 th Street N between George Mason Drive and N Jefferson Street. The presence of multiple signalized intersections along Washington Boulevard in the vicinity of the site provide safe crossing locations for pedestrians across an arterial. Each traffic signal provides adequate walk time for pedestrians crossing Washington Boulevard. Crosswalks on Patrick Henry Drive in the vicinity of the site do not meet County standards for crosswalk treatments, especially when considered as primary crossing points across an arterial Already planned infrastructure enhancements by the County on Washington Boulevard and Patrick Henry Drive will significantly improve pedestrian access to the site, especially at the intersection of Patrick Henry Drive and 16th Street N Even with the already planned improvements, some crossings over arterials could prove difficult for elementary school age students. To aid crossings at arterials, this report recommends all crosswalks over Patrick Henry Drive at its intersections with 18 th Street N and 16 th Street N be re stripped as highvisibility style (continental) crosswalk markings with roadside School Crossing signage. This report recommends that the placement of crossing guards be considered at the following intersections when the school opens: o Washington Boulevard and 18 th Street N o Patrick Henry Drive and 18 th Street N o Patrick Henry Drive and 16 th Street N o N Lexington Street and 18 th Street N 68
76 BICYCLE FACILITIES bicycles to and from the site. Figure 41 shows existing bicycle facilities in the area. This section presents a review of bicycle routes to and from the Reed site. The purpose of this review is to develop a set of recommendations for infrastructure and operational improvements to raise the potential bicycle mode split of students and staff at the New ES. The steps performed in this review included: A detailed review of existing bicycle infrastructure in the vicinity of the site An examination of impacts that planned County projects would have on bicycle comfort levels to and from the site The following conclusions are reached within this chapter: The site has good connectivity to existing on and off street bicycle facilities. The site is surrounded by local neighborhood streets, bicycle lanes on Washington Boulevard and Patrick Henry Drive, and the W&OD and Custis Trails While there are no bicycle lanes on Washington Boulevard adjacent to the site and stretching westward, planned improvements will add bicycle lanes and narrow vehicular lanes in both direction, improving bicycle comfort levels. There is one (1) Capital Bikeshare station adjacent to the site, with an additional station planned at the intersection of Washington Boulevard and Patrick Henry Drive in FY2018 Providing long term bicycle parking, showers, and lockers for staff, and well situated short term bicycle parking for students and visitors will increase the likelihood of people choosing to cycle to and from the site EXISTING BICYCLE FACILITIES REVIEW The site has good connectivity to existing on and off street bicycle facilities, and the site is surrounded by neighborhood streets that are relatively low in vehicular traffic and speed. North south connectivity is provided via bicycle lanes on Patrick Henry Drive and signed routes on N Lexington Street and N McKinley Road. East west connectivity is provided via bicycle lanes on Washington Boulevard and via signed routes on 22 nd Street N. In addition, the site is located a short distance from the W&OD and Custis Trails, which are both located less than 0.5 miles from the site. These two trails provide regional connectivity Bicycle Parking There is some short term bicycle parking in the vicinity of the site, particularly near the entrance to the Westover Branch Library. Capital Bikeshare In addition to personal bicycle, the Capital Bikeshare program provides additional cycling options for staff and visitors of the planned development. The Bikeshare program has placed over 400 Bikeshare stations across Washington, DC, Arlington, and Alexandria, VA, Montgomery County, MD, and most recently Fairfax, VA, with over 3,700 bicycles provided. There is a Capital Bikeshare station that is adjacent to the site, on the northwest corner of the intersection of Washington Boulevard and N McKinley Road. The Capital Bikeshare stations house a total of 15 bikes. PLANNED BICYCLE FACILITIES This section reviews planned infrastructure improvements near the Reed site that would improve bicycle comfort levels to and from the site. Washington Boulevard Bike, Pedestrian, Roadway Enhancements A number of improvements to bicycle infrastructure are included as part of the Washington Boulevard Bike, Pedestrian, Roadway Enhancements project. The most significant feature of the proposed plan is the introduction of bicycle lanes in both directions; some stretches getting an additional 2 or 3 foot buffer against moving traffic. In addition, the narrowing of unnecessarily wide travel lanes to help calm traffic will slow vehicles and further improve bicycle comfort levels. The Washington Boulevard Bike, Pedestrian, Roadway Enhancements project was reviewed in more detail in the Study Area Overview chapter. East Falls Church Plan The East Fall Church Plan includes street improvements such as new lane configurations and the addition of on street bicycle lanes. This is accomplished by removing exclusive right tum lanes and reducing vehicular travel lane widths to create space for on street parking and a striped bicycle lane in each direction 69
77 Improving bicycle comfort in the vicinity of the East Falls Church Metrorail Station is seen as a vital strategy in increasing the likelihood of transit and bicycles being used by commuters. Capital Bikeshare One (1) Capital Bikeshare station is planned at the intersection of Washington Boulevard and Patrick Henry Drive, as part of Arlington County s Capital Bikeshare Expansion Plan. This station is scheduled to be installed in FY2018. BICYCLE FACILITIES AT THE NEW ES The plan for bicycle parking for the New ES is currently being developed as the project is in schematic design. The project plans to include short and long term bicycle parking. Short term bicycle parking spaces will be provided near the primary entrances of the school and will be designed to meet Arlington County s Bicycle Parking Guidelines (2016). This report recommends that bicycle parking be located on both the north and south sides of the New ES, as there will be bicycle facilities and/or bicycle friendly roads on both sides of the facility. In particular, some cyclists may use the trail that leads to 19 th Street N. The project also plans to include secure long term bicycle parking, serving staff that commute to the school. The project plans to meet or exceed the number of long term bicycle parking spaces, showers, and lockers as required by Arlington County. These long term storage spaces are provided for staff so that they may store their bicycles securely. The inclusion of short and long term bicycle parking and related facilities as a part of the project will increase the likelihood of students and staff commuting to and from the site by bicycle. BICYCLE RECOMMENDATIONS Based on the review of bicycle facilities, this report concludes the following: The site has good connectivity to existing on and off street bicycle facilities. The site is surrounded by local neighborhood streets, bicycle lanes on Washington Boulevard and Patrick Henry Drive, and the W&OD and Custis Trails. While there are no bicycle lanes on Washington Boulevard adjacent to the site and stretching westward, planned improvements will add bicycle lanes and narrow vehicular lanes in both direction, improving bicycle comfort levels. There is one (1) Capital Bikeshare station adjacent to the site, with an additional station planned to be installed at the intersection of Washington Boulevard and Patrick Henry Drive in FY2018. The plans for on site bicycle parking for the New ES are currently being developed as part of the schematic design. The school plans to meet or exceed County requirements for short and long term bicycle parking on site, including providing showers and lockers for staff that commute via bicycle. This report recommends short term bicycle parking be located on both the southern and northern entrances to the New ES, as cyclists will likely approach the school from several directions. 70


78 Figure 41: Existing Bicycle Facilities 71

79 Figure 42: Future Bicycle Facilities 72
Arlington Public Schools Thomas Jefferson Site Evaluation Transportation Networks. Thomas Jefferson Working Group Meeting #6 November 10, 2014
 Arlington Public Schools Thomas Jefferson Site Evaluation Transportation Networks Thomas Jefferson Working Group Meeting #6 November 10, 2014 2 3 INTRODUCTION 4 Goal of our work: Identify and assess multi-modal
Arlington Public Schools Abingdon Elementary School Site Evaluation Preliminary Transportation Findings
 Arlington Public Schools Abingdon Elementary School Site Evaluation Preliminary Transportation Findings Arlington County Public Facilities Review Committee (PFRC) November 19, 2014 SAN ANTONIO-BEXAR COUNTY
TRAVEL PLAN: CENTRAL EUROPEAN UNIVERSITY CAMPUS REDEVELOPMENT PROJECT TRAVEL PLAN. Central European University Campus Redevelopment Project.
 TRAVEL PLAN Central European University Campus Redevelopment Project Page 1 Table of Contents Introduction... 3 Background... 7 Building Users... 7 Transportation in Community Consultation... 7 Summary
July 5, Arthur R. Ware, Jr. Elementary School 2017 Safe Routes to School Walkabout Report
 July 5, 2017 Arthur R. Ware, Jr. Elementary School 2017 Safe Routes to School Walkabout Report 1 Walkabout Report Introduction On April 28, 2017, City, School, and SAWMPO staff met to conduct a Safe Routes
Vision: Traditional hamlet with an attractive business/pedestrian friendly main street connected to adjacent walkable neighborhoods
 N D. Focus Area II Vision: Traditional hamlet with an attractive business/pedestrian friendly main street connected to adjacent walkable neighborhoods Transit Road Focus Area II is located in the Hamlet
TECHNICAL MEMORANDUM. Introduction
 TECHNICAL MEMORANDUM To: From: John M. Welsh Chris Furlong AHC, Inc. Andrew T. Smith, P.E. Edward Y. Papazian, P.E. Kimley-Horn and Associates, Inc. Date: July 6, 2017 Subject: 200 9 th reet South Redevelopment
EUCLID AVENUE PARKING STUDY CITY OF SYRACUSE, ONONDAGA COUNTY, NEW YORK
 EUCLID AVENUE PARKING STUDY CITY OF SYRACUSE, ONONDAGA COUNTY, NEW YORK CITY OF SYRACUSE DEPARTMENT OF PUBLIC WORKS 1200 CANAL STREET EXTENSION SYRACUSE, NEW YORK 13210 DRAFT REPORT DATE: November 13,
Abingdon Elementary School School Transportation Report
 Abingdon Elementary School School Transportation Report May 2015 Prepared for Arlington Public Schools by Toole Design Group, LLC 1 CONTENTS Executive Summary... 3 Introduction... 7 Existing Conditions
VDOT I-66 Inside the Beltway Eastbound Widening Environmental Assessment. Staff Recommendations
 VDOT I-66 Inside the Beltway Eastbound Widening Environmental Assessment Staff Recommendations Department of Environmental Services Transportation January 28, 2017 Timeline of Transform66 June 2012: I-66
CITY OF COCOA BEACH 2025 COMPREHENSIVE PLAN. Section VIII Mobility Element Goals, Objectives, and Policies
 CITY OF COCOA BEACH 2025 COMPREHENSIVE PLAN Section VIII Mobility Element Goals, Objectives, and Policies Adopted August 6, 2015 by Ordinance No. 1591 VIII MOBILITY ELEMENT Table of Contents Page Number
Magnolia Place. Traffic Impact Analysis. Prepared for: City of San Mateo. Prepared by: Hexagon Transportation Consultants, Inc.
 Magnolia Place Traffic Impact Analysis Prepared for: City of San Mateo Prepared by: Hexagon Transportation Consultants, Inc. Updated January 4, 2010 Table of Contents 1. Introduction...1 2. Existing Conditions...6
Executive Summary Route 30 Corridor Master Plan
 Route Corridor Master Plan Project Overview The Route Corridor Master Plan is a coordinated multimodal transportation and land use plan for the entire stretch of Route through East Whiteland Township,
Arlington Public Schools New Elementary School at Thomas Jefferson Site Off-Site Transportation. Thomas Jefferson BLPC / PFRC Meeting July 27, 2016
 Arlington Public Schools New Elementary School at Thomas Jefferson Site Off-Site Transportation Thomas Jefferson BLPC / PFRC Meeting July 27, 2016 1.Review of Analysis 2.Key Transportation Issues 3.Recommendations
CONNECTING PEOPLE TO PLACES
 CONNECTING PEOPLE TO PLACES 82 EAST BENCH MASTER PLAN 07 Introduction The East Bench transportation system is a collection of slow moving, treelined residential streets and major arteries that are the
Arlington Public Schools Thomas Jefferson Site Evaluation Preliminary Findings. Thomas Jefferson Working Group Meeting #2 October 1, 2014
 Arlington Public Schools Thomas Jefferson Site Evaluation Preliminary Findings Thomas Jefferson Working Group Meeting #2 October 1, 2014 SAN ANTONIO BEXAR COUNTY PEDESTRIAN SAFETY ACTION PLAN INTRODUCTION
Traffic Impact Memorandum. May 22, 2018
 BISHOP PROFESSIONAL DEVELOPMENT BUILDING Proposed Land-use Change & Parking Modification 3601 SW 31st Street Topeka, Kansas 66614 CFS Project No. 185077 Traffic Impact Memorandum May 22, 2018 Prepared
Shockoe Bottom Preliminary Traffic and Parking Analysis
 Shockoe Bottom Preliminary Traffic and Parking Analysis Richmond, Virginia August 14, 2013 Prepared For City of Richmond Department of Public Works Prepared By 1001 Boulders Pkwy Suite 300, Richmond, VA
Meadow Woods Elementary School
 Drag and drop pic and stretch/crop to the limits of the blue rectangle (delete this text box) Meadow Woods Elementary School Drag and drop pic and stretch/crop to the limits of the blue rectangle (delete
Broad Street Bicycle Boulevard Design Guidelines
 Broad Street Bicycle Boulevard Design Guidelines Building from the strategies introduced in the 2013 Bicycle Transportation Plan and community input received thus far, City Transportation Staff have identified
Active Transportation Facility Glossary
 Active Transportation Facility Glossary This document defines different active transportation facilities and suggests appropriate corridor types. Click on a facility type to jump to its definition. Bike
Washington DC Section of ITE Project Briefing
 Washington DC Section of ITE Project Briefing November 5, 2015 Renée Hamilton, VDOT, Deputy District Administrator I-66 Outside the Beltway Improvement Area Project Location Virginia 2 Purpose and Need
Hidden Oaks Elementary School
 Hidden Oaks Elementary School SCHOOL ROUTE PLAN For HIDDEN OAKS ELEMENTARY SCHOOL LOCATION 13 ORANGE COUNTY Prepared for: ORANGE COUNTY SCHOOL ASSESSMENT PROGRAM ORANGE COUNTY PUBLIC WORKS Traffic Engineering
Development of Arlington County s Marked Crosswalk Guidelines. Jon Lawler, P.E. Design Engineer Arlington County, VA
 Development of Arlington County s Marked Crosswalk Guidelines Jon Lawler, P.E. Design Engineer Arlington County, VA April 13, 2015 Transportation System Users Residents Estimated 215,000 in 2014 Lowest
C C C
 C-012-001 Thank you for your support for the creation of new public space and nonmotorized access between downtown and the waterfront through the Overlook Walk, the East-West Connections, and the Promenade.
N. Frederick Street to N. Manchester Street
 November 20, 2014 N. Frederick Street to N. Manchester Street Goals and Summary, November 2007 Map, December 2007 Bicycle Element, July 2008 Pedestrian Element, July 2008 Demand and System Management,
HALFF TRAFFIC MANAGEMENT PLAN. Richardson ISD Northwood Hills Elementary School Dallas, Texas. /? /4O/2o16
 30279 161966 TRAFFIC MANAGEMENT PLAN Richardson ISD Northwood Hills Elementary School August 30 2016 Exhibit 976B Planned Development District No. 976 Z156-311(OTH) Approved City Plan Commission October
TRAFFIC IMPACT ANALYSIS
 TRAFFIC IMPACT ANALYSIS FOR THE CHAMPAIGN UNIT#4 SCHOOL DISTRICT PROPOSED HIGH SCHOOL (SPALDING PARK SITE) IN THE CITY OF CHAMPAIGN Final Report Champaign Urbana Urbanized Area Transportation Study 6/24/2014
Virginia Hospital Center Expansion
 Virginia Hospital Center Expansion Site Plan Amendment (SP #177) SPRC Meeting #2 Dennis Sellin Arlington County DES/Transportation February 5, 2018 1 Arlington County Master Transportation Plan Goals Move
Public Works Committee Meeting Richard E. Mastrangelo Council Chamber November 20, 2017
 Public Works Committee Meeting Richard E. Mastrangelo Council Chamber November 20, 2017 Purpose of Meeting Why are we here? Project Recap/Updates Project Limits/Segments Road Diet Concept Lessons Learned
Appendix B: Forecasting and Traffic Operations Analysis Framework Document
 Existing Conditions Report - Appendix Appendix B: Forecasting and Traffic Operations Analysis Framework Document This document defines the methodology and assumptions that will be used in the traffic forecasting
Old Dominion Drive (Route 309) Pedestrian Safety Project Phase II. North Glebe Road to 38 th Street N
 Pedestrian Safety Project Phase II. North Glebe Road to 38 th Street N") Old Dominion Drive (Route 309) Pedestrian Safety Project Phase II North Glebe Road to 38 th Street N Prepared: 12/2010 The presentation you are about to review represents a 90 percent completed design.
Old Dominion Drive (Route 309) Pedestrian Safety Project Phase II North Glebe Road to 38 th Street N Prepared: 12/2010 The presentation you are about to review represents a 90 percent completed design.
FY Transportation Capital Improvement Plan Update Arlington Committee for Transportation Choices
 FY 2017-2026 Transportation Capital Improvement Plan Update Arlington Committee for Transportation Choices November 1, 2017 Forecasted Growth Arlington continues to grow with a shift towards multi-family
PRINCE GEORGE S PLAZA METRO AREA PEDESTRIAN PLAN
 PRINCE GEORGE S PLAZA METRO AREA PEDESTRIAN PLAN May 28, 2008 Agenda Welcome and introductions Project overview and issue identification Planning context and strengths Design challenges and initial recommendations
Agenda. Overview PRINCE GEORGE S PLAZA METRO AREA PEDESTRIAN PLAN
 PRINCE GEORGE S PLAZA METRO AREA PEDESTRIAN PLAN May 28, 2008 Agenda Welcome and introductions Project overview and issue identification Planning context and strengths Design challenges and initial recommendations
Solana Beach Comprehensive Active Transportation Strategy (CATS)
") Solana Beach Comprehensive Active Transportation Strategy (CATS) 3.0 Goals & Policies The Solana Beach CATS goals and objectives outlined below were largely drawn from the Solana Beach Circulation Element
Solana Beach Comprehensive Active Transportation Strategy (CATS) 3.0 Goals & Policies The Solana Beach CATS goals and objectives outlined below were largely drawn from the Solana Beach Circulation Element
NM-POLICY 1: Improve service levels, participation, and options for non-motorized transportation modes throughout the County.
 Transportation PRINCE WILLIAM COUNTY 2008 COMPREHENSIVE PLAN NON-MOTORIZED PLAN CONTENTS Goals, Policies, and Action Strategies Table 4 (Bike Facility Classifications and Descriptions) Table 5 (Bike Facility
Drag and drop pic and stretch/crop to the limits of the blue rectangle (delete this text box) Maxey Elementary School
 Maxey Elementary School") Drag and drop pic and stretch/crop to the limits of the blue rectangle (delete this text box) Maxey Elementary School SCHOOL ROUTE PLAN For MAXEY ELEMENTARY SCHOOL LOCATION 33 ORANGE COUNTY Prepared for:
Drag and drop pic and stretch/crop to the limits of the blue rectangle (delete this text box) Maxey Elementary School SCHOOL ROUTE PLAN For MAXEY ELEMENTARY SCHOOL LOCATION 33 ORANGE COUNTY Prepared for:
10.0 CURB EXTENSIONS GUIDELINE
 10.0 CURB EXTENSIONS GUIDELINE Road Engineering Design Guidelines Version 1.0 March 2017 City of Toronto, Transportation Services City of Toronto Page 0 Background In early 2014, Transportation Services
Item to be Addressed Checklist Consideration YES NO N/A Required Description Complete Streets Guidelines
 Passaic County Complete Streets Checklist - Concept Development Project Name Item to be Addressed Checklist Consideration YES NO N/A Required Description Complete Streets Guidelines Existing Plans Have
Downtown Naples Mobility and Connectivity Study. Naples City Council Presentation January 2017
 Downtown Naples Mobility and Connectivity Study Naples City Council Presentation January 2017 Agenda 1. Introduction 2. Scope Review 3. Project Schedule 4. Existing Conditions 5. Public Charrette 6. Mobility
Orange Center Elementary School
 Drag and drop pic and stretch/crop to the limits of the blue rectangle (delete this text box) Orange Center Elementary School Drag and drop pic and stretch/crop to the limits of the blue rectangle (delete
Arlington s Master Transportation Plan
 Arlington s Master Transportation Plan The Master Transportation Plan (MTP) Adopted in eight parts Goals & Policies element and MTP Map adopted in 2007 Bicycle, Pedestrian and Demand and Systems Management
PenPlace SPRC #6. September 27, DRAFT
 PenPlace SPRC #6 1 Agenda Site and Project Overview Multiple Transportation Options Traffic Analysis Neighborhood Analysis Street Network Street Sections/Sidewalk Width Pedestrian/Bicycle Circulation Secure
Chapter 5 Future Transportation
 Chapter 5 Future Transportation The Future Land Use Plan identifies the desired land use designations. The land uses desired for Crozet depend, in large part, on the success of the transportation system,
Roads and Vehicular Traffic Design Principles. Roads and Vehicular Traffic Recommendations
 CIRCULATION AND PARKING roads and vehicular traffic The Campus Master Plan updates the campus transportation network through a multi-modal approach that encourages walking and biking while improving vehicular
122 Avenue: 107 Street to Fort Road
 : 107 Street to Fort Road November 24, 2015 4:30 8:00 p.m. Meeting Purpose Summarize project work completed to date Share results of public input from Phase 1 Share the draft concept plan and proposed
2014/2015 BIKE ROUTE PLAN 83 AVENUE PROTECTED BIKE LANE
 About the Project 2014/2015 BIKE ROUTE PLAN The City of Edmonton is planning a major bike route on the south side of Edmonton. This bike route is one part of a plan to provide citizens with transportation
ADA Transition Plan. City of Gainesville FY19-FY28. Date: November 5, Prepared by: City Of Gainesville Department of Mobility
 ADA Transition Plan FY19-FY28 Date: November 5, 2018 Prepared by: City Of Gainesville Department of Mobility 1.0 INTRODUCTION 1.1 BACKGROUND The federal statute known as the Americans with Disabilities
Set of plans containing details for game day operations of the Ballpark. Plans set forth the responsibilities and the specific actions of:
 What is the TOPP? Set of plans containing details for game day operations of the Ballpark. Plans set forth the responsibilities and the specific actions of: Ballpark management, District Department of
o n - m o t o r i z e d transportation is an overlooked element that can greatly enhance the overall quality of life for the community s residents.
 N o n - m o t o r i z e d transportation is an overlooked element that can greatly enhance the overall quality of life for the community s residents. 84 Transportation CHAPTER 11 INTRODUCTION Transportation
Preliminary Transportation Analysis
 Preliminary Transportation Analysis Goals of a Robust, Multimodal Transportation Network Safe Accessible/Connected Efficient Comfortable Context-Sensitive Motor Vehicle: Continue to analyze the data to
Chapter 2: Standards for Access, Non-Motorized, and Transit
 Standards for Access, Non-Motorized, and Transit Chapter 2: Standards for Access, Non-Motorized, and Transit The Washtenaw County Access Management Plan was developed based on the analysis of existing
TRAFFIC ACTION PLAN. North Central Neighborhood CITY OF SAN MATEO
 TRAFFIC ACTION PLAN North Central Neighborhood CITY OF SAN MATEO Draft February 2017 Table of Contents Introduction... 1 The Traffic Forum Process... 4 Neighborhood Traffic Issues... 6 Neighborhood Recommendations
Clackamas County Comprehensive Plan
 ROADWAYS The County s road system permits the movement of goods and people between communities and regions, using any of a variety of modes of travel. Roads provide access to virtually all property. They
REGIONAL BICYCLE AND PEDESTRIAN DESIGN GUIDELINES
 REGIONAL BICYCLE AND PEDESTRIAN DESIGN GUIDELINES November 16, 2011 Deb Humphreys North Central Texas Council of Governments Bicycle and Pedestrian Advisory Committee Snapshot of the Guide 1. Introduction
Presentation to Media. February 27, 2008
 Anacostia Waterfront Nationals Ballpark Transportation Management Plan Presentation to Media February 27, 2008 Overarching Goals of DDOT s Ballpark TMP Organize and manage traffic to ensure pedestrian
Bikeway action plan. Bicycle Friendly Community Workshop March 5, 2007 Rochester, MN
 Bikeway action plan Summary The was held on March 5, 2007 at the Rochester Mayo Civic Center. The workshop was hosted by Rochester-Olmsted County Planning Department in collaboration with the League of
Windy Ridge Elementary School
 Windy Ridge Elementary School SCHOOL ROUTE PLAN For WINDY RIDGE ELEMENTARY SCHOOL LOCATION 54 ORANGE COUNTY Prepared for: ORANGE COUNTY SCHOOL ASSESSMENT PROGRAM ORANGE COUNTY PUBLIC WORKS Traffic Engineering
HENDERSON DEVELOPMENT 213, 217, 221, 221 ½, 223 HENDERSON AVENUE and 65 TEMPLETON STREET OTTAWA, ONTARIO TRANSPORTATION OVERVIEW.
 HENDERSON DEVELOPMENT 213, 217, 221, 221 ½, 223 HENDERSON AVENUE and 65 TEMPLETON STREET OTTAWA, ONTARIO TRANSPORTATION OVERVIEW Prepared for: 2294170 Ontario Inc. February 2, 2017 117-652 Report_1.doc
Business owner or commercial property owner in Arlington, 8. Visitor in Arlington, 17
 1. How do you currently travel around your neighborhood? (Select your top 3) Resident of Arlington 86.72% 222 Worker in Arlington 20.70% 53 Business owner or commercial property own 3.13% 8 Visitor in
APPENDIX G: INTERSECTION NEEDS AT OKEECHOBEE BOULEVARD
 APPENDIX G: INTERSECTION NEEDS AT OKEECHOBEE BOULEVARD INTERSECTION NEEDS AT SR 7 and OKEECHOBEE BOULEVARD SR 7 Extension Project Development and Environment (PD&E) Study From Okeechobee Boulevard (SR
Welcome. If you have any questions or comments on the project, please contact:
 Welcome This drop-in public open house is intended to provide information about the Bay Street bike lanes project. This project proposes a dedicated cycling facility along Bay Street between Aberdeen Avenue
Exhibit 1 PLANNING COMMISSION AGENDA ITEM
 Exhibit 1 PLANNING COMMISSION AGENDA ITEM Project Name: Grand Junction Circulation Plan Grand Junction Complete Streets Policy Applicant: City of Grand Junction Representative: David Thornton Address:
BETHEL ROAD AND SEDGWICK ROAD CORRIDOR STUDY
 DRAFT PLAN City Council Meeting August 14, 2017 STUDY AREA Sedgwick Corridor State Route 160, principal arterial with Class 3 access management designation, commuter and freight route, connection to SR
Memorandum. Sunday, July 13, Saturday, July 19, 2014
 Memorandum To: David Lowin, Brooklyn Bridge Park Corporation From: Daniel Schack, AICP, PTP Date: Re: Brooklyn Bridge Park Pier 5/6 Loop Road Traffic Study Project No: 14-01-2407 At the request of Brooklyn
Lake Whitney Elementary School
 Lake Whitney Elementary School SCHOOL ROUTE PLAN For LAKE WHITNEY ELEMENTARY SCHOOL LOCATION 18 ORANGE COUNTY Prepared for: ORANGE COUNTY SCHOOL ASSESSMENT PROGRAM ORANGE COUNTY PUBLIC WORKS Traffic Engineering
5 CIRCULATION AND STREET DESIGN
 5 CIRCULATION AND STREET DESIGN This chapter describes circulation and streetscape improvements proposed for the Northwest Chico Specific Plan Area. It includes detailed design specifications for existing
SECTION 1 - TRAFFIC PLANNING
 SECTION 1 - TRAFFIC PLANNING 1.1 TRAFFIC OPERATIONS 1.1.1 Roadway Functional Classification The Multnomah County Comprehensive Framework Plan s Policy 34: Trafficways and the Functional Classification
MAG Town of Cave Creek Bike Study Task 6 Executive Summary and Regional Significance Report
 Page 1 MAG Town of Cave Creek Bike Study Task 6 Executive Summary and Regional Significance Report August 1, 2012 MAG Project #481 Page 2 Task 6 Executive Summary and Regional Significance Report Introduction
Corpus Christi Metropolitan Transportation Plan Fiscal Year Introduction:
 Introduction: The Safe, Accountable, Flexible, Efficient Transportation Equity Act: A Legacy for Users (SAFETEA-LU) has continued the efforts started through the Intermodal Surface Transportation Efficiency
Transportation Impact Study for Abington Terrace
 Transportation Impact Study for Abington Terrace Abington Township, Montgomery County, PA Sandy A. Koza, P.E., PTOE PA PE License Number PE059911 Prepared by McMahon Associates, Inc. 425 Commerce Drive,
Building Great Neighbourhoods BELLEVUE AND VIRGINIA PARK
 Building Great Neighbourhoods BELLEVUE AND VIRGINIA PARK This is Meeting 2 Unfortunately, some residents in Bellevue and Virginia Park received the wrong information for this public open house (Meeting
THIS PAGE LEFT BLANK INTENTIONALLY
 GA SR 25 Spur at Canal Road Transportation Impact Analysis PREPARED FOR GLYNN COUNTY, GEORGIA 1725 Reynolds Street, Suite 300 Brunswick, Georgia 31520 PREPARED BY 217 Arrowhead Boulevard Suite 26 Jonesboro,
Working Group Meeting
 Working Group Meeting February 6, 2018 Parks and Natural Resources Operations Building Transportation Analysis Draft Policy Framework Agenda 7:05 pm Welcome 7:10 pm Follow-up from Previous Meetings Schedule
5. RUNNINGWAY GUIDELINES
 5. RUNNINGWAY GUIDELINES These guidelines should be considered collectively when making runningway decisions. A runningway is the linear component of the transit system that forms the right-of-way reserved
14 TH STREET TRANSPORTATION & STREETSCAPE DESIGN STUDY PLAN B PLAN B TRANSPORTATION & STREETSCAPE RECOMMENDATIONS
 14 TH STREET TRANSPORTATION & STREETSCAPE DESIGN STUDY PLAN B PLAN B TRANSPORTATION & STREETSCAPE RECOMMENDATIONS 141 Symbols Recommendations - Southern End of 14th Street Study Area Streetscape Each icon
Small Area Study U.S. Route 220 and VA Route 615 Intersection. Bath County, Virginia
 Small Area Study U.S. Route 220 and VA Route 615 Intersection Bath County, Virginia Prepared by the Central Shenandoah Planning District Commission Final Report February 2018 Table of Contents 1. INTRODUCTION...
Cycle Track Design Best Practices Cycle Track Sections
 Design Best Practices Sections It is along street segments where the separation and protection methods of cycle tracks offer more comfort than conventional bicycle lanes, and are more attractive to a wide
CURBSIDE ACTIVITY DESIGN
 5 CURBSIDE ACTIVITY DESIGN This chapter provides design guidance for separated bike lanes adjacent to curbside activities including parking, loading and bus stops. Typical configurations are presented
Circulation in Elk Grove includes: Motor vehicles, including cars and trucks
 Circulation, as it is used in this General Plan, refers to the many ways people and goods move from place to place in Elk Grove and the region. Circulation in Elk Grove includes: Motor vehicles, including
9 Leeming Drive Redevelopment Ottawa, ON Transportation Brief. Prepared By: Stantec Consulting Ltd.
 9 Leeming Drive Redevelopment Ottawa, ON Transportation Brief Prepared By: Stantec Consulting Ltd. TIA GUIDELINES CHECKLIST Report Context Municipal Address Comment: Section 1.1 Location relative to major
CITY OF BLOOMINGTON COMPLETE STREETS POLICY
 CITY OF BLOOMINGTON COMPLETE STREETS POLICY POLICY OBJECTIVE: The City of Bloomington will enhance safety, mobility, accessibility and convenience for transportation network users of all ages and abilities,
Pedestrian, Bicycle and Traffic Calming Strategic Implementation Plan. January 18, 2011
 Pedestrian, Bicycle and Traffic Calming Strategic Implementation Plan January 18, 2011 Tonight s Agenda Receive update on project Provide feedback on two policy issues Complete Streets Policy Project Prioritization
DULLES AREA TRANSPORTATION ASSOCIATION (DATA) February 18, Susan Shaw, P.E., VDOT, Megaprojects Director
 February 18, Susan Shaw, P.E., VDOT, Megaprojects Director") DULLES AREA TRANSPORTATION ASSOCIATION (DATA) February 18, 2015 Susan Shaw, P.E., VDOT, Megaprojects Director I-66 Corridor Conditions Steady population growth Employment growth in activity centers Congestion
DULLES AREA TRANSPORTATION ASSOCIATION (DATA) February 18, 2015 Susan Shaw, P.E., VDOT, Megaprojects Director I-66 Corridor Conditions Steady population growth Employment growth in activity centers Congestion
SAN FRANCISCO MUNICIPAL TRANSPORTATION AGENCY
 THIS PRINT COVERS CALENDAR ITEM NO. : 11 DIVISION: Sustainable Streets BRIEF DESCRIPTION: SAN FRANCISCO MUNICIPAL TRANSPORTATION AGENCY Approving traffic modifications on Twin Peaks Boulevard between Christmas
APPENDIX 2 LAKESHORE ROAD TRANSPORTATION REVIEW STUDY EXECUTIVE SUMMARY
 APPENDIX 2 LAKESHORE ROAD TRANSPORTATION REVIEW STUDY EXECUTIVE SUMMARY Appendix 2 City of Mississauga Lakeshore Road FINAL REPORT Transportation Review Study December 2010 EXECUTIVE SUMMARY Study Purpose
Ownership Lots 17 & 18 (Part of Lot 14), Montgomery Auto Sales Park
, Montgomery Auto Sales Park") Traffic Impact Analysis Ownership Lots 17 & 18 (Part of Lot 14), Montgomery Auto Sales Park Silver Spring, MD Lot 17: Site Plan No. 821413 Lot 18: Site Plan No. 821414 Filing Number: 13-TS-1198527A Prepared
Traffic Impact Analysis Ownership Lots 17 & 18 (Part of Lot 14), Montgomery Auto Sales Park Silver Spring, MD Lot 17: Site Plan No. 821413 Lot 18: Site Plan No. 821414 Filing Number: 13-TS-1198527A Prepared
Goodlettsville Bicycle and Pedestrian Plan Executive Summary
 Goodlettsville Bicycle and Pedestrian Plan July 2010 In Cooperation with the Nashville Area Metropolitan Planning Executive Organization Summary Introduction Progressive and forward thinking communities
Multimodal Through Corridors and Placemaking Corridors
 68 Multimodal Through Corridors and Placemaking Corridors Corridors have different functions in a region. Some corridors are used to get smoothly and rapidly through a region or to get quickly to major
WELCOME TO OPEN HOUSE # 1 June 14, 2017
 Langstaff Road Weston Road to Highway 7 Class Environmental Assessment Study WELCOME TO OPEN HOUSE # 1 June 14, 2017 Please sign in and join our mailing list Purpose of Open House #1 & Study Area York
University of Victoria Campus Cycling Plan Terms of Reference. 1.0 Project Description
 University of Victoria Campus Cycling Plan Terms of Reference 1.0 Project Description The Campus Cycling Plan, a first for the University, will provide a comprehensive and coordinated approach to support
Draft North Industrial Area-Wide Traffic Plan
 Summary of North Industrial and Hudson Bay Industrial Recommended Improvements Table 1. Summary of s Item Location 1 2 3 4 5 6 7 8 9 10 11 12 Millar Ave north of 51st St Super 8 Motel back lane 400 Block
June 29, Dear Mr. Walter:
 From: CountyBoard@arlingtonva.us To: chickandsandy@msn.com Subject: County Board Response Regarding the Arlington Ridge Road Improvement Project (Intranet Quorum IMA00252707) Date: Wed, 29 Jun 2011 08:09:53-0400
DRAFT BUENA VISTA 2020 TRANSPORTATION PLAN
 DRAFT BUENA VISTA 2020 TRANSPORTATION PLAN DEVELOPED BY THE TRANSPORTATION PLANNING DIVISION OF THE VIRGINIA DEPARTMENT OF TRANSPORTATION IN COOPERATION WITH THE U.S. DEPARTMENT OF TRANSPORTATION, FEDERAL
Citizen Advisory Group Meeting #8 May 5, Welcome. Today s meeting will focus on: Land Use & Transportation CHARLOTTEPLANNING.
 Citizen Advisory Group Meeting #8 May 5, 2010 Welcome. Today s meeting will focus on: Land Use & Transportation CHARLOTTEPLANNING.ORG Meeting Agenda Handouts: o Meeting Agenda o Summary of East Seventh
CITY OF OAK CREEK SAFE ROUTES TO SCHOOL ACTION PLAN. East Middle School
 CITY OF OAK CREEK SAFE ROUTES TO SCHOOL ACTION PLAN East Middle School CITY OF OAK CREEK SAFE ROUTES TO SCHOOL ACTION PLAN East Middle School Why Safe Routes to School? Safe Routes to School ( SRTS ) is
5858 N COLLEGE, LLC N College Avenue Traffic Impact Study
 5858 N COLLEGE, LLC nue Traffic Impact Study August 22, 2016 Contents Traffic Impact Study Page Preparer Qualifications... 1 Introduction... 2 Existing Roadway Conditions... 5 Existing Traffic Conditions...
Standing Committee on Policy and Strategic Priorities. Mount Pleasant Industrial Area Parking Strategy and Access Improvements
 POLICY REPORT Report Date: April 23, 2018 Contact: Lon LaClaire Contact No.: 604.873.7722 RTS No.: 9944 VanRIMS No.: 08-2000-20 Meeting Date: May 16, 2018 TO: FROM: SUBJECT: Standing Committee on Policy
Transportation 6. A. Transit Center Circulation and Access. 1. Transit Center Circulation
 Transportation 6 This chapter describes the transportation system in and around the Hillsdale Station Area, with a focus on the Transit Center at the relocated Hillsdale Caltrain Station. The transportation
RECOMMENDATION: Approve traffic calming projects as recommended by the Neighborhood Traffic Calming Committee (NTCC) on the following streets:
 on the following streets:") June 24, 2003 TO: FROM: SUBJECT: The County Board of Arlington, Virginia Ron Carlee, County Manager Approval of Traffic Calming Projects RECOMMENDATION: Approve traffic calming projects as recommended
June 24, 2003 TO: FROM: SUBJECT: The County Board of Arlington, Virginia Ron Carlee, County Manager Approval of Traffic Calming Projects RECOMMENDATION: Approve traffic calming projects as recommended