BRC TAMS & ESTABLISHMENT SURVEY / SEM UPDATE OCTOBER 2017
|
|
|
- Alaina Craig
- 5 years ago
- Views:
Transcription

1 BRC TAMS & ESTABLISHMENT SURVEY / SEM UPDATE OCTOBER
2 ESTABLISHMENT SURVEY UPDATE OCTOBER
3 THE ES REPRESENTATIVE OF THE SA POPULATION DEMOGRAPHIC / GEOGRAPHIC / LIFESTYLE / PRODUCTS & MULTI-MEDIA LANDSCAPE CROSS PLATFORM / CROSS DEVICE MEDIA CONSUMPTION SINGLE SOURCE (IHS POPULATION DATA) SEM S (SEGMENTATION MODEL) PRODUCTS & BRANDS MODULE (IN 2018) 3
 Source: IHS Individual Population estimates Jun")
4 ES SAMPLE CLOSELY REFLECTS THE SA POPULATION ES (unweighted) IHS Population Black 81% Coloured 10% Indian / Asian 2% White 8% Black 79% Coloured 9% Indian / Asian 3% White 9% Source: ES Jul 2016-Jun 2017 (n=25,082) Source: IHS Individual Population estimates Jun

5 WEIGHTING EFFICIENCY HOUSEHOLD 93.8% INDIVIDUAL 84.7% 5


6 ES VITAL SIGNS NATIONAL SAMPLE 25,082 sample JUL 2016 JUN % Metro 28% Urban 31% Rural Universe: Population aged million 6

7 DEMOGRAPHIC LANDSCAPE 7
8 DEMOGRAPHIC LANDSCAPE BLACK WHITE COLOURED INDIAN 79% 9% 9% 3% 15.8 million HOUSEHOLDS 39.5 million ADULTS 15 YEARS+ AGE % LANGUAGES SPOKEN IN HOME % % 48% Zulu English Xhosa Afrikaans Sesotho Sepedi Setswana Tsonga Swati Ndebele Venda
9 DEMOGRAPHIC LANDSCAPE MONTHLY HOUSEHOLD INCOME % AVERAGE: R10, R0 - R R R R3 999 R R4 999 R R9 999 R R R R R R R Below Matric Matric Tertiary Working full-time Working part-time CHILDREN UNDER 15 YEARS LIVING AT HOME % Unemployed Not looking for work 49% WORKING 51% NOT WORKING Student Retired Home executive % CHILDREN 55% NONE 9
10 GEOGRAPHIC LANDSCAPE 10

 28% (11.2m) 5% (2.0m) 2% (0.")
 19% (7.6m) 31% (12.1m) 12% (4.")
11 GEOGRAPHIC LANDSCAPE PROVINCE % and population figures 41% (16.1m) 25% (10.0m) 7% (2.6m) LP 10% (3.8m) 28% (11.2m) 5% (2.0m) 2% (0.9m) NC NW GP FS MP KZN 7% (2.9m) 19% (7.6m) 31% (12.1m) 12% (4.8m) WC EC 12% (4.8m) 11
12 PRODUCTS AND LIFESTYLES 12

13 LIFESTYLES Past week destinations % Black 74 Coloured Indian/Asian 4 8 White 15 48% Shopping mall 13

14 LIFESTYLES Past week destinations % Black 61 Coloured Indian/Asian 6 4 White 29 11% Restaurant 14


15 LIFESTYLES Past week destinations % Black 87 Coloured Indian/Asian White % Stadium 15


16 PRODUCT % Black 76 Coloured Indian/Asian White % Home theatre system in home 16


17 PRODUCT % Black 73 Coloured 11 Indian/Asian 4 White 13 69% Microwave oven in home 17

18 PRODUCT % Black 46 Coloured 14 Indian/Asian 7 White 33 25% Motor car in home 18
19 MEDIA LANDSCAPE 19


20 P4WEEK MEDIA LANDSCAPE DEVICE % TV set Cellphone Paper/ printed copy Radio set/ hi-fi Car/Taxi/ Bus radio Desktop/ laptop Tablet Games console
21 MEDIA LANDSCAPE REACH % Yesterday In the last week In the last month 6 In the last 3 months 9 In the last 6 months 13 In the last 12 months TV Radio Internet Newspapers Magazines Cinema 21

22 SNAPSHOTS BY MEDIA TYPE 22
23 VIEWING Past 7 days 23

24 VIEWING REACH 90% of the population in a day 94% of the population in a week 95% of the population in a month 24
25 P7D TV VIEWERS DEMOGRAPHIC LANDSCAPE BLACK WHITE COLOURED INDIAN 37.1 million ADULTS 15 YEARS+ 79% 9% 9% 3% AGE % HOME LANGUAGE % % 48% Zulu Xhosa Afrikaans English Sepedi Sesotho Setswana Tsonga Swati Venda Ndebele
26 P7D TV VIEWERS DEMOGRAPHIC LANDSCAPE MONTHLY HOUSEHOLD INCOME % AVERAGE: R10, R0 - R1 999 R R R 10 R R4 999 R R9 999 R R R R R R R Below Matric Matric Tertiary Working full-time Working part-time CHILDREN UNDER 15 YEARS LIVING AT HOME % 49% WORKING 51% NOT WORKING Unemployed Not looking for work Student Retired Home executive % CHILDREN 54% NONE 26
 28% URBAN 5% (1.9m) 2% (0.8m) NC NW GP FS MP KZN 7% (2.8m) 19% (7.1m) 30% RURAL 13% (4.7m) WC EC 11% (4.")
27 P7D TV VIEWERS GEOGRAPHIC LANDSCAPE PROVINCE % and population figures 42% METRO 26% (9.6m) 6% (2.4m) LP 10% (3.6m) 28% URBAN 5% (1.9m) 2% (0.8m) NC NW GP FS MP KZN 7% (2.8m) 19% (7.1m) 30% RURAL 13% (4.7m) WC EC 11% (4.2m) 27


28 VIEWING DEVICE TV set 97% Smartphone 8% Laptop/ desktop 2% Tablet 1% Games console 1% 28


29 VIEWING LOCATION Location in past week % Home/someone else s home 98 Shopping centre/shop/bank 7 Bar/shebeen/pub/café 6 Work 5 Restaurant/coffee shop 5 Car/taxi/bus 4 School/university/college 1 29
30 LISTENING Past 7 days 30
31 LISTENING REACH 71% of the population in a day 84% of the population in a week 88% of the population in a month 31
32 P7D RADIO LISTENERS DEMOGRAPHIC LANDSCAPE BLACK WHITE COLOURED INDIAN 33.3 million ADULTS 15 YEARS+ 80% 9% 8% 3% AGE % HOME LANGUAGE % % 50% Zulu Xhosa Afrikaans English Sepedi Sesotho Setswana Tsonga Swati Venda Ndebele
33 READING Past 7 days 33
34 P7D NEWSPAPER READERS DEMOGRAPHIC LANDSCAPE BLACK WHITE COLOURED INDIAN 69% 14% 13% 4% 13.1 million ADULTS 15 YEARS+ AGE % % 53% LANGUAGES READ AND UNDERSTAND % English Afrikaans Zulu Xhosa Sesotho Setswana Sepedi Swati Tsonga Ndebele Venda
35 P7D MAGAZINE READERS DEMOGRAPHIC LANDSCAPE BLACK WHITE COLOURED INDIAN 67% 19% 12% 3% 5.7 million ADULTS 15 YEARS+ AGE % % 42% LANGUAGES READ AND UNDERSTAND % English Afrikaans Zulu Xhosa Sesotho Sepedi Setswana Ndebele Swati Tsonga Venda
36 DIGITAL Past 7 days 36
37 P7D INTERNET USERS DEMOGRAPHIC LANDSCAPE BLACK WHITE COLOURED INDIAN 75% 14% 8% 3% 19.6 million ADULTS 15 YEARS+ AGE % % 50% LANGUAGES READ AND UNDERSTAND % English Zulu Afrikaans Xhosa Sesotho Sepedi Setswana Tsonga Swati Ndebele Venda
38 DIGITAL DEVICE % Cellphone Desktop/ laptop Tablet
39 DIGITAL ACTIVITY BY DEVICE % Cellphone Desktop/ laptop Tablet Whatsapp/IM/chat Social media Search for things Use/download apps Download music/podcasts Play games Check the weather Banking Note: Activities by device used to access internet in past 7 days 39
40 CINEMA Past month 40
41 PAST MONTH CINEMA GOERS DEMOGRAPHIC LANDSCAPE BLACK WHITE COLOURED INDIAN 55% 33% 7% 5% 1.2 million ADULTS 15 YEARS+ AGE % LANGUAGES SPOKEN IN HOME % % 52% English Afrikaans Zulu Sepedi Sesotho Setswana Xhosa Ndebele Swati Tsonga Venda
42 ON THE GO Past 7 days 42

43 PAST WEEK DESTINATIONS Friend's house 59 The bank/atm 24 Spaza shop 55 School/college 13 Shopping mall 48 A restaurant 11 Store or shop 46 Bar/shebeen/tavern 10 Church/place of worship 45 Hospital/clinic 8 Work 42 Stadium 3 Family member's house 38 Cinema 2 Neighbour's house 37 Other/Did not leave home 2 43

44 MODES OF TRANSPORT Walked % 84 Taxi or bus 59 Car 28 Train 2 Bicycle or motorbike 1 Did not leave home 1 Note: Modes of transport to past week destinations 44
45 BRC TAMS UPDATE OCTOBER 2017
46 TV UNIVERSE UPDATE (from the ES)

47 ES SURVEY April September June October M HOUSEHOLDS INDIVIDUALS HOUSEHOLDS INDIVIDUALS SA POPULATION
48 P7D TV VIEWERS DEMOGRAPHIC LANDSCAPE BLACK WHITE COLOURED INDIAN 79% 9% 9% 3% 37.1 million ADULTS 15 YEARS+ AGE % HOME LANGUAGE % % 48% Zulu Xhosa Afrikaans English Sepedi Sesotho Setswana Tsonga Swati Venda Ndebele
49 FREE TO AIR VIEWERS DEMOGRAPHIC LANDSCAPE BLACK WHITE COLOURED INDIAN 86% 3% 10% 1% 18.1 million ADULTS 15 YEARS+ 52% 48% AGE % HOME LANGUAGE % MONTHLY HOUSEHOLD INCOME AVERAGE: R5,971 R Zulu Xhosa Afrikaans Setswana Sesotho Sepedi English Tsonga Swati Venda Ndebele
50 PAY TV SUBSCRIBERS DEMOGRAPHIC LANDSCAPE BLACK WHITE COLOURED INDIAN 70% 17% 9% 4% 15.4 million ADULTS 15 YEARS+ 51% 49% AGE % HOME LANGUAGE % MONTHLY HOUSEHOLD INCOME AVERAGE: R16,882 R Zulu English Afrikaans Sepedi Xhosa Sesotho Setswana Tsonga Swati Venda Ndebele
51 TV SETS IN HH Average of 1.1 working TV sets in household 1 92% Have 1 working TV set % Have 2 working TV sets 1% Have 3+ working TV sets 5% Also have a non-working TV set in home


52 EQUIPMENT IN HH FLAT SCREEN/HD VS STANDARD BOX TELEVISION SETS IN HH 60% Standard box 42% Flat screen/hd PLUG-IN EQUIPMENT 54% DVD player 4% Media player 2% VHS recorder 1% Games console


53 TECHNOLOGY IN HH 46% Satellite dish 51% Antenna/Aerial 8% PVR decoder 38% Standard decoder


54 TV & INTERNET PLATFORMS 46% 1% 0.3% 21,462 individuals 0.05% ** very small base


55 VIEWING BEHAVIOUR 96% Live TV 13% DVD box set 10% Recorded TV 7% Automatically stored on decoder 3% Online 9% have internet enabled TV sets 2% claim internet usage on TV set

56 FROM THE ES TO THE DAILY PANEL... The daily panel is compared to the ES TV UNIVERSE on a household and individual level. Theorethically, in a perfectly representative panel, everyone has the same weight.

57 THE NATURE OF LIVE PANELS... Panels churn, CHANGE and EVOLVE all the time Polling on any given day will not collect data from the whole panel. To PROJECT the correct picture, panels require DAILY ADJUSTMENT by WEIGHTING

58 HOUSEHOLD RIM WEIGHTING STRUCTURE HOUSEHOLD RIMS CATEGORIES Province Race Area (M/U/R) Pay TV/Non Pay TV Household Size Total Number of Categories 21 Min AVG Factor Max Efficiency Index 1,124 5,402 16,
59 INDIVIDUAL RIM WEIGHTING STRUCTURE INDIVIDUAL RIMS CATEGORIES Age Group Kids/Adults x Pay TV/Non Pay TV Kids/Adults x Gender Kids/Adults x Province Kids/Adults x Race Kids/Adults x Area (M/U/R) Total Number of Categories 48 Min AVG Factor Max Efficiency Index 1,689 4,043 13,
60 THE PANEL, WEIGHTING EFFICIENCIES & PANEL HEALTH
 90.9% 89.8% 89.7% 91.0%")
61 THE PANEL KPI Panel Health August 2014 August 2015 August 2016 August 2017 Installed Panel Polling 95% 94.5% 93% 97.1% Reporting (Intabs) 90.9% 89.8% 89.7% 91.0%

62 WEIGHTING EFFICIENCIES KPI Panel Health August 2014 August 2015 August 2016 August 2017 Ind. weighting efficiency 64.9% 79.5% 75% 93% H/H weighting efficiency 54.5% 65% 65% 74% Ind. maximum weight


63 PANEL BALANCE BY PROVINCE & AREA PROVINCE WC NC FS EC KZN MP LP GP NW Ideal Installed AREA Metro Urban Rural
64 TV & INTERNET PLATFORMS ON TAMS 18 HHs equates to 840,000 homes when weighted up Smart TV s will be tracked on the BRC TAMS Panel, as this is a live panel and will give us a better indication of TV Internet Platforms

65 TV UNIVERSE UPDATE (from the ES)


66 BRC TAMS INSTALLED PANEL ALIGNED TO ES TV UNIVERSE BRC TAMS PANEL (installed H/H) ES TV Universe BLACK COLOURED ASIAN/INDIAN WHITE 79% 8% 2% 11% BLACK COLOURED ASIAN/INDIAN WHITE 79% 8% 3% 10%


67 BRC TAMS VITAL SIGNS Universe: Population age million 14,021 Individual Sample OCT % METRO 29% URBAN 27% RURAL


68 BRC TAMS SNAPSHOTS TOTAL TV HOUSEHOLDS H/H FREE TO AIR (FTA) 8,221,606 DSTV 5,784,537 TOTAL TV HOUSEHOLDS H/H 14 MILLION No, of TV CHANNELS 111 OVHD 700,307 TV DATA is tracked DAILY and by EVERY SECOND viewed
69 02:00 02:30 03:00 03:30 04:00 04:30 05:00 05:30 06:00 06:30 07:00 07:30 08:00 08:30 09:00 09:30 10:00 10:30 11:00 11:30 12:00 12:30 13:00 13:30 14:00 14:30 15:00 15:30 16:00 16:30 17:00 17:30 18:00 18:30 19:00 19:30 20:00 20:30 21:00 21:30 22:00 22:30 23:00 23:30 24:00 24:30 25:00 25:30 TOTAL TELEVISION Current New Universe SOURCE: 17 Jul 30 Jul 17
70 02:00 02:30 03:00 03:30 04:00 04:30 05:00 05:30 06:00 06:30 07:00 07:30 08:00 08:30 09:00 09:30 10:00 10:30 11:00 11:30 12:00 12:30 13:00 13:30 14:00 14:30 15:00 15:30 16:00 16:30 17:00 17:30 18:00 18:30 19:00 19:30 20:00 20:30 21:00 21:30 22:00 22:30 23:00 23:30 24:00 24:30 25:00 25:30 SABC Current New Universe SOURCE: 17 Jul 30 Jul 17
71 02:00 02:30 03:00 03:30 04:00 04:30 05:00 05:30 06:00 06:30 07:00 07:30 08:00 08:30 09:00 09:30 10:00 10:30 11:00 11:30 12:00 12:30 13:00 13:30 14:00 14:30 15:00 15:30 16:00 16:30 17:00 17:30 18:00 18:30 19:00 19:30 20:00 20:30 21:00 21:30 22:00 22:30 23:00 23:30 24:00 24:30 25:00 25:30 SABC Current New Universe SOURCE: 17 Jul 30 Jul 17
72 02:00 02:30 03:00 03:30 04:00 04:30 05:00 05:30 06:00 06:30 07:00 07:30 08:00 08:30 09:00 09:30 10:00 10:30 11:00 11:30 12:00 12:30 13:00 13:30 14:00 14:30 15:00 15:30 16:00 16:30 17:00 17:30 18:00 18:30 19:00 19:30 20:00 20:30 21:00 21:30 22:00 22:30 23:00 23:30 24:00 24:30 25:00 25:30 SABC Current New Universe SOURCE: 17 Jul 30 Jul 17
73 02:00 02:30 03:00 03:30 04:00 04:30 05:00 05:30 06:00 06:30 07:00 07:30 08:00 08:30 09:00 09:30 10:00 10:30 11:00 11:30 12:00 12:30 13:00 13:30 14:00 14:30 15:00 15:30 16:00 16:30 17:00 17:30 18:00 18:30 19:00 19:30 20:00 20:30 21:00 21:30 22:00 22:30 23:00 23:30 24:00 24:30 25:00 25:30 etv Current New Universe SOURCE: 17 Jul 30 Jul 17
74 02:00 02:30 03:00 03:30 04:00 04:30 05:00 05:30 06:00 06:30 07:00 07:30 08:00 08:30 09:00 09:30 10:00 10:30 11:00 11:30 12:00 12:30 13:00 13:30 14:00 14:30 15:00 15:30 16:00 16:30 17:00 17:30 18:00 18:30 19:00 19:30 20:00 20:30 21:00 21:30 22:00 22:30 23:00 23:30 24:00 24:30 25:00 25:30 enca Current New Universe SOURCE: 17 Jul 30 Jul 17
75 02:00 02:30 03:00 03:30 04:00 04:30 05:00 05:30 06:00 06:30 07:00 07:30 08:00 08:30 09:00 09:30 10:00 10:30 11:00 11:30 12:00 12:30 13:00 13:30 14:00 14:30 15:00 15:30 16:00 16:30 17:00 17:30 18:00 18:30 19:00 19:30 20:00 20:30 21:00 21:30 22:00 22:30 23:00 23:30 24:00 24:30 25:00 25:30 DStv Current New Universe SOURCE: 17 Jul 30 Jul 17
76 MTV :00 02:30 03:00 03:30 04:00 04:30 05:00 05:30 06:00 06:30 07:00 07:30 08:00 08:30 09:00 09:30 10:00 10:30 11:00 11:30 12:00 12:30 13:00 13:30 14:00 14:30 15:00 15:30 16:00 16:30 17:00 17:30 18:00 18:30 19:00 19:30 20:00 20:30 21:00 21:30 22:00 22:30 23:00 23:30 24:00 24:30 25:00 25:30 Current New Universe

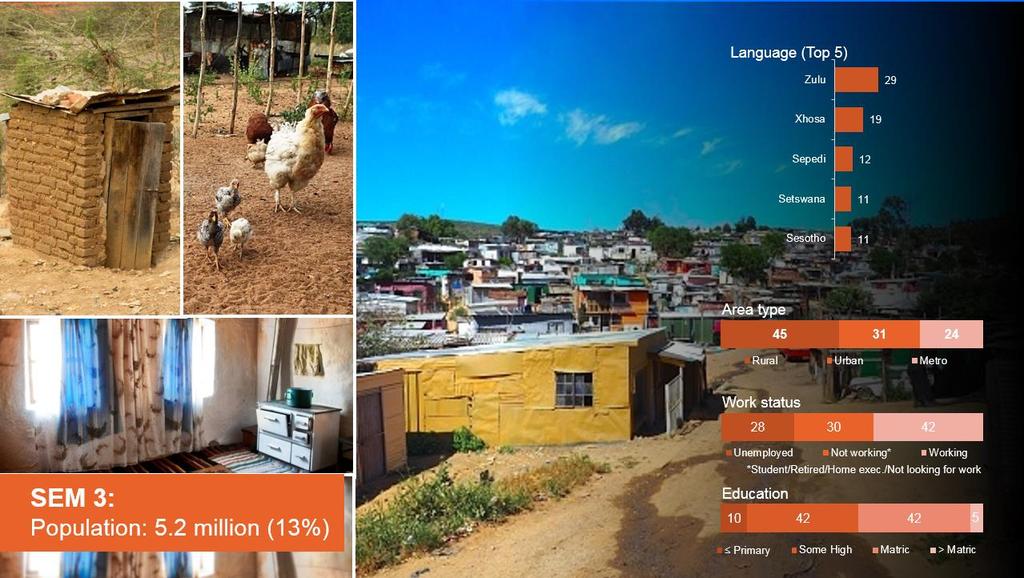
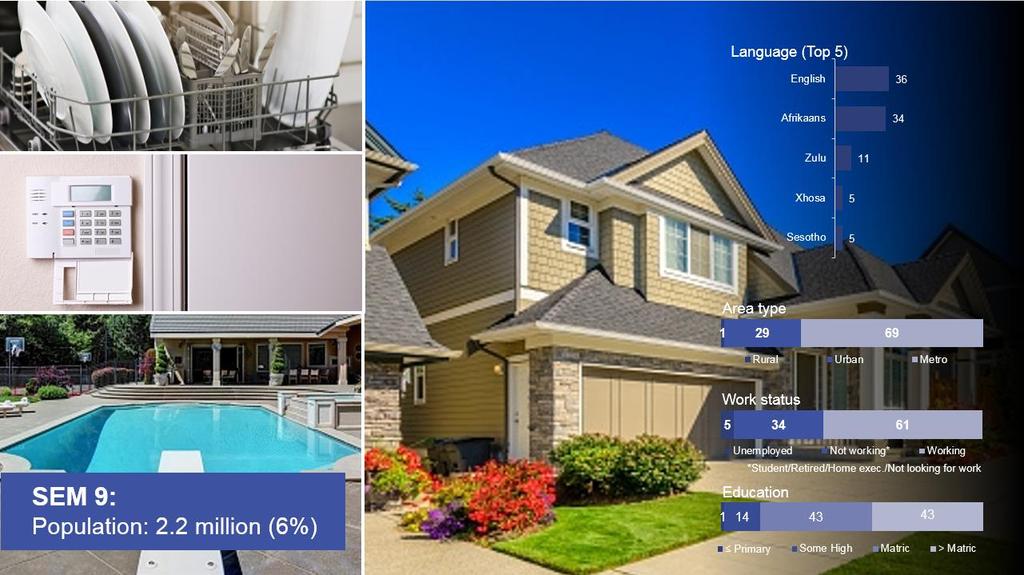
77 ESTABLISHMENT SURVEY SEM A SOCIO-ECONOMIC SEGMENTATION SYSTEM 77
78 THE ESTABLISHMENT SURVEY SEM CONCEPTUAL STARTING POINT A measure that depicts how you live, not necessarily what you have 78


79 THE SEMS ARE Relevant and differentiating Stable Not overly dependent on durables Easy to use With the flexibility to be applied to any media and marketing study in South Africa 79

80 THE 14 ESTABLISHMENT SURVEY SEM VARIABLES Final variables: Post Office nearby Police station nearby Built-in kitchen sink Home security service Motor car Deep freezer which is free standing Microwave oven Floor polisher or vacuum cleaner Washing machine Floor material Water source Type of toilet Roof material Focus on structural items Low reliance on durables No reliance on technology items Short and easy to use Number of sleeping rooms 80

81 ES SEMs VS ES LSMs SEM: % SEM 1 SEM 2 SEM 3 SEM 4 SEM 5 SEM 6 SEM 7 SEM 8 SEM 9 SEM 10 LSM: % LSM 1 LSM 2 LSM 3 LSM 4 LSM 5 LSM 6 LSM 7 LSM 8 LSM 9 LSM 10 81
 1 2 3 4 5 6 7 8 9 10 Finished/ sealed floor 5 30")

82 SEM INPUT VARIABLES STRUCTURAL Low incidence (%) SEM High incidence (%) Finished/ sealed floor Sleeping rooms Home security service Note: HH weights 82
 SEM High incidence (%) 1")


83 SEM INPUT VARIABLES DURABLES Low incidence (%) SEM High incidence (%) Washing machine Motor car Microwave Note: HH weights 83
 Low incidence (%)")


84 SEM INPUT VARIABLES INFRASTRUCTURE AND BASIC AMENITIES NO Police Station nearby High incidence (%) Low incidence (%) SEM NO Post Office nearby NO Built-in kitchen sink NO Flush toilet inside the house Note: HH weights 84
85 AREA DISTRIBUTION BY SEM SEM Metro Urban Rural Note: Individual weights 85

86 ESTABLISHMENT SURVEY SEM VISUAL REPRESENTATIONS
87

88
89

90
91
92
93

94
95

96
97

98
99

100
101

102
103
104
105

106
107 EQUIPMENT IN HOME BY SEM % SEM 1 SEM 2 SEM 3 SEM 4 SEM 5 SEM 6 SEM 7 SEM 8 SEM 9 SEM 10 Avg. no. of equipment items in home: Key equipment penetration: TV set Smartphone 56 Desktop/ laptop Tablet Wifi/fibre 107
108 MEDIA CONSUMPTION BY SEM % SEM 1 SEM 2 SEM 3 SEM 4 SEM 5 SEM 6 SEM 7 SEM 8 SEM 9 SEM 10 Past 12 month usage:


109 SEM VIEWING PROFILES BY TV CHANEL

110 AVERAGE DAILY REACH BY SEM 80.0% Average Daily REACH % 70.0% 60.0% 50.0% 40.0% 30.0% 20.0% 10.0% 0.0% SEM 1 SEM 2 SEM 3 SEM 4 SEM 5 SEM 6 SEM 7 SEM 8 SEM 9 SEM 10
111 SEM: AVERAGE DAILY RATINGS 18.0% 16.0% 14.0% 12.0% 10.0% 8.0% 6.0% 4.0% 2.0% Average daily AR % 0.0% SEM 1 SEM 2 SEM 3 SEM 4 SEM 5 SEM 6 SEM 7 SEM 8 SEM 9 SEM 10


112 SEM VIEWING PROFILE SABC % 30.00% 25.00% 20.00% 15.00% 10.00% 5.00% 0.00% SEM 1 SEM 2 SEM 3 SEM 4 SEM 5 SEM 6 SEM 7 SEM 8 SEM 9 SEM 10

113 SEM VIEWING PROFILE SABC % 30.00% 25.00% 20.00% 15.00% 10.00% 5.00% 0.00% SEM 1 SEM 2 SEM 3 SEM 4 SEM 5 SEM 6 SEM 7 SEM 8 SEM 9 SEM 10

114 SEM VIEWING PROFILE SABC % 30.00% 25.00% 20.00% 15.00% 10.00% 5.00% 0.00% SEM 1 SEM 2 SEM 3 SEM 4 SEM 5 SEM 6 SEM 7 SEM 8 SEM 9 SEM 10


115 SEM VIEWING PROFILE SABC NEWS INTERNATIONAL 35.00% 30.00% 25.00% 20.00% 15.00% 10.00% 5.00% 0.00% SEM 1 SEM 2 SEM 3 SEM 4 SEM 5 SEM 6 SEM 7 SEM 8 SEM 9 SEM 10

116 SEM VIEWING PROFILE ETV 35.00% 30.00% 25.00% 20.00% 15.00% 10.00% 5.00% 0.00% SEM 1 SEM 2 SEM 3 SEM 4 SEM 5 SEM 6 SEM 7 SEM 8 SEM 9 SEM 10

117 SEM VIEWING PROFILE enca 35.00% 30.00% 25.00% 20.00% 15.00% 10.00% 5.00% 0.00% SEM 1 SEM 2 SEM 3 SEM 4 SEM 5 SEM 6 SEM 7 SEM 8 SEM 9 SEM 10

118 SEM VIEWING PROFILE DSTV COMMERCIAL 35.00% 30.00% 25.00% 20.00% 15.00% 10.00% 5.00% 0.00% SEM 1 SEM 2 SEM 3 SEM 4 SEM 5 SEM 6 SEM 7 SEM 8 SEM 9 SEM 10

119 SEM VIEWING PROFILE MZANZI MAGIC 35.00% 30.00% 25.00% 20.00% 15.00% 10.00% 5.00% 0.00% SEM 1 SEM 2 SEM 3 SEM 4 SEM 5 SEM 6 SEM 7 SEM 8 SEM 9 SEM 10

120 SEM VIEWING PROFILE M-NET 35.00% 30.00% 25.00% 20.00% 15.00% 10.00% 5.00% 0.00% SEM 1 SEM 2 SEM 3 SEM 4 SEM 5 SEM 6 SEM 7 SEM 8 SEM 9 SEM 10


121 SEM VIEWING PROFILE CARTOON NETWORK 35.00% 30.00% 25.00% 20.00% 15.00% 10.00% 5.00% 0.00% SEM 1 SEM 2 SEM 3 SEM 4 SEM 5 SEM 6 SEM 7 SEM 8 SEM 9 SEM 10

122 SEM VIEWING PROFILE NAT GEO WILD 35.00% 30.00% 25.00% 20.00% 15.00% 10.00% 5.00% 0.00% SEM 1 SEM 2 SEM 3 SEM 4 SEM 5 SEM 6 SEM 7 SEM 8 SEM 9 SEM 10 TAMS TECHNICAL COMMITTEE REPORT

123 SEM VIEWING PROFILE AFRICA MAGIC EPIC 35.00% 30.00% 25.00% 20.00% 15.00% 10.00% 5.00% 0.00% SEM 1 SEM 2 SEM 3 SEM 4 SEM 5 SEM 6 SEM 7 SEM 8 SEM 9 SEM 10

124 SEM VIEWING PROFILE MTV 35.00% 30.00% 25.00% 20.00% 15.00% 10.00% 5.00% 0.00% SEM 1 SEM 2 SEM 3 SEM 4 SEM 5 SEM 6 SEM 7 SEM 8 SEM 9 SEM 10


125 SEM VIEWING PROFILE MTV BASE 35.00% 30.00% 25.00% 20.00% 15.00% 10.00% 5.00% 0.00% SEM 1 SEM 2 SEM 3 SEM 4 SEM 5 SEM 6 SEM 7 SEM 8 SEM 9 SEM 10

126 SEM VIEWING PROFILE COMEDY CENTRAL 35.00% 30.00% 25.00% 20.00% 15.00% 10.00% 5.00% 0.00% SEM 1 SEM 2 SEM 3 SEM 4 SEM 5 SEM 6 SEM 7 SEM 8 SEM 9 SEM 10

127 SEM VIEWING PROFILE NICKELODEON 35.00% 30.00% 25.00% 20.00% 15.00% 10.00% 5.00% 0.00% SEM 1 SEM 2 SEM 3 SEM 4 SEM 5 SEM 6 SEM 7 SEM 8 SEM 9 SEM 10

128 SEM VIEWING PROFILE emovies EXTRA 35.00% 30.00% 25.00% 20.00% 15.00% 10.00% 5.00% 0.00% SEM 1 SEM 2 SEM 3 SEM 4 SEM 5 SEM 6 SEM 7 SEM 8 SEM 9 SEM 10

129 SEM VIEWING PROFILE emovies % 30.00% 25.00% 20.00% 15.00% 10.00% 5.00% 0.00% SEM 1 SEM 2 SEM 3 SEM 4 SEM 5 SEM 6 SEM 7 SEM 8 SEM 9 SEM 10

130 SEM VIEWING PROFILE etoonz 35.00% 30.00% 25.00% 20.00% 15.00% 10.00% 5.00% 0.00% SEM 1 SEM 2 SEM 3 SEM 4 SEM 5 SEM 6 SEM 7 SEM 8 SEM 9 SEM 10

131

132

133
Understanding Transit Demand. E. Beimborn, University of Wisconsin-Milwaukee
 Understanding Transit Demand E. Beimborn, University of Wisconsin-Milwaukee 1 Purpose To provide a basic understanding of transit ridership and some common misunderstandings. To explain concepts of choice
PURPOSE AND NEED SUMMARY 54% Corridor Need 1. Corridor Need 2. Corridor Need 3. Corridor Need 4. Corridor Need 5
 SUMMARY PURPOSE AND NEED Chapel Hill Transit ridership has increased Buses operate every 4 minutes and have standing room only Exceeding seated capacity by 12% Corridor Need 1 by more than 20 percent between
Growing Bicycle Travel & Tourism for Economic Development Jeff Miller, VP North America
 Growing Bicycle Travel & Tourism for Economic Development Jeff Miller, VP North America 202-445-4415 Jeff@CycleLifeHQ.com 1 2 3 4 Growing Bicycle Travel & Tourism for Economic Development Jeff Miller,
2020 K Street NW, Suite 410 Washington, DC (202)
") 2020 K Street NW, Suite 410 Washington, DC 20006 (202) 463-7300 Interview dates: October 24 25, 2013 Interviews: 1,008 adults CONDUCTED BY IPSOS PUBLIC AFFAIRS These are findings of an Ipsos online poll
2020 K Street NW, Suite 410 Washington, DC 20006 (202) 463-7300 Interview dates: October 24 25, 2013 Interviews: 1,008 adults CONDUCTED BY IPSOS PUBLIC AFFAIRS These are findings of an Ipsos online poll
MTA Surveys: Facts and Findings. NYMTC Brown Bag March 12, 2014 Julia Seltzer, MTA Planning
 MTA Surveys: Facts and Findings NYMTC Brown Bag March 12, 2014 Julia Seltzer, MTA Planning MTA Planning Survey Program Why survey? Who was surveyed? Challenges Methodologies Findings Uses for data 1 Why
NASCAR LISTENER PROFILE
 NASCAR LISTENER PROFILE Listeners < $50,000 39% 47% 32% Listeners 68% 52% 49% $50,000 - $74,999 19% 16% $75,000 - $99,999 17% 14% $,000 - $149,999 15% 13% $150,000 + 11% 10% Listeners 18-34 Years 35-54
DEPARTMENT OF TRANSPORT
 DEPARTMENT OF TRANSPORT UPDATE ON THE IMPLEMENTATION OF SHOVA KALULA BICYCLE PROJECT SELECT COMMITTEE ON PUBLIC SERVICES 14 SEPTEMBER 2010 Outline of the presentation Objectives of the project Legislative
Location Matters: Where America Is Moving
 Location Matters: Where America Is Moving Nearly half of all American households plan to move at some point in the future. While some will move for a larger or nicer home, or perhaps to purchase a home
Cobb Community Transit
 Cobb Community Transit Ridership Survey January 2014 1 Methodology Paper survey of 315 CCT riders 165 on local routes (margin of sampling error: ± 7.6%) 150 on express routes (margin of sampling error:
INTERIM RESULTS. December 2017 WINTER OLYMPICS. Pae 1 Photosport.nz
 INTERIM RESULTS December 2017 WINTER OLYMPICS Pae 1 Photosport.nz NET PROFIT 70.0 66.7 60.0 Millions 59.5 50.0 40.0 30.0 20.0 10.0 - Dec-16 Dec-17 WINTER OLYMPICS Page 2 Photosport.nz PROGRAMMING COSTS
Customer Satisfaction Tracking Report 2016 Quarter 1
 Customer Satisfaction Tracking Report 2016 Quarter 1 May 2016 Prepared by: NRG Research Group Project no. 317-15-1445 Suite 1380-1100 Melville Street Vancouver, BC V6E 4A6 Table of Contents Background
VISION 2020 ANNEX 2 Media Consumption Trends MEDIA INTELLIGENCE SERVICE
 VISION 2020 ANNEX 2 Media Consumption Trends MEDIA INTELLIGENCE SERVICE 1 TELEVISION 2 DAILY VIEWING TIME (1996-2012) PER INDIVIDUAL (HH:MM) 04:48 EUROPEAN DAILY VIEWING 04:19 03:50 03:21 03:14 03:16 03:20
Bicycle-Pedestrian Master Plan Update
 Bicycle-Pedestrian Master Plan Update Planning & Zoning Commission November 29, 2017 Overview Project Purpose & Scope Project History Plan Vision & Goals Chapter 5: Making Connections-Beyond the Path Next
GOLF MOBILE APP DEVELOPER
 Media Kit 2017 Who Is SwingxSwing? Who is SwingxSwing? GOLF MOBILE APP DEVELOPER SwingxSwing has grown into the top-rated golf GPS & scorecard app in the world with over 3.8 million registered users. 2017
THE SOCIAL IMPACT OF GAMBLING IN SOUTH AFRICA
 THE SOCIAL IMPACT OF GAMBLING IN SOUTH AFRICA A quantitative perspective 2013 2013 National Gambling Board Page 1 SOCIAL IMPACT OF GAMBLING IN SOUTH AFRICA A quantitative perspective Study commissioned
Take the Bus. Project Proposal AUSTRALIA. Bus Industry Confederation. Take the Bus. Bus Australia Network WARTA. BusS. Bus & Coach Association SA
 Project Proposal Bus Industry Confederation Bus Australia Network BusS Bus & Coach Association SA WARTA Bus Australia Network BusS Bus & Coach Association SA 2 Project Proposal Bus Industry Confederation
2016 Fan Index. in association with
 2016 Fan Index 2016 FAN INDEX UNITED KINGDOM p3 UNITED states p5 china p9 thailand p13 hong kong p11 singapore p19 malaysia p17 indonesia p15 australia p7 Introduction Welcome to the Football Inc. Fan
Briefing Paper #1. An Overview of Regional Demand and Mode Share
 2011 Metro Vancouver Regional Trip Diary Survey Briefing Paper #1 An Overview of Regional Demand and Mode Share Introduction The 2011 Metro Vancouver Regional Trip Diary Survey is the latest survey conducted
Viacom will remain Europe s revenue leader
 Viacom will remain Europe s revenue leader Total revenues for Europe s top pay TV channels will reach $4.24 billion in 2012, according to a new report by Digital TV Research. The TV Channel Revenues in
Nielsen s Response to BRC Queries on Nov 15 RAMS
 Nielsen s Response to BRC Queries on Nov 15 RAMS Date: 22 January 2016 IELSEN S RESPONSE TO BRC QUERIES RAMS NOVEMBER 2015 RELEASE TABLE OF CONTENTS Pg No 1. 1.1 1.2 1.3 1.4 1.5 1.6 2. 2.1 2.2 2.3 2.4
REGIONAL HOUSEHOLD TRAVEL SURVEY:
 Defining the Vision. Shaping the Future. REGIONAL HOUSEHOLD TRAVEL SURVEY: Profile Why we travel How we travel Who we are and how often we travel When we travel Where we travel How far and how long we travel
Online Open House Survey Report. December 2016
 December 216 I. OVERVIEW & OUTREACH SUMMARY Introduction Washington County evaluated long-term transportation investments and strategies as part of the Transportation Futures Study. The purpose of the
6. Transport GAUTENG CITY-REGION OBSERVATORY QUALITY OF LIFE SURVEY 2015 LANDSCAPES IN TRANSITION
 GAUTENG CITY-REGION OBSERVATORY QUALITY OF LIFE SURVEY 1 6. Transport Christina Culwick, christina.culwick@gcro.ac.za, 011 717 7296 Dr Siân Butcher, sian.butcher@gcro.ac.za, 011 717 7696 Samy Katumba,
Clouds, Crowds, and Traffic: What 10 Emerging Megatrends Mean for the Future of Transportation
 Portland State University PDXScholar TREC Friday Seminar Series Transportation Research and Education Center (TREC) 11-1-2013 Clouds, Crowds, and Traffic: What 10 Emerging Megatrends Mean for the Future
2018 FIFA World Cup Russia
 2018 FIFA World Cup Russia Global broadcast and audience summary Continue 2018 FIFA World Cup Russia Global broadcast and audience summary Click to select Methodology Match audience Global overview Consumption
THE 2010 MSP REGION TRAVEL BEHAVIOR INVENTORY (TBI) REPORT HOME INTERVIEW SURVEY. A Summary of Resident Travel in the Twin Cities Region
 REPORT HOME INTERVIEW SURVEY. A Summary of Resident Travel in the Twin Cities Region") THE 2010 MSP REGION TRAVEL BEHAVIOR INVENTORY (TBI) REPORT HOME INTERVIEW SURVEY A Summary of Resident Travel in the Twin Cities Region October 2013 WHAT IS THE TBI? The Travel Behavior Inventory (TBI)
THE 2010 MSP REGION TRAVEL BEHAVIOR INVENTORY (TBI) REPORT HOME INTERVIEW SURVEY A Summary of Resident Travel in the Twin Cities Region October 2013 WHAT IS THE TBI? The Travel Behavior Inventory (TBI)
DRAFT REPORT SPECIAL DEVELOPMENT PROJECT: Fateng tse Ntsho/Paul Roux. Community Empowerment Impact Assessment Report: Phase 1 EXECUTIVE SUMMARY
 DRAFT REPORT SPECIAL DEVELOPMENT PROJECT: Fateng tse Ntsho/Paul Roux Community Empowerment Impact Assessment Report: Phase 1 EXECUTIVE SUMMARY February 2007 29 De Havilland Crescent Pro Park Building 1
Policy and Strategy for Sustainable Urban Transport in Vietnam
 International Seminar on Sustainable Urban Transport & Land Use Planning Policy and Strategy for Sustainable Urban Transport in Vietnam 23-26 September 2005 Mr. Tran Minh Phuong, MOT, Vietnam Dr. IWATA
SPONSORSHIP OPPORTUNITY. 3 rd. Weekend. in April. 20 th, 21 st, 22 nd
 SPONSORSHIP OPPORTUNITY 3 rd Weekend in April 20 th, 21 st, 22 nd 2018 Proudly Ce lebrating ou r 9 7 t h A n n ua l Red Bluff Round-Up Since 1921 530.527.1000 www.redbluffroundup.com BECOME A SPONSOR OF
Setting. Stories of innovation.
 Setting the pace Stories of innovation. Stories of innovation from William Hill William Hill is one of the world s leading betting and gaming companies. This year we are continuing to transform the business,
PASSENGER SURVEY RESULTS
 ROGUE VALLEY TRANSPORTATION DISTRICT PASSENGER SURVEY RESULTS Date: December 12, 2018 Project #: 21289 To: Paige West, RVTD From: Susan Wright, PE; Molly McCormick; (Kittelson & Associates, Inc.) Subject:
U.S. Bicycling Participation Study
 U.S. Bicycling Participation Study Report of findings from the 2016 survey Conducted by Corona Insights Commissioned by PeopleForBikes Released July 2017 Table of Contents Background and Objectives 3 Research
Polish-Nordic Road Forum/3rd 26/10/2017 Vilnius
 Polish-Nordic Road Forum/3rd 26/10/2017 Vilnius LITHUANIAN STEPS IN IMPLEMENTING ZERO VISION 4-6/June/2018 SOPOT Dovilė Krasauskaitė Head of Traffic Safety and Environmental Protection Division Lithuanian
Neighborhood Influences on Use of Urban Trails
 Neighborhood Influences on Use of Urban Trails Greg Lindsey, Yuling Han, Jeff Wilson Center for Urban Policy and the Environment Indiana University Purdue University Indianapolis Objectives Present new
Webinar: Development of a Pedestrian Demand Estimation Tool
 Portland State University PDXScholar TREC Webinar Series Transportation Research and Education Center (TREC) 2-18-2016 Webinar: Development of a Pedestrian Demand Estimation Tool Kelly Clifton Portland
Public Bike Share Schemes. 14 December 2017
 Public Bike Share Schemes 14 December 2017 What is public bike share? l Any scheme where bikes are made available for members of the public to use l Operating models include: Self-service (docking stations)
The Who and What: Bus Rapid Transit Riders and Systems in the U.S.
 The Who and What: Bus Rapid Transit Riders and Systems in the U.S. Cheryl Thole December 12, 2013 Webinar Center for Urban Transportation Research University of South Florida Pre presentation How familiar
How familiar are you with BRT?
 The Who and What: Bus Rapid Transit Riders and Systems in the U.S. Cheryl Thole December 12, 2013 Webinar Center for Urban Transportation Research University of South Florida Pre presentation How familiar
Public Bicycle Sharing Scheme
 National Workshop on Public Bicycle Sharing Scheme 4 th March IBI GROUP Defining the cities of tomorrow 1 PBS GUIDANCE DOCUMENT A STEP-BY-STEP HANDBOOK PBS GUIDANCE DOCUMENT TABLE OF CONTENTS PBS GUIDANCE
2017 North Texas Regional Bicycle Opinion Survey
 2017 North Texas Regional Bicycle Opinion Survey Sustainable Development Program Kevin Kokes, AICP Public Meetings April, 2018 North Central Texas Council of Governments MPO for the Dallas-Fort Worth Region
Kevin Manaugh Department of Geography McGill School of Environment
 Kevin Manaugh Department of Geography McGill School of Environment Outline Why do people use active modes? Physical (Built environment) Factors Psychological Factors Empirical Work Neighbourhood Walkability
RBFF Launches New Hispanic Campaign VAMOS A PESCAR. April 24, 2014
 RBFF Launches New Hispanic Campaign VAMOS A PESCAR April 24, 2014 OVERVIEW Growing Participation in Fishing & Boating o The Hispanic Opportunity o Target Market Segmentation o The Plan Vamos a Pescar!
Frequently asked questions about how the Transport Walkability Index was calculated are answered below.
 Transport Walkability Index The Transport Walkability Index is a relative indicator of how well the built environment in different areas supports walking for transport. The index is frequently used in
RE-CYCLING A CITY: EXAMINING THE GROWTH OF CYCLING IN DUBLIN
 Proceedings ITRN2013 5-6th September, Caulfield: Re-cycling a city: Examining the growth of cycling in Dublin RE-CYCLING A CITY: EXAMINING THE GROWTH OF CYCLING IN DUBLIN Brian Caulfield Abstract In the
The Case for New Trends in Travel
 The Case for New Trends in Travel The Future of Cities and Travel Steven E. Polzin, PhD. Center for urban Transportation Research University of South Florida October 19, 2008 Successful Strategies from
City of Davenport CitiBus Public Transportation Study. April 2015
 City of Davenport CitiBus Public Transportation Study April 2015 Overview Project Background Key Findings CitiBus Service Allocation Policy Discussion 2 Project Background 3 About CitiBus Operates 17 routes
RESEARCH Massachusetts Recreational Boater Survey. Project Summary
 Coastal and Marine Spatial Planning RESEARCH Project Summary 2010 Massachusetts Recreational Boater Survey The 2010 Massachusetts Recreational Boater Survey gathered spatial and economic data relating
NASCAR No. 1 sport to deliver brand loyalty. NASCAR Delivers Marketing Horsepower
 NASCAR No. 1 sport to deliver brand loyalty NASCAR Delivers Marketing Horsepower Is the No. 1 sport in brand loyalty. Fans are three times as likely as non fans to try and purchase sponsors products and
A Framework For Integrating Pedestrians into Travel Demand Models
 A Framework For Integrating Pedestrians into Travel Demand Models Kelly J. Clifton Intersections Seminar University of Toronto September 22, 2017 Portland, Oregon, USA Region Population~ 2.4 M Urban Growth
7 Ciphers Segmentation Cracking The Code On The Urban Market >>
 7 Ciphers Segmentation Cracking The Code On The Urban Market >> UMI Forum 2007 Urban Market Demographic Profile >> 15% of the U.S. population, or 45.3 million trendsetting Americans have adopted the urban
Konstantin Glukhenkiy Economic Affairs Officer
 Konstantin Glukhenkiy Economic Affairs Officer Rapid growth of urban areas Very rapid increase in motorisation Substantial increases in traffic congestion Relative decline of public transport usage and
Cycle Tourism: Destination Burlington
 Cycle Tourism: Destination Burlington TOURISM BURLINGTON AGM May 24, 2018 Louisa Mursell Executive Director www.ontariobybike.ca 2018 Transportation Options What We Do Industry Standards & Certification
Rochester Area Bike Sharing Program Study
 roc bike share Rochester Area Bike Sharing Program Study Executive Summary ~ January 2015 JANUARY 2015 8484 Georgia Avenue, Suite 800 Silver Spring, MD 20910 3495 Winton Pl., Bldg E, Suite 110 Rochester,
AUTHENTIC EXCITING ENGAGING
 2018 MEDIA GUIDE AUTHENTIC EXCITING ENGAGING The Supra Boats Pro Wakeboard Tour (PWT) is the largest and longest-running professional wakeboarding circuit in the world. Since 1992 the PWT has attracted
Tee Times is Minnesota s monthly golf and lifestyle publication dedicated to keeping local golfers connected with the Minnesota golf scene both on
 Tee Times is Minnesota s monthly golf and lifestyle publication dedicated to keeping local golfers connected with the Minnesota golf scene both on and off the course. Media KIT 2019 DEMOGRAPHICS Our Reader
Transit Ridership - Why the Decline and How to Increase. Hosted by the. Virginia Transit Association
 Transit Ridership - Why the Decline and How to Increase Hosted by the Virginia Transit Association Virginia Transit Association 1108 East Main Street, Suite 1108 Richmond, VA 23219 804.643.1166 www.vatransit.com
AGENDA. Stakeholder Workshop
 AGENDA Stakeholder Workshop 19 th February DLF City Club, Gurgaon IBI GROUP Defining the cities of tomorrow 1 WORKSHOP AGENDA IBI GROUP Defining the cities of tomorrow 2 INTRODUCTION TO THE PBS GUIDANCE
Accessibility, mobility and social exclusion
 Accessibility, mobility and social exclusion Dionisis Balourdos Kostas Sakellaropoulos Aim The aim of this paper is to present data from the four cities in the project SceneSusTech concerning the issues
BUYER S GUIDE AQUAlogger 530WTD
 OCEAN & ENVIRONMENTAL BUYER S GUIDE AQUAlogger 530WTD Wireless Temperature and Depth Logger AQUAlogger 530WTD The AQUAlogger 530WTD has an innovative design that includes the ability to transfer stored
DEPARTMENT OF FISHERIES. COMMUNITY PERCEPTIONS RESEARCH May 2013
 DEPARTMENT OF FISHERIES COMMUNITY PERCEPTIONS RESEARCH May 2013 This page has been intentionally left blank for double-sided printing. CONTENTS RECAPPING THE OBJECTIVES... 4 METHODOLOGY... 5 TESTS OF STATISTICAL
The Evolving Shopper & Its Impact on Produce
 The Evolving Shopper & Its Impact on Produce Amir Jalaly & Chris Cowan WHO are Kantar Worldpanel? HOW have shopping habits changed & the impact on produce? A CHANGING consumer landscape WHO are Kantar
Is St. Louis Ready for a Bike Share System? May 14, 2014 Public Open House
 Is St. Louis Ready for a Bike Share System? May 14, 2014 Public Open House PRESENTATION AGENDA 2 BIKE SHARE How does it work? What are the benefits? Who would use it? Will it be safe? Would it work in
Community & Transportation Preferences Survey
 Community & Transportation Preferences Survey Webinar: August 5, 2015 Hugh Morris, AICP, LEED Realtor.org Jennifer Dill, Ph.D. trec.pdx.edu 1 Introduction National Association of Realtors Over 1,000,000
AAMPO Regional Transportation Attitude Survey
 AAMPO Regional Transportation Attitude Survey Traditionally Underserved Populations helping organizations make better decisions since 1982 2018 Submitted to the AAMPO By: ETC Institute 725 W. Frontier
1999 On-Board Sacramento Regional Transit District Survey
 SACOG-00-009 1999 On-Board Sacramento Regional Transit District Survey June 2000 Sacramento Area Council of Governments 1999 On-Board Sacramento Regional Transit District Survey June 2000 Table of Contents
MTP BICYCLE ELEMENT UPDATE. November 2017
 MTP BICYCLE ELEMENT UPDATE November 2017 TIME FOR AN UPDATE Bicycle Element adopted in July 2008 Almost 10 years old Many planned facilities have been implemented 10 years more experience in planning,
BICYCLE TIMES IS THE INDEPENDENT VOICE COVERING THE PASSION, PERSONALITIES AND PRODUCTS YOU LOVE MOST ABOUT PRACTICAL CYCLING.
 BICYCLE TIMES IS THE INDEPENDENT VOICE COVERING THE PASSION, PERSONALITIES AND PRODUCTS YOU LOVE MOST ABOUT PRACTICAL CYCLING. ABOUT BICYCLE TIMES Plenty of other magazines cover the rough and tumble world
FULL PROFILE Census, 2018 Estimates with 2023 Projections Calculated using Weighted Block Centroid from Block Groups Realm Realty Lat/Lon: 3
 FULL PROFILE 2000-2010 Census, 2018 Estimates with 2023 Projections Calculated using Weighted Block Centroid from Block Groups Realm Realty Lat/Lon: 30.0027/-90.1613 RF1 Lakeside Shopping Center Metairie,
Alternate pedestrian routes in the cities
 Alternate pedestrian routes in the cities Real Corp 2017 Panta Rhei A World in Constant Motion 12-14 September 2017 Dr. László Jóna PhD in civil engineering, junior research fellow HAS Centre for Economic
Study on Development and Parking Management of Dockless Bike Share (DBS) and in Tianjin
 and in Tianjin") Study on Development and Parking Management of Dockless Bike Share (DBS) and in Tianjin Li Wei, Liu Shaokun, Deng Han @ ITDP Institute for Transportation and Development Policy Tianjin, one of the four
Study on Development and Parking Management of Dockless Bike Share (DBS) and in Tianjin Li Wei, Liu Shaokun, Deng Han @ ITDP Institute for Transportation and Development Policy Tianjin, one of the four
Pedestrian Dynamics: Models of Pedestrian Behaviour
 Pedestrian Dynamics: Models of Pedestrian Behaviour John Ward 19 th January 2006 Contents Macro-scale sketch plan model Micro-scale agent based model for pedestrian movement Development of JPed Results
Bike Planner Overview
 Bike Planner Overview A Web-based Sketch Planning Tool for Los Angeles County presented by William E. Walter, GISP April 12, 2017 GIS-T Transportation leadership you can trust. Bike Planner Overview Guiding
Author Acknowledgements
 EXPLORING TRANSIT S CONTRIBUTION TO LIVABILITY IN RURAL COMMUNITIES WEBCAST PRESENTATION HOSTED BY CENTER FOR URBAN TRANSPORTATIONRESEARCH UNIVERSITY OF SOUTHFLORIDA OCTOBER 27, 2016 12:00 PM EST JONATHAN
Supplementary Explanation Materials
 Supplementary Explanation Materials Golf Digest Online Inc. (TSE Securities code: 3319) URL:www.golfdigest.co.jp Notes concerning these materials The Company s plans, projections, strategies, etc., stated
FAQs. General. There are many ways to get information about us:
 FAQs General 1. What are the benefits of Surfline LTE? Surfline s LTE network is designed to provide Ghanaians with fast and reliable internet. Our data service will transform how you connect with friends,
#1 CABLE SPORTS NETWORK IN CENTRAL AMERICA 1
 S PREMIER MULTI- PLATFORM SPORTS MEDIA BRAND ESPN RANKINGS HOW DOES ESPN PERFORM IN THE SPORTS CATEGORY? #1 CABLE SPORTS NETWORK IN CENTRAL 1 NORTH REACH & DISTRIBUTION 21.8M TV HOUSEHOLDS 4 2.7M AVERAGE
Accell Group. power in branding and distribution. Business profile. René Takens (CEO) Two segments: - Bicycles, Bicycle Parts & Accessories - Fitness
 Two segments: - Bicycles, Bicycle Parts & Accessories - Fitness") Accell Group power in branding and distribution Brussels/Antwerp, René Takens (CEO) Wouter de Vreeze (Manager M&A/IR) 1 Business profile Two segments: - Bicycles, Bicycle Parts & Accessories - Fitness
Accell Group power in branding and distribution Brussels/Antwerp, René Takens (CEO) Wouter de Vreeze (Manager M&A/IR) 1 Business profile Two segments: - Bicycles, Bicycle Parts & Accessories - Fitness
BROADCASTING THE OLYMPIC GAMES
 Information Sheet BROADCASTING THE OLYMPIC GAMES THE MEDIA AND THE OLYMPIC GAMES HISTORICAL OVERVIEW 1 The Media and the Olympic Games the major Stages Information Sheet Introduction Table of contents
Supplementary Explanation Materials
 Supplementary Explanation Materials Golf Digest Online Inc. (TSE Stock Code :3319) URL:www.golfdigest.co.jp Notes concerning these materials The Company s plans, projections, strategies, etc., stated in
World s Largest Smart Bike-Share Platform Rides into Charlotte for the Holidays Dec 21, 2017 HOW MOBIKE WORKS
 World s Largest Smart Bike-Share Platform Rides into Charlotte for the Holidays Bikes to be placed in key downtown locations following the city s approval CHARLOTTE, NC, Dec 21, 2017 Mobike, the world
Accelerate Your Sales with Motorsports Racing Thank you for taking the time to review our marketing partnership proposal. Coast to coast, no other
 Accelerate Your Sales with Motorsports Racing Thank you for taking the time to review our marketing partnership proposal. Coast to coast, no other sport has generated so much excitement, or created an
Free Ride Transit System 2014 On Board Passenger Survey
 Free Ride Transit System 2014 On Board Passenger Survey March 28, 2014 INTRODUCTION The last on-board passenger survey was conducted by the Breckenridge Free Ride on March 30, 2012. The 2012 survey had
Houston and Tomball Economic and. Housing Outlook. recenter.tamu.edu. Dr. James P. Gaines Research Economist
 Houston and Tomball Economic and Dr. James P. Gaines Research Economist Housing Outlook recenter.tamu.edu THE CURRENT SITUATION The Future Just Ain t What It Used to Be! Yogi Berra National Economic Recovery
The Value of Cycle Tourism
 The Value of Cycle Tourism Opportunities for the Scottish economy SUMMARY REPORT Ivan Zovko June 2013 www.scottishviewpoint.com Executive Summary BACKGROUND, SCOPE AND PURPOSE OF THE REPORT This report
New rules, new opportunities: a potential for growth
 #TV year New rules, new opportunities: a potential for growth June 19th, 2015 Jacques Balducci Eurodata TV Worldwide Deputy Sales Director Worldwide TV viewing remains strong World daily viewing time Average
Assessment of socio economic benefits of non-motorized transport (NMT) integration with public transit (PT)
 integration with public transit (PT)") Assessment of socio economic benefits of non-motorized transport (NMT) integration with public transit (PT) Case study of Bike share (BS) system in Pune, India Parvesh Kumar Sharawat Department of Policy
Assessment of socio economic benefits of non-motorized transport (NMT) integration with public transit (PT) Case study of Bike share (BS) system in Pune, India Parvesh Kumar Sharawat Department of Policy
2016 REGIONAL ORIGIN AND DESTINATION STUDY TDCHR WORKSHOP APRIL 27, 2017
 2016 REGIONAL ORIGIN AND DESTINATION STUDY TDCHR WORKSHOP APRIL 27, 2017 WORKSHOP AGENDA 2016 Regional Origin & Destination (O&D) Study Purpose Methodology How our Riders use the HRT System? Who Are Our
Transport attitudes, residential preferences, and urban form effects on cycling and car use.
 Downloaded from orbit.dtu.dk on: Mar 10, 2019 Transport attitudes, residential preferences, and urban form effects on cycling and car use. Nielsen, Thomas Alexander Sick; Olafsson, Anton Stahl; Carstensen,
Media Kit Contents. Company Profile... Audience Profile... Site Traffic... Ad Types... Ad Placements... Web Reporting... Rate Card...
 Media Kit 2009 Contents Company Profile... Audience Profile... Site Traffic... Ad Types... Ad Placements... Web Reporting... Rate Card... Page 2 Page 3 Page 4 Page 5 Page 6 Page 11 Page 12 Company Profile
El Paso County 2040 Major Transportation Corridors Plan
 El Paso County 2040 Major Transportation Corridors Plan Connect-our-County Online Transportation User Survey Preliminary Results June 24, 2010 Years of Residence 2. How many years have you LIVED HERE?
Case study Dublin (IE)
") Case study Dublin (IE) Content: - City profile - Description of Bicycle Share Scheme - Operational aspects - User Profile - Communication / Marketing plan - Contact details 1. City profile Dublin is the
Case study Dublin (IE) Content: - City profile - Description of Bicycle Share Scheme - Operational aspects - User Profile - Communication / Marketing plan - Contact details 1. City profile Dublin is the
BIKEPLUS Public Bike Share Users Survey Results 2017
 BIKEPLUS Public Bike Share Users Survey Results 2017 September 2017 Public Bike Share Users Survey Results 2017 The second annual Bikeplus survey combines robust data, and expert opinion to provide a snapshot
The current state of motor sports and motor sports sponsorship from a global media perspective
 1 Professional MotorSport World Expo Cologne, 7 th November 2007 _more than research! The current state of motor sports and motor sports sponsorship from a global media perspective Adrian Bach, IFM International
QUICK GUIDE HOW TO USE THE AMWELL APP
 QUICK GUIDE HOW TO USE THE AMWELL APP Blue Cross and Blue Shield of Kansas City (Blue KC) wants to improve your access to care. That s why we expanded our networks to include American Well (Amwell) so
Using smartphones for cycle planning Authors: Norman, G. and Kesha, N January 2015
 Using smartphones for cycle planning Authors: Norman, G. and Kesha, N January 2015 Abstract There has been an inherent lack of information available to transport and urban planners when looking at cycle
Hi, we are Hook & Barrel Magazine.
 MEDIA KIT // 209 Hi, we are Hook & Barrel Magazine. Let us introduce you to the best audience, editorial product, and engagement opportunity, new to the market. AT A GLANCE: Hook & Barrel Magazine is an
Pedestrian Activity Criteria. PSAC March 8, 2011
 Pedestrian Activity Criteria PSAC March 8, 2011 Contents 1. Project Overview a) Revised schedule of PSAC hearings 2. Pedestrian Activity: Where walking is important a) Existing conditions (revisions based
395 Express Lanes Extension
 395 Express Lanes Extension January 2016 Building a network of Express Lanes Project overview Add capacity on I-395 with addition of a third HOV lane and active traffic management Generate guaranteed transit
University of Michigan & Urban Land Institute Real Estate Forum. Mary Beth Graebert Michigan State University
 University of Michigan & Urban Land Institute Real Estate Forum Mary Beth Graebert Michigan State University November 20, 2013 Michigan State University Land Policy Institute Strong focus on research and
aiming higher How enhanced network performance improved satisfaction among spectators at the 2016 Summer Games in Rio
 aiming higher How enhanced network performance improved satisfaction among spectators at the 2016 Summer Games in Rio CONTENTS AN EVENT WITHOUT PRECEDENT 3 PREPARING & SUPPORTING THE NETWORK 5 STREAMING